
#14
14
15,395 views
198 Discussing
Hot
Latest

·
--
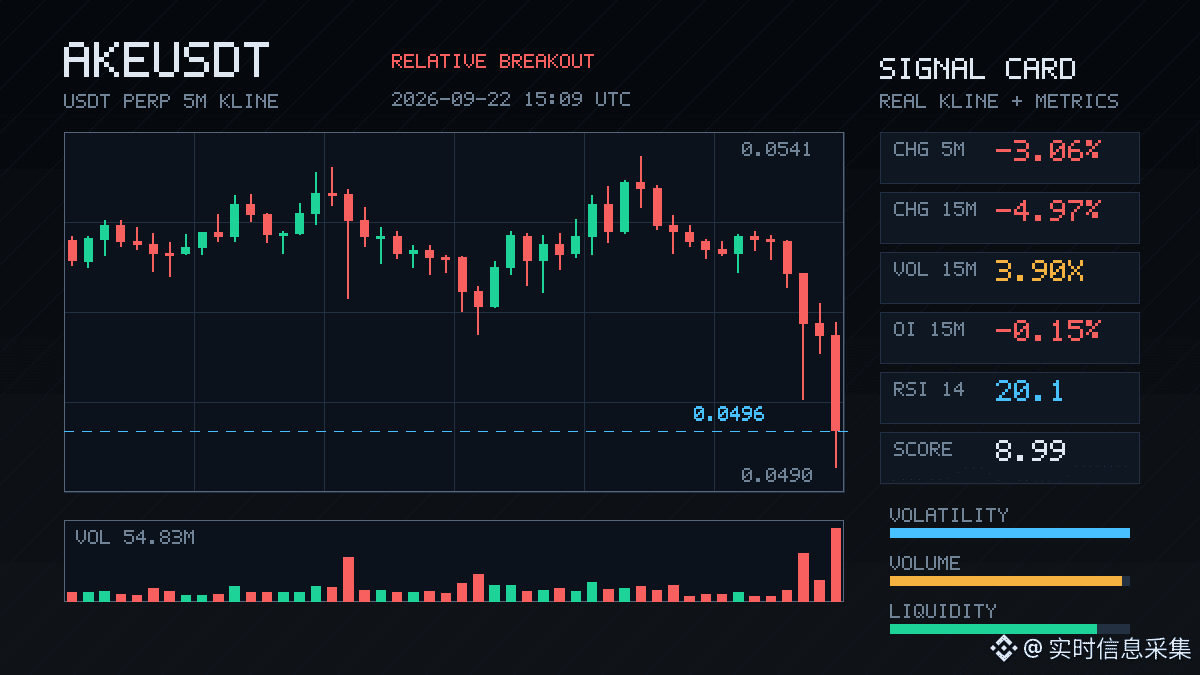
$AKE This drop is quite decisive—on the 15m chart it’s directly -4.97%. Volume is up to 3.9x, active trade imbalance is -16.1%, buy/sell ratio is 0.72, and the sell pressure is very solid. OI on both 15m and 1h is decreasing; nominal has shed 1.34M / 2.15M. The whole pool is ranked abnormally high at #15, and nominal change at #14—definitely one of the more eye-catching pools today.
Structurally, it looks more like longs deleveraging or stop-loss cascades, rather than new shorts pushing in aggressively. Price has just broken below the lower band of the last ~20 5m candles. For now, we’ll see whether it can reclaim this range. If it can’t, this kind of contraction-style selloff often comes with a second probe. In the past 24h, trading value is 383M. Liquidity is sufficient, and volatility isn’t small either—when chasing shorts or catching dips, you need to leave some room for error.
$AKE This drop is quite decisive—on the 15m chart it’s directly -4.97%. Volume is up to 3.9x, active trade imbalance is -16.1%, buy/sell ratio is 0.72, and the sell pressure is very solid. OI on both 15m and 1h is decreasing; nominal has shed 1.34M / 2.15M. The whole pool is ranked abnormally high at #15, and nominal change at #14—definitely one of the more eye-catching pools today.
Structurally, it looks more like longs deleveraging or stop-loss cascades, rather than new shorts pushing in aggressively. Price has just broken below the lower band of the last ~20 5m candles. For now, we’ll see whether it can reclaim this range. If it can’t, this kind of contraction-style selloff often comes with a second probe. In the past 24h, trading value is 383M. Liquidity is sufficient, and volatility isn’t small either—when chasing shorts or catching dips, you need to leave some room for error.
Structurally, it looks more like longs deleveraging or stop-loss cascades, rather than new shorts pushing in aggressively. Price has just broken below the lower band of the last ~20 5m candles. For now, we’ll see whether it can reclaim this range. If it can’t, this kind of contraction-style selloff often comes with a second probe. In the past 24h, trading value is 383M. Liquidity is sufficient, and volatility isn’t small either—when chasing shorts or catching dips, you need to leave some room for error.
10

·
--
$1000PEPE is kind of interesting.
On the 15m chart it climbed 2.41%, with volume at 1.75x. It closed a volume-expansion bullish candle that grabbed the upper edge of the most recent 20 5m candles. Aggressive buy orders are pressing down on sell orders; aggressive trades were weakly matched, with the buy-sell ratio at 1.21 and an order-trade gap of +9.7%.
But what really caught my attention is the OI data. On the 15m, OI fell 0.69%, while on the 1h it rose 2.57%, with nominal inflow of 6.73 million U. Price went up, but short-cycle OI decreased instead—this doesn’t smell right. It looks more like shorts are being pulled into covering, not like new long positions are pouring in. The abnormal percentile is 90.3%. In the whole pool it ranks #14; nominal change ranks #6. It hasn’t broken across several consecutive periods, and the funding rate is also sitting at a high percentile recently.
The 24h trading volume is 1058M, and the depth is sufficient.
With this kind of structure, you can ride the momentum, but don’t treat it like a trending-market setup and chase. If the shorts covering pushes it up, once the covering is done—who’s going to take over the next leg? Keep a close eye on OI divergence. If it continues to diverge, the more sharply it rises, the more you should be careful.
$1000PEPE is kind of interesting.
On the 15m chart it climbed 2.41%, with volume at 1.75x. It closed a volume-expansion bullish candle that grabbed the upper edge of the most recent 20 5m candles. Aggressive buy orders are pressing down on sell orders; aggressive trades were weakly matched, with the buy-sell ratio at 1.21 and an order-trade gap of +9.7%.
But what really caught my attention is the OI data. On the 15m, OI fell 0.69%, while on the 1h it rose 2.57%, with nominal inflow of 6.73 million U. Price went up, but short-cycle OI decreased instead—this doesn’t smell right. It looks more like shorts are being pulled into covering, not like new long positions are pouring in. The abnormal percentile is 90.3%. In the whole pool it ranks #14; nominal change ranks #6. It hasn’t broken across several consecutive periods, and the funding rate is also sitting at a high percentile recently.
The 24h trading volume is 1058M, and the depth is sufficient.
With this kind of structure, you can ride the momentum, but don’t treat it like a trending-market setup and chase. If the shorts covering pushes it up, once the covering is done—who’s going to take over the next leg? Keep a close eye on OI divergence. If it continues to diverge, the more sharply it rises, the more you should be careful.
On the 15m chart it climbed 2.41%, with volume at 1.75x. It closed a volume-expansion bullish candle that grabbed the upper edge of the most recent 20 5m candles. Aggressive buy orders are pressing down on sell orders; aggressive trades were weakly matched, with the buy-sell ratio at 1.21 and an order-trade gap of +9.7%.
But what really caught my attention is the OI data. On the 15m, OI fell 0.69%, while on the 1h it rose 2.57%, with nominal inflow of 6.73 million U. Price went up, but short-cycle OI decreased instead—this doesn’t smell right. It looks more like shorts are being pulled into covering, not like new long positions are pouring in. The abnormal percentile is 90.3%. In the whole pool it ranks #14; nominal change ranks #6. It hasn’t broken across several consecutive periods, and the funding rate is also sitting at a high percentile recently.
The 24h trading volume is 1058M, and the depth is sufficient.
With this kind of structure, you can ride the momentum, but don’t treat it like a trending-market setup and chase. If the shorts covering pushes it up, once the covering is done—who’s going to take over the next leg? Keep a close eye on OI divergence. If it continues to diverge, the more sharply it rises, the more you should be careful.
103

·
--
Just checked the leaderboard—$ZEC has quietly climbed to position #14 on CoinMarketCap’s Trends list. As an established privacy coin, there’s been a recent uptick in community discussion and search volume, though the market has always been highly volatile. How long do you think this wave of attention can last?👀 #Zcash #PrivacyCoins
Just checked the leaderboard—$ZEC has quietly climbed to position #14 on CoinMarketCap’s Trends list. As an established privacy coin, there’s been a recent uptick in community discussion and search volume, though the market has always been highly volatile. How long do you think this wave of attention can last?👀 #Zcash #PrivacyCoins
185

·
--
$FLOCK This move is a bit brutal.
In 15m, it was hit directly down 3.28%, and the volume surged to 87 times the usual level. The Z value is 7.61. This isn’t ordinary fluctuation—someone is concentratedly swinging the hammer.
What’s even more worth watching is the OI. In 15m: +8.10%, in 1h: +8.47%. The abnormal percentile for OI has already climbed to 93.3%, with the whole pool ranked at #14. Price is falling while open interest is rising—this is the typical pattern of shorts adding leverage, not longs getting liquidated in a stampede.
Active volume is down -20.5%, buy/sell ratio is 0.66—everything is being smashed by active sell orders. But the price is already approaching its own historical extreme zone.
With this kind of structure, I generally don’t chase shorts. The more levered shorts stack up in an extreme range, the more explosive the rebound can be once selling pressure stops. 24h trading value is 41M, and liquidity is sufficient—there’s no shortage of buyers waiting to take the other side.
If I’m watching this level, I’d rather wait for a stalling candle to confirm before reassessing, instead of charging downward following the 87-times volume.
$FLOCK This move is a bit brutal.
In 15m, it was hit directly down 3.28%, and the volume surged to 87 times the usual level. The Z value is 7.61. This isn’t ordinary fluctuation—someone is concentratedly swinging the hammer.
What’s even more worth watching is the OI. In 15m: +8.10%, in 1h: +8.47%. The abnormal percentile for OI has already climbed to 93.3%, with the whole pool ranked at #14. Price is falling while open interest is rising—this is the typical pattern of shorts adding leverage, not longs getting liquidated in a stampede.
Active volume is down -20.5%, buy/sell ratio is 0.66—everything is being smashed by active sell orders. But the price is already approaching its own historical extreme zone.
With this kind of structure, I generally don’t chase shorts. The more levered shorts stack up in an extreme range, the more explosive the rebound can be once selling pressure stops. 24h trading value is 41M, and liquidity is sufficient—there’s no shortage of buyers waiting to take the other side.
If I’m watching this level, I’d rather wait for a stalling candle to confirm before reassessing, instead of charging downward following the 87-times volume.
In 15m, it was hit directly down 3.28%, and the volume surged to 87 times the usual level. The Z value is 7.61. This isn’t ordinary fluctuation—someone is concentratedly swinging the hammer.
What’s even more worth watching is the OI. In 15m: +8.10%, in 1h: +8.47%. The abnormal percentile for OI has already climbed to 93.3%, with the whole pool ranked at #14. Price is falling while open interest is rising—this is the typical pattern of shorts adding leverage, not longs getting liquidated in a stampede.
Active volume is down -20.5%, buy/sell ratio is 0.66—everything is being smashed by active sell orders. But the price is already approaching its own historical extreme zone.
With this kind of structure, I generally don’t chase shorts. The more levered shorts stack up in an extreme range, the more explosive the rebound can be once selling pressure stops. 24h trading value is 41M, and liquidity is sufficient—there’s no shortage of buyers waiting to take the other side.
If I’m watching this level, I’d rather wait for a stalling candle to confirm before reassessing, instead of charging downward following the 87-times volume.
1
·
--
$LIT This spot is kind of interesting.
In the 15m timeframe, it’s up 2.66% on the move, and the volume managed to reach 1.62x, while the Z value at 4 went straight through and brought it up. The key isn’t just the price increase—OI is rising in sync too: 15m +0.09%, 1h +0.10%. The nominal change adds up to roughly 3M USD. The anomaly percentile is 96.6%, ranked #14 in the whole pool—these data would be in the front row across today’s entire market.
Structurally, it looks more like new leveraged long positions entering the market, not some sort of short-covering “fake pump.” The passive/active buy-sell ratio is 1.29, with a 12.7% difference—direction is quite clear. At the close, it even broke above the highs of the last ~20 5m candles, and this anomaly has been continuing for several consecutive cycles, not a one-off spike.
The depth data also confirms it: trading volume is higher than usual, and the price has touched the boundary of the recent range. This kind of combination hasn’t been that common on LIT lately.
Keep an eye on whether it can hold this range high afterward. If OI keeps building and price doesn’t turn back, there may be another leg. But if it spikes higher while OI drops along with it, then be careful—it could be the last wave.
$LIT This spot is kind of interesting.
In the 15m timeframe, it’s up 2.66% on the move, and the volume managed to reach 1.62x, while the Z value at 4 went straight through and brought it up. The key isn’t just the price increase—OI is rising in sync too: 15m +0.09%, 1h +0.10%. The nominal change adds up to roughly 3M USD. The anomaly percentile is 96.6%, ranked #14 in the whole pool—these data would be in the front row across today’s entire market.
Structurally, it looks more like new leveraged long positions entering the market, not some sort of short-covering “fake pump.” The passive/active buy-sell ratio is 1.29, with a 12.7% difference—direction is quite clear. At the close, it even broke above the highs of the last ~20 5m candles, and this anomaly has been continuing for several consecutive cycles, not a one-off spike.
The depth data also confirms it: trading volume is higher than usual, and the price has touched the boundary of the recent range. This kind of combination hasn’t been that common on LIT lately.
Keep an eye on whether it can hold this range high afterward. If OI keeps building and price doesn’t turn back, there may be another leg. But if it spikes higher while OI drops along with it, then be careful—it could be the last wave.
In the 15m timeframe, it’s up 2.66% on the move, and the volume managed to reach 1.62x, while the Z value at 4 went straight through and brought it up. The key isn’t just the price increase—OI is rising in sync too: 15m +0.09%, 1h +0.10%. The nominal change adds up to roughly 3M USD. The anomaly percentile is 96.6%, ranked #14 in the whole pool—these data would be in the front row across today’s entire market.
Structurally, it looks more like new leveraged long positions entering the market, not some sort of short-covering “fake pump.” The passive/active buy-sell ratio is 1.29, with a 12.7% difference—direction is quite clear. At the close, it even broke above the highs of the last ~20 5m candles, and this anomaly has been continuing for several consecutive cycles, not a one-off spike.
The depth data also confirms it: trading volume is higher than usual, and the price has touched the boundary of the recent range. This kind of combination hasn’t been that common on LIT lately.
Keep an eye on whether it can hold this range high afterward. If OI keeps building and price doesn’t turn back, there may be another leg. But if it spikes higher while OI drops along with it, then be careful—it could be the last wave.
4

·
--
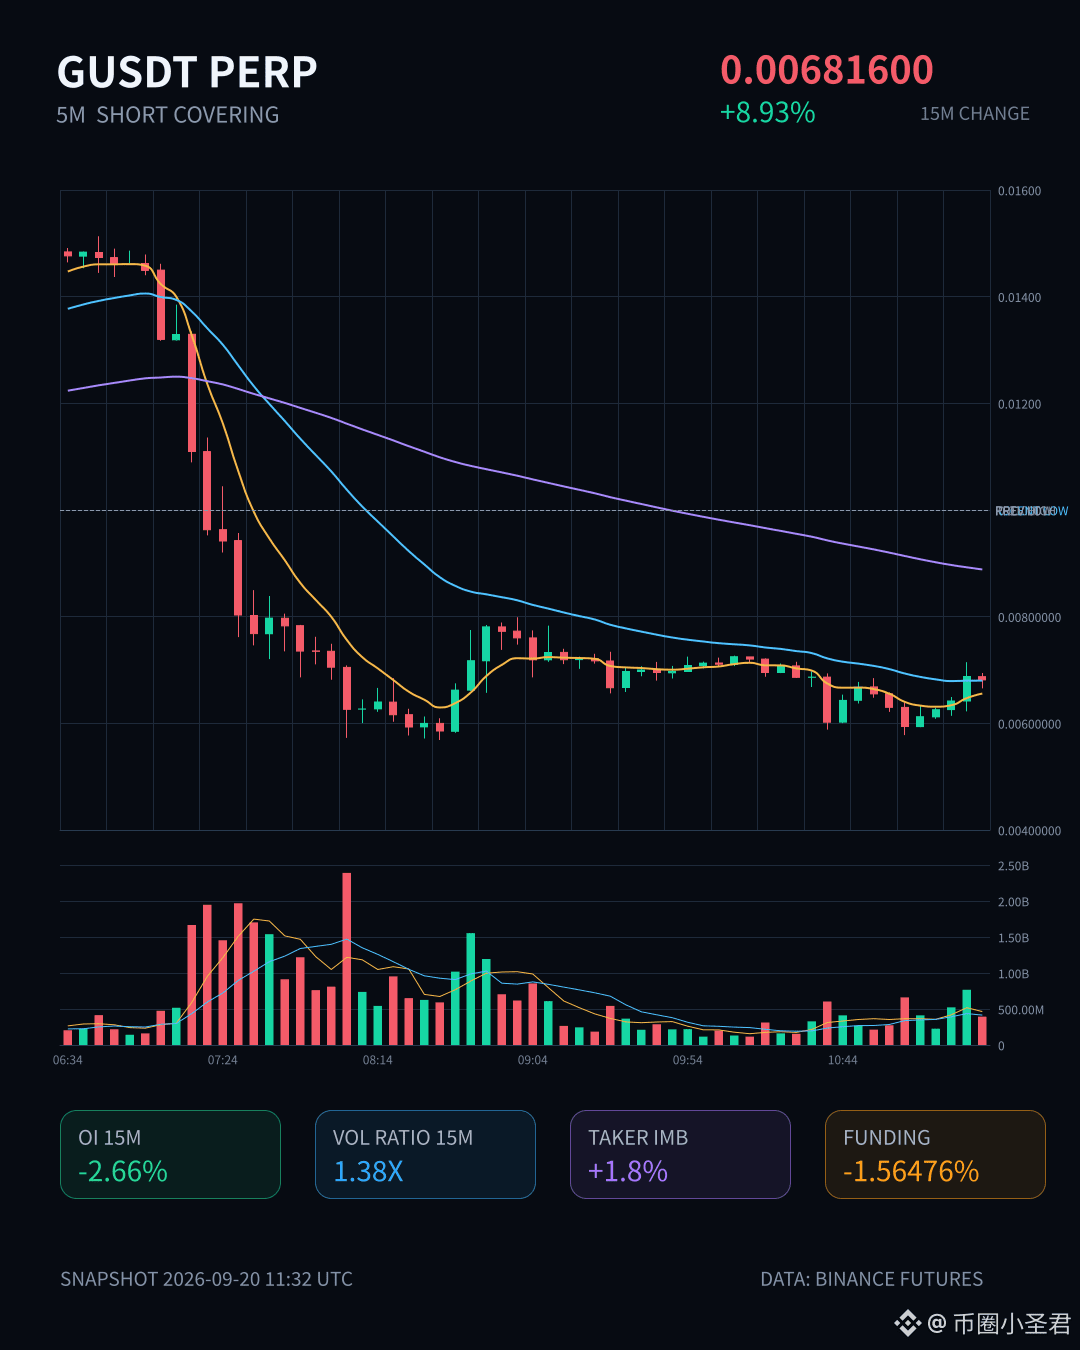
$G This move is a bit too fast—within 15m it already ran almost 9 points, but looking at OI it’s actually dropping. The 15m contract is -2.66%, and the 1h is also -1.71%, a typical pattern of price going up while positions go down.
This kind of structure is probably (80% likely) short covering pushing the price up, not fresh longs entering. The funding rate is still in the high percentile recently, which suggests longs are already quite crowded.
The aggressive trade gap is 1.8%, buy/sell ratio is 1.04, and volume is 1.38x. It’s not really a huge breakout—more like shorts being forced to close. The nominal change for the whole pool ranks at #14, with an abnormal percentile of 64.1%: there’s some action, but it hasn’t reached runaway territory.
In the last 24h, trading volume is 693M and the heat is there. But with this OI-divergent pump, be careful chasing. Once the covering ends, follow-through is likely to fade. See if it can hold steady—don’t get carried away.
$G This move is a bit too fast—within 15m it already ran almost 9 points, but looking at OI it’s actually dropping. The 15m contract is -2.66%, and the 1h is also -1.71%, a typical pattern of price going up while positions go down.
This kind of structure is probably (80% likely) short covering pushing the price up, not fresh longs entering. The funding rate is still in the high percentile recently, which suggests longs are already quite crowded.
The aggressive trade gap is 1.8%, buy/sell ratio is 1.04, and volume is 1.38x. It’s not really a huge breakout—more like shorts being forced to close. The nominal change for the whole pool ranks at #14, with an abnormal percentile of 64.1%: there’s some action, but it hasn’t reached runaway territory.
In the last 24h, trading volume is 693M and the heat is there. But with this OI-divergent pump, be careful chasing. Once the covering ends, follow-through is likely to fade. See if it can hold steady—don’t get carried away.
This kind of structure is probably (80% likely) short covering pushing the price up, not fresh longs entering. The funding rate is still in the high percentile recently, which suggests longs are already quite crowded.
The aggressive trade gap is 1.8%, buy/sell ratio is 1.04, and volume is 1.38x. It’s not really a huge breakout—more like shorts being forced to close. The nominal change for the whole pool ranks at #14, with an abnormal percentile of 64.1%: there’s some action, but it hasn’t reached runaway territory.
In the last 24h, trading volume is 693M and the heat is there. But with this OI-divergent pump, be careful chasing. Once the covering ends, follow-through is likely to fade. See if it can hold steady—don’t get carried away.
17
·
--
$SOL This drop is pretty orderly—prices down, positions down too. It doesn’t look like someone secretly adding shorts; it looks like the long side is withdrawing on its own.
The 15-minute trading volume directly hit more than 6 times the usual level, and the buy/sell ratio is 0.52—selling pressure is clearly one-sided. On Binance over the past 5 minutes, a liquidation proxy for 625k USDT was triggered, basically concentrated in the sell direction. The OI percentile is at 99.2%, and the pool rank is #14, with nominal change at #3. This isn’t a handful of stop-losses—it’s a batch of positions being swept out at roughly the same time.
Now look at the 1h OI: -0.85%, with nominally 24 million USDT exiting. Funding rates are still in the high percentile recently, which implies longs were already tightly crowded; this move looks more like a passive contraction during deleveraging rather than fresh shorts entering. Price has already tapped the boundary of the recent range, and volume has confirmed it. Structurally, it’s a classic long-side deleveraging, not new shorting.
Next, watch two things: first, whether OI can hold steady here; second, whether the aggressive buy/sell ratio can come back. If it keeps drifting lower on decreasing volume and OI continues to fall, then the liquidation/clearing process isn’t over yet. If selling pressure starts to exhaust and the buy/sell ratio moves back above 0.8, then this sweep may be close to done.
At this level, don’t rush to catch the dip. Wait for signals.
$SOL This drop is pretty orderly—prices down, positions down too. It doesn’t look like someone secretly adding shorts; it looks like the long side is withdrawing on its own.
The 15-minute trading volume directly hit more than 6 times the usual level, and the buy/sell ratio is 0.52—selling pressure is clearly one-sided. On Binance over the past 5 minutes, a liquidation proxy for 625k USDT was triggered, basically concentrated in the sell direction. The OI percentile is at 99.2%, and the pool rank is #14, with nominal change at #3. This isn’t a handful of stop-losses—it’s a batch of positions being swept out at roughly the same time.
Now look at the 1h OI: -0.85%, with nominally 24 million USDT exiting. Funding rates are still in the high percentile recently, which implies longs were already tightly crowded; this move looks more like a passive contraction during deleveraging rather than fresh shorts entering. Price has already tapped the boundary of the recent range, and volume has confirmed it. Structurally, it’s a classic long-side deleveraging, not new shorting.
Next, watch two things: first, whether OI can hold steady here; second, whether the aggressive buy/sell ratio can come back. If it keeps drifting lower on decreasing volume and OI continues to fall, then the liquidation/clearing process isn’t over yet. If selling pressure starts to exhaust and the buy/sell ratio moves back above 0.8, then this sweep may be close to done.
At this level, don’t rush to catch the dip. Wait for signals.
The 15-minute trading volume directly hit more than 6 times the usual level, and the buy/sell ratio is 0.52—selling pressure is clearly one-sided. On Binance over the past 5 minutes, a liquidation proxy for 625k USDT was triggered, basically concentrated in the sell direction. The OI percentile is at 99.2%, and the pool rank is #14, with nominal change at #3. This isn’t a handful of stop-losses—it’s a batch of positions being swept out at roughly the same time.
Now look at the 1h OI: -0.85%, with nominally 24 million USDT exiting. Funding rates are still in the high percentile recently, which implies longs were already tightly crowded; this move looks more like a passive contraction during deleveraging rather than fresh shorts entering. Price has already tapped the boundary of the recent range, and volume has confirmed it. Structurally, it’s a classic long-side deleveraging, not new shorting.
Next, watch two things: first, whether OI can hold steady here; second, whether the aggressive buy/sell ratio can come back. If it keeps drifting lower on decreasing volume and OI continues to fall, then the liquidation/clearing process isn’t over yet. If selling pressure starts to exhaust and the buy/sell ratio moves back above 0.8, then this sweep may be close to done.
At this level, don’t rush to catch the dip. Wait for signals.
178

·
--
$POL This move is a bit interesting.
On the 15m timeframe it rose by a little over 1%, volume expanded to 1.66x, and the close directly pierced through the upper band of nearly 20 of the 5m candles. But the OI gives it away—both the 15m and 1h are declining. Price is up while open interest is down. This doesn’t look like brand-new long positions entering; it looks more like shorts being forced to cover.
The aggressive buy orders do account for a 9.3% gap, with a buy-to-sell ratio of 1.21, so the short-term sentiment leans bullish. Also, the OI abnormal percentile has reached 89.5%, and the entire pool is stacked at #14 —so yes, it does look like capital is moving.
But I generally don’t chase setups like this. For a position-covering rally pushed upward, the “fuel” depends on whether there’s real money taking over afterward. The breakout is a real breakout—whether it can hold is another question.
I’ll set a stop loss to watch for a bit first.
$POL This move is a bit interesting.
On the 15m timeframe it rose by a little over 1%, volume expanded to 1.66x, and the close directly pierced through the upper band of nearly 20 of the 5m candles. But the OI gives it away—both the 15m and 1h are declining. Price is up while open interest is down. This doesn’t look like brand-new long positions entering; it looks more like shorts being forced to cover.
The aggressive buy orders do account for a 9.3% gap, with a buy-to-sell ratio of 1.21, so the short-term sentiment leans bullish. Also, the OI abnormal percentile has reached 89.5%, and the entire pool is stacked at #14 —so yes, it does look like capital is moving.
But I generally don’t chase setups like this. For a position-covering rally pushed upward, the “fuel” depends on whether there’s real money taking over afterward. The breakout is a real breakout—whether it can hold is another question.
I’ll set a stop loss to watch for a bit first.
On the 15m timeframe it rose by a little over 1%, volume expanded to 1.66x, and the close directly pierced through the upper band of nearly 20 of the 5m candles. But the OI gives it away—both the 15m and 1h are declining. Price is up while open interest is down. This doesn’t look like brand-new long positions entering; it looks more like shorts being forced to cover.
The aggressive buy orders do account for a 9.3% gap, with a buy-to-sell ratio of 1.21, so the short-term sentiment leans bullish. Also, the OI abnormal percentile has reached 89.5%, and the entire pool is stacked at #14 —so yes, it does look like capital is moving.
But I generally don’t chase setups like this. For a position-covering rally pushed upward, the “fuel” depends on whether there’s real money taking over afterward. The breakout is a real breakout—whether it can hold is another question.
I’ll set a stop loss to watch for a bit first.
23
·
--
ADA This move is kind of interesting.
On the 15m timeframe, it directly surged by 1.47%. Volume hit 3.04x, Z value is 4.2—clearly there’s capital entering and causing a stir. Price broke above the upper bounds of the last ~20 consecutive 5m K-bars. The aggressive buy/sell ratio is 1.38, aggressive trade volume is up +16.1%, and the bid side is pushing.
But pay attention to one detail—OI is falling. On the 15m timeframe, OI is -0.32%; on the 1h timeframe, OI is -0.45%. Price is up while positions are down. This kind of structure looks more like short covering or older positions being reduced—not large-scale new longs building fresh positions.
Still, the OI abnormal percentile is 97%. It’s #16 in the pool’s abnormal ranking, with nominal change ranked #14. That indicates the position change itself is extremely abnormal within the pool. Funding rate has also been sitting in high percentiles recently, and multiple consecutive cycles have continued this condition.
In the last 24h, the trading value is 260 million U, and depth is sufficient.
With this kind of structure, I usually take a closer look—if the rally driven by short covering doesn’t get followed by new longs, it can easily turn into a one-off move. But if the funding rate stays high and OI starts to increase again, then it’s a different story.
$ADA
ADA This move is kind of interesting.
On the 15m timeframe, it directly surged by 1.47%. Volume hit 3.04x, Z value is 4.2—clearly there’s capital entering and causing a stir. Price broke above the upper bounds of the last ~20 consecutive 5m K-bars. The aggressive buy/sell ratio is 1.38, aggressive trade volume is up +16.1%, and the bid side is pushing.
But pay attention to one detail—OI is falling. On the 15m timeframe, OI is -0.32%; on the 1h timeframe, OI is -0.45%. Price is up while positions are down. This kind of structure looks more like short covering or older positions being reduced—not large-scale new longs building fresh positions.
Still, the OI abnormal percentile is 97%. It’s #16 in the pool’s abnormal ranking, with nominal change ranked #14. That indicates the position change itself is extremely abnormal within the pool. Funding rate has also been sitting in high percentiles recently, and multiple consecutive cycles have continued this condition.
In the last 24h, the trading value is 260 million U, and depth is sufficient.
With this kind of structure, I usually take a closer look—if the rally driven by short covering doesn’t get followed by new longs, it can easily turn into a one-off move. But if the funding rate stays high and OI starts to increase again, then it’s a different story.
$ADA
On the 15m timeframe, it directly surged by 1.47%. Volume hit 3.04x, Z value is 4.2—clearly there’s capital entering and causing a stir. Price broke above the upper bounds of the last ~20 consecutive 5m K-bars. The aggressive buy/sell ratio is 1.38, aggressive trade volume is up +16.1%, and the bid side is pushing.
But pay attention to one detail—OI is falling. On the 15m timeframe, OI is -0.32%; on the 1h timeframe, OI is -0.45%. Price is up while positions are down. This kind of structure looks more like short covering or older positions being reduced—not large-scale new longs building fresh positions.
Still, the OI abnormal percentile is 97%. It’s #16 in the pool’s abnormal ranking, with nominal change ranked #14. That indicates the position change itself is extremely abnormal within the pool. Funding rate has also been sitting in high percentiles recently, and multiple consecutive cycles have continued this condition.
In the last 24h, the trading value is 260 million U, and depth is sufficient.
With this kind of structure, I usually take a closer look—if the rally driven by short covering doesn’t get followed by new longs, it can easily turn into a one-off move. But if the funding rate stays high and OI starts to increase again, then it’s a different story.
$ADA
1.1k
·
--
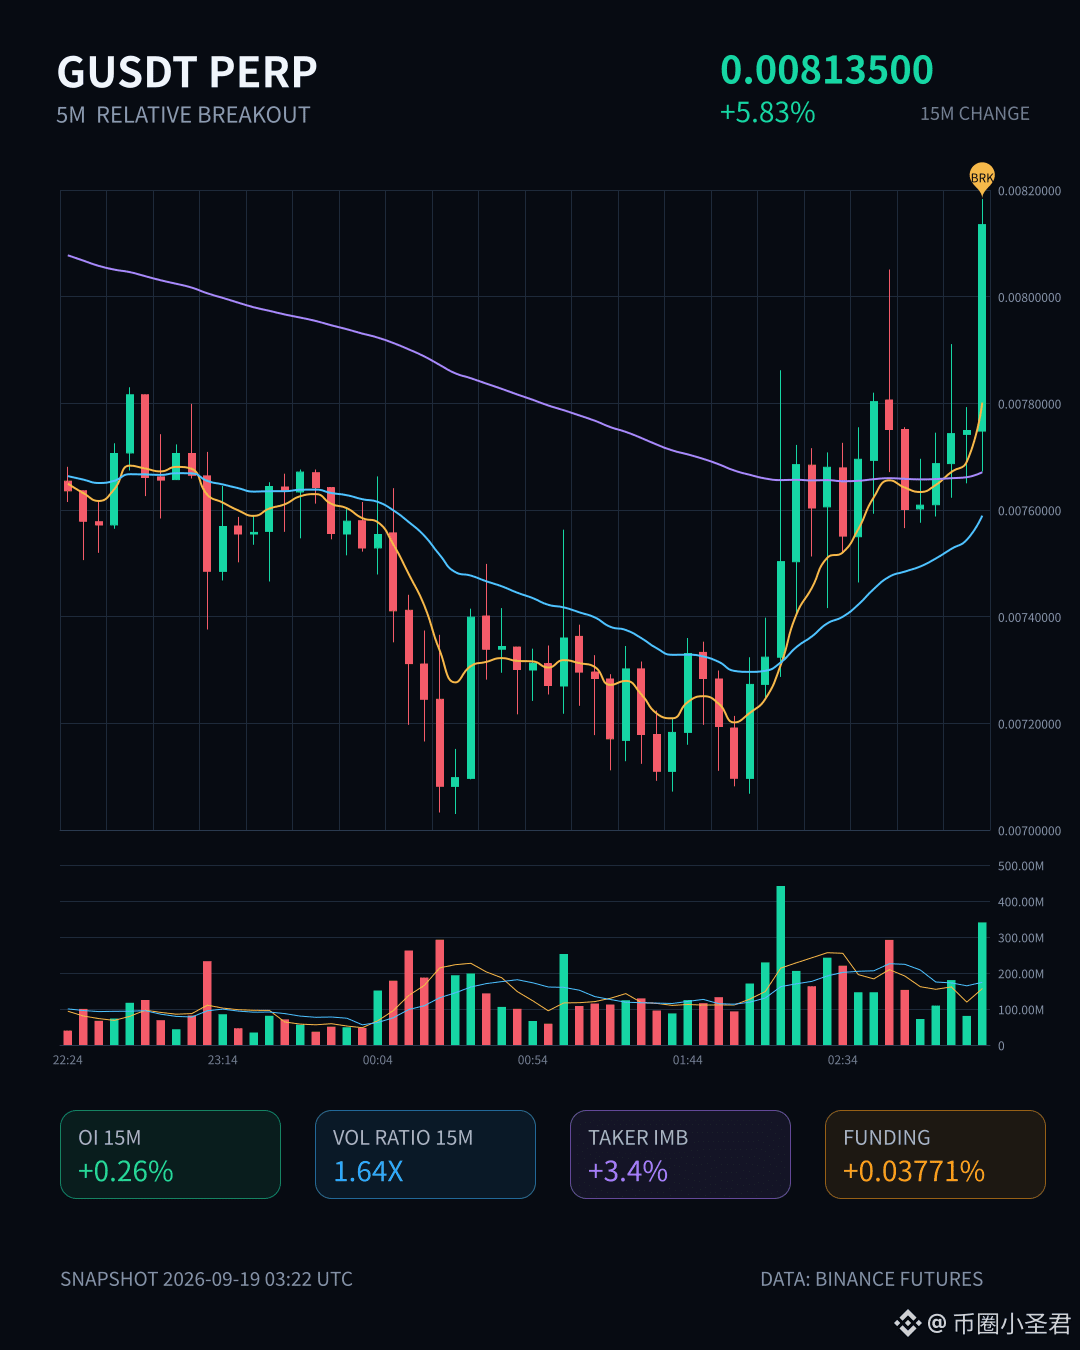
$G This move is a bit interesting.
In 15m, it’s up 5.83%; volume is 1.64x. It directly broke through the upper edge of the recent ~20 consecutive 5m candles. The key is that OI is rising along with it—on 15m, OI +0.26%, nominal +936K; on the 1h timeframe, nominal also added 860K. Price is rising along with OI—this doesn’t look like a short-squeeze kind of fakeout; it looks more like someone is opening fresh longs.
Anomaly percentile is 88.5%, total pool #23, nominal change #14. Depth has been confirmed.
24h trading value is 707M, which isn’t small in the pool.
Active trade gap is 3.4%, buy/sell ratio is 1.07—bullish, but not overheated.
First, see whether it can hold above this range’s upper edge. If it’s a false breakout, OI will speak first.
$G This move is a bit interesting.
In 15m, it’s up 5.83%; volume is 1.64x. It directly broke through the upper edge of the recent ~20 consecutive 5m candles. The key is that OI is rising along with it—on 15m, OI +0.26%, nominal +936K; on the 1h timeframe, nominal also added 860K. Price is rising along with OI—this doesn’t look like a short-squeeze kind of fakeout; it looks more like someone is opening fresh longs.
Anomaly percentile is 88.5%, total pool #23, nominal change #14. Depth has been confirmed.
24h trading value is 707M, which isn’t small in the pool.
Active trade gap is 3.4%, buy/sell ratio is 1.07—bullish, but not overheated.
First, see whether it can hold above this range’s upper edge. If it’s a false breakout, OI will speak first.
In 15m, it’s up 5.83%; volume is 1.64x. It directly broke through the upper edge of the recent ~20 consecutive 5m candles. The key is that OI is rising along with it—on 15m, OI +0.26%, nominal +936K; on the 1h timeframe, nominal also added 860K. Price is rising along with OI—this doesn’t look like a short-squeeze kind of fakeout; it looks more like someone is opening fresh longs.
Anomaly percentile is 88.5%, total pool #23, nominal change #14. Depth has been confirmed.
24h trading value is 707M, which isn’t small in the pool.
Active trade gap is 3.4%, buy/sell ratio is 1.07—bullish, but not overheated.
First, see whether it can hold above this range’s upper edge. If it’s a false breakout, OI will speak first.
26
·
--
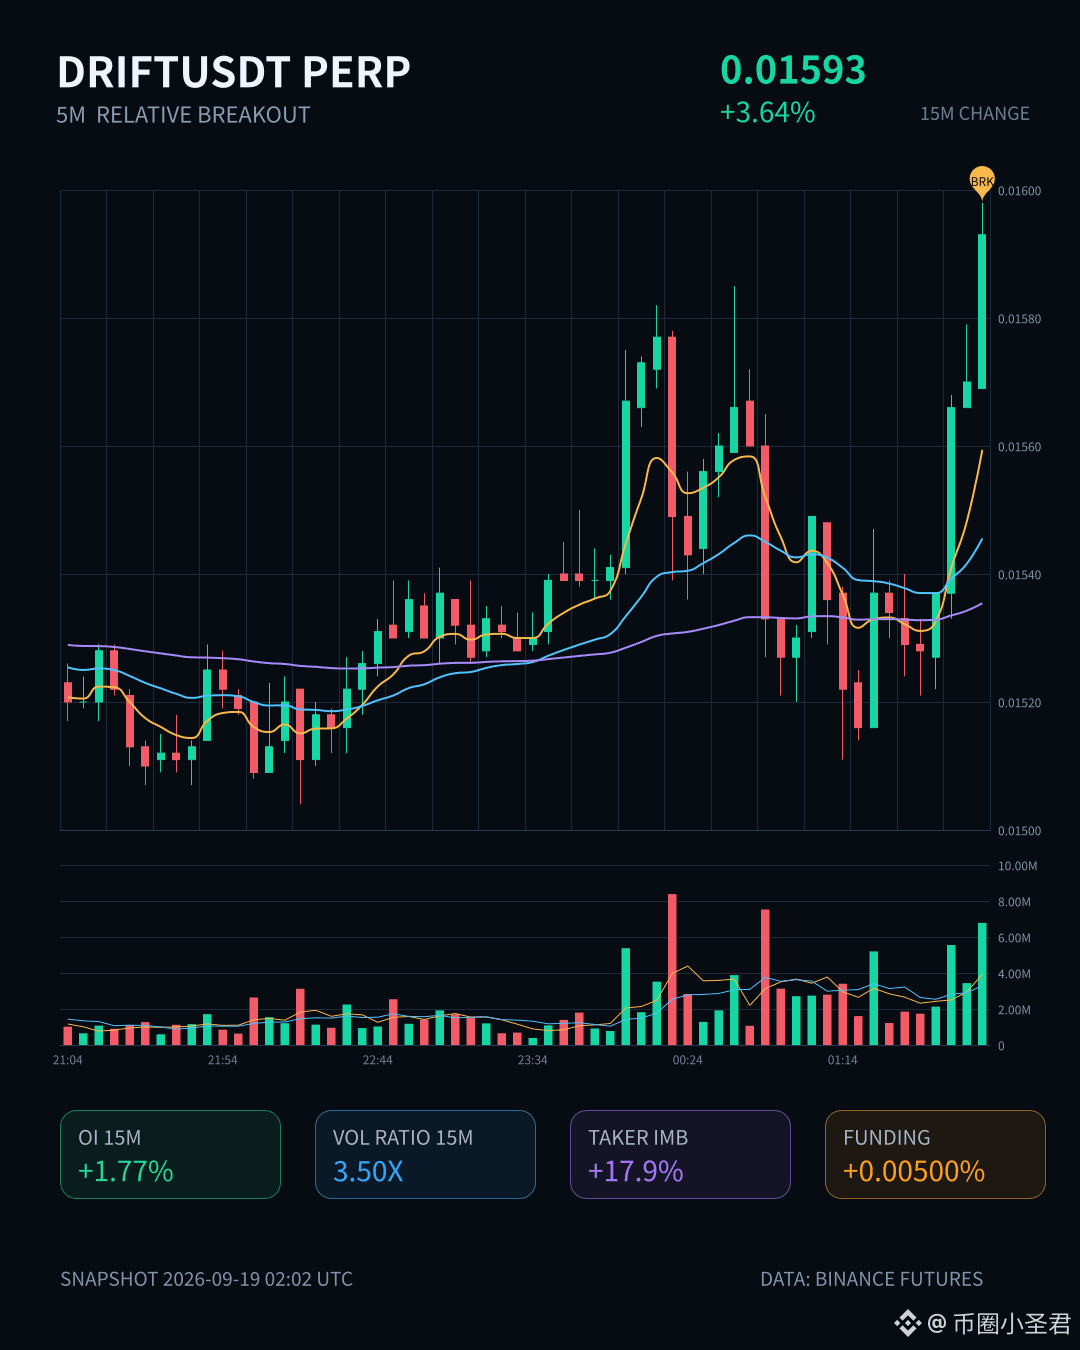
$DRIFT This move has something to it.
In 15m, it pulled directly up 3.64%; volume hit 3.5x, and the Z value is 3.71—this isn’t something small retail orders can produce just by tapping around. The closing price holds above the upper edge of the last ~20 5m candles, and the breakout through the range is quite clean.
The key is OI: 15m +1.77%, 1h +0.93%, and the notional change is all above 5%, with an abnormal percentile of 92.5%. Price is up and open interest is up—this looks like new leveraged long positions rushing in, not the kind of “hot air” from shorts covering. Active trading volume is down 17.9%, buy/sell ratio is 1.43, and buyers are holding the initiative.
The funding rate is already at a high percentile recently—worth keeping an eye on. Long crowding is trending higher.
Over the last 24h, turnover is 65M; liquidity depth is sufficient, not the kind of order book where you pull one candle and nobody comes to take it. The whole pool’s abnormal #14—doesn’t rank as the most intense, but the structure is cleaner than a lot of noisy solo setups.
Let’s see whether it can hold on to this broken upper line—if it can, then there’s a next leg.
$DRIFT This move has something to it.
In 15m, it pulled directly up 3.64%; volume hit 3.5x, and the Z value is 3.71—this isn’t something small retail orders can produce just by tapping around. The closing price holds above the upper edge of the last ~20 5m candles, and the breakout through the range is quite clean.
The key is OI: 15m +1.77%, 1h +0.93%, and the notional change is all above 5%, with an abnormal percentile of 92.5%. Price is up and open interest is up—this looks like new leveraged long positions rushing in, not the kind of “hot air” from shorts covering. Active trading volume is down 17.9%, buy/sell ratio is 1.43, and buyers are holding the initiative.
The funding rate is already at a high percentile recently—worth keeping an eye on. Long crowding is trending higher.
Over the last 24h, turnover is 65M; liquidity depth is sufficient, not the kind of order book where you pull one candle and nobody comes to take it. The whole pool’s abnormal #14—doesn’t rank as the most intense, but the structure is cleaner than a lot of noisy solo setups.
Let’s see whether it can hold on to this broken upper line—if it can, then there’s a next leg.
In 15m, it pulled directly up 3.64%; volume hit 3.5x, and the Z value is 3.71—this isn’t something small retail orders can produce just by tapping around. The closing price holds above the upper edge of the last ~20 5m candles, and the breakout through the range is quite clean.
The key is OI: 15m +1.77%, 1h +0.93%, and the notional change is all above 5%, with an abnormal percentile of 92.5%. Price is up and open interest is up—this looks like new leveraged long positions rushing in, not the kind of “hot air” from shorts covering. Active trading volume is down 17.9%, buy/sell ratio is 1.43, and buyers are holding the initiative.
The funding rate is already at a high percentile recently—worth keeping an eye on. Long crowding is trending higher.
Over the last 24h, turnover is 65M; liquidity depth is sufficient, not the kind of order book where you pull one candle and nobody comes to take it. The whole pool’s abnormal #14—doesn’t rank as the most intense, but the structure is cleaner than a lot of noisy solo setups.
Let’s see whether it can hold on to this broken upper line—if it can, then there’s a next leg.
41
·
--
$MOODENG This drop is a bit sudden.
In the 15m chart, it directly got smashed down 2%. The volume surged to more than 8x the average volume. The Z value is 4.77—this isn’t just minor action.
The key point is that OI is declining in sync. OI is down -4.82% on 15m and -5.76% on 1h, with an abnormal percentile of 98.6%, placing it at #14 in the whole pool.
Price is falling while OI is falling too—this is a classic deleveraging pattern. It’s not new shorts entering; it’s longs being forced out (liquidated) instead.
The buy/sell ratio is 0.62, meaning sell pressure is dominant. On the 5m chart, it also broke below the lower bound of the past 20+ range.
The question now is: has this deleveraging run already finished, or is it only the first round? An abnormal percentile of 98.6% means this kind of thing is not common. If multiple consecutive cycles are continuing, don’t rush to catch the falling move yet.
$MOODENG This drop is a bit sudden.
In the 15m chart, it directly got smashed down 2%. The volume surged to more than 8x the average volume. The Z value is 4.77—this isn’t just minor action.
The key point is that OI is declining in sync. OI is down -4.82% on 15m and -5.76% on 1h, with an abnormal percentile of 98.6%, placing it at #14 in the whole pool.
Price is falling while OI is falling too—this is a classic deleveraging pattern. It’s not new shorts entering; it’s longs being forced out (liquidated) instead.
The buy/sell ratio is 0.62, meaning sell pressure is dominant. On the 5m chart, it also broke below the lower bound of the past 20+ range.
The question now is: has this deleveraging run already finished, or is it only the first round? An abnormal percentile of 98.6% means this kind of thing is not common. If multiple consecutive cycles are continuing, don’t rush to catch the falling move yet.
In the 15m chart, it directly got smashed down 2%. The volume surged to more than 8x the average volume. The Z value is 4.77—this isn’t just minor action.
The key point is that OI is declining in sync. OI is down -4.82% on 15m and -5.76% on 1h, with an abnormal percentile of 98.6%, placing it at #14 in the whole pool.
Price is falling while OI is falling too—this is a classic deleveraging pattern. It’s not new shorts entering; it’s longs being forced out (liquidated) instead.
The buy/sell ratio is 0.62, meaning sell pressure is dominant. On the 5m chart, it also broke below the lower bound of the past 20+ range.
The question now is: has this deleveraging run already finished, or is it only the first round? An abnormal percentile of 98.6% means this kind of thing is not common. If multiple consecutive cycles are continuing, don’t rush to catch the falling move yet.
5
·
--
ONE This move is a bit interesting.
In 15m, it rose 4.39%, with volume up 1.6x. OI jumped +4.84% in 1h, and nominal value saw 1.92M in inflows. Price is up, positions are up—this is typical leveraged longs adding, not shorts getting squeezed.
Anomaly percentile is 89.9%, within the whole pool #20, nominal change #14—this isn’t the absolute top, but it’s already in the front row. The funding rate has also reached a high percentile recently, suggesting long sentiment isn’t low.
In 24h, turnover is 603M, buy/sell ratio 1.04. Active buying is slightly dominant, but not extreme.
The question now is: OI is rising faster than price, and the leverage is stacking a bit quickly. If it can hold here, it becomes the upper boundary of a new range; if it can’t, it becomes fuel for a wave of longs getting forced liquidated.
First, see whether it can hold the 4.39% move on the 15m timeframe.
ONE This move is a bit interesting.
In 15m, it rose 4.39%, with volume up 1.6x. OI jumped +4.84% in 1h, and nominal value saw 1.92M in inflows. Price is up, positions are up—this is typical leveraged longs adding, not shorts getting squeezed.
Anomaly percentile is 89.9%, within the whole pool #20, nominal change #14—this isn’t the absolute top, but it’s already in the front row. The funding rate has also reached a high percentile recently, suggesting long sentiment isn’t low.
In 24h, turnover is 603M, buy/sell ratio 1.04. Active buying is slightly dominant, but not extreme.
The question now is: OI is rising faster than price, and the leverage is stacking a bit quickly. If it can hold here, it becomes the upper boundary of a new range; if it can’t, it becomes fuel for a wave of longs getting forced liquidated.
First, see whether it can hold the 4.39% move on the 15m timeframe.
In 15m, it rose 4.39%, with volume up 1.6x. OI jumped +4.84% in 1h, and nominal value saw 1.92M in inflows. Price is up, positions are up—this is typical leveraged longs adding, not shorts getting squeezed.
Anomaly percentile is 89.9%, within the whole pool #20, nominal change #14—this isn’t the absolute top, but it’s already in the front row. The funding rate has also reached a high percentile recently, suggesting long sentiment isn’t low.
In 24h, turnover is 603M, buy/sell ratio 1.04. Active buying is slightly dominant, but not extreme.
The question now is: OI is rising faster than price, and the leverage is stacking a bit quickly. If it can hold here, it becomes the upper boundary of a new range; if it can’t, it becomes fuel for a wave of longs getting forced liquidated.
First, see whether it can hold the 4.39% move on the 15m timeframe.
14
·
--
$AKE This is kind of interesting. 15m: it pulled 2.69%, with volume surging to 4.44x. The Z value is 4.54. And the close even broke above the upper band of nearly 20 of the 5m candles—not a wick push-through, but a real close upward.
The key is that OI is rising in sync: 1h +0.52%, nominal +986K, with an extreme percentile of 88.9%. The full-pool nominal change ranks at #14. Price is up, positions are up—classic incremental leveraged long entries, not that kind of “short covering” that comes with fake heat.
The buy/sell ratio (initiated) is 1.22, and the difference in initiated trades is -10.1%—buyers are actively eating orders. 24h turnover is 98.77M. Liquidity is sufficient, and the depth also confirms that the volume capacity is higher than normal.
The range boundary has just been breached. From here, it either accelerates or performs a fake breakout and then retraces. I’m mainly watching whether the volume can continue, and that the OI doesn’t diverge anymore.
$AKE This is kind of interesting. 15m: it pulled 2.69%, with volume surging to 4.44x. The Z value is 4.54. And the close even broke above the upper band of nearly 20 of the 5m candles—not a wick push-through, but a real close upward.
The key is that OI is rising in sync: 1h +0.52%, nominal +986K, with an extreme percentile of 88.9%. The full-pool nominal change ranks at #14. Price is up, positions are up—classic incremental leveraged long entries, not that kind of “short covering” that comes with fake heat.
The buy/sell ratio (initiated) is 1.22, and the difference in initiated trades is -10.1%—buyers are actively eating orders. 24h turnover is 98.77M. Liquidity is sufficient, and the depth also confirms that the volume capacity is higher than normal.
The range boundary has just been breached. From here, it either accelerates or performs a fake breakout and then retraces. I’m mainly watching whether the volume can continue, and that the OI doesn’t diverge anymore.
The key is that OI is rising in sync: 1h +0.52%, nominal +986K, with an extreme percentile of 88.9%. The full-pool nominal change ranks at #14. Price is up, positions are up—classic incremental leveraged long entries, not that kind of “short covering” that comes with fake heat.
The buy/sell ratio (initiated) is 1.22, and the difference in initiated trades is -10.1%—buyers are actively eating orders. 24h turnover is 98.77M. Liquidity is sufficient, and the depth also confirms that the volume capacity is higher than normal.
The range boundary has just been breached. From here, it either accelerates or performs a fake breakout and then retraces. I’m mainly watching whether the volume can continue, and that the OI doesn’t diverge anymore.
36
·
--
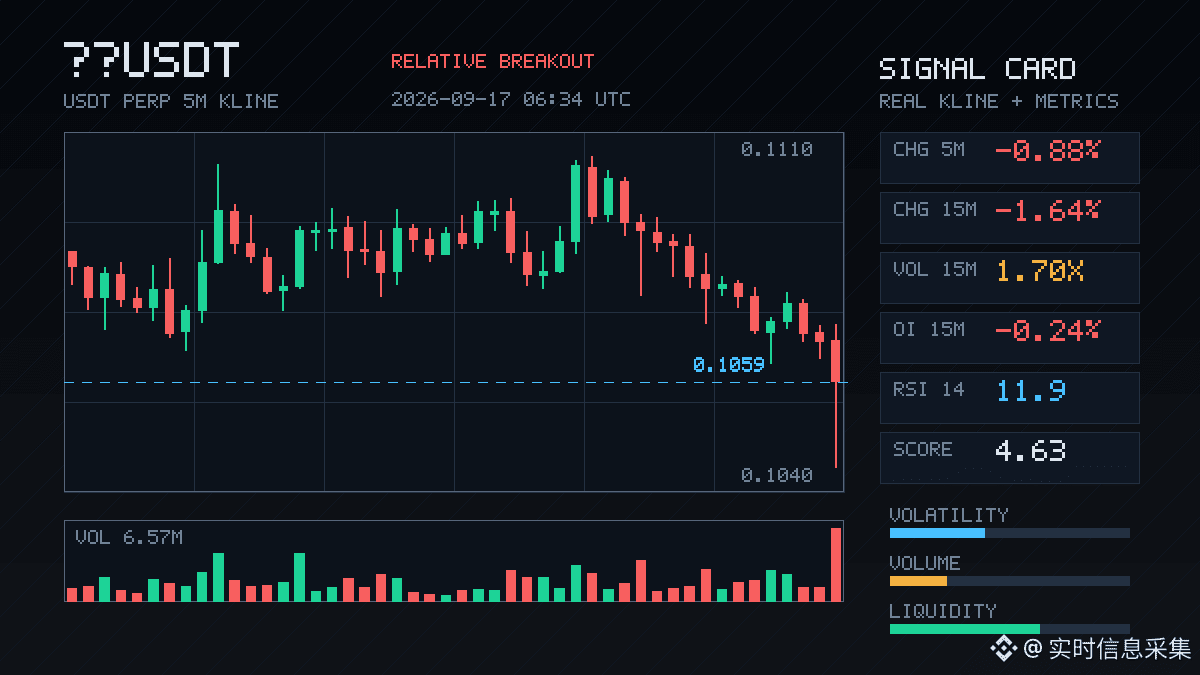
$牛来 This 15m selloff is kind of interesting.
The price is down 1.64%, and the volume expands to 1.7x. It directly breaks below the lower edge of the past ~20 5m candles. But looking at OI—both 15m and 1h OI are falling, and the nominal has run off by nearly 1.5 million U. This isn’t fresh shorting entering; it feels more like longs are de-leveraging on their own, and stop-losses get swept.
Passive trade gap is -30.9%, buy/sell ratio is 0.53, and sell pressure is clearly dominant. However, the OI abnormal percentile hits 85.9%, the whole pool abnormal is #12, and nominal change is #14—at this spot, it doesn’t look like a quiet, orderly decline.
In the last 24h, turnover is 73M, and the depth confirms that volume is higher than usual.
My take: this is a position-contraction type of drop, not a trend-driven wave of short entries. But since the lower bound of the range breaks, in the short term we have to see whether price can quickly reclaim it. If it can’t, the next level won’t look as good.
$牛来 This 15m selloff is kind of interesting.
The price is down 1.64%, and the volume expands to 1.7x. It directly breaks below the lower edge of the past ~20 5m candles. But looking at OI—both 15m and 1h OI are falling, and the nominal has run off by nearly 1.5 million U. This isn’t fresh shorting entering; it feels more like longs are de-leveraging on their own, and stop-losses get swept.
Passive trade gap is -30.9%, buy/sell ratio is 0.53, and sell pressure is clearly dominant. However, the OI abnormal percentile hits 85.9%, the whole pool abnormal is #12, and nominal change is #14—at this spot, it doesn’t look like a quiet, orderly decline.
In the last 24h, turnover is 73M, and the depth confirms that volume is higher than usual.
My take: this is a position-contraction type of drop, not a trend-driven wave of short entries. But since the lower bound of the range breaks, in the short term we have to see whether price can quickly reclaim it. If it can’t, the next level won’t look as good.
The price is down 1.64%, and the volume expands to 1.7x. It directly breaks below the lower edge of the past ~20 5m candles. But looking at OI—both 15m and 1h OI are falling, and the nominal has run off by nearly 1.5 million U. This isn’t fresh shorting entering; it feels more like longs are de-leveraging on their own, and stop-losses get swept.
Passive trade gap is -30.9%, buy/sell ratio is 0.53, and sell pressure is clearly dominant. However, the OI abnormal percentile hits 85.9%, the whole pool abnormal is #12, and nominal change is #14—at this spot, it doesn’t look like a quiet, orderly decline.
In the last 24h, turnover is 73M, and the depth confirms that volume is higher than usual.
My take: this is a position-contraction type of drop, not a trend-driven wave of short entries. But since the lower bound of the range breaks, in the short term we have to see whether price can quickly reclaim it. If it can’t, the next level won’t look as good.
12
·
--
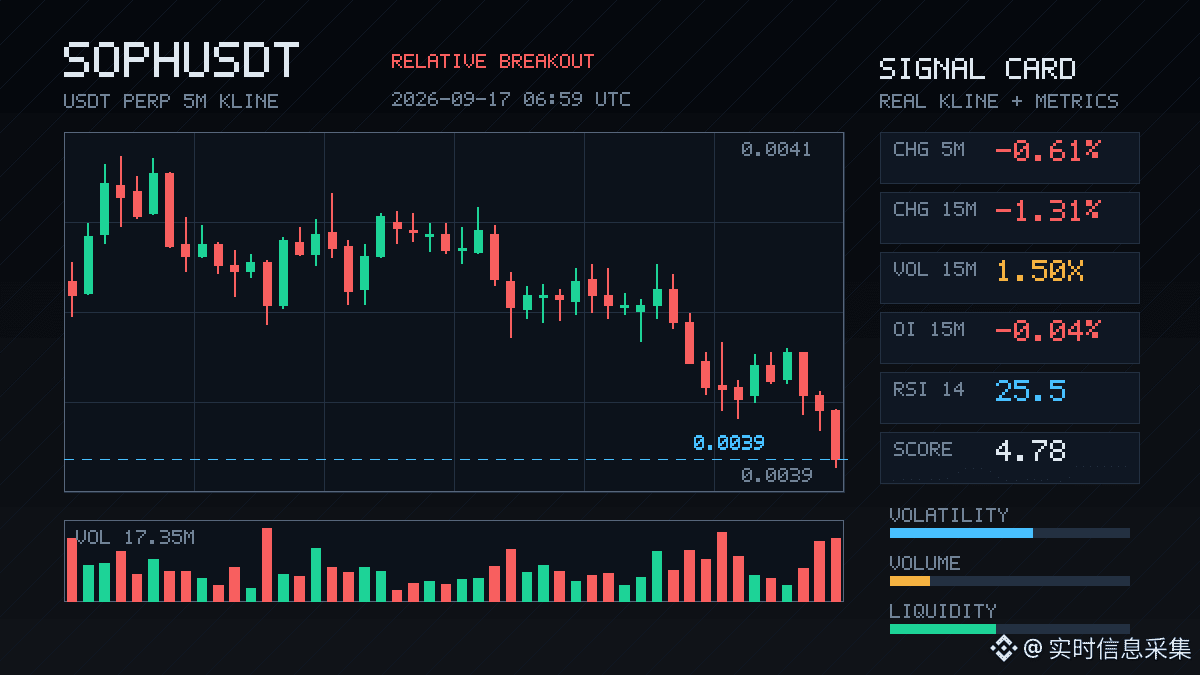
$SOPH This 15m has broken the lower support line; it’s down 1.31%, volume is 1.5x, and the Z value is 2.38. It’s not a huge commotion, but the aggressive trade imbalance is -19.9%, and the buy/sell ratio is 0.67—the sell pressure is for real.
What’s interesting is the OI: over the 1h window it’s still +0.10%, yet the notional has decreased by 94K; on the 15m window the notional is down 72K. Price is falling while OI is decreasing—this is typical of long liquidation/deleveraging, with stop-losses or position reduction, not fresh shorts entering to smash it.
The abnormal percentile is 85.9%, rank #14 in the whole pool, with 24h turnover of 20.56M. This depth confirms that the range boundary has been touched: directionally there’s some bias, but OI hasn’t expanded accordingly. That suggests this move is more like passive deleveraging within existing positions, not a trend-driven shorting.
First, see whether this lower support can be reclaimed. If it can’t be reclaimed, there may still be another leg of deleveraging afterward.
$SOPH This 15m has broken the lower support line; it’s down 1.31%, volume is 1.5x, and the Z value is 2.38. It’s not a huge commotion, but the aggressive trade imbalance is -19.9%, and the buy/sell ratio is 0.67—the sell pressure is for real.
What’s interesting is the OI: over the 1h window it’s still +0.10%, yet the notional has decreased by 94K; on the 15m window the notional is down 72K. Price is falling while OI is decreasing—this is typical of long liquidation/deleveraging, with stop-losses or position reduction, not fresh shorts entering to smash it.
The abnormal percentile is 85.9%, rank #14 in the whole pool, with 24h turnover of 20.56M. This depth confirms that the range boundary has been touched: directionally there’s some bias, but OI hasn’t expanded accordingly. That suggests this move is more like passive deleveraging within existing positions, not a trend-driven shorting.
First, see whether this lower support can be reclaimed. If it can’t be reclaimed, there may still be another leg of deleveraging afterward.
What’s interesting is the OI: over the 1h window it’s still +0.10%, yet the notional has decreased by 94K; on the 15m window the notional is down 72K. Price is falling while OI is decreasing—this is typical of long liquidation/deleveraging, with stop-losses or position reduction, not fresh shorts entering to smash it.
The abnormal percentile is 85.9%, rank #14 in the whole pool, with 24h turnover of 20.56M. This depth confirms that the range boundary has been touched: directionally there’s some bias, but OI hasn’t expanded accordingly. That suggests this move is more like passive deleveraging within existing positions, not a trend-driven shorting.
First, see whether this lower support can be reclaimed. If it can’t be reclaimed, there may still be another leg of deleveraging afterward.
3
·
--
$INJ There’s something going on with this bullish 15m candle.
The volume directly shot up to 4.13x, the buy-sell ratio is 2.41, active trading is down 41.4%, and the close still held above the upper edge of nearly 20 5m K candles. In short—someone is actively sweeping buy orders upwards, and doing it pretty aggressively.
But interestingly, the OI: 15m -0.53%, 1h -0.85%. Price is up while open interest is down. This structure is more like short covering and position unwinding, not brand-new longs entering in a big way. Coupled with the abnormal percentile of OI hitting 95%, and the whole pool abnormal rank #14, it suggests this isn’t only that one contract moving—it’s a relatively leading mover within the entire pool.
My take: the shorts above are being squeezed, so the probability of a short-term squeeze isn’t small. However, since OI isn’t keeping up, if this move is only driven by covering, when price pushes toward the prior high area, watch whether there’s incremental “fresh” buying to take over. Don’t treat a squeeze as the start of a sustained uptrend.
Keep an eye on whether volume can continue, and after price reaches extreme levels, whether OI starts turning upward too.
$INJ There’s something going on with this bullish 15m candle.
The volume directly shot up to 4.13x, the buy-sell ratio is 2.41, active trading is down 41.4%, and the close still held above the upper edge of nearly 20 5m K candles. In short—someone is actively sweeping buy orders upwards, and doing it pretty aggressively.
But interestingly, the OI: 15m -0.53%, 1h -0.85%. Price is up while open interest is down. This structure is more like short covering and position unwinding, not brand-new longs entering in a big way. Coupled with the abnormal percentile of OI hitting 95%, and the whole pool abnormal rank #14, it suggests this isn’t only that one contract moving—it’s a relatively leading mover within the entire pool.
My take: the shorts above are being squeezed, so the probability of a short-term squeeze isn’t small. However, since OI isn’t keeping up, if this move is only driven by covering, when price pushes toward the prior high area, watch whether there’s incremental “fresh” buying to take over. Don’t treat a squeeze as the start of a sustained uptrend.
Keep an eye on whether volume can continue, and after price reaches extreme levels, whether OI starts turning upward too.
The volume directly shot up to 4.13x, the buy-sell ratio is 2.41, active trading is down 41.4%, and the close still held above the upper edge of nearly 20 5m K candles. In short—someone is actively sweeping buy orders upwards, and doing it pretty aggressively.
But interestingly, the OI: 15m -0.53%, 1h -0.85%. Price is up while open interest is down. This structure is more like short covering and position unwinding, not brand-new longs entering in a big way. Coupled with the abnormal percentile of OI hitting 95%, and the whole pool abnormal rank #14, it suggests this isn’t only that one contract moving—it’s a relatively leading mover within the entire pool.
My take: the shorts above are being squeezed, so the probability of a short-term squeeze isn’t small. However, since OI isn’t keeping up, if this move is only driven by covering, when price pushes toward the prior high area, watch whether there’s incremental “fresh” buying to take over. Don’t treat a squeeze as the start of a sustained uptrend.
Keep an eye on whether volume can continue, and after price reaches extreme levels, whether OI starts turning upward too.
97
·
--
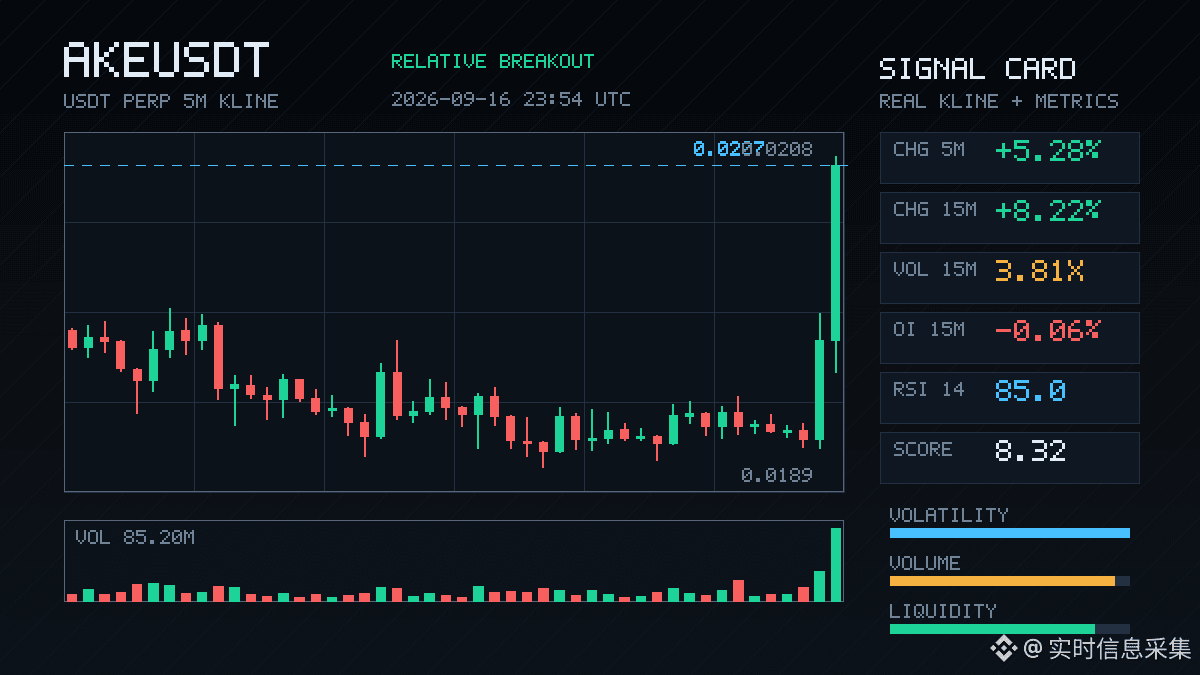
$AKE 15m directly surged up 8.22%. Volume was 3.81x, and the volatility Z hit 10.34. The close broke above the upper edge of the recent 20 five-minute intervals.
But OI is falling: 15m -0.06%, 1h -0.29%. Prices are up while positions are being reduced—this structure looks more like short-covering pushing the move rather than fresh long capital entering.
The主动成交 (aggressive trading) is -12.3% short-term, with a buy/sell ratio of 1.28. Over the past 24h, total trading volume is a bit over 360 million, and liquidity depth is sufficient. The notional change ranks #14 in the whole pool, with an abnormal percentile of 65.9%—not extreme, but not ambiguous either.
For a breakout driven by short-covering, before you chase it, make sure you’ve thought through whether there will be incremental buying after the covering ends—the presence or absence of follow-through is the key to whether it can keep running.
$AKE 15m directly surged up 8.22%. Volume was 3.81x, and the volatility Z hit 10.34. The close broke above the upper edge of the recent 20 five-minute intervals.
But OI is falling: 15m -0.06%, 1h -0.29%. Prices are up while positions are being reduced—this structure looks more like short-covering pushing the move rather than fresh long capital entering.
The主动成交 (aggressive trading) is -12.3% short-term, with a buy/sell ratio of 1.28. Over the past 24h, total trading volume is a bit over 360 million, and liquidity depth is sufficient. The notional change ranks #14 in the whole pool, with an abnormal percentile of 65.9%—not extreme, but not ambiguous either.
For a breakout driven by short-covering, before you chase it, make sure you’ve thought through whether there will be incremental buying after the covering ends—the presence or absence of follow-through is the key to whether it can keep running.
But OI is falling: 15m -0.06%, 1h -0.29%. Prices are up while positions are being reduced—this structure looks more like short-covering pushing the move rather than fresh long capital entering.
The主动成交 (aggressive trading) is -12.3% short-term, with a buy/sell ratio of 1.28. Over the past 24h, total trading volume is a bit over 360 million, and liquidity depth is sufficient. The notional change ranks #14 in the whole pool, with an abnormal percentile of 65.9%—not extreme, but not ambiguous either.
For a breakout driven by short-covering, before you chase it, make sure you’ve thought through whether there will be incremental buying after the covering ends—the presence or absence of follow-through is the key to whether it can keep running.
14

·
--
🏆 CRYPTO vs THE WORLD
$BTC #14 of all assets · needs +$101.13B to flip Broadcom
$ETH #68 of all assets · needs +$9.74B to flip Philip Morris
🍳 Crypto vs stocks, gold, everything. Not financial advice.
#CookingBNB #Crypto
🏆 CRYPTO vs THE WORLD
$BTC #14 of all assets · needs +$101.13B to flip Broadcom
$ETH #68 of all assets · needs +$9.74B to flip Philip Morris
🍳 Crypto vs stocks, gold, everything. Not financial advice.
#CookingBNB #Crypto
$BTC #14 of all assets · needs +$101.13B to flip Broadcom
$ETH #68 of all assets · needs +$9.74B to flip Philip Morris
🍳 Crypto vs stocks, gold, everything. Not financial advice.
#CookingBNB #Crypto

1
147
·
--
FF This one is kind of interesting. In the 15m timeframe, it rose 1.37%; volume directly hit 2.07x. The Z value is 3.90. The closing price even pressed along the upper edge of the previous ~20 of the 5m candles.
The key is OI: both the 15m and 1h nominal changes are rising—583K / 709K. But the number of contract lots barely moved. That feels very subtle—more like fresh money is coming in adding leverage to go long, rather than shorts covering and pushing.
The主动成交差 (active trade differential) is 15.5%; the buy/sell ratio is 1.37, clearly buy-leaning. The abnormal percentile is 80%. Within the whole pool, the nominal change ranks #14, and the depth has been confirmed.
For 60M over the past 24h, the traded value, together with this breakout, makes me first look at whether it can hold and stay above the upper edge. Whether to chase is another matter—just don’t get shaken out and washed out while it’s in a needle-like move.
FF This one is kind of interesting. In the 15m timeframe, it rose 1.37%; volume directly hit 2.07x. The Z value is 3.90. The closing price even pressed along the upper edge of the previous ~20 of the 5m candles.
The key is OI: both the 15m and 1h nominal changes are rising—583K / 709K. But the number of contract lots barely moved. That feels very subtle—more like fresh money is coming in adding leverage to go long, rather than shorts covering and pushing.
The主动成交差 (active trade differential) is 15.5%; the buy/sell ratio is 1.37, clearly buy-leaning. The abnormal percentile is 80%. Within the whole pool, the nominal change ranks #14, and the depth has been confirmed.
For 60M over the past 24h, the traded value, together with this breakout, makes me first look at whether it can hold and stay above the upper edge. Whether to chase is another matter—just don’t get shaken out and washed out while it’s in a needle-like move.
The key is OI: both the 15m and 1h nominal changes are rising—583K / 709K. But the number of contract lots barely moved. That feels very subtle—more like fresh money is coming in adding leverage to go long, rather than shorts covering and pushing.
The主动成交差 (active trade differential) is 15.5%; the buy/sell ratio is 1.37, clearly buy-leaning. The abnormal percentile is 80%. Within the whole pool, the nominal change ranks #14, and the depth has been confirmed.
For 60M over the past 24h, the traded value, together with this breakout, makes me first look at whether it can hold and stay above the upper edge. Whether to chase is another matter—just don’t get shaken out and washed out while it’s in a needle-like move.
Log in to explore more content
Join global crypto users on Binance Square
⚡️ Get latest and useful information about crypto.
💬 Trusted by the world’s largest crypto exchange.
👍 Discover real insights from verified creators.
Email / Phone number
Trending Topics
1
#AIStocksWhatNext
353,849 views
2,944 Discussing
2
#BitcoinBreaksAboveMayHighNears$86K
14,185 views
188 Discussing
3
#DogecoinRises15%
44,635 views
971 Discussing
4
#$14BBitcoinOptionsExpireFriday
3,650 views
87 Discussing
5
#BNBMarketCapPassesBNYMellon
28,595 views
698 Discussing
6
#CryptoMarketCapReclaims$3Trillion
4,754 views
80 Discussing
7
#MuseOvertakesChatGPTAsTopFreeIOSApp
16,919 views
524 Discussing
8
#TokenizedStockPlatformsCouldLaunchNextQuarter
26,842 views
579 Discussing
9
#StrategyAdds950Bitcoin
33,593 views
678 Discussing
10
#CardanoAddedToX402KitForADAPayments
29,094 views
651 Discussing