
#5
5
223,906 views
817 Discussing
Hot
Latest


·
--
118

·
--
$牛来 Surges Into the Top 5 Trending Coins
$牛来 is making massive waves today, climbing to the #5 spot on the trending list after booking a solid 10.45% gain. The market is paying close attention, and for good reason—24-hour trading volume has absolutely exploded to over $353 million, signaling intense liquidity and massive interest from active traders. Sitting at a market cap rank of 254, this momentum suggests that $牛来 is rapidly transitioning from a niche favorite into a highly liquid market mover. The sheer volume spike indicates strong accumulation and high-velocity trading. Keep a close eye on this one as the market continues to fuel its current breakout structure.
Follow for daily crypto updates.
#DeGenYuv #NiuLai
$牛来 Surges Into the Top 5 Trending Coins
$牛来 is making massive waves today, climbing to the #5 spot on the trending list after booking a solid 10.45% gain. The market is paying close attention, and for good reason—24-hour trading volume has absolutely exploded to over $353 million, signaling intense liquidity and massive interest from active traders. Sitting at a market cap rank of 254, this momentum suggests that $牛来 is rapidly transitioning from a niche favorite into a highly liquid market mover. The sheer volume spike indicates strong accumulation and high-velocity trading. Keep a close eye on this one as the market continues to fuel its current breakout structure.
Follow for daily crypto updates.
#DeGenYuv #NiuLai
$牛来 is making massive waves today, climbing to the #5 spot on the trending list after booking a solid 10.45% gain. The market is paying close attention, and for good reason—24-hour trading volume has absolutely exploded to over $353 million, signaling intense liquidity and massive interest from active traders. Sitting at a market cap rank of 254, this momentum suggests that $牛来 is rapidly transitioning from a niche favorite into a highly liquid market mover. The sheer volume spike indicates strong accumulation and high-velocity trading. Keep a close eye on this one as the market continues to fuel its current breakout structure.
Follow for daily crypto updates.
#DeGenYuv #NiuLai

227
·
--
$牛来 Surges Into the Top 5 Trending Spotlights
$牛来 is capturing major market attention today, locking in the #5 trending spot with a solid 10.45% gain over the last 24 hours. The token is currently trading at $0.10683, backed by a massive $353.6M trading volume. This explosive liquidity spike indicates heavy institutional and retail participation. As a cultural narrative play, $牛来 (meaning "the bull run is coming") is perfectly aligned with the broader market's bullish sentiment. With its market cap ranking climbing to #254, momentum is rapidly building. Traders are closely watching this volume surge to see if the token can sustain its upward trajectory and lead the next wave of meme-driven momentum.
Follow for more crypto setups.
#DeGenYuv #NiuLai
$牛来 Surges Into the Top 5 Trending Spotlights
$牛来 is capturing major market attention today, locking in the #5 trending spot with a solid 10.45% gain over the last 24 hours. The token is currently trading at $0.10683, backed by a massive $353.6M trading volume. This explosive liquidity spike indicates heavy institutional and retail participation. As a cultural narrative play, $牛来 (meaning "the bull run is coming") is perfectly aligned with the broader market's bullish sentiment. With its market cap ranking climbing to #254, momentum is rapidly building. Traders are closely watching this volume surge to see if the token can sustain its upward trajectory and lead the next wave of meme-driven momentum.
Follow for more crypto setups.
#DeGenYuv #NiuLai
$牛来 is capturing major market attention today, locking in the #5 trending spot with a solid 10.45% gain over the last 24 hours. The token is currently trading at $0.10683, backed by a massive $353.6M trading volume. This explosive liquidity spike indicates heavy institutional and retail participation. As a cultural narrative play, $牛来 (meaning "the bull run is coming") is perfectly aligned with the broader market's bullish sentiment. With its market cap ranking climbing to #254, momentum is rapidly building. Traders are closely watching this volume surge to see if the token can sustain its upward trajectory and lead the next wave of meme-driven momentum.
Follow for more crypto setups.
#DeGenYuv #NiuLai

169
·
--
$牛来 Surges Into the Top 5 Trending as Volume Explodes
$牛来 is capturing serious market attention today, claiming the #5 spot on the trending list after a solid 10.45% push. This Chinese-cultural themed token is riding a massive wave of momentum, backed by a staggering 24-hour trading volume of over $353 million. The sheer liquidity moving through this asset suggests heavy institutional and retail interest, pushing its market cap rank up to 254. In a market hungry for fresh narratives, the "bull arrival" theme of $牛来 is clearly resonating with traders looking for high-velocity plays. Keep a close eye on the volume profile here—sustained liquidity is key to keeping this momentum alive.
Follow for more crypto setups.
#DeGenYuv #NiuLai
$牛来 Surges Into the Top 5 Trending as Volume Explodes
$牛来 is capturing serious market attention today, claiming the #5 spot on the trending list after a solid 10.45% push. This Chinese-cultural themed token is riding a massive wave of momentum, backed by a staggering 24-hour trading volume of over $353 million. The sheer liquidity moving through this asset suggests heavy institutional and retail interest, pushing its market cap rank up to 254. In a market hungry for fresh narratives, the "bull arrival" theme of $牛来 is clearly resonating with traders looking for high-velocity plays. Keep a close eye on the volume profile here—sustained liquidity is key to keeping this momentum alive.
Follow for more crypto setups.
#DeGenYuv #NiuLai
$牛来 is capturing serious market attention today, claiming the #5 spot on the trending list after a solid 10.45% push. This Chinese-cultural themed token is riding a massive wave of momentum, backed by a staggering 24-hour trading volume of over $353 million. The sheer liquidity moving through this asset suggests heavy institutional and retail interest, pushing its market cap rank up to 254. In a market hungry for fresh narratives, the "bull arrival" theme of $牛来 is clearly resonating with traders looking for high-velocity plays. Keep a close eye on the volume profile here—sustained liquidity is key to keeping this momentum alive.
Follow for more crypto setups.
#DeGenYuv #NiuLai

199

·
--
NEAR Protocol ($NEAR) Gains Momentum
NEAR Protocol is buzzing right now, ranking #5 in trending coins. Its 2.29% 24h gain and $1B+ volume signal strong momentum. 📈 $NEAR’s layer-1 blockchain is gaining traction with developers and users, thanks to its high throughput and low fees. The project’s recent partnerships and ecosystem growth are driving interest. 🚀 Traders should keep an eye on this as the community continues to expand. 👀
Follow for more setups like this.
#HahaProfit #NEAR
NEAR Protocol ($NEAR ) Gains Momentum
NEAR Protocol is buzzing right now, ranking #5 in trending coins. Its 2.29% 24h gain and $1B+ volume signal strong momentum. 📈 $NEAR ’s layer-1 blockchain is gaining traction with developers and users, thanks to its high throughput and low fees. The project’s recent partnerships and ecosystem growth are driving interest. 🚀 Traders should keep an eye on this as the community continues to expand. 👀
Follow for more setups like this.
#HahaProfit #NEAR
NEAR Protocol is buzzing right now, ranking #5 in trending coins. Its 2.29% 24h gain and $1B+ volume signal strong momentum. 📈 $NEAR ’s layer-1 blockchain is gaining traction with developers and users, thanks to its high throughput and low fees. The project’s recent partnerships and ecosystem growth are driving interest. 🚀 Traders should keep an eye on this as the community continues to expand. 👀
Follow for more setups like this.
#HahaProfit #NEAR

76
·
--
NEAR Protocol ($NEAR) Gains Momentum with Strong Volume and Community Support
NEAR Protocol ($NEAR) is riding a wave of positive momentum, ranking #5 in trending coins. A 2.45% price increase and a 24-hour volume of $1.08B highlight its growing traction. The protocol’s robust ecosystem and active developer community are key drivers. With a market cap rank of 21, $NEAR is attracting attention from both retail and institutional investors. Stay tuned for further developments as the network continues to expand. 🚀📊
Follow for daily crypto updates.
#DeGenYuv #NEAR
NEAR Protocol ($NEAR ) Gains Momentum with Strong Volume and Community Support
NEAR Protocol ($NEAR ) is riding a wave of positive momentum, ranking #5 in trending coins. A 2.45% price increase and a 24-hour volume of $1.08B highlight its growing traction. The protocol’s robust ecosystem and active developer community are key drivers. With a market cap rank of 21, $NEAR is attracting attention from both retail and institutional investors. Stay tuned for further developments as the network continues to expand. 🚀📊
Follow for daily crypto updates.
#DeGenYuv #NEAR
NEAR Protocol ($NEAR ) is riding a wave of positive momentum, ranking #5 in trending coins. A 2.45% price increase and a 24-hour volume of $1.08B highlight its growing traction. The protocol’s robust ecosystem and active developer community are key drivers. With a market cap rank of 21, $NEAR is attracting attention from both retail and institutional investors. Stay tuned for further developments as the network continues to expand. 🚀📊
Follow for daily crypto updates.
#DeGenYuv #NEAR

94

·
--
$LAB This move has some substance.
In 15m, it surged 2.19%. Volume directly hit 1.65x. The Z value is 2.99, and the closing price is above the upper edge of the last ~20 5m range. The buy-side has a clearly stronger tilt—buy/sell ratio is 1.51, and active trades are 20.4% lower.
But what really catches my attention is the OI: 15m -0.02%, 1h -0.39%. Price is rising while positions are falling. This is typical short covering driving the move—not fresh longs piling in.
The OI anomaly percentile is 96.4%, ranking #5 across the whole pool. Put like this, you don’t need me to spell out what it means.
In 24h, the turnover is 16M—not exactly a big-pool level. It’s close to historical extreme ranges, and the whole-pool notional changes are also near the front.
With this kind of structure, I usually don’t dare to chase. Yes, it’s up—but the “fuel” is short covering, not real and solid long positioning. Wait until the covering finishes, and then see whether there’s continued buy follow-through; otherwise it’s just a pulse.
For now, I’ll just set an observation level. No rush.
$LAB This move has some substance.
In 15m, it surged 2.19%. Volume directly hit 1.65x. The Z value is 2.99, and the closing price is above the upper edge of the last ~20 5m range. The buy-side has a clearly stronger tilt—buy/sell ratio is 1.51, and active trades are 20.4% lower.
But what really catches my attention is the OI: 15m -0.02%, 1h -0.39%. Price is rising while positions are falling. This is typical short covering driving the move—not fresh longs piling in.
The OI anomaly percentile is 96.4%, ranking #5 across the whole pool. Put like this, you don’t need me to spell out what it means.
In 24h, the turnover is 16M—not exactly a big-pool level. It’s close to historical extreme ranges, and the whole-pool notional changes are also near the front.
With this kind of structure, I usually don’t dare to chase. Yes, it’s up—but the “fuel” is short covering, not real and solid long positioning. Wait until the covering finishes, and then see whether there’s continued buy follow-through; otherwise it’s just a pulse.
For now, I’ll just set an observation level. No rush.
In 15m, it surged 2.19%. Volume directly hit 1.65x. The Z value is 2.99, and the closing price is above the upper edge of the last ~20 5m range. The buy-side has a clearly stronger tilt—buy/sell ratio is 1.51, and active trades are 20.4% lower.
But what really catches my attention is the OI: 15m -0.02%, 1h -0.39%. Price is rising while positions are falling. This is typical short covering driving the move—not fresh longs piling in.
The OI anomaly percentile is 96.4%, ranking #5 across the whole pool. Put like this, you don’t need me to spell out what it means.
In 24h, the turnover is 16M—not exactly a big-pool level. It’s close to historical extreme ranges, and the whole-pool notional changes are also near the front.
With this kind of structure, I usually don’t dare to chase. Yes, it’s up—but the “fuel” is short covering, not real and solid long positioning. Wait until the covering finishes, and then see whether there’s continued buy follow-through; otherwise it’s just a pulse.
For now, I’ll just set an observation level. No rush.
1
·
--
$TUT This move is kind of interesting.
In the 15m timeframe, it’s up 1.89%. The volume directly hit 2.23x. The proportion of active buy orders is clearly on the high side; the buy/sell ratio is 1.69. The close also broke above the upper boundary of the last 20 5m candles. This isn’t a fake-out that spikes and then disappears—it’s volume-backed.
More importantly, look at OI. 15m is +1.04%, 1h is +1.09%. The abnormal percentile is 99.8%, ranking #5 across the whole pool. Price is rising and OI is rising in sync—this is a structure of new leveraged long positions entering, not passive upside caused by shorts getting squeezed.
The 24h trading value is only 15.68M, so the pool isn’t large. Even though the nominal OI change is only at the tens-of-thousands-of-dollars level, within this scale it’s already considered unusual. Multiple consecutive cycles continuing—approaching historical extreme zones. At this position, it’s either starting up or a trap, but at least for now the tape is biased toward longs.
Keep an eye on it. If volume continues to follow through, the upside potential may be more than just this.
$TUT This move is kind of interesting.
In the 15m timeframe, it’s up 1.89%. The volume directly hit 2.23x. The proportion of active buy orders is clearly on the high side; the buy/sell ratio is 1.69. The close also broke above the upper boundary of the last 20 5m candles. This isn’t a fake-out that spikes and then disappears—it’s volume-backed.
More importantly, look at OI. 15m is +1.04%, 1h is +1.09%. The abnormal percentile is 99.8%, ranking #5 across the whole pool. Price is rising and OI is rising in sync—this is a structure of new leveraged long positions entering, not passive upside caused by shorts getting squeezed.
The 24h trading value is only 15.68M, so the pool isn’t large. Even though the nominal OI change is only at the tens-of-thousands-of-dollars level, within this scale it’s already considered unusual. Multiple consecutive cycles continuing—approaching historical extreme zones. At this position, it’s either starting up or a trap, but at least for now the tape is biased toward longs.
Keep an eye on it. If volume continues to follow through, the upside potential may be more than just this.
In the 15m timeframe, it’s up 1.89%. The volume directly hit 2.23x. The proportion of active buy orders is clearly on the high side; the buy/sell ratio is 1.69. The close also broke above the upper boundary of the last 20 5m candles. This isn’t a fake-out that spikes and then disappears—it’s volume-backed.
More importantly, look at OI. 15m is +1.04%, 1h is +1.09%. The abnormal percentile is 99.8%, ranking #5 across the whole pool. Price is rising and OI is rising in sync—this is a structure of new leveraged long positions entering, not passive upside caused by shorts getting squeezed.
The 24h trading value is only 15.68M, so the pool isn’t large. Even though the nominal OI change is only at the tens-of-thousands-of-dollars level, within this scale it’s already considered unusual. Multiple consecutive cycles continuing—approaching historical extreme zones. At this position, it’s either starting up or a trap, but at least for now the tape is biased toward longs.
Keep an eye on it. If volume continues to follow through, the upside potential may be more than just this.
2

·
--
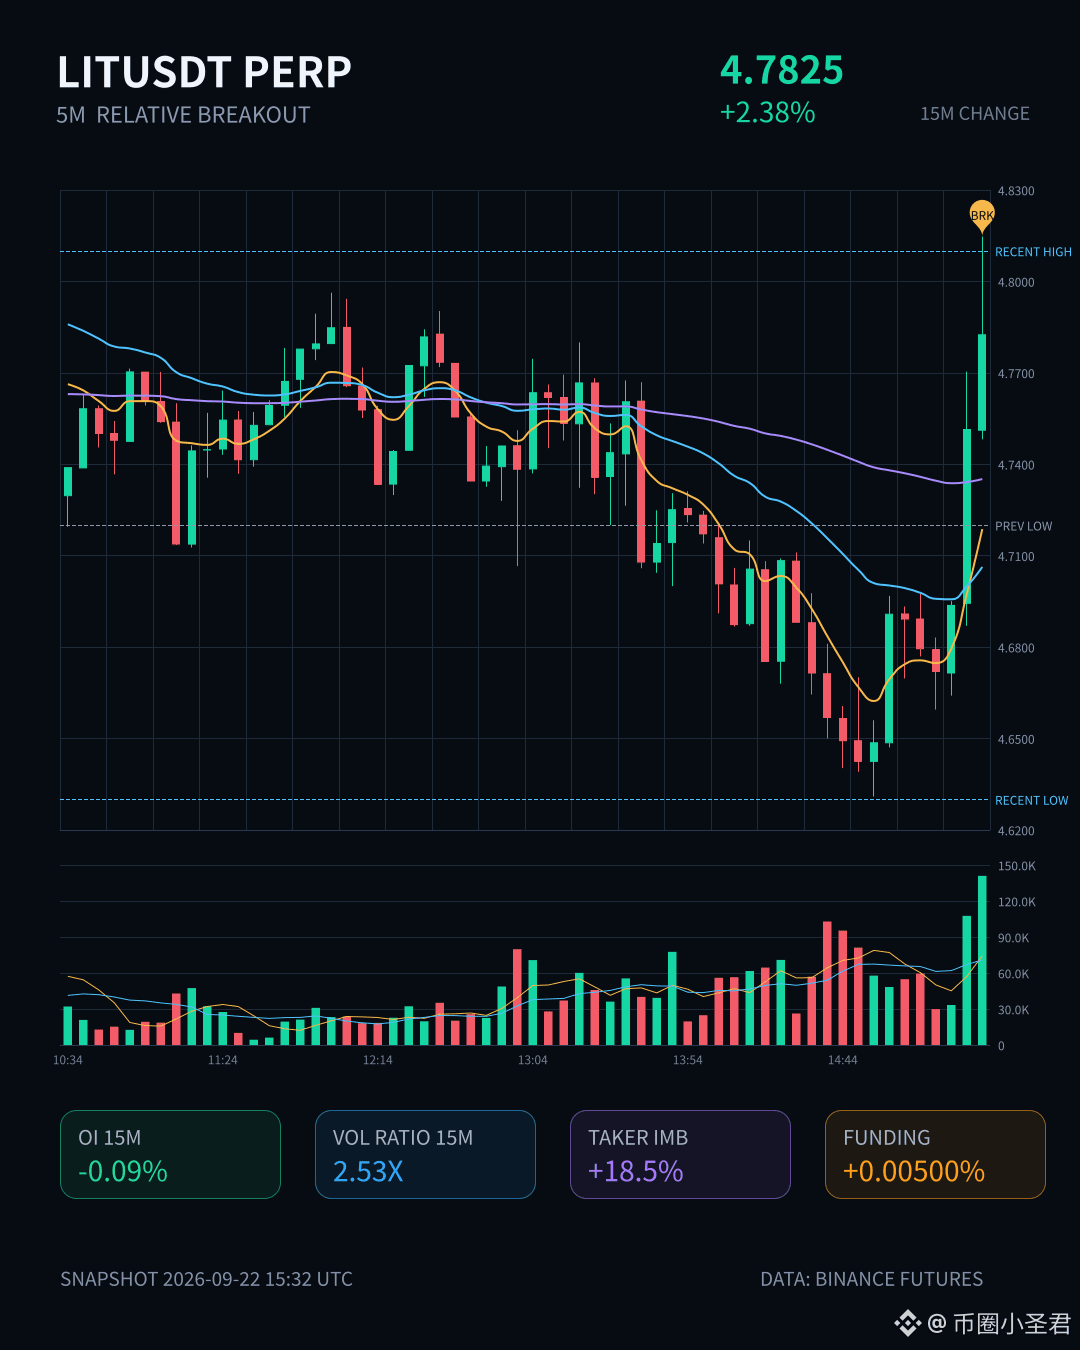
$LIT This move on the 15m chart: up 2.38%. The volume surged straight to 2.53x, with a Z-score of 4.32—this isn’t just ordinary volatility anymore.
What’s interesting is the OI (open interest): the 15m contract is -0.09%, and 1h is -0.12%, yet the notional change is +2.28% and +1.89%. Price is rising while OI is falling—this fits the classic short-covering script, not the “new longs entering” story.
Active volume is down 18.5%, buy/sell ratio is 1.45, indicating the buy side is the one acting aggressively.
The OI anomaly percentile is 98.8%, with the whole pool ranked #5 and notional change ranked #7. It has continued across multiple consecutive periods. Trading volume is higher than usual, and price has just broken through the upper band of the last ~20 consecutive 5m K-bars. With this combo of signals, depth confirmation is basically aligned.
In the last 24h, turnover is 66.35M—not a huge pool. In liquidity like this, an anomaly percentile at this level tends to produce more direct volatility/elasticity than with big-cap flows.
The行情 driven by short covering: if it fully plays out, it turns into a stampede (liquidation). If it hasn’t finished, it becomes a squeeze. At this level, the bet is how many shorts haven’t closed yet.
$LIT This move on the 15m chart: up 2.38%. The volume surged straight to 2.53x, with a Z-score of 4.32—this isn’t just ordinary volatility anymore.
What’s interesting is the OI (open interest): the 15m contract is -0.09%, and 1h is -0.12%, yet the notional change is +2.28% and +1.89%. Price is rising while OI is falling—this fits the classic short-covering script, not the “new longs entering” story.
Active volume is down 18.5%, buy/sell ratio is 1.45, indicating the buy side is the one acting aggressively.
The OI anomaly percentile is 98.8%, with the whole pool ranked #5 and notional change ranked #7. It has continued across multiple consecutive periods. Trading volume is higher than usual, and price has just broken through the upper band of the last ~20 consecutive 5m K-bars. With this combo of signals, depth confirmation is basically aligned.
In the last 24h, turnover is 66.35M—not a huge pool. In liquidity like this, an anomaly percentile at this level tends to produce more direct volatility/elasticity than with big-cap flows.
The行情 driven by short covering: if it fully plays out, it turns into a stampede (liquidation). If it hasn’t finished, it becomes a squeeze. At this level, the bet is how many shorts haven’t closed yet.
What’s interesting is the OI (open interest): the 15m contract is -0.09%, and 1h is -0.12%, yet the notional change is +2.28% and +1.89%. Price is rising while OI is falling—this fits the classic short-covering script, not the “new longs entering” story.
Active volume is down 18.5%, buy/sell ratio is 1.45, indicating the buy side is the one acting aggressively.
The OI anomaly percentile is 98.8%, with the whole pool ranked #5 and notional change ranked #7. It has continued across multiple consecutive periods. Trading volume is higher than usual, and price has just broken through the upper band of the last ~20 consecutive 5m K-bars. With this combo of signals, depth confirmation is basically aligned.
In the last 24h, turnover is 66.35M—not a huge pool. In liquidity like this, an anomaly percentile at this level tends to produce more direct volatility/elasticity than with big-cap flows.
The行情 driven by short covering: if it fully plays out, it turns into a stampede (liquidation). If it hasn’t finished, it becomes a squeeze. At this level, the bet is how many shorts haven’t closed yet.
3

·
--
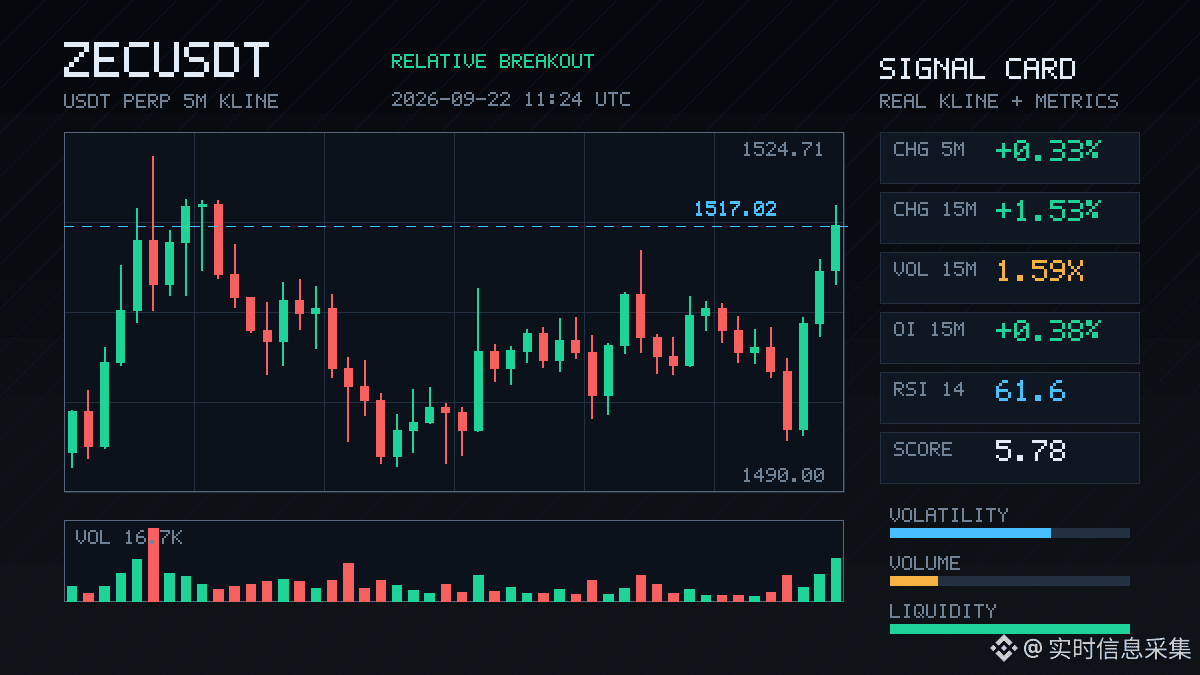
$ZEC This move has a little something interesting.
In 15m: it rallied 1.53%, volume came in at 1.59x, and the volatility Z is 2.68. The close directly broke through the upper band of the last ~20 consecutive 5m candles. The aggressive traded value is +22.8%, buy/sell ratio is 1.59. Someone really is sweeping upward—it's not just resting orders propping up the appearance.
More importantly: OI. The 15m contract is +0.38%; notional change is 13.23M; the percentile is abnormal at 98%. Abnormal rank: whole pool #5; notional change #3. Price is rising while OI is rising too—new leveraged longs are entering. Over the 1h timeframe, OI is almost unchanged (-0.02%), which suggests this push has just ignited, not an old position buildup from an hour ago.
It’s nearing its own historical extreme zone. 24h traded value is 2134M, and the order book depth has also confirmed it. I won’t chase the first candle at this spot. I’ll wait for a pullback to see the support/absorption: if it can hold, then it continues; if it can’t, then it’s just a single pin-type wick.
$ZEC
$ZEC This move has a little something interesting.
In 15m: it rallied 1.53%, volume came in at 1.59x, and the volatility Z is 2.68. The close directly broke through the upper band of the last ~20 consecutive 5m candles. The aggressive traded value is +22.8%, buy/sell ratio is 1.59. Someone really is sweeping upward—it's not just resting orders propping up the appearance.
More importantly: OI. The 15m contract is +0.38%; notional change is 13.23M; the percentile is abnormal at 98%. Abnormal rank: whole pool #5; notional change #3. Price is rising while OI is rising too—new leveraged longs are entering. Over the 1h timeframe, OI is almost unchanged (-0.02%), which suggests this push has just ignited, not an old position buildup from an hour ago.
It’s nearing its own historical extreme zone. 24h traded value is 2134M, and the order book depth has also confirmed it. I won’t chase the first candle at this spot. I’ll wait for a pullback to see the support/absorption: if it can hold, then it continues; if it can’t, then it’s just a single pin-type wick.
$ZEC
In 15m: it rallied 1.53%, volume came in at 1.59x, and the volatility Z is 2.68. The close directly broke through the upper band of the last ~20 consecutive 5m candles. The aggressive traded value is +22.8%, buy/sell ratio is 1.59. Someone really is sweeping upward—it's not just resting orders propping up the appearance.
More importantly: OI. The 15m contract is +0.38%; notional change is 13.23M; the percentile is abnormal at 98%. Abnormal rank: whole pool #5; notional change #3. Price is rising while OI is rising too—new leveraged longs are entering. Over the 1h timeframe, OI is almost unchanged (-0.02%), which suggests this push has just ignited, not an old position buildup from an hour ago.
It’s nearing its own historical extreme zone. 24h traded value is 2134M, and the order book depth has also confirmed it. I won’t chase the first candle at this spot. I’ll wait for a pullback to see the support/absorption: if it can hold, then it continues; if it can’t, then it’s just a single pin-type wick.
$ZEC
7
·
--
See translation
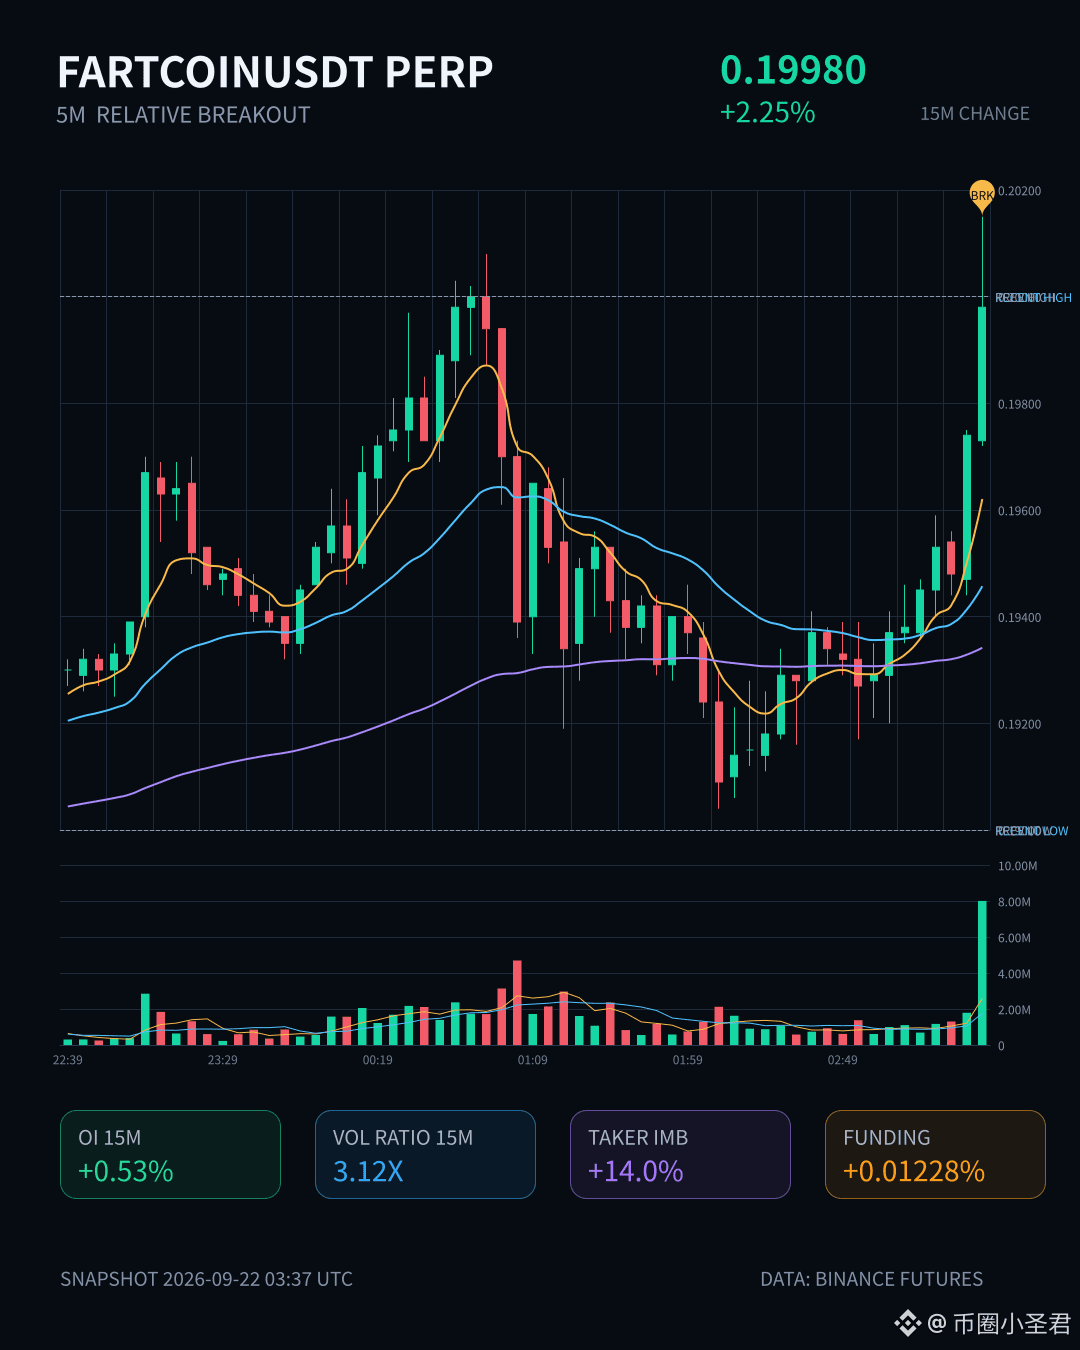
$FARTCOIN 这个位置有点意思。
15m 拉了 2.25%,量能直接干到 3.12 倍,收盘价突破了近 20 根 5m 的上沿,买卖比 1.33,主动成交差 +14%,说明是有人主动往上打的,不是挂单被人吃掉那种被动上涨。
更关键的是 OI。15m +0.53%,1h +1.08%,名义变化加起来接近 1.4M,异常分位 97.6%,全池异常排到 #5。价格涨 + OI 涨,新增杠杆多头进场的信号,不是空头回补那种虚涨。而且 OI 连续多个周期延续,资金费率也在近期高分位——这说明多头情绪已经堆得比较满了。
24h 成交额 73.86M,深度确认项基本都过了。接近自身历史极端区间,全池名义变化靠前。
这种结构要么是主升浪前段的加杠杆,要么就是情绪过热后的挤压起点。我倾向于继续看强,但不会再这个位置追。OI 太热的时候,一根针下来比涨上去快得多。
盯着 OI 什么时候开始背离价格。
$FARTCOIN 这个位置有点意思。
15m 拉了 2.25%,量能直接干到 3.12 倍,收盘价突破了近 20 根 5m 的上沿,买卖比 1.33,主动成交差 +14%,说明是有人主动往上打的,不是挂单被人吃掉那种被动上涨。
更关键的是 OI。15m +0.53%,1h +1.08%,名义变化加起来接近 1.4M,异常分位 97.6%,全池异常排到 #5。价格涨 + OI 涨,新增杠杆多头进场的信号,不是空头回补那种虚涨。而且 OI 连续多个周期延续,资金费率也在近期高分位——这说明多头情绪已经堆得比较满了。
24h 成交额 73.86M,深度确认项基本都过了。接近自身历史极端区间,全池名义变化靠前。
这种结构要么是主升浪前段的加杠杆,要么就是情绪过热后的挤压起点。我倾向于继续看强,但不会再这个位置追。OI 太热的时候,一根针下来比涨上去快得多。
盯着 OI 什么时候开始背离价格。
15m 拉了 2.25%,量能直接干到 3.12 倍,收盘价突破了近 20 根 5m 的上沿,买卖比 1.33,主动成交差 +14%,说明是有人主动往上打的,不是挂单被人吃掉那种被动上涨。
更关键的是 OI。15m +0.53%,1h +1.08%,名义变化加起来接近 1.4M,异常分位 97.6%,全池异常排到 #5。价格涨 + OI 涨,新增杠杆多头进场的信号,不是空头回补那种虚涨。而且 OI 连续多个周期延续,资金费率也在近期高分位——这说明多头情绪已经堆得比较满了。
24h 成交额 73.86M,深度确认项基本都过了。接近自身历史极端区间,全池名义变化靠前。
这种结构要么是主升浪前段的加杠杆,要么就是情绪过热后的挤压起点。我倾向于继续看强,但不会再这个位置追。OI 太热的时候,一根针下来比涨上去快得多。
盯着 OI 什么时候开始背离价格。
5


·
--
$MARSCOIN This one is a bit interesting. In 15m, it went straight up by 3.83%. Volume reached 3.32x, the Z value is 3.30—not some fake move where it randomly spikes during a slow, downtrend bleed.
More importantly, OI: 15m +1.11%, 1h +0.57%. The nominal change totals nearly 2M U. The anomaly percentile is 99.6%, ranking #5 in the entire pool. Price rising and OI rising in sync—this is a typical structure of newly added leveraged long positions, not the kind of “fat bounce” from short covering.
The price just closed near the upper edge of about 20 consecutive 5m candles: aggressive taker flow difference +3.2%, buy/sell ratio 1.07, slightly biased toward buyers. In the last 24h, turnover is 58M U, and the depth is also sufficient—not a small pond self-hype.
With multiple consecutive cycles, the abnormal OI keeps persisting and touching historical extreme ranges. In this kind of spot, it’s either the starting point of the main uptrend, or it’s smart money raising the sedan for the ride. Either way, I’ll get my position in first; the rest is up to the market.
$MARSCOIN This one is a bit interesting. In 15m, it went straight up by 3.83%. Volume reached 3.32x, the Z value is 3.30—not some fake move where it randomly spikes during a slow, downtrend bleed.
More importantly, OI: 15m +1.11%, 1h +0.57%. The nominal change totals nearly 2M U. The anomaly percentile is 99.6%, ranking #5 in the entire pool. Price rising and OI rising in sync—this is a typical structure of newly added leveraged long positions, not the kind of “fat bounce” from short covering.
The price just closed near the upper edge of about 20 consecutive 5m candles: aggressive taker flow difference +3.2%, buy/sell ratio 1.07, slightly biased toward buyers. In the last 24h, turnover is 58M U, and the depth is also sufficient—not a small pond self-hype.
With multiple consecutive cycles, the abnormal OI keeps persisting and touching historical extreme ranges. In this kind of spot, it’s either the starting point of the main uptrend, or it’s smart money raising the sedan for the ride. Either way, I’ll get my position in first; the rest is up to the market.
More importantly, OI: 15m +1.11%, 1h +0.57%. The nominal change totals nearly 2M U. The anomaly percentile is 99.6%, ranking #5 in the entire pool. Price rising and OI rising in sync—this is a typical structure of newly added leveraged long positions, not the kind of “fat bounce” from short covering.
The price just closed near the upper edge of about 20 consecutive 5m candles: aggressive taker flow difference +3.2%, buy/sell ratio 1.07, slightly biased toward buyers. In the last 24h, turnover is 58M U, and the depth is also sufficient—not a small pond self-hype.
With multiple consecutive cycles, the abnormal OI keeps persisting and touching historical extreme ranges. In this kind of spot, it’s either the starting point of the main uptrend, or it’s smart money raising the sedan for the ride. Either way, I’ll get my position in first; the rest is up to the market.
12
·
--
$NEAR This move has something to it.
On the 15m timeframe, it’s up 1.71%; volume capacity directly hit 3.27x. OI in the past hour is +2.51%, and nominal increase is over 15 million U. The key point is that the abnormal percentile for OI is already 98%: the abnormal positions across the whole pool are ranked all the way down to #5, with nominal change at #2.
Price rising together with OI increasing indicates typical leveraged longs are entering—not some kind of short covering fake rally. The funding rate is also at a high percentile recently, which suggests long sentiment is already very crowded.
On the 5m timeframe, there’s a liquidation agent at 217K, with buy-side orders concentrated. In the short term, there may still be the usual squeeze continuation momentum. But note: OI has been abnormally extended across multiple consecutive cycles, approaching the boundary of the historical extreme range. Once longs become maximally crowded at this position, the downside damage from reverse volatility can be amplified.
Over the past 24h, the trading value is 1.07 billion U, and the depth is certainly there—but an OI abnormality at the 98th percentile is not a signal you see every day.
If you’re going to chase longs, think clearly about what you’re actually betting on.
$NEAR This move has something to it.
On the 15m timeframe, it’s up 1.71%; volume capacity directly hit 3.27x. OI in the past hour is +2.51%, and nominal increase is over 15 million U. The key point is that the abnormal percentile for OI is already 98%: the abnormal positions across the whole pool are ranked all the way down to #5, with nominal change at #2.
Price rising together with OI increasing indicates typical leveraged longs are entering—not some kind of short covering fake rally. The funding rate is also at a high percentile recently, which suggests long sentiment is already very crowded.
On the 5m timeframe, there’s a liquidation agent at 217K, with buy-side orders concentrated. In the short term, there may still be the usual squeeze continuation momentum. But note: OI has been abnormally extended across multiple consecutive cycles, approaching the boundary of the historical extreme range. Once longs become maximally crowded at this position, the downside damage from reverse volatility can be amplified.
Over the past 24h, the trading value is 1.07 billion U, and the depth is certainly there—but an OI abnormality at the 98th percentile is not a signal you see every day.
If you’re going to chase longs, think clearly about what you’re actually betting on.
On the 15m timeframe, it’s up 1.71%; volume capacity directly hit 3.27x. OI in the past hour is +2.51%, and nominal increase is over 15 million U. The key point is that the abnormal percentile for OI is already 98%: the abnormal positions across the whole pool are ranked all the way down to #5, with nominal change at #2.
Price rising together with OI increasing indicates typical leveraged longs are entering—not some kind of short covering fake rally. The funding rate is also at a high percentile recently, which suggests long sentiment is already very crowded.
On the 5m timeframe, there’s a liquidation agent at 217K, with buy-side orders concentrated. In the short term, there may still be the usual squeeze continuation momentum. But note: OI has been abnormally extended across multiple consecutive cycles, approaching the boundary of the historical extreme range. Once longs become maximally crowded at this position, the downside damage from reverse volatility can be amplified.
Over the past 24h, the trading value is 1.07 billion U, and the depth is certainly there—but an OI abnormality at the 98th percentile is not a signal you see every day.
If you’re going to chase longs, think clearly about what you’re actually betting on.
53
·
--
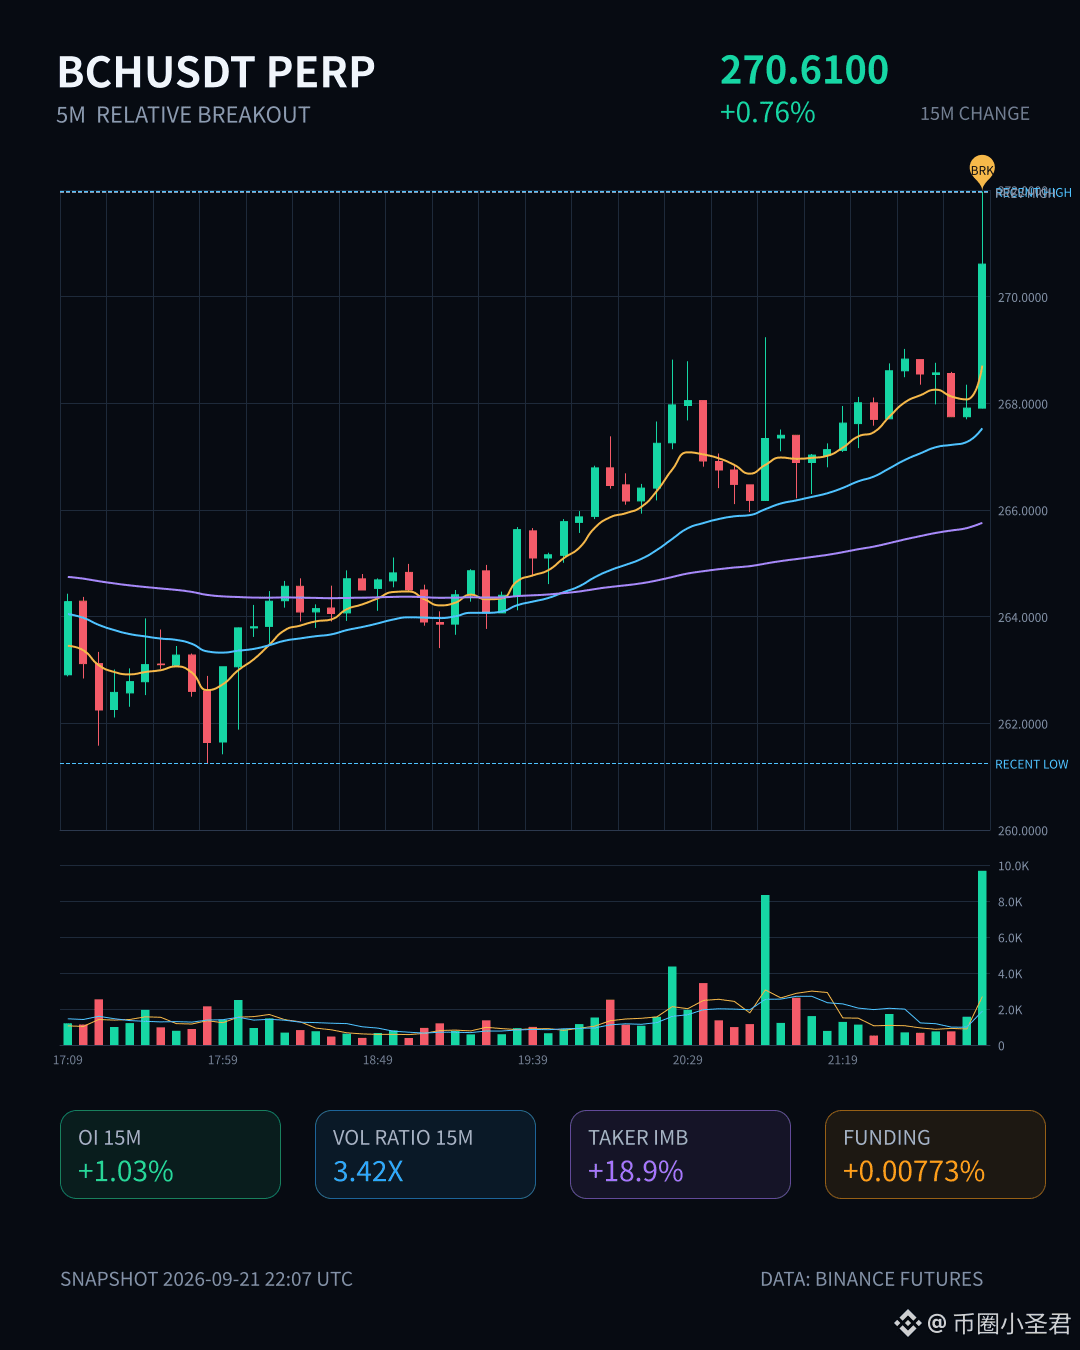
$BCH This 15m has something going on. Volume directly hits 3.42x, the aggressive buy/sell ratio is 1.47, and the price is riding close to the upper edge of about 20 five-minute candles as it rises—it's not the kind of fake jab with a quick wick.
What’s even more important is the OI: 15m +1.03%, 1h +0.88%. The price and open interest are rising together, suggesting new leveraged long positions are being added—not a false breakout pushed by shorts closing.
The anomaly percentile is 94.6%, it’s ranked #5 in the whole pool, and even the nominal change is pushed into the top eight. This kind of synchronization isn’t that common.
For BCH, these old, established coins—once they start moving, either they don’t move at all or they won’t turn back. Right now it’s not far from its own historical extreme range. Whether to chase it is up to your position, but at least it’s worth keeping a close eye on—don’t wait until it’s already run, then ask what happened.
$BCH This 15m has something going on. Volume directly hits 3.42x, the aggressive buy/sell ratio is 1.47, and the price is riding close to the upper edge of about 20 five-minute candles as it rises—it's not the kind of fake jab with a quick wick.
What’s even more important is the OI: 15m +1.03%, 1h +0.88%. The price and open interest are rising together, suggesting new leveraged long positions are being added—not a false breakout pushed by shorts closing.
The anomaly percentile is 94.6%, it’s ranked #5 in the whole pool, and even the nominal change is pushed into the top eight. This kind of synchronization isn’t that common.
For BCH, these old, established coins—once they start moving, either they don’t move at all or they won’t turn back. Right now it’s not far from its own historical extreme range. Whether to chase it is up to your position, but at least it’s worth keeping a close eye on—don’t wait until it’s already run, then ask what happened.
What’s even more important is the OI: 15m +1.03%, 1h +0.88%. The price and open interest are rising together, suggesting new leveraged long positions are being added—not a false breakout pushed by shorts closing.
The anomaly percentile is 94.6%, it’s ranked #5 in the whole pool, and even the nominal change is pushed into the top eight. This kind of synchronization isn’t that common.
For BCH, these old, established coins—once they start moving, either they don’t move at all or they won’t turn back. Right now it’s not far from its own historical extreme range. Whether to chase it is up to your position, but at least it’s worth keeping a close eye on—don’t wait until it’s already run, then ask what happened.
208
·
--
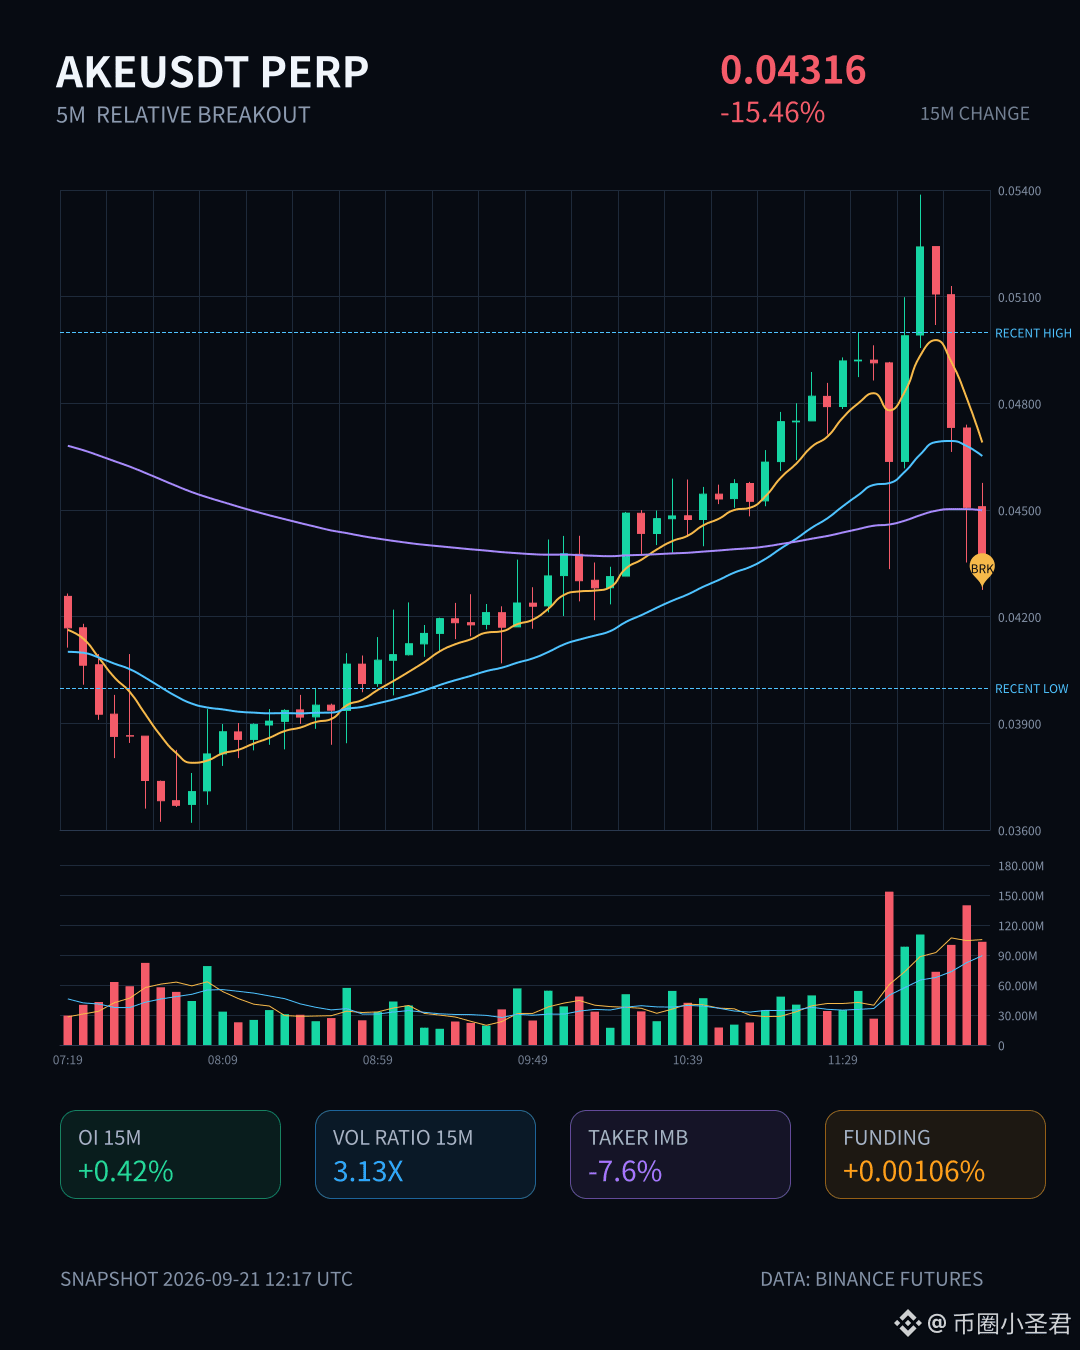
$AKE These 15 minutes smashed it pretty solidly, -15.46%. The volume directly hit 3.13x. Volatility Z is 4.96—this isn’t the kind of low-volume, slow bleed down. It’s a breakdown with volume.
The structure is worth studying more: as price drops, the OI for 15m actually increases by +0.42%. Nominal change is -3.99M; the difference in active trades is -7.6%; buy/sell ratio is 0.86. This doesn’t look like existing longs cutting and running. It looks more like new shorts stepping in and pressing their entry here. 1h OI is -2.15%, which suggests a round of leverage is regrouping at this level.
Whole pool abnormality #22, nominal change #5, abnormal percentile 92.3%. Multiple consecutive periods have continued; the depth confirmation also passed. The closing price broke below the lower edge of the most recent 20 five-minute ranges. This spot is pretty key—after breaking the lower edge, if it can’t get pulled back, below is a vacuum zone.
24h turnover is 647M, and the pool still has actively traded liquidity. Right now, chasing shorts has mediocre risk-reward. Wait for a rebound that fails to get back above the previous low, add it to your watchlist to observe. A weak rebound after a breakdown is the real opportunity.
$AKE These 15 minutes smashed it pretty solidly, -15.46%. The volume directly hit 3.13x. Volatility Z is 4.96—this isn’t the kind of low-volume, slow bleed down. It’s a breakdown with volume.
The structure is worth studying more: as price drops, the OI for 15m actually increases by +0.42%. Nominal change is -3.99M; the difference in active trades is -7.6%; buy/sell ratio is 0.86. This doesn’t look like existing longs cutting and running. It looks more like new shorts stepping in and pressing their entry here. 1h OI is -2.15%, which suggests a round of leverage is regrouping at this level.
Whole pool abnormality #22, nominal change #5, abnormal percentile 92.3%. Multiple consecutive periods have continued; the depth confirmation also passed. The closing price broke below the lower edge of the most recent 20 five-minute ranges. This spot is pretty key—after breaking the lower edge, if it can’t get pulled back, below is a vacuum zone.
24h turnover is 647M, and the pool still has actively traded liquidity. Right now, chasing shorts has mediocre risk-reward. Wait for a rebound that fails to get back above the previous low, add it to your watchlist to observe. A weak rebound after a breakdown is the real opportunity.
The structure is worth studying more: as price drops, the OI for 15m actually increases by +0.42%. Nominal change is -3.99M; the difference in active trades is -7.6%; buy/sell ratio is 0.86. This doesn’t look like existing longs cutting and running. It looks more like new shorts stepping in and pressing their entry here. 1h OI is -2.15%, which suggests a round of leverage is regrouping at this level.
Whole pool abnormality #22, nominal change #5, abnormal percentile 92.3%. Multiple consecutive periods have continued; the depth confirmation also passed. The closing price broke below the lower edge of the most recent 20 five-minute ranges. This spot is pretty key—after breaking the lower edge, if it can’t get pulled back, below is a vacuum zone.
24h turnover is 647M, and the pool still has actively traded liquidity. Right now, chasing shorts has mediocre risk-reward. Wait for a rebound that fails to get back above the previous low, add it to your watchlist to observe. A weak rebound after a breakdown is the real opportunity.
14

·
--
$PIEVERSE This place has a bit of interest.
In 15m, it pulled up 4.46%, and the volume immediately spiked to 2.56×. The volatility “Z” reached 5.40, and the closing price broke through the upper edge of the recent 20 five-minute K-line range. The key is that the OI (open interest) isn’t flat—15m +0.18%, 1h +0.21%. The nominal change totals a couple million U (around two million). The anomaly percentile is 97.4%, and the whole pool of anomalies is ranked #5.
Price is rising along with OI—this structure looks more like fresh leveraged long positions moving in, rather than a short-covering kind of fake rally. Active trade volume is down 8.5%, buy/sell ratio is 1.19, and the willingness to hold the bag is also on point.
Over 24h, turnover is 39M. The depth has confirmed it—volume is higher than usual. It’s sustained across multiple consecutive cycles, not just a one-candle spike.
It’s approaching the historical extreme zone. Chasing here needs caution, but the structure itself is worth watching.
$PIEVERSE This place has a bit of interest.
In 15m, it pulled up 4.46%, and the volume immediately spiked to 2.56×. The volatility “Z” reached 5.40, and the closing price broke through the upper edge of the recent 20 five-minute K-line range. The key is that the OI (open interest) isn’t flat—15m +0.18%, 1h +0.21%. The nominal change totals a couple million U (around two million). The anomaly percentile is 97.4%, and the whole pool of anomalies is ranked #5.
Price is rising along with OI—this structure looks more like fresh leveraged long positions moving in, rather than a short-covering kind of fake rally. Active trade volume is down 8.5%, buy/sell ratio is 1.19, and the willingness to hold the bag is also on point.
Over 24h, turnover is 39M. The depth has confirmed it—volume is higher than usual. It’s sustained across multiple consecutive cycles, not just a one-candle spike.
It’s approaching the historical extreme zone. Chasing here needs caution, but the structure itself is worth watching.
In 15m, it pulled up 4.46%, and the volume immediately spiked to 2.56×. The volatility “Z” reached 5.40, and the closing price broke through the upper edge of the recent 20 five-minute K-line range. The key is that the OI (open interest) isn’t flat—15m +0.18%, 1h +0.21%. The nominal change totals a couple million U (around two million). The anomaly percentile is 97.4%, and the whole pool of anomalies is ranked #5.
Price is rising along with OI—this structure looks more like fresh leveraged long positions moving in, rather than a short-covering kind of fake rally. Active trade volume is down 8.5%, buy/sell ratio is 1.19, and the willingness to hold the bag is also on point.
Over 24h, turnover is 39M. The depth has confirmed it—volume is higher than usual. It’s sustained across multiple consecutive cycles, not just a one-candle spike.
It’s approaching the historical extreme zone. Chasing here needs caution, but the structure itself is worth watching.
9
·
--
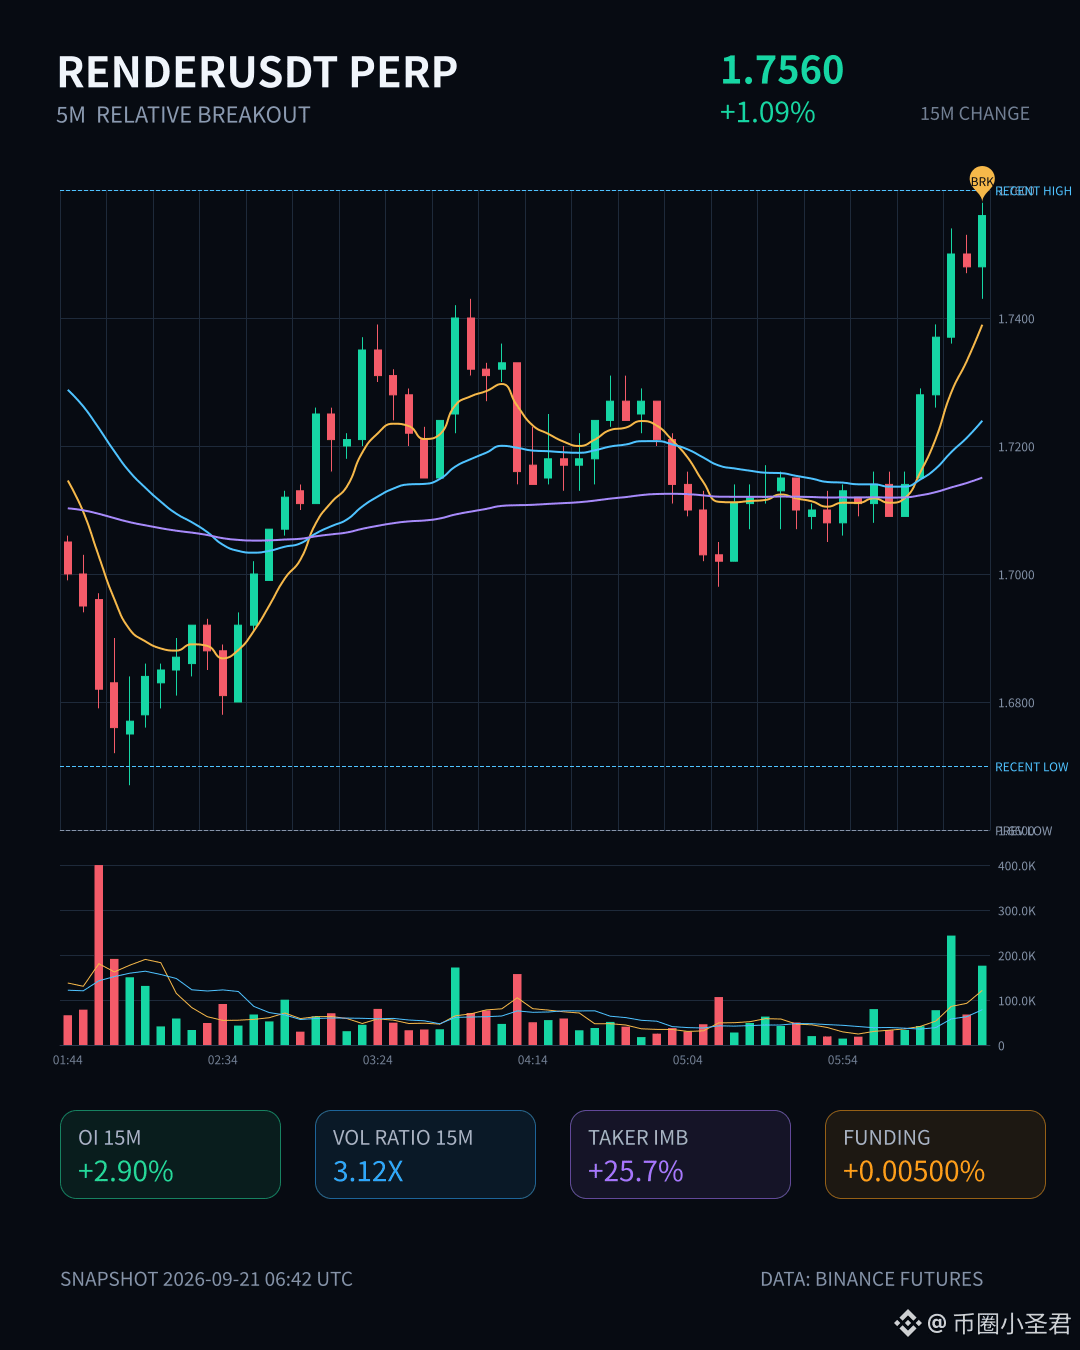
$RENDER This one’s got some interesting vibes.
In 15m, it directly surged 1.09%. Volume surged to 3.12x, and the closing price broke above the upper edge of the most recent ~20 consecutive 5m K-lines—not just a wick, it was a real close up.
More importantly: OI. In 15m it’s +2.90%, and in 1h it’s +2.86%. The percentile is an abnormal 98.8%, and the entire pool ranks this at #5 for abnormality. This isn’t the kind of artificial pop from short covering—it’s new leveraged long positions entering. The notional change has continued across multiple consecutive cycles, and the depth confirmation has also held.
Active trade difference is -25.7% and the buy/sell ratio is 1.69; the direction is very clear.
In the past 24h, turnover is 44.68M. For a pool with this size to produce a structure like this means it probably wasn’t pushed casually by retail.
We’re getting close to historical extreme zones. The breakout has continued across multiple cycles—I’ll keep watching whether OI keeps following through. If price keeps rising but OI starts to flatten, be careful. Right now, the long setup is still intact.
$RENDER This one’s got some interesting vibes.
In 15m, it directly surged 1.09%. Volume surged to 3.12x, and the closing price broke above the upper edge of the most recent ~20 consecutive 5m K-lines—not just a wick, it was a real close up.
More importantly: OI. In 15m it’s +2.90%, and in 1h it’s +2.86%. The percentile is an abnormal 98.8%, and the entire pool ranks this at #5 for abnormality. This isn’t the kind of artificial pop from short covering—it’s new leveraged long positions entering. The notional change has continued across multiple consecutive cycles, and the depth confirmation has also held.
Active trade difference is -25.7% and the buy/sell ratio is 1.69; the direction is very clear.
In the past 24h, turnover is 44.68M. For a pool with this size to produce a structure like this means it probably wasn’t pushed casually by retail.
We’re getting close to historical extreme zones. The breakout has continued across multiple cycles—I’ll keep watching whether OI keeps following through. If price keeps rising but OI starts to flatten, be careful. Right now, the long setup is still intact.
In 15m, it directly surged 1.09%. Volume surged to 3.12x, and the closing price broke above the upper edge of the most recent ~20 consecutive 5m K-lines—not just a wick, it was a real close up.
More importantly: OI. In 15m it’s +2.90%, and in 1h it’s +2.86%. The percentile is an abnormal 98.8%, and the entire pool ranks this at #5 for abnormality. This isn’t the kind of artificial pop from short covering—it’s new leveraged long positions entering. The notional change has continued across multiple consecutive cycles, and the depth confirmation has also held.
Active trade difference is -25.7% and the buy/sell ratio is 1.69; the direction is very clear.
In the past 24h, turnover is 44.68M. For a pool with this size to produce a structure like this means it probably wasn’t pushed casually by retail.
We’re getting close to historical extreme zones. The breakout has continued across multiple cycles—I’ll keep watching whether OI keeps following through. If price keeps rising but OI starts to flatten, be careful. Right now, the long setup is still intact.
9
·
--
$BTW This drop is a bit abrupt.
In the 15m timeframe, it just got slammed down 5.24% directly, with volume surging to 4.3x. This isn’t a slow bleed—it’s being hammered lower. The price broke below the lower band of the past 20 5m candles, and the close didn’t hold. Active turnover was short by -3.8%, the buy/sell ratio is 0.93, and the sellers are pushing.
But what really matters is the OI. Both the 15m and 1h show a decline. In nominal terms, 5.4M / 7.68M left, with an abnormal percentile of 98%, and the whole-pool nominal change ranked #2. This isn’t like new shorts entering to slam the market; it looks more like the longs ran first—deleveraging, cutting losses, shrinking positions. When price falls while OI also drops, this combination suggests it’s not someone opening new shorts; it’s old long positions exiting.
Whole-pool abnormal #5—several consecutive periods are continuing the pattern, and the traded value of 86M is right there. At this level, either the market has just finished dropping a leg, or it hasn’t finished yet. If the OI has shrunk this much and price can’t hold, there could be another kick down. But if it starts to go sideways from here, then that’s when the shorts should start thinking.
Watch first; no rush to pick it up.
$BTW This drop is a bit abrupt.
In the 15m timeframe, it just got slammed down 5.24% directly, with volume surging to 4.3x. This isn’t a slow bleed—it’s being hammered lower. The price broke below the lower band of the past 20 5m candles, and the close didn’t hold. Active turnover was short by -3.8%, the buy/sell ratio is 0.93, and the sellers are pushing.
But what really matters is the OI. Both the 15m and 1h show a decline. In nominal terms, 5.4M / 7.68M left, with an abnormal percentile of 98%, and the whole-pool nominal change ranked #2. This isn’t like new shorts entering to slam the market; it looks more like the longs ran first—deleveraging, cutting losses, shrinking positions. When price falls while OI also drops, this combination suggests it’s not someone opening new shorts; it’s old long positions exiting.
Whole-pool abnormal #5—several consecutive periods are continuing the pattern, and the traded value of 86M is right there. At this level, either the market has just finished dropping a leg, or it hasn’t finished yet. If the OI has shrunk this much and price can’t hold, there could be another kick down. But if it starts to go sideways from here, then that’s when the shorts should start thinking.
Watch first; no rush to pick it up.
In the 15m timeframe, it just got slammed down 5.24% directly, with volume surging to 4.3x. This isn’t a slow bleed—it’s being hammered lower. The price broke below the lower band of the past 20 5m candles, and the close didn’t hold. Active turnover was short by -3.8%, the buy/sell ratio is 0.93, and the sellers are pushing.
But what really matters is the OI. Both the 15m and 1h show a decline. In nominal terms, 5.4M / 7.68M left, with an abnormal percentile of 98%, and the whole-pool nominal change ranked #2. This isn’t like new shorts entering to slam the market; it looks more like the longs ran first—deleveraging, cutting losses, shrinking positions. When price falls while OI also drops, this combination suggests it’s not someone opening new shorts; it’s old long positions exiting.
Whole-pool abnormal #5—several consecutive periods are continuing the pattern, and the traded value of 86M is right there. At this level, either the market has just finished dropping a leg, or it hasn’t finished yet. If the OI has shrunk this much and price can’t hold, there could be another kick down. But if it starts to go sideways from here, then that’s when the shorts should start thinking.
Watch first; no rush to pick it up.
7
Log in to explore more content
Join global crypto users on Binance Square
⚡️ Get latest and useful information about crypto.
💬 Trusted by the world’s largest crypto exchange.
👍 Discover real insights from verified creators.
Email / Phone number
Trending Topics
1
#AIStocksWhatNext
283,212 views
2,671 Discussing
2
#BitcoinBreaksAboveMayHighNears$86K
10,570 views
159 Discussing
3
#DogecoinRises15%
30,420 views
854 Discussing
4
#$14BBitcoinOptionsExpireFriday
2,329 views
74 Discussing
5
#BNBMarketCapPassesBNYMellon
21,188 views
639 Discussing
6
#CryptoMarketCapReclaims$3Trillion
2,938 views
67 Discussing
7
#MuseOvertakesChatGPTAsTopFreeIOSApp
12,984 views
485 Discussing
8
#TokenizedStockPlatformsCouldLaunchNextQuarter
20,698 views
544 Discussing
9
#StrategyAdds950Bitcoin
26,031 views
609 Discussing
10
#CardanoAddedToX402KitForADAPayments
25,086 views
623 Discussing