

#13
13
63,632 views
280 Discussing
Hot
Latest

·
--
$PUMP This drop feels a bit dull.
On the 15m chart, volume surged to 5x directly. Price broke below the lower edge of nearly 20 consecutive 5m candles. Superficially it looks like a breakdown, but OI is actually shrinking—on the 1h timeframe, it’s down 0.25%, with a notional decrease of $1.2 million. This doesn’t look like new shorts entering to smash it; it’s more like longs getting ground down until they can’t hold, and stop-losses and deleveraging are both cashing out their chips.
Active trade value is down -6.1%, the buy/sell ratio is 0.88, and there’s sell pressure, but it’s not out of control. What’s truly worth paying attention to is the structure of this pullback on declining volume: if OI keeps falling but price holds steady afterward, then chances are this is the tail end of a position-clearing cycle. If OI falls and price continues to drift lower as well, then don’t rush to catch it.
In the last 24h, trading volume is still 190 million, so the pool isn’t cold. The whole pool’s abnormal flow ranks #12, with notional change at #13—suggesting this isn’t just one person’s PUMP. The entire order book may be contracting in sync.
First, see when this deleveraging phase stops. Only then do we talk about a rebound.
$PUMP This drop feels a bit dull.
On the 15m chart, volume surged to 5x directly. Price broke below the lower edge of nearly 20 consecutive 5m candles. Superficially it looks like a breakdown, but OI is actually shrinking—on the 1h timeframe, it’s down 0.25%, with a notional decrease of $1.2 million. This doesn’t look like new shorts entering to smash it; it’s more like longs getting ground down until they can’t hold, and stop-losses and deleveraging are both cashing out their chips.
Active trade value is down -6.1%, the buy/sell ratio is 0.88, and there’s sell pressure, but it’s not out of control. What’s truly worth paying attention to is the structure of this pullback on declining volume: if OI keeps falling but price holds steady afterward, then chances are this is the tail end of a position-clearing cycle. If OI falls and price continues to drift lower as well, then don’t rush to catch it.
In the last 24h, trading volume is still 190 million, so the pool isn’t cold. The whole pool’s abnormal flow ranks #12, with notional change at #13—suggesting this isn’t just one person’s PUMP. The entire order book may be contracting in sync.
First, see when this deleveraging phase stops. Only then do we talk about a rebound.
On the 15m chart, volume surged to 5x directly. Price broke below the lower edge of nearly 20 consecutive 5m candles. Superficially it looks like a breakdown, but OI is actually shrinking—on the 1h timeframe, it’s down 0.25%, with a notional decrease of $1.2 million. This doesn’t look like new shorts entering to smash it; it’s more like longs getting ground down until they can’t hold, and stop-losses and deleveraging are both cashing out their chips.
Active trade value is down -6.1%, the buy/sell ratio is 0.88, and there’s sell pressure, but it’s not out of control. What’s truly worth paying attention to is the structure of this pullback on declining volume: if OI keeps falling but price holds steady afterward, then chances are this is the tail end of a position-clearing cycle. If OI falls and price continues to drift lower as well, then don’t rush to catch it.
In the last 24h, trading volume is still 190 million, so the pool isn’t cold. The whole pool’s abnormal flow ranks #12, with notional change at #13—suggesting this isn’t just one person’s PUMP. The entire order book may be contracting in sync.
First, see when this deleveraging phase stops. Only then do we talk about a rebound.
51

Article
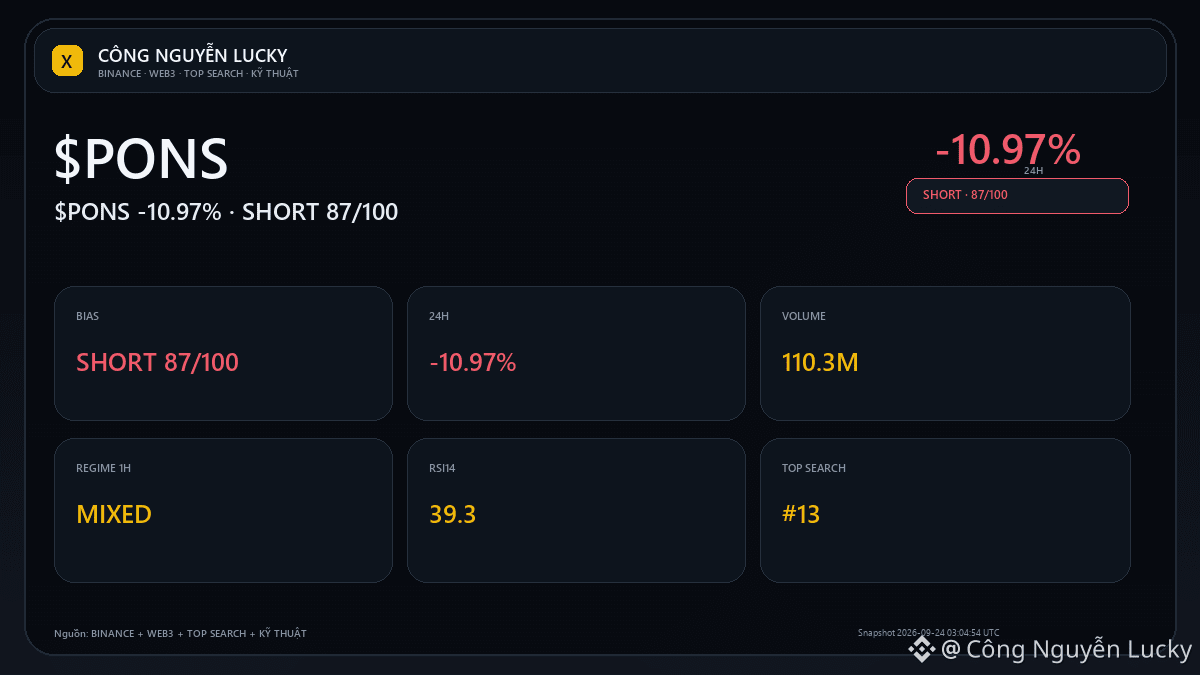
$PONS -10.97%: is there any data to confirm this strong move?🔥 $PONS is down -10.97% — but the percentage increase/decrease isn’t enough to call this a good setup. Market: 0.6463 · 24h -10.97% · volume ~110.3M USDT · 939,241 trades.
User attention level: 56/100. If attention turns into real trading: Breaking 0.6199 with expanding open volume would make the continued downtrend scenario more credible.
If search volume increases but the market doesn’t confirm: Failing to hold the lower zone and reclaiming the 0.6767 midpoint will make the downward pressure weaken. 🧭 Current direction: **SHORT · STRONG · 87/100**.
$PONS -10.97%: is there any data to confirm this strong move?
🔥 $PONS is down -10.97% — but the percentage increase/decrease isn’t enough to call this a good setup. Market: 0.6463 · 24h -10.97% · volume ~110.3M USDT · 939,241 trades.
User attention level: 56/100. If attention turns into real trading: Breaking 0.6199 with expanding open volume would make the continued downtrend scenario more credible.
If search volume increases but the market doesn’t confirm: Failing to hold the lower zone and reclaiming the 0.6767 midpoint will make the downward pressure weaken. 🧭 Current direction: **SHORT · STRONG · 87/100**.
User attention level: 56/100. If attention turns into real trading: Breaking 0.6199 with expanding open volume would make the continued downtrend scenario more credible.
If search volume increases but the market doesn’t confirm: Failing to hold the lower zone and reclaiming the 0.6767 midpoint will make the downward pressure weaken. 🧭 Current direction: **SHORT · STRONG · 87/100**.
8
Article
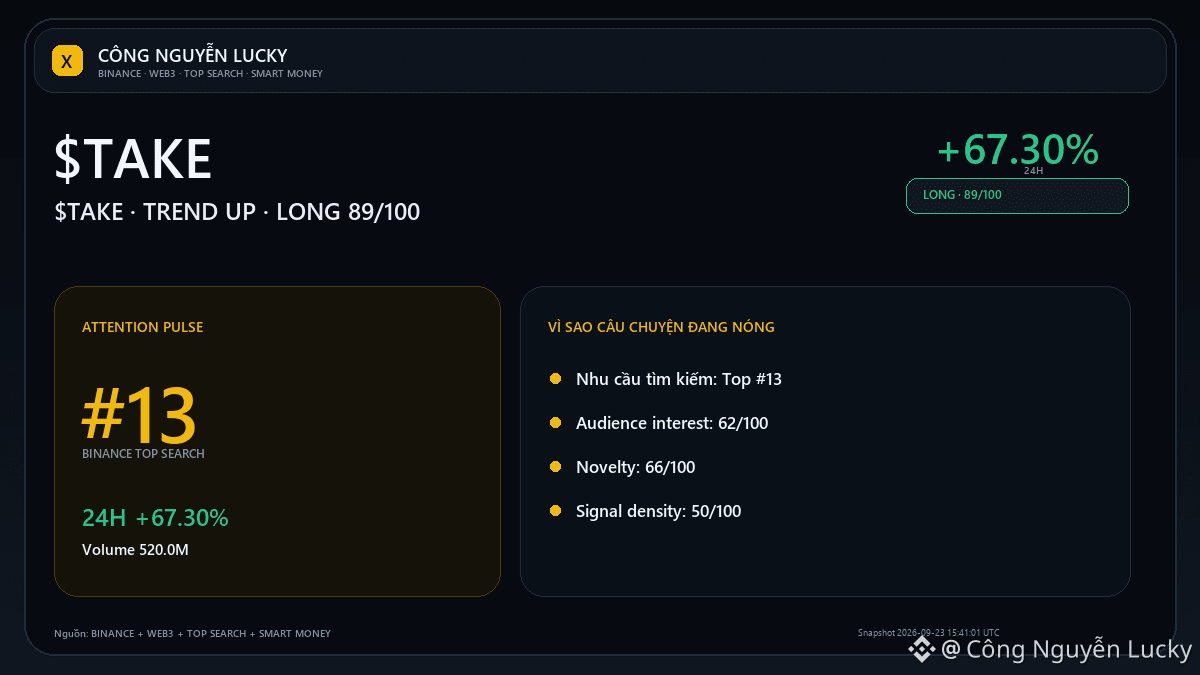
$TAKE · TREND UP: real breakout or just a 24h fluctuation?🔥 $TAKE is +67.30% — but the percentage increase/decrease is not enough to call this a good setup. Snapshot: 0.10018 · 24h +67.30% · volume ~520.0M USDT · 8,293,011 trades.
Distance to the day’s high: ~53.3%. If it continues: breaking above 0.2147 with expanded open interest will make the continuation scenario more credible.
If momentum is lost: not holding the higher zone and dropping again below the midpoint 0.13675 will make the cooling-down scenario more evident. 📌 LONG/SHORT perspective: **LONG · STRONG · 89/100**.
$TAKE · TREND UP: real breakout or just a 24h fluctuation?
🔥 $TAKE is +67.30% — but the percentage increase/decrease is not enough to call this a good setup. Snapshot: 0.10018 · 24h +67.30% · volume ~520.0M USDT · 8,293,011 trades.
Distance to the day’s high: ~53.3%. If it continues: breaking above 0.2147 with expanded open interest will make the continuation scenario more credible.
If momentum is lost: not holding the higher zone and dropping again below the midpoint 0.13675 will make the cooling-down scenario more evident. 📌 LONG/SHORT perspective: **LONG · STRONG · 89/100**.
Distance to the day’s high: ~53.3%. If it continues: breaking above 0.2147 with expanded open interest will make the continuation scenario more credible.
If momentum is lost: not holding the higher zone and dropping again below the midpoint 0.13675 will make the cooling-down scenario more evident. 📌 LONG/SHORT perspective: **LONG · STRONG · 89/100**.
4
Article
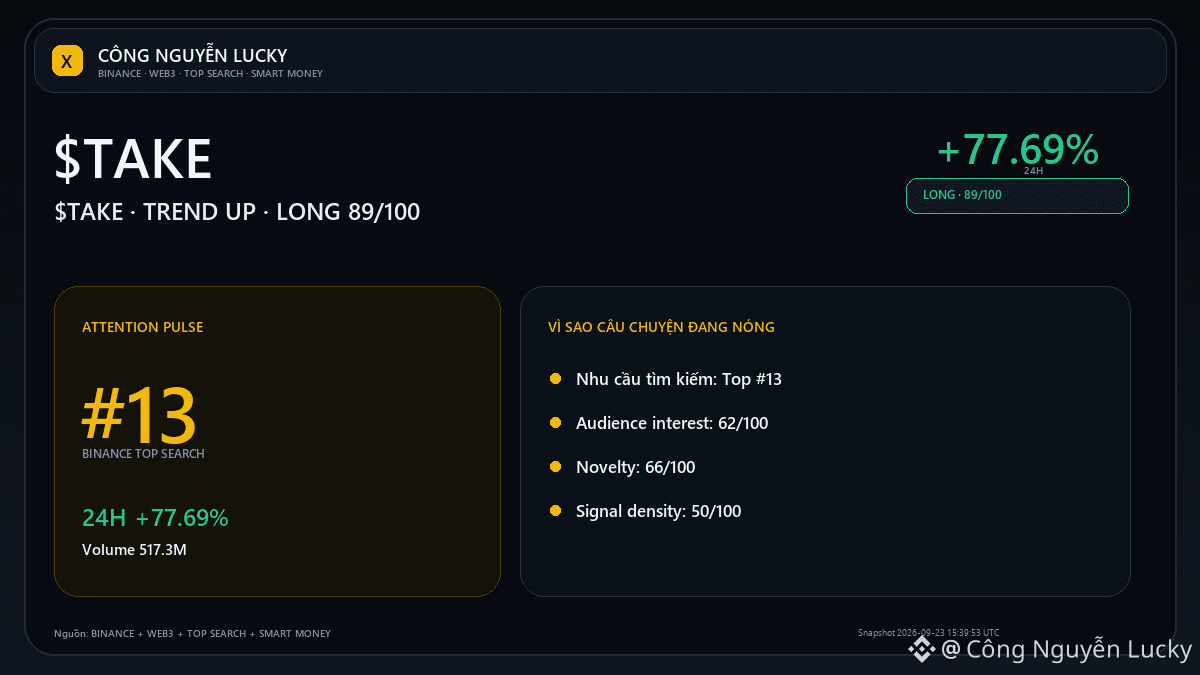
$TAKE: What is EMA 20/50/200 saying about the trend?$TAKE is hovering around 0.10633. If you only look at the current price, you still miss the most important part: what confirms or disproves the thesis? Market: 0.10633 · 24h +77.69% · volume ~517.3M USDT · 8,251,923 trades.
EMA20 0.12495488 · EMA50 0.09276681 · EMA200 0.06745809.
Structure: HH_HL · RSI14 51.8 · MACD histogram 0.00397341. Technical bias: LONG 100/100. EMA is only a trend filter; I only increase conviction when structure + momentum + flow of funds all confirm.
$TAKE: What is EMA 20/50/200 saying about the trend?
$TAKE is hovering around 0.10633. If you only look at the current price, you still miss the most important part: what confirms or disproves the thesis? Market: 0.10633 · 24h +77.69% · volume ~517.3M USDT · 8,251,923 trades.
EMA20 0.12495488 · EMA50 0.09276681 · EMA200 0.06745809.
Structure: HH_HL · RSI14 51.8 · MACD histogram 0.00397341. Technical bias: LONG 100/100. EMA is only a trend filter; I only increase conviction when structure + momentum + flow of funds all confirm.
EMA20 0.12495488 · EMA50 0.09276681 · EMA200 0.06745809.
Structure: HH_HL · RSI14 51.8 · MACD histogram 0.00397341. Technical bias: LONG 100/100. EMA is only a trend filter; I only increase conviction when structure + momentum + flow of funds all confirm.
140
Article
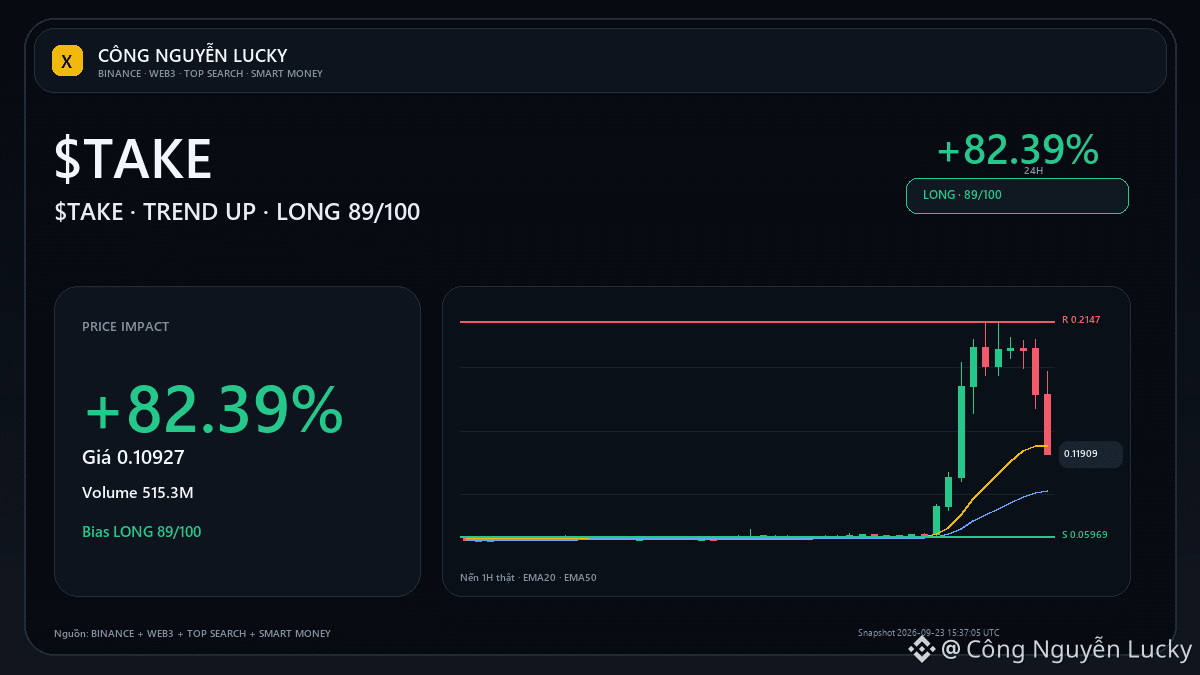
$TAKE · TREND UP: real breakout or just a 24h fluctuation?🔥 $TAKE đang +82.39% — but the percent increase/decrease isn’t enough to call this a good setup yet. Snapshot: 0.10927 · 24h +82.39% · volume ~515.3M USDT · 8,214,890 trades. 🟢 Bull/continuation case: Breaking above 0.2147 with expanding open volume will make the continuation scenario more credible.
🔴 Bear/cooling case: Failing to hold the high zone and dropping back below the midpoint 0.13675 will make the cooling scenario clearer. 🎯 Preferred trend: **LONG · STRONG · 89/100**.
$TAKE · TREND UP: real breakout or just a 24h fluctuation?
🔥 $TAKE đang +82.39% — but the percent increase/decrease isn’t enough to call this a good setup yet. Snapshot: 0.10927 · 24h +82.39% · volume ~515.3M USDT · 8,214,890 trades. 🟢 Bull/continuation case: Breaking above 0.2147 with expanding open volume will make the continuation scenario more credible.
🔴 Bear/cooling case: Failing to hold the high zone and dropping back below the midpoint 0.13675 will make the cooling scenario clearer. 🎯 Preferred trend: **LONG · STRONG · 89/100**.
🔴 Bear/cooling case: Failing to hold the high zone and dropping back below the midpoint 0.13675 will make the cooling scenario clearer. 🎯 Preferred trend: **LONG · STRONG · 89/100**.
8

·
--
$PHA This move has something to it. In the 15m timeframe it climbed 3.85%, with volume straight up reaching 2.01x. The buy/sell ratio is 1.41, and the buy orders are noticeably heavier.
The key is that OI is keeping up too—15m +1.07%, 1h +0.30%. This doesn’t look like just short-covering; it feels more like new long positions entering and adding leverage. The OI abnormal percentile is 94.4%, ranking #13 across the whole pool. At this kind of position, it usually isn’t a quiet spot.
Price has just broken above the top edge of the last ~20 five-minute candles—basically it’s just touched the range boundary. In the past 24h, turnover is a bit over 17M; the depth isn’t very thick, so it moves up fast, and a drop wouldn’t necessarily be slow either. Keep a close eye—don’t chase the spike.
$PHA This move has something to it. In the 15m timeframe it climbed 3.85%, with volume straight up reaching 2.01x. The buy/sell ratio is 1.41, and the buy orders are noticeably heavier.
The key is that OI is keeping up too—15m +1.07%, 1h +0.30%. This doesn’t look like just short-covering; it feels more like new long positions entering and adding leverage. The OI abnormal percentile is 94.4%, ranking #13 across the whole pool. At this kind of position, it usually isn’t a quiet spot.
Price has just broken above the top edge of the last ~20 five-minute candles—basically it’s just touched the range boundary. In the past 24h, turnover is a bit over 17M; the depth isn’t very thick, so it moves up fast, and a drop wouldn’t necessarily be slow either. Keep a close eye—don’t chase the spike.
The key is that OI is keeping up too—15m +1.07%, 1h +0.30%. This doesn’t look like just short-covering; it feels more like new long positions entering and adding leverage. The OI abnormal percentile is 94.4%, ranking #13 across the whole pool. At this kind of position, it usually isn’t a quiet spot.
Price has just broken above the top edge of the last ~20 five-minute candles—basically it’s just touched the range boundary. In the past 24h, turnover is a bit over 17M; the depth isn’t very thick, so it moves up fast, and a drop wouldn’t necessarily be slow either. Keep a close eye—don’t chase the spike.
5

·
--
🏆 FLIPPENING
💰 Bitcoin just flipped Saudi Aramco!
$BTC $1.68T · now #13 of all assets
Passed Saudi Aramco ($1.66T)
🍳 Crypto vs the whole world. Not financial advice.
#CookingBNB #Crypto #Bitcoin #BTC
🏆 FLIPPENING
💰 Bitcoin just flipped Saudi Aramco!
$BTC $1.68T · now #13 of all assets
Passed Saudi Aramco ($1.66T)
🍳 Crypto vs the whole world. Not financial advice.
#CookingBNB #Crypto #Bitcoin #BTC
💰 Bitcoin just flipped Saudi Aramco!
$BTC $1.68T · now #13 of all assets
Passed Saudi Aramco ($1.66T)
🍳 Crypto vs the whole world. Not financial advice.
#CookingBNB #Crypto #Bitcoin #BTC

31
·
--
At this moment $TIA suddenly saw a surge in volume pushing upward; in the 15m timeframe it surged 3.48%, with volume directly reaching 3.53x.
The key is the structure: price broke above the upper edge of the recent ~20 5m-range candles, and OI on the 15m is still increasing in sync. Nominal change is +1.22%, which is typical of leveraged long positions entering—not just a simple short-covering bounce. Active trade differential is -18.8%, the buy/sell ratio is 1.46, and the buy-side bias is very obvious.
However, note that the 1h OI is still -0.86%, suggesting overall positioning is gradually backing off. This 15m move is an abrupt short-term new addition. The anomalous percentile for the whole pool is 80.6%, ranking #13—visible, but not an extreme level.
In the past 24h, turnover is 46M, and the depth is sufficient, but don’t treat it as the entire reason to start a trend. This kind of structure is more like someone is grabbing liquidity at this level; the key to whether it continues is whether, next, the 15m can pull the 1h OI back up. For now, watch whether the order book can keep standing firm and continue expanding volume. If it retreats back below the top of the range, then all this effort is wasted.
At this moment $TIA suddenly saw a surge in volume pushing upward; in the 15m timeframe it surged 3.48%, with volume directly reaching 3.53x.
The key is the structure: price broke above the upper edge of the recent ~20 5m-range candles, and OI on the 15m is still increasing in sync. Nominal change is +1.22%, which is typical of leveraged long positions entering—not just a simple short-covering bounce. Active trade differential is -18.8%, the buy/sell ratio is 1.46, and the buy-side bias is very obvious.
However, note that the 1h OI is still -0.86%, suggesting overall positioning is gradually backing off. This 15m move is an abrupt short-term new addition. The anomalous percentile for the whole pool is 80.6%, ranking #13—visible, but not an extreme level.
In the past 24h, turnover is 46M, and the depth is sufficient, but don’t treat it as the entire reason to start a trend. This kind of structure is more like someone is grabbing liquidity at this level; the key to whether it continues is whether, next, the 15m can pull the 1h OI back up. For now, watch whether the order book can keep standing firm and continue expanding volume. If it retreats back below the top of the range, then all this effort is wasted.
The key is the structure: price broke above the upper edge of the recent ~20 5m-range candles, and OI on the 15m is still increasing in sync. Nominal change is +1.22%, which is typical of leveraged long positions entering—not just a simple short-covering bounce. Active trade differential is -18.8%, the buy/sell ratio is 1.46, and the buy-side bias is very obvious.
However, note that the 1h OI is still -0.86%, suggesting overall positioning is gradually backing off. This 15m move is an abrupt short-term new addition. The anomalous percentile for the whole pool is 80.6%, ranking #13—visible, but not an extreme level.
In the past 24h, turnover is 46M, and the depth is sufficient, but don’t treat it as the entire reason to start a trend. This kind of structure is more like someone is grabbing liquidity at this level; the key to whether it continues is whether, next, the 15m can pull the 1h OI back up. For now, watch whether the order book can keep standing firm and continue expanding volume. If it retreats back below the top of the range, then all this effort is wasted.
1

·
--
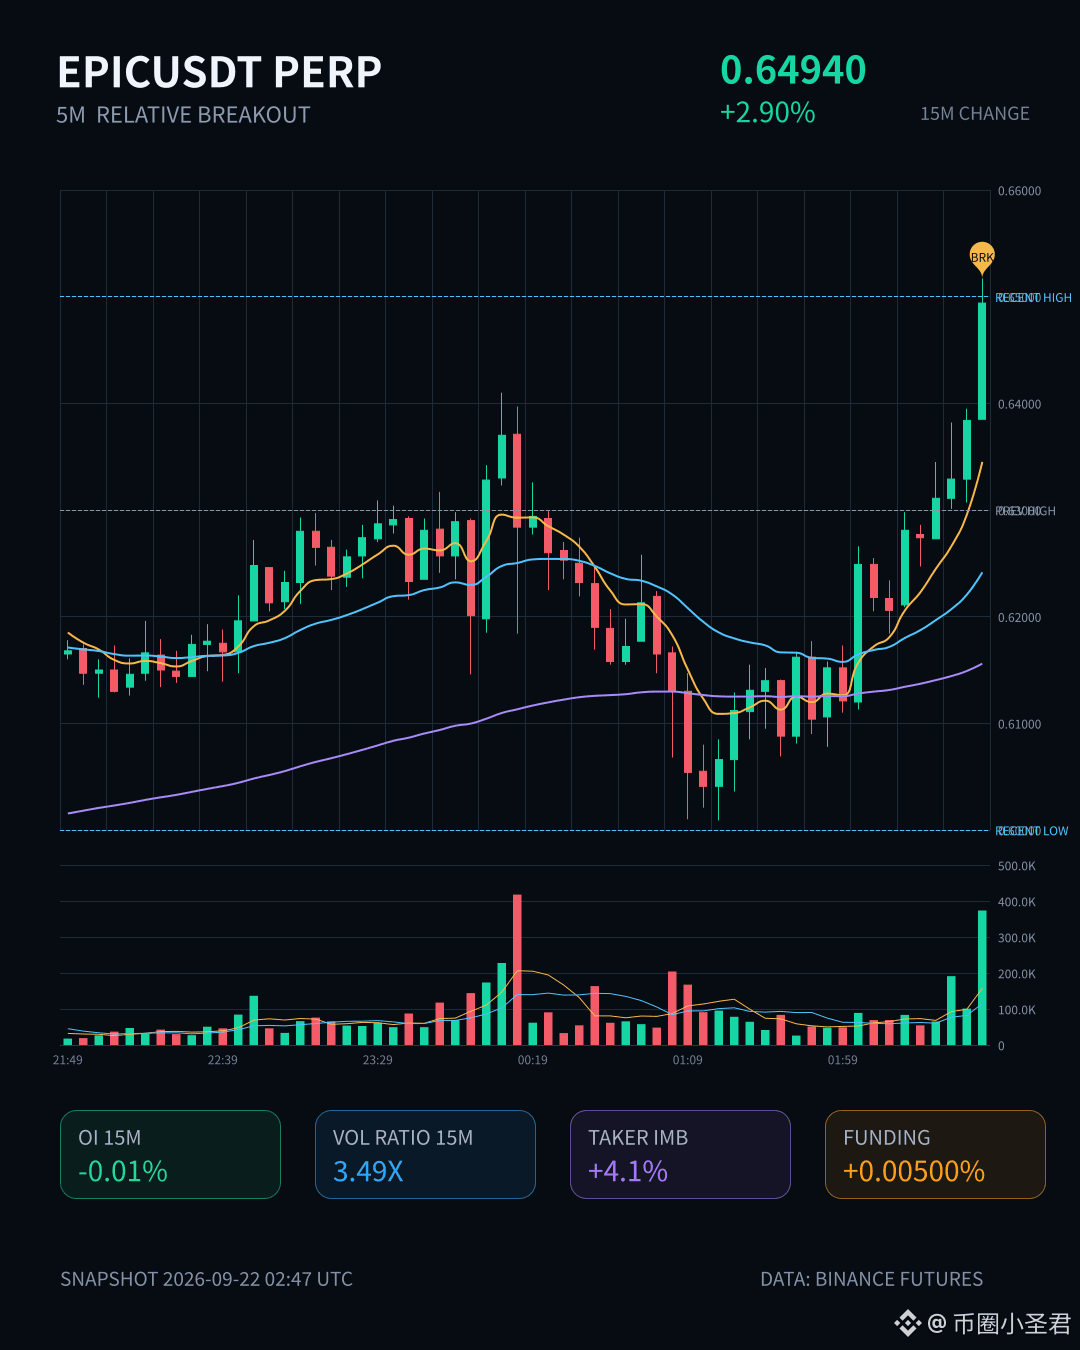
$EPIC This move is kind of interesting.
On the 15m timeframe it surged 2.90%. Volume directly jumped to 3.49x. The closing price even pierced above the upper edges of roughly 20 of the 5m candles. But the strange part is that OI is dropping—15m -0.01%, 1h -0.25%. As price rises, positions decrease. This looks like a classic short-covering行情, not fresh long entries.
Active trade volume is down 4.1%, the buy/sell ratio is 1.09, and the funding rate is still in the recent high percentile. This structure suggests shorts are being forced to close out—it doesn’t look like someone is truly picking up shares underneath. The whole pool is at an unusual high percentile of 88.7%, ranking #13, with nominal changes also near the front. On the short term, there’s definitely some heat.
In 24h, turnover is 26.3M—depth is sufficient to watch, but don’t treat short-covering as a trend. Once shorts are done closing, who will take over?
$EPIC This move is kind of interesting.
On the 15m timeframe it surged 2.90%. Volume directly jumped to 3.49x. The closing price even pierced above the upper edges of roughly 20 of the 5m candles. But the strange part is that OI is dropping—15m -0.01%, 1h -0.25%. As price rises, positions decrease. This looks like a classic short-covering行情, not fresh long entries.
Active trade volume is down 4.1%, the buy/sell ratio is 1.09, and the funding rate is still in the recent high percentile. This structure suggests shorts are being forced to close out—it doesn’t look like someone is truly picking up shares underneath. The whole pool is at an unusual high percentile of 88.7%, ranking #13, with nominal changes also near the front. On the short term, there’s definitely some heat.
In 24h, turnover is 26.3M—depth is sufficient to watch, but don’t treat short-covering as a trend. Once shorts are done closing, who will take over?
On the 15m timeframe it surged 2.90%. Volume directly jumped to 3.49x. The closing price even pierced above the upper edges of roughly 20 of the 5m candles. But the strange part is that OI is dropping—15m -0.01%, 1h -0.25%. As price rises, positions decrease. This looks like a classic short-covering行情, not fresh long entries.
Active trade volume is down 4.1%, the buy/sell ratio is 1.09, and the funding rate is still in the recent high percentile. This structure suggests shorts are being forced to close out—it doesn’t look like someone is truly picking up shares underneath. The whole pool is at an unusual high percentile of 88.7%, ranking #13, with nominal changes also near the front. On the short term, there’s definitely some heat.
In 24h, turnover is 26.3M—depth is sufficient to watch, but don’t treat short-covering as a trend. Once shorts are done closing, who will take over?
7

·
--
$POL 15m This one’s a bit interesting.
The price only got pushed up a little—0.68%—but the volume directly surged to 1.94x, which isn’t something you can just brush through. More importantly, as the price is moving higher, OI is also increasing—both 15m and 1h are at +0.36%, suggesting that most likely new leveraged longs have entered, not just spot arbitrage or shorts covering.
The closing price has just chewed through nearly 20 of the 5m candles’ upper bands. The aggressive traded volume is up 17.5%, the buy/sell ratio is 1.42, and the buy side is leaning in that direction. The OI abnormal percentile is 84.3%, ranking #13 in the whole pool—depth confirms this area is properly supported.
With a structure like this, I usually take a couple more looks—when volume, price, and positions are all pushing upward in agreement, it’s often not a matter of just one or two K-lines before it ends. But the 24h trading value is only a bit over 53M, the pool isn’t especially thick; if it truly charges, slippage is something you still need to watch.
For now, log it and see whether it can hold steady above the upper edge of this zone.
$POL 15m This one’s a bit interesting.
The price only got pushed up a little—0.68%—but the volume directly surged to 1.94x, which isn’t something you can just brush through. More importantly, as the price is moving higher, OI is also increasing—both 15m and 1h are at +0.36%, suggesting that most likely new leveraged longs have entered, not just spot arbitrage or shorts covering.
The closing price has just chewed through nearly 20 of the 5m candles’ upper bands. The aggressive traded volume is up 17.5%, the buy/sell ratio is 1.42, and the buy side is leaning in that direction. The OI abnormal percentile is 84.3%, ranking #13 in the whole pool—depth confirms this area is properly supported.
With a structure like this, I usually take a couple more looks—when volume, price, and positions are all pushing upward in agreement, it’s often not a matter of just one or two K-lines before it ends. But the 24h trading value is only a bit over 53M, the pool isn’t especially thick; if it truly charges, slippage is something you still need to watch.
For now, log it and see whether it can hold steady above the upper edge of this zone.
The price only got pushed up a little—0.68%—but the volume directly surged to 1.94x, which isn’t something you can just brush through. More importantly, as the price is moving higher, OI is also increasing—both 15m and 1h are at +0.36%, suggesting that most likely new leveraged longs have entered, not just spot arbitrage or shorts covering.
The closing price has just chewed through nearly 20 of the 5m candles’ upper bands. The aggressive traded volume is up 17.5%, the buy/sell ratio is 1.42, and the buy side is leaning in that direction. The OI abnormal percentile is 84.3%, ranking #13 in the whole pool—depth confirms this area is properly supported.
With a structure like this, I usually take a couple more looks—when volume, price, and positions are all pushing upward in agreement, it’s often not a matter of just one or two K-lines before it ends. But the 24h trading value is only a bit over 53M, the pool isn’t especially thick; if it truly charges, slippage is something you still need to watch.
For now, log it and see whether it can hold steady above the upper edge of this zone.
24
·
--
$ZAMA This drop is quite decisive.
In the 15m timeframe, it fell 3.47%. Volume surged straight to 2.13x, with volatility at Z 2.62—this isn’t a minor wick or a small needle penetration; it’s a breakout with volume that breaks down. The closing price fell through the lower edge of the last nearly 20 consecutive 5m K lines. Active trading imbalance was -23.8%, and the buy-sell ratio was 0.62—seller control is very obvious.
But what’s truly interesting is the OI. In 15m, OI is -0.87%; in 1h, OI is -0.63%. The nominal change is -852K / -767K USDT, roughly around -4%. Price is down while OI is also down—this isn’t new shorts entering; it’s longs deleveraging, cutting losses, and reducing position size. The pool’s abnormal percentile is 94.2%, abnormal rank is #3, nominal change rank is #13, and the pattern continues across multiple consecutive periods. This kind of structure usually indicates panic traders transferring positions and not adding to shorts.
The last 24h trading value is 138.55M, and volume is still there, meaning it’s not a coin that no one plays. The key now is: can this deleveraging find a stop near the historical extreme range? The OI abnormality is still continuing—don’t rush in. Wait for the active sell pressure to converge before considering entry.
$ZAMA This drop is quite decisive.
In the 15m timeframe, it fell 3.47%. Volume surged straight to 2.13x, with volatility at Z 2.62—this isn’t a minor wick or a small needle penetration; it’s a breakout with volume that breaks down. The closing price fell through the lower edge of the last nearly 20 consecutive 5m K lines. Active trading imbalance was -23.8%, and the buy-sell ratio was 0.62—seller control is very obvious.
But what’s truly interesting is the OI. In 15m, OI is -0.87%; in 1h, OI is -0.63%. The nominal change is -852K / -767K USDT, roughly around -4%. Price is down while OI is also down—this isn’t new shorts entering; it’s longs deleveraging, cutting losses, and reducing position size. The pool’s abnormal percentile is 94.2%, abnormal rank is #3, nominal change rank is #13, and the pattern continues across multiple consecutive periods. This kind of structure usually indicates panic traders transferring positions and not adding to shorts.
The last 24h trading value is 138.55M, and volume is still there, meaning it’s not a coin that no one plays. The key now is: can this deleveraging find a stop near the historical extreme range? The OI abnormality is still continuing—don’t rush in. Wait for the active sell pressure to converge before considering entry.
In the 15m timeframe, it fell 3.47%. Volume surged straight to 2.13x, with volatility at Z 2.62—this isn’t a minor wick or a small needle penetration; it’s a breakout with volume that breaks down. The closing price fell through the lower edge of the last nearly 20 consecutive 5m K lines. Active trading imbalance was -23.8%, and the buy-sell ratio was 0.62—seller control is very obvious.
But what’s truly interesting is the OI. In 15m, OI is -0.87%; in 1h, OI is -0.63%. The nominal change is -852K / -767K USDT, roughly around -4%. Price is down while OI is also down—this isn’t new shorts entering; it’s longs deleveraging, cutting losses, and reducing position size. The pool’s abnormal percentile is 94.2%, abnormal rank is #3, nominal change rank is #13, and the pattern continues across multiple consecutive periods. This kind of structure usually indicates panic traders transferring positions and not adding to shorts.
The last 24h trading value is 138.55M, and volume is still there, meaning it’s not a coin that no one plays. The key now is: can this deleveraging find a stop near the historical extreme range? The OI abnormality is still continuing—don’t rush in. Wait for the active sell pressure to converge before considering entry.

·
--
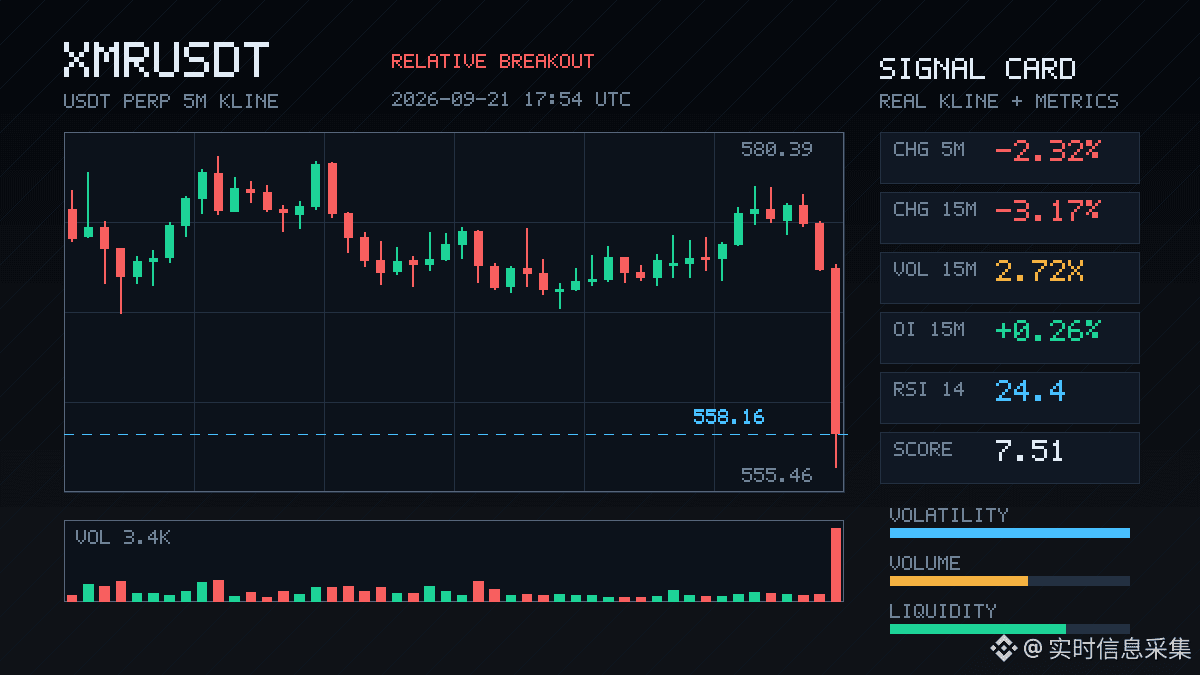
$XMR This spot is a bit interesting.
In 15m, it directly got smashed by 3.17%. The volume was at 2.72x, and the volatility (Z) hit 4.52. The close fell through the lower bound of nearly 20 consecutive 5m candles.
Passive-to-active turnover gap is -42.8%, and the buy/sell ratio is 0.40—there really is sell-side pressure.
But looking at OI: the 15m contract is +0.26%, yet the notional is -1.58M; and 1h is also only slightly down. The price is falling, while the OI abnormal percentile is pushed up to 96.6%—abnormal #13 across the whole pool.
This structure looks more like newly added leveraged shorts are pushing, not just a simple long liquidation cascading from a squeeze.
Because notional change and the direction of open interest don’t match, it suggests capital is getting in and out quickly.
Over 24h, turnover is 154M, and the depth is there. The key now is whether, after this breakdown of the lower bound, it can continue— or whether it’s just another liquidity sweep followed by a quick pullback.
Watch OI changes closely. If shorts keep adding but price stops moving down, then it’s a different story.
$XMR This spot is a bit interesting.
In 15m, it directly got smashed by 3.17%. The volume was at 2.72x, and the volatility (Z) hit 4.52. The close fell through the lower bound of nearly 20 consecutive 5m candles.
Passive-to-active turnover gap is -42.8%, and the buy/sell ratio is 0.40—there really is sell-side pressure.
But looking at OI: the 15m contract is +0.26%, yet the notional is -1.58M; and 1h is also only slightly down. The price is falling, while the OI abnormal percentile is pushed up to 96.6%—abnormal #13 across the whole pool.
This structure looks more like newly added leveraged shorts are pushing, not just a simple long liquidation cascading from a squeeze.
Because notional change and the direction of open interest don’t match, it suggests capital is getting in and out quickly.
Over 24h, turnover is 154M, and the depth is there. The key now is whether, after this breakdown of the lower bound, it can continue— or whether it’s just another liquidity sweep followed by a quick pullback.
Watch OI changes closely. If shorts keep adding but price stops moving down, then it’s a different story.
In 15m, it directly got smashed by 3.17%. The volume was at 2.72x, and the volatility (Z) hit 4.52. The close fell through the lower bound of nearly 20 consecutive 5m candles.
Passive-to-active turnover gap is -42.8%, and the buy/sell ratio is 0.40—there really is sell-side pressure.
But looking at OI: the 15m contract is +0.26%, yet the notional is -1.58M; and 1h is also only slightly down. The price is falling, while the OI abnormal percentile is pushed up to 96.6%—abnormal #13 across the whole pool.
This structure looks more like newly added leveraged shorts are pushing, not just a simple long liquidation cascading from a squeeze.
Because notional change and the direction of open interest don’t match, it suggests capital is getting in and out quickly.
Over 24h, turnover is 154M, and the depth is there. The key now is whether, after this breakdown of the lower bound, it can continue— or whether it’s just another liquidity sweep followed by a quick pullback.
Watch OI changes closely. If shorts keep adding but price stops moving down, then it’s a different story.
·
--
$INJ there’s a bit of movement.
15m: it’s up 1.33%, volume is 1.59x, and the price breaks straight through the recent 5m upper range line, hugging that upper boundary. The key isn’t this single bullish candle—it’s that OI is rising in sync: 15m +0.42%, 1h +0.23%, and the notional changes are also moving upward, with the abnormal percentile at 92.1%.
Price rises + OI rises—structurally it looks more like new leveraged long positions are entering, not a short squeeze type of fake pull. Passive/active trade gap is 19.3%, buy/sell ratio is 1.48, and the order flow is clearly biased to the buy side.
24h turnover is 92M; the abnormality level ranks at #15 in the pool, notional change is #13. Multiple consecutive periods are continuing—this isn’t just a single impulse.
Watch whether it can hold above this range’s upper edge. If it can’t, it’s a fake breakout; if it can, there may be another leg up.
$INJ there’s a bit of movement.
15m: it’s up 1.33%, volume is 1.59x, and the price breaks straight through the recent 5m upper range line, hugging that upper boundary. The key isn’t this single bullish candle—it’s that OI is rising in sync: 15m +0.42%, 1h +0.23%, and the notional changes are also moving upward, with the abnormal percentile at 92.1%.
Price rises + OI rises—structurally it looks more like new leveraged long positions are entering, not a short squeeze type of fake pull. Passive/active trade gap is 19.3%, buy/sell ratio is 1.48, and the order flow is clearly biased to the buy side.
24h turnover is 92M; the abnormality level ranks at #15 in the pool, notional change is #13. Multiple consecutive periods are continuing—this isn’t just a single impulse.
Watch whether it can hold above this range’s upper edge. If it can’t, it’s a fake breakout; if it can, there may be another leg up.
15m: it’s up 1.33%, volume is 1.59x, and the price breaks straight through the recent 5m upper range line, hugging that upper boundary. The key isn’t this single bullish candle—it’s that OI is rising in sync: 15m +0.42%, 1h +0.23%, and the notional changes are also moving upward, with the abnormal percentile at 92.1%.
Price rises + OI rises—structurally it looks more like new leveraged long positions are entering, not a short squeeze type of fake pull. Passive/active trade gap is 19.3%, buy/sell ratio is 1.48, and the order flow is clearly biased to the buy side.
24h turnover is 92M; the abnormality level ranks at #15 in the pool, notional change is #13. Multiple consecutive periods are continuing—this isn’t just a single impulse.
Watch whether it can hold above this range’s upper edge. If it can’t, it’s a fake breakout; if it can, there may be another leg up.
7
·
--
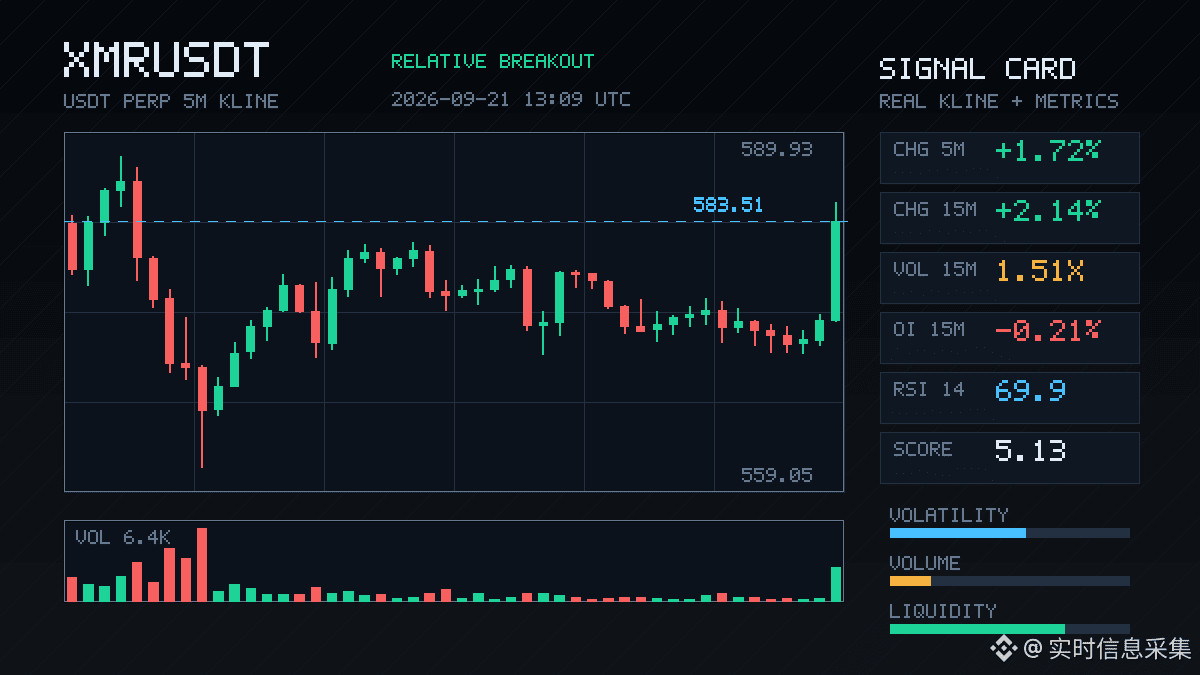
$XMR moved.
In 15m, it surged 2.14%, with volume at 1.51x, and the volatility (Z) hit 2.26. The close directly broke above the upper edge of the last 20 5m candles. The aggressive order flow gap is -34.6%, and the buy/sell ratio is 2.06. This isn’t a test—someone directly pushed it upward.
But interestingly, the OI shows: 15m -0.21%, 1h -0.18%. Price is up while open interest is down. It smells strongly of short covering—either that, or this rally wasn’t new longs entering at all; instead, old shorts are being lifted out. The funding rate is still in the high percentile recently, which suggests the long side is already a bit crowded.
As for XMR, this asset usually doesn’t make much noise. But when it does, it immediately rockets to a very top position across the whole pool—an abnormal percentile of 94.4%, ranking #13 in the entire pool. I don’t need to say more.
It moved pretty fast, but since OI didn’t follow through, let’s first see whether this wave is yet another one-off move.
$XMR moved.
In 15m, it surged 2.14%, with volume at 1.51x, and the volatility (Z) hit 2.26. The close directly broke above the upper edge of the last 20 5m candles. The aggressive order flow gap is -34.6%, and the buy/sell ratio is 2.06. This isn’t a test—someone directly pushed it upward.
But interestingly, the OI shows: 15m -0.21%, 1h -0.18%. Price is up while open interest is down. It smells strongly of short covering—either that, or this rally wasn’t new longs entering at all; instead, old shorts are being lifted out. The funding rate is still in the high percentile recently, which suggests the long side is already a bit crowded.
As for XMR, this asset usually doesn’t make much noise. But when it does, it immediately rockets to a very top position across the whole pool—an abnormal percentile of 94.4%, ranking #13 in the entire pool. I don’t need to say more.
It moved pretty fast, but since OI didn’t follow through, let’s first see whether this wave is yet another one-off move.
In 15m, it surged 2.14%, with volume at 1.51x, and the volatility (Z) hit 2.26. The close directly broke above the upper edge of the last 20 5m candles. The aggressive order flow gap is -34.6%, and the buy/sell ratio is 2.06. This isn’t a test—someone directly pushed it upward.
But interestingly, the OI shows: 15m -0.21%, 1h -0.18%. Price is up while open interest is down. It smells strongly of short covering—either that, or this rally wasn’t new longs entering at all; instead, old shorts are being lifted out. The funding rate is still in the high percentile recently, which suggests the long side is already a bit crowded.
As for XMR, this asset usually doesn’t make much noise. But when it does, it immediately rockets to a very top position across the whole pool—an abnormal percentile of 94.4%, ranking #13 in the entire pool. I don’t need to say more.
It moved pretty fast, but since OI didn’t follow through, let’s first see whether this wave is yet another one-off move.
9
·
--
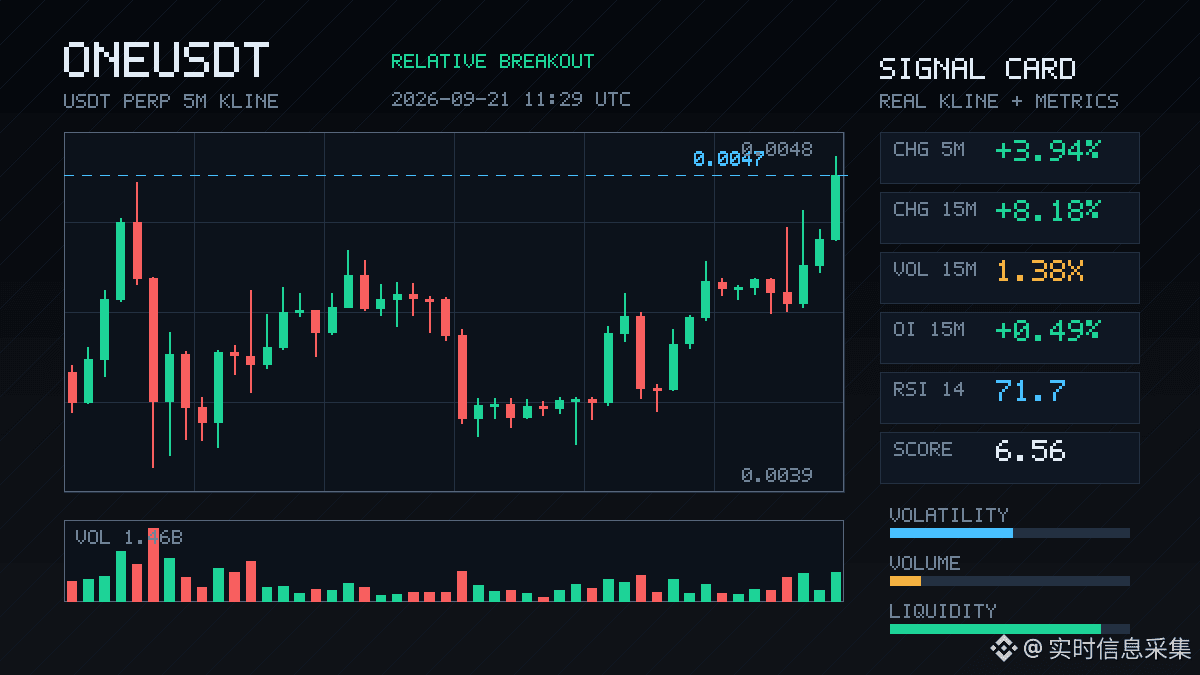
$ONE In these 15 minutes, there’s something there: it pulled up 8 points. Volume didn’t really explode, but it’s still participating. Trading volume at 1.38x paired with volatility at 2.03—this is the kind of “quietly getting work done” move.
The key is the OI percentile—92.3%. The whole pool is abnormal (#13). Nominal change has pushed into the top 7. The 15m OI is increasing, while the 1h OI is only slightly down, which suggests this wave is newly entered leveraged longs, not old positions propping it up.
Active trades are down 11.1%, and the buy/sell ratio is 1.25—buying is genuinely sweeping.
The closing price directly broke above the upper edge of the last ~20 5m candles. The range boundary looks like it’s been touched. 24h trading volume is 425 million (RMB equivalent), with enough depth—not some tiny pool that gets pierced with one poke.
With this kind of structure, I usually don’t rush to chase the first candle, but I’ll watch for a pullback. If the upside opens, whether the newly added leverage can relay is the real focus. $ONE
$ONE In these 15 minutes, there’s something there: it pulled up 8 points. Volume didn’t really explode, but it’s still participating. Trading volume at 1.38x paired with volatility at 2.03—this is the kind of “quietly getting work done” move.
The key is the OI percentile—92.3%. The whole pool is abnormal (#13). Nominal change has pushed into the top 7. The 15m OI is increasing, while the 1h OI is only slightly down, which suggests this wave is newly entered leveraged longs, not old positions propping it up.
Active trades are down 11.1%, and the buy/sell ratio is 1.25—buying is genuinely sweeping.
The closing price directly broke above the upper edge of the last ~20 5m candles. The range boundary looks like it’s been touched. 24h trading volume is 425 million (RMB equivalent), with enough depth—not some tiny pool that gets pierced with one poke.
With this kind of structure, I usually don’t rush to chase the first candle, but I’ll watch for a pullback. If the upside opens, whether the newly added leverage can relay is the real focus. $ONE
The key is the OI percentile—92.3%. The whole pool is abnormal (#13). Nominal change has pushed into the top 7. The 15m OI is increasing, while the 1h OI is only slightly down, which suggests this wave is newly entered leveraged longs, not old positions propping it up.
Active trades are down 11.1%, and the buy/sell ratio is 1.25—buying is genuinely sweeping.
The closing price directly broke above the upper edge of the last ~20 5m candles. The range boundary looks like it’s been touched. 24h trading volume is 425 million (RMB equivalent), with enough depth—not some tiny pool that gets pierced with one poke.
With this kind of structure, I usually don’t rush to chase the first candle, but I’ll watch for a pullback. If the upside opens, whether the newly added leverage can relay is the real focus. $ONE
278

·
--
Bullish
Lula #13 Pro Brazil to continue rising to the Moon.
Away with fascists!!!
Lula #13 Pro Brazil to continue rising to the Moon.
Away with fascists!!!
Away with fascists!!!
1
79
·
--
$INJ This move has something to it. In the 15m timeframe, it pulls up 1.92%; volume energy directly reaches 2.54x, and the Z value is 3.49—this isn’t the kind of price action that looks like a fake breakout on shrinking volume. The key is that OI is rising along with it: 15m +0.67%, 1h +0.53%. The nominal change adds up quickly by about 1.7 million U, with a very strong sign of new leveraged longs entering. The abnormal percentile is 90.1%. It’s ranked #13 across the whole pool by order book, and #9 by nominal change—among the earlier group in relative breakouts.
The price has just moved above the upper edge of about 20 of the 5m candles. Active trade value is down 18.9%, buy/sell ratio is 1.47, and buy-side pressure is quite clear. Over the last 24h, turnover is 217 million, with enough depth—not some small pool being played with on its own. With this kind of structure, it either keeps running or turns into a single wave and finishes with a quick spike (like a pin). Watch first—don’t rush to chase.
$INJ This move has something to it. In the 15m timeframe, it pulls up 1.92%; volume energy directly reaches 2.54x, and the Z value is 3.49—this isn’t the kind of price action that looks like a fake breakout on shrinking volume. The key is that OI is rising along with it: 15m +0.67%, 1h +0.53%. The nominal change adds up quickly by about 1.7 million U, with a very strong sign of new leveraged longs entering. The abnormal percentile is 90.1%. It’s ranked #13 across the whole pool by order book, and #9 by nominal change—among the earlier group in relative breakouts.
The price has just moved above the upper edge of about 20 of the 5m candles. Active trade value is down 18.9%, buy/sell ratio is 1.47, and buy-side pressure is quite clear. Over the last 24h, turnover is 217 million, with enough depth—not some small pool being played with on its own. With this kind of structure, it either keeps running or turns into a single wave and finishes with a quick spike (like a pin). Watch first—don’t rush to chase.
The price has just moved above the upper edge of about 20 of the 5m candles. Active trade value is down 18.9%, buy/sell ratio is 1.47, and buy-side pressure is quite clear. Over the last 24h, turnover is 217 million, with enough depth—not some small pool being played with on its own. With this kind of structure, it either keeps running or turns into a single wave and finishes with a quick spike (like a pin). Watch first—don’t rush to chase.
21
·
--
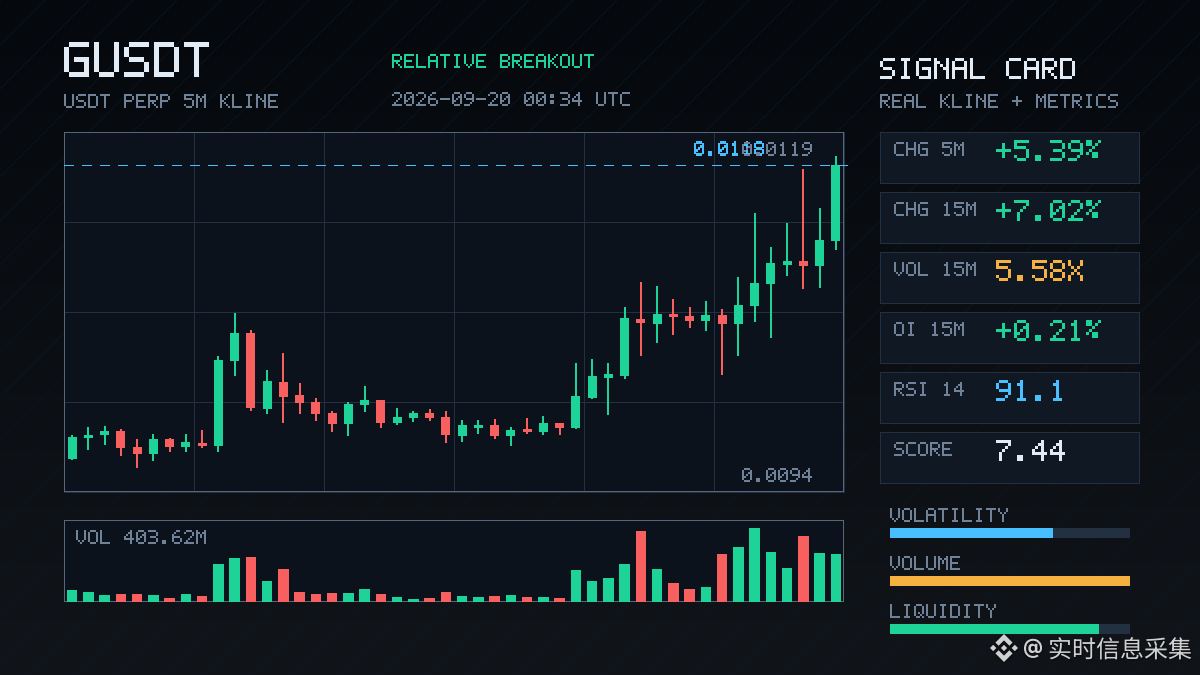
$G This pump is getting a bit too fast.
On the 15m chart it directly pushed through 7 points; the volume is up to 5.58x, with a Z value of 2.71—clearly not the kind of small-scale play retail traders do. The key is that OI is also rising along with it—on the 1h contracts are up 1.43%, the notional increased by nearly 3 million U, and the anomaly percentile is 92.9%, with the whole pool ranking at #13. Price is up, open interest is up—structurally it looks more like fresh leveraged longs coming in to push, not like a short-squeeze fueled by panicked selling.
The closing price just broke above the upper edge of the last ~20 consecutive 5m candles. In the past 24h, the traded value is over 400 million, and the depth is there. Active buy-vs-sell is only off by 2.3%, and the buy/sell ratio is 1.05. Buys are slightly dominant, but not out of control.
Whether to chase at this position depends on the individual. Once you break the boundary and volume-price are coordinated cleanly, it can look good—but if leverage builds up, the pullback won’t be gentle. I’ll throw this onto my watchlist and keep an eye on it first.
$G This pump is getting a bit too fast.
On the 15m chart it directly pushed through 7 points; the volume is up to 5.58x, with a Z value of 2.71—clearly not the kind of small-scale play retail traders do. The key is that OI is also rising along with it—on the 1h contracts are up 1.43%, the notional increased by nearly 3 million U, and the anomaly percentile is 92.9%, with the whole pool ranking at #13. Price is up, open interest is up—structurally it looks more like fresh leveraged longs coming in to push, not like a short-squeeze fueled by panicked selling.
The closing price just broke above the upper edge of the last ~20 consecutive 5m candles. In the past 24h, the traded value is over 400 million, and the depth is there. Active buy-vs-sell is only off by 2.3%, and the buy/sell ratio is 1.05. Buys are slightly dominant, but not out of control.
Whether to chase at this position depends on the individual. Once you break the boundary and volume-price are coordinated cleanly, it can look good—but if leverage builds up, the pullback won’t be gentle. I’ll throw this onto my watchlist and keep an eye on it first.
On the 15m chart it directly pushed through 7 points; the volume is up to 5.58x, with a Z value of 2.71—clearly not the kind of small-scale play retail traders do. The key is that OI is also rising along with it—on the 1h contracts are up 1.43%, the notional increased by nearly 3 million U, and the anomaly percentile is 92.9%, with the whole pool ranking at #13. Price is up, open interest is up—structurally it looks more like fresh leveraged longs coming in to push, not like a short-squeeze fueled by panicked selling.
The closing price just broke above the upper edge of the last ~20 consecutive 5m candles. In the past 24h, the traded value is over 400 million, and the depth is there. Active buy-vs-sell is only off by 2.3%, and the buy/sell ratio is 1.05. Buys are slightly dominant, but not out of control.
Whether to chase at this position depends on the individual. Once you break the boundary and volume-price are coordinated cleanly, it can look good—but if leverage builds up, the pullback won’t be gentle. I’ll throw this onto my watchlist and keep an eye on it first.
68
·
--
$MAGMA This is a bit interesting.
In 15m, it directly surged by 1.59%, with volume hitting 3.76x. The proportion of active buy orders is clearly tilted toward buyers: buy/sell ratio 1.87. And the close even broke above the upper band of the last 20 5m candles.
More importantly, OI is rising in sync—15m +1.10%, 1h +1.43%. The abnormal percentile is close to 90%, ranking #13 across the whole pool. Price is up and positions are up as well; this isn’t a short panic sell-off. It looks like someone is adding leverage and charging in.
In the past 24h, turnover is 26M. The depth has been confirmed—volume and price are cooperating properly.
This kind of structure is either new long positions being pushed in, or someone having laid groundwork early. Anyway, I’ll keep watching it; whether to chase on a breakout is another question.
$MAGMA This is a bit interesting.
In 15m, it directly surged by 1.59%, with volume hitting 3.76x. The proportion of active buy orders is clearly tilted toward buyers: buy/sell ratio 1.87. And the close even broke above the upper band of the last 20 5m candles.
More importantly, OI is rising in sync—15m +1.10%, 1h +1.43%. The abnormal percentile is close to 90%, ranking #13 across the whole pool. Price is up and positions are up as well; this isn’t a short panic sell-off. It looks like someone is adding leverage and charging in.
In the past 24h, turnover is 26M. The depth has been confirmed—volume and price are cooperating properly.
This kind of structure is either new long positions being pushed in, or someone having laid groundwork early. Anyway, I’ll keep watching it; whether to chase on a breakout is another question.
In 15m, it directly surged by 1.59%, with volume hitting 3.76x. The proportion of active buy orders is clearly tilted toward buyers: buy/sell ratio 1.87. And the close even broke above the upper band of the last 20 5m candles.
More importantly, OI is rising in sync—15m +1.10%, 1h +1.43%. The abnormal percentile is close to 90%, ranking #13 across the whole pool. Price is up and positions are up as well; this isn’t a short panic sell-off. It looks like someone is adding leverage and charging in.
In the past 24h, turnover is 26M. The depth has been confirmed—volume and price are cooperating properly.
This kind of structure is either new long positions being pushed in, or someone having laid groundwork early. Anyway, I’ll keep watching it; whether to chase on a breakout is another question.
5
·
--
$FARTCOIN 15m Up 1.1% — at first glance it doesn’t seem like much, but active trades are off +23.4%, buy/sell ratio is 1.61, and the candle closed still holding above the top line of nearly 20 of the 5m bars. This breakout is volume-backed: 1.71x volume paired with Z at 2.16 — not some fake move.
What’s interesting is the OI: 15m -0.21%, 1h -0.20%, and yet the notional is only slightly up. Price is rising while open interest is falling — a classic short-covering structure, not new longs pushing it up. Structures like this often move fast, but whether they can sustain depends on whether fresh positions step in afterward.
OI abnormal percentile is 85.7%, whole pool #13, which shows that the abnormality of positioning at this level is indeed quite front-loaded on-chain/at the contract level. 24h turnover is 28M; the pool isn’t that deep. With this kind of volume, structural amplification of volatility is very easy.
Around 3 a.m., at this kind of time, it’s about watching whether it can hold the upper edge of the range. If it can’t, it’s basically a round of short covering and then it moves.
$FARTCOIN 15m Up 1.1% — at first glance it doesn’t seem like much, but active trades are off +23.4%, buy/sell ratio is 1.61, and the candle closed still holding above the top line of nearly 20 of the 5m bars. This breakout is volume-backed: 1.71x volume paired with Z at 2.16 — not some fake move.
What’s interesting is the OI: 15m -0.21%, 1h -0.20%, and yet the notional is only slightly up. Price is rising while open interest is falling — a classic short-covering structure, not new longs pushing it up. Structures like this often move fast, but whether they can sustain depends on whether fresh positions step in afterward.
OI abnormal percentile is 85.7%, whole pool #13, which shows that the abnormality of positioning at this level is indeed quite front-loaded on-chain/at the contract level. 24h turnover is 28M; the pool isn’t that deep. With this kind of volume, structural amplification of volatility is very easy.
Around 3 a.m., at this kind of time, it’s about watching whether it can hold the upper edge of the range. If it can’t, it’s basically a round of short covering and then it moves.
What’s interesting is the OI: 15m -0.21%, 1h -0.20%, and yet the notional is only slightly up. Price is rising while open interest is falling — a classic short-covering structure, not new longs pushing it up. Structures like this often move fast, but whether they can sustain depends on whether fresh positions step in afterward.
OI abnormal percentile is 85.7%, whole pool #13, which shows that the abnormality of positioning at this level is indeed quite front-loaded on-chain/at the contract level. 24h turnover is 28M; the pool isn’t that deep. With this kind of volume, structural amplification of volatility is very easy.
Around 3 a.m., at this kind of time, it’s about watching whether it can hold the upper edge of the range. If it can’t, it’s basically a round of short covering and then it moves.
1
Log in to explore more content
Join global crypto users on Binance Square
⚡️ Get latest and useful information about crypto.
💬 Trusted by the world’s largest crypto exchange.
👍 Discover real insights from verified creators.
Email / Phone number
Trending Topics
1
#BinanceWillListHyperliquid(HYPE)
75,848 views
1,810 Discussing
2
#FedOctoberRateHikeOddsRiseTo69.7%
15,699 views
654 Discussing
3
#BitcoinFallsBelow$83,000
2,460 views
20 Discussing
4
#BitcoinFallsToAround$84,600ThisWeek
0 views
0 Discussing
5
#US30YearYieldHighestSince2004
17,665 views
536 Discussing
6
#ETHBreaksAbove$2,700
1,205 views
20 Discussing
7
#USWeighsPromotingDollarStablecoinsAbroad
48,563 views
1,428 Discussing
8
#US10YTreasuryYieldHits19YearHigh
49,404 views
1,142 Discussing
9
#SpotBitcoinETFsInflow$2.31BInFourDays
5,923 views
66 Discussing
10
#BitcoinRejectedAt$87,300Twice
0 views
0 Discussing