
#6
6
66,221 views
547 Discussing
Hot
Latest

·
--
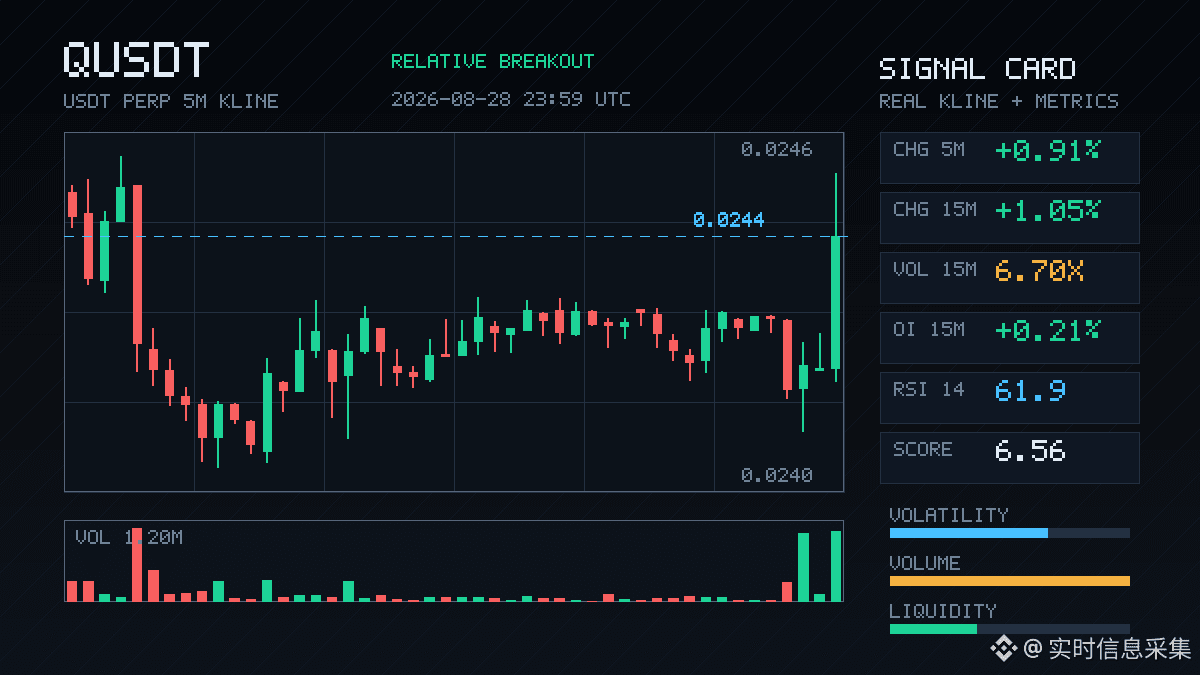
$Q This one’s kind of interesting.
In just 15 minutes it surged 1%, with trading volume reaching 6.7 times the usual level. And at the close it even pushed through the upper boundary of the range formed by the latest 20 five-minute candlesticks. The key point is that OI is rising in sync too—open interest and price both moving upward. This suggests real new leverage long positions are entering (money actually coming in), not just short-covering and a fake spike.
Aggressive trading volume is up 40.9%, buy/sell ratio is 2.38, and the bid side in the order book looks clearly more aggressive. The funding rate is also in the recent high percentile. At the moment, bullish sentiment feels a bit overheated, but the market structure is still fairly healthy, with no signs of divergence.
Breakthrough above the high #6, and the nominal changes are also leading across the pool.
Keep an eye on whether it can hold above the upper edge of this range. Breakouts with this kind of volume-price alignment usually get a continuation move. But if the volume can’t keep up, then a pullback for confirmation is also a normal script.
$Q For short-term trading, pay attention to risk control—don’t chase too high.
$Q This one’s kind of interesting.
In just 15 minutes it surged 1%, with trading volume reaching 6.7 times the usual level. And at the close it even pushed through the upper boundary of the range formed by the latest 20 five-minute candlesticks. The key point is that OI is rising in sync too—open interest and price both moving upward. This suggests real new leverage long positions are entering (money actually coming in), not just short-covering and a fake spike.
Aggressive trading volume is up 40.9%, buy/sell ratio is 2.38, and the bid side in the order book looks clearly more aggressive. The funding rate is also in the recent high percentile. At the moment, bullish sentiment feels a bit overheated, but the market structure is still fairly healthy, with no signs of divergence.
Breakthrough above the high #6, and the nominal changes are also leading across the pool.
Keep an eye on whether it can hold above the upper edge of this range. Breakouts with this kind of volume-price alignment usually get a continuation move. But if the volume can’t keep up, then a pullback for confirmation is also a normal script.
$Q For short-term trading, pay attention to risk control—don’t chase too high.
In just 15 minutes it surged 1%, with trading volume reaching 6.7 times the usual level. And at the close it even pushed through the upper boundary of the range formed by the latest 20 five-minute candlesticks. The key point is that OI is rising in sync too—open interest and price both moving upward. This suggests real new leverage long positions are entering (money actually coming in), not just short-covering and a fake spike.
Aggressive trading volume is up 40.9%, buy/sell ratio is 2.38, and the bid side in the order book looks clearly more aggressive. The funding rate is also in the recent high percentile. At the moment, bullish sentiment feels a bit overheated, but the market structure is still fairly healthy, with no signs of divergence.
Breakthrough above the high #6, and the nominal changes are also leading across the pool.
Keep an eye on whether it can hold above the upper edge of this range. Breakouts with this kind of volume-price alignment usually get a continuation move. But if the volume can’t keep up, then a pullback for confirmation is also a normal script.
$Q For short-term trading, pay attention to risk control—don’t chase too high.
101

·
--
Official Trump ($TRUMP) Gains Momentum as Community Engagement Soars
Official Trump ($TRUMP) is trending at #6 with a solid 24h volume of $245M. The coin's 1.69% price increase is fueled by strong community support and recent developments. Traders should keep an eye on $TRUMP as it continues to gain traction, driven by its unique narrative and active community. 📈✨
Follow for more crypto setups.
#HahaProfit #TrumpCoin
Official Trump ($TRUMP ) Gains Momentum as Community Engagement Soars
Official Trump ($TRUMP ) is trending at #6 with a solid 24h volume of $245M. The coin's 1.69% price increase is fueled by strong community support and recent developments. Traders should keep an eye on $TRUMP as it continues to gain traction, driven by its unique narrative and active community. 📈✨
Follow for more crypto setups.
#HahaProfit #TrumpCoin
Official Trump ($TRUMP ) is trending at #6 with a solid 24h volume of $245M. The coin's 1.69% price increase is fueled by strong community support and recent developments. Traders should keep an eye on $TRUMP as it continues to gain traction, driven by its unique narrative and active community. 📈✨
Follow for more crypto setups.
#HahaProfit #TrumpCoin

110

·
--
$BCH This one is a bit interesting.
In 15m, it’s up 1.18%; volume directly jumps to 6.4x. OI is +2.14% in 15m and +2.59% in 1h, with nominal changes stacking for several consecutive cycles. Price is rising, OI is rising—this is a typical leveraged long entry structure.
Active trades are down 24.5%, buy/sell ratio is 1.65—clearly bullish. OI anomaly percentile is 96.8%, the whole pool is #6, nominal change is #8—this level is close to the historical extreme zone.
24h turnover is 219M, liquidity is sufficient. But with this current OI accumulation speed, either it keeps forcing a squeeze, or it’s setting up a mine for later. Keep an eye on it yourself.
$BCH This one is a bit interesting.
In 15m, it’s up 1.18%; volume directly jumps to 6.4x. OI is +2.14% in 15m and +2.59% in 1h, with nominal changes stacking for several consecutive cycles. Price is rising, OI is rising—this is a typical leveraged long entry structure.
Active trades are down 24.5%, buy/sell ratio is 1.65—clearly bullish. OI anomaly percentile is 96.8%, the whole pool is #6, nominal change is #8—this level is close to the historical extreme zone.
24h turnover is 219M, liquidity is sufficient. But with this current OI accumulation speed, either it keeps forcing a squeeze, or it’s setting up a mine for later. Keep an eye on it yourself.
In 15m, it’s up 1.18%; volume directly jumps to 6.4x. OI is +2.14% in 15m and +2.59% in 1h, with nominal changes stacking for several consecutive cycles. Price is rising, OI is rising—this is a typical leveraged long entry structure.
Active trades are down 24.5%, buy/sell ratio is 1.65—clearly bullish. OI anomaly percentile is 96.8%, the whole pool is #6, nominal change is #8—this level is close to the historical extreme zone.
24h turnover is 219M, liquidity is sufficient. But with this current OI accumulation speed, either it keeps forcing a squeeze, or it’s setting up a mine for later. Keep an eye on it yourself.
12
·
--
$1000PEPE is kind of interesting.
On the 15m chart it climbed 2.41%, with volume at 1.75x. It closed a volume-expansion bullish candle that grabbed the upper edge of the most recent 20 5m candles. Aggressive buy orders are pressing down on sell orders; aggressive trades were weakly matched, with the buy-sell ratio at 1.21 and an order-trade gap of +9.7%.
But what really caught my attention is the OI data. On the 15m, OI fell 0.69%, while on the 1h it rose 2.57%, with nominal inflow of 6.73 million U. Price went up, but short-cycle OI decreased instead—this doesn’t smell right. It looks more like shorts are being pulled into covering, not like new long positions are pouring in. The abnormal percentile is 90.3%. In the whole pool it ranks #14; nominal change ranks #6. It hasn’t broken across several consecutive periods, and the funding rate is also sitting at a high percentile recently.
The 24h trading volume is 1058M, and the depth is sufficient.
With this kind of structure, you can ride the momentum, but don’t treat it like a trending-market setup and chase. If the shorts covering pushes it up, once the covering is done—who’s going to take over the next leg? Keep a close eye on OI divergence. If it continues to diverge, the more sharply it rises, the more you should be careful.
$1000PEPE is kind of interesting.
On the 15m chart it climbed 2.41%, with volume at 1.75x. It closed a volume-expansion bullish candle that grabbed the upper edge of the most recent 20 5m candles. Aggressive buy orders are pressing down on sell orders; aggressive trades were weakly matched, with the buy-sell ratio at 1.21 and an order-trade gap of +9.7%.
But what really caught my attention is the OI data. On the 15m, OI fell 0.69%, while on the 1h it rose 2.57%, with nominal inflow of 6.73 million U. Price went up, but short-cycle OI decreased instead—this doesn’t smell right. It looks more like shorts are being pulled into covering, not like new long positions are pouring in. The abnormal percentile is 90.3%. In the whole pool it ranks #14; nominal change ranks #6. It hasn’t broken across several consecutive periods, and the funding rate is also sitting at a high percentile recently.
The 24h trading volume is 1058M, and the depth is sufficient.
With this kind of structure, you can ride the momentum, but don’t treat it like a trending-market setup and chase. If the shorts covering pushes it up, once the covering is done—who’s going to take over the next leg? Keep a close eye on OI divergence. If it continues to diverge, the more sharply it rises, the more you should be careful.
On the 15m chart it climbed 2.41%, with volume at 1.75x. It closed a volume-expansion bullish candle that grabbed the upper edge of the most recent 20 5m candles. Aggressive buy orders are pressing down on sell orders; aggressive trades were weakly matched, with the buy-sell ratio at 1.21 and an order-trade gap of +9.7%.
But what really caught my attention is the OI data. On the 15m, OI fell 0.69%, while on the 1h it rose 2.57%, with nominal inflow of 6.73 million U. Price went up, but short-cycle OI decreased instead—this doesn’t smell right. It looks more like shorts are being pulled into covering, not like new long positions are pouring in. The abnormal percentile is 90.3%. In the whole pool it ranks #14; nominal change ranks #6. It hasn’t broken across several consecutive periods, and the funding rate is also sitting at a high percentile recently.
The 24h trading volume is 1058M, and the depth is sufficient.
With this kind of structure, you can ride the momentum, but don’t treat it like a trending-market setup and chase. If the shorts covering pushes it up, once the covering is done—who’s going to take over the next leg? Keep a close eye on OI divergence. If it continues to diverge, the more sharply it rises, the more you should be careful.
101

·
--
$BR This is a bit interesting.
In 15m, it directly surged 5.22%. Volume surged to 2.94x, and the volatility Z reached 4.48. The key isn’t how much it went up—OI is still following along. On the 15m contract, OI increased +0.16%, nominal 2.84M, and the 1h timeframe also shows net growth. Price rises alongside OI growth—this is typical bidirectional leverage, not that kind of “short covering” hype.
Anomaly percentile 97.4%, whole pool #2, nominal change #6. These high-ranking abnormal moves usually aren’t isolated.
Aggressive trade gap +13.8%, buy/sell ratio 1.32, with a clear tilt toward bids. The closing price also sits above the upper edge of nearly the last 20 five-minute candles. Structurally, it looks like it wants to push upward.
But don’t get too carried away. The 1h OI nominal change and the 15m change overlap almost exactly, suggesting this increment mainly came in over the past dozen or so minutes, and the positions haven’t fully settled. 24h volume is 136M; the pool isn’t that deep. If it retraces and doesn’t get absorbed, leveraged longs flipping shorts can easily lead to a dump.
First, let’s see whether it can hold above the upper edge of this 5m range.
$BR This is a bit interesting.
In 15m, it directly surged 5.22%. Volume surged to 2.94x, and the volatility Z reached 4.48. The key isn’t how much it went up—OI is still following along. On the 15m contract, OI increased +0.16%, nominal 2.84M, and the 1h timeframe also shows net growth. Price rises alongside OI growth—this is typical bidirectional leverage, not that kind of “short covering” hype.
Anomaly percentile 97.4%, whole pool #2, nominal change #6. These high-ranking abnormal moves usually aren’t isolated.
Aggressive trade gap +13.8%, buy/sell ratio 1.32, with a clear tilt toward bids. The closing price also sits above the upper edge of nearly the last 20 five-minute candles. Structurally, it looks like it wants to push upward.
But don’t get too carried away. The 1h OI nominal change and the 15m change overlap almost exactly, suggesting this increment mainly came in over the past dozen or so minutes, and the positions haven’t fully settled. 24h volume is 136M; the pool isn’t that deep. If it retraces and doesn’t get absorbed, leveraged longs flipping shorts can easily lead to a dump.
First, let’s see whether it can hold above the upper edge of this 5m range.
In 15m, it directly surged 5.22%. Volume surged to 2.94x, and the volatility Z reached 4.48. The key isn’t how much it went up—OI is still following along. On the 15m contract, OI increased +0.16%, nominal 2.84M, and the 1h timeframe also shows net growth. Price rises alongside OI growth—this is typical bidirectional leverage, not that kind of “short covering” hype.
Anomaly percentile 97.4%, whole pool #2, nominal change #6. These high-ranking abnormal moves usually aren’t isolated.
Aggressive trade gap +13.8%, buy/sell ratio 1.32, with a clear tilt toward bids. The closing price also sits above the upper edge of nearly the last 20 five-minute candles. Structurally, it looks like it wants to push upward.
But don’t get too carried away. The 1h OI nominal change and the 15m change overlap almost exactly, suggesting this increment mainly came in over the past dozen or so minutes, and the positions haven’t fully settled. 24h volume is 136M; the pool isn’t that deep. If it retraces and doesn’t get absorbed, leveraged longs flipping shorts can easily lead to a dump.
First, let’s see whether it can hold above the upper edge of this 5m range.
2

·
--
See translation
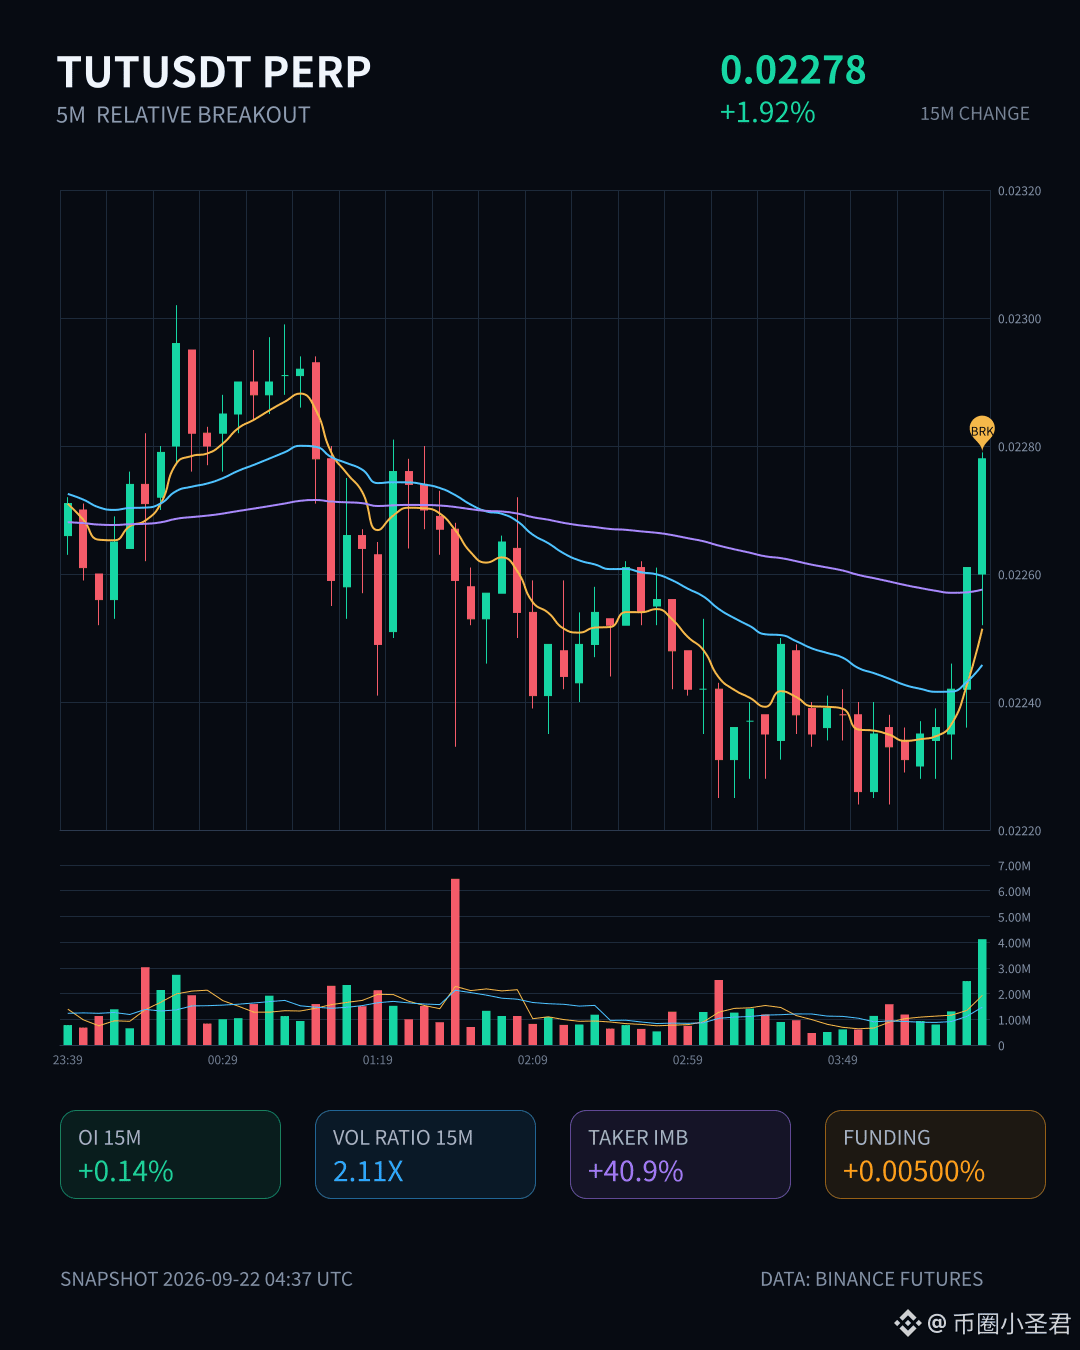
$TUT 这波有点意思。
15m 拉了 1.92%,量能直接干到 2.11x,Z 值 3.81,收盘价站上近 20 根 5m 的上沿——不是插一下就跑,是踩着边界往上摸。
更关键的是 OI:15m +0.14%、1h +0.03%,名义变化都在十来万 U,异常分位已经 97.8%,全池排到 #6。这不是空头回补,是新增杠杆多头在往里挤。
主动成交差 40.9%,买卖比 2.38,买盘偏得挺明显。24h 成交额才 12.63M,池子不算深,这种量价+持仓同步推的结构,延续性值得盯一下,但小池子拉起来快、回撤也不含糊。
连续几个周期都在延续,先看这根能不能站稳区间上沿。追不追是另一回事,至少现在不是没人管的状态。
$TUT 这波有点意思。
15m 拉了 1.92%,量能直接干到 2.11x,Z 值 3.81,收盘价站上近 20 根 5m 的上沿——不是插一下就跑,是踩着边界往上摸。
更关键的是 OI:15m +0.14%、1h +0.03%,名义变化都在十来万 U,异常分位已经 97.8%,全池排到 #6。这不是空头回补,是新增杠杆多头在往里挤。
主动成交差 40.9%,买卖比 2.38,买盘偏得挺明显。24h 成交额才 12.63M,池子不算深,这种量价+持仓同步推的结构,延续性值得盯一下,但小池子拉起来快、回撤也不含糊。
连续几个周期都在延续,先看这根能不能站稳区间上沿。追不追是另一回事,至少现在不是没人管的状态。
15m 拉了 1.92%,量能直接干到 2.11x,Z 值 3.81,收盘价站上近 20 根 5m 的上沿——不是插一下就跑,是踩着边界往上摸。
更关键的是 OI:15m +0.14%、1h +0.03%,名义变化都在十来万 U,异常分位已经 97.8%,全池排到 #6。这不是空头回补,是新增杠杆多头在往里挤。
主动成交差 40.9%,买卖比 2.38,买盘偏得挺明显。24h 成交额才 12.63M,池子不算深,这种量价+持仓同步推的结构,延续性值得盯一下,但小池子拉起来快、回撤也不含糊。
连续几个周期都在延续,先看这根能不能站稳区间上沿。追不追是另一回事,至少现在不是没人管的状态。
7

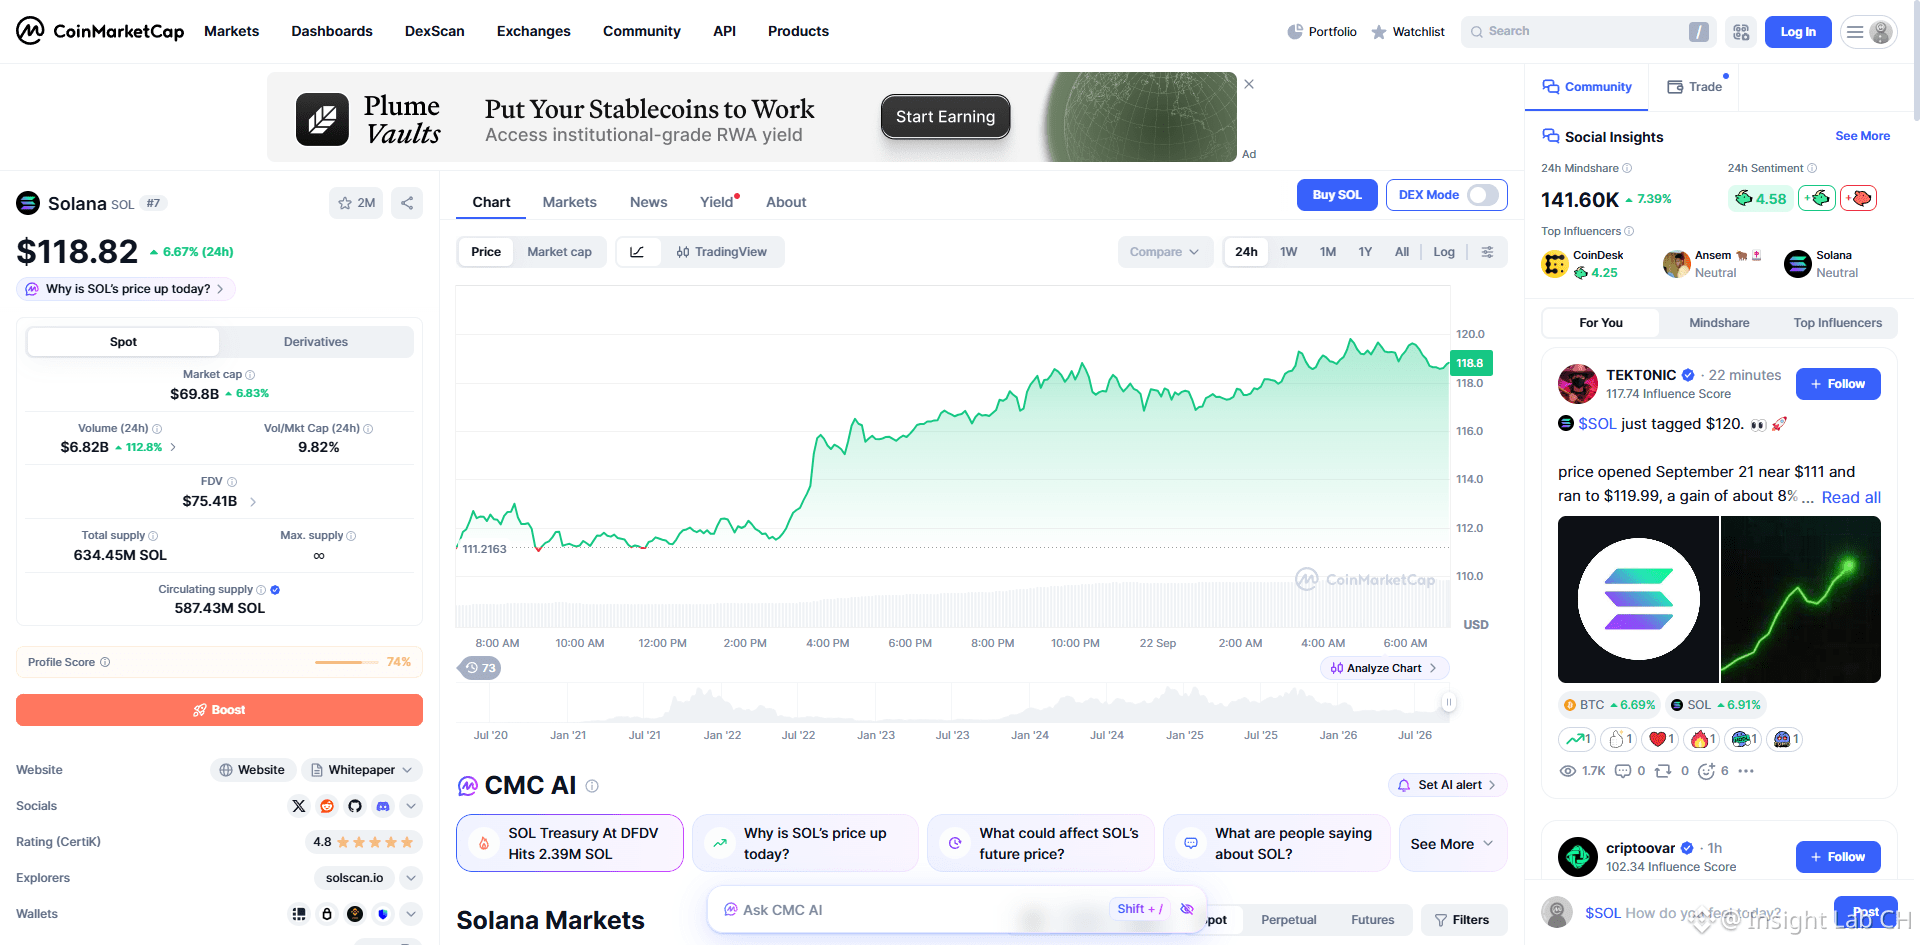
Current data shows $SOL is currently ranked #6 on the CoinMarketCap trend chart. Under tightening macro liquidity and high interest rates, the rise in short-term enthusiasm for mainstream risk assets looks more like a game among existing capital. Investors should be wary of the risk of pullbacks after sentiment cools down.📉 #Solana #Layer1
Current data shows $SOL is currently ranked #6 on the CoinMarketCap trend chart. Under tightening macro liquidity and high interest rates, the rise in short-term enthusiasm for mainstream risk assets looks more like a game among existing capital. Investors should be wary of the risk of pullbacks after sentiment cools down.📉 #Solana #Layer1
75
·
--
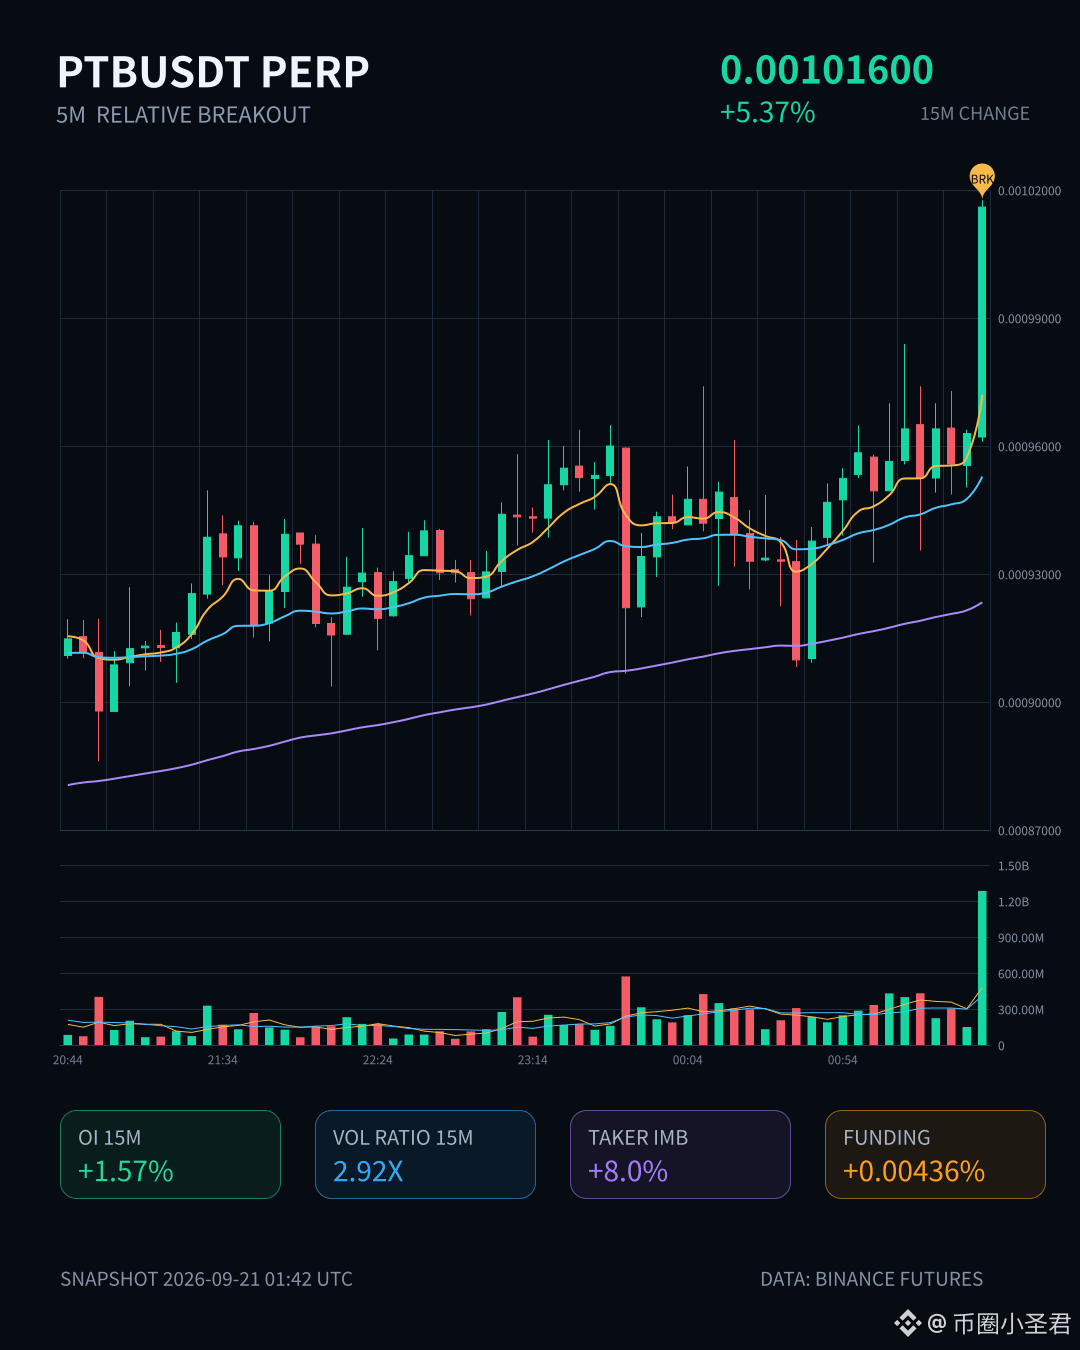
$PTB This 15m candle has something to it.
A 5.37% surge isn’t that outrageous, but combined with a 2.92x volume and an OI anomaly at the 98.6 percentile, it’s not just a simple sentiment impulse. Open interest increased by 4.16% net over the last 1h, notional +1.01M. Price and OI are moving upward in sync—more like new leveraged long positions entering actively, not shorts getting squeezed.
The order book shows an 8% difference in active trades, the buy/sell ratio is 1.17, and the bid side has been steadily “biting.” The closing price directly breaks above the upper edge of the past ~20 five-minute range, touching the recent price boundary.
The anomaly across the whole pool ranks #6, notional change is #39, and the depth confirmation is also passed—so the volume is higher than normal. It doesn’t feel like a fakeout.
In the last 24h, turnover is 47M. The pool isn’t particularly thick; in a liquidity-thin environment, this kind of OI spike can get amplified easily. If you’re chasing at higher levels, watch out for the reflexivity after leverage stacks—don’t catch the last baton.
First, see whether this move can hold above the upper edge of the range.
$PTB This 15m candle has something to it.
A 5.37% surge isn’t that outrageous, but combined with a 2.92x volume and an OI anomaly at the 98.6 percentile, it’s not just a simple sentiment impulse. Open interest increased by 4.16% net over the last 1h, notional +1.01M. Price and OI are moving upward in sync—more like new leveraged long positions entering actively, not shorts getting squeezed.
The order book shows an 8% difference in active trades, the buy/sell ratio is 1.17, and the bid side has been steadily “biting.” The closing price directly breaks above the upper edge of the past ~20 five-minute range, touching the recent price boundary.
The anomaly across the whole pool ranks #6, notional change is #39, and the depth confirmation is also passed—so the volume is higher than normal. It doesn’t feel like a fakeout.
In the last 24h, turnover is 47M. The pool isn’t particularly thick; in a liquidity-thin environment, this kind of OI spike can get amplified easily. If you’re chasing at higher levels, watch out for the reflexivity after leverage stacks—don’t catch the last baton.
First, see whether this move can hold above the upper edge of the range.
A 5.37% surge isn’t that outrageous, but combined with a 2.92x volume and an OI anomaly at the 98.6 percentile, it’s not just a simple sentiment impulse. Open interest increased by 4.16% net over the last 1h, notional +1.01M. Price and OI are moving upward in sync—more like new leveraged long positions entering actively, not shorts getting squeezed.
The order book shows an 8% difference in active trades, the buy/sell ratio is 1.17, and the bid side has been steadily “biting.” The closing price directly breaks above the upper edge of the past ~20 five-minute range, touching the recent price boundary.
The anomaly across the whole pool ranks #6, notional change is #39, and the depth confirmation is also passed—so the volume is higher than normal. It doesn’t feel like a fakeout.
In the last 24h, turnover is 47M. The pool isn’t particularly thick; in a liquidity-thin environment, this kind of OI spike can get amplified easily. If you’re chasing at higher levels, watch out for the reflexivity after leverage stacks—don’t catch the last baton.
First, see whether this move can hold above the upper edge of the range.
46
·
--
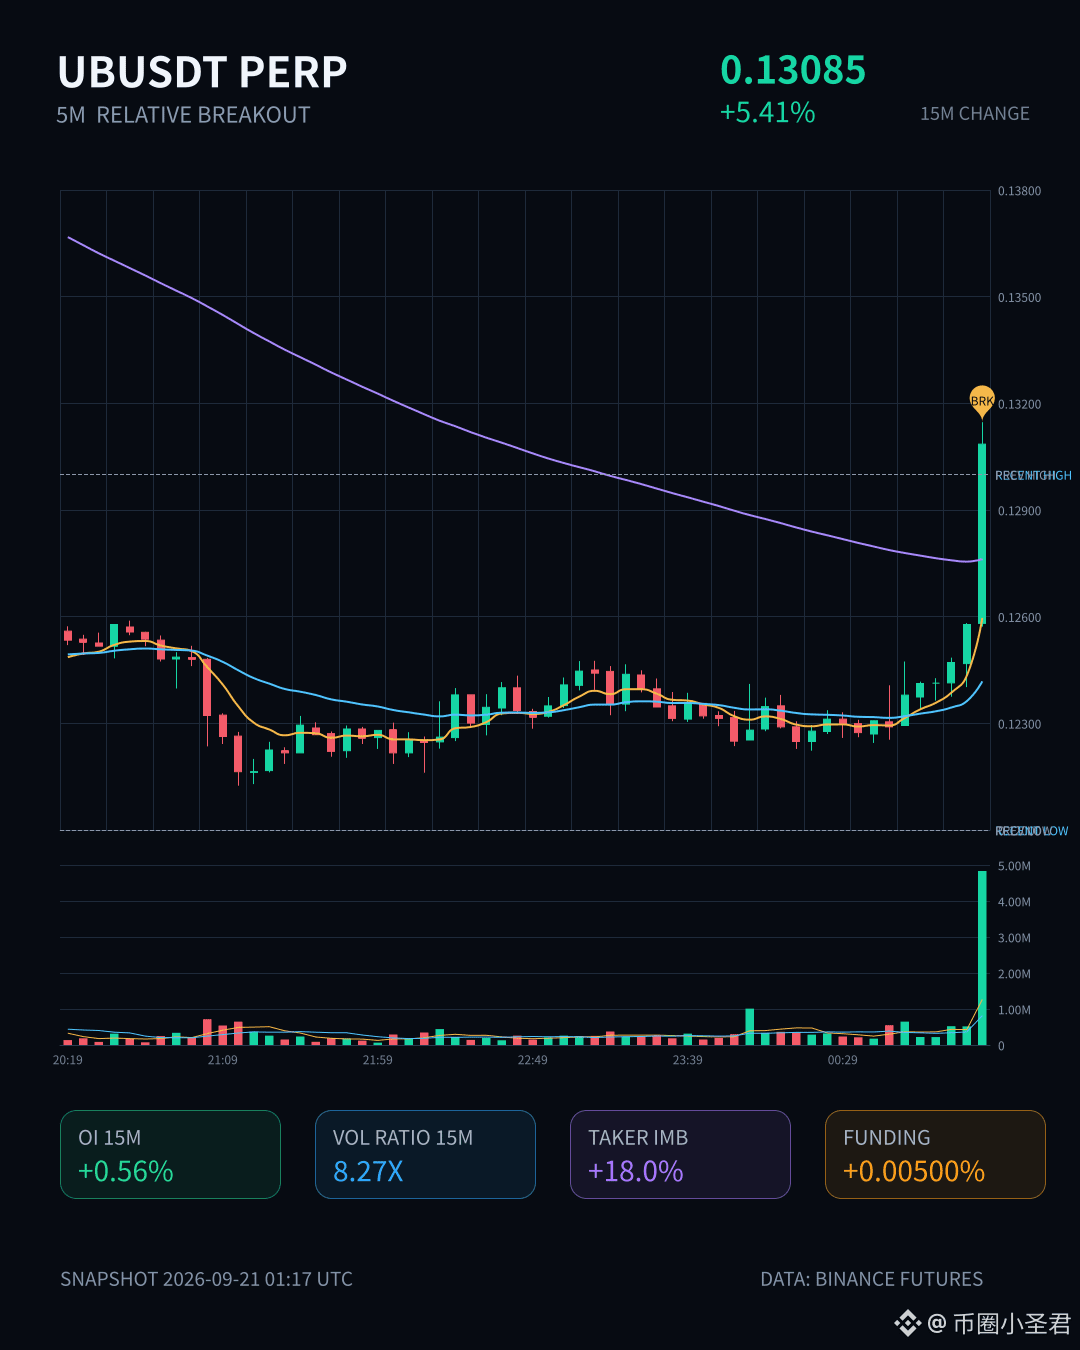
$UB These 15 minutes have something going on: a 5.41% surge paired with more than 8x the volume—straight up breaking through the upper edge of nearly 20 consecutive 5m candles. The proactive buy-side accounts for 18% of the gap; the buy/sell ratio is 1.44. Clearly, someone is actively pushing upward. OI is rising in sync: in 1h it’s up 0.78%, with a notional 254K entering—this isn’t that fake “short covering” stuff; it looks more like new long positions adding leverage. Funding rate is already at one of the highest percentiles recently, and the OI percentile is at an extreme 95.2%, ranking #6 across the whole pool—close to its historical extreme zone. In plain words: the car’s getting a bit heavy here. I wouldn’t chase the first wave at this position. Wait for a pullback to see how well it holds. If the volume can’t keep up, the funding rate will eventually bite back. If you have positions, hold tight; if you don’t, don’t FOMO.
$UB These 15 minutes have something going on: a 5.41% surge paired with more than 8x the volume—straight up breaking through the upper edge of nearly 20 consecutive 5m candles. The proactive buy-side accounts for 18% of the gap; the buy/sell ratio is 1.44. Clearly, someone is actively pushing upward. OI is rising in sync: in 1h it’s up 0.78%, with a notional 254K entering—this isn’t that fake “short covering” stuff; it looks more like new long positions adding leverage. Funding rate is already at one of the highest percentiles recently, and the OI percentile is at an extreme 95.2%, ranking #6 across the whole pool—close to its historical extreme zone. In plain words: the car’s getting a bit heavy here. I wouldn’t chase the first wave at this position. Wait for a pullback to see how well it holds. If the volume can’t keep up, the funding rate will eventually bite back. If you have positions, hold tight; if you don’t, don’t FOMO.
54
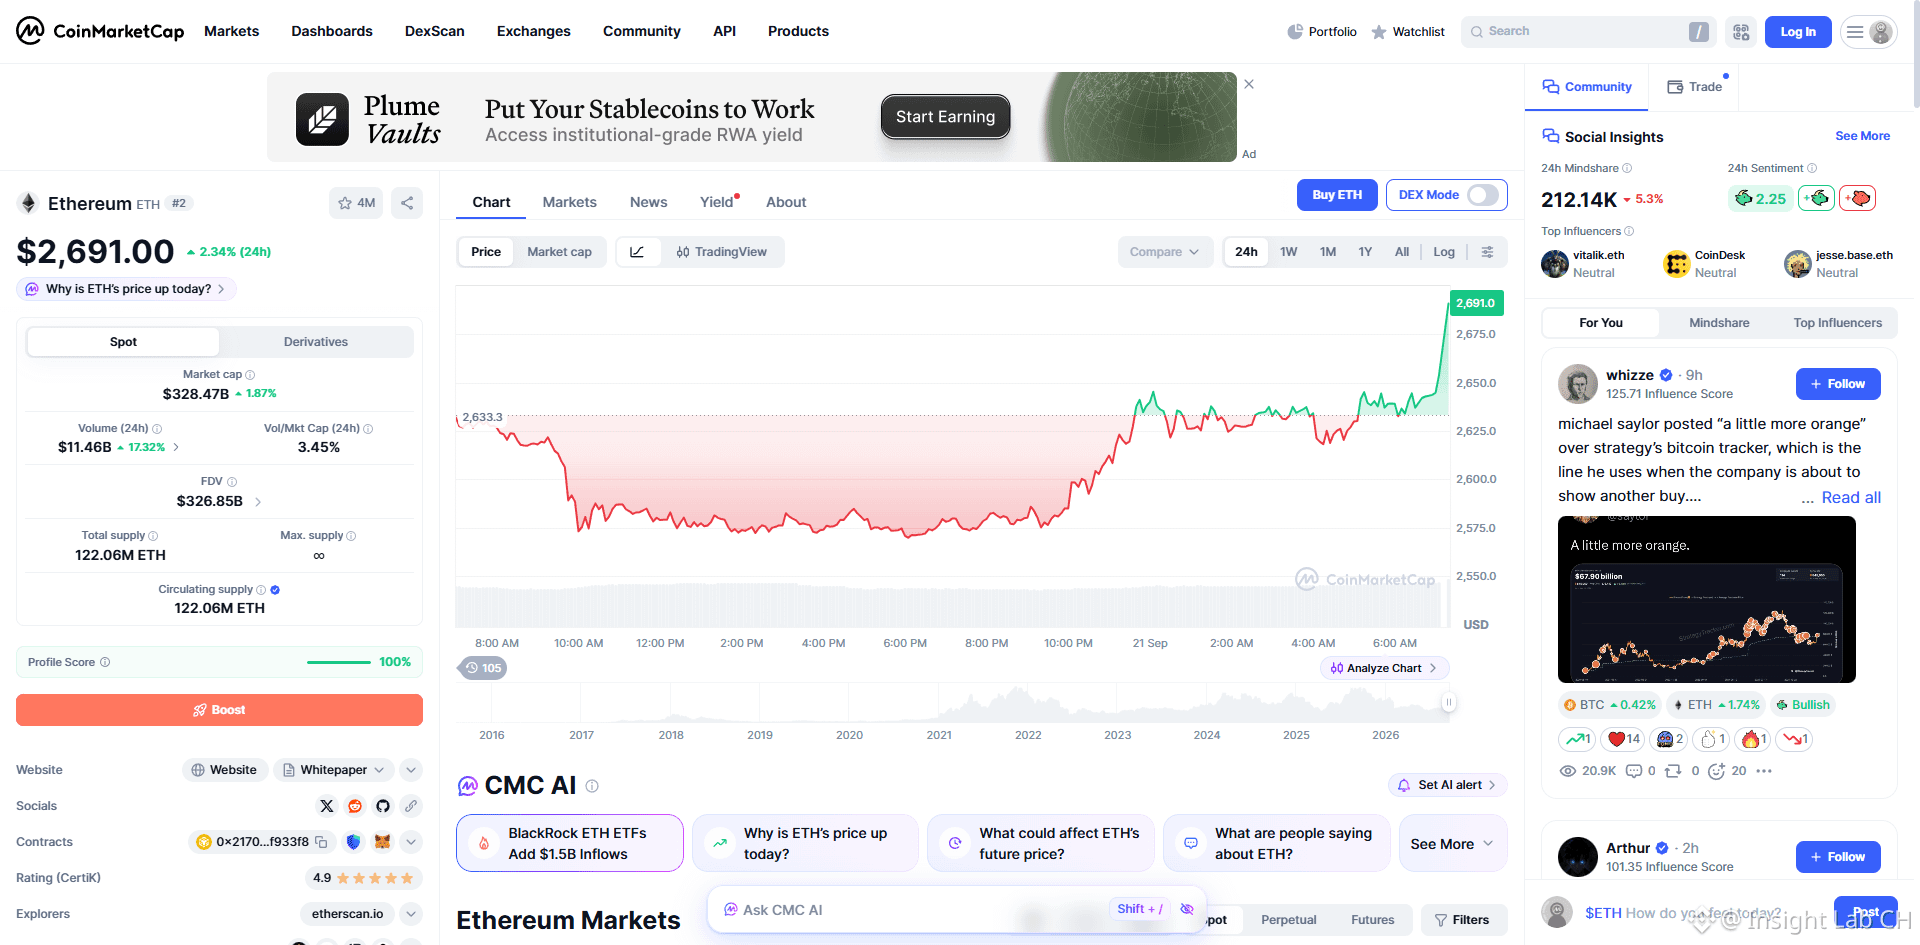
It has been observed that $ETH is currently ranked #6 on the CoinMarketCap trend chart. Against the backdrop of tightening macro liquidity and persistently high interest rates, there are still significant uncertainties regarding how long funds will continue to chase risk assets; blindly following the trend may cause investors to overlook potential pullback pressure. Investors should closely watch for systemic liquidity risks brought about by fluctuations in macroeconomic policies.📉 #Ethereum #Layer1
It has been observed that $ETH is currently ranked #6 on the CoinMarketCap trend chart. Against the backdrop of tightening macro liquidity and persistently high interest rates, there are still significant uncertainties regarding how long funds will continue to chase risk assets; blindly following the trend may cause investors to overlook potential pullback pressure. Investors should closely watch for systemic liquidity risks brought about by fluctuations in macroeconomic policies.📉 #Ethereum #Layer1
600

·
--
$CAKE This 15m move has some interesting aspects—pushing the price up by 1.52% isn’t that outrageous, but the OI is rising in step. The 1h contract open interest is up 2.09%, 817K U in notional has come in, and the 15m timeframe adds another 527K. This clearly indicates new leveraged long positions are participating—it’s not just “short-covering” fire.
A few details: trading volume directly hits 4.55x the norm, the ratio of aggressive buy/sell is 1.97, and aggressive executions are down by 32.7%—the direction is very clear. Price also just closed by breaking above the upper bound of the past ~20 5m candles, stepping right on the edge of the recent range boundary. The funding rate has climbed to a high percentile recently; OI is at an abnormal percentile of 95.8%, ranking #6 across the whole pool.
Approaching its own historical extreme range, multiple consecutive periods have continued the move, with volume, price, and positioning all confirmed. The 24h turnover is only 46.97M—at this size, this kind of anomaly is worth keeping an eye on. Don’t rush to chase, but this structure rarely appears out of nowhere.
$CAKE This 15m move has some interesting aspects—pushing the price up by 1.52% isn’t that outrageous, but the OI is rising in step. The 1h contract open interest is up 2.09%, 817K U in notional has come in, and the 15m timeframe adds another 527K. This clearly indicates new leveraged long positions are participating—it’s not just “short-covering” fire.
A few details: trading volume directly hits 4.55x the norm, the ratio of aggressive buy/sell is 1.97, and aggressive executions are down by 32.7%—the direction is very clear. Price also just closed by breaking above the upper bound of the past ~20 5m candles, stepping right on the edge of the recent range boundary. The funding rate has climbed to a high percentile recently; OI is at an abnormal percentile of 95.8%, ranking #6 across the whole pool.
Approaching its own historical extreme range, multiple consecutive periods have continued the move, with volume, price, and positioning all confirmed. The 24h turnover is only 46.97M—at this size, this kind of anomaly is worth keeping an eye on. Don’t rush to chase, but this structure rarely appears out of nowhere.
A few details: trading volume directly hits 4.55x the norm, the ratio of aggressive buy/sell is 1.97, and aggressive executions are down by 32.7%—the direction is very clear. Price also just closed by breaking above the upper bound of the past ~20 5m candles, stepping right on the edge of the recent range boundary. The funding rate has climbed to a high percentile recently; OI is at an abnormal percentile of 95.8%, ranking #6 across the whole pool.
Approaching its own historical extreme range, multiple consecutive periods have continued the move, with volume, price, and positioning all confirmed. The 24h turnover is only 46.97M—at this size, this kind of anomaly is worth keeping an eye on. Don’t rush to chase, but this structure rarely appears out of nowhere.
46
·
--
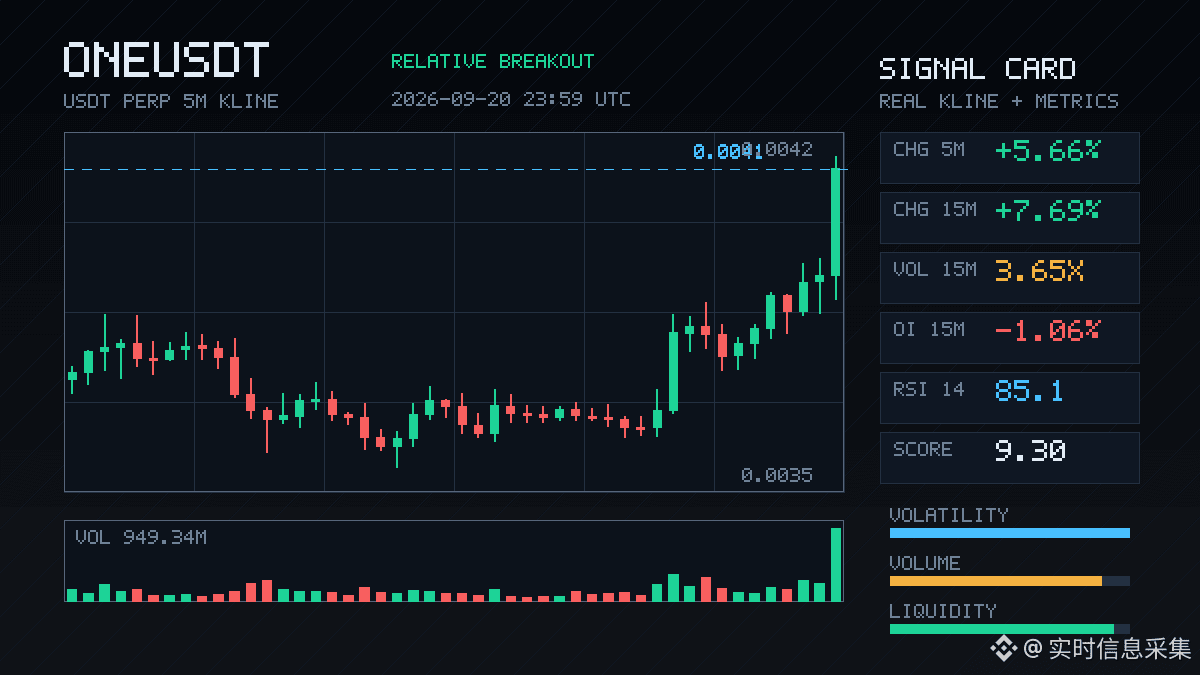
$ONE This move in the 15m timeframe is up 7.69%. Volume surged directly to 3.65x, with a Z-value of 3.99—typical abnormal activity.
But here’s what’s interesting: OI is falling—15m -1.06%, 1h -1.04%. As price moves up, the contract open interest actually decreases. This structure is very likely short-covering pushing prices higher, not fresh long entries. The buy/sell ratio is 1.21, and the trade gap is 9.5%. Buyers are definitely absorbing, but it feels more like a squeeze than genuine new longs.
The close has already broken above the upper band of the last 20 consecutive 5m candles. In the past 24h, turnover is 616 million, and the depth is sufficient. The anomaly for the whole pool ranks #7, with nominal change #6—this isn’t small-scale.
In this kind of short-covering move, chasing higher needs caution. Once the shorts are fully covered, the momentum could quickly run out. Let’s see whether it can hold above the upper band first.
$ONE This move in the 15m timeframe is up 7.69%. Volume surged directly to 3.65x, with a Z-value of 3.99—typical abnormal activity.
But here’s what’s interesting: OI is falling—15m -1.06%, 1h -1.04%. As price moves up, the contract open interest actually decreases. This structure is very likely short-covering pushing prices higher, not fresh long entries. The buy/sell ratio is 1.21, and the trade gap is 9.5%. Buyers are definitely absorbing, but it feels more like a squeeze than genuine new longs.
The close has already broken above the upper band of the last 20 consecutive 5m candles. In the past 24h, turnover is 616 million, and the depth is sufficient. The anomaly for the whole pool ranks #7, with nominal change #6—this isn’t small-scale.
In this kind of short-covering move, chasing higher needs caution. Once the shorts are fully covered, the momentum could quickly run out. Let’s see whether it can hold above the upper band first.
But here’s what’s interesting: OI is falling—15m -1.06%, 1h -1.04%. As price moves up, the contract open interest actually decreases. This structure is very likely short-covering pushing prices higher, not fresh long entries. The buy/sell ratio is 1.21, and the trade gap is 9.5%. Buyers are definitely absorbing, but it feels more like a squeeze than genuine new longs.
The close has already broken above the upper band of the last 20 consecutive 5m candles. In the past 24h, turnover is 616 million, and the depth is sufficient. The anomaly for the whole pool ranks #7, with nominal change #6—this isn’t small-scale.
In this kind of short-covering move, chasing higher needs caution. Once the shorts are fully covered, the momentum could quickly run out. Let’s see whether it can hold above the upper band first.
76
·
--
$LSK This pull-up is a bit interesting. In the 15m timeframe it’s up 2.89%; volume directly hit 2.64x, the volatility Z value is 3.39, and the price has just broken above the upper band of the recent ~20 5m K-bars.
But looking at OI is quite thought-provoking—on the 15m contract it’s -0.81%, and on the 1h it’s -1.90%. Price is rising while open interest is falling. This is the classic short covering pushing the price up, not fresh longs stepping in. The nominal change is still quite significant: on the 1h there’s 578K USDT, an abnormal percentile of 90.3%, and the whole pool’s abnormality ranks at #6.
The active trade imbalance is -4.4%; the buy/sell ratio is 1.09. Buys have a slight edge, but not aggressively so. Over 24h, the turnover is 124.71M, and the depth checks confirm it’s solid.
With this kind of structure, the short-term move could still try to push a bit further. But once the fuel from short covering runs out, it’s gone—chasing higher prices needs caution. Watch whether OI can turn positive; otherwise, it’s likely to follow a squeeze-then-pullback storyline.
$LSK This pull-up is a bit interesting. In the 15m timeframe it’s up 2.89%; volume directly hit 2.64x, the volatility Z value is 3.39, and the price has just broken above the upper band of the recent ~20 5m K-bars.
But looking at OI is quite thought-provoking—on the 15m contract it’s -0.81%, and on the 1h it’s -1.90%. Price is rising while open interest is falling. This is the classic short covering pushing the price up, not fresh longs stepping in. The nominal change is still quite significant: on the 1h there’s 578K USDT, an abnormal percentile of 90.3%, and the whole pool’s abnormality ranks at #6.
The active trade imbalance is -4.4%; the buy/sell ratio is 1.09. Buys have a slight edge, but not aggressively so. Over 24h, the turnover is 124.71M, and the depth checks confirm it’s solid.
With this kind of structure, the short-term move could still try to push a bit further. But once the fuel from short covering runs out, it’s gone—chasing higher prices needs caution. Watch whether OI can turn positive; otherwise, it’s likely to follow a squeeze-then-pullback storyline.
But looking at OI is quite thought-provoking—on the 15m contract it’s -0.81%, and on the 1h it’s -1.90%. Price is rising while open interest is falling. This is the classic short covering pushing the price up, not fresh longs stepping in. The nominal change is still quite significant: on the 1h there’s 578K USDT, an abnormal percentile of 90.3%, and the whole pool’s abnormality ranks at #6.
The active trade imbalance is -4.4%; the buy/sell ratio is 1.09. Buys have a slight edge, but not aggressively so. Over 24h, the turnover is 124.71M, and the depth checks confirm it’s solid.
With this kind of structure, the short-term move could still try to push a bit further. But once the fuel from short covering runs out, it’s gone—chasing higher prices needs caution. Watch whether OI can turn positive; otherwise, it’s likely to follow a squeeze-then-pullback storyline.
17

Article
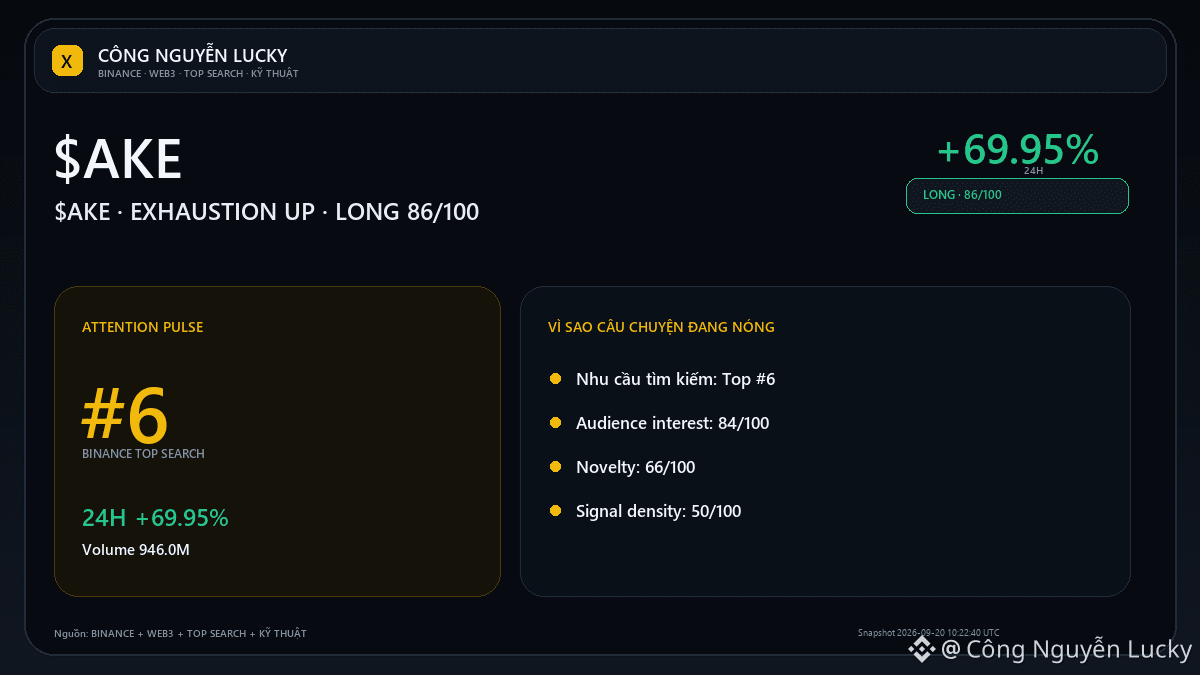
$AKE +69.95%: what data confirms this strong run?🔥 $AKE đang +69.95% — but the percent increase/decrease isn't enough to call this a good setup yet. Snapshot: 0.110389 · 24h +69.95% · volume ~946.0M USDT · 15,693,607 trades. 🟢 Bull/continuation case: Breaking 0.125513 with expanded open volume would make the continuation scenario more credible.
🔴 Bear/cooling case: Not holding the high zone and dropping back below the midpoint 0.0899145 would make the cooling scenario more evident. 🧭 Current outlook: **LONG · STRONG · 86/100**.
$AKE +69.95%: what data confirms this strong run?
🔥 $AKE đang +69.95% — but the percent increase/decrease isn't enough to call this a good setup yet. Snapshot: 0.110389 · 24h +69.95% · volume ~946.0M USDT · 15,693,607 trades. 🟢 Bull/continuation case: Breaking 0.125513 with expanded open volume would make the continuation scenario more credible.
🔴 Bear/cooling case: Not holding the high zone and dropping back below the midpoint 0.0899145 would make the cooling scenario more evident. 🧭 Current outlook: **LONG · STRONG · 86/100**.
🔴 Bear/cooling case: Not holding the high zone and dropping back below the midpoint 0.0899145 would make the cooling scenario more evident. 🧭 Current outlook: **LONG · STRONG · 86/100**.
20
·
--
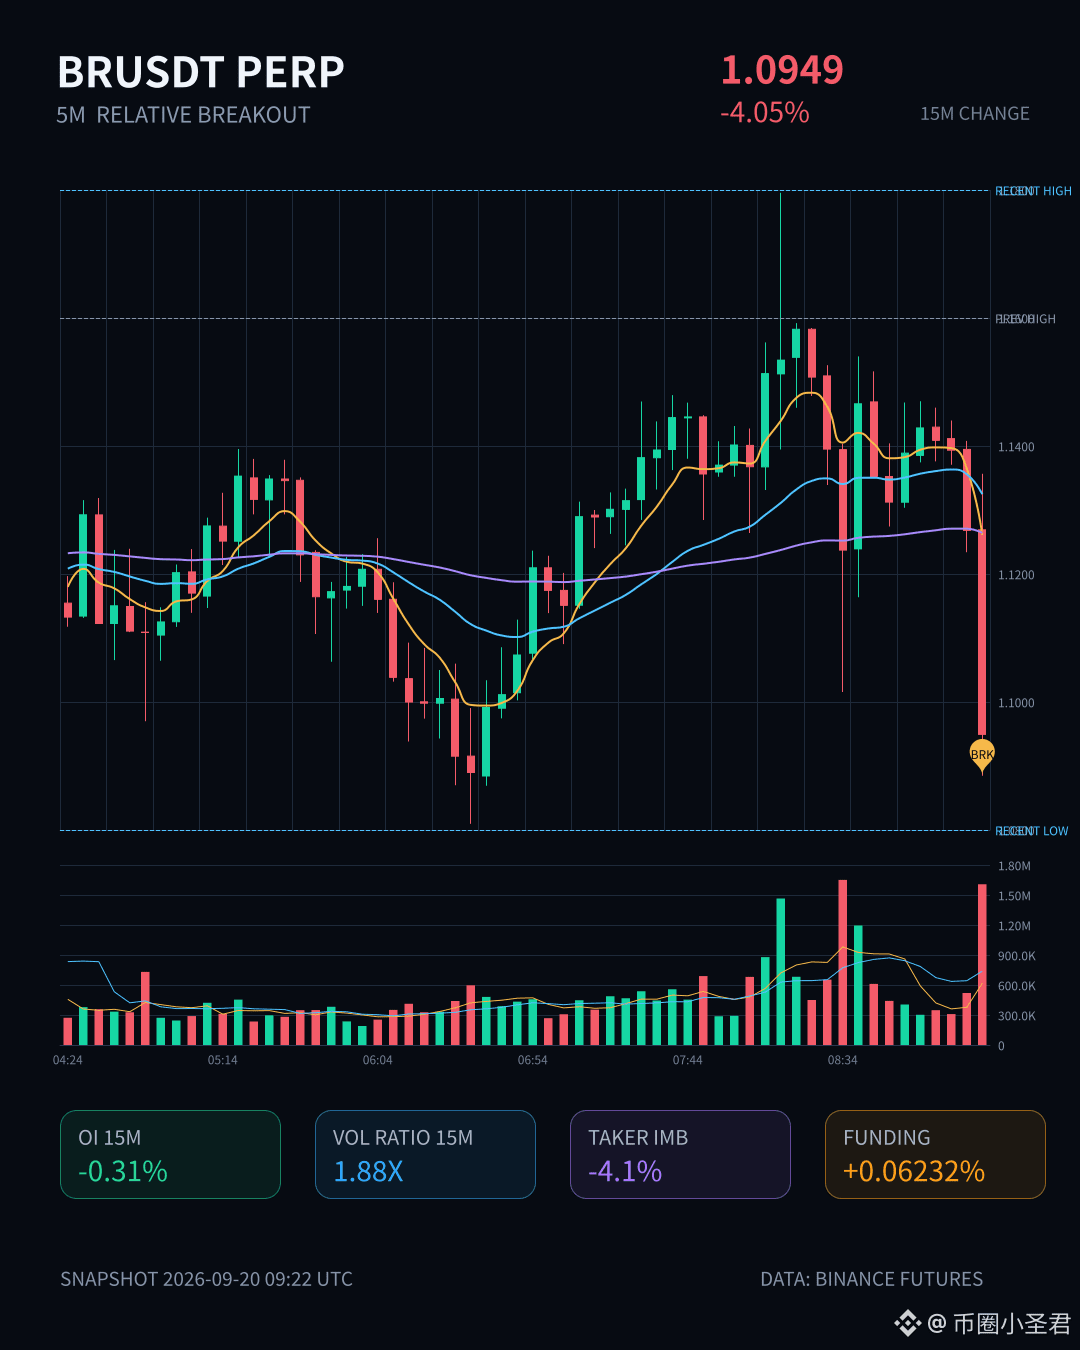
$BR This drop was pretty decisive—on the 15m chart it’s directly -4.05%, volume has spiked to 1.88x, the Z-value is 3.84. This isn’t ordinary volatility anymore.
The close broke below the lower edge of the recent 20-odd 5m range. Active trade imbalance is -4.1%, the buy/sell ratio is 0.92. Selling pressure is real, but OI is also falling—15m -0.31%, 1h -0.37%, and the notional has shrunk by nearly 4M. When price drops while OI declines, it looks more like longs are deleveraging, getting stopped out, or reducing positions—not like a brand-new wave of shorts is massively pressing in.
In the extreme percentile of 95.8%, Pool #6, notional change #3. It tagged the boundary of the recent range and volume confirmed it—this kind of spot is very likely to trigger follow-through orders. In the past 24h, turnover is still 392M, so liquidity isn’t lacking, but the short-term direction has already tilted.
First, see whether this can hold and stop the move. If OI keeps shrinking and price doesn’t rebound, there may be a second wave of deleveraging. Don’t rush to buy the dip—wait until the structure stabilizes.
$BR This drop was pretty decisive—on the 15m chart it’s directly -4.05%, volume has spiked to 1.88x, the Z-value is 3.84. This isn’t ordinary volatility anymore.
The close broke below the lower edge of the recent 20-odd 5m range. Active trade imbalance is -4.1%, the buy/sell ratio is 0.92. Selling pressure is real, but OI is also falling—15m -0.31%, 1h -0.37%, and the notional has shrunk by nearly 4M. When price drops while OI declines, it looks more like longs are deleveraging, getting stopped out, or reducing positions—not like a brand-new wave of shorts is massively pressing in.
In the extreme percentile of 95.8%, Pool #6, notional change #3. It tagged the boundary of the recent range and volume confirmed it—this kind of spot is very likely to trigger follow-through orders. In the past 24h, turnover is still 392M, so liquidity isn’t lacking, but the short-term direction has already tilted.
First, see whether this can hold and stop the move. If OI keeps shrinking and price doesn’t rebound, there may be a second wave of deleveraging. Don’t rush to buy the dip—wait until the structure stabilizes.
The close broke below the lower edge of the recent 20-odd 5m range. Active trade imbalance is -4.1%, the buy/sell ratio is 0.92. Selling pressure is real, but OI is also falling—15m -0.31%, 1h -0.37%, and the notional has shrunk by nearly 4M. When price drops while OI declines, it looks more like longs are deleveraging, getting stopped out, or reducing positions—not like a brand-new wave of shorts is massively pressing in.
In the extreme percentile of 95.8%, Pool #6, notional change #3. It tagged the boundary of the recent range and volume confirmed it—this kind of spot is very likely to trigger follow-through orders. In the past 24h, turnover is still 392M, so liquidity isn’t lacking, but the short-term direction has already tilted.
First, see whether this can hold and stop the move. If OI keeps shrinking and price doesn’t rebound, there may be a second wave of deleveraging. Don’t rush to buy the dip—wait until the structure stabilizes.
14
·
--
$STRK This 15m move is pretty brutal, down -5.14%. The volume went straight to 4.68 times the usual level, with volatility Z at 3.60. This isn’t a slow bleed—it’s a heavy selloff with volume.
What’s interesting is the OI: the 15m contract is -3.22%, notional -1.30M, while in 1h it’s only -0.05%. This looks like the classic drop + position reduction combo—very much the feel of longs deleveraging, taking stop-losses, and cutting exposure. It’s not that fresh shorts just came in and pressured it; it’s that the old longs couldn’t hold on and got flushed out.
Price closed below the lower edge of the recent ~20 five-minute range. Active traded volume is -16.9%, the buy/sell ratio is 0.71, and sell pressure is clearly leaning to one side. Funding rate is still in the higher percentile recently too—this spot was already crowded.
OI abnormal percentile is 99.2%, full-pool abnormal #2, notional change #6—plainly put, on-chain data is also signaling this is an extreme point. 24h trading volume is 96.64M, and depth confirmation is solid.
Now it depends on whether this deleveraging wave is truly cleaned up, or if it’s just the first round. In this kind of structure, trying to catch a rebound often gets buried—wait for the volume to shrink before judging.
$STRK This 15m move is pretty brutal, down -5.14%. The volume went straight to 4.68 times the usual level, with volatility Z at 3.60. This isn’t a slow bleed—it’s a heavy selloff with volume.
What’s interesting is the OI: the 15m contract is -3.22%, notional -1.30M, while in 1h it’s only -0.05%. This looks like the classic drop + position reduction combo—very much the feel of longs deleveraging, taking stop-losses, and cutting exposure. It’s not that fresh shorts just came in and pressured it; it’s that the old longs couldn’t hold on and got flushed out.
Price closed below the lower edge of the recent ~20 five-minute range. Active traded volume is -16.9%, the buy/sell ratio is 0.71, and sell pressure is clearly leaning to one side. Funding rate is still in the higher percentile recently too—this spot was already crowded.
OI abnormal percentile is 99.2%, full-pool abnormal #2, notional change #6—plainly put, on-chain data is also signaling this is an extreme point. 24h trading volume is 96.64M, and depth confirmation is solid.
Now it depends on whether this deleveraging wave is truly cleaned up, or if it’s just the first round. In this kind of structure, trying to catch a rebound often gets buried—wait for the volume to shrink before judging.
What’s interesting is the OI: the 15m contract is -3.22%, notional -1.30M, while in 1h it’s only -0.05%. This looks like the classic drop + position reduction combo—very much the feel of longs deleveraging, taking stop-losses, and cutting exposure. It’s not that fresh shorts just came in and pressured it; it’s that the old longs couldn’t hold on and got flushed out.
Price closed below the lower edge of the recent ~20 five-minute range. Active traded volume is -16.9%, the buy/sell ratio is 0.71, and sell pressure is clearly leaning to one side. Funding rate is still in the higher percentile recently too—this spot was already crowded.
OI abnormal percentile is 99.2%, full-pool abnormal #2, notional change #6—plainly put, on-chain data is also signaling this is an extreme point. 24h trading volume is 96.64M, and depth confirmation is solid.
Now it depends on whether this deleveraging wave is truly cleaned up, or if it’s just the first round. In this kind of structure, trying to catch a rebound often gets buried—wait for the volume to shrink before judging.
8
·
--
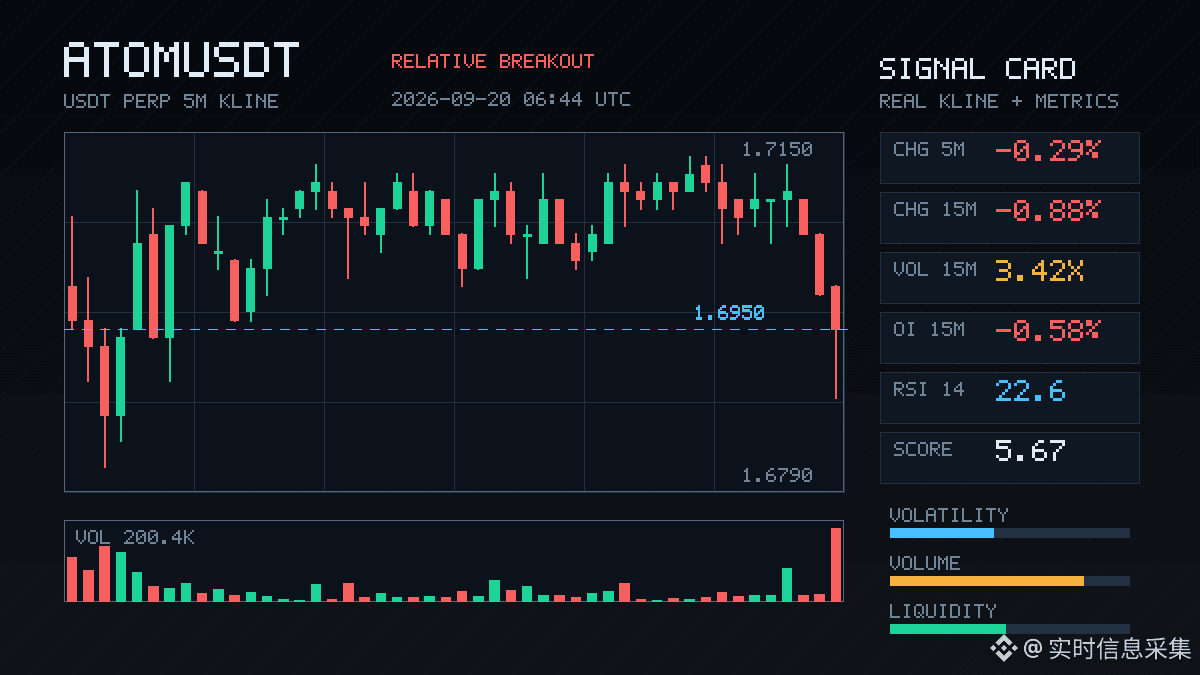
$ATOM This one is kind of interesting.
The price is down 0.88%, but the OI is contracting. In the 15m timeframe, the notional fell by 332K; in the 1h timeframe, it dropped by 259K. This isn’t fresh shorts entering—it’s leverage pulling out. The active trade volume difference is -51.8%, the buy/sell ratio is 0.32. Sell pressure is real, but it looks more like long liquidation or passive position reduction.
On 15m, the volume is 3.42x. The close breaks below the lower edge of the recent 20 5m range. The OI percentile is at an abnormal 96.4%. Whole pool #6—this is close to the historical extreme zone.
In the past 24h, turnover is 27.41M; liquidity depth is sufficient.
With this kind of structure, a drop isn’t necessarily a bad thing. Leverage clearing out is stronger than stubbornly holding. The key is whether the subsequent OI can stabilize—don’t have OI continue to fall while price keeps dropping; that would mean nobody is taking the other side.
$ATOM This one is kind of interesting.
The price is down 0.88%, but the OI is contracting. In the 15m timeframe, the notional fell by 332K; in the 1h timeframe, it dropped by 259K. This isn’t fresh shorts entering—it’s leverage pulling out. The active trade volume difference is -51.8%, the buy/sell ratio is 0.32. Sell pressure is real, but it looks more like long liquidation or passive position reduction.
On 15m, the volume is 3.42x. The close breaks below the lower edge of the recent 20 5m range. The OI percentile is at an abnormal 96.4%. Whole pool #6—this is close to the historical extreme zone.
In the past 24h, turnover is 27.41M; liquidity depth is sufficient.
With this kind of structure, a drop isn’t necessarily a bad thing. Leverage clearing out is stronger than stubbornly holding. The key is whether the subsequent OI can stabilize—don’t have OI continue to fall while price keeps dropping; that would mean nobody is taking the other side.
The price is down 0.88%, but the OI is contracting. In the 15m timeframe, the notional fell by 332K; in the 1h timeframe, it dropped by 259K. This isn’t fresh shorts entering—it’s leverage pulling out. The active trade volume difference is -51.8%, the buy/sell ratio is 0.32. Sell pressure is real, but it looks more like long liquidation or passive position reduction.
On 15m, the volume is 3.42x. The close breaks below the lower edge of the recent 20 5m range. The OI percentile is at an abnormal 96.4%. Whole pool #6—this is close to the historical extreme zone.
In the past 24h, turnover is 27.41M; liquidity depth is sufficient.
With this kind of structure, a drop isn’t necessarily a bad thing. Leverage clearing out is stronger than stubbornly holding. The key is whether the subsequent OI can stabilize—don’t have OI continue to fall while price keeps dropping; that would mean nobody is taking the other side.
7
·
--
$INJ This one hits a bit hard.
On the 15m, just went straight in—up 2.82%, volume up to 2.99x, aggressive成交(taker)比 -33.9%, buy/sell ratio 0.49—sell orders are being dumped aggressively, not posted to scare people.
The key is that OI is dropping together. 15m contract -2.67%, 1h -3.42%, notional shrank by nearly 3.75M. Price is down + positions are being reduced. This isn’t new shorts entering—it’s longs deleveraging, cutting losses, and shrinking their exposure. Anomalous percentile is 98.8%, whole pool #6. This level of contraction hasn’t been common recently.
The close has already broken below the lower band of the last ~20 5m candles. 24h turnover is still 181M—liquidity hasn’t fled, but the direction is very clear.
Personally, I wouldn’t rush to pick it up here. When OI is still falling, the bottom often can’t be probed out by just one K line. Wait for positions to stabilize a bit, then see whether anyone is willing to go long in the extreme zone—this is more reliable than trying to guess the bottom right now.
$INJ
$INJ This one hits a bit hard.
On the 15m, just went straight in—up 2.82%, volume up to 2.99x, aggressive成交(taker)比 -33.9%, buy/sell ratio 0.49—sell orders are being dumped aggressively, not posted to scare people.
The key is that OI is dropping together. 15m contract -2.67%, 1h -3.42%, notional shrank by nearly 3.75M. Price is down + positions are being reduced. This isn’t new shorts entering—it’s longs deleveraging, cutting losses, and shrinking their exposure. Anomalous percentile is 98.8%, whole pool #6. This level of contraction hasn’t been common recently.
The close has already broken below the lower band of the last ~20 5m candles. 24h turnover is still 181M—liquidity hasn’t fled, but the direction is very clear.
Personally, I wouldn’t rush to pick it up here. When OI is still falling, the bottom often can’t be probed out by just one K line. Wait for positions to stabilize a bit, then see whether anyone is willing to go long in the extreme zone—this is more reliable than trying to guess the bottom right now.
$INJ
On the 15m, just went straight in—up 2.82%, volume up to 2.99x, aggressive成交(taker)比 -33.9%, buy/sell ratio 0.49—sell orders are being dumped aggressively, not posted to scare people.
The key is that OI is dropping together. 15m contract -2.67%, 1h -3.42%, notional shrank by nearly 3.75M. Price is down + positions are being reduced. This isn’t new shorts entering—it’s longs deleveraging, cutting losses, and shrinking their exposure. Anomalous percentile is 98.8%, whole pool #6. This level of contraction hasn’t been common recently.
The close has already broken below the lower band of the last ~20 5m candles. 24h turnover is still 181M—liquidity hasn’t fled, but the direction is very clear.
Personally, I wouldn’t rush to pick it up here. When OI is still falling, the bottom often can’t be probed out by just one K line. Wait for positions to stabilize a bit, then see whether anyone is willing to go long in the extreme zone—this is more reliable than trying to guess the bottom right now.
$INJ
9

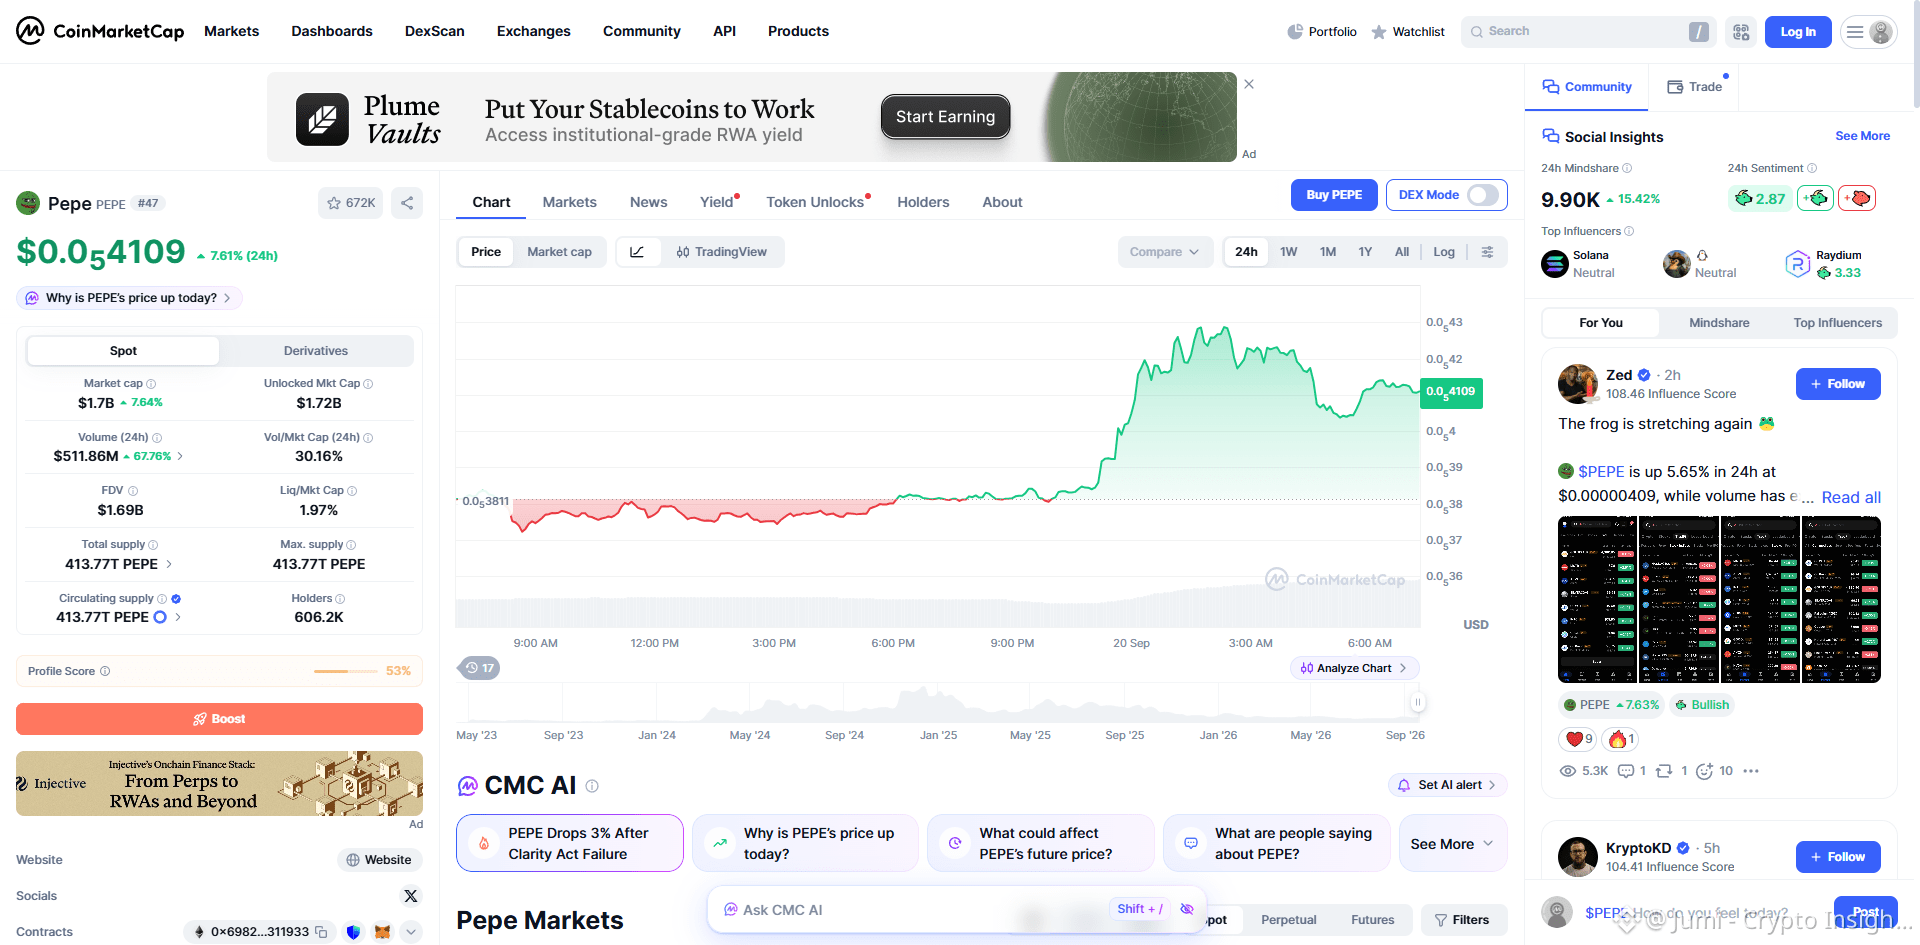
Data shows that $PEPE is currently ranked #6 on the CoinMarketCap trend chart. Technically, in the short term the moving averages display a bullish divergence, with volume and price in healthy alignment, and continuous capital inflow provides sufficient momentum for a breakout above the key resistance zone. If it can effectively hold the support, the market in the future may see further upside rally.📈 #PEPE #Memecoin
Data shows that $PEPE is currently ranked #6 on the CoinMarketCap trend chart. Technically, in the short term the moving averages display a bullish divergence, with volume and price in healthy alignment, and continuous capital inflow provides sufficient momentum for a breakout above the key resistance zone. If it can effectively hold the support, the market in the future may see further upside rally.📈 #PEPE #Memecoin
218
·
--
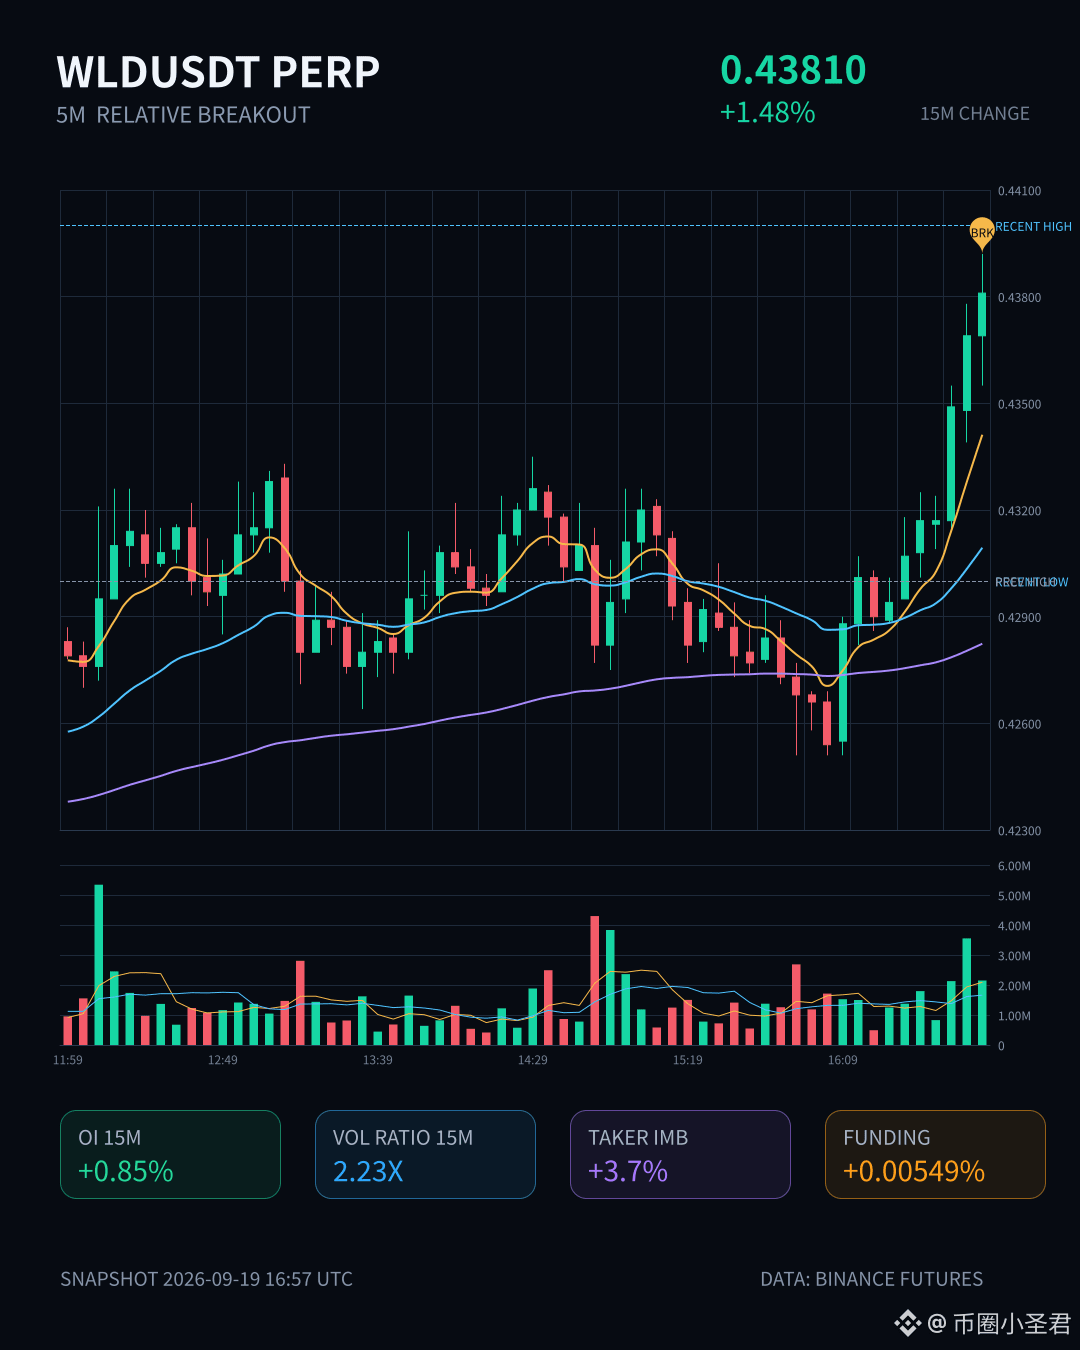
$WLD This is something.
In 15m, it directly surged up 1.48%, with volume reaching 2.23x, and a Z value of 3.22—this isn’t a slow, lukewarm grind; it’s a volume-backed anomaly. The closing price broke through the upper edge of the last ~20 5m K lines, with an active trade spread difference of +3.7%, buy/sell ratio at 1.08, and the bids are pushing.
What’s even more worth watching is OI. 15m +0.85%, 1h +1.12%, and the nominal changes add up to nearly 5M USDT. The key is that the OI anomaly percentile hit 97.6%: overall pool anomaly rank #6, nominal change rank #4—this isn’t an isolated signal. It’s been continuing across multiple consecutive cycles. Price is rising alongside OI, forming a typical incremental-leverage long-entry structure, not some “short covering” kind of hollow move.
24h trading value is 226M, and the depth has confirmed it. WLD itself is also near the historical extreme range. A relative breakout from this position—if it continues—won’t have small upside elasticity.
Of course, when leveraged longs gather, it also means reverse pin-pricks will hurt a lot. I’m watching—won’t chase the price. I’ll wait for a pullback and confirmation.
$WLD This is something.
In 15m, it directly surged up 1.48%, with volume reaching 2.23x, and a Z value of 3.22—this isn’t a slow, lukewarm grind; it’s a volume-backed anomaly. The closing price broke through the upper edge of the last ~20 5m K lines, with an active trade spread difference of +3.7%, buy/sell ratio at 1.08, and the bids are pushing.
What’s even more worth watching is OI. 15m +0.85%, 1h +1.12%, and the nominal changes add up to nearly 5M USDT. The key is that the OI anomaly percentile hit 97.6%: overall pool anomaly rank #6, nominal change rank #4—this isn’t an isolated signal. It’s been continuing across multiple consecutive cycles. Price is rising alongside OI, forming a typical incremental-leverage long-entry structure, not some “short covering” kind of hollow move.
24h trading value is 226M, and the depth has confirmed it. WLD itself is also near the historical extreme range. A relative breakout from this position—if it continues—won’t have small upside elasticity.
Of course, when leveraged longs gather, it also means reverse pin-pricks will hurt a lot. I’m watching—won’t chase the price. I’ll wait for a pullback and confirmation.
In 15m, it directly surged up 1.48%, with volume reaching 2.23x, and a Z value of 3.22—this isn’t a slow, lukewarm grind; it’s a volume-backed anomaly. The closing price broke through the upper edge of the last ~20 5m K lines, with an active trade spread difference of +3.7%, buy/sell ratio at 1.08, and the bids are pushing.
What’s even more worth watching is OI. 15m +0.85%, 1h +1.12%, and the nominal changes add up to nearly 5M USDT. The key is that the OI anomaly percentile hit 97.6%: overall pool anomaly rank #6, nominal change rank #4—this isn’t an isolated signal. It’s been continuing across multiple consecutive cycles. Price is rising alongside OI, forming a typical incremental-leverage long-entry structure, not some “short covering” kind of hollow move.
24h trading value is 226M, and the depth has confirmed it. WLD itself is also near the historical extreme range. A relative breakout from this position—if it continues—won’t have small upside elasticity.
Of course, when leveraged longs gather, it also means reverse pin-pricks will hurt a lot. I’m watching—won’t chase the price. I’ll wait for a pullback and confirmation.
21
Log in to explore more content
Join global crypto users on Binance Square
⚡️ Get latest and useful information about crypto.
💬 Trusted by the world’s largest crypto exchange.
👍 Discover real insights from verified creators.
Email / Phone number
Trending Topics
1
#AIStocksWhatNext
88,755 views
1,130 Discussing
2
#BitcoinBreaksAboveMayHighNears$86K
899 views
29 Discussing
3
#DogecoinRises15%
2,837 views
149 Discussing
4
#$14BBitcoinOptionsExpireFriday
145 views
17 Discussing
5
#BNBMarketCapPassesBNYMellon
1,462 views
114 Discussing
6
#CryptoMarketCapReclaims$3Trillion
319 views
17 Discussing
7
#MuseOvertakesChatGPTAsTopFreeIOSApp
2,572 views
158 Discussing
8
#TokenizedStockPlatformsCouldLaunchNextQuarter
4,416 views
191 Discussing
9
#StrategyAdds950Bitcoin
7,462 views
259 Discussing
10
#CardanoAddedToX402KitForADAPayments
12,795 views
412 Discussing