
#dot
dot
20.7M views
29,699 Discussing
Hot
Latest


$DOT: DOT Volume Pulse: How It Stacks Against Peers
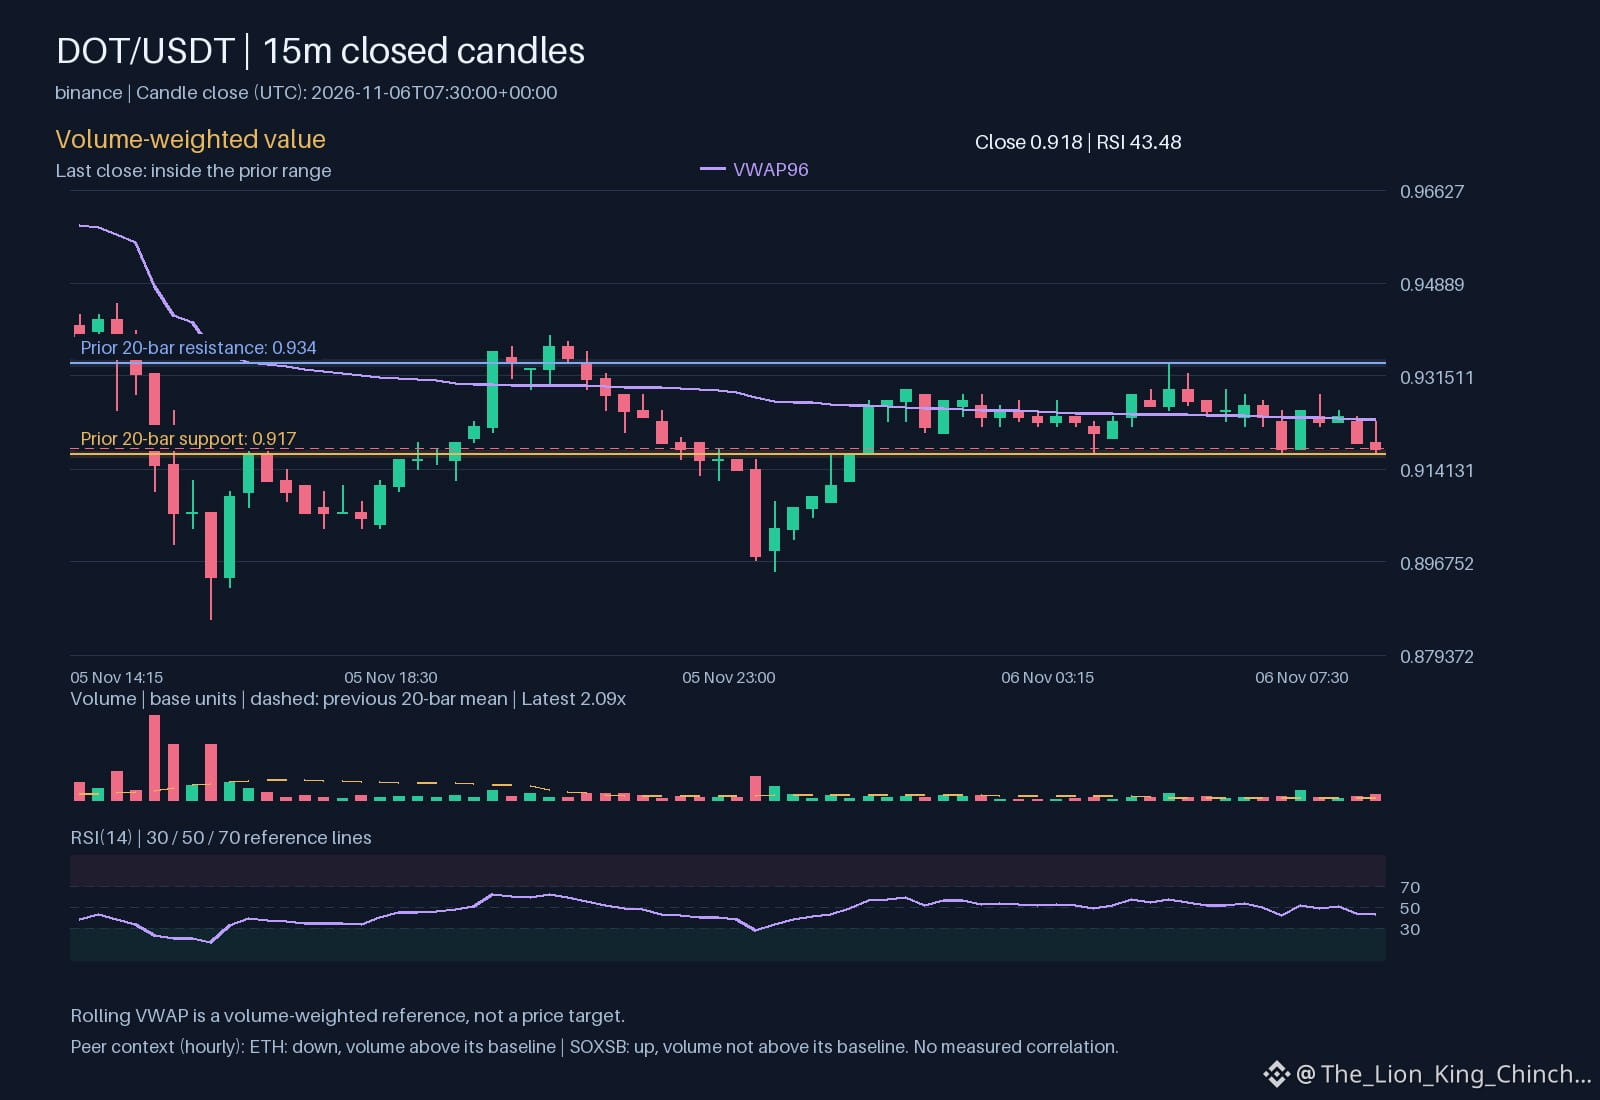
The primary asset $DOT shows an hourly direction down while its volume sits above baseline. This raises the question of whether the move’s persistence matters more than the direction itself.
A peer comparison helps frame the issue. $ETH (ETH) also trades down hourly, but its volume is above baseline, suggesting stronger participation behind the decline. By contrast, $SOXSB (SOXSB) moves up hourly with volume not above baseline, indicating a weaker push. The shared downward direction of $DOT and $ETH does not prove a common driver; the volume context differs.
Hourly price action can diverge even on the same exchange. For $DOT, the down candle closed inside the recorded range, limiting the immediate impact on support 0.917 and resistance 0.934 levels. In contrast, $ETH may break its range, expanding risk exposure. The volume disparity sets a ceiling on how far the price can move before liquidity constraints appear.
To reassess the interpretation, track the relative volume 2.08707 and watch if the down move holds above the VWAP 0.923328 for two consecutive hours. A sustained hold would hint that direction is reinforcing, while a quick reversal would shift focus back to volume strength. 😊
Probabilistic market research, not a recommendation or guaranteed return.
The comparison to keep in mind: $ETH has hourly direction down and volume above its baseline; $SOXSB has hourly direction up and volume not above its baseline. This alone does not establish correlation.
Which matters more in this comparison: direction or how the move holds?
#DOT #ETH
Binance spot proof for $DOT: closed price 0.918 USDT.
Source: binance. Closed candle: 2026-11-06T07:30:00+00:00.
$DOT : DOT Volume Pulse: How It Stacks Against Peers
The primary asset $DOT shows an hourly direction down while its volume sits above baseline. This raises the question of whether the move’s persistence matters more than the direction itself.
A peer comparison helps frame the issue. $ETH (ETH) also trades down hourly, but its volume is above baseline, suggesting stronger participation behind the decline. By contrast, $SOXSB (SOXSB) moves up hourly with volume not above baseline, indicating a weaker push. The shared downward direction of $DOT and $ETH does not prove a common driver; the volume context differs.
Hourly price action can diverge even on the same exchange. For $DOT , the down candle closed inside the recorded range, limiting the immediate impact on support 0.917 and resistance 0.934 levels. In contrast, $ETH may break its range, expanding risk exposure. The volume disparity sets a ceiling on how far the price can move before liquidity constraints appear.
To reassess the interpretation, track the relative volume 2.08707 and watch if the down move holds above the VWAP 0.923328 for two consecutive hours. A sustained hold would hint that direction is reinforcing, while a quick reversal would shift focus back to volume strength. 😊
Probabilistic market research, not a recommendation or guaranteed return.
The comparison to keep in mind: $ETH has hourly direction down and volume above its baseline; $SOXSB has hourly direction up and volume not above its baseline. This alone does not establish correlation.
Which matters more in this comparison: direction or how the move holds?
#DOT #ETH
Binance spot proof for $DOT : closed price 0.918 USDT.
Source: binance. Closed candle: 2026-11-06T07:30:00+00:00.
The primary asset $DOT shows an hourly direction down while its volume sits above baseline. This raises the question of whether the move’s persistence matters more than the direction itself.
A peer comparison helps frame the issue. $ETH (ETH) also trades down hourly, but its volume is above baseline, suggesting stronger participation behind the decline. By contrast, $SOXSB (SOXSB) moves up hourly with volume not above baseline, indicating a weaker push. The shared downward direction of $DOT and $ETH does not prove a common driver; the volume context differs.
Hourly price action can diverge even on the same exchange. For $DOT , the down candle closed inside the recorded range, limiting the immediate impact on support 0.917 and resistance 0.934 levels. In contrast, $ETH may break its range, expanding risk exposure. The volume disparity sets a ceiling on how far the price can move before liquidity constraints appear.
To reassess the interpretation, track the relative volume 2.08707 and watch if the down move holds above the VWAP 0.923328 for two consecutive hours. A sustained hold would hint that direction is reinforcing, while a quick reversal would shift focus back to volume strength. 😊
Probabilistic market research, not a recommendation or guaranteed return.
The comparison to keep in mind: $ETH has hourly direction down and volume above its baseline; $SOXSB has hourly direction up and volume not above its baseline. This alone does not establish correlation.
Which matters more in this comparison: direction or how the move holds?
#DOT #ETH
Binance spot proof for $DOT : closed price 0.918 USDT.
Source: binance. Closed candle: 2026-11-06T07:30:00+00:00.
37

·
--
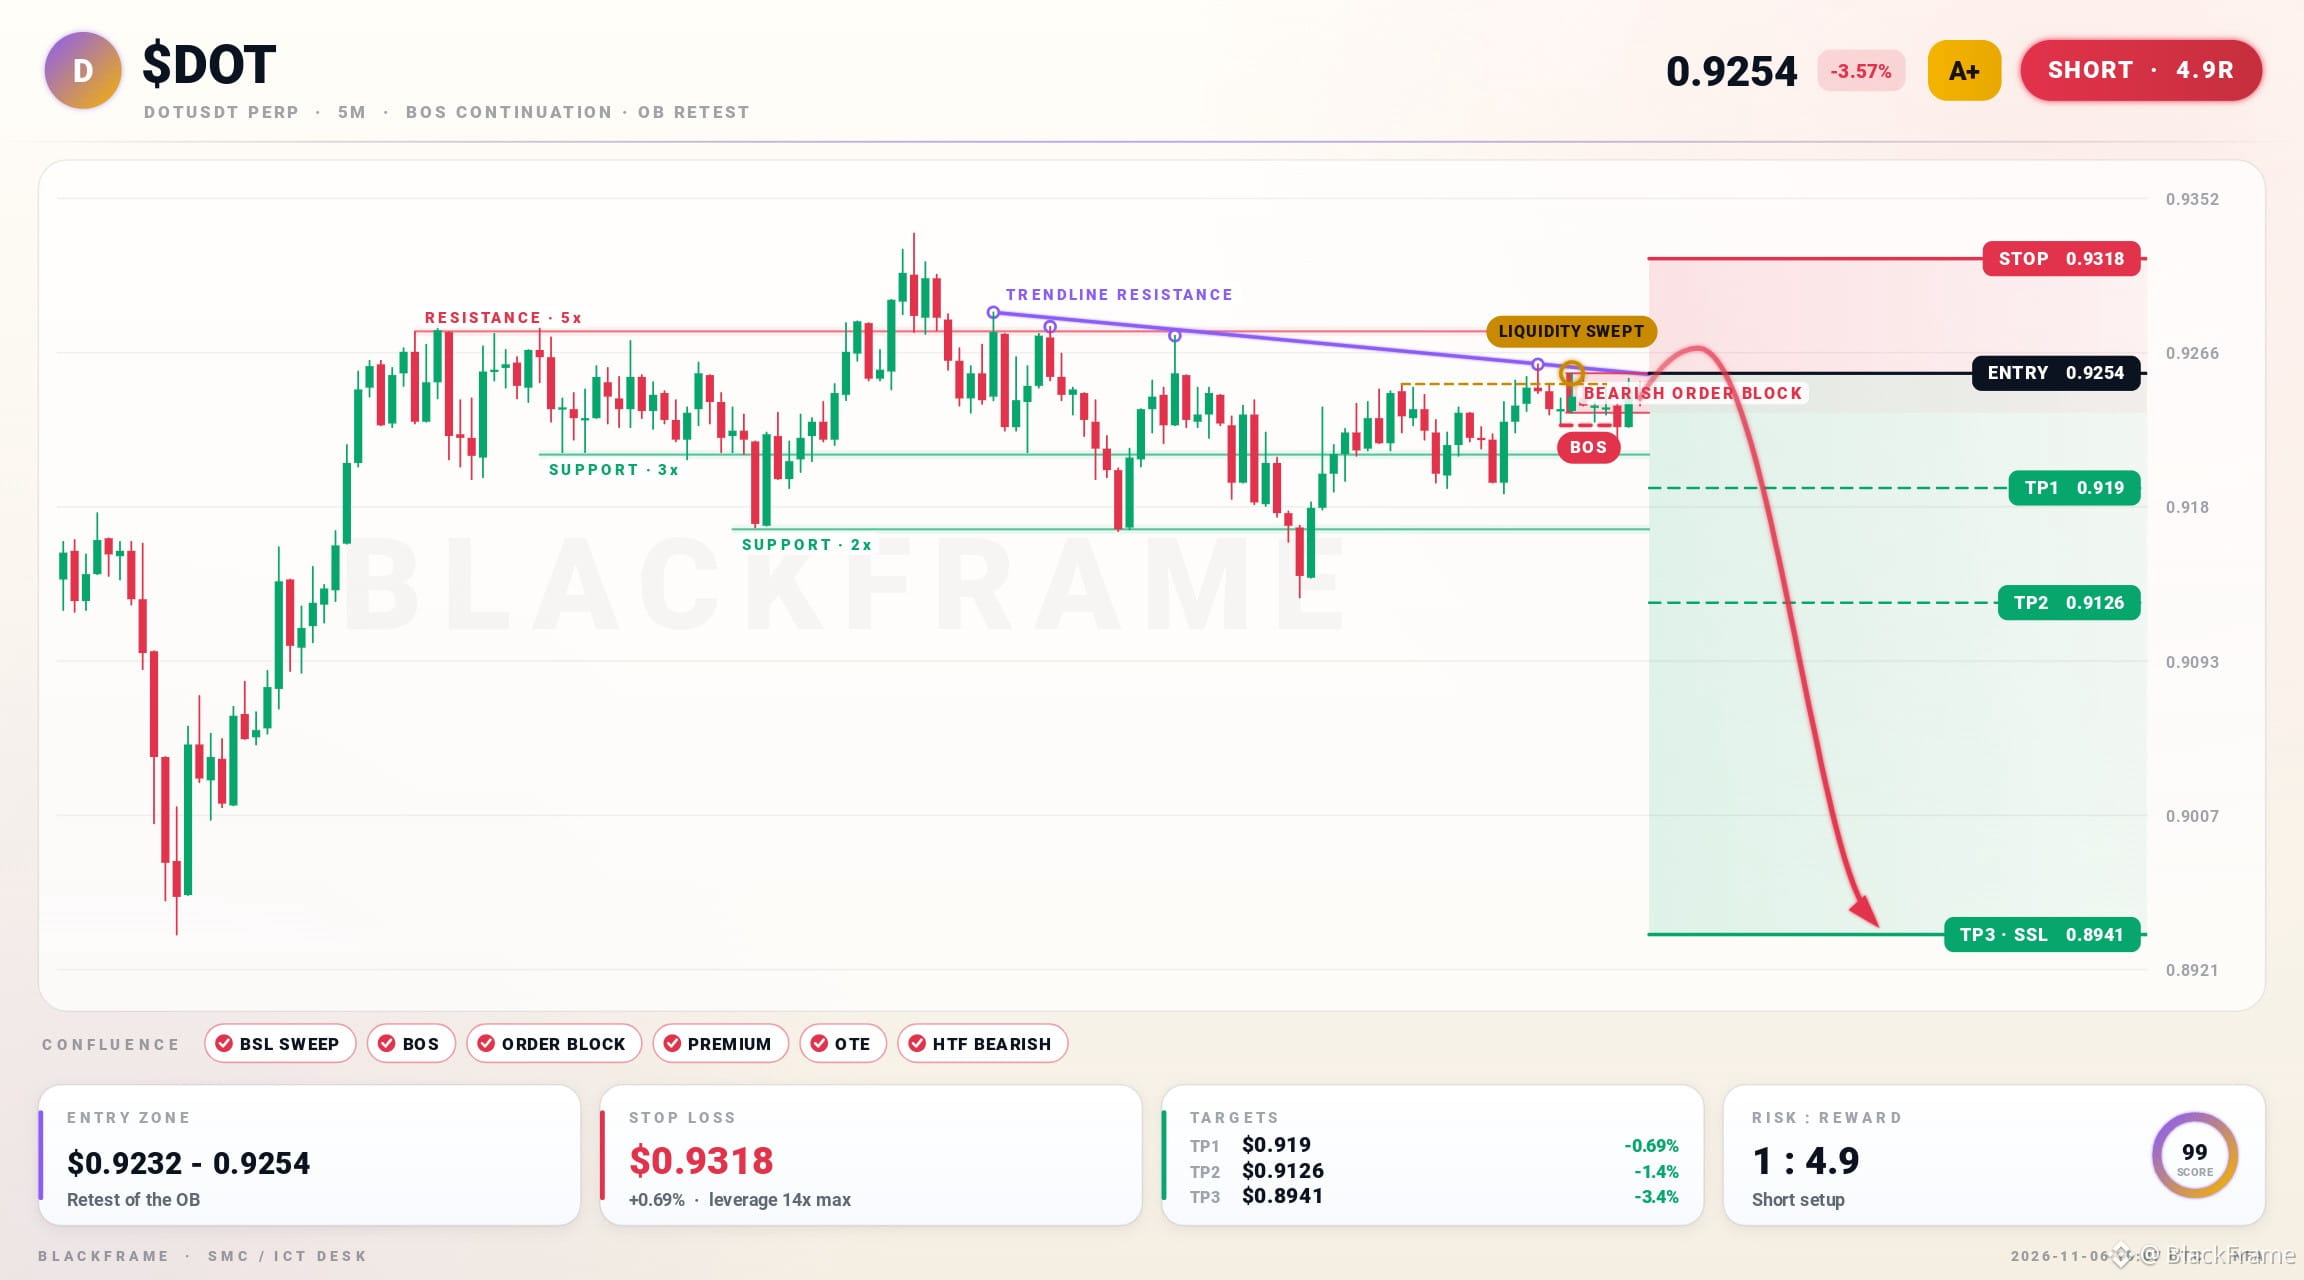
📉 $DOT broke structure lower, continuation short
SHORT · 5M
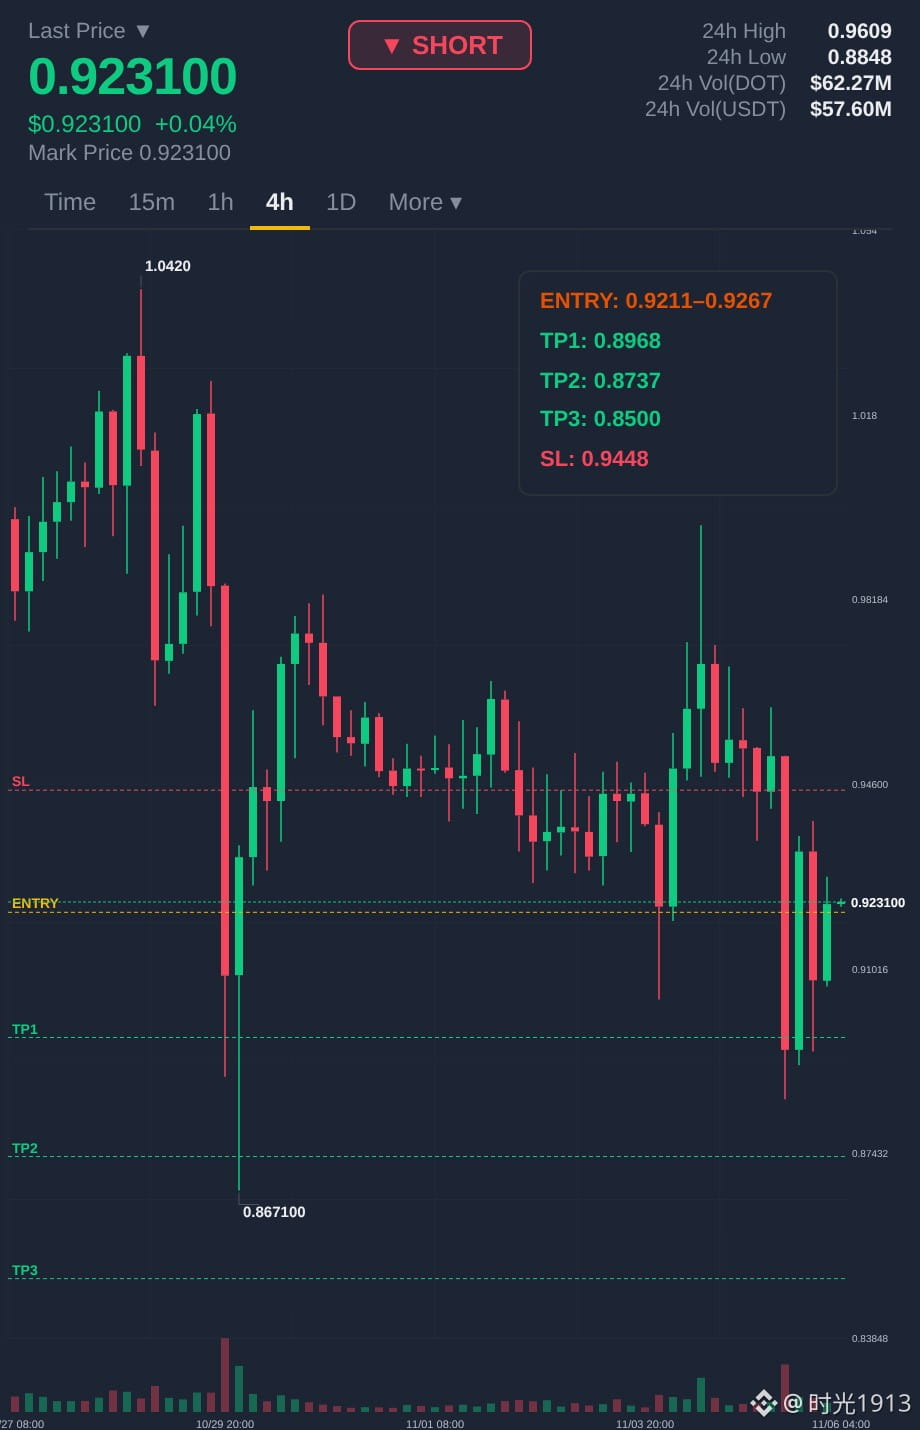
Entry: $0.9232 - $0.9254
TP1: $0.919
TP2: $0.9126
TP3: $0.8941
SL: $0.9318
Buy-side liquidity above the last swing high was swept and price closed back inside. Structure continues lower with a fresh BOS on the 5M. Entry is the first retest of the fresh bearish order block in premium, targeting sell-side liquidity below.
#DOT #ICT · NFA
📉 $DOT broke structure lower, continuation short
SHORT · 5M
Entry: $0.9232 - $0.9254
TP1: $0.919
TP2: $0.9126
TP3: $0.8941
SL: $0.9318
Buy-side liquidity above the last swing high was swept and price closed back inside. Structure continues lower with a fresh BOS on the 5M. Entry is the first retest of the fresh bearish order block in premium, targeting sell-side liquidity below.
#DOT #ICT · NFA
SHORT · 5M
Entry: $0.9232 - $0.9254
TP1: $0.919
TP2: $0.9126
TP3: $0.8941
SL: $0.9318
Buy-side liquidity above the last swing high was swept and price closed back inside. Structure continues lower with a fresh BOS on the 5M. Entry is the first retest of the fresh bearish order block in premium, targeting sell-side liquidity below.
#DOT #ICT · NFA
107

·
--
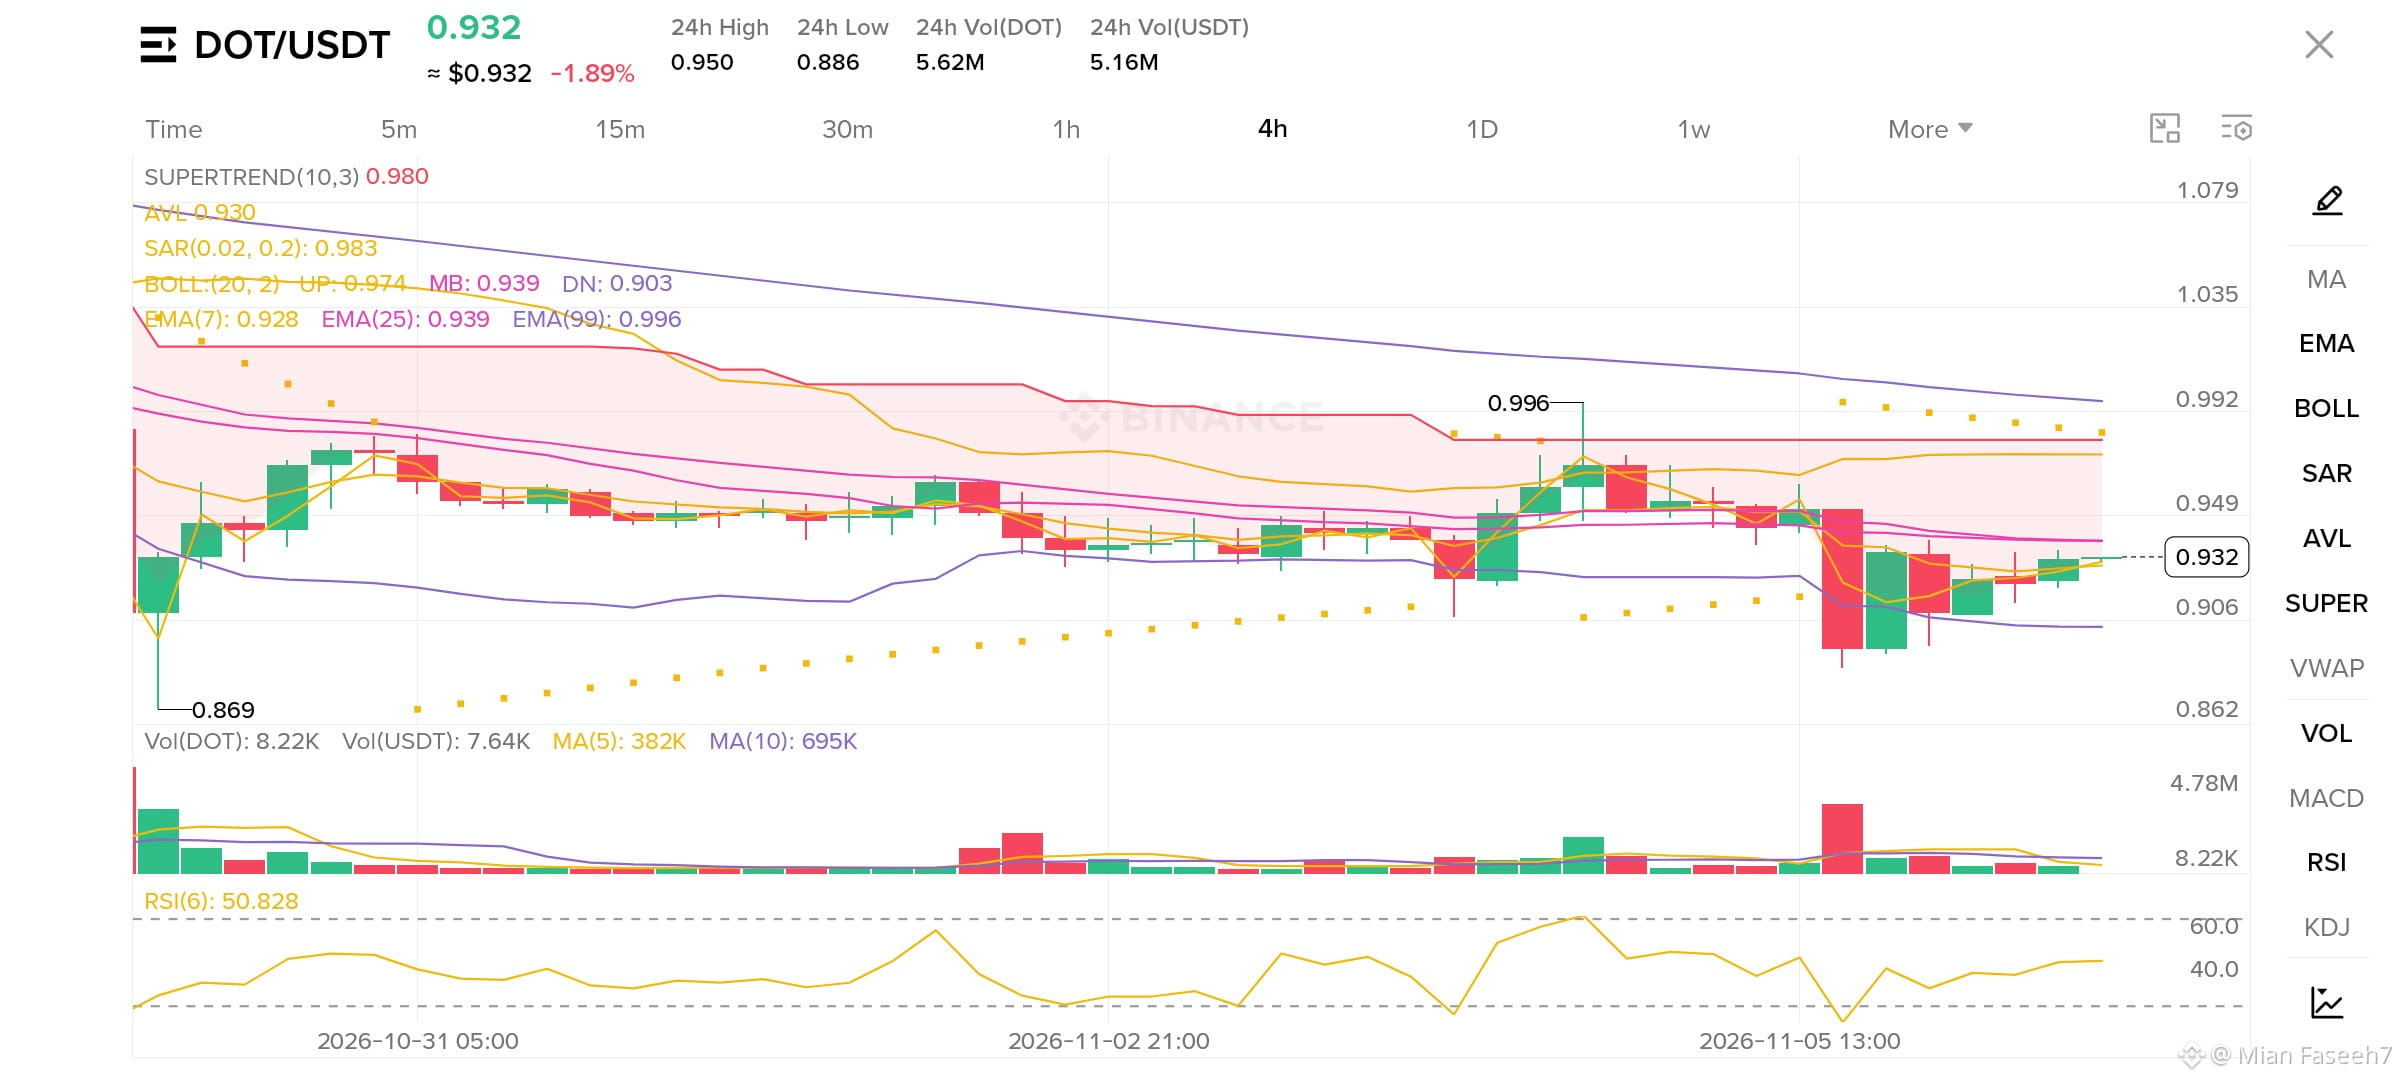
$DOT is trading around $0.932 after bouncing from $0.886 low — buyers tried to hold but still price is stuck under pressure.
On the 4H chart price is just below BOLL Middle at $0.939 and EMA 25 at $0.939, while EMA 7 at $0.928 is right under price. Supertrend is still red above at $0.980 and SAR dots are also above, so trend is still weak. RSI is at 50.8, totally neutral, means no clear momentum yet. Volume around $5.16M is also low, so next move will need fresh volume.
Are you holding $DOT here or waiting for a strong close above $0.939 first?
{spot}(DOTUSDT)
Follow for real-time updates, no fake signals.
If this analysis helped you, a small Tip is appreciated 🙏
#DOT #Polkadot #CryptoTrading
$DOT is trading around $0.932 after bouncing from $0.886 low — buyers tried to hold but still price is stuck under pressure.
On the 4H chart price is just below BOLL Middle at $0.939 and EMA 25 at $0.939, while EMA 7 at $0.928 is right under price. Supertrend is still red above at $0.980 and SAR dots are also above, so trend is still weak. RSI is at 50.8, totally neutral, means no clear momentum yet. Volume around $5.16M is also low, so next move will need fresh volume.
Are you holding $DOT here or waiting for a strong close above $0.939 first?
Follow for real-time updates, no fake signals.
If this analysis helped you, a small Tip is appreciated 🙏
#DOT #Polkadot #CryptoTrading
On the 4H chart price is just below BOLL Middle at $0.939 and EMA 25 at $0.939, while EMA 7 at $0.928 is right under price. Supertrend is still red above at $0.980 and SAR dots are also above, so trend is still weak. RSI is at 50.8, totally neutral, means no clear momentum yet. Volume around $5.16M is also low, so next move will need fresh volume.
Are you holding $DOT here or waiting for a strong close above $0.939 first?
Follow for real-time updates, no fake signals.
If this analysis helped you, a small Tip is appreciated 🙏
#DOT #Polkadot #CryptoTrading
163


·
--
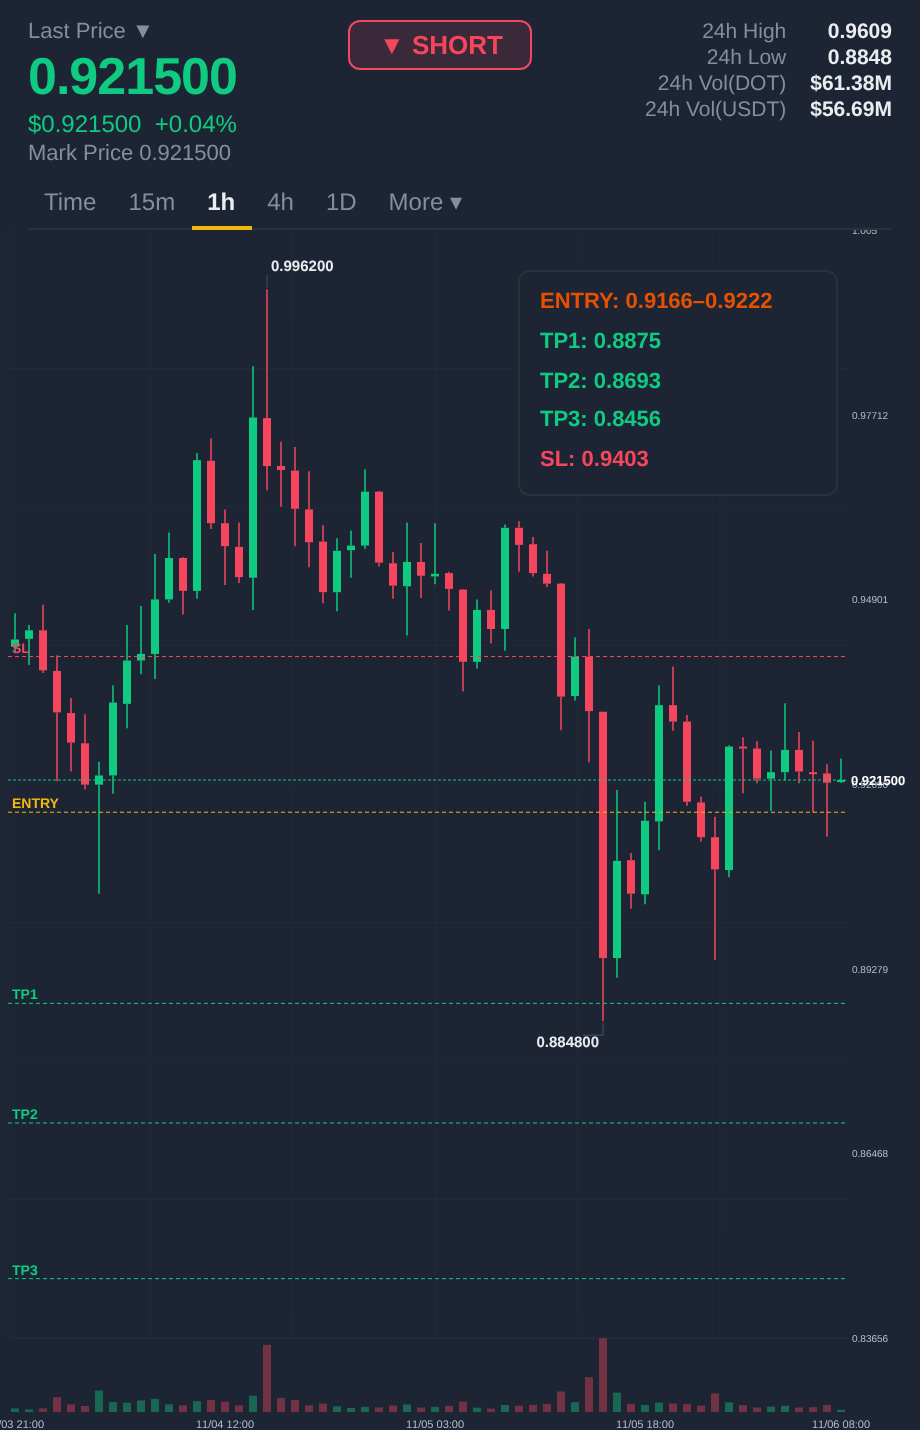
$DOT looks ready to move up from here 🚀
Trading volume is almost double the normal average
Price sits right in the middle of today range
🎯 Buy $DOT 0.91854 to 0.92786
Stop loss 0.88879
Targets 0.98182 / 1.0190 / 1.0749
Price is in the zone right now
Tap $DOT to buy
Who else is in
#DOT #TradingSignals
$DOT looks ready to move up from here 🚀
Trading volume is almost double the normal average
Price sits right in the middle of today range
🎯 Buy $DOT 0.91854 to 0.92786
Stop loss 0.88879
Targets 0.98182 / 1.0190 / 1.0749
Price is in the zone right now
Tap $DOT to buy
Who else is in
#DOT #TradingSignals
Trading volume is almost double the normal average
Price sits right in the middle of today range
🎯 Buy $DOT 0.91854 to 0.92786
Stop loss 0.88879
Targets 0.98182 / 1.0190 / 1.0749
Price is in the zone right now
Tap $DOT to buy
Who else is in
#DOT #TradingSignals
8

·
--
$DOT #DOT 📉
Direction: SHORT
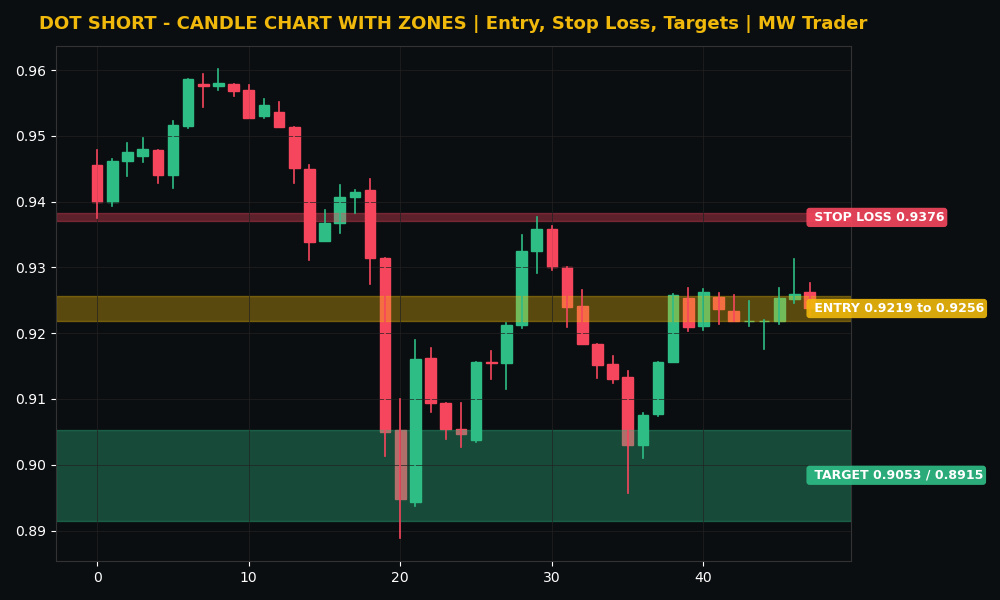
Entry zone: 0.9219 to 0.9256
Stop loss: 0.9376
Target 1: 0.9053
Target 2: 0.8915
Polkadot is trading near 0.923576 dollars, down 1.58 percent in 24 hours, inside a range of 0.888887 to 0.960145 dollars, and the recent closes show a flat drift in the middle of the range, 0.921799, then 0.921808, then 0.925342, then 0.925883, then 0.923788. 🔴 My reading is that DOT held up better than most coins in this crash, but every close is pinned in the middle of the range with no buyers pushing higher, and that kind of stillness usually breaks down before it breaks up. A short from the current zone, with a stop above 0.9376, targets 0.9053 first and then 0.8915 if sellers push through the range low. A rise above 0.9376 kills the idea without debate.
Futures trading is risky. Trade small, use a stop loss, and do your own research. This is my reading, not a guaranteed signal.
Does DOT fall to 0.9053 first, or rise above 0.9376? 🤔
Follow for more trades.
#Polkadot #Crypto #FuturesTrading #TradingSignals
$DOT #DOT 📉
Direction: SHORT
Entry zone: 0.9219 to 0.9256
Stop loss: 0.9376
Target 1: 0.9053
Target 2: 0.8915
Polkadot is trading near 0.923576 dollars, down 1.58 percent in 24 hours, inside a range of 0.888887 to 0.960145 dollars, and the recent closes show a flat drift in the middle of the range, 0.921799, then 0.921808, then 0.925342, then 0.925883, then 0.923788. 🔴 My reading is that DOT held up better than most coins in this crash, but every close is pinned in the middle of the range with no buyers pushing higher, and that kind of stillness usually breaks down before it breaks up. A short from the current zone, with a stop above 0.9376, targets 0.9053 first and then 0.8915 if sellers push through the range low. A rise above 0.9376 kills the idea without debate.
Futures trading is risky. Trade small, use a stop loss, and do your own research. This is my reading, not a guaranteed signal.
Does DOT fall to 0.9053 first, or rise above 0.9376? 🤔
Follow for more trades.
#Polkadot #Crypto #FuturesTrading #TradingSignals
Direction: SHORT
Entry zone: 0.9219 to 0.9256
Stop loss: 0.9376
Target 1: 0.9053
Target 2: 0.8915
Polkadot is trading near 0.923576 dollars, down 1.58 percent in 24 hours, inside a range of 0.888887 to 0.960145 dollars, and the recent closes show a flat drift in the middle of the range, 0.921799, then 0.921808, then 0.925342, then 0.925883, then 0.923788. 🔴 My reading is that DOT held up better than most coins in this crash, but every close is pinned in the middle of the range with no buyers pushing higher, and that kind of stillness usually breaks down before it breaks up. A short from the current zone, with a stop above 0.9376, targets 0.9053 first and then 0.8915 if sellers push through the range low. A rise above 0.9376 kills the idea without debate.
Futures trading is risky. Trade small, use a stop loss, and do your own research. This is my reading, not a guaranteed signal.
Does DOT fall to 0.9053 first, or rise above 0.9376? 🤔
Follow for more trades.
#Polkadot #Crypto #FuturesTrading #TradingSignals
8

🚀 $DOT JAM UPGRADE APPROVAL SPARKS HEAVY ACCUMULATION AT KEY RECLAIM ZONE! 💥
Entry: 0.9195 ⚡
Target: 0.9450 🚀
Stop Loss: 0.9066 ⚠️
Fresh capital is flooding the ecosystem following the approval of the JAM upgrade, setting up a primed launchpad. 🌊 MACD is coiling for a textbook golden cross while KDJ shifts upward sharply, signaling smart money is positioning ahead of the push. 📊
📌 Smart capital is quietly absorbing liquidity before the breakout candle prints. ⚡ The setup offers clean execution for traders tracking institutional momentum before the crowd chases the move higher. 💬 Are you front-running this momentum flip or waiting for resistance to break? 👇
⚠️ Not financial advice. Always manage your risk. 🛡️
🏷️ #DOT #LongSetup #Polkadot #Altcoins #Crypto
⚡ 💎
🚀 $DOT JAM UPGRADE APPROVAL SPARKS HEAVY ACCUMULATION AT KEY RECLAIM ZONE! 💥
Entry: 0.9195 ⚡
Target: 0.9450 🚀
Stop Loss: 0.9066 ⚠️
Fresh capital is flooding the ecosystem following the approval of the JAM upgrade, setting up a primed launchpad. 🌊 MACD is coiling for a textbook golden cross while KDJ shifts upward sharply, signaling smart money is positioning ahead of the push. 📊
📌 Smart capital is quietly absorbing liquidity before the breakout candle prints. ⚡ The setup offers clean execution for traders tracking institutional momentum before the crowd chases the move higher. 💬 Are you front-running this momentum flip or waiting for resistance to break? 👇
⚠️ Not financial advice. Always manage your risk. 🛡️
🏷️ #DOT #LongSetup #Polkadot #Altcoins #Crypto
⚡ 💎
Entry: 0.9195 ⚡
Target: 0.9450 🚀
Stop Loss: 0.9066 ⚠️
Fresh capital is flooding the ecosystem following the approval of the JAM upgrade, setting up a primed launchpad. 🌊 MACD is coiling for a textbook golden cross while KDJ shifts upward sharply, signaling smart money is positioning ahead of the push. 📊
📌 Smart capital is quietly absorbing liquidity before the breakout candle prints. ⚡ The setup offers clean execution for traders tracking institutional momentum before the crowd chases the move higher. 💬 Are you front-running this momentum flip or waiting for resistance to break? 👇
⚠️ Not financial advice. Always manage your risk. 🛡️
🏷️ #DOT #LongSetup #Polkadot #Altcoins #Crypto
⚡ 💎
6

🚨 SELLER TRAP SPRUNG AS $DOT FAILS AT RESISTANCE AND PREPARES TO FLIP BEARISH! 📉
Entry: 0.9103 📉
Target: 0.8935 🎯
Stop Loss: 0.9186 ⚠️
That sharp push into the 0.9180 supply block was met with swift rejection, proving buyers lacked the stamina to hold higher ground. 📊 As order flow turns heavy, momentum is tilting sharply toward lower liquidity pockets.
A decisive breakdown beneath the key 0.9050 support level opens the floodgates for accelerated downside pressure toward lower targets. ⚡ Sellers are firmly in control of the tape while localized demand vanishes. 💬 Are you shorting this rejection or waiting for a deeper sweep below support? 👇
⚠️ Not financial advice. Always manage your risk. 🛡️
🏷️ #DOT #ShortSetup #Altcoins #Crypto
📉 🐻
🚨 SELLER TRAP SPRUNG AS $DOT FAILS AT RESISTANCE AND PREPARES TO FLIP BEARISH! 📉
Entry: 0.9103 📉
Target: 0.8935 🎯
Stop Loss: 0.9186 ⚠️
That sharp push into the 0.9180 supply block was met with swift rejection, proving buyers lacked the stamina to hold higher ground. 📊 As order flow turns heavy, momentum is tilting sharply toward lower liquidity pockets.
A decisive breakdown beneath the key 0.9050 support level opens the floodgates for accelerated downside pressure toward lower targets. ⚡ Sellers are firmly in control of the tape while localized demand vanishes. 💬 Are you shorting this rejection or waiting for a deeper sweep below support? 👇
⚠️ Not financial advice. Always manage your risk. 🛡️
🏷️ #DOT #ShortSetup #Altcoins #Crypto
📉 🐻
Entry: 0.9103 📉
Target: 0.8935 🎯
Stop Loss: 0.9186 ⚠️
That sharp push into the 0.9180 supply block was met with swift rejection, proving buyers lacked the stamina to hold higher ground. 📊 As order flow turns heavy, momentum is tilting sharply toward lower liquidity pockets.
A decisive breakdown beneath the key 0.9050 support level opens the floodgates for accelerated downside pressure toward lower targets. ⚡ Sellers are firmly in control of the tape while localized demand vanishes. 💬 Are you shorting this rejection or waiting for a deeper sweep below support? 👇
⚠️ Not financial advice. Always manage your risk. 🛡️
🏷️ #DOT #ShortSetup #Altcoins #Crypto
📉 🐻
12
·
--
$DOT looks ready to bounce and go up
Last hour low is at $0.88600 just 1.1 percent away
Heavy volume is running at 1.6x the weekly average
Price sits near the bottom of today's range
🎯 Buy $DOT 0.88567 to 0.89858
Stop loss 0.87739
Targets 0.92391 / 0.94252 / 0.97043
Tap $DOT to buy it here
In or out
#DOT #TradingSignals
$DOT looks ready to bounce and go up
Last hour low is at $0.88600 just 1.1 percent away
Heavy volume is running at 1.6x the weekly average
Price sits near the bottom of today's range
🎯 Buy $DOT 0.88567 to 0.89858
Stop loss 0.87739
Targets 0.92391 / 0.94252 / 0.97043
Tap $DOT to buy it here
In or out
#DOT #TradingSignals
Last hour low is at $0.88600 just 1.1 percent away
Heavy volume is running at 1.6x the weekly average
Price sits near the bottom of today's range
🎯 Buy $DOT 0.88567 to 0.89858
Stop loss 0.87739
Targets 0.92391 / 0.94252 / 0.97043
Tap $DOT to buy it here
In or out
#DOT #TradingSignals
11

·
--
Bearish
📉 POLKADOT (DOT) DROPS 3.5% – TREASURY EXPLOIT AND GOVERNANCE CHANGES RAISE CONCERNS!
Polkadot (DOT) is facing selling pressure as security concerns and proposed governance changes weigh on market sentiment.
According to CoinMarketCap's November 5, 2026 report, DOT declined approximately 3.5% over the reported period.
📊 Market Highlights
Cryptocurrency: Polkadot (DOT)
Reported Price: $0.937
24-Hour Price Movement: Approximately -2.5%
Reported Overall Movement: -3.5%
Market Sentiment: Bearish
🔍 What's Behind the Decline?
1. Treasury Exploit
A recent security exploit reportedly caused approximately $1.38 million in losses to Polkadot's Treasury. The vulnerability has reportedly been patched, and user funds remained safe.
2. Validator Changes
New governance proposals aim to gradually reduce the active validator set to 320 and restructure staking rewards.
3. Market Pressure
DOT has underperformed against the broader cryptocurrency market, reflecting additional asset-specific concerns.
⚠️ What Should Investors Watch?
Updates on treasury security.
Governance proposal outcomes.
Validator and staking reward changes.
Trading volume and important support levels.
💡 Key Market Insight
Security, governance, and investor confidence play important roles in cryptocurrency valuations.
A price decline is not always just a market correction. Sometimes, developments within a blockchain ecosystem can influence investor sentiment.
Stay informed. Understand the risks. Never trade blindly.
⚠️ Disclaimer: For educational purposes only. Not financial advice. Always DYOR.
{spot}(DOTUSDT)
#DOT #CryptoMarket #CryptoNews #BlockchainSecurity #Cryptocurrency
📉 POLKADOT (DOT) DROPS 3.5% – TREASURY EXPLOIT AND GOVERNANCE CHANGES RAISE CONCERNS!
Polkadot (DOT) is facing selling pressure as security concerns and proposed governance changes weigh on market sentiment.
According to CoinMarketCap's November 5, 2026 report, DOT declined approximately 3.5% over the reported period.
📊 Market Highlights
Cryptocurrency: Polkadot (DOT)
Reported Price: $0.937
24-Hour Price Movement: Approximately -2.5%
Reported Overall Movement: -3.5%
Market Sentiment: Bearish
🔍 What's Behind the Decline?
1. Treasury Exploit
A recent security exploit reportedly caused approximately $1.38 million in losses to Polkadot's Treasury. The vulnerability has reportedly been patched, and user funds remained safe.
2. Validator Changes
New governance proposals aim to gradually reduce the active validator set to 320 and restructure staking rewards.
3. Market Pressure
DOT has underperformed against the broader cryptocurrency market, reflecting additional asset-specific concerns.
⚠️ What Should Investors Watch?
Updates on treasury security.
Governance proposal outcomes.
Validator and staking reward changes.
Trading volume and important support levels.
💡 Key Market Insight
Security, governance, and investor confidence play important roles in cryptocurrency valuations.
A price decline is not always just a market correction. Sometimes, developments within a blockchain ecosystem can influence investor sentiment.
Stay informed. Understand the risks. Never trade blindly.
⚠️ Disclaimer: For educational purposes only. Not financial advice. Always DYOR.
#DOT #CryptoMarket #CryptoNews #BlockchainSecurity #Cryptocurrency
Polkadot (DOT) is facing selling pressure as security concerns and proposed governance changes weigh on market sentiment.
According to CoinMarketCap's November 5, 2026 report, DOT declined approximately 3.5% over the reported period.
📊 Market Highlights
Cryptocurrency: Polkadot (DOT)
Reported Price: $0.937
24-Hour Price Movement: Approximately -2.5%
Reported Overall Movement: -3.5%
Market Sentiment: Bearish
🔍 What's Behind the Decline?
1. Treasury Exploit
A recent security exploit reportedly caused approximately $1.38 million in losses to Polkadot's Treasury. The vulnerability has reportedly been patched, and user funds remained safe.
2. Validator Changes
New governance proposals aim to gradually reduce the active validator set to 320 and restructure staking rewards.
3. Market Pressure
DOT has underperformed against the broader cryptocurrency market, reflecting additional asset-specific concerns.
⚠️ What Should Investors Watch?
Updates on treasury security.
Governance proposal outcomes.
Validator and staking reward changes.
Trading volume and important support levels.
💡 Key Market Insight
Security, governance, and investor confidence play important roles in cryptocurrency valuations.
A price decline is not always just a market correction. Sometimes, developments within a blockchain ecosystem can influence investor sentiment.
Stay informed. Understand the risks. Never trade blindly.
⚠️ Disclaimer: For educational purposes only. Not financial advice. Always DYOR.
#DOT #CryptoMarket #CryptoNews #BlockchainSecurity #Cryptocurrency
1
308

·
--
Bullish
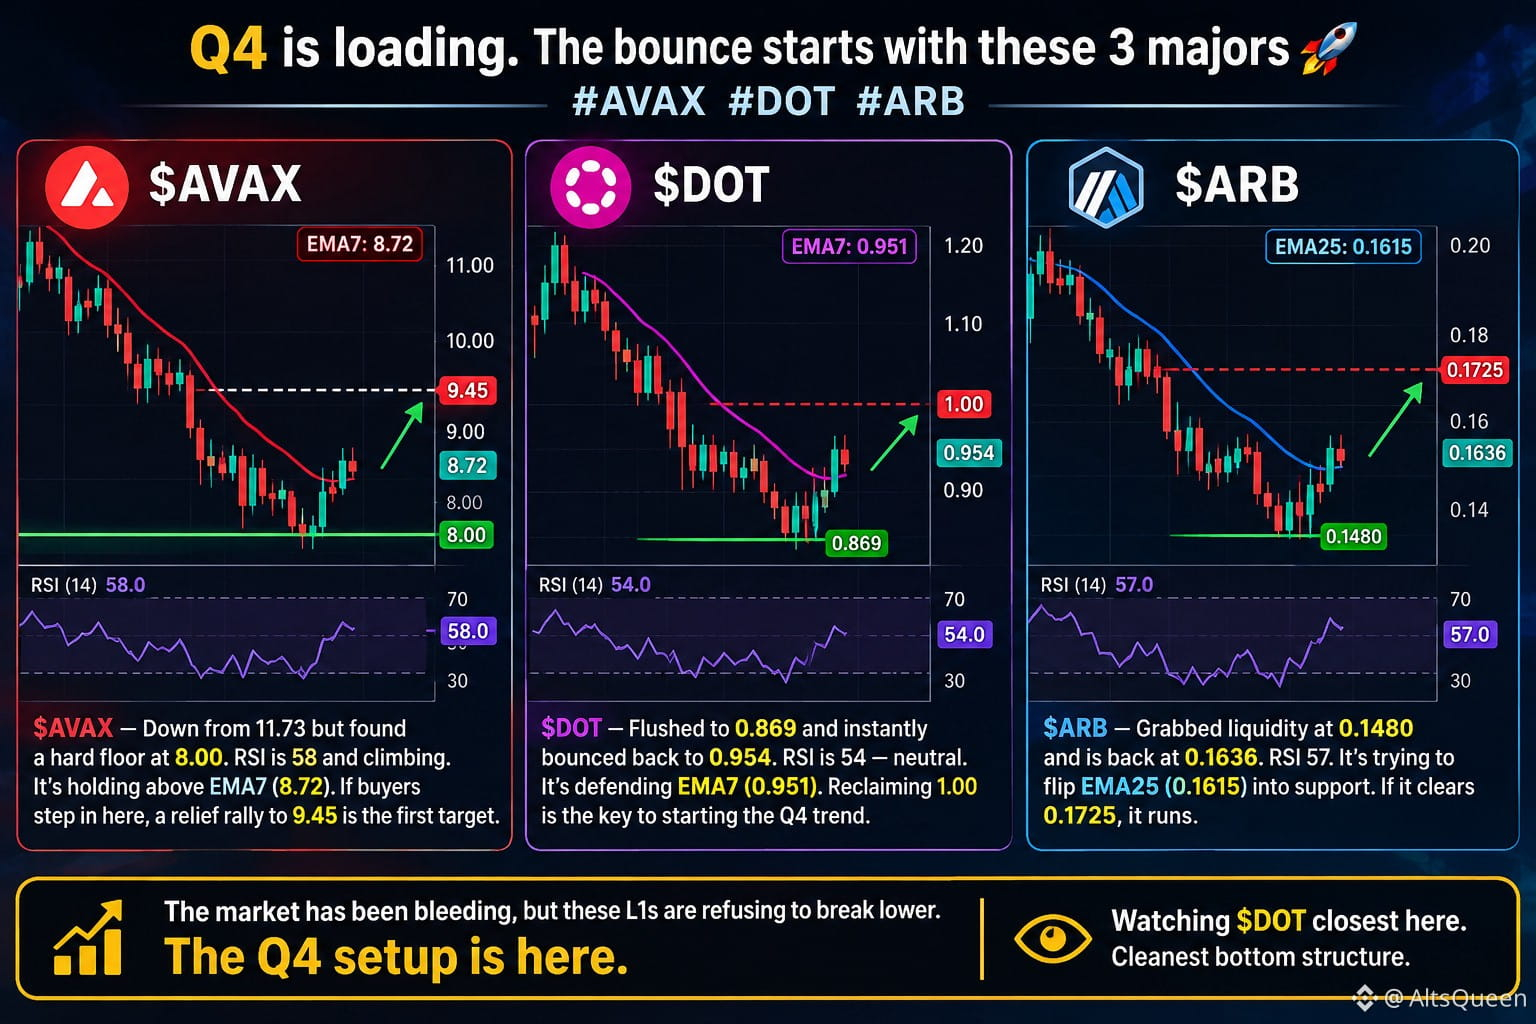
Q4 is loading. The bounce starts with these 3 majors 🚀 #AVAX #DOT #ARB
$AVAX — Down from 11.73 but found a hard floor at 8.00. RSI is 58 and climbing. It’s holding above EMA7 (8.72). If buyers step in here, a relief rally to 9.45 is the first target.
{future}(AVAXUSDT)
$DOT — Flushed to 0.869 and instantly bounced back to 0.954. RSI is 54 — neutral. It’s defending EMA7 (0.951). Reclaiming 1.00 is the key to starting the Q4 trend.
{future}(DOTUSDT)
$ARB — Grabbed liquidity at 0.1480 and is back at 0.1636. RSI 57. It’s trying to flip EMA25 (0.1615) into support. If it clears 0.1725, it runs.
{future}(ARBUSDT)
The market has been bleeding, but these L1s are refusing to break lower. The Q4 setup is here.
Watching #DOT closest here. Cleanest bottom structure.
Q4 is loading. The bounce starts with these 3 majors 🚀 #AVAX #DOT #ARB
$AVAX — Down from 11.73 but found a hard floor at 8.00. RSI is 58 and climbing. It’s holding above EMA7 (8.72). If buyers step in here, a relief rally to 9.45 is the first target.
$DOT — Flushed to 0.869 and instantly bounced back to 0.954. RSI is 54 — neutral. It’s defending EMA7 (0.951). Reclaiming 1.00 is the key to starting the Q4 trend.
$ARB — Grabbed liquidity at 0.1480 and is back at 0.1636. RSI 57. It’s trying to flip EMA25 (0.1615) into support. If it clears 0.1725, it runs.
The market has been bleeding, but these L1s are refusing to break lower. The Q4 setup is here.
Watching #DOT closest here. Cleanest bottom structure.
$AVAX — Down from 11.73 but found a hard floor at 8.00. RSI is 58 and climbing. It’s holding above EMA7 (8.72). If buyers step in here, a relief rally to 9.45 is the first target.
$DOT — Flushed to 0.869 and instantly bounced back to 0.954. RSI is 54 — neutral. It’s defending EMA7 (0.951). Reclaiming 1.00 is the key to starting the Q4 trend.
$ARB — Grabbed liquidity at 0.1480 and is back at 0.1636. RSI 57. It’s trying to flip EMA25 (0.1615) into support. If it clears 0.1725, it runs.
The market has been bleeding, but these L1s are refusing to break lower. The Q4 setup is here.
Watching #DOT closest here. Cleanest bottom structure.
3
1.2k

·
--
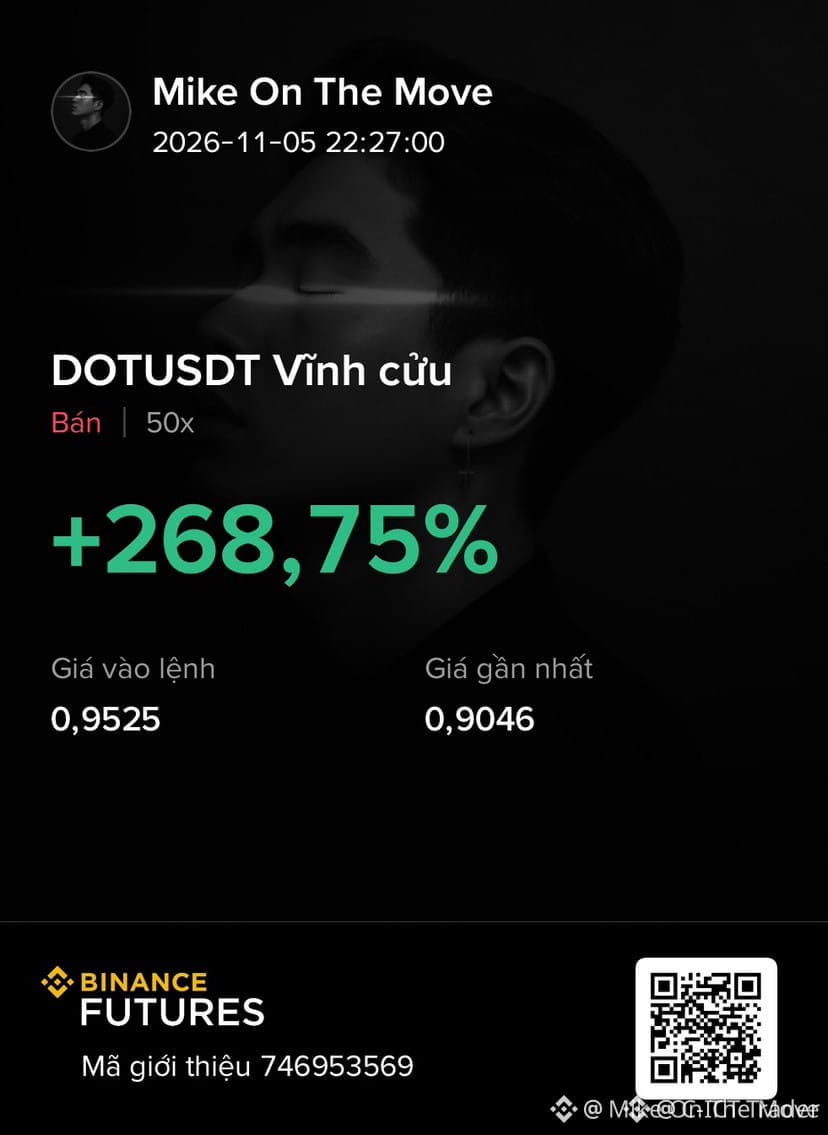
🚨 $DOT SHORT SWEEP REVEALS LIQUIDITY TRAP! 🔴
🦈 Smart money is aggressively clearing the demand zone under $DOT , forcing sellers to absorb fresh liquidity. 📊 Volume spikes on the 4‑hour chart confirm a decisive sell‑off, while the order block at the recent swing low remains intact, acting as a magnet for short entries. ⚡ The price action aligns with a classic liquidity hunt, suggesting the market will continue to test lower thresholds before any reversal attempt.
💬 Are you riding this short wave now or waiting for the next liquidity drain? 👇
⚠️ Not financial advice. Always manage your risk. 🛡️
🏷️ #DOT #ShortSetup #LiquidityHunt #Crypto
🦈 🔥
🚨 $DOT SHORT SWEEP REVEALS LIQUIDITY TRAP! 🔴
🦈 Smart money is aggressively clearing the demand zone under $DOT , forcing sellers to absorb fresh liquidity. 📊 Volume spikes on the 4‑hour chart confirm a decisive sell‑off, while the order block at the recent swing low remains intact, acting as a magnet for short entries. ⚡ The price action aligns with a classic liquidity hunt, suggesting the market will continue to test lower thresholds before any reversal attempt.
💬 Are you riding this short wave now or waiting for the next liquidity drain? 👇
⚠️ Not financial advice. Always manage your risk. 🛡️
🏷️ #DOT #ShortSetup #LiquidityHunt #Crypto
🦈 🔥
🦈 Smart money is aggressively clearing the demand zone under $DOT , forcing sellers to absorb fresh liquidity. 📊 Volume spikes on the 4‑hour chart confirm a decisive sell‑off, while the order block at the recent swing low remains intact, acting as a magnet for short entries. ⚡ The price action aligns with a classic liquidity hunt, suggesting the market will continue to test lower thresholds before any reversal attempt.
💬 Are you riding this short wave now or waiting for the next liquidity drain? 👇
⚠️ Not financial advice. Always manage your risk. 🛡️
🏷️ #DOT #ShortSetup #LiquidityHunt #Crypto
🦈 🔥
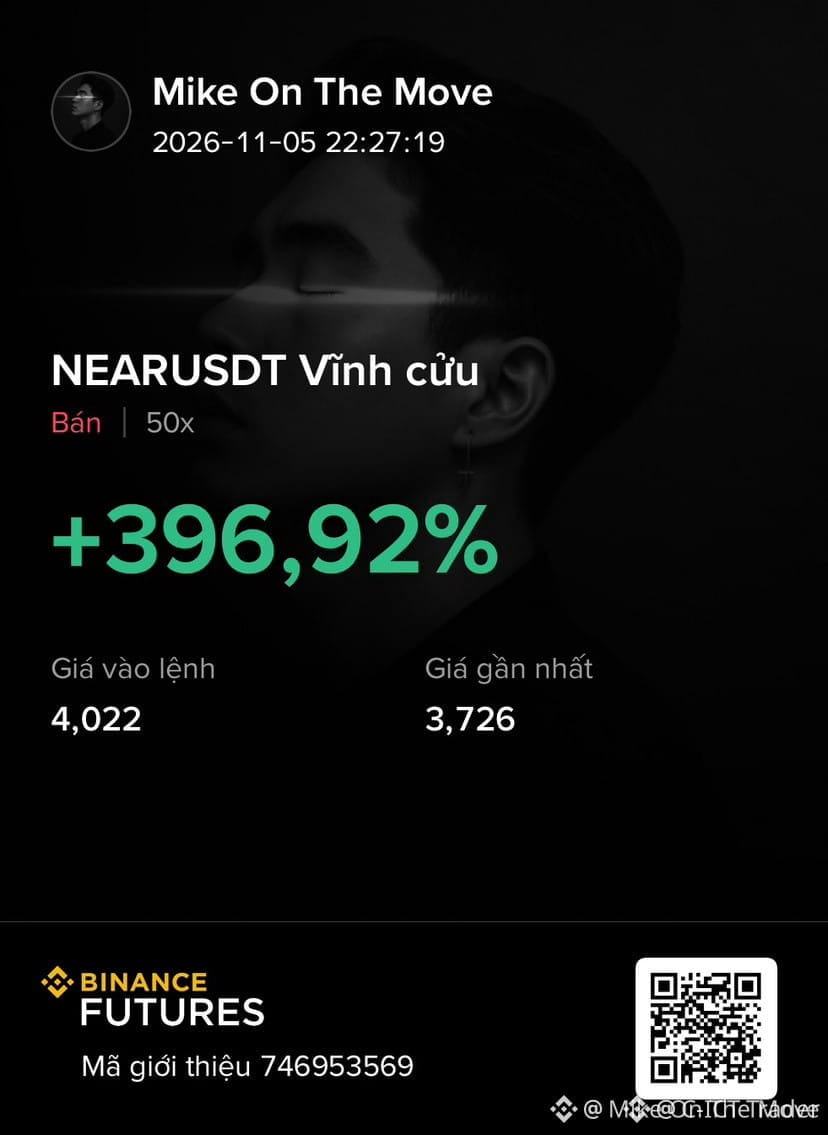
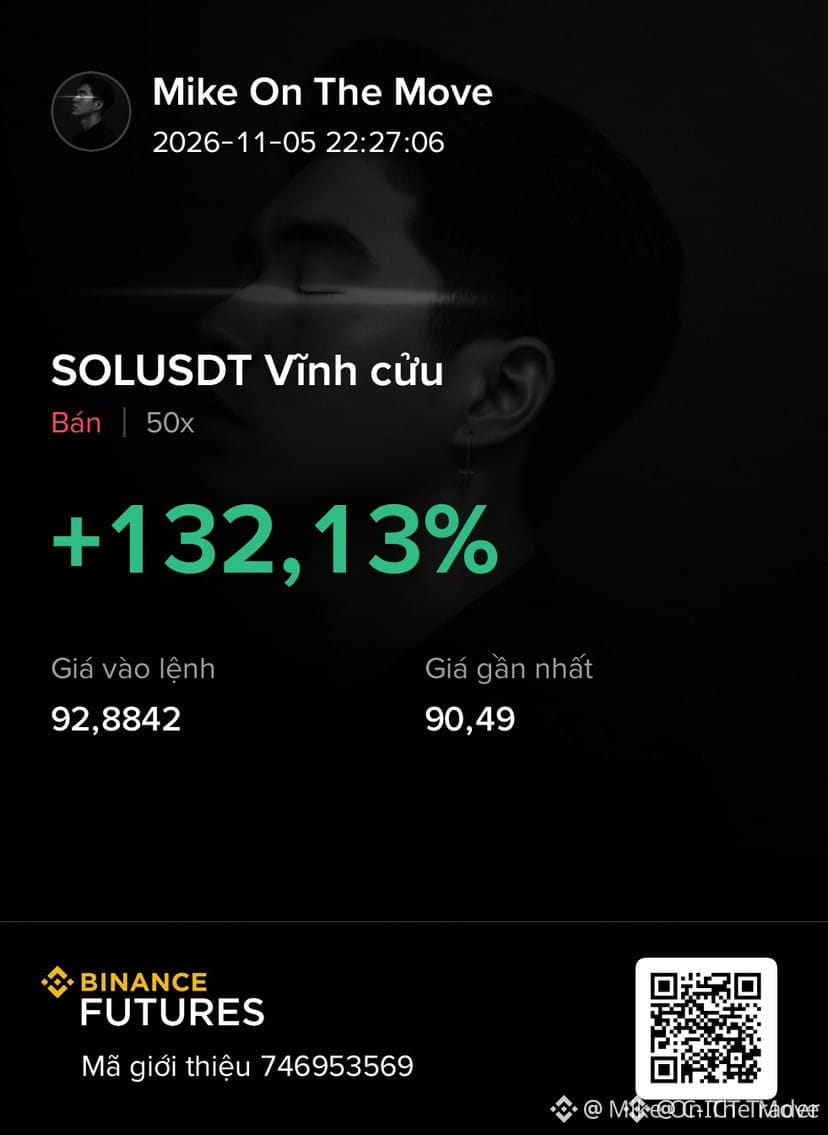
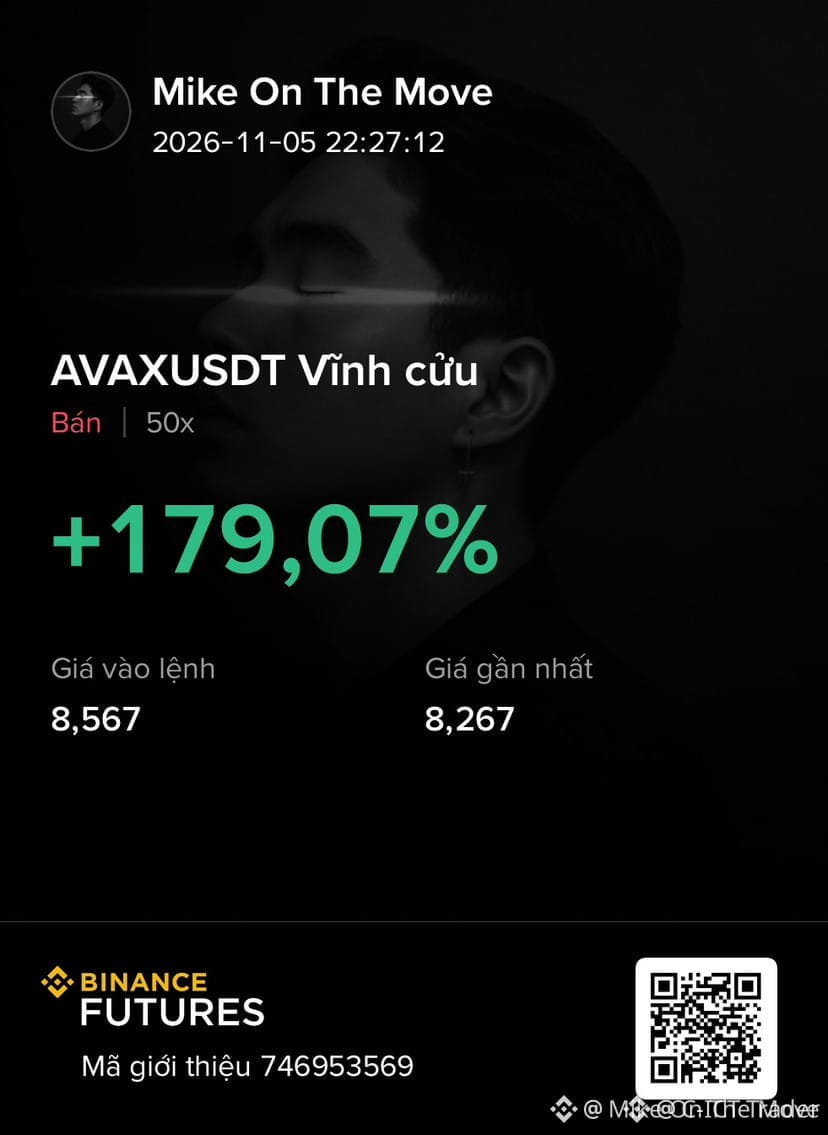
10
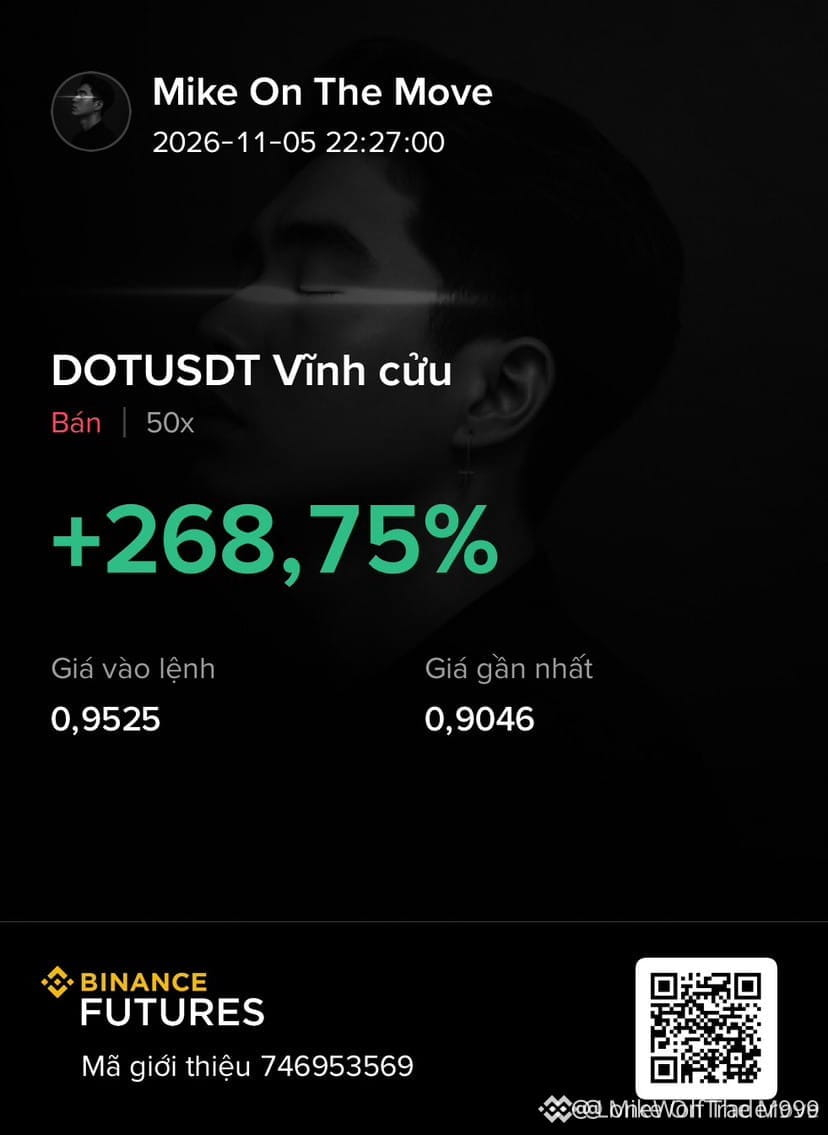
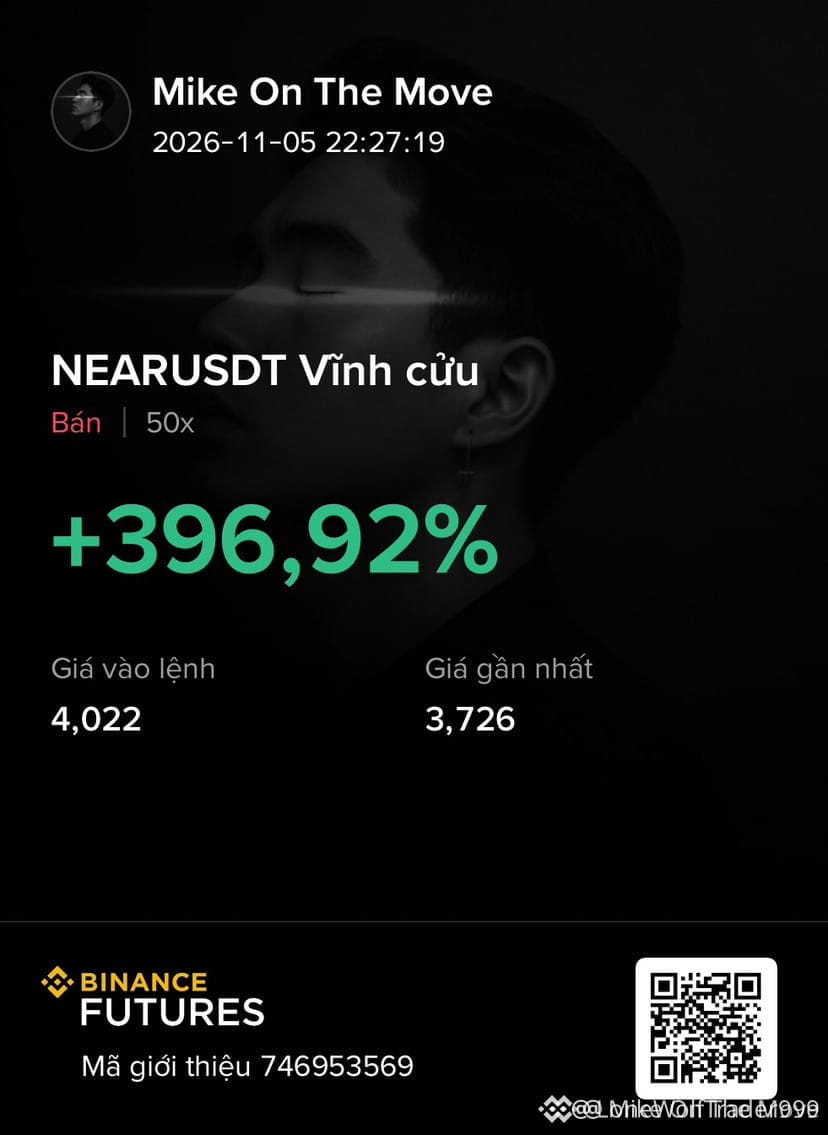
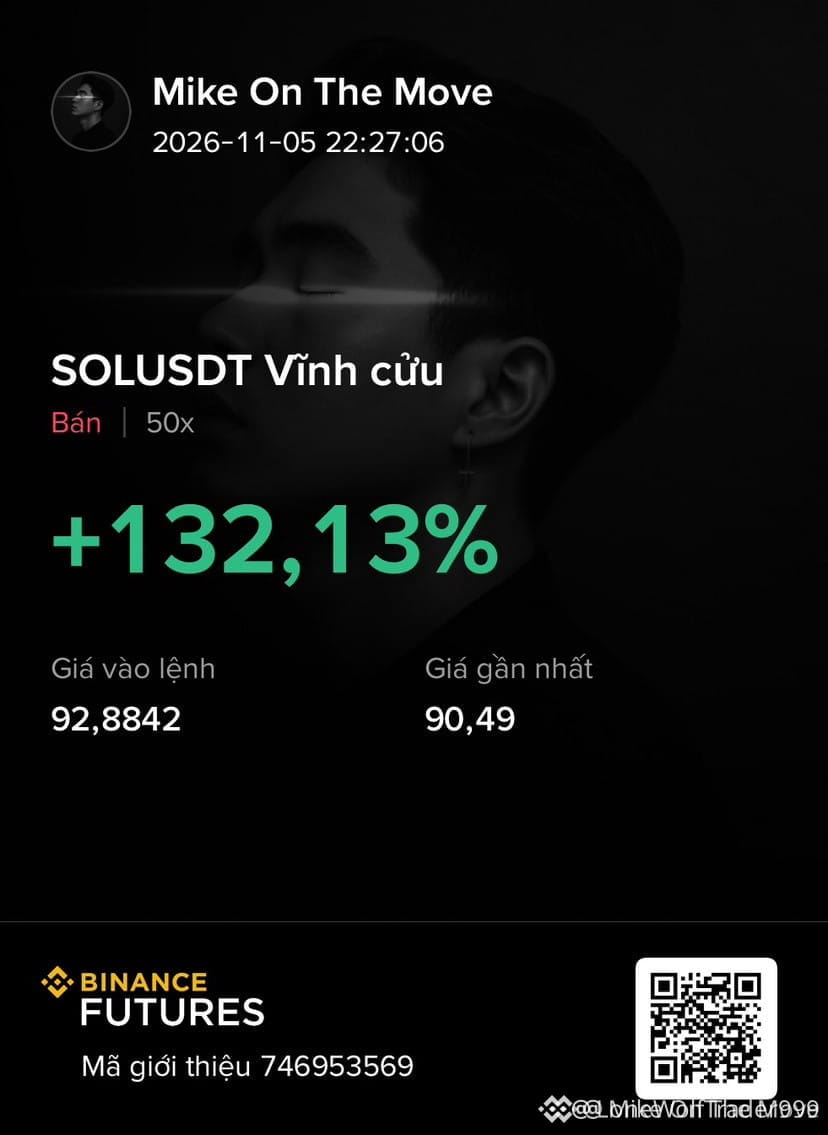
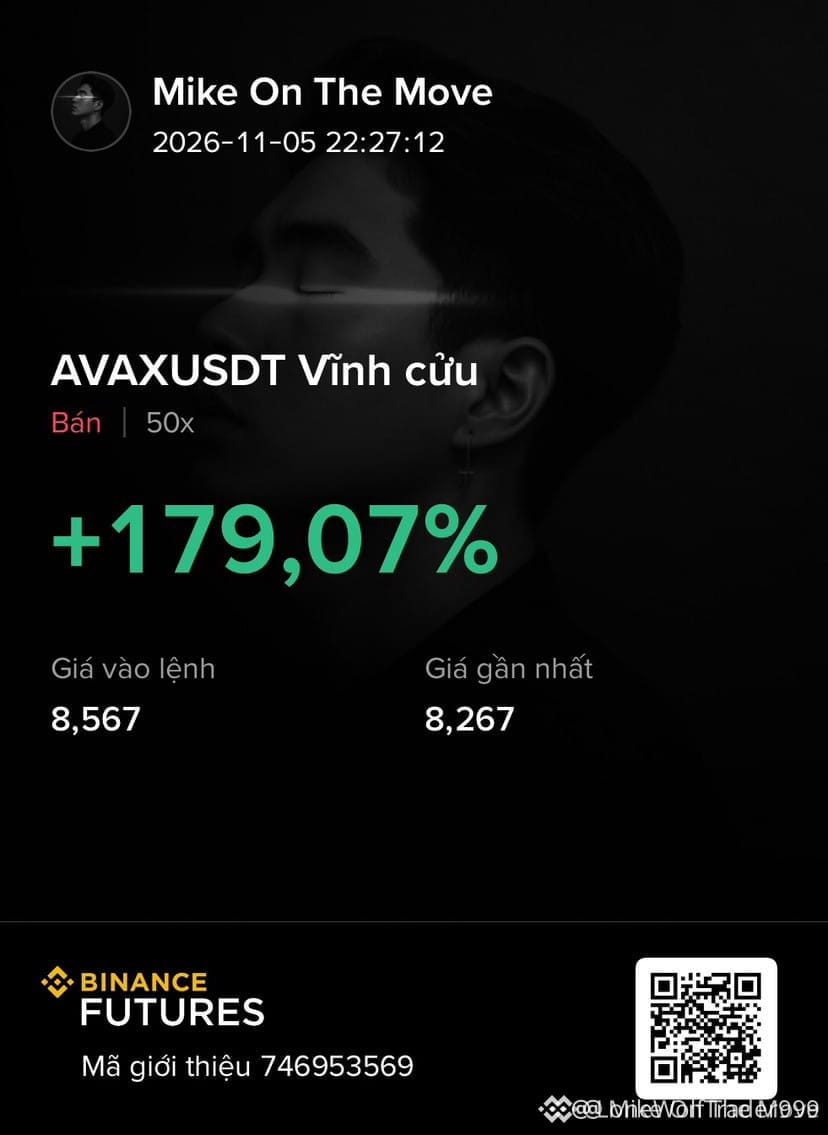
🚨 $DOT $SOL $AVAX SHORT RALLY CONTINUES – LOCK IN GAINS NOW! 🐻
📊 Liquidity hunters are draining the upward thrust on $DOT , $SOL and $AVAX , flipping the order flow into a swift bearish wave. The smart money is sweeping the last long pools, and each dip is being gobbled by whales. 🦈
⚡ Volume spikes on the 1‑hour chart confirm the sell‑off, while the RSI plunges under 40, signalling oversold pressure ready to be reclaimed. Lock those profits now before the market tries to re‑ignite the rally. 💬 Are you scaling into the short or waiting for the next liquidity trap? 👇
⚠️ Not financial advice. Always manage your risk. 🛡️
🏷️ #DOT #ShortSetup #Bearish #Crypto
🐻 🚀
🚨 $DOT $SOL $AVAX SHORT RALLY CONTINUES – LOCK IN GAINS NOW! 🐻
📊 Liquidity hunters are draining the upward thrust on $DOT , $SOL and $AVAX , flipping the order flow into a swift bearish wave. The smart money is sweeping the last long pools, and each dip is being gobbled by whales. 🦈
⚡ Volume spikes on the 1‑hour chart confirm the sell‑off, while the RSI plunges under 40, signalling oversold pressure ready to be reclaimed. Lock those profits now before the market tries to re‑ignite the rally. 💬 Are you scaling into the short or waiting for the next liquidity trap? 👇
⚠️ Not financial advice. Always manage your risk. 🛡️
🏷️ #DOT #ShortSetup #Bearish #Crypto
🐻 🚀
📊 Liquidity hunters are draining the upward thrust on $DOT , $SOL and $AVAX , flipping the order flow into a swift bearish wave. The smart money is sweeping the last long pools, and each dip is being gobbled by whales. 🦈
⚡ Volume spikes on the 1‑hour chart confirm the sell‑off, while the RSI plunges under 40, signalling oversold pressure ready to be reclaimed. Lock those profits now before the market tries to re‑ignite the rally. 💬 Are you scaling into the short or waiting for the next liquidity trap? 👇
⚠️ Not financial advice. Always manage your risk. 🛡️
🏷️ #DOT #ShortSetup #Bearish #Crypto
🐻 🚀
12

·
--
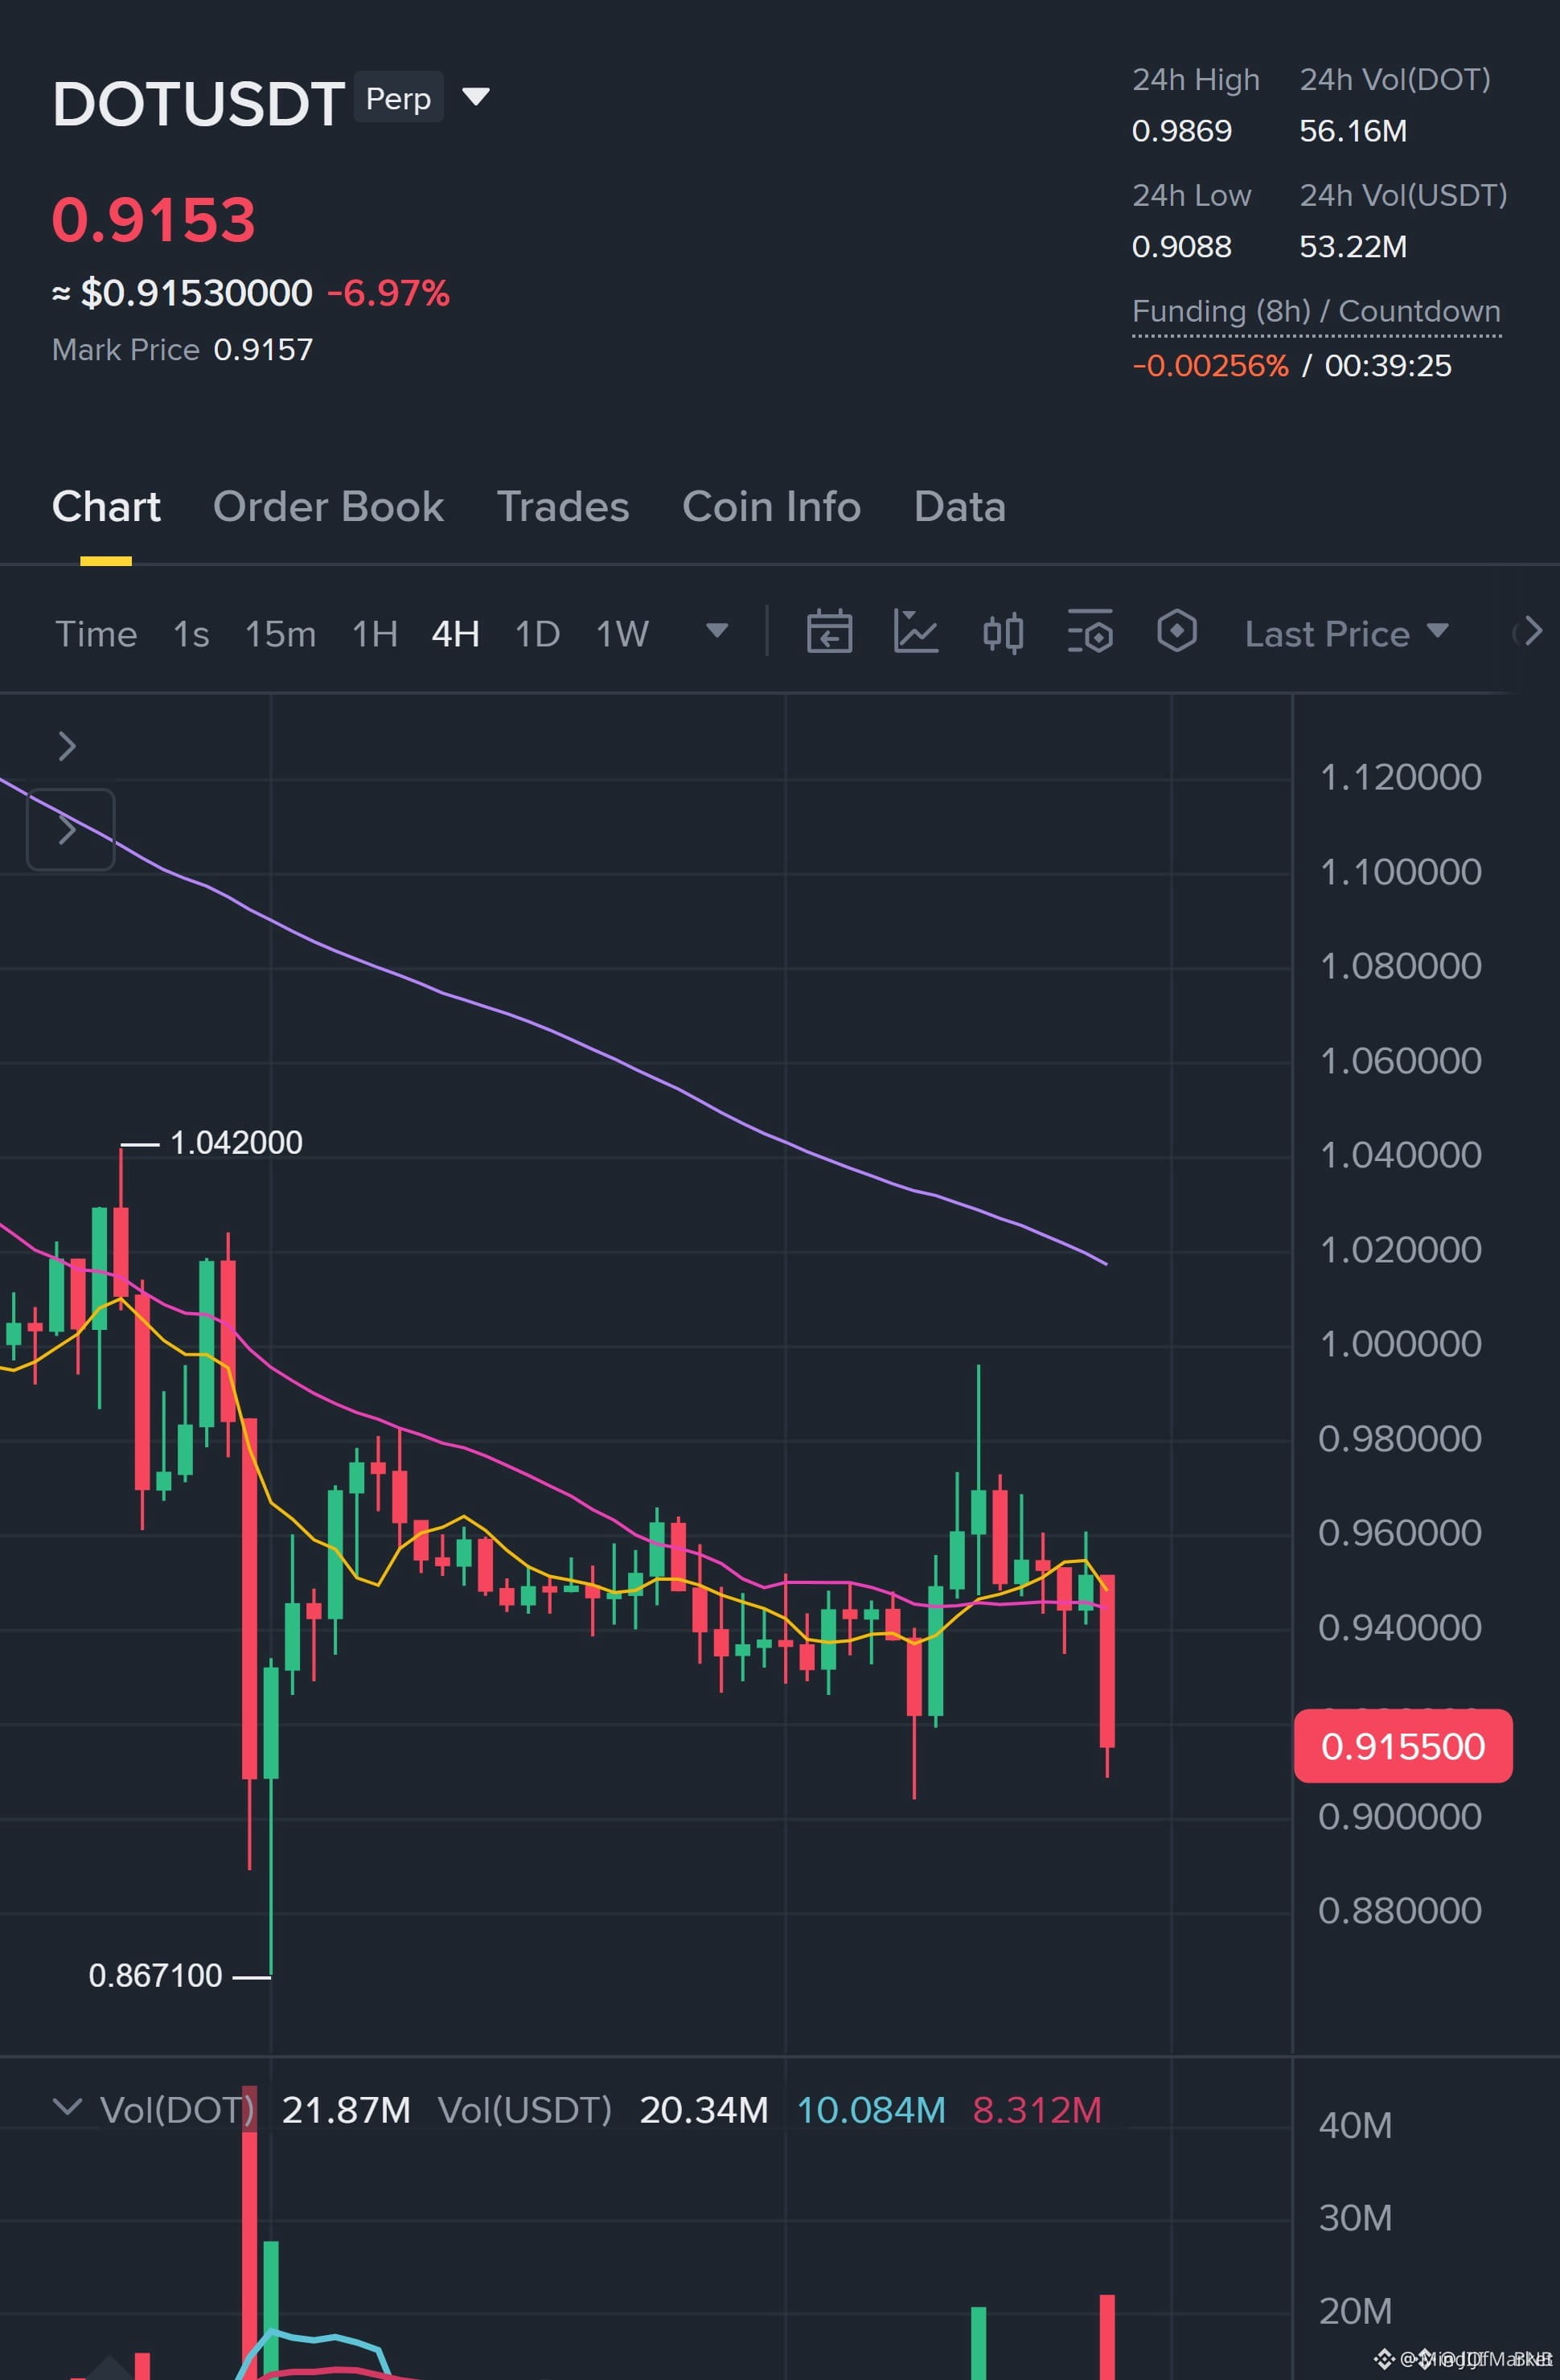
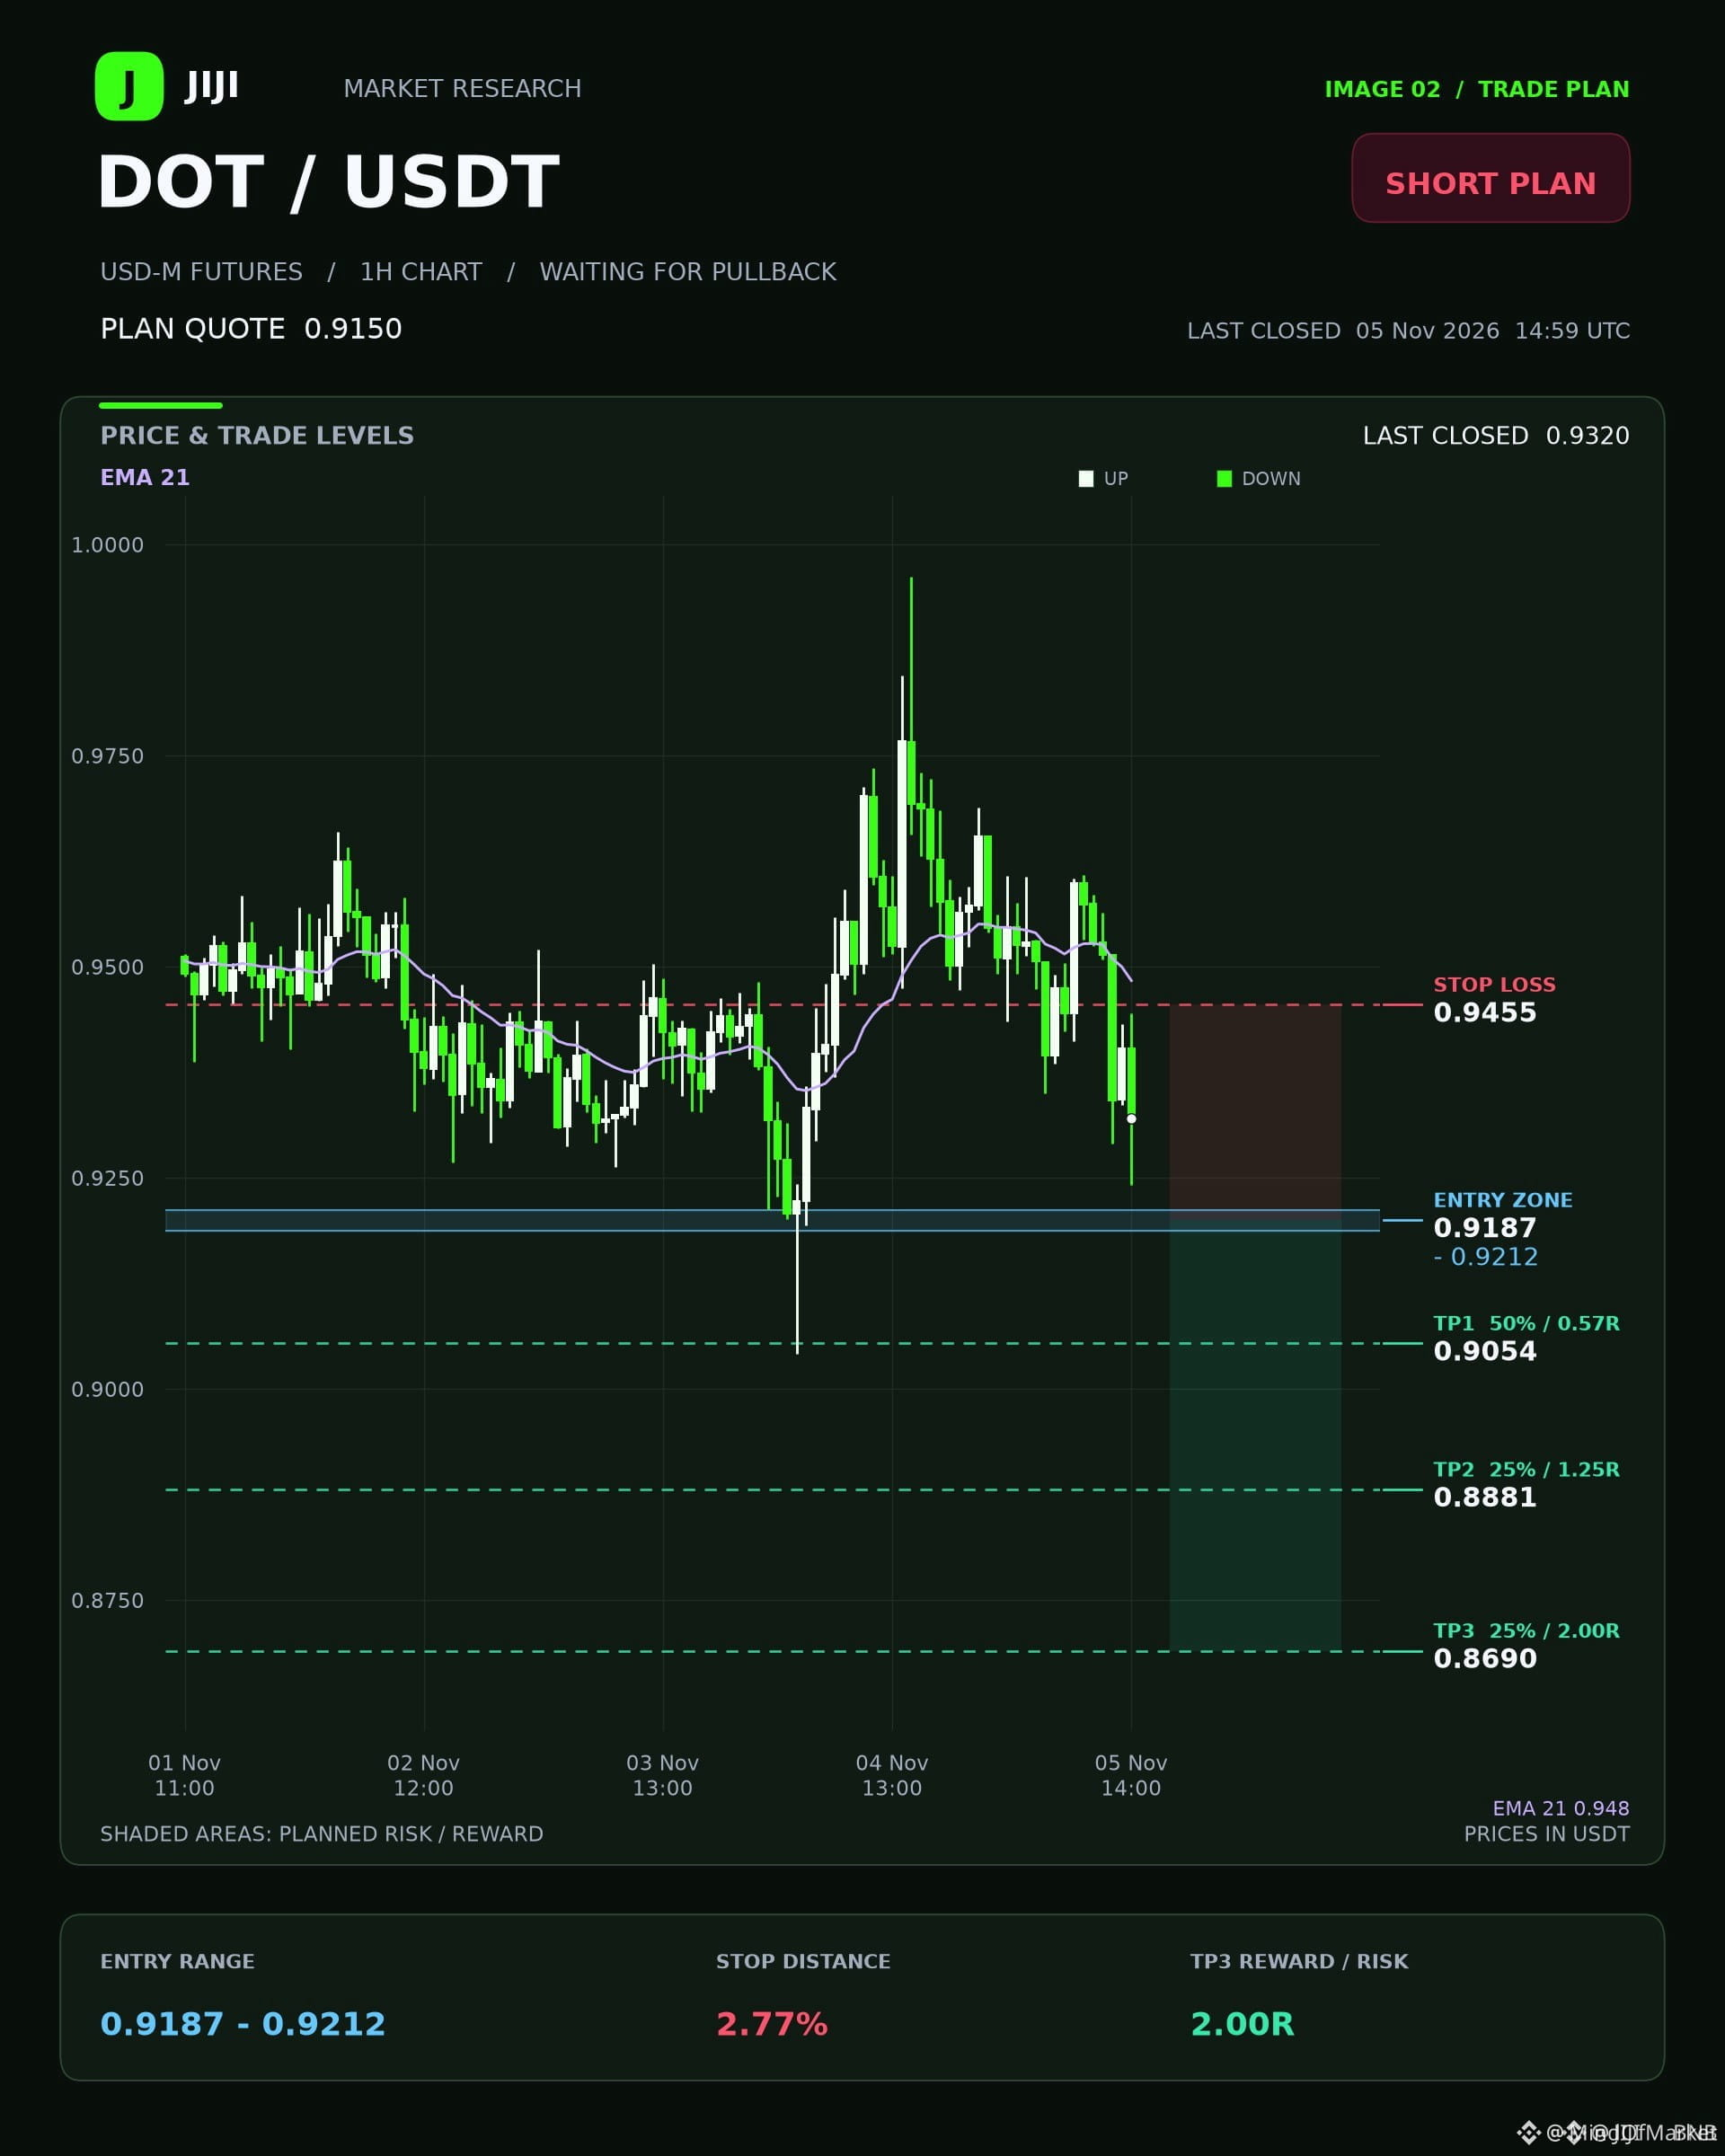
🔴 $DOT SHORT ON LIQUIDITY SWEEP – TARGET 0.9054 📉
Entry: 0.9187-0.9212 ⚡
Target: 0.9054 🚀
Stop Loss: 0.9455 ⚠️
📊 Smart money is draining the 0.92 zone, and the 1H demand block at 0.9042 stands ready to snap price back into the bearish corridor. 🦈 Volume spikes on the 15‑minute candle confirm the pullback pressure, while the RSI is edging into oversold territory, hinting at a deeper decay. 📈 The projected path to TP2 (0.8881) and TP3 (0.869) aligns with the historic liquidity hunt pattern we’ve seen on Polkadot’s swing cycles. 💬 Do you see the next liquidity pool forming below 0.9042? 👇
⚠️ Not financial advice. Always manage your risk. 🛡️
🏷️ #DOT #ShortSetup #Liquidity #Crypto #RiskManagement
🦈 🔥
🔴 $DOT SHORT ON LIQUIDITY SWEEP – TARGET 0.9054 📉
Entry: 0.9187-0.9212 ⚡
Target: 0.9054 🚀
Stop Loss: 0.9455 ⚠️
📊 Smart money is draining the 0.92 zone, and the 1H demand block at 0.9042 stands ready to snap price back into the bearish corridor. 🦈 Volume spikes on the 15‑minute candle confirm the pullback pressure, while the RSI is edging into oversold territory, hinting at a deeper decay. 📈 The projected path to TP2 (0.8881) and TP3 (0.869) aligns with the historic liquidity hunt pattern we’ve seen on Polkadot’s swing cycles. 💬 Do you see the next liquidity pool forming below 0.9042? 👇
⚠️ Not financial advice. Always manage your risk. 🛡️
🏷️ #DOT #ShortSetup #Liquidity #Crypto #RiskManagement
🦈 🔥
Entry: 0.9187-0.9212 ⚡
Target: 0.9054 🚀
Stop Loss: 0.9455 ⚠️
📊 Smart money is draining the 0.92 zone, and the 1H demand block at 0.9042 stands ready to snap price back into the bearish corridor. 🦈 Volume spikes on the 15‑minute candle confirm the pullback pressure, while the RSI is edging into oversold territory, hinting at a deeper decay. 📈 The projected path to TP2 (0.8881) and TP3 (0.869) aligns with the historic liquidity hunt pattern we’ve seen on Polkadot’s swing cycles. 💬 Do you see the next liquidity pool forming below 0.9042? 👇
⚠️ Not financial advice. Always manage your risk. 🛡️
🏷️ #DOT #ShortSetup #Liquidity #Crypto #RiskManagement
🦈 🔥
25

·
--
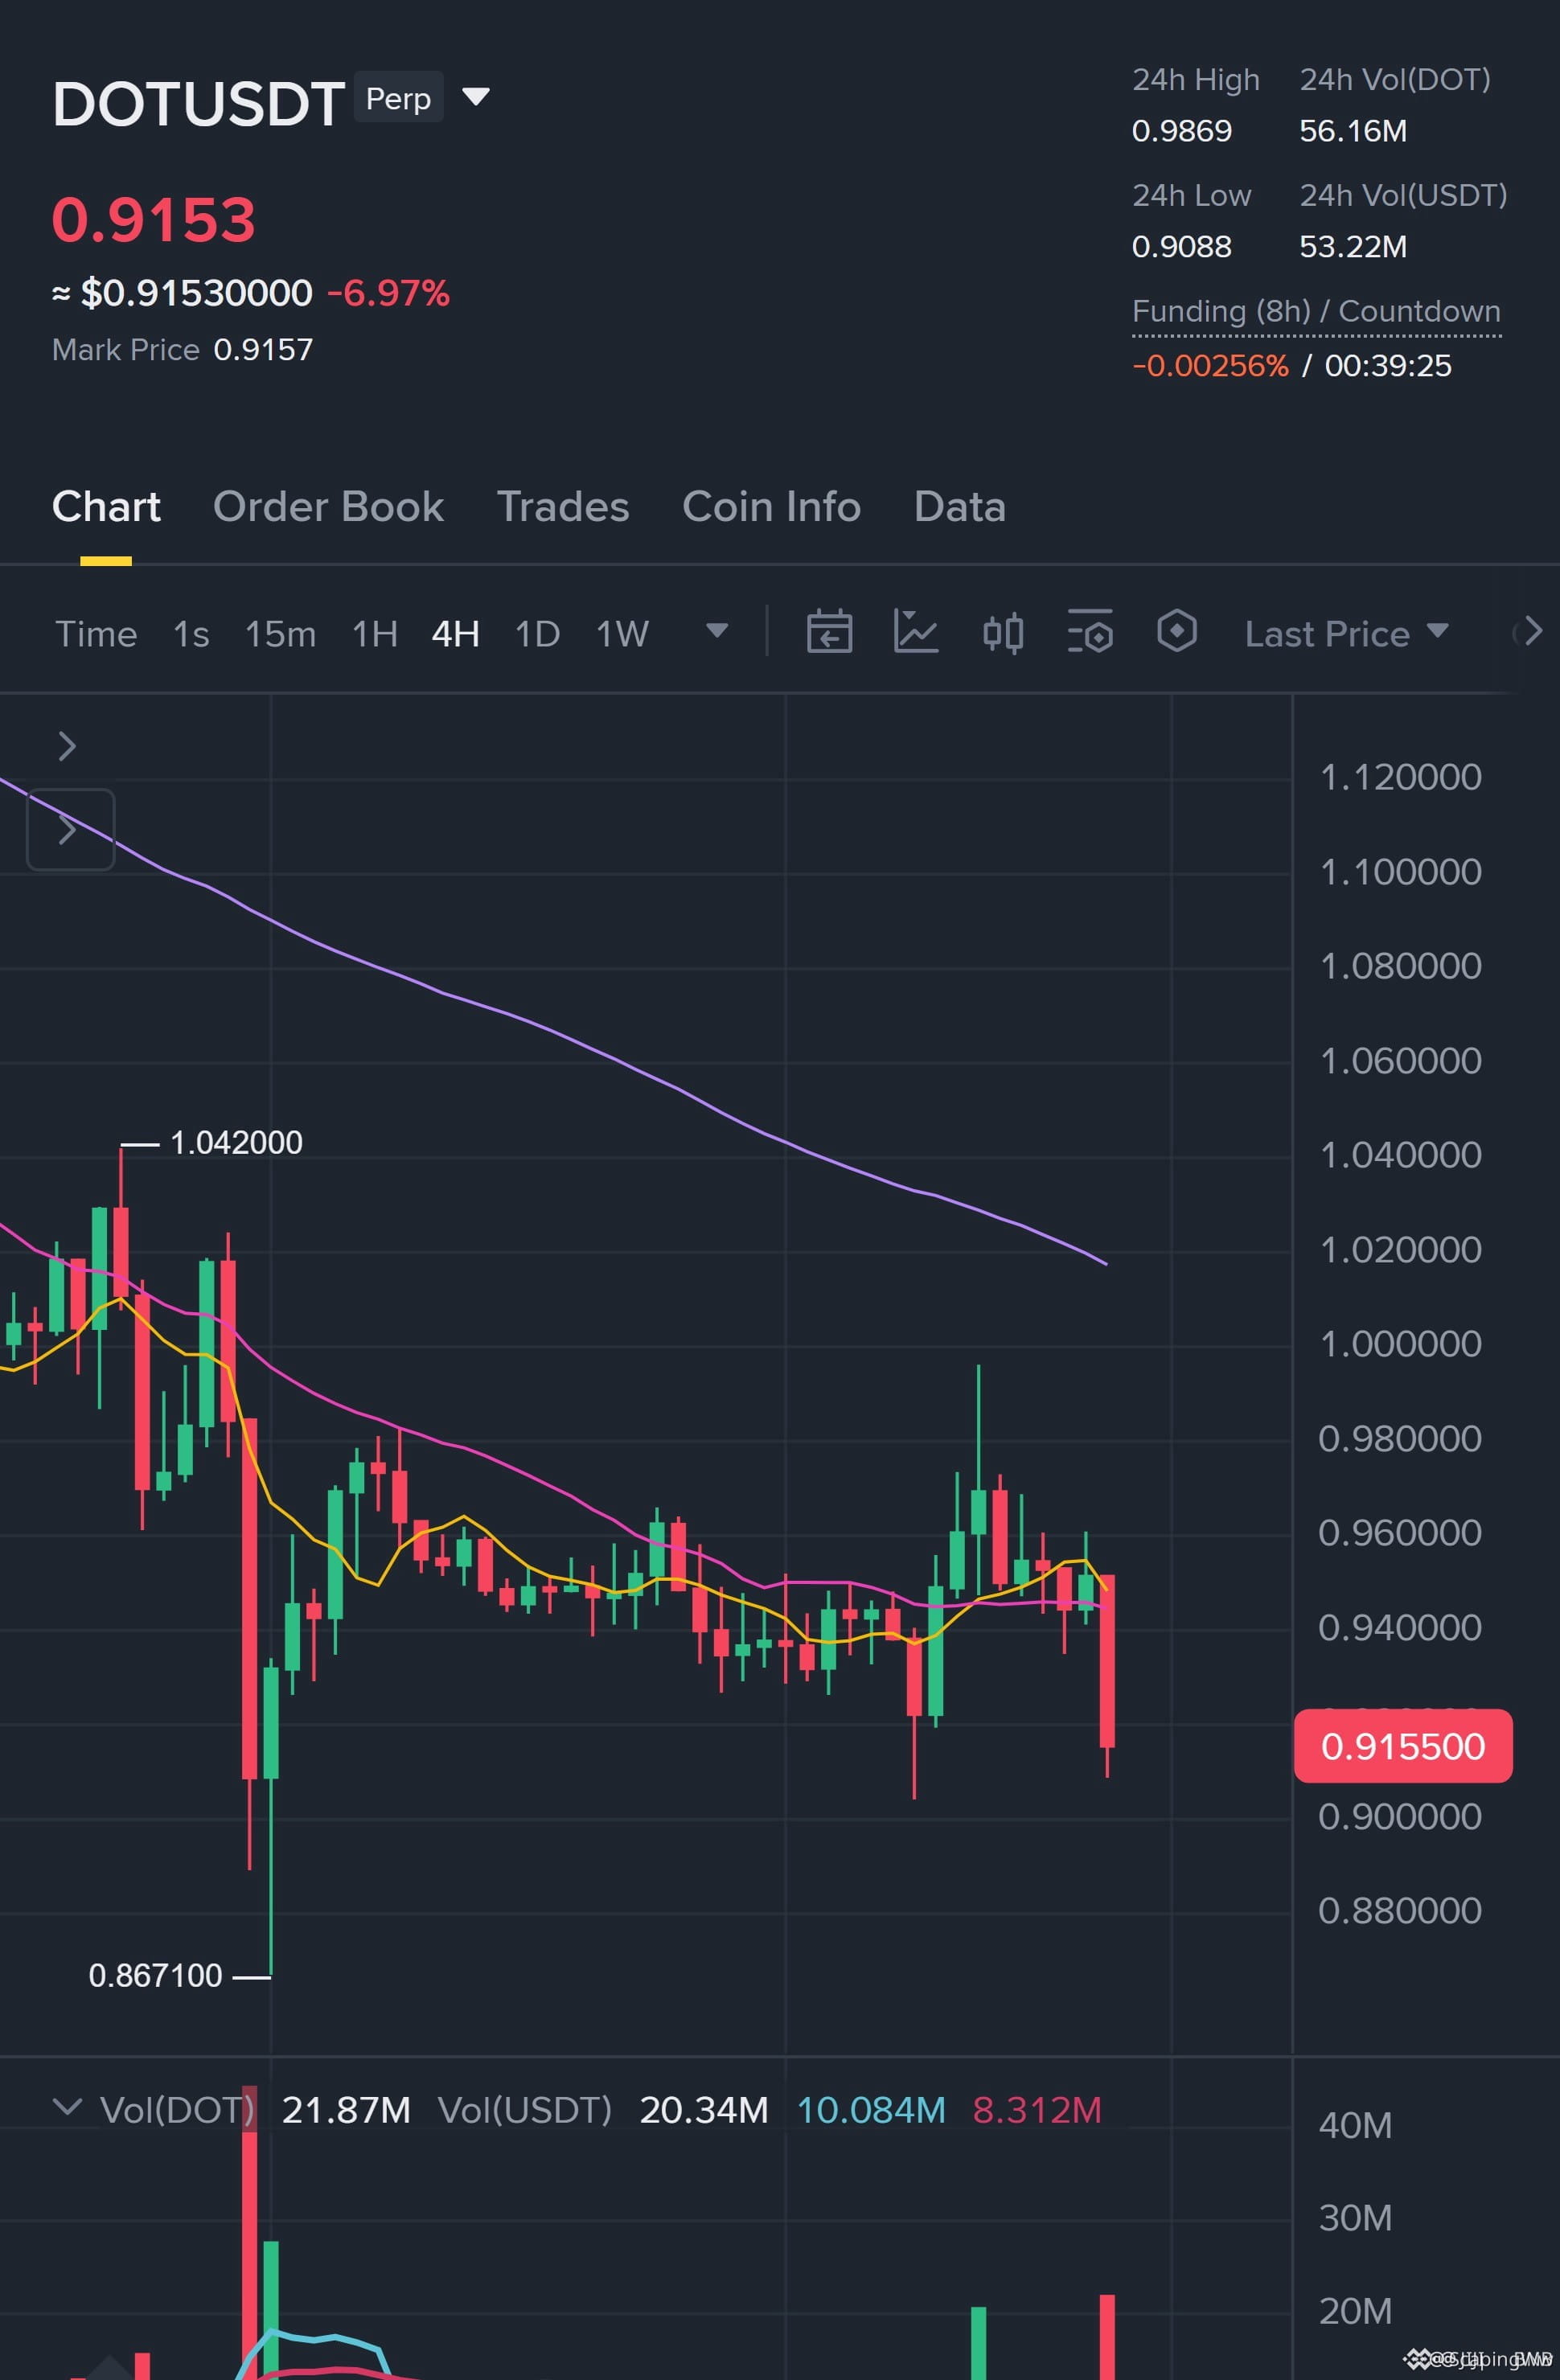
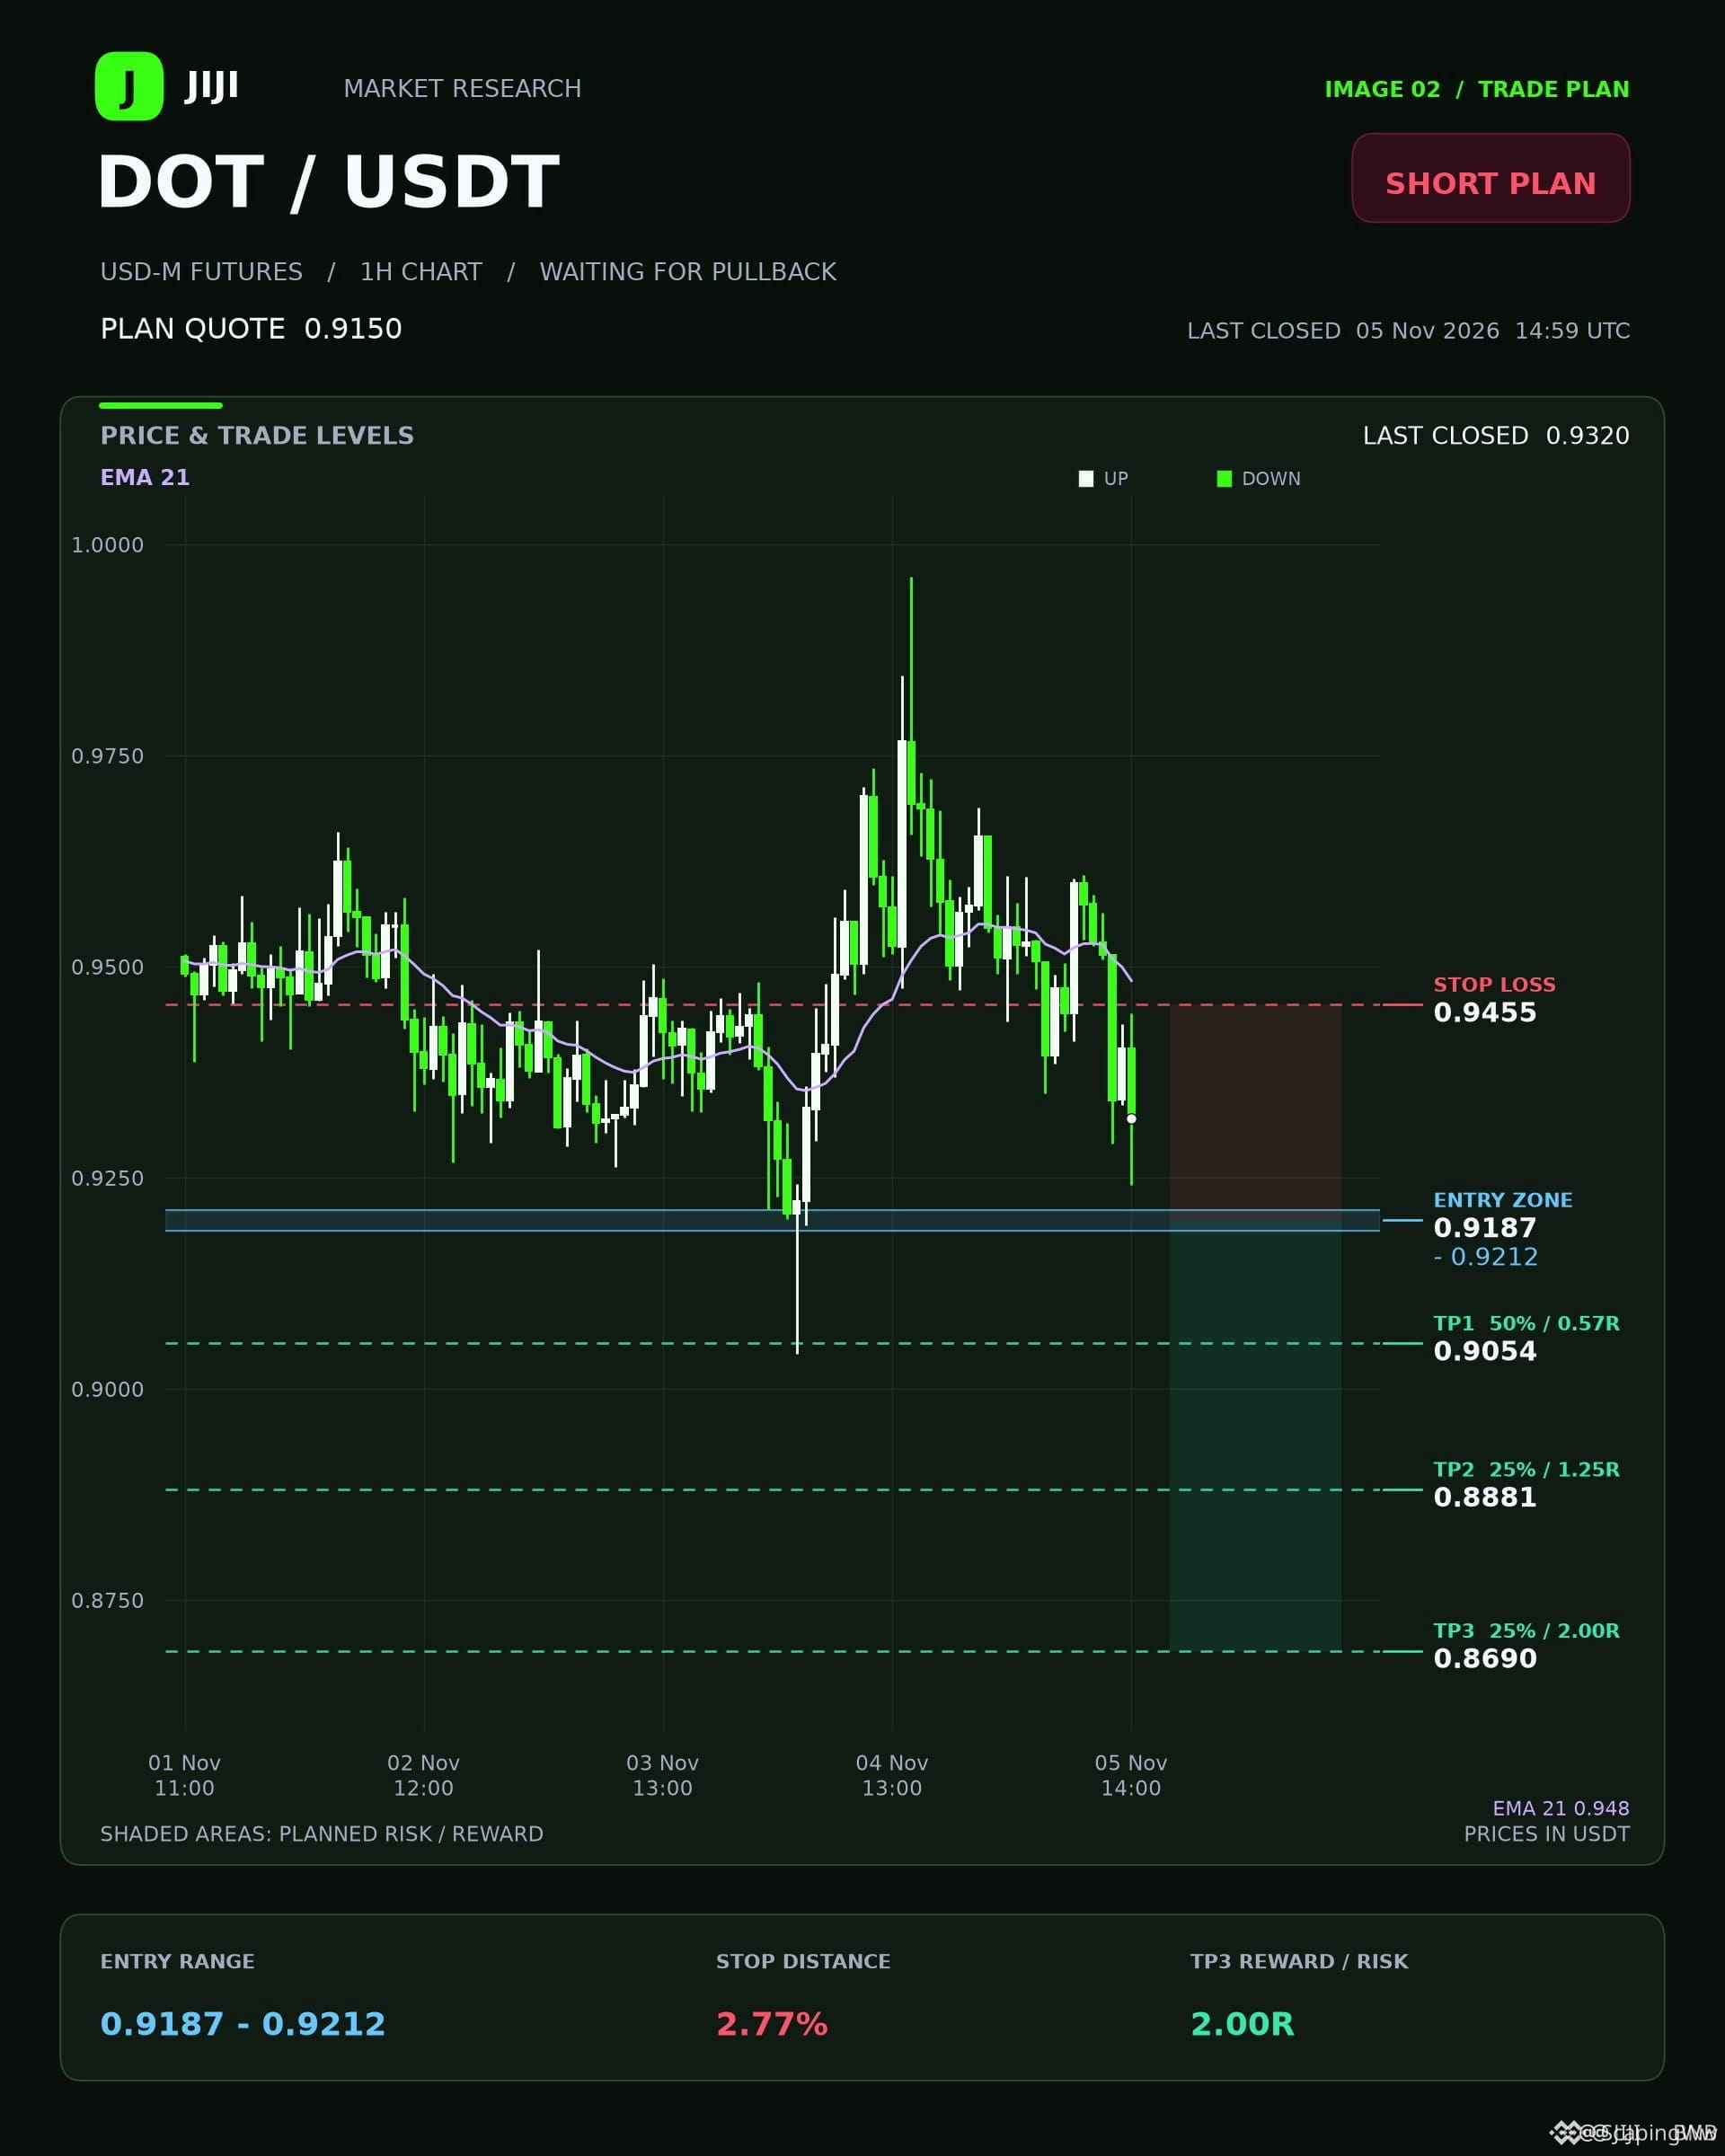
🚨 $DOT SHORT ALERT: LIQUIDITY SWEEP BREWS BELOW 0.92 🐻
Entry: 0.9187‑0.9212 ⚡
Target: 0.9054 🎯
Stop Loss: 0.9455 ⚠️
📊 The 1‑hour chart is whispering a bearish pivot as price eyes the tight 0.9187‑0.9212 band. A closed 15‑minute candle with a lower‑close confirms the sellers are tightening the net, while the 0.9042 support looms as a potential choke point. 🦈 Smart money is likely draining liquidity, setting the stage for a swift dive toward the 0.8881 projection if the first target holds. 💡 Momentum is building on the downside, and the funding landscape stays neutral.
💬 Are you ready to ride the pullback and lock in that 0.43R edge? 👇
⚠️ Not financial advice. Always manage your risk. 🛡️
🏷️ #DOT #ShortSetup #Crypto #Futures
🔥 💎
🚨 $DOT SHORT ALERT: LIQUIDITY SWEEP BREWS BELOW 0.92 🐻
Entry: 0.9187‑0.9212 ⚡
Target: 0.9054 🎯
Stop Loss: 0.9455 ⚠️
📊 The 1‑hour chart is whispering a bearish pivot as price eyes the tight 0.9187‑0.9212 band. A closed 15‑minute candle with a lower‑close confirms the sellers are tightening the net, while the 0.9042 support looms as a potential choke point. 🦈 Smart money is likely draining liquidity, setting the stage for a swift dive toward the 0.8881 projection if the first target holds. 💡 Momentum is building on the downside, and the funding landscape stays neutral.
💬 Are you ready to ride the pullback and lock in that 0.43R edge? 👇
⚠️ Not financial advice. Always manage your risk. 🛡️
🏷️ #DOT #ShortSetup #Crypto #Futures
🔥 💎
Entry: 0.9187‑0.9212 ⚡
Target: 0.9054 🎯
Stop Loss: 0.9455 ⚠️
📊 The 1‑hour chart is whispering a bearish pivot as price eyes the tight 0.9187‑0.9212 band. A closed 15‑minute candle with a lower‑close confirms the sellers are tightening the net, while the 0.9042 support looms as a potential choke point. 🦈 Smart money is likely draining liquidity, setting the stage for a swift dive toward the 0.8881 projection if the first target holds. 💡 Momentum is building on the downside, and the funding landscape stays neutral.
💬 Are you ready to ride the pullback and lock in that 0.43R edge? 👇
⚠️ Not financial advice. Always manage your risk. 🛡️
🏷️ #DOT #ShortSetup #Crypto #Futures
🔥 💎
15

·
--
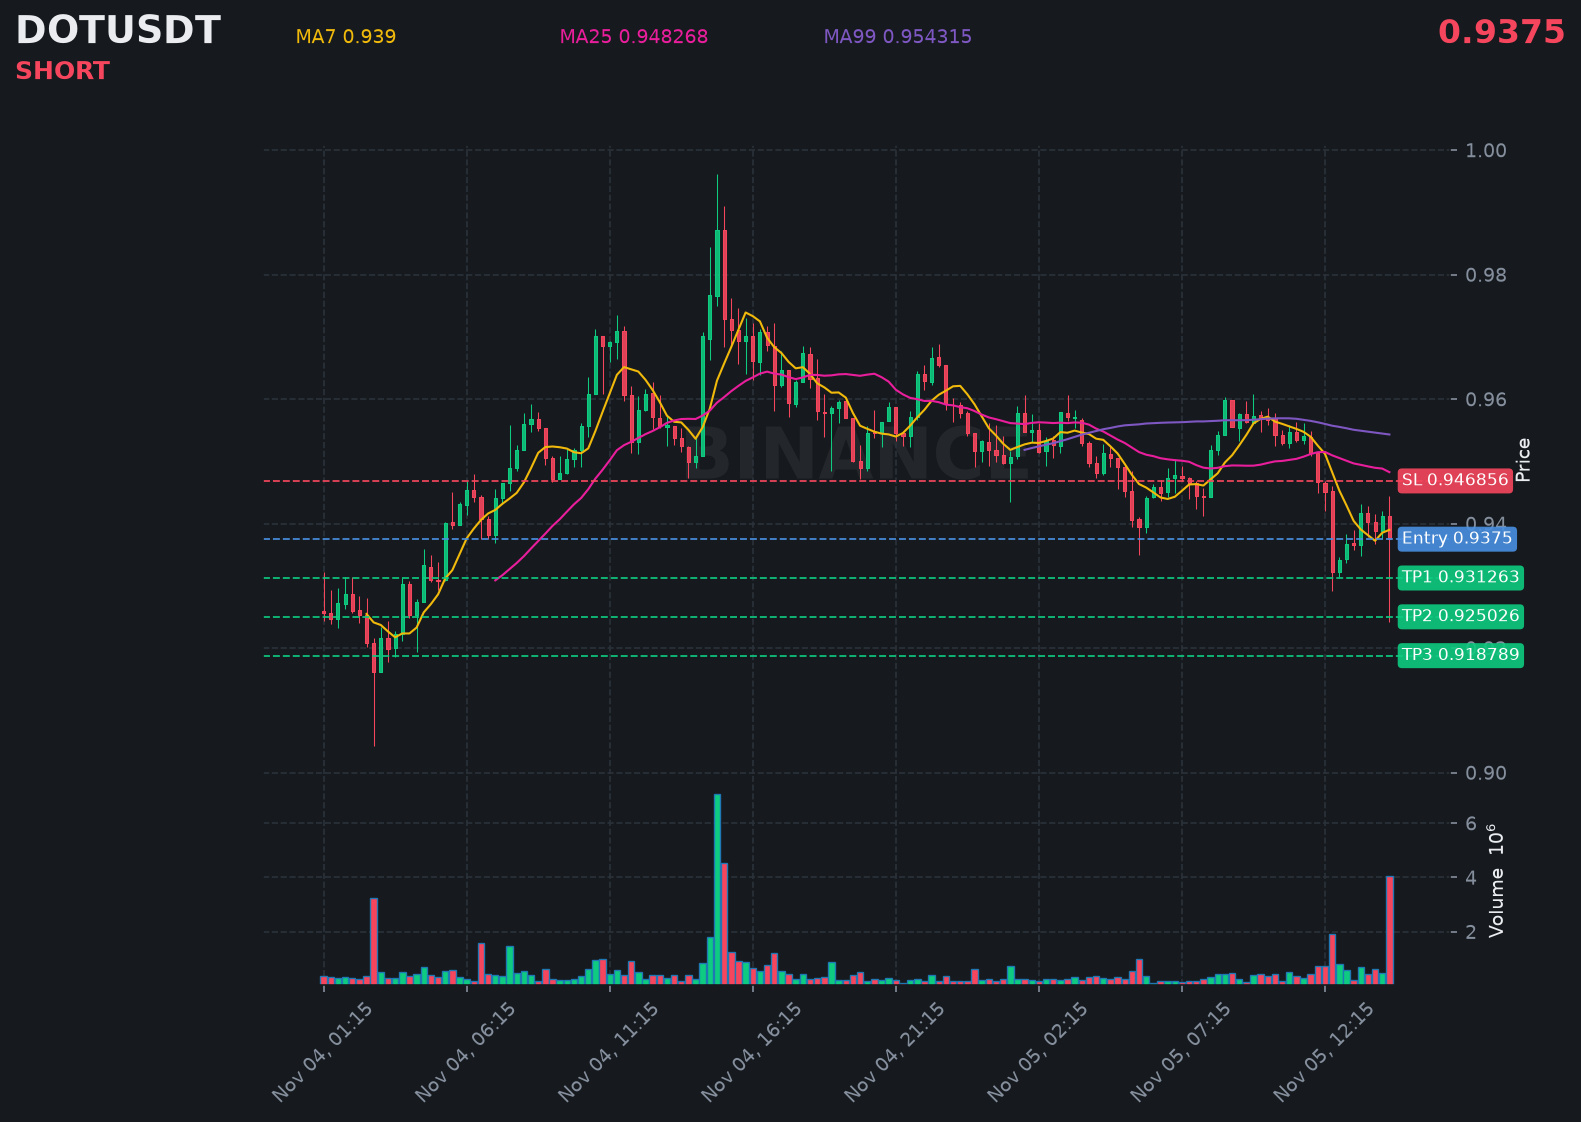
$DOT is struggling below resistance, hinting at another leg down in the coming hours.
📍 @ 0.9375 | Volume: 3.79M USD
RSI 39 | EMA20: 0.94373 USD
📈 Trade Plan:
📈 Entry: 0.935629 – 0.939371
🛑 Stop Loss: 0.946856
🎯 TP1: 0.931263
🎯 TP2: 0.925026
🎯 TP3: 0.918789
Waiting for confirmation, then riding the downtrend.
👉 $DOT 👈 Catch it
#DOT
$DOT is struggling below resistance, hinting at another leg down in the coming hours.
📍 @ 0.9375 | Volume: 3.79M USD
RSI 39 | EMA20: 0.94373 USD
📈 Trade Plan:
📈 Entry: 0.935629 – 0.939371
🛑 Stop Loss: 0.946856
🎯 TP1: 0.931263
🎯 TP2: 0.925026
🎯 TP3: 0.918789
Waiting for confirmation, then riding the downtrend.
👉 $DOT 👈 Catch it
#DOT
📍 @ 0.9375 | Volume: 3.79M USD
RSI 39 | EMA20: 0.94373 USD
📈 Trade Plan:
📈 Entry: 0.935629 – 0.939371
🛑 Stop Loss: 0.946856
🎯 TP1: 0.931263
🎯 TP2: 0.925026
🎯 TP3: 0.918789
Waiting for confirmation, then riding the downtrend.
👉 $DOT 👈 Catch it
#DOT
49
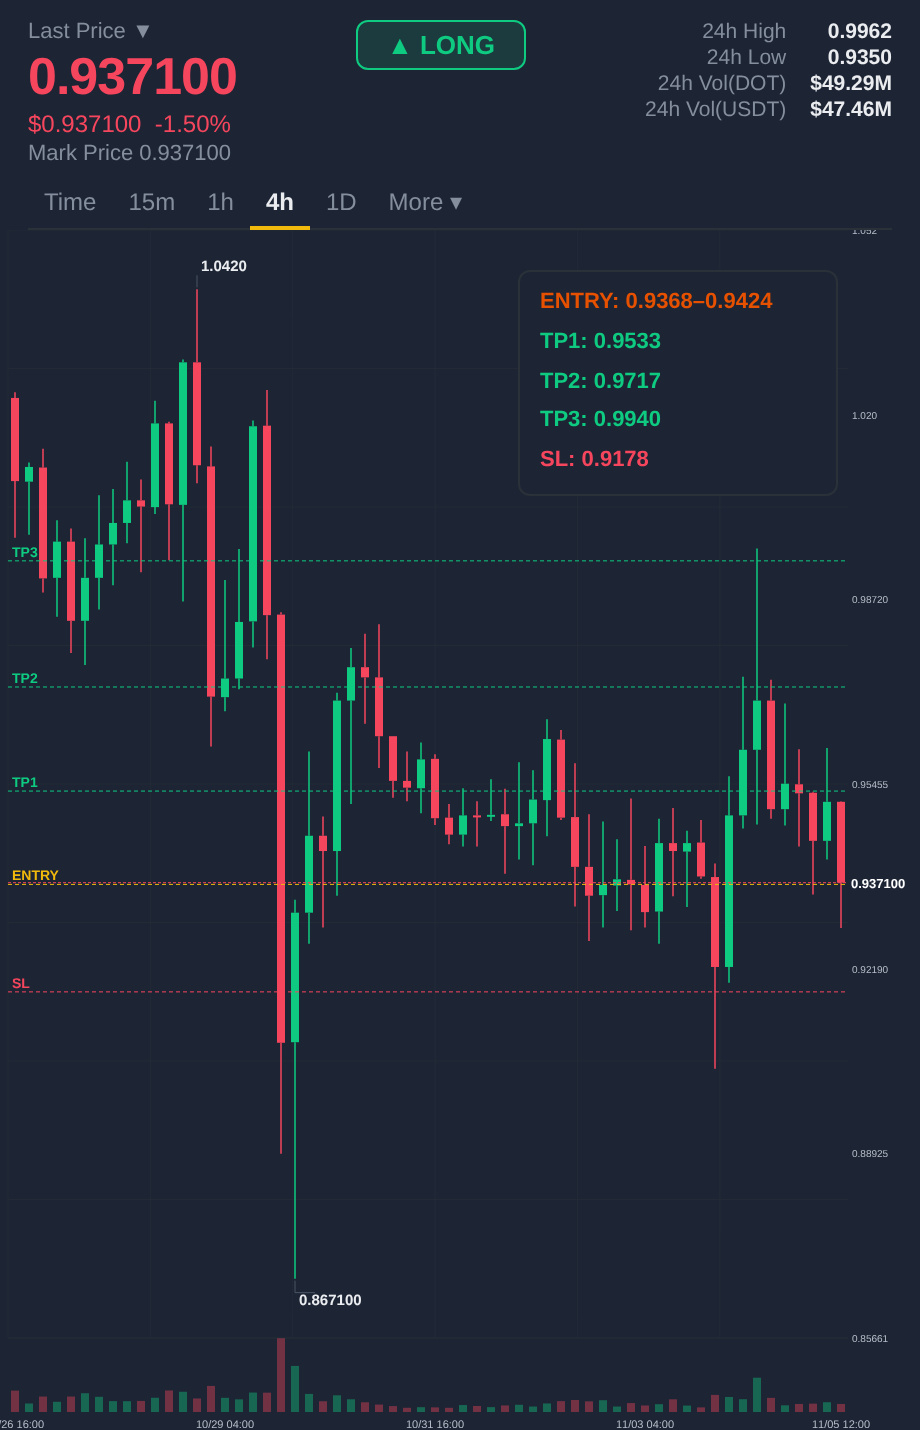
$DOT: The Learning Angle: When the Candle Runs Faster Than the Checklist: Without Rushing the Conclusion
I once tried to write a research note before my morning coffee, only to discover the candle had already sprinted ahead. The watchlist was calm, my mind was a hamster on a wheel. In the case of $DOT the hourly direction is down while volume sits above baseline, a classic sign that traders are still active even as price slides.
Why do we fall into that trap? We love a clean rule: "If price drops and volume stays high, stay out." Yet the brain craves a story, so the moment a fast move appears we scramble to rewrite the rule on the fly. It feels logical – more activity should mean a stronger move – but the data only says the market is debating, not that it will continue.
A better habit is to pause and let the candle finish before adjusting the checklist. Take the relative volume figure 3.38701 and compare it to the usual baseline; if it is merely above, note the tension but wait for a confirmation such as a break of the 0.952762 or a shift in 52.7807. This extra step turns a reactive impulse into a measured observation.
Lesson: let the market finish its sentence before you edit the grammar of your strategy.
Probabilistic market research, not a recommendation or guaranteed return.
Have you caught yourself changing a rule after seeing a fast move?
#DOT #LearnCrypto #CryptoLearning
$DOT : The Learning Angle: When the Candle Runs Faster Than the Checklist: Without Rushing the Conclusion
I once tried to write a research note before my morning coffee, only to discover the candle had already sprinted ahead. The watchlist was calm, my mind was a hamster on a wheel. In the case of $DOT the hourly direction is down while volume sits above baseline, a classic sign that traders are still active even as price slides.
Why do we fall into that trap? We love a clean rule: "If price drops and volume stays high, stay out." Yet the brain craves a story, so the moment a fast move appears we scramble to rewrite the rule on the fly. It feels logical – more activity should mean a stronger move – but the data only says the market is debating, not that it will continue.
A better habit is to pause and let the candle finish before adjusting the checklist. Take the relative volume figure 3.38701 and compare it to the usual baseline; if it is merely above, note the tension but wait for a confirmation such as a break of the 0.952762 or a shift in 52.7807. This extra step turns a reactive impulse into a measured observation.
Lesson: let the market finish its sentence before you edit the grammar of your strategy.
Probabilistic market research, not a recommendation or guaranteed return.
Have you caught yourself changing a rule after seeing a fast move?
#DOT #LearnCrypto #CryptoLearning
I once tried to write a research note before my morning coffee, only to discover the candle had already sprinted ahead. The watchlist was calm, my mind was a hamster on a wheel. In the case of $DOT the hourly direction is down while volume sits above baseline, a classic sign that traders are still active even as price slides.
Why do we fall into that trap? We love a clean rule: "If price drops and volume stays high, stay out." Yet the brain craves a story, so the moment a fast move appears we scramble to rewrite the rule on the fly. It feels logical – more activity should mean a stronger move – but the data only says the market is debating, not that it will continue.
A better habit is to pause and let the candle finish before adjusting the checklist. Take the relative volume figure 3.38701 and compare it to the usual baseline; if it is merely above, note the tension but wait for a confirmation such as a break of the 0.952762 or a shift in 52.7807. This extra step turns a reactive impulse into a measured observation.
Lesson: let the market finish its sentence before you edit the grammar of your strategy.
Probabilistic market research, not a recommendation or guaranteed return.
Have you caught yourself changing a rule after seeing a fast move?
#DOT #LearnCrypto #CryptoLearning
27
·
--
🔴 $DOT SHORT IS SETTING UP A LIQUIDITY SWEEP! ⚡
Entry: 0.944-0.962 ⚡
Target: 0.925 🚀
Target: 0.896 🚀
Target: 0.877 🚀
Stop Loss: 1.035 ⚠️
The market is carving a clean downside corridor as smart money drains liquidity above the 1.00 barrier. The order block at 0.962‑0.944 is now acting as a supply zone, and volume spikes on the 4H chart confirm aggressive sell pressure. 📊
A swift break below 0.944 could trigger the first target at 0.925, with the ladder extending to 0.896 and 0.877 as the bears continue to hunt remaining longs. 🦈⚡
Watch the 1.035 stop; a bounce there would suggest a premature reversal and a fresh accumulation phase. 📌
💬 Are you ready to ride this bearish wave or waiting for a deeper liquidity dump? 👇
⚠️ Not financial advice. Always manage your risk. 🛡️
🏷️ #DOT #ShortSetup #Liquidity #Crypto
🦈 🔥
🔴 $DOT SHORT IS SETTING UP A LIQUIDITY SWEEP! ⚡
Entry: 0.944-0.962 ⚡
Target: 0.925 🚀
Target: 0.896 🚀
Target: 0.877 🚀
Stop Loss: 1.035 ⚠️
The market is carving a clean downside corridor as smart money drains liquidity above the 1.00 barrier. The order block at 0.962‑0.944 is now acting as a supply zone, and volume spikes on the 4H chart confirm aggressive sell pressure. 📊
A swift break below 0.944 could trigger the first target at 0.925, with the ladder extending to 0.896 and 0.877 as the bears continue to hunt remaining longs. 🦈⚡
Watch the 1.035 stop; a bounce there would suggest a premature reversal and a fresh accumulation phase. 📌
💬 Are you ready to ride this bearish wave or waiting for a deeper liquidity dump? 👇
⚠️ Not financial advice. Always manage your risk. 🛡️
🏷️ #DOT #ShortSetup #Liquidity #Crypto
🦈 🔥
Entry: 0.944-0.962 ⚡
Target: 0.925 🚀
Target: 0.896 🚀
Target: 0.877 🚀
Stop Loss: 1.035 ⚠️
The market is carving a clean downside corridor as smart money drains liquidity above the 1.00 barrier. The order block at 0.962‑0.944 is now acting as a supply zone, and volume spikes on the 4H chart confirm aggressive sell pressure. 📊
A swift break below 0.944 could trigger the first target at 0.925, with the ladder extending to 0.896 and 0.877 as the bears continue to hunt remaining longs. 🦈⚡
Watch the 1.035 stop; a bounce there would suggest a premature reversal and a fresh accumulation phase. 📌
💬 Are you ready to ride this bearish wave or waiting for a deeper liquidity dump? 👇
⚠️ Not financial advice. Always manage your risk. 🛡️
🏷️ #DOT #ShortSetup #Liquidity #Crypto
🦈 🔥
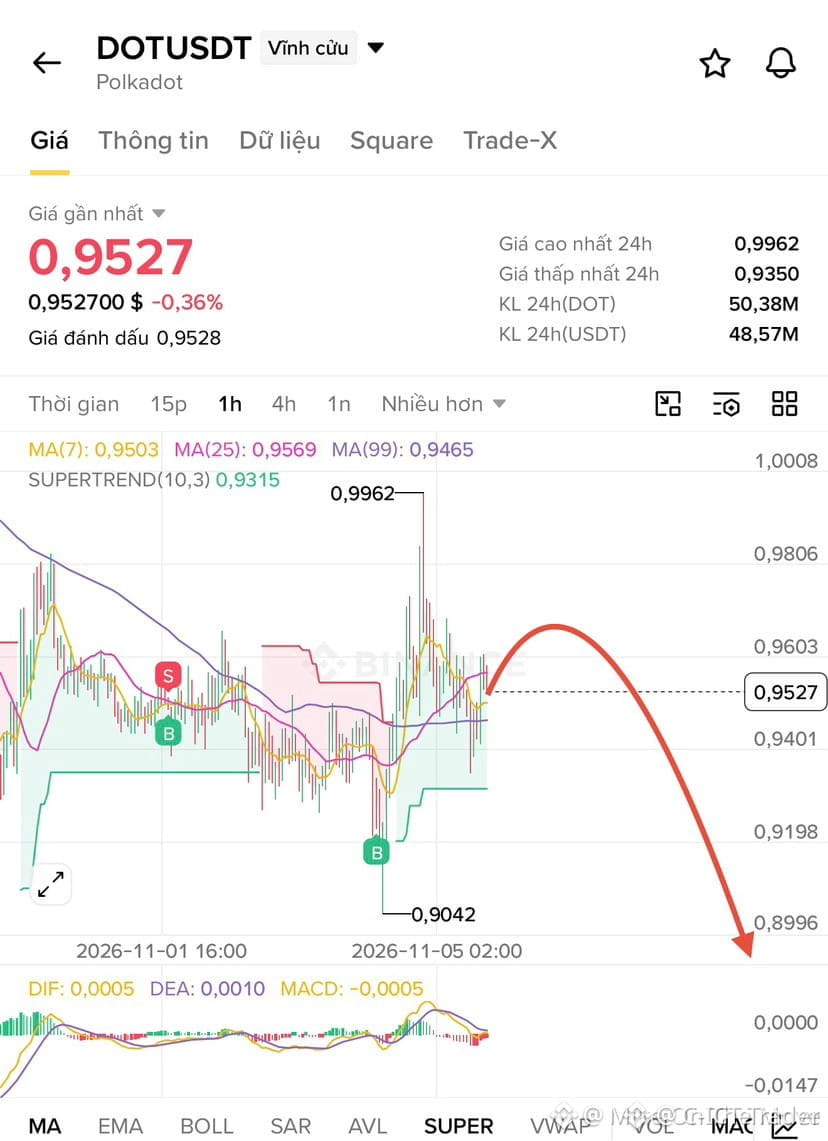
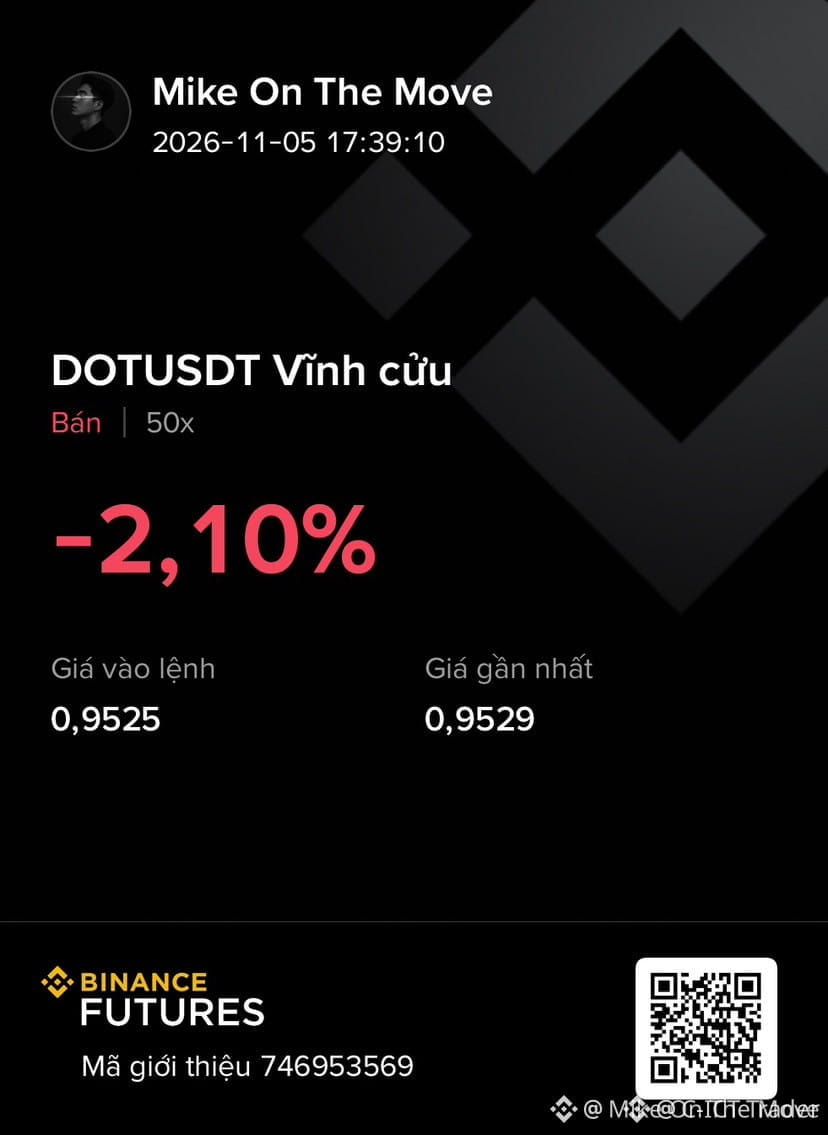
6
Log in to explore more content
Join global crypto users on Binance Square
⚡️ Get latest and useful information about crypto.
💬 Trusted by the world’s largest crypto exchange.
👍 Discover real insights from verified creators.
Email / Phone number
Trending Topics
1
#BitcoinRebounds$75KAsChipsLead
1,082 views
38 Discussing
2
#JobsReportRaisesHikeOdds
41,259 views
614 Discussing
3
#US Data Center Rules May Constrain AI Expansion
5,925 views
67 Discussing
4
#$2TWipedOutHedgeFundsFaceLiquidation
9,003 views
79 Discussing
5
#WillAnthropicListOnTime
2,259 views
96 Discussing
6
#USNovemberMichiganExpectationsIndexPrelimAt50.9
7,927 views
204 Discussing
7
#OilPlungesBelow$100
9,726 views
31 Discussing
8
#TradFiForBeginners
3,994 views
108 Discussing
9
#USMidtermsCouldShakeUpUS-IranTies
23,461 views
381 Discussing
10
#RussianCentralBankNamesBTCETHUSDTForNonQualifiedInvestors
338 views
6 Discussing