

Raad imran
15 Posts

Raad imran
Report
Block User
1 Following
0 Followers
9 Liked
Posts
·
--
$BNB
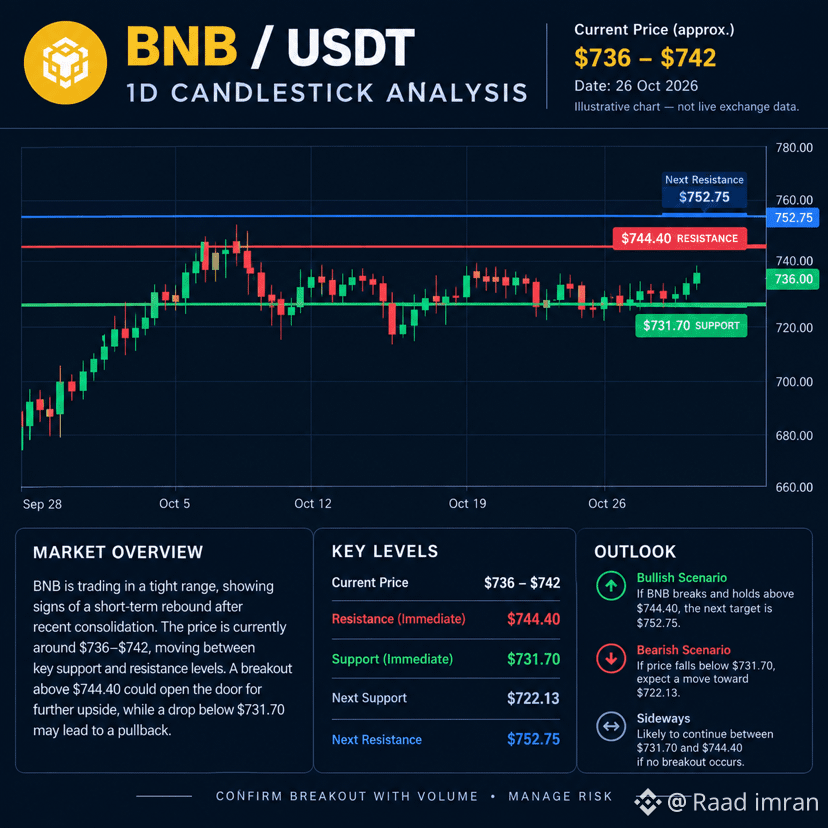
Market overview: BNB is trading around $736–$742, with short-term momentum showing mixed signals. Technical indicators suggest potential bullish momentum, but price confirmation is important before entering a trade.
Support: $731.70, then $722.13.
Resistance: $744.40, then $752.75.
Bullish signal: A strong daily close above $744.40 could support further upside.
Bearish signal: A break below $731.70 could increase selling pressure. 
Trading view: Neutral-to-bullish while BNB holds above support. Wait for a confirmed breakout with volume rather than chasing price.
#BNB #Binance #TradingSignals #USDT #EarningsSeason
38
·
--
🐸 $PEPE Coin
PEPE/USDT | 1D Timeframe
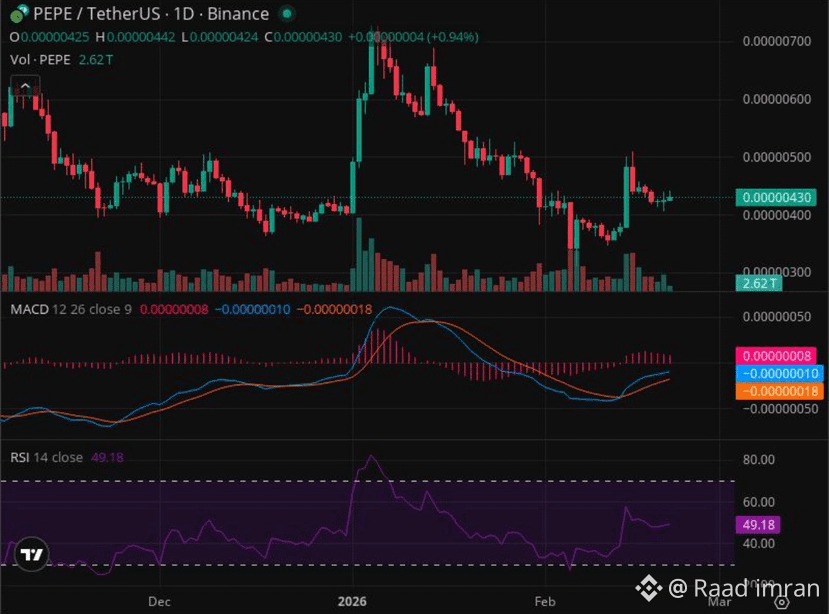
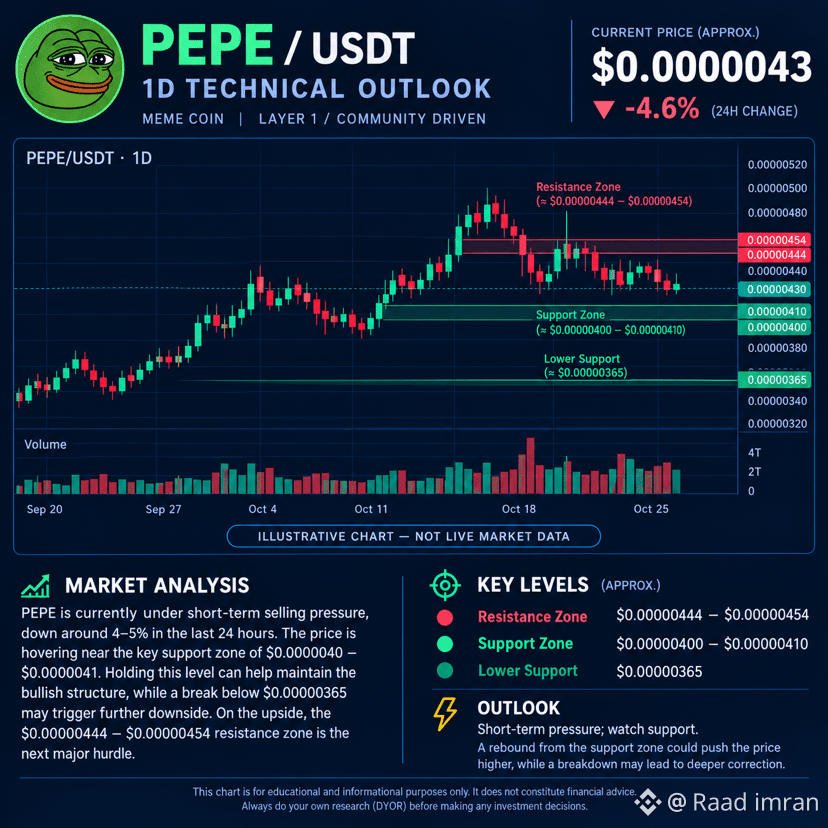
PEPE is facing short-term selling pressure, with its price near $0.0000043 as of October 26, 2026. Key support lies around $0.0000040–$0.0000041, while resistance sits near $0.00000444–$0.00000454. A strong breakout above resistance could signal bullish recovery, but a support breakdown may trigger further downside.
Key levels
🟢 Support: $0.0000040–$0.0000041
🔴 Resistance: $0.00000444–$0.00000454
📉 Lower support: around $0.00000365
Trader outlook: Cautious until buyers reclaim resistance. Watch volume and daily candle closes before considering a breakout trade.
#pepe #CryptoAnalysis #TechnicalAnalysis #PEPEUSDT #CryptoTrading
1
154
·
--
$ERA Coin (Caldera)
#analysis
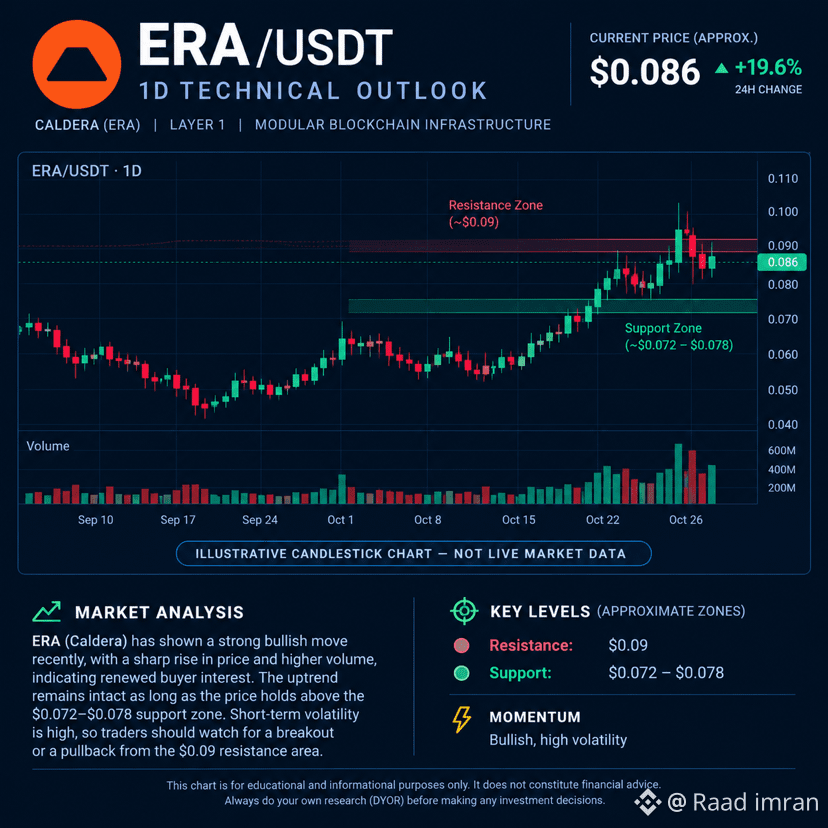
Market outlook: October 26, 2026 | Pair: ERA/USDT | Timeframe: 1D
ERA (Caldera) has shown a strong bullish move, supported by increased trading activity and renewed buying interest. The price is approaching the $0.09 resistance zone, where selling pressure could trigger a pullback. A confirmed breakout with strong volume may support further upside, while a drop below support could weaken momentum.
Trading outlook: Bullish momentum, but volatility is high. A strong daily close above $0.09 with volume would strengthen the bullish case; rejection could lead to consolidation or a pullback toward support. Avoid chasing sudden price spikes, and manage risk carefully.
#ERA #Caldera #ERAUSDT #CryptoAnalysis
1
156
·
--
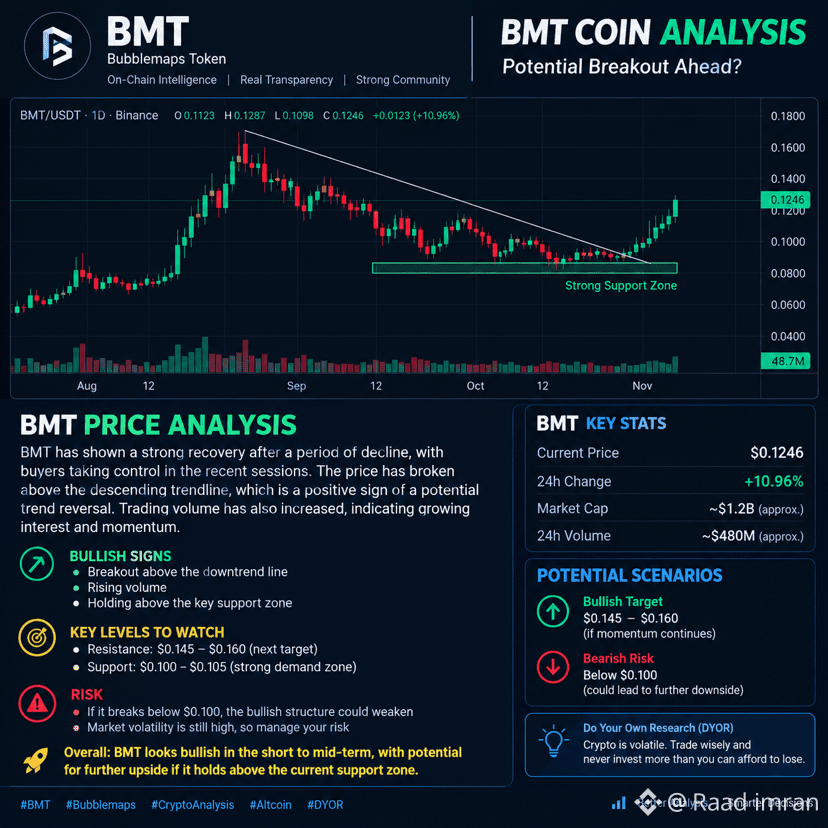
$BMT Coin (BubbleMaps) — Analysis.
BMT/USDT | Technical Outlook: BMT shows bullish momentum after recovering from its downtrend, with a potential breakout supported by rising buying pressure. A sustained move above resistance could open further upside, while a breakdown below key support may trigger renewed selling. Trade cautiously and confirm the trend with live Binance data.
#BMT #Bubblemaps #Binance #TradingStrategy
1
1
172
·
--
📊 $BTC $USDT ✈️
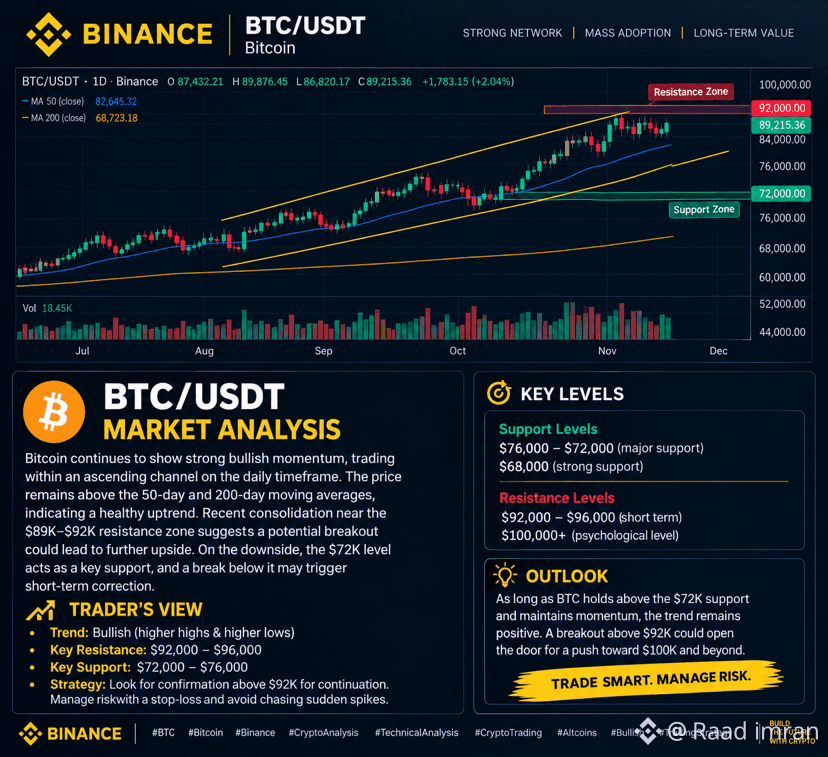
BTC/USDT — Professional Trading Analysis
Bitcoin ( $BTC ) Market Outlook: BTC remains the leading cryptocurrency, with market direction influenced by trading volume, investor sentiment, and key technical levels. A confirmed breakout above resistance could support further upside, while a loss of support may trigger a correction. Traders should wait for candle confirmation, use stop-loss protection, and avoid emotional entries.
#BTC #bitcoin #BTCUSDT #CryptoAnalysis #TechnicalAnalysis
1
71
·
--
$BNB 🔥
$USDT 💰
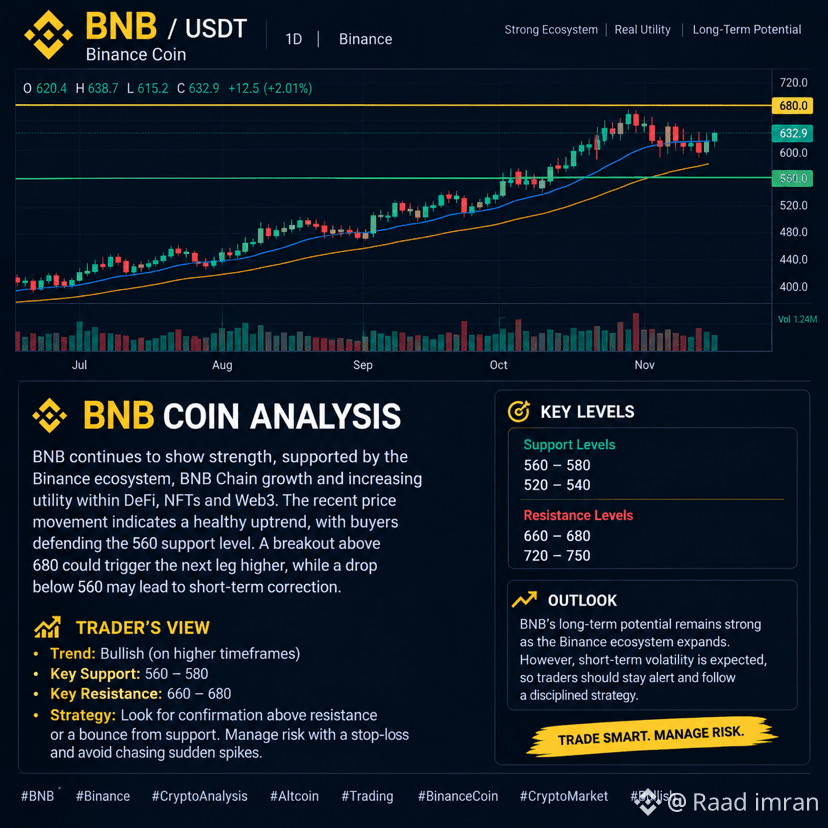
Trader Analysis
Market outlook: BNB has strong ecosystem utility through Binance and BNB Chain. Traders should monitor price action, trading volume, and key support/resistance zones before taking a position. A confirmed breakout may signal further upside, while rejection at resistance could trigger a pullback. Use stop-loss protection and manage risk carefully.
#BNB_Market_Update #Binance #BNBUSDT #CryptoAnalysis #TechnicalAnalysis
16
·
--
🔥 $BNB Coin Analysis:
BNB shows strong ecosystem utility and long-term potential. Watch support, resistance, and volume for breakout signals. Trade strategically and manage risk wisely.
#bnb #Binance #CryptoAnalysis #bullish #CryptoTrading
🔥 $BNB Coin Analysis:
BNB shows strong ecosystem utility and long-term potential. Watch support, resistance, and volume for breakout signals. Trade strategically and manage risk wisely.
#bnb #Binance #CryptoAnalysis #bullish #CryptoTrading
BNB shows strong ecosystem utility and long-term potential. Watch support, resistance, and volume for breakout signals. Trade strategically and manage risk wisely.
#bnb #Binance #CryptoAnalysis #bullish #CryptoTrading
46
·
--
#PEPE #TechnicalAnalysis
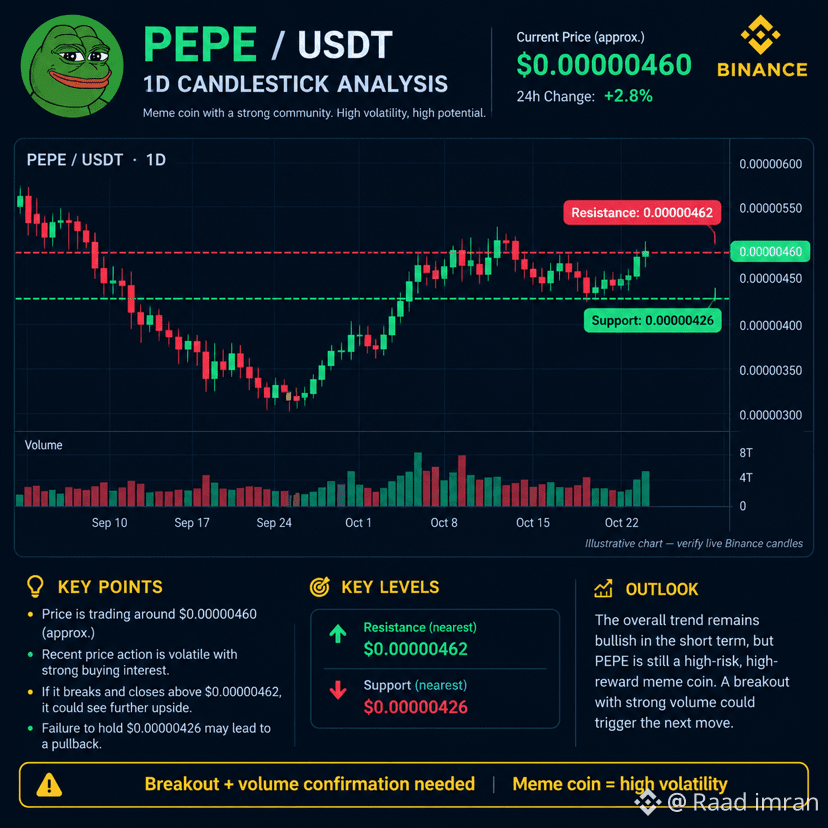
$PEPE Coin Analysis | Binance Post
Timeframe: 1D · October 23, 2026
PEPE/USDT ·
Daily candlestick chart
📊 Market Analysis
$PEPE is showing a potential bullish recovery, with price trading around $0.00000460. The daily technical outlook is positive, but strong confirmation is needed before expecting another upward move. 
Resistance: $0.00000462
Support: $0.00000426
Bullish signal: A daily candle closing above resistance with strong volume.
Bearish signal: A breakdown below support could trigger further selling.
My outlook: PEPE could continue upward if buyers maintain momentum. However, meme coins are highly volatile, so manage risk carefully and avoid chasing sudden pumps.
Chart note: The image is illustrative, not a verified live Binance chart. Price levels are approximate reference levels from published technical analysis; verify current candles before trading.
#PEPEUSDT #Binance #CryptoAnalysis
1
76
·
--
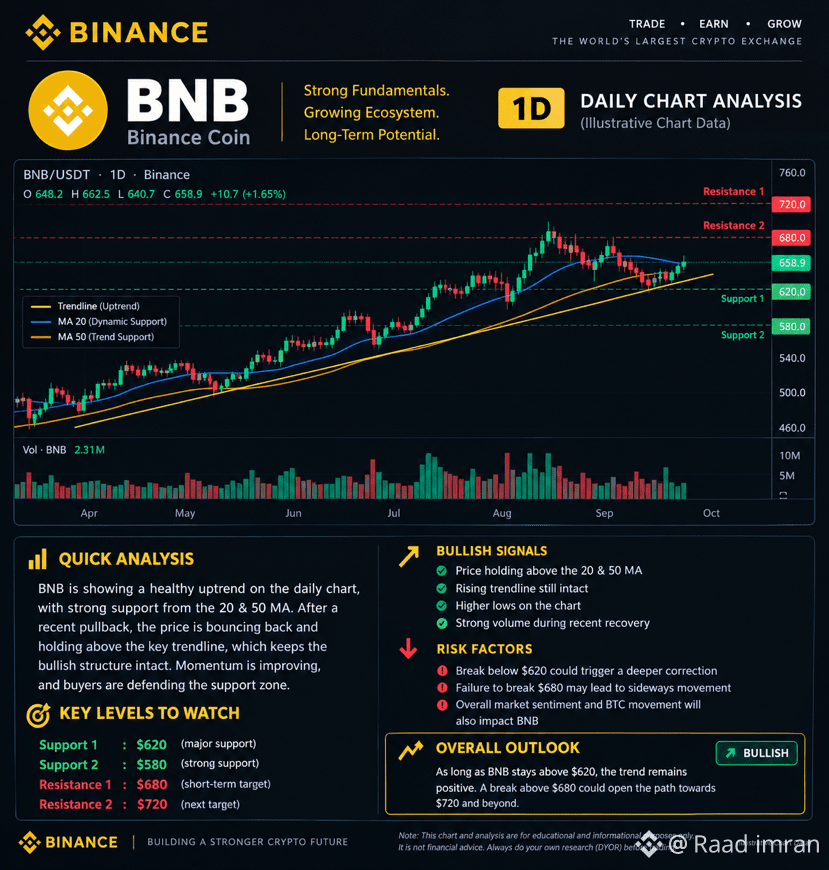
$BNB (1D) is showing a bullish recovery, with buyers defending the $620 support zone and momentum gradually improving. A breakout above $680 could open the path toward $720, while a drop below $620 may signal deeper correction; chart levels are illustrative, not verified live market data, so confirm current Binance prices before trading.
#BNB #BinancePick #cryptouniverseofficial #bitcoin #EarningsSeason
#BNB #BinancePick #cryptouniverseofficial #bitcoin #EarningsSeason
1
65
·
--
$DGB DigiByte— Strong Crypto Analysis
22 October 2026 ·
Daily market outlook
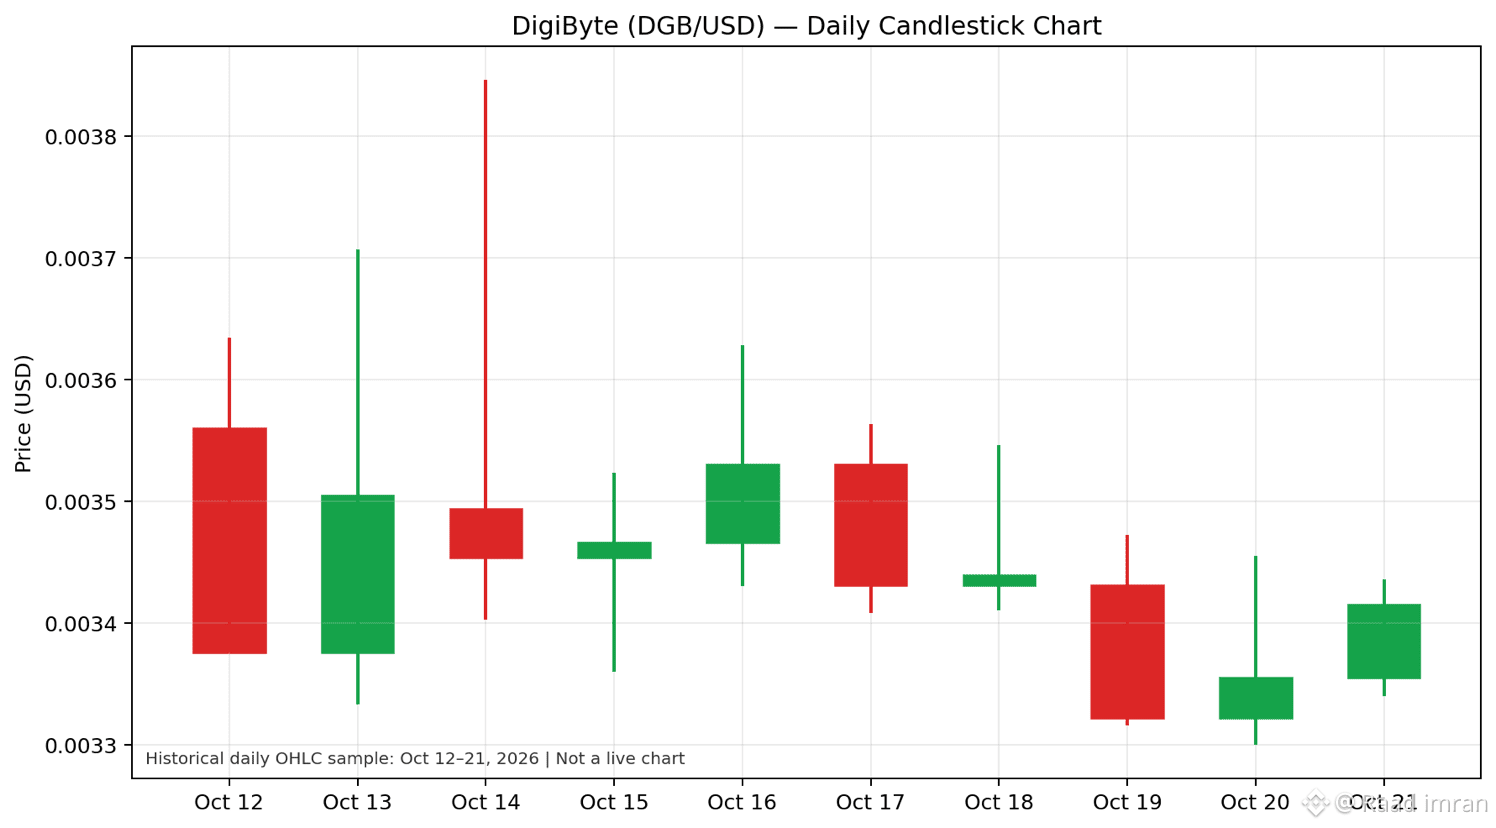
DigiByte ( $DGB ) is an established, decentralized Proof-of-Work blockchain focused on fast transactions and network security. Its price action shows potential for a short-term recovery, but buyers must confirm the breakout before a stronger bullish trend can be trusted. Recent technical analysis indicates a key resistance near $0.00407 and support around $0.00333. A strong daily close above resistance, supported by rising trading volume, could strengthen bullish momentum; losing support would increase downside risk. 
DGB candle chart
Historical daily candles, 12–21 October 2026. This is not a live Binance chart.

Key trading levels
Support: $0.00333
Resistance: $0.00407
Bullish confirmation: Daily close above resistance with strong volume.
Bearish warning: Daily close below support.
Final verdict: $DGB may offer a recovery opportunity, but confirmation is essential. Avoid buying solely because the coin's price looks cheap; manage risk and check the live DGB/USDT chart on Binance before trading.
#DigiByteGrowth #CryptoNewss #EarningsSeason #USDT #DGBUSDT
1
91
·
--
$PROM #Coin — Strong Market Analysis
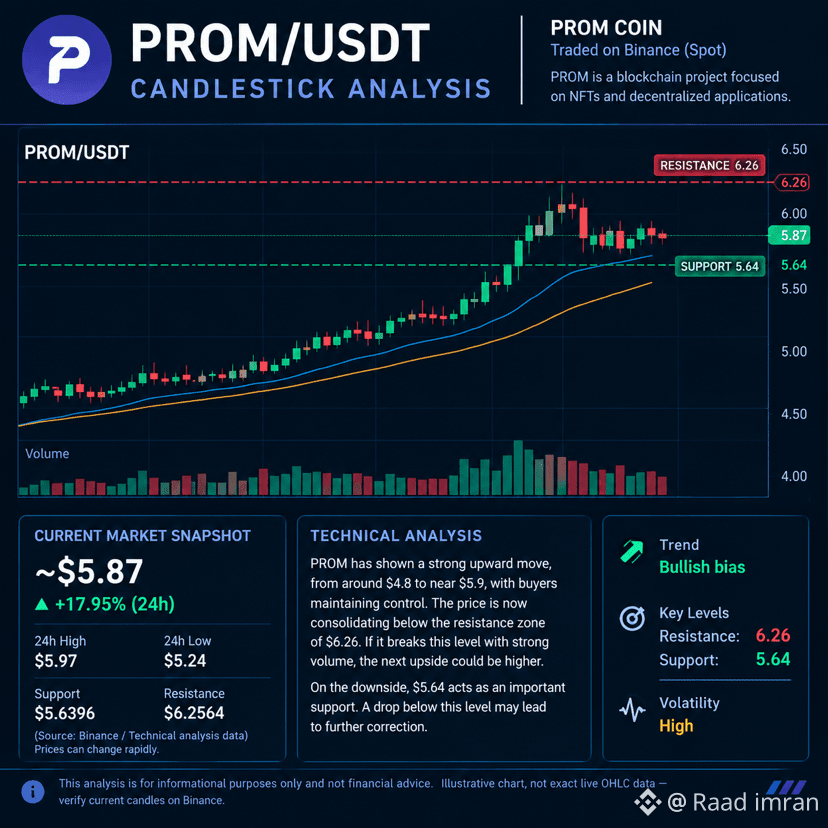
$PROM is showing strong bullish momentum, with its price trading near $5.88 and gaining approximately 17% in 24 hours. Recent buying pressure has pushed the price close to its 24-hour high of $5.97, indicating increased market interest. However, after a sharp rally, profit-taking and short-term corrections are possible. Source: Binance
Key technical levels
* Support: $5.64
* Resistance: $5.97, followed by the $6.20–$6.26 zone.
* Bullish scenario: A confirmed breakout above $6.26 with strong trading volume could open the door to further gains.
* Bearish scenario: A breakdown below $5.64 may trigger additional selling pressure.
Conclusion: $PROM currently has a bullish short-term bias, but traders should wait for candle confirmation instead of chasing a sudden pump. Watch volume, support, and resistance closely, and use a stop-loss to manage risk. The next move depends on whether buyers can sustain momentum above resistance. This is technical analysis, not a guaranteed trading signal.
#PROMCoin #PROM/USDT #PROM
1
229
·
--
$TSLAB
Tesla Tokenized bStocks, a tokenized asset designed to provide economic exposure to Tesla ( $TSLAB )price movements. It is not a conventional cryptocurrency with its own independent business model.
1. Market analysis
Recent market reference — October 2026
$370–$380
Approximate price range across recent market snapshots; not a guaranteed live quote.
Main price driver
Tesla stock performance
Main risk
Tesla volatility and token liquidity
Trading outlook
Short-term bearish pressure in recent daily candles
Recent daily data showed TSLAB declining from around $385 on October 12 to around $349 on October 18, indicating selling pressure during that period. 
2. TSLAB candlestick chart
The recent candles show a sharp drop followed by a recovery. The latest available daily data on October 21 showed a price near $379.31. 
For the actual interactive candlestick chart, open:
 — select the time range and candlestick view if available.
#110AutomatedWalletsGenerate99.6%OfRLUSDPayments #TSLABEven #TSLAXMUSK #EarningsSeason #ElonMuskTalks

60
·
--
$IOST IOST Coin Short Analysis
IOST (Internet of Services Token) is currently trading at approximately $0.0013 USD, capturing massive market attention due to a sudden 24-hour trading volume and price surge.
Technical Analysis & Market Patterns
IOST has broken out of a multi-week consolidation pattern, experiencing an 82.2% price surge over the last 24 hours to settle around $0.001304 USD. This explosive upward movement is reinforced by a structural spike in network liquidity and short-term bullish
. Fundamental Outlook & Infrastructure
• Utility Focus: IOST serves as a ultra-fast, decentralized smart contract platform capable of handling high transaction throughput. Its current strategic roadmap revolves heavily around scaling its real-world asset (RWA) tokenization infrastructure and expanding Web3 payment integrations throughout Asia-Pacific regulated markets.
• Tokenomics Risk: While backed by notable venture funding rounds, the asset carries inherent dilution risks. Its circulating supply sits around 36.04 billion tokens against a 90 billion hard cap, resulting in an annual inflation rate of roughly 7%. Token burns (such as the 70 million burn in late 2026) attempt to offset this emission.
#USDT. #IOSTBTC #BTC
202
Log in to explore more content
Join global crypto users on Binance Square
⚡️ Get latest and useful information about crypto.
💬 Trusted by the world’s largest crypto exchange.
👍 Discover real insights from verified creators.
Email / Phone number