

Future Pulse
26.2k Posts

Future Pulse
Report
Block User
Hi, I'm passionate about crypto, technology, and innovation. I enjoy exploring ideas, sharing insights, and staying ahead of what's next.
Open Trade
High-Frequency Trader
2.7 Years
4.1K+ Following
34.2K+ Followers
54.0K+ Liked
Posts
Portfolio
All
Quotes
Live
·
--
🔻 Breakdown continues
🟢 Sharp bounce
🟡 Base forms
⚡ Fake breakdown
12 hr(s) left
618
·
--
Can XRP reach $1.80 after recent ETF inflows?
XRP is holding around $1.51, while continued demand through U.S. spot XRP ETFs has kept attention on the next major technical hurdle.
The key zone is $1.60–$1.62. A decisive breakout and sustained trading above this resistance could shift the market structure toward the $1.80 area, which represents roughly a 19% move from $1.51.
However, ETF inflows alone do not guarantee that move. XRP still needs to convert the current demand into sustained spot buying and avoid rejection at $1.60–$1.62.
From a technical perspective, $1.60–$1.62 is the level to watch first, while $1.80 becomes a potential target only if that resistance is successfully cleared.
$ZEC
{future}(ZECUSDT)
$AKE
{future}(AKEUSDT)
$XRP
{future}(XRPUSDT)
What will XRP need most to challenge $1.80?
Can XRP reach $1.80 after recent ETF inflows?
XRP is holding around $1.51, while continued demand through U.S. spot XRP ETFs has kept attention on the next major technical hurdle.
The key zone is $1.60–$1.62. A decisive breakout and sustained trading above this resistance could shift the market structure toward the $1.80 area, which represents roughly a 19% move from $1.51.
However, ETF inflows alone do not guarantee that move. XRP still needs to convert the current demand into sustained spot buying and avoid rejection at $1.60–$1.62.
From a technical perspective, $1.60–$1.62 is the level to watch first, while $1.80 becomes a potential target only if that resistance is successfully cleared.
$ZEC
$AKE
$XRP
What will XRP need most to challenge $1.80?
XRP is holding around $1.51, while continued demand through U.S. spot XRP ETFs has kept attention on the next major technical hurdle.
The key zone is $1.60–$1.62. A decisive breakout and sustained trading above this resistance could shift the market structure toward the $1.80 area, which represents roughly a 19% move from $1.51.
However, ETF inflows alone do not guarantee that move. XRP still needs to convert the current demand into sustained spot buying and avoid rejection at $1.60–$1.62.
From a technical perspective, $1.60–$1.62 is the level to watch first, while $1.80 becomes a potential target only if that resistance is successfully cleared.
$ZEC
$AKE
$XRP
What will XRP need most to challenge $1.80?

🔥 Clean break above $1.62
📈 Continued ETF inflows
🐋 Stronger spot buying
⏳ More consolidation first
7 hr(s) left
104
·
--
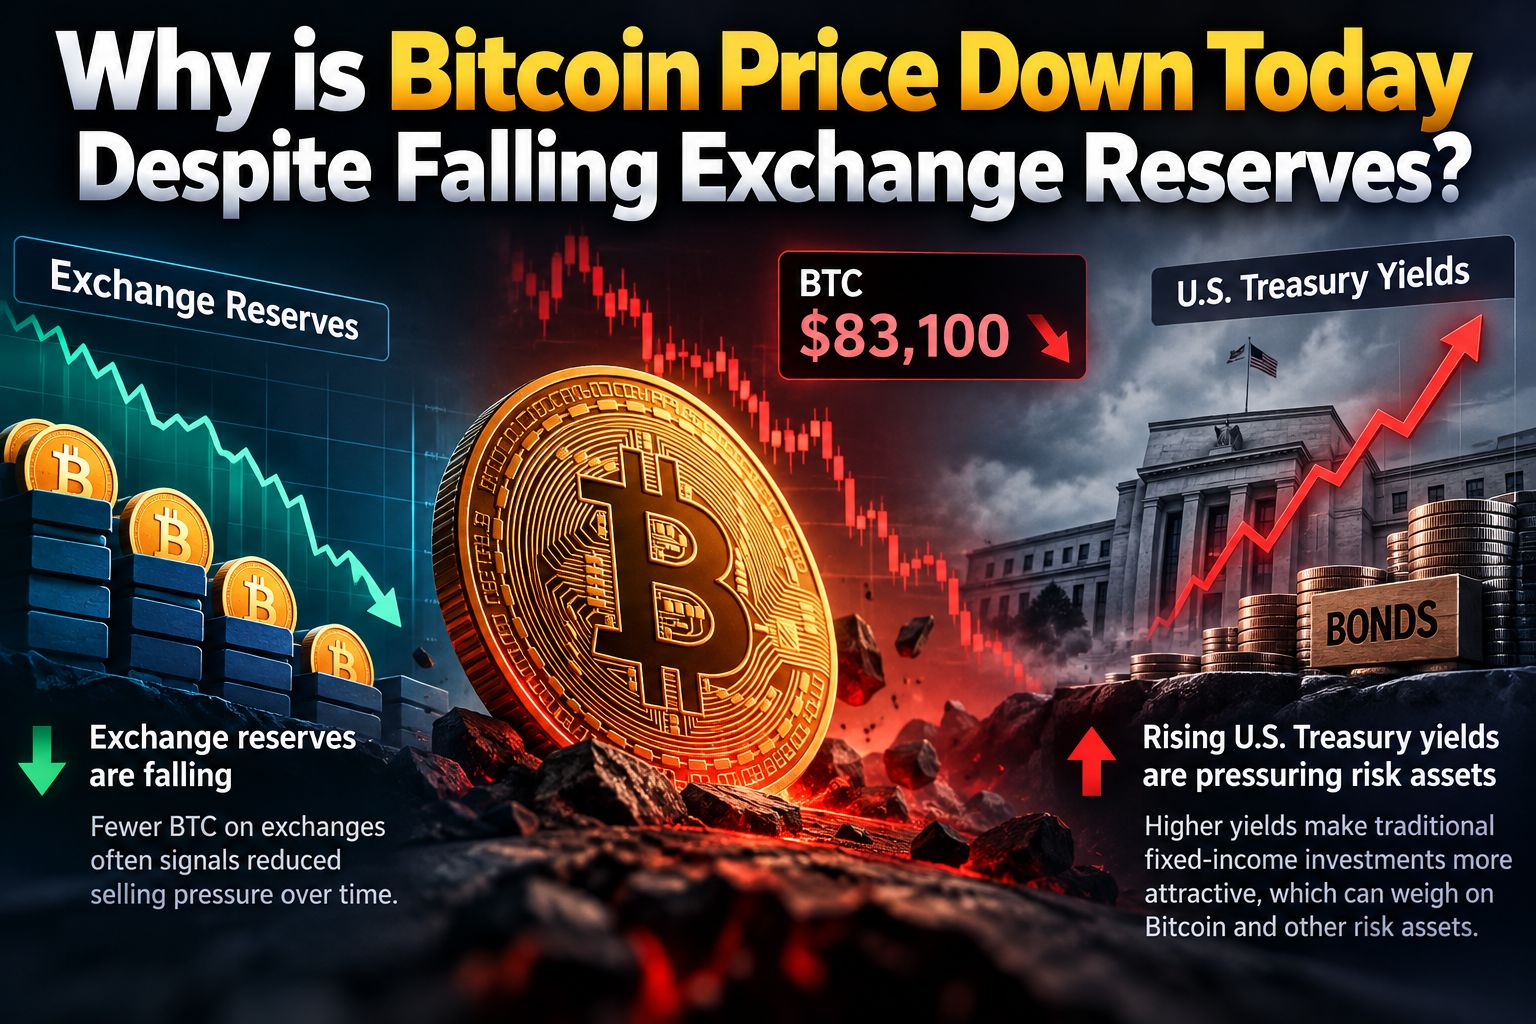
Why is Bitcoin falling even as exchange reserves decline?
BTC has slipped toward $83,100, showing that lower exchange balances alone don’t guarantee immediate price strength.
The key factor appears to be the broader macro environment. Rising U.S. Treasury yields can make risk assets less attractive by increasing the relative appeal of traditional fixed-income instruments. That pressure can weigh on Bitcoin even when fewer coins are sitting on exchanges.
This creates an important distinction: supply held off exchanges is a structural signal, while macro liquidity and risk appetite can dominate short-term price action.
With BTC near the lower edge of its recent range, the market is effectively balancing long-term supply constraints against near-term macro pressure.
The takeaway: falling exchange reserves may support the longer-term supply picture, but they don't eliminate short-term downside risk when financial conditions tighten.
$NMR
{future}(NMRUSDT)
$QNT
{future}(QNTUSDT)
$BTC
{future}(BTCUSDT)
Why is Bitcoin falling even as exchange reserves decline?
BTC has slipped toward $83,100, showing that lower exchange balances alone don’t guarantee immediate price strength.
The key factor appears to be the broader macro environment. Rising U.S. Treasury yields can make risk assets less attractive by increasing the relative appeal of traditional fixed-income instruments. That pressure can weigh on Bitcoin even when fewer coins are sitting on exchanges.
This creates an important distinction: supply held off exchanges is a structural signal, while macro liquidity and risk appetite can dominate short-term price action.
With BTC near the lower edge of its recent range, the market is effectively balancing long-term supply constraints against near-term macro pressure.
The takeaway: falling exchange reserves may support the longer-term supply picture, but they don't eliminate short-term downside risk when financial conditions tighten.
$NMR
$QNT
$BTC
BTC has slipped toward $83,100, showing that lower exchange balances alone don’t guarantee immediate price strength.
The key factor appears to be the broader macro environment. Rising U.S. Treasury yields can make risk assets less attractive by increasing the relative appeal of traditional fixed-income instruments. That pressure can weigh on Bitcoin even when fewer coins are sitting on exchanges.
This creates an important distinction: supply held off exchanges is a structural signal, while macro liquidity and risk appetite can dominate short-term price action.
With BTC near the lower edge of its recent range, the market is effectively balancing long-term supply constraints against near-term macro pressure.
The takeaway: falling exchange reserves may support the longer-term supply picture, but they don't eliminate short-term downside risk when financial conditions tighten.
$NMR
$QNT
$BTC
1
387
·
--
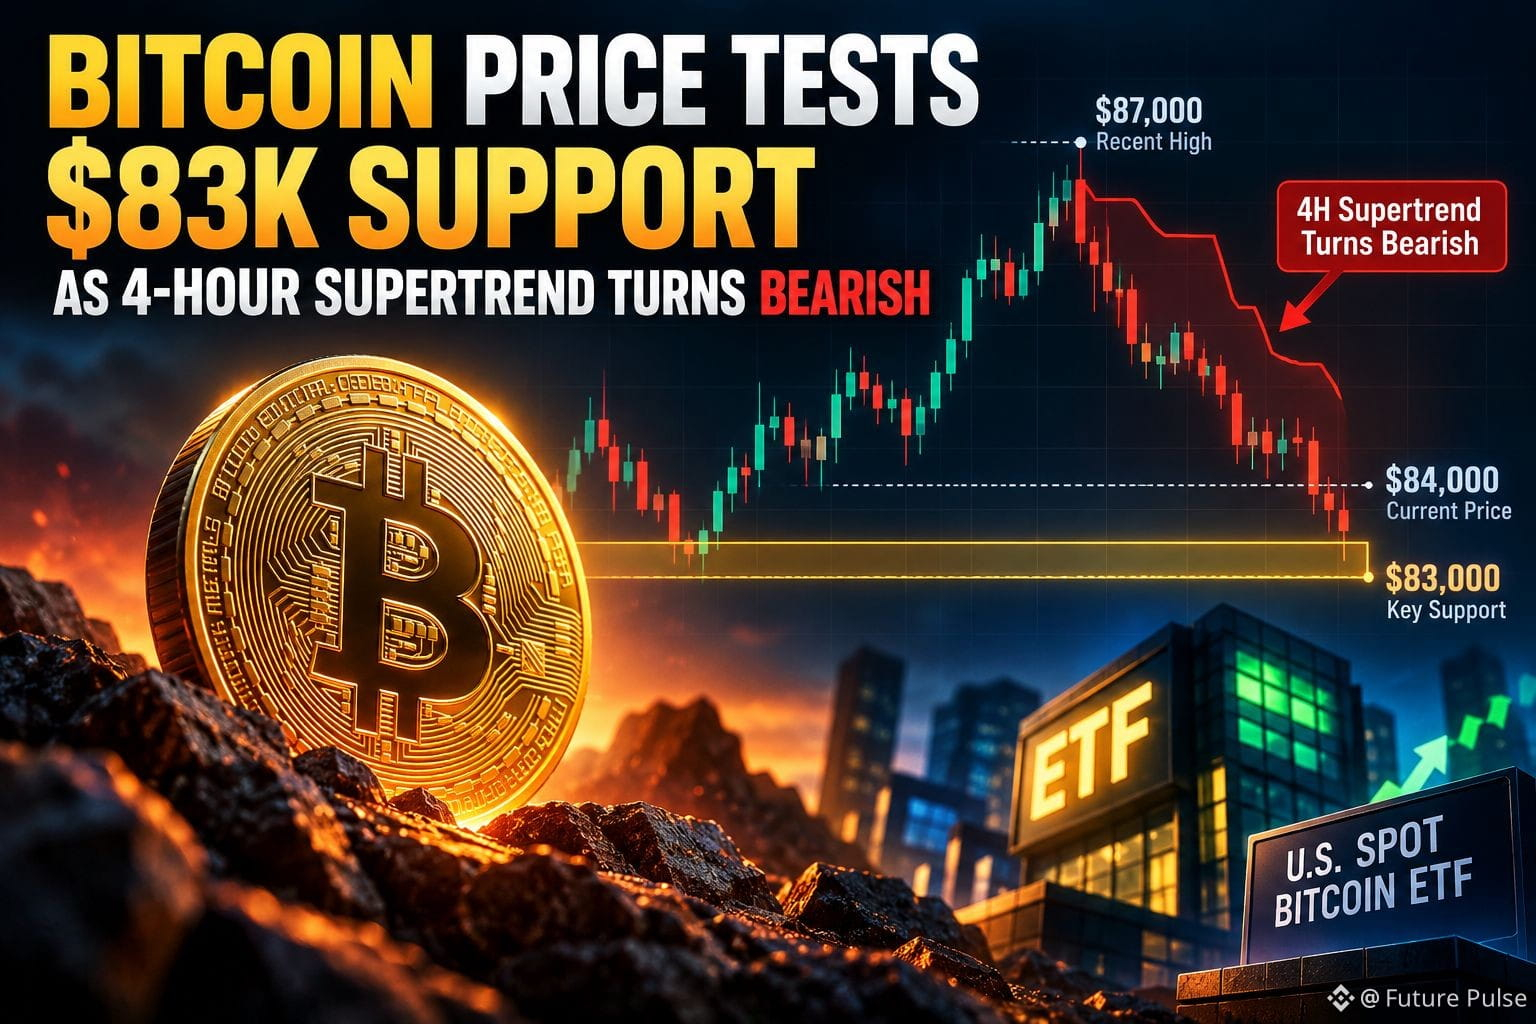
Bitcoin is testing a critical area around $83K after pulling back from above $87K.
The bigger shift is on the 4-hour chart: the Supertrend has turned bearish, suggesting short-term momentum has weakened and sellers are gaining control.
Now the $83K zone matters. If buyers defend it, the September breakout could remain technically intact. If it fails, the market may need to search for a lower support area before momentum improves.
Another variable is U.S. spot Bitcoin ETF demand. Continued inflows could provide the buying pressure needed to absorb the pullback, while weaker demand would leave price more exposed to technical selling.
For me, the key question isn't simply whether BTC can bounce. It's whether buyers can reclaim the 4-hour trend structure after defending support.
$BTC
{future}(BTCUSDT)
$ETH
{future}(ETHUSDT)
$SOL
{future}(SOLUSDT)
#ChainlinkLaunchesCCIP2WithEnterpriseVerification
#UKFCAWinsCourtOrderToRecover851400Pounds
#GoldFallsTo$4144
#QNTFallsOver40%FromMorningHigh
#BTCFallsBelow$83000
Bitcoin is testing a critical area around $83K after pulling back from above $87K.
The bigger shift is on the 4-hour chart: the Supertrend has turned bearish, suggesting short-term momentum has weakened and sellers are gaining control.
Now the $83K zone matters. If buyers defend it, the September breakout could remain technically intact. If it fails, the market may need to search for a lower support area before momentum improves.
Another variable is U.S. spot Bitcoin ETF demand. Continued inflows could provide the buying pressure needed to absorb the pullback, while weaker demand would leave price more exposed to technical selling.
For me, the key question isn't simply whether BTC can bounce. It's whether buyers can reclaim the 4-hour trend structure after defending support.
$BTC
$ETH
$SOL
#ChainlinkLaunchesCCIP2WithEnterpriseVerification
#UKFCAWinsCourtOrderToRecover851400Pounds
#GoldFallsTo$4144
#QNTFallsOver40%FromMorningHigh
#BTCFallsBelow$83000
The bigger shift is on the 4-hour chart: the Supertrend has turned bearish, suggesting short-term momentum has weakened and sellers are gaining control.
Now the $83K zone matters. If buyers defend it, the September breakout could remain technically intact. If it fails, the market may need to search for a lower support area before momentum improves.
Another variable is U.S. spot Bitcoin ETF demand. Continued inflows could provide the buying pressure needed to absorb the pullback, while weaker demand would leave price more exposed to technical selling.
For me, the key question isn't simply whether BTC can bounce. It's whether buyers can reclaim the 4-hour trend structure after defending support.
$BTC
$ETH
$SOL
#ChainlinkLaunchesCCIP2WithEnterpriseVerification
#UKFCAWinsCourtOrderToRecover851400Pounds
#GoldFallsTo$4144
#QNTFallsOver40%FromMorningHigh
#BTCFallsBelow$83000
250
·
--
Verified
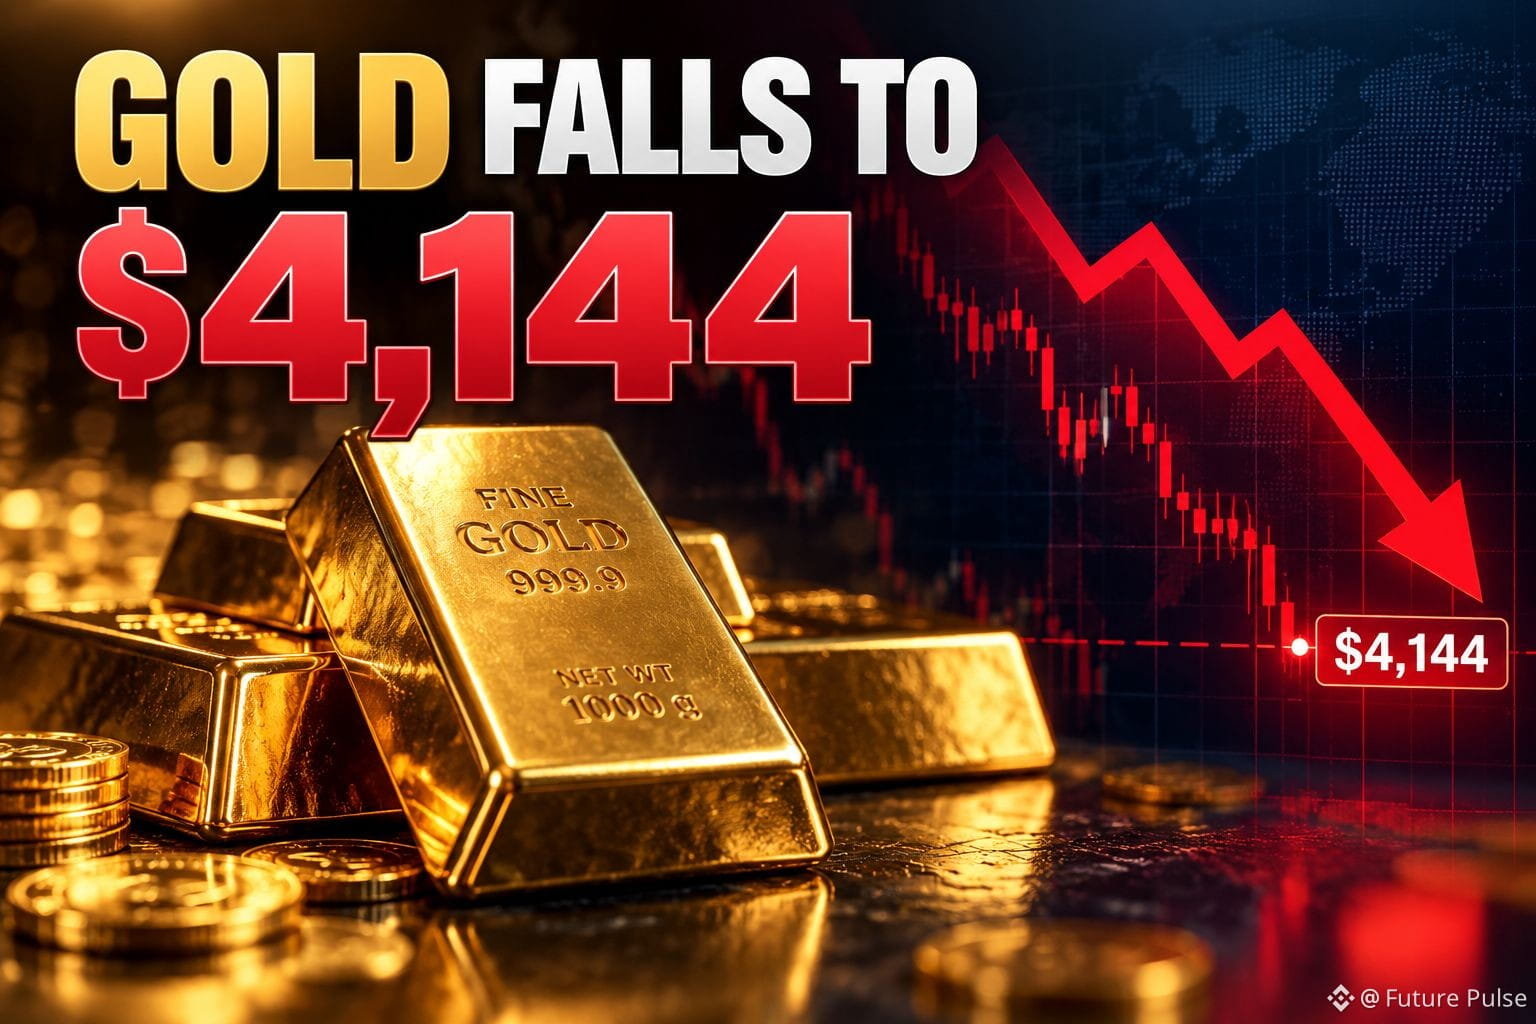
🚨 Gold falls to around $4,144 as the precious-metal selloff accelerates.
Gold prices have dropped to around $4,144, marking a notable pullback after the precious metal recently traded at much higher levels.
The decline comes as traders reassess the macroeconomic outlook, with movements in the U.S. dollar, Treasury yields and expectations for monetary policy remaining important factors for bullion.
The sharp move highlights how quickly sentiment can change even in traditionally defensive assets. Market participants are now watching whether gold can stabilize near current levels or whether further downside pressure develops.
For the broader market, the move is another reminder that gold remains sensitive to shifts in rates, currencies and global risk sentiment.
$QNT
{future}(QNTUSDT)
$XAU
{future}(XAUUSDT)
$XAG
{future}(XAGUSDT)
Where does gold find its next strong reaction?
🚨 Gold falls to around $4,144 as the precious-metal selloff accelerates.
Gold prices have dropped to around $4,144, marking a notable pullback after the precious metal recently traded at much higher levels.
The decline comes as traders reassess the macroeconomic outlook, with movements in the U.S. dollar, Treasury yields and expectations for monetary policy remaining important factors for bullion.
The sharp move highlights how quickly sentiment can change even in traditionally defensive assets. Market participants are now watching whether gold can stabilize near current levels or whether further downside pressure develops.
For the broader market, the move is another reminder that gold remains sensitive to shifts in rates, currencies and global risk sentiment.
$QNT
$XAU
$XAG
Where does gold find its next strong reaction?
Gold prices have dropped to around $4,144, marking a notable pullback after the precious metal recently traded at much higher levels.
The decline comes as traders reassess the macroeconomic outlook, with movements in the U.S. dollar, Treasury yields and expectations for monetary policy remaining important factors for bullion.
The sharp move highlights how quickly sentiment can change even in traditionally defensive assets. Market participants are now watching whether gold can stabilize near current levels or whether further downside pressure develops.
For the broader market, the move is another reminder that gold remains sensitive to shifts in rates, currencies and global risk sentiment.
$QNT
$XAU
$XAG
Where does gold find its next strong reaction?
🟢 $4,100–$4,150 support
28%
⚡ Bounce back above $4,250
45%
🔴 Breakdown below $4,100
21%
👀 Wait for confirmation
6%
107 votes • Voting closed
1
2
6.2k
·
--
Why is Bitcoin falling as Iran risk returns?
Bitcoin has pulled back below $84K after briefly moving above $87K last week, as renewed U.S.-Iran tensions pushed investors away from risk-sensitive assets.
The key issue is not Iran alone. Geopolitical escalation can lift oil prices, increase inflation concerns and strengthen expectations for tighter monetary policy—conditions that can pressure Bitcoin alongside other risk assets.
Interestingly, U.S. spot Bitcoin ETFs still attracted about $2.39B during the five trading days through Friday, suggesting institutional demand has not disappeared.
For now, the market is balancing two forces: geopolitical risk versus continued demand for BTC. That makes the next reaction around the $84K area particularly important for traders.
$QNT
{future}(QNTUSDT)
$MARSCOIN
{future}(MARSCOINUSDT)
$BTC
{future}(BTCUSDT)
#Geopolitics
#BTC
Why is Bitcoin falling as Iran risk returns?
Bitcoin has pulled back below $84K after briefly moving above $87K last week, as renewed U.S.-Iran tensions pushed investors away from risk-sensitive assets.
The key issue is not Iran alone. Geopolitical escalation can lift oil prices, increase inflation concerns and strengthen expectations for tighter monetary policy—conditions that can pressure Bitcoin alongside other risk assets.
Interestingly, U.S. spot Bitcoin ETFs still attracted about $2.39B during the five trading days through Friday, suggesting institutional demand has not disappeared.
For now, the market is balancing two forces: geopolitical risk versus continued demand for BTC. That makes the next reaction around the $84K area particularly important for traders.
$QNT
$MARSCOIN
$BTC
#Geopolitics
#BTC
Bitcoin has pulled back below $84K after briefly moving above $87K last week, as renewed U.S.-Iran tensions pushed investors away from risk-sensitive assets.
The key issue is not Iran alone. Geopolitical escalation can lift oil prices, increase inflation concerns and strengthen expectations for tighter monetary policy—conditions that can pressure Bitcoin alongside other risk assets.
Interestingly, U.S. spot Bitcoin ETFs still attracted about $2.39B during the five trading days through Friday, suggesting institutional demand has not disappeared.
For now, the market is balancing two forces: geopolitical risk versus continued demand for BTC. That makes the next reaction around the $84K area particularly important for traders.
$QNT
$MARSCOIN
$BTC
#Geopolitics
#BTC

419
·
--
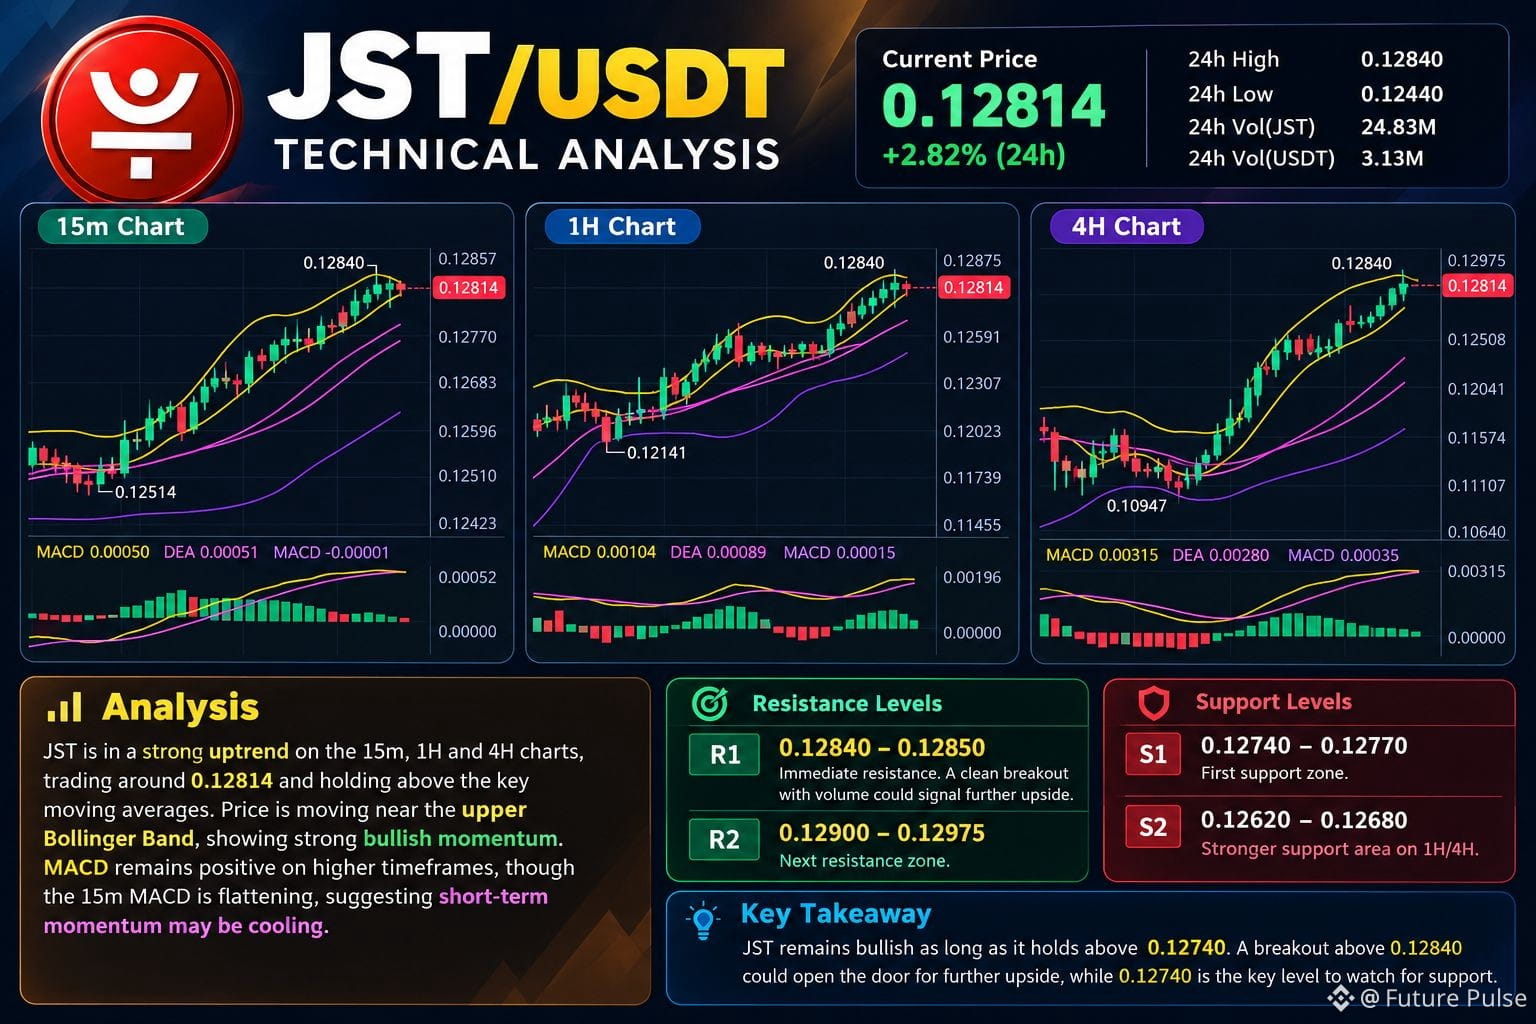
JST is showing a strong bullish structure across the 15m, 1H and 4H charts. Price is around 0.12814, holding above the key moving averages while the 1H and 4H candles remain near the upper Bollinger Band.
The immediate resistance is 0.12840–0.12850. A clean breakout with volume could signal further continuation. On the downside, 0.12740–0.12770 is the first support zone, while 0.12620–0.12680 is a stronger 1H/4H support area. MACD remains positive on higher timeframes, but the 15m MACD is flattening, suggesting short-term momentum may be cooling. 0.12840 is the key level to watch.
$MU
{future}(MUUSDT)
$NVDA
{future}(NVDAUSDT)
$JST
{future}(JSTUSDT)
JST is showing a strong bullish structure across the 15m, 1H and 4H charts. Price is around 0.12814, holding above the key moving averages while the 1H and 4H candles remain near the upper Bollinger Band.
The immediate resistance is 0.12840–0.12850. A clean breakout with volume could signal further continuation. On the downside, 0.12740–0.12770 is the first support zone, while 0.12620–0.12680 is a stronger 1H/4H support area. MACD remains positive on higher timeframes, but the 15m MACD is flattening, suggesting short-term momentum may be cooling. 0.12840 is the key level to watch.
$MU
$NVDA
$JST
The immediate resistance is 0.12840–0.12850. A clean breakout with volume could signal further continuation. On the downside, 0.12740–0.12770 is the first support zone, while 0.12620–0.12680 is a stronger 1H/4H support area. MACD remains positive on higher timeframes, but the 15m MACD is flattening, suggesting short-term momentum may be cooling. 0.12840 is the key level to watch.
$MU
$NVDA
$JST
462
·
--
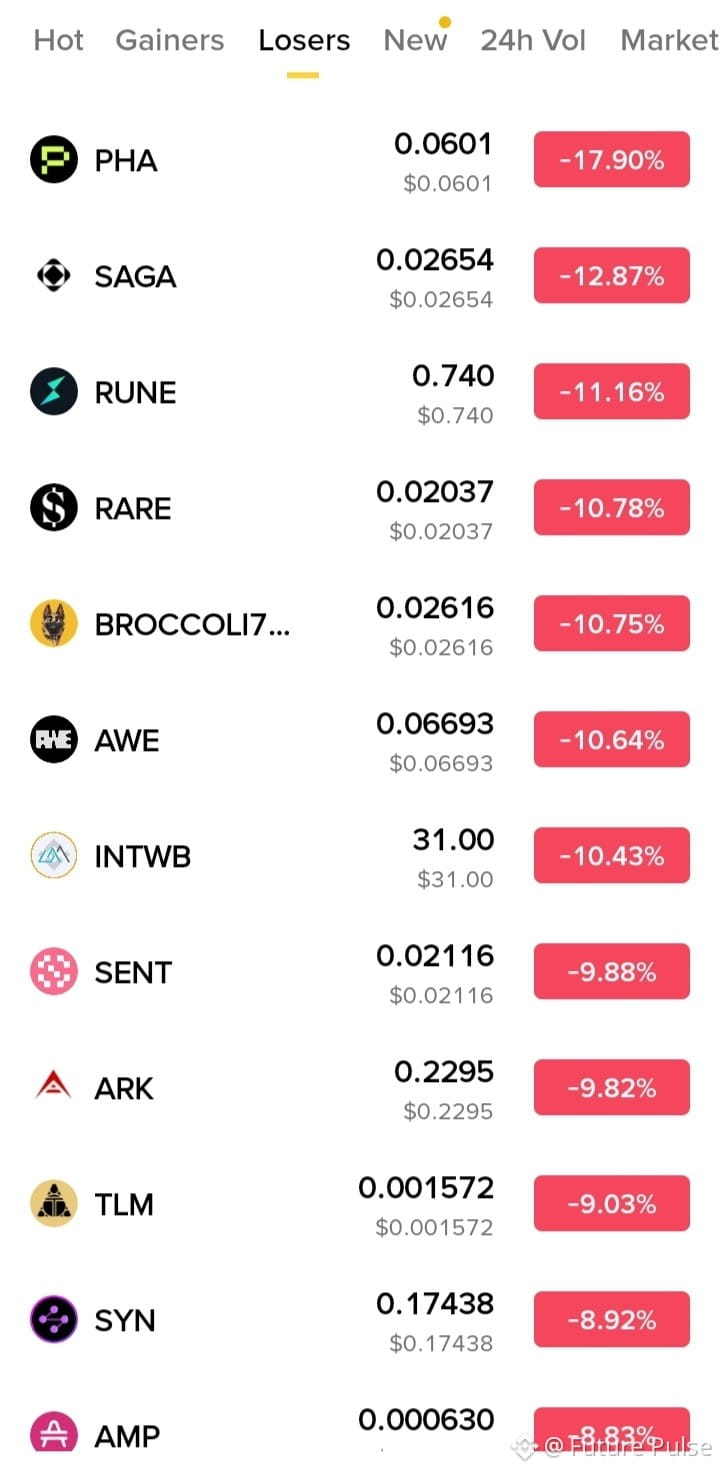
Faaaaaaahhhhhhhh
$BROCCOLI714
{future}(BROCCOLI714USDT)
$SENT
{future}(SENTUSDT)
$SYN
{future}(SYNUSDT)
#BitwiseFilesFinalNEARSpotETFProspectus
#DogecoinETFsPostBiggestWeekSinceLaunch
#StrategyStriveAdd2305BitcoinThisWeek
#TrumpRejectsIranHormuzReopening
Faaaaaaahhhhhhhh
$BROCCOLI714
$SENT
$SYN
#BitwiseFilesFinalNEARSpotETFProspectus
#DogecoinETFsPostBiggestWeekSinceLaunch
#StrategyStriveAdd2305BitcoinThisWeek
#TrumpRejectsIranHormuzReopening
$BROCCOLI714
$SENT
$SYN
#BitwiseFilesFinalNEARSpotETFProspectus
#DogecoinETFsPostBiggestWeekSinceLaunch
#StrategyStriveAdd2305BitcoinThisWeek
#TrumpRejectsIranHormuzReopening
905
·
--
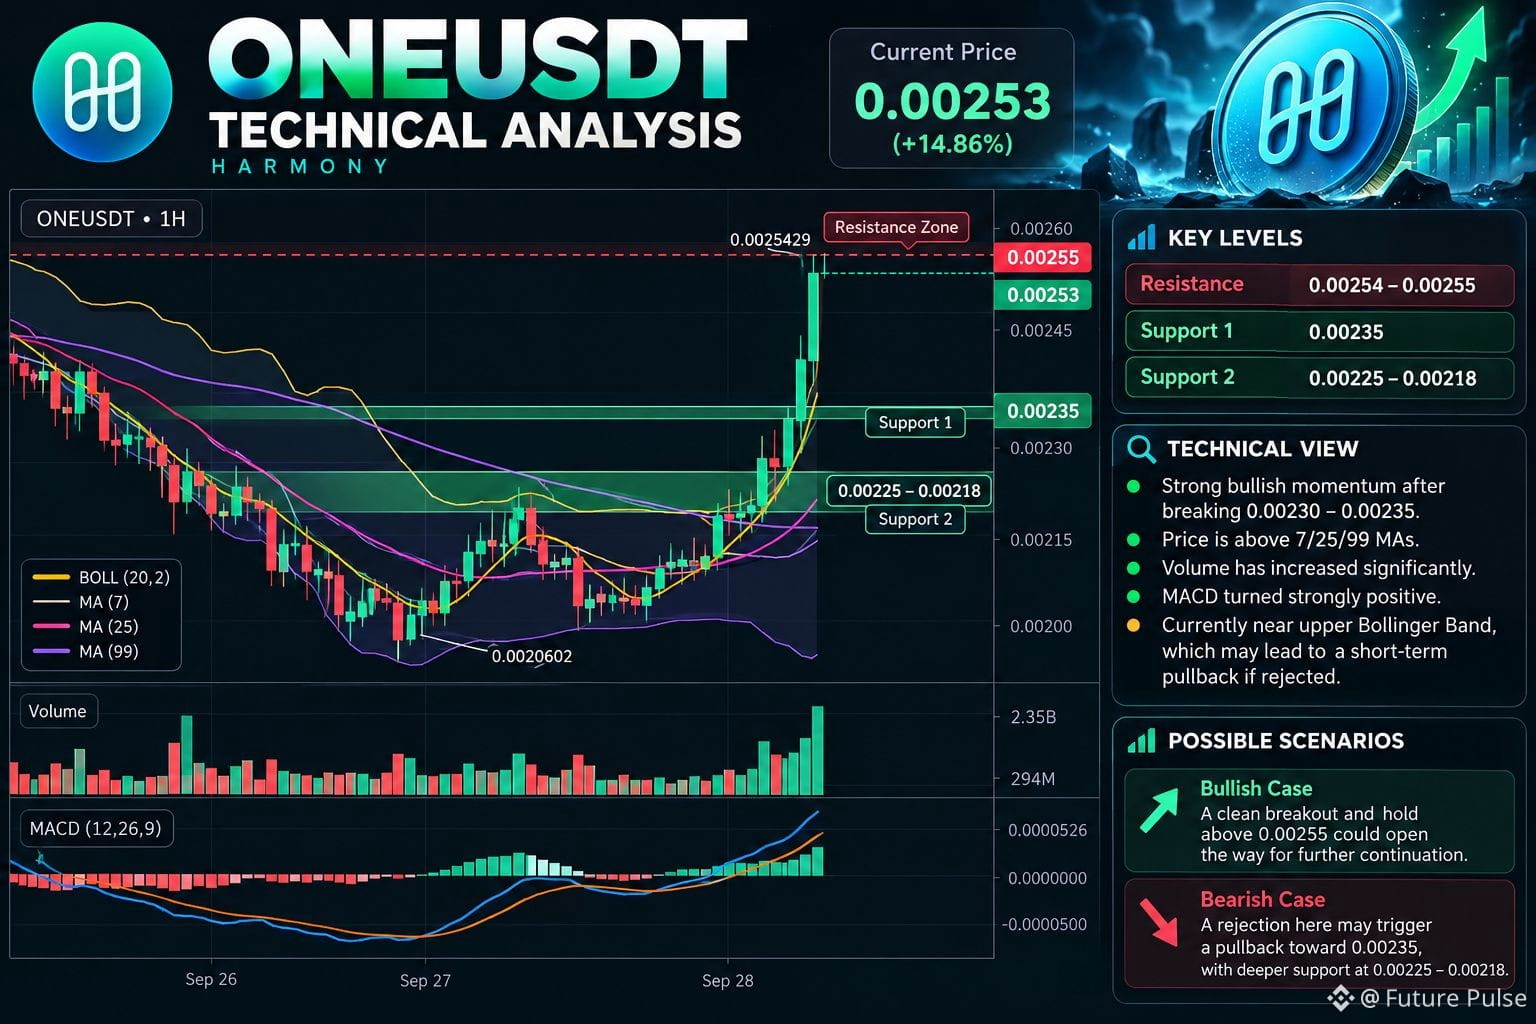
ONE has shifted into a strong short-term bullish structure after breaking above the 0.00230–0.00235 resistance zone. The 15m and 1H charts show a sharp volume expansion, while MACD has turned strongly positive. Price is now above the 7/25/99 MAs, confirming momentum.
However, the move is extended near 0.00254–0.00255, around the recent high and upper Bollinger Band. A rejection here could trigger a pullback toward 0.00235, with 0.00225–0.00218 as deeper support.
A clean breakout and hold above 0.00255 would strengthen the continuation setup.
$QNT
{future}(QNTUSDT)
$GRT
{future}(GRTUSDT)
$ONE
{future}(ONEUSDT)
#Harmony
#QNT
#GRT
ONE has shifted into a strong short-term bullish structure after breaking above the 0.00230–0.00235 resistance zone. The 15m and 1H charts show a sharp volume expansion, while MACD has turned strongly positive. Price is now above the 7/25/99 MAs, confirming momentum.
However, the move is extended near 0.00254–0.00255, around the recent high and upper Bollinger Band. A rejection here could trigger a pullback toward 0.00235, with 0.00225–0.00218 as deeper support.
A clean breakout and hold above 0.00255 would strengthen the continuation setup.
$QNT
$GRT
$ONE
#Harmony
#QNT
#GRT
However, the move is extended near 0.00254–0.00255, around the recent high and upper Bollinger Band. A rejection here could trigger a pullback toward 0.00235, with 0.00225–0.00218 as deeper support.
A clean breakout and hold above 0.00255 would strengthen the continuation setup.
$QNT
$GRT
$ONE
#Harmony
#QNT
#GRT
703
·
--
SPCX: The $152 “Bounce” Story Needs a Reality Check
The $77 floor narrative is getting attention, but the actual chart tells a different story.
$SPCX
{future}(SPCXUSDT)
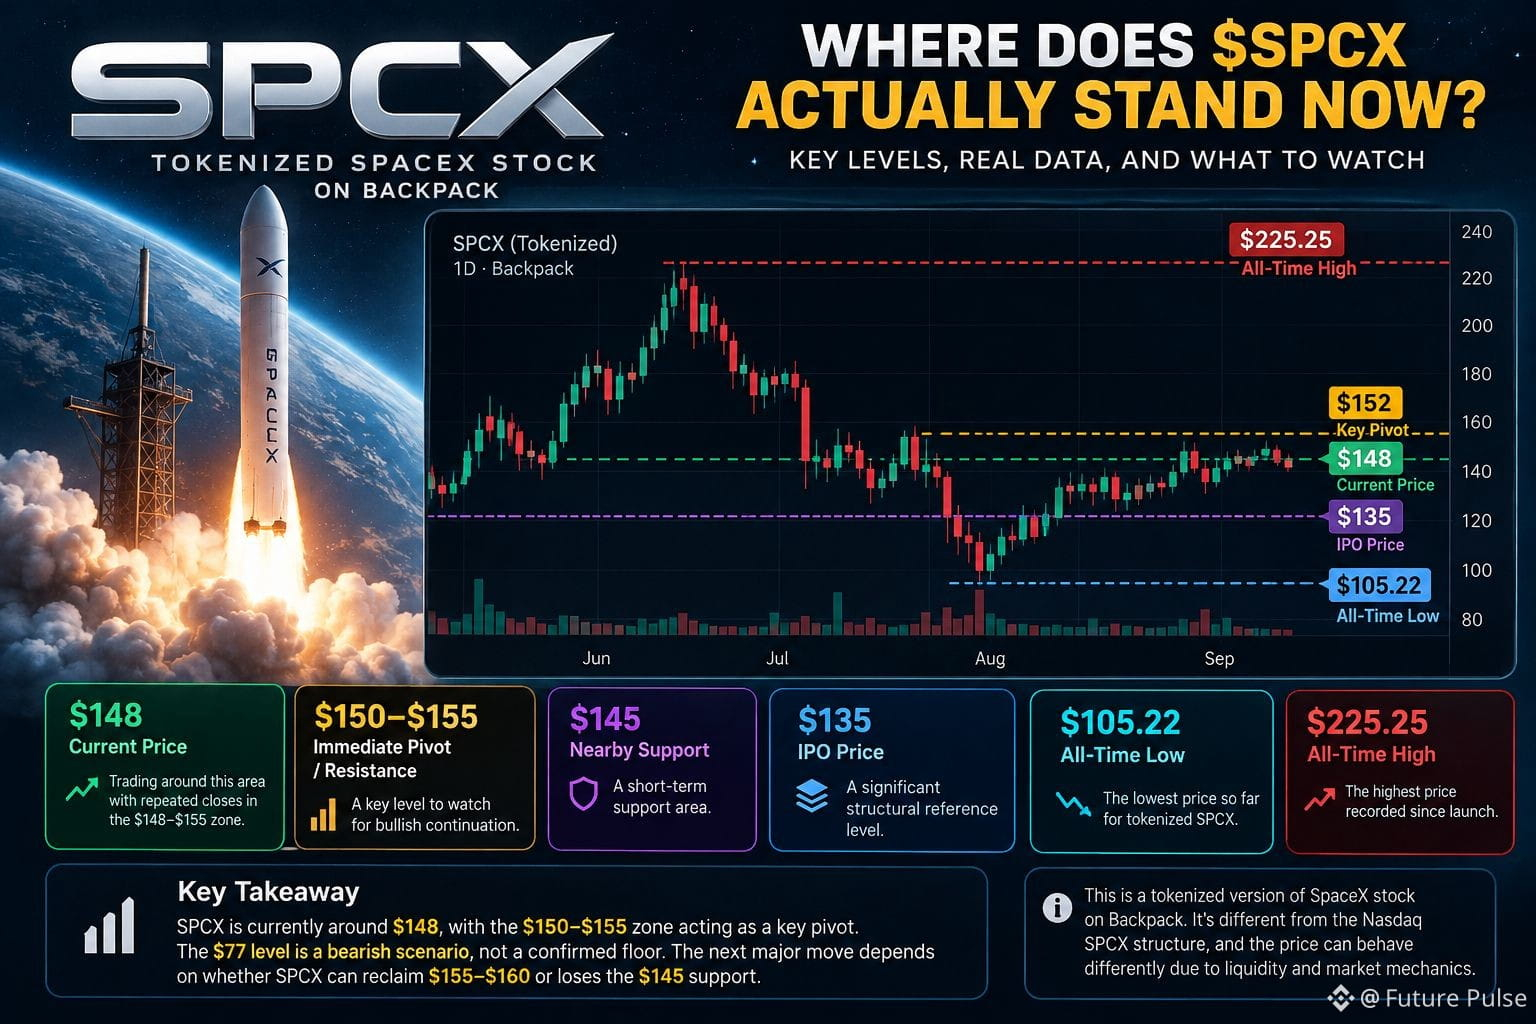
SPCX is currently around $148, with recent closes repeatedly sitting in the $148–$155 area. The $152 zone has acted more like a key pivot than proof of a guaranteed reversal.
The important levels I’m watching:
• $150–$155 → immediate pivot/resistance area
• $145 → nearby downside support
• $135 → IPO price and a much more significant structural reference
• $105 → historical tokenized-SPCX low
• $225 → historical tokenized-SPCX high
The key question isn't whether $77 “must” happen.
It’s whether SPCX can reclaim $155–$160 with sustained buying pressure. If it fails and loses the $145 area, the market could start testing lower historical levels.
For me, the $77 thesis remains a scenario, not a confirmed target.
The chart needs to prove the next move.
#SPCX
SPCX: The $152 “Bounce” Story Needs a Reality Check
The $77 floor narrative is getting attention, but the actual chart tells a different story.
$SPCX
SPCX is currently around $148, with recent closes repeatedly sitting in the $148–$155 area. The $152 zone has acted more like a key pivot than proof of a guaranteed reversal.
The important levels I’m watching:
• $150–$155 → immediate pivot/resistance area
• $145 → nearby downside support
• $135 → IPO price and a much more significant structural reference
• $105 → historical tokenized-SPCX low
• $225 → historical tokenized-SPCX high
The key question isn't whether $77 “must” happen.
It’s whether SPCX can reclaim $155–$160 with sustained buying pressure. If it fails and loses the $145 area, the market could start testing lower historical levels.
For me, the $77 thesis remains a scenario, not a confirmed target.
The chart needs to prove the next move.
#SPCX
The $77 floor narrative is getting attention, but the actual chart tells a different story.
$SPCX
SPCX is currently around $148, with recent closes repeatedly sitting in the $148–$155 area. The $152 zone has acted more like a key pivot than proof of a guaranteed reversal.
The important levels I’m watching:
• $150–$155 → immediate pivot/resistance area
• $145 → nearby downside support
• $135 → IPO price and a much more significant structural reference
• $105 → historical tokenized-SPCX low
• $225 → historical tokenized-SPCX high
The key question isn't whether $77 “must” happen.
It’s whether SPCX can reclaim $155–$160 with sustained buying pressure. If it fails and loses the $145 area, the market could start testing lower historical levels.
For me, the $77 thesis remains a scenario, not a confirmed target.
The chart needs to prove the next move.
#SPCX
742
·
--
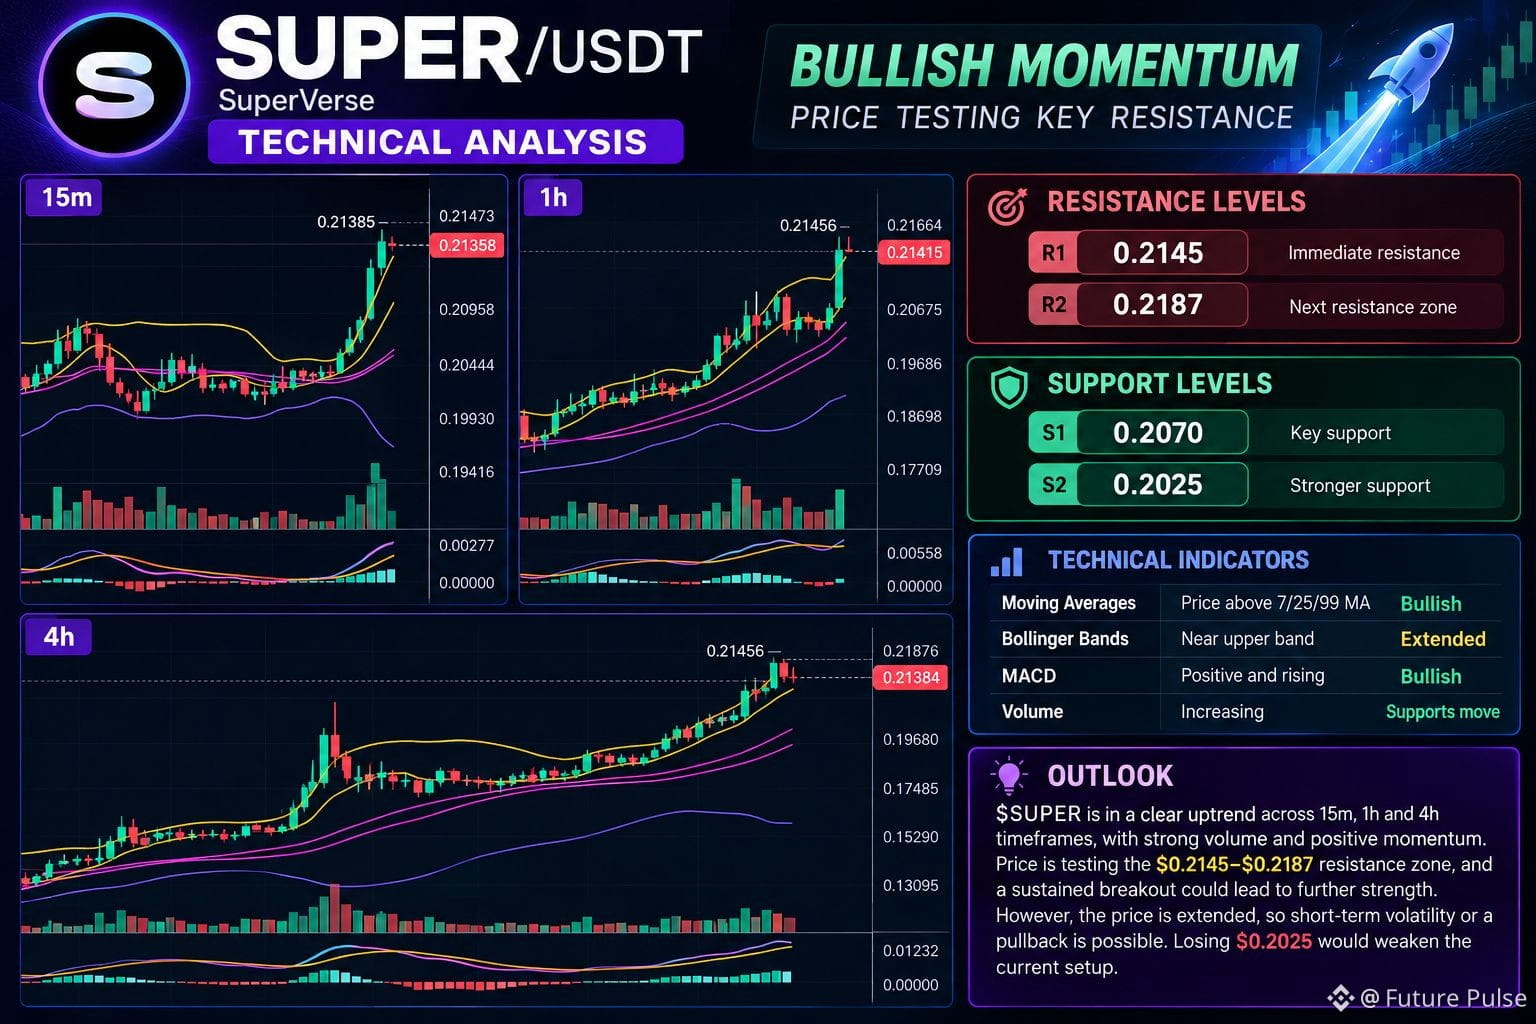
SUPER is showing strong bullish momentum across the 15m, 1h and 4h charts. Price is trading above the 7/25/99-period moving averages, while MACD remains positive and expanding. The recent breakout is also supported by a clear volume increase.
However, price is pressing the $0.2145–$0.2187 resistance zone and is extended above the upper Bollinger Band, so short-term volatility or a pullback is possible.
🟢 Support: $0.2070 / $0.2025
🔴 Resistance: $0.2145 / $0.2187
A sustained breakout above resistance could confirm further strength, while losing $0.2025 would weaken the setup.
$WLD
{future}(WLDUSDT)
$DASH
{future}(DASHUSDT)
$SUPER
{future}(SUPERUSDT)
SUPER is showing strong bullish momentum across the 15m, 1h and 4h charts. Price is trading above the 7/25/99-period moving averages, while MACD remains positive and expanding. The recent breakout is also supported by a clear volume increase.
However, price is pressing the $0.2145–$0.2187 resistance zone and is extended above the upper Bollinger Band, so short-term volatility or a pullback is possible.
🟢 Support: $0.2070 / $0.2025
🔴 Resistance: $0.2145 / $0.2187
A sustained breakout above resistance could confirm further strength, while losing $0.2025 would weaken the setup.
$WLD
$DASH
$SUPER
However, price is pressing the $0.2145–$0.2187 resistance zone and is extended above the upper Bollinger Band, so short-term volatility or a pullback is possible.
🟢 Support: $0.2070 / $0.2025
🔴 Resistance: $0.2145 / $0.2187
A sustained breakout above resistance could confirm further strength, while losing $0.2025 would weaken the setup.
$WLD
$DASH
$SUPER
259
7
687
·
--
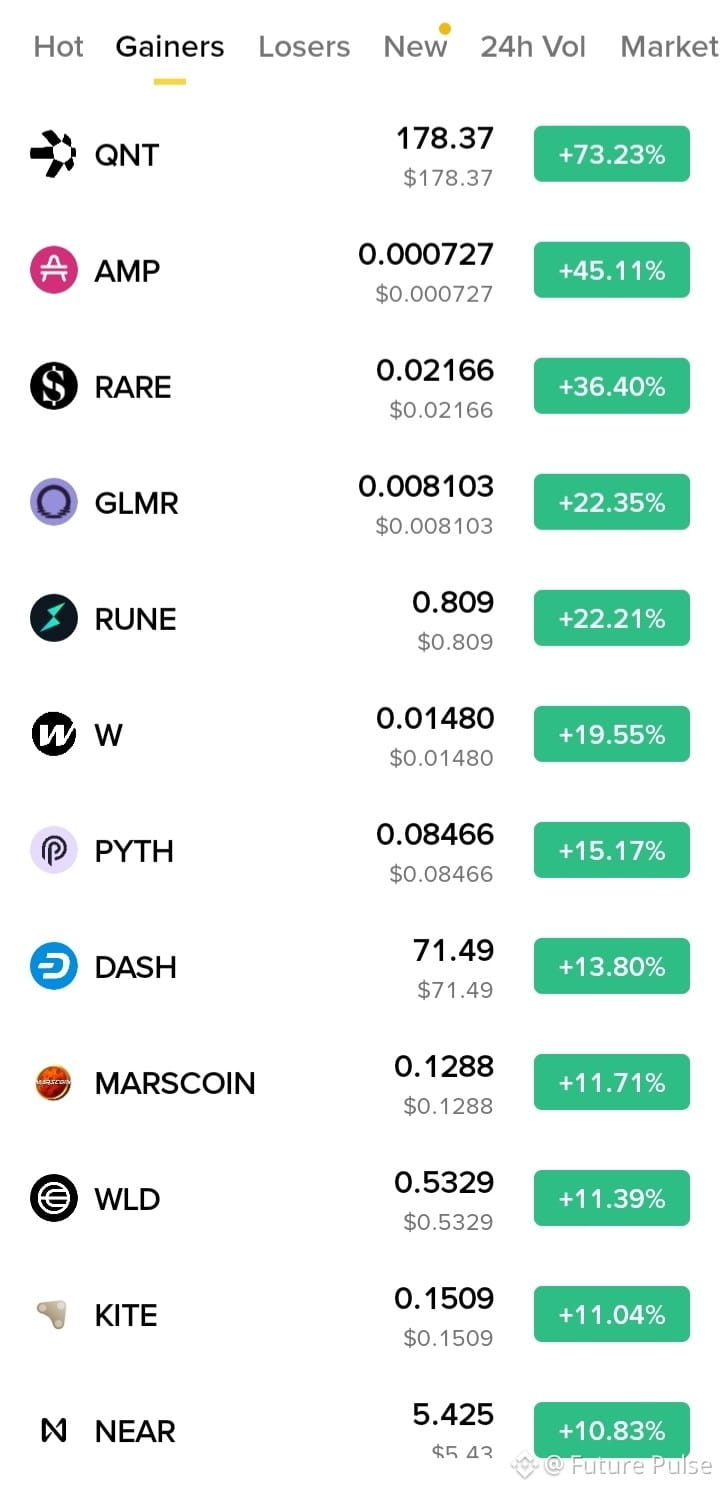
Gainers of the day 🚀
$QNT
{future}(QNTUSDT)
$DASH
{future}(DASHUSDT)
$MARSCOIN
{future}(MARSCOINUSDT)
Gainers of the day 🚀
$QNT
$DASH
$MARSCOIN
$QNT
$DASH
$MARSCOIN
508
·
--
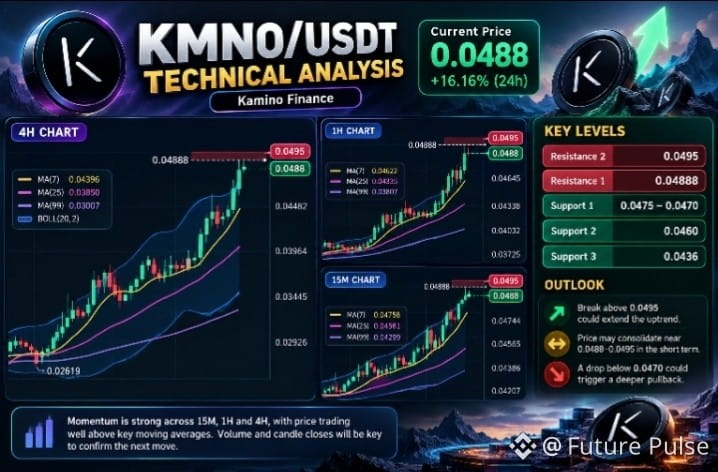
KMNO is showing strong bullish momentum across the 15M, 1H and 4H charts, trading around $0.0488 after a sharp breakout.
On the 4H, price is well above MA(7) $0.04396, MA(25) $0.03850 and MA(99) $0.03007, confirming a strong uptrend. The 1H structure is similarly bullish, with MACD remaining positive and expanding.
However, price is now pressing the $0.04888–$0.0495 resistance zone and sitting near the upper Bollinger Band. That makes a short-term consolidation or pullback possible.
🔹 Resistance: $0.04888–$0.0495
🔹 Support: $0.0475–$0.0470
🔹 Deeper support: $0.0460 / $0.0436
A sustained breakout above $0.0495 could strengthen momentum, while losing $0.047 could trigger a deeper retracement. Volume and candle closes are key to confirming the next move.
$2Z
{future}(2ZUSDT)
$RARE
{future}(RAREUSDT)
$KMNO
{future}(KMNOUSDT)
KMNO is showing strong bullish momentum across the 15M, 1H and 4H charts, trading around $0.0488 after a sharp breakout.
On the 4H, price is well above MA(7) $0.04396, MA(25) $0.03850 and MA(99) $0.03007, confirming a strong uptrend. The 1H structure is similarly bullish, with MACD remaining positive and expanding.
However, price is now pressing the $0.04888–$0.0495 resistance zone and sitting near the upper Bollinger Band. That makes a short-term consolidation or pullback possible.
🔹 Resistance: $0.04888–$0.0495
🔹 Support: $0.0475–$0.0470
🔹 Deeper support: $0.0460 / $0.0436
A sustained breakout above $0.0495 could strengthen momentum, while losing $0.047 could trigger a deeper retracement. Volume and candle closes are key to confirming the next move.
$2Z
$RARE
$KMNO
On the 4H, price is well above MA(7) $0.04396, MA(25) $0.03850 and MA(99) $0.03007, confirming a strong uptrend. The 1H structure is similarly bullish, with MACD remaining positive and expanding.
However, price is now pressing the $0.04888–$0.0495 resistance zone and sitting near the upper Bollinger Band. That makes a short-term consolidation or pullback possible.
🔹 Resistance: $0.04888–$0.0495
🔹 Support: $0.0475–$0.0470
🔹 Deeper support: $0.0460 / $0.0436
A sustained breakout above $0.0495 could strengthen momentum, while losing $0.047 could trigger a deeper retracement. Volume and candle closes are key to confirming the next move.
$2Z
$RARE
$KMNO
321
·
--
Bearish
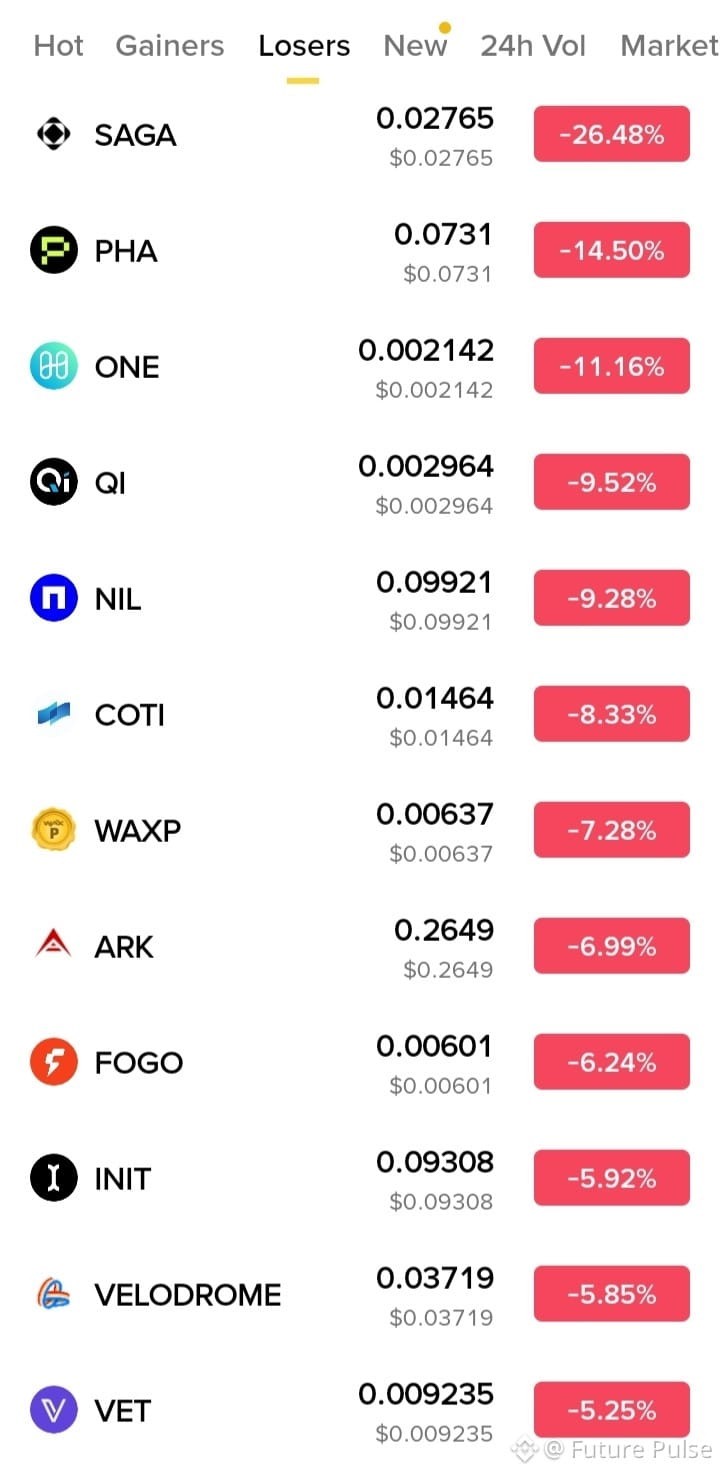
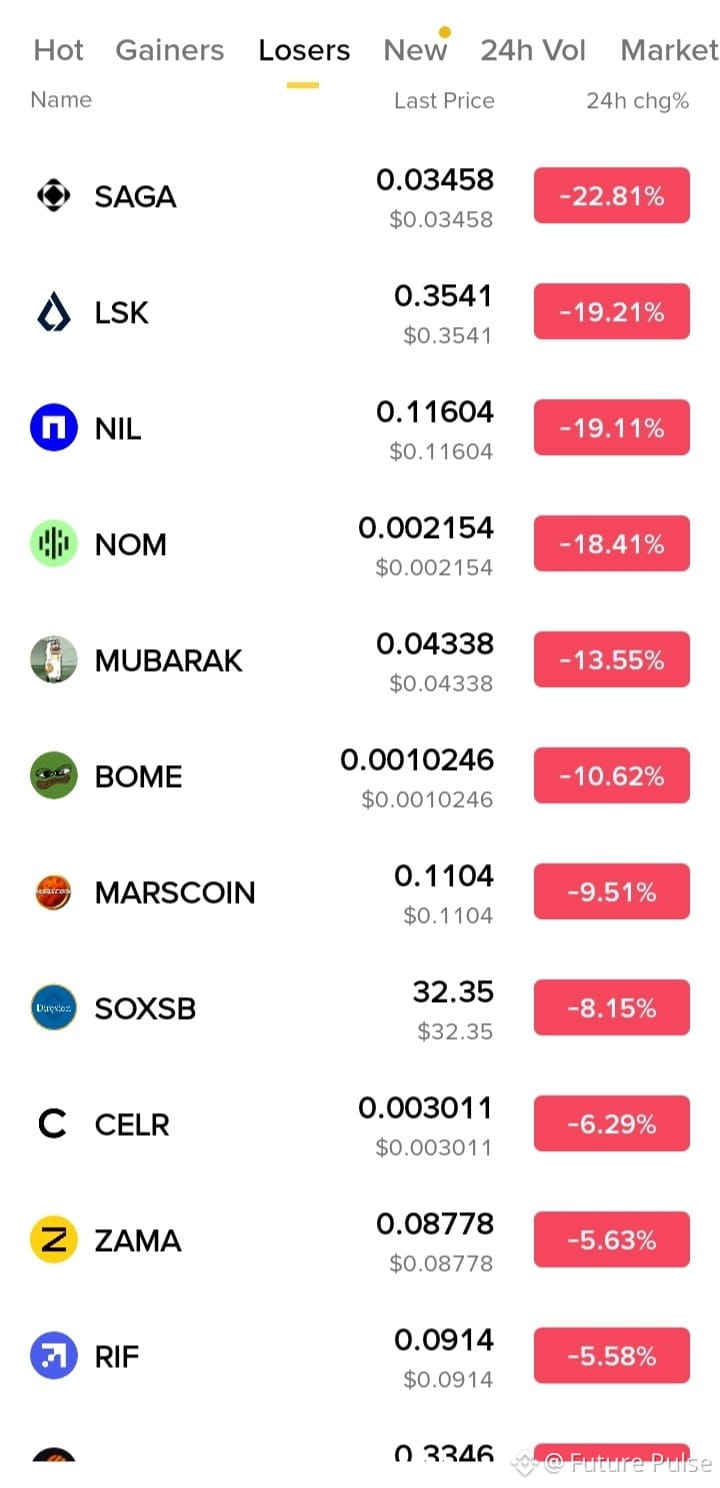
Losers of the day📉
$SAGA
{future}(SAGAUSDT)
$MARSCOIN
{future}(MARSCOINUSDT)
$RIF
{future}(RIFUSDT)
Losers of the day📉
$SAGA
$MARSCOIN
$RIF
$SAGA
$MARSCOIN
$RIF
1
1.2k
·
--
Cardano Brings ADA Payments to AI Agents 🤖⚡
Cardano has gained support in the x402 software stack, opening a new route for developers building AI agents and automated applications that need to pay for online services.
With the integration, applications can use ADA and Cardano native tokens for machine-to-machine payments. That means an AI agent could potentially pay for APIs, data, computing resources or other digital services without relying on traditional payment rails.
What interests me most is the shift toward programmable payments. Instead of AI agents only generating information, they can become economic actors capable of initiating transactions when a service requires payment.
The bigger question is whether crypto-native payment infrastructure can become practical enough for autonomous agents to use at scale.
Could AI agents become a major use case for ADA payments?
$COOKIE
{future}(COOKIEUSDT)
$TST
{future}(TSTUSDT)
$ADA
{future}(ADAUSDT)
Cardano Brings ADA Payments to AI Agents 🤖⚡
Cardano has gained support in the x402 software stack, opening a new route for developers building AI agents and automated applications that need to pay for online services.
With the integration, applications can use ADA and Cardano native tokens for machine-to-machine payments. That means an AI agent could potentially pay for APIs, data, computing resources or other digital services without relying on traditional payment rails.
What interests me most is the shift toward programmable payments. Instead of AI agents only generating information, they can become economic actors capable of initiating transactions when a service requires payment.
The bigger question is whether crypto-native payment infrastructure can become practical enough for autonomous agents to use at scale.
Could AI agents become a major use case for ADA payments?
$COOKIE
$TST
$ADA
Cardano has gained support in the x402 software stack, opening a new route for developers building AI agents and automated applications that need to pay for online services.
With the integration, applications can use ADA and Cardano native tokens for machine-to-machine payments. That means an AI agent could potentially pay for APIs, data, computing resources or other digital services without relying on traditional payment rails.
What interests me most is the shift toward programmable payments. Instead of AI agents only generating information, they can become economic actors capable of initiating transactions when a service requires payment.
The bigger question is whether crypto-native payment infrastructure can become practical enough for autonomous agents to use at scale.
Could AI agents become a major use case for ADA payments?
$COOKIE
$TST
$ADA

1
325
·
--
Ondo Finance is changing how tokenized stocks can connect to real-world shares.
Ondo Finance has launched an in-kind conversion route that allows approved institutions to mint and redeem Ondo Stocks using the underlying shares through Alpaca’s Instant Tokenization Network.
The key idea is the conversion mechanism: eligible institutions can move between traditional equity exposure and tokenized representations without relying solely on cash-based settlement.
This could make tokenized equities more closely connected to the underlying market infrastructure, while giving institutions a more direct path into onchain assets.
For me, the bigger question is not simply whether stocks can be tokenized—it’s whether the rails can make that tokenization efficient, transparent, and usable at institutional scale.
Tokenized equities are increasingly becoming an infrastructure story, not just a crypto narrative.
$KERNEL
{future}(KERNELUSDT)
$TAO
{future}(TAOUSDT)
$ONDO
{future}(ONDOUSDT)
Ondo Finance is changing how tokenized stocks can connect to real-world shares.
Ondo Finance has launched an in-kind conversion route that allows approved institutions to mint and redeem Ondo Stocks using the underlying shares through Alpaca’s Instant Tokenization Network.
The key idea is the conversion mechanism: eligible institutions can move between traditional equity exposure and tokenized representations without relying solely on cash-based settlement.
This could make tokenized equities more closely connected to the underlying market infrastructure, while giving institutions a more direct path into onchain assets.
For me, the bigger question is not simply whether stocks can be tokenized—it’s whether the rails can make that tokenization efficient, transparent, and usable at institutional scale.
Tokenized equities are increasingly becoming an infrastructure story, not just a crypto narrative.
$KERNEL
$TAO
$ONDO
Ondo Finance has launched an in-kind conversion route that allows approved institutions to mint and redeem Ondo Stocks using the underlying shares through Alpaca’s Instant Tokenization Network.
The key idea is the conversion mechanism: eligible institutions can move between traditional equity exposure and tokenized representations without relying solely on cash-based settlement.
This could make tokenized equities more closely connected to the underlying market infrastructure, while giving institutions a more direct path into onchain assets.
For me, the bigger question is not simply whether stocks can be tokenized—it’s whether the rails can make that tokenization efficient, transparent, and usable at institutional scale.
Tokenized equities are increasingly becoming an infrastructure story, not just a crypto narrative.
$KERNEL
$TAO
$ONDO

1
310
·
--
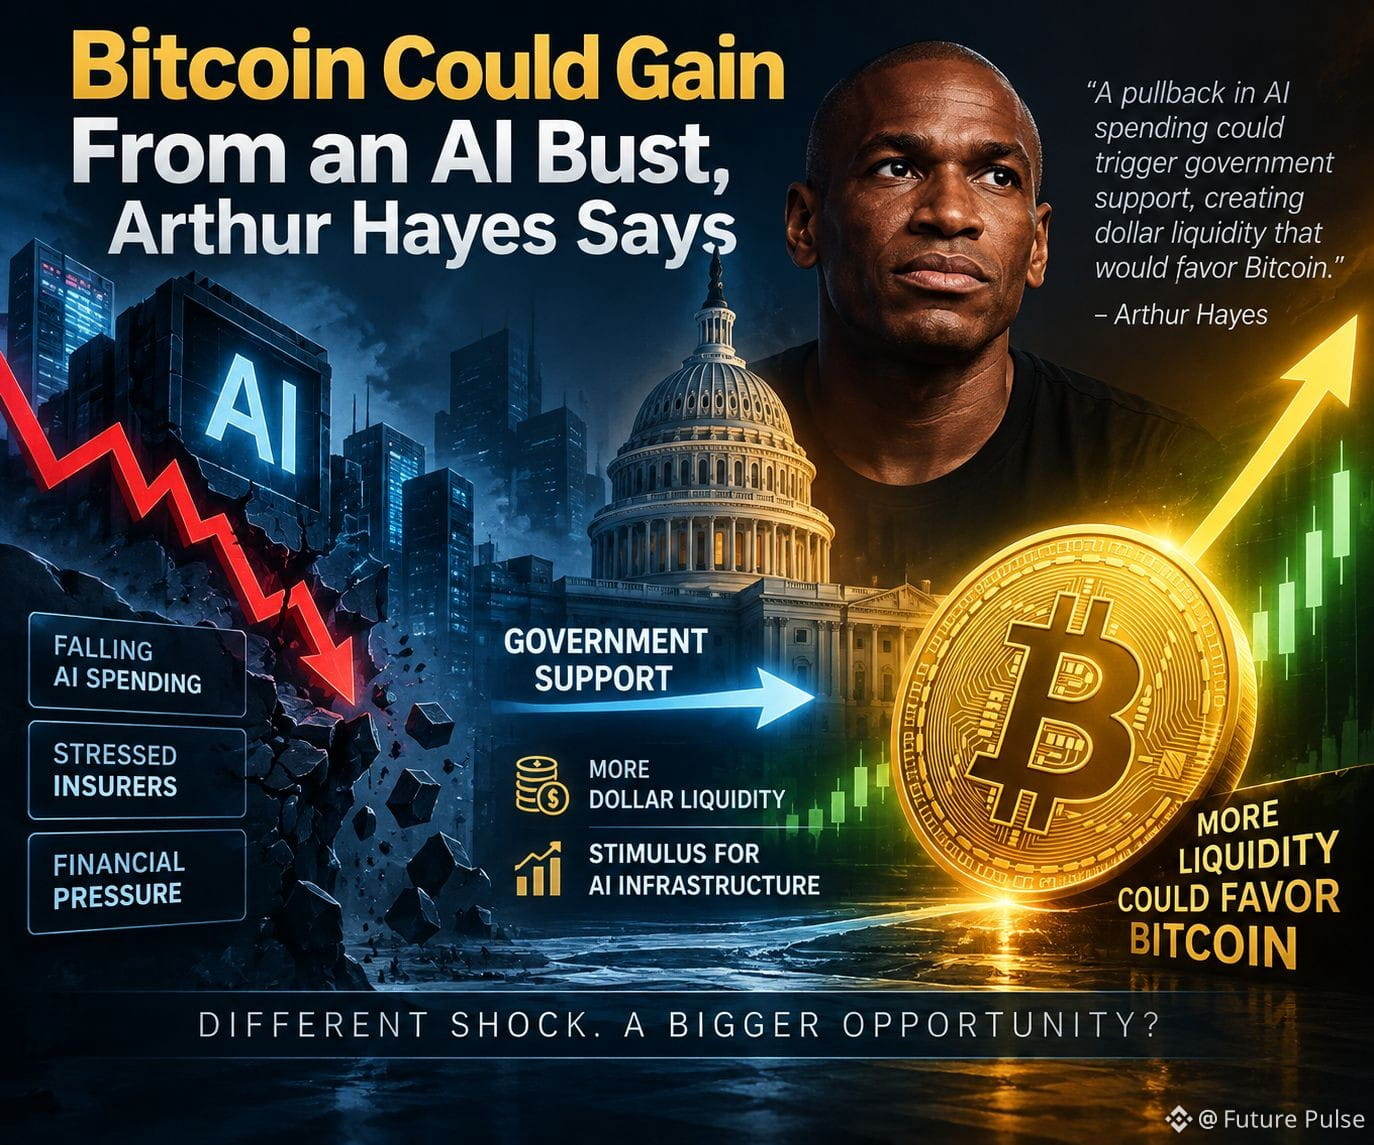
What if a slowdown in the AI boom eventually becomes a liquidity story for Bitcoin?
Arthur Hayes argues that a sharp pullback in U.S. AI spending could expose weaknesses in the debt financing the sector’s massive infrastructure buildout. In his latest analysis, Hayes suggests policymakers could ultimately respond by supporting AI infrastructure or absorbing losses tied to stressed insurers.
His thesis is straightforward: an AI downturn could create financial stress first, but a government liquidity response could become the second-order effect. If authorities inject substantial dollar liquidity to stabilize the system, Hayes believes Bitcoin could benefit as capital seeks scarce assets.
This is a scenario, not a guaranteed outcome. Bitcoin could initially face selling pressure if an AI-driven credit shock triggers broad risk-off positioning. Hayes has previously argued that the liquidity response—not the initial crash—is the key part of his Bitcoin thesis.
The interesting question for me is whether an AI bust would ultimately destroy liquidity or force policymakers to create more of it. That distinction could matter enormously for BTC.
$XNO
{spot}(XNOUSDT)
$BROCCOLI714
{future}(BROCCOLI714USDT)
$BTC
{future}(BTCUSDT)
What if a slowdown in the AI boom eventually becomes a liquidity story for Bitcoin?
Arthur Hayes argues that a sharp pullback in U.S. AI spending could expose weaknesses in the debt financing the sector’s massive infrastructure buildout. In his latest analysis, Hayes suggests policymakers could ultimately respond by supporting AI infrastructure or absorbing losses tied to stressed insurers.
His thesis is straightforward: an AI downturn could create financial stress first, but a government liquidity response could become the second-order effect. If authorities inject substantial dollar liquidity to stabilize the system, Hayes believes Bitcoin could benefit as capital seeks scarce assets.
This is a scenario, not a guaranteed outcome. Bitcoin could initially face selling pressure if an AI-driven credit shock triggers broad risk-off positioning. Hayes has previously argued that the liquidity response—not the initial crash—is the key part of his Bitcoin thesis.
The interesting question for me is whether an AI bust would ultimately destroy liquidity or force policymakers to create more of it. That distinction could matter enormously for BTC.
$XNO
$BROCCOLI714
$BTC
Arthur Hayes argues that a sharp pullback in U.S. AI spending could expose weaknesses in the debt financing the sector’s massive infrastructure buildout. In his latest analysis, Hayes suggests policymakers could ultimately respond by supporting AI infrastructure or absorbing losses tied to stressed insurers.
His thesis is straightforward: an AI downturn could create financial stress first, but a government liquidity response could become the second-order effect. If authorities inject substantial dollar liquidity to stabilize the system, Hayes believes Bitcoin could benefit as capital seeks scarce assets.
This is a scenario, not a guaranteed outcome. Bitcoin could initially face selling pressure if an AI-driven credit shock triggers broad risk-off positioning. Hayes has previously argued that the liquidity response—not the initial crash—is the key part of his Bitcoin thesis.
The interesting question for me is whether an AI bust would ultimately destroy liquidity or force policymakers to create more of it. That distinction could matter enormously for BTC.
$XNO
$BROCCOLI714
$BTC
1
290
·
--
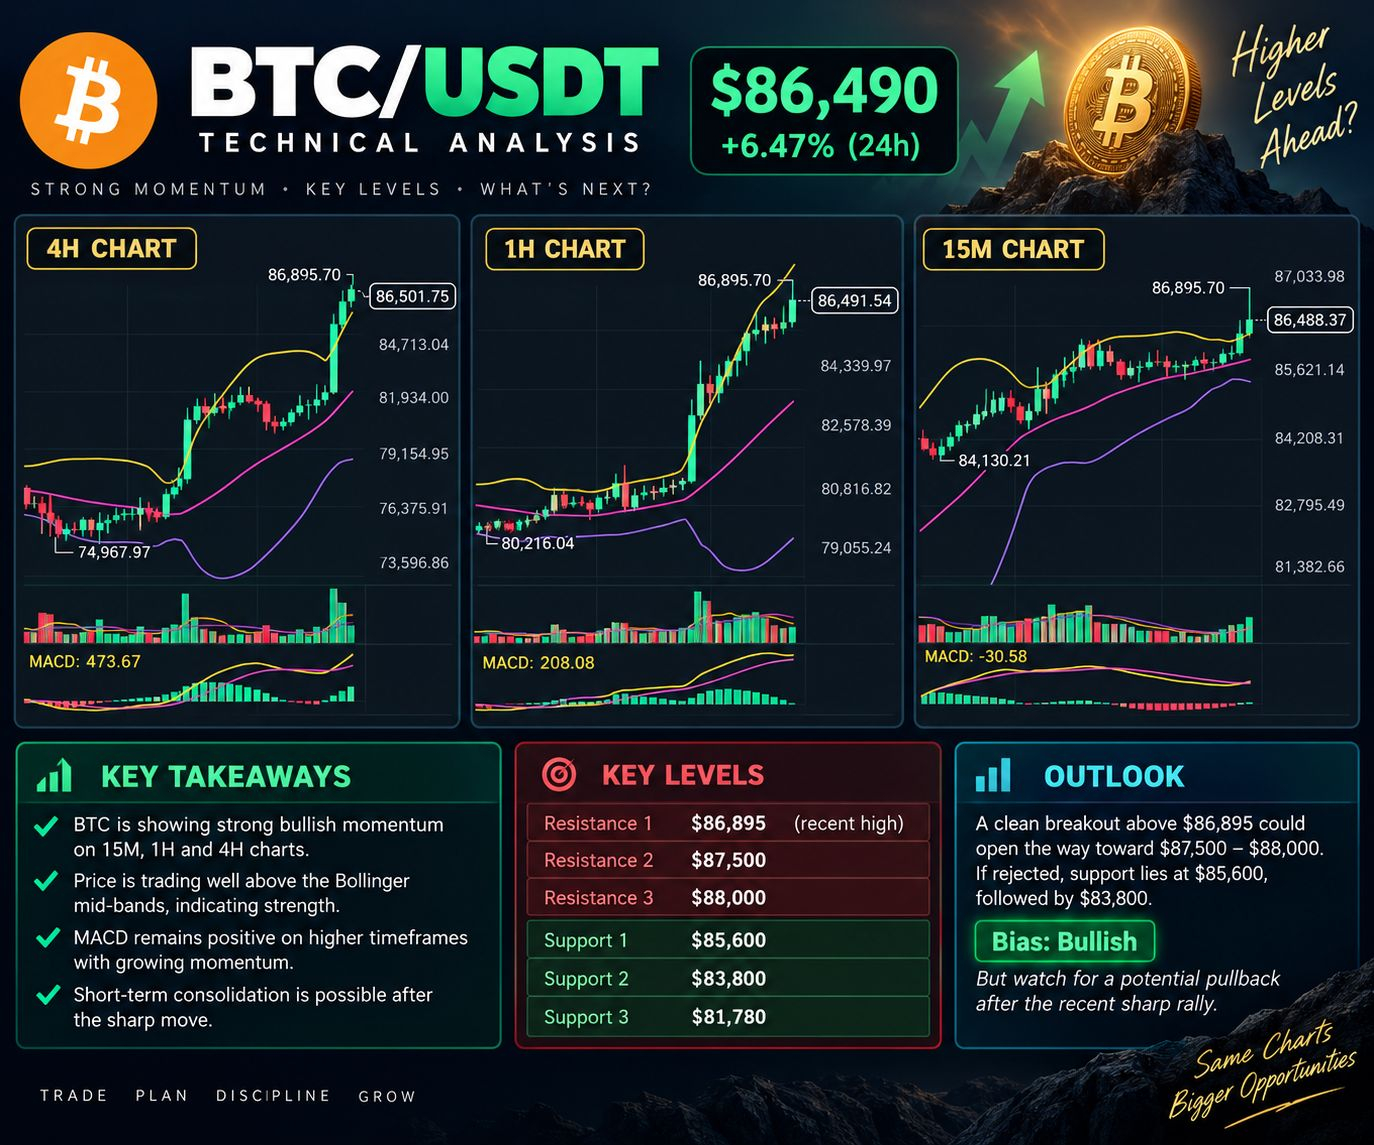
Bitcoin is trading around $86,490, showing strong bullish momentum across the 15M, 1H and 4H charts.
On the 4H, BTC is holding well above the Bollinger mid-band near $81,780, while MACD remains positive and expanding. The 1H chart also shows price above the mid-band at $83,818, confirming the short-term uptrend.
On the 15M, BTC is pressing the upper Bollinger Band after consolidating above $85,600. The key resistance is the recent high near $86,895. A clean breakout could open the way toward $87,500–$88,000.
If rejected, support sits around $85,600, followed by $83,800.
Bias: Bullish, but watch for a pullback after the sharp move.
$SUI
{future}(SUIUSDT)
$SOL
{future}(SOLUSDT)
$BTC
{future}(BTCUSDT)
BTC is hovering near $86.5K after a sharp breakout. What happens next?
Bitcoin is trading around $86,490, showing strong bullish momentum across the 15M, 1H and 4H charts.
On the 4H, BTC is holding well above the Bollinger mid-band near $81,780, while MACD remains positive and expanding. The 1H chart also shows price above the mid-band at $83,818, confirming the short-term uptrend.
On the 15M, BTC is pressing the upper Bollinger Band after consolidating above $85,600. The key resistance is the recent high near $86,895. A clean breakout could open the way toward $87,500–$88,000.
If rejected, support sits around $85,600, followed by $83,800.
Bias: Bullish, but watch for a pullback after the sharp move.
$SUI
$SOL
$BTC
BTC is hovering near $86.5K after a sharp breakout. What happens next?
On the 4H, BTC is holding well above the Bollinger mid-band near $81,780, while MACD remains positive and expanding. The 1H chart also shows price above the mid-band at $83,818, confirming the short-term uptrend.
On the 15M, BTC is pressing the upper Bollinger Band after consolidating above $85,600. The key resistance is the recent high near $86,895. A clean breakout could open the way toward $87,500–$88,000.
If rejected, support sits around $85,600, followed by $83,800.
Bias: Bullish, but watch for a pullback after the sharp move.
$SUI
$SOL
$BTC
BTC is hovering near $86.5K after a sharp breakout. What happens next?
🟢 Breaks $86.9K → $88K
55%
🟡 Consolidates → $85.6K
7%
🔴 Rejects → $83.8K
18%
⚪ Sharp pullback → $81.8K
20%
45 votes • Voting closed
1
599
·
--
Verified
0G is turning staking into something more directly connected to AI infrastructure.
The project has launched Ascend, a liquid staking product designed to let eligible users move from staked 0G into AI compute credits through a five-step system.
What caught my attention is the mechanism: instead of treating staking purely as a yield strategy, Ascend creates a path where staked assets can potentially become access to computing resources.
That links three pieces of the 0G ecosystem — staking, token utility, and AI compute — into one workflow.
I think the interesting part is not simply “liquid staking,” but how blockchain-based capital can be connected to the growing demand for AI infrastructure.
$FET
{future}(FETUSDT)
$XPL
{future}(XPLUSDT)
$0G
{future}(0GUSDT)
0G is turning staking into something more directly connected to AI infrastructure.
The project has launched Ascend, a liquid staking product designed to let eligible users move from staked 0G into AI compute credits through a five-step system.
What caught my attention is the mechanism: instead of treating staking purely as a yield strategy, Ascend creates a path where staked assets can potentially become access to computing resources.
That links three pieces of the 0G ecosystem — staking, token utility, and AI compute — into one workflow.
I think the interesting part is not simply “liquid staking,” but how blockchain-based capital can be connected to the growing demand for AI infrastructure.
$FET
$XPL
$0G
The project has launched Ascend, a liquid staking product designed to let eligible users move from staked 0G into AI compute credits through a five-step system.
What caught my attention is the mechanism: instead of treating staking purely as a yield strategy, Ascend creates a path where staked assets can potentially become access to computing resources.
That links three pieces of the 0G ecosystem — staking, token utility, and AI compute — into one workflow.
I think the interesting part is not simply “liquid staking,” but how blockchain-based capital can be connected to the growing demand for AI infrastructure.
$FET
$XPL
$0G

1
608
Log in to explore more content
Join global crypto users on Binance Square
⚡️ Get latest and useful information about crypto.
💬 Trusted by the world’s largest crypto exchange.
👍 Discover real insights from verified creators.
Email / Phone number