
000000000x
95 Posts

000000000x
Report
Block User
一个小目标
4 Following
1 Followers
1 Liked
Posts
All
Videos
·
--
Article
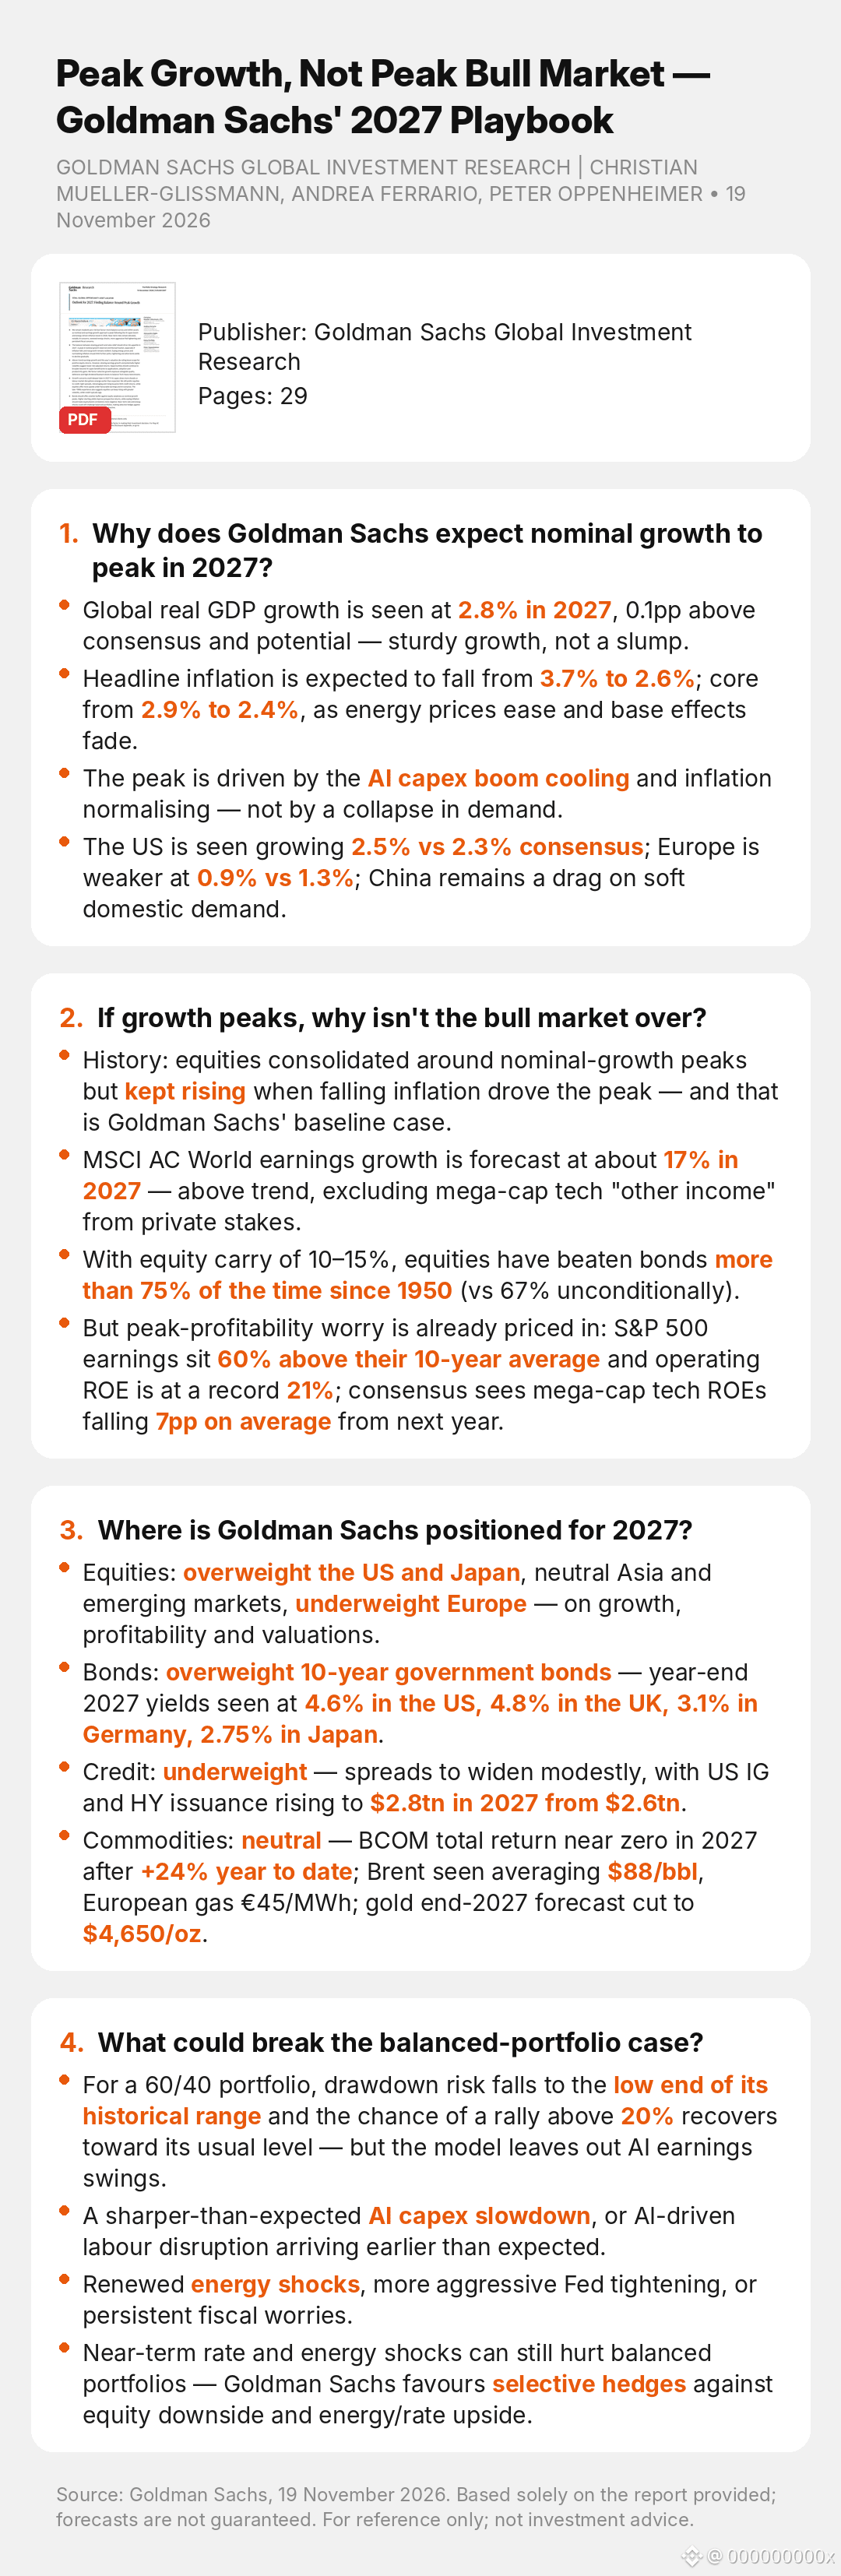
Peak Growth, Not Peak Bull Market — Goldman Sachs’ 2027 PlaybookPeak Growth, Not Peak Bull Market — Goldman Sachs' 2027 Playbook
$SPX $BTC
Goldman Sachs just published its 2027 outlook — peak growth, but not the end of the bull market. Here's the balance it recommends:
Source: Goldman Sachs Global Investment Research | Christian Mueller-Glissmann, Andrea Ferrario, Peter Oppenheimer • 19 November 2026
1. Why does Goldman Sachs expect nominal growth to peak in 2027?
• Global real GDP growth is seen at 2.8% in 2027, 0.1pp above consensus and potential — sturdy growth, not a slump.
• Headline inflation is expected to fall from 3.7% to 2.6%; core from 2.9% to 2.4%, as energy prices ease and base effects fade.
• The peak is driven by the AI capex boom cooling and inflation normalising — not by a collapse in demand.
• The US is seen growing 2.5% vs 2.3% consensus; Europe is weaker at 0.9% vs 1.3%; China remains a drag on soft domestic demand.
2. If growth peaks, why isn't the bull market over?
• History: equities consolidated around nominal-growth peaks but kept rising when falling inflation drove the peak — and that is Goldman Sachs' baseline case.
• MSCI AC World earnings growth is forecast at about 17% in 2027 — above trend, excluding mega-cap tech "other income" from private stakes.
• With equity carry of 10–15%, equities have beaten bonds more than 75% of the time since 1950 (vs 67% unconditionally).
• But peak-profitability worry is already priced in: S&P 500 earnings sit 60% above their 10-year average and operating ROE is at a record 21%; consensus sees mega-cap tech ROEs falling 7pp on average from next year.
3. Where is Goldman Sachs positioned for 2027?
• Equities: overweight the US and Japan, neutral Asia and emerging markets, underweight Europe — on growth, profitability and valuations.
• Bonds: overweight 10-year government bonds — year-end 2027 yields seen at 4.6% in the US, 4.8% in the UK, 3.1% in Germany, 2.75% in Japan.
• Credit: underweight — spreads to widen modestly, with US IG and HY issuance rising to $2.8tn in 2027 from $2.6tn.
• Commodities: neutral — BCOM total return near zero in 2027 after +24% year to date; Brent seen averaging $88/bbl, European gas €45/MWh; gold end-2027 forecast cut to $4,650/oz.
4. What could break the balanced-portfolio case?
• For a 60/40 portfolio, drawdown risk falls to the low end of its historical range and the chance of a rally above 20% recovers toward its usual level — but the model leaves out AI earnings swings.
• A sharper-than-expected AI capex slowdown, or AI-driven labour disruption arriving earlier than expected.
• Renewed energy shocks, more aggressive Fed tightening, or persistent fiscal worries.
• Near-term rate and energy shocks can still hurt balanced portfolios — Goldman Sachs favours selective hedges against equity downside and energy/rate upside.
#2027Outlook #Macro #Equities #Bonds #AI
Source: Goldman Sachs, "GOAL: Global Opportunity Asset Locator — Outlook for 2027: Finding Balance Around Peak Growth", 19 November 2026. For reference only; not investment advice.
Read the full breakdown on Unhidea: https://unhidea.com/en/articles/research-b9579b272f7d4b67bafa338be194e99b-en
Visit unhidea.com for more of the latest sell-side research interpretations.
Peak Growth, Not Peak Bull Market — Goldman Sachs’ 2027 Playbook
Peak Growth, Not Peak Bull Market — Goldman Sachs' 2027 Playbook
$SPX $BTC
Goldman Sachs just published its 2027 outlook — peak growth, but not the end of the bull market. Here's the balance it recommends:
Source: Goldman Sachs Global Investment Research | Christian Mueller-Glissmann, Andrea Ferrario, Peter Oppenheimer • 19 November 2026
1. Why does Goldman Sachs expect nominal growth to peak in 2027?
• Global real GDP growth is seen at 2.8% in 2027, 0.1pp above consensus and potential — sturdy growth, not a slump.
• Headline inflation is expected to fall from 3.7% to 2.6%; core from 2.9% to 2.4%, as energy prices ease and base effects fade.
• The peak is driven by the AI capex boom cooling and inflation normalising — not by a collapse in demand.
• The US is seen growing 2.5% vs 2.3% consensus; Europe is weaker at 0.9% vs 1.3%; China remains a drag on soft domestic demand.
2. If growth peaks, why isn't the bull market over?
• History: equities consolidated around nominal-growth peaks but kept rising when falling inflation drove the peak — and that is Goldman Sachs' baseline case.
• MSCI AC World earnings growth is forecast at about 17% in 2027 — above trend, excluding mega-cap tech "other income" from private stakes.
• With equity carry of 10–15%, equities have beaten bonds more than 75% of the time since 1950 (vs 67% unconditionally).
• But peak-profitability worry is already priced in: S&P 500 earnings sit 60% above their 10-year average and operating ROE is at a record 21%; consensus sees mega-cap tech ROEs falling 7pp on average from next year.
3. Where is Goldman Sachs positioned for 2027?
• Equities: overweight the US and Japan, neutral Asia and emerging markets, underweight Europe — on growth, profitability and valuations.
• Bonds: overweight 10-year government bonds — year-end 2027 yields seen at 4.6% in the US, 4.8% in the UK, 3.1% in Germany, 2.75% in Japan.
• Credit: underweight — spreads to widen modestly, with US IG and HY issuance rising to $2.8tn in 2027 from $2.6tn.
• Commodities: neutral — BCOM total return near zero in 2027 after +24% year to date; Brent seen averaging $88/bbl, European gas €45/MWh; gold end-2027 forecast cut to $4,650/oz.
4. What could break the balanced-portfolio case?
• For a 60/40 portfolio, drawdown risk falls to the low end of its historical range and the chance of a rally above 20% recovers toward its usual level — but the model leaves out AI earnings swings.
• A sharper-than-expected AI capex slowdown, or AI-driven labour disruption arriving earlier than expected.
• Renewed energy shocks, more aggressive Fed tightening, or persistent fiscal worries.
• Near-term rate and energy shocks can still hurt balanced portfolios — Goldman Sachs favours selective hedges against equity downside and energy/rate upside.
#2027Outlook #Macro #Equities #Bonds #AI
Source: Goldman Sachs, "GOAL: Global Opportunity Asset Locator — Outlook for 2027: Finding Balance Around Peak Growth", 19 November 2026. For reference only; not investment advice.
Read the full breakdown on Unhidea: https://unhidea.com/en/articles/research-b9579b272f7d4b67bafa338be194e99b-en
Visit unhidea.com for more of the latest sell-side research interpretations.
$SPX $BTC
Goldman Sachs just published its 2027 outlook — peak growth, but not the end of the bull market. Here's the balance it recommends:
Source: Goldman Sachs Global Investment Research | Christian Mueller-Glissmann, Andrea Ferrario, Peter Oppenheimer • 19 November 2026
1. Why does Goldman Sachs expect nominal growth to peak in 2027?
• Global real GDP growth is seen at 2.8% in 2027, 0.1pp above consensus and potential — sturdy growth, not a slump.
• Headline inflation is expected to fall from 3.7% to 2.6%; core from 2.9% to 2.4%, as energy prices ease and base effects fade.
• The peak is driven by the AI capex boom cooling and inflation normalising — not by a collapse in demand.
• The US is seen growing 2.5% vs 2.3% consensus; Europe is weaker at 0.9% vs 1.3%; China remains a drag on soft domestic demand.
2. If growth peaks, why isn't the bull market over?
• History: equities consolidated around nominal-growth peaks but kept rising when falling inflation drove the peak — and that is Goldman Sachs' baseline case.
• MSCI AC World earnings growth is forecast at about 17% in 2027 — above trend, excluding mega-cap tech "other income" from private stakes.
• With equity carry of 10–15%, equities have beaten bonds more than 75% of the time since 1950 (vs 67% unconditionally).
• But peak-profitability worry is already priced in: S&P 500 earnings sit 60% above their 10-year average and operating ROE is at a record 21%; consensus sees mega-cap tech ROEs falling 7pp on average from next year.
3. Where is Goldman Sachs positioned for 2027?
• Equities: overweight the US and Japan, neutral Asia and emerging markets, underweight Europe — on growth, profitability and valuations.
• Bonds: overweight 10-year government bonds — year-end 2027 yields seen at 4.6% in the US, 4.8% in the UK, 3.1% in Germany, 2.75% in Japan.
• Credit: underweight — spreads to widen modestly, with US IG and HY issuance rising to $2.8tn in 2027 from $2.6tn.
• Commodities: neutral — BCOM total return near zero in 2027 after +24% year to date; Brent seen averaging $88/bbl, European gas €45/MWh; gold end-2027 forecast cut to $4,650/oz.
4. What could break the balanced-portfolio case?
• For a 60/40 portfolio, drawdown risk falls to the low end of its historical range and the chance of a rally above 20% recovers toward its usual level — but the model leaves out AI earnings swings.
• A sharper-than-expected AI capex slowdown, or AI-driven labour disruption arriving earlier than expected.
• Renewed energy shocks, more aggressive Fed tightening, or persistent fiscal worries.
• Near-term rate and energy shocks can still hurt balanced portfolios — Goldman Sachs favours selective hedges against equity downside and energy/rate upside.
#2027Outlook #Macro #Equities #Bonds #AI
Source: Goldman Sachs, "GOAL: Global Opportunity Asset Locator — Outlook for 2027: Finding Balance Around Peak Growth", 19 November 2026. For reference only; not investment advice.
Read the full breakdown on Unhidea: https://unhidea.com/en/articles/research-b9579b272f7d4b67bafa338be194e99b-en
Visit unhidea.com for more of the latest sell-side research interpretations.
30
·
--
Article
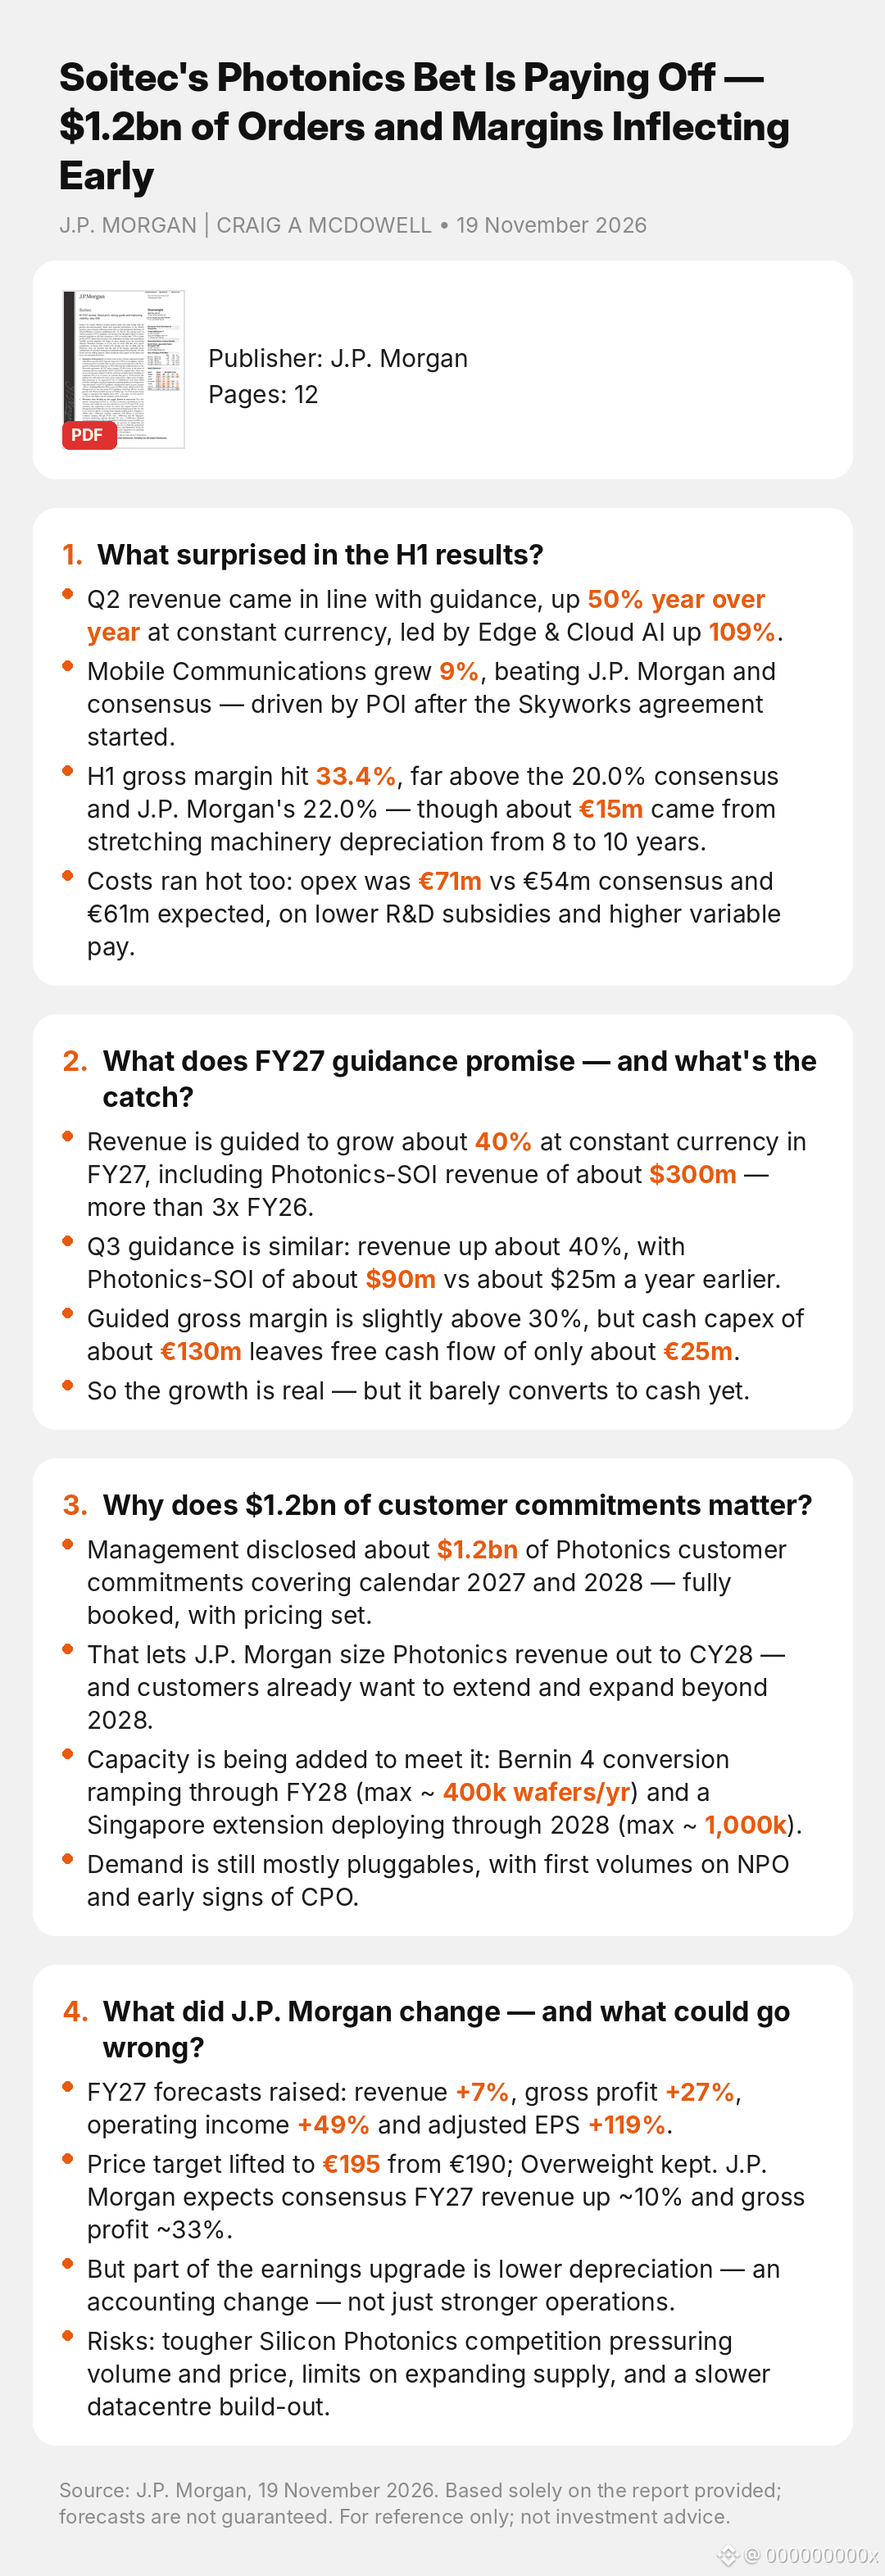
Soitec's Photonics Bet Is Paying Off — $1.2bn of Orders and Margins Inflecting EarlySoitec's Photonics Bet Is Paying Off — $1.2bn of Orders and Margins Inflecting Early
$SOIT.PA
J.P. MORGAN | CRAIG A MCDOWELL • 19 November 2026
1. What surprised in the H1 results?
• Q2 revenue came in line with guidance, up 50% year over year at constant currency, led by Edge & Cloud AI up 109%.
• Mobile Communications grew 9%, beating J.P. Morgan and consensus — driven by POI after the Skyworks agreement started.
• H1 gross margin hit 33.4%, far above the 20.0% consensus and J.P. Morgan's 22.0% — though about €15m came from stretching machinery depreciation from 8 to 10 years.
• Costs ran hot too: opex was €71m vs €54m consensus and €61m expected, on lower R&D subsidies and higher variable pay.
2. What does FY27 guidance promise — and what's the catch?
• Revenue is guided to grow about 40% at constant currency in FY27, including Photonics-SOI revenue of about $300m — more than 3x FY26.
• Q3 guidance is similar: revenue up about 40%, with Photonics-SOI of about $90m vs about $25m a year earlier.
• Guided gross margin is slightly above 30%, but cash capex of about €130m leaves free cash flow of only about €25m.
• So the growth is real — but it barely converts to cash yet.
3. Why does $1.2bn of customer commitments matter?
• Management disclosed about $1.2bn of Photonics customer commitments covering calendar 2027 and 2028 — fully booked, with pricing set.
• That lets J.P. Morgan size Photonics revenue out to CY28 — and customers already want to extend and expand beyond 2028.
• Capacity is being added to meet it: Bernin 4 conversion ramping through FY28 (max ~400k wafers/yr) and a Singapore extension deploying through 2028 (max ~1,000k).
• Demand is still mostly pluggables, with first volumes on NPO and early signs of CPO.
4. What did J.P. Morgan change — and what could go wrong?
• FY27 forecasts raised: revenue +7%, gross profit +27%, operating income +49% and adjusted EPS +119%.
• Price target lifted to €195 from €190; Overweight kept. J.P. Morgan expects consensus FY27 revenue up ~10% and gross profit ~33%.
• But part of the earnings upgrade is lower depreciation — an accounting change — not just stronger operations.
• Risks: tougher Silicon Photonics competition pressuring volume and price, limits on expanding supply, and a slower datacentre build-out.
#Photonics #SiliconPhotonics #AI #Semiconductors #DataCenter
Source: J.P. Morgan, 19 November 2026. Based solely on the report provided; forecasts are not guaranteed. For reference only; not investment advice.
Read the full breakdown on Unhidea: https://unhidea.com/en/articles/research-c0c43ef4b6c44f188d2e4fb4b5a2a8d8-en
Visit unhidea.com for more of the latest sell-side research interpretations.
Soitec's Photonics Bet Is Paying Off — $1.2bn of Orders and Margins Inflecting Early
Soitec's Photonics Bet Is Paying Off — $1.2bn of Orders and Margins Inflecting Early
$SOIT.PA
J.P. MORGAN | CRAIG A MCDOWELL • 19 November 2026
1. What surprised in the H1 results?
• Q2 revenue came in line with guidance, up 50% year over year at constant currency, led by Edge & Cloud AI up 109%.
• Mobile Communications grew 9%, beating J.P. Morgan and consensus — driven by POI after the Skyworks agreement started.
• H1 gross margin hit 33.4%, far above the 20.0% consensus and J.P. Morgan's 22.0% — though about €15m came from stretching machinery depreciation from 8 to 10 years.
• Costs ran hot too: opex was €71m vs €54m consensus and €61m expected, on lower R&D subsidies and higher variable pay.
2. What does FY27 guidance promise — and what's the catch?
• Revenue is guided to grow about 40% at constant currency in FY27, including Photonics-SOI revenue of about $300m — more than 3x FY26.
• Q3 guidance is similar: revenue up about 40%, with Photonics-SOI of about $90m vs about $25m a year earlier.
• Guided gross margin is slightly above 30%, but cash capex of about €130m leaves free cash flow of only about €25m.
• So the growth is real — but it barely converts to cash yet.
3. Why does $1.2bn of customer commitments matter?
• Management disclosed about $1.2bn of Photonics customer commitments covering calendar 2027 and 2028 — fully booked, with pricing set.
• That lets J.P. Morgan size Photonics revenue out to CY28 — and customers already want to extend and expand beyond 2028.
• Capacity is being added to meet it: Bernin 4 conversion ramping through FY28 (max ~400k wafers/yr) and a Singapore extension deploying through 2028 (max ~1,000k).
• Demand is still mostly pluggables, with first volumes on NPO and early signs of CPO.
4. What did J.P. Morgan change — and what could go wrong?
• FY27 forecasts raised: revenue +7%, gross profit +27%, operating income +49% and adjusted EPS +119%.
• Price target lifted to €195 from €190; Overweight kept. J.P. Morgan expects consensus FY27 revenue up ~10% and gross profit ~33%.
• But part of the earnings upgrade is lower depreciation — an accounting change — not just stronger operations.
• Risks: tougher Silicon Photonics competition pressuring volume and price, limits on expanding supply, and a slower datacentre build-out.
#Photonics #SiliconPhotonics #AI #Semiconductors #DataCenter
Source: J.P. Morgan, 19 November 2026. Based solely on the report provided; forecasts are not guaranteed. For reference only; not investment advice.
Read the full breakdown on Unhidea: https://unhidea.com/en/articles/research-c0c43ef4b6c44f188d2e4fb4b5a2a8d8-en
Visit unhidea.com for more of the latest sell-side research interpretations.
$SOIT.PA
J.P. MORGAN | CRAIG A MCDOWELL • 19 November 2026
1. What surprised in the H1 results?
• Q2 revenue came in line with guidance, up 50% year over year at constant currency, led by Edge & Cloud AI up 109%.
• Mobile Communications grew 9%, beating J.P. Morgan and consensus — driven by POI after the Skyworks agreement started.
• H1 gross margin hit 33.4%, far above the 20.0% consensus and J.P. Morgan's 22.0% — though about €15m came from stretching machinery depreciation from 8 to 10 years.
• Costs ran hot too: opex was €71m vs €54m consensus and €61m expected, on lower R&D subsidies and higher variable pay.
2. What does FY27 guidance promise — and what's the catch?
• Revenue is guided to grow about 40% at constant currency in FY27, including Photonics-SOI revenue of about $300m — more than 3x FY26.
• Q3 guidance is similar: revenue up about 40%, with Photonics-SOI of about $90m vs about $25m a year earlier.
• Guided gross margin is slightly above 30%, but cash capex of about €130m leaves free cash flow of only about €25m.
• So the growth is real — but it barely converts to cash yet.
3. Why does $1.2bn of customer commitments matter?
• Management disclosed about $1.2bn of Photonics customer commitments covering calendar 2027 and 2028 — fully booked, with pricing set.
• That lets J.P. Morgan size Photonics revenue out to CY28 — and customers already want to extend and expand beyond 2028.
• Capacity is being added to meet it: Bernin 4 conversion ramping through FY28 (max ~400k wafers/yr) and a Singapore extension deploying through 2028 (max ~1,000k).
• Demand is still mostly pluggables, with first volumes on NPO and early signs of CPO.
4. What did J.P. Morgan change — and what could go wrong?
• FY27 forecasts raised: revenue +7%, gross profit +27%, operating income +49% and adjusted EPS +119%.
• Price target lifted to €195 from €190; Overweight kept. J.P. Morgan expects consensus FY27 revenue up ~10% and gross profit ~33%.
• But part of the earnings upgrade is lower depreciation — an accounting change — not just stronger operations.
• Risks: tougher Silicon Photonics competition pressuring volume and price, limits on expanding supply, and a slower datacentre build-out.
#Photonics #SiliconPhotonics #AI #Semiconductors #DataCenter
Source: J.P. Morgan, 19 November 2026. Based solely on the report provided; forecasts are not guaranteed. For reference only; not investment advice.
Read the full breakdown on Unhidea: https://unhidea.com/en/articles/research-c0c43ef4b6c44f188d2e4fb4b5a2a8d8-en
Visit unhidea.com for more of the latest sell-side research interpretations.
59
·
--
Article
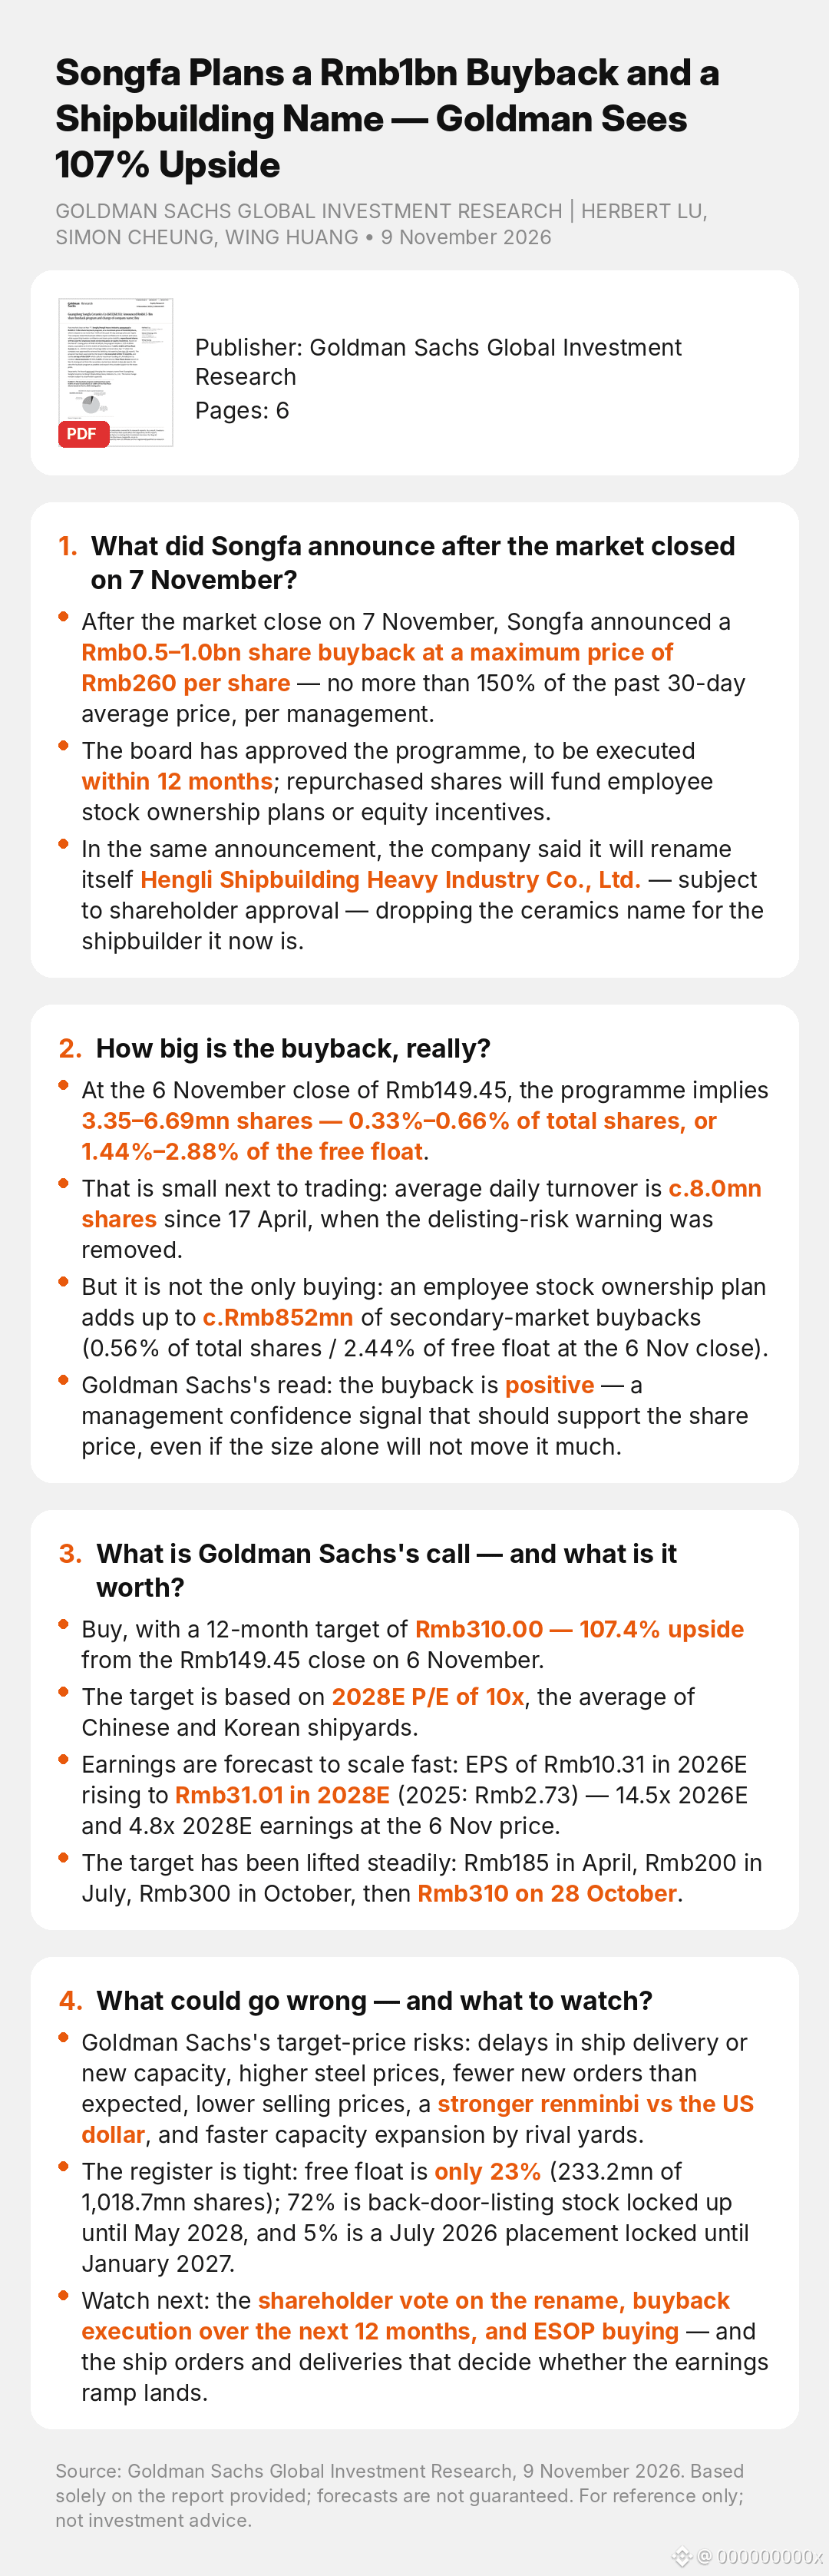
Songfa Plans a Rmb1bn Buyback and a Shipbuilding Name — Goldman Sees 107% UpsideSongfa Plans a Rmb1bn Buyback and a Shipbuilding Name — Goldman Sees 107% Upside
$603268.SS
GOLDMAN SACHS GLOBAL INVESTMENT RESEARCH | HERBERT LU, SIMON CHEUNG, WING HUANG • 9 November 2026
1. What did Songfa announce after the market closed on 7 November?
• After the market close on 7 November, Songfa announced a Rmb0.5–1.0bn share buyback at a maximum price of Rmb260 per share — no more than 150% of the past 30-day average price, per management.
• The board has approved the programme, to be executed within 12 months; repurchased shares will fund employee stock ownership plans or equity incentives.
• In the same announcement, the company said it will rename itself Hengli Shipbuilding Heavy Industry Co., Ltd. — subject to shareholder approval — dropping the ceramics name for the shipbuilder it now is.
2. How big is the buyback, really?
• At the 6 November close of Rmb149.45, the programme implies 3.35–6.69mn shares — 0.33%–0.66% of total shares, or 1.44%–2.88% of the free float.
• That is small next to trading: average daily turnover is c.8.0mn shares since 17 April, when the delisting-risk warning was removed.
• But it is not the only buying: an employee stock ownership plan adds up to c.Rmb852mn of secondary-market buybacks (0.56% of total shares / 2.44% of free float at the 6 Nov close).
• Goldman Sachs's read: the buyback is positive — a management confidence signal that should support the share price, even if the size alone will not move it much.
3. What is Goldman Sachs's call — and what is it worth?
• Buy, with a 12-month target of Rmb310.00 — 107.4% upside from the Rmb149.45 close on 6 November.
• The target is based on 2028E P/E of 10x, the average of Chinese and Korean shipyards.
• Earnings are forecast to scale fast: EPS of Rmb10.31 in 2026E rising to Rmb31.01 in 2028E (2025: Rmb2.73) — 14.5x 2026E and 4.8x 2028E earnings at the 6 Nov price.
• The target has been lifted steadily: Rmb185 in April, Rmb200 in July, Rmb300 in October, then Rmb310 on 28 October.
4. What could go wrong — and what to watch?
• Goldman Sachs's target-price risks: delays in ship delivery or new capacity, higher steel prices, fewer new orders than expected, lower selling prices, a stronger renminbi vs the US dollar, and faster capacity expansion by rival yards.
• The register is tight: free float is only 23% (233.2mn of 1,018.7mn shares); 72% is back-door-listing stock locked up until May 2028, and 5% is a July 2026 placement locked until January 2027.
• Watch next: the shareholder vote on the rename, buyback execution over the next 12 months, and ESOP buying — and the ship orders and deliveries that decide whether the earnings ramp lands.
#Shipbuilding #ChinaStocks #Buyback #Hengli #Maritime
Source: Goldman Sachs Global Investment Research, 9 November 2026. Based solely on the report provided; forecasts are not guaranteed. For reference only; not investment advice.
Read the full breakdown on Unhidea: https://unhidea.com/en/articles/research-02fa70ee0203442f91c4a51af87a7cc5-en
Visit unhidea.com for more of the latest sell-side research interpretations.
Songfa Plans a Rmb1bn Buyback and a Shipbuilding Name — Goldman Sees 107% Upside
Songfa Plans a Rmb1bn Buyback and a Shipbuilding Name — Goldman Sees 107% Upside
$603268.SS
GOLDMAN SACHS GLOBAL INVESTMENT RESEARCH | HERBERT LU, SIMON CHEUNG, WING HUANG • 9 November 2026
1. What did Songfa announce after the market closed on 7 November?
• After the market close on 7 November, Songfa announced a Rmb0.5–1.0bn share buyback at a maximum price of Rmb260 per share — no more than 150% of the past 30-day average price, per management.
• The board has approved the programme, to be executed within 12 months; repurchased shares will fund employee stock ownership plans or equity incentives.
• In the same announcement, the company said it will rename itself Hengli Shipbuilding Heavy Industry Co., Ltd. — subject to shareholder approval — dropping the ceramics name for the shipbuilder it now is.
2. How big is the buyback, really?
• At the 6 November close of Rmb149.45, the programme implies 3.35–6.69mn shares — 0.33%–0.66% of total shares, or 1.44%–2.88% of the free float.
• That is small next to trading: average daily turnover is c.8.0mn shares since 17 April, when the delisting-risk warning was removed.
• But it is not the only buying: an employee stock ownership plan adds up to c.Rmb852mn of secondary-market buybacks (0.56% of total shares / 2.44% of free float at the 6 Nov close).
• Goldman Sachs's read: the buyback is positive — a management confidence signal that should support the share price, even if the size alone will not move it much.
3. What is Goldman Sachs's call — and what is it worth?
• Buy, with a 12-month target of Rmb310.00 — 107.4% upside from the Rmb149.45 close on 6 November.
• The target is based on 2028E P/E of 10x, the average of Chinese and Korean shipyards.
• Earnings are forecast to scale fast: EPS of Rmb10.31 in 2026E rising to Rmb31.01 in 2028E (2025: Rmb2.73) — 14.5x 2026E and 4.8x 2028E earnings at the 6 Nov price.
• The target has been lifted steadily: Rmb185 in April, Rmb200 in July, Rmb300 in October, then Rmb310 on 28 October.
4. What could go wrong — and what to watch?
• Goldman Sachs's target-price risks: delays in ship delivery or new capacity, higher steel prices, fewer new orders than expected, lower selling prices, a stronger renminbi vs the US dollar, and faster capacity expansion by rival yards.
• The register is tight: free float is only 23% (233.2mn of 1,018.7mn shares); 72% is back-door-listing stock locked up until May 2028, and 5% is a July 2026 placement locked until January 2027.
• Watch next: the shareholder vote on the rename, buyback execution over the next 12 months, and ESOP buying — and the ship orders and deliveries that decide whether the earnings ramp lands.
#Shipbuilding #ChinaStocks #Buyback #Hengli #Maritime
Source: Goldman Sachs Global Investment Research, 9 November 2026. Based solely on the report provided; forecasts are not guaranteed. For reference only; not investment advice.
Read the full breakdown on Unhidea: https://unhidea.com/en/articles/research-02fa70ee0203442f91c4a51af87a7cc5-en
Visit unhidea.com for more of the latest sell-side research interpretations.
$603268.SS
GOLDMAN SACHS GLOBAL INVESTMENT RESEARCH | HERBERT LU, SIMON CHEUNG, WING HUANG • 9 November 2026
1. What did Songfa announce after the market closed on 7 November?
• After the market close on 7 November, Songfa announced a Rmb0.5–1.0bn share buyback at a maximum price of Rmb260 per share — no more than 150% of the past 30-day average price, per management.
• The board has approved the programme, to be executed within 12 months; repurchased shares will fund employee stock ownership plans or equity incentives.
• In the same announcement, the company said it will rename itself Hengli Shipbuilding Heavy Industry Co., Ltd. — subject to shareholder approval — dropping the ceramics name for the shipbuilder it now is.
2. How big is the buyback, really?
• At the 6 November close of Rmb149.45, the programme implies 3.35–6.69mn shares — 0.33%–0.66% of total shares, or 1.44%–2.88% of the free float.
• That is small next to trading: average daily turnover is c.8.0mn shares since 17 April, when the delisting-risk warning was removed.
• But it is not the only buying: an employee stock ownership plan adds up to c.Rmb852mn of secondary-market buybacks (0.56% of total shares / 2.44% of free float at the 6 Nov close).
• Goldman Sachs's read: the buyback is positive — a management confidence signal that should support the share price, even if the size alone will not move it much.
3. What is Goldman Sachs's call — and what is it worth?
• Buy, with a 12-month target of Rmb310.00 — 107.4% upside from the Rmb149.45 close on 6 November.
• The target is based on 2028E P/E of 10x, the average of Chinese and Korean shipyards.
• Earnings are forecast to scale fast: EPS of Rmb10.31 in 2026E rising to Rmb31.01 in 2028E (2025: Rmb2.73) — 14.5x 2026E and 4.8x 2028E earnings at the 6 Nov price.
• The target has been lifted steadily: Rmb185 in April, Rmb200 in July, Rmb300 in October, then Rmb310 on 28 October.
4. What could go wrong — and what to watch?
• Goldman Sachs's target-price risks: delays in ship delivery or new capacity, higher steel prices, fewer new orders than expected, lower selling prices, a stronger renminbi vs the US dollar, and faster capacity expansion by rival yards.
• The register is tight: free float is only 23% (233.2mn of 1,018.7mn shares); 72% is back-door-listing stock locked up until May 2028, and 5% is a July 2026 placement locked until January 2027.
• Watch next: the shareholder vote on the rename, buyback execution over the next 12 months, and ESOP buying — and the ship orders and deliveries that decide whether the earnings ramp lands.
#Shipbuilding #ChinaStocks #Buyback #Hengli #Maritime
Source: Goldman Sachs Global Investment Research, 9 November 2026. Based solely on the report provided; forecasts are not guaranteed. For reference only; not investment advice.
Read the full breakdown on Unhidea: https://unhidea.com/en/articles/research-02fa70ee0203442f91c4a51af87a7cc5-en
Visit unhidea.com for more of the latest sell-side research interpretations.
·
--
Article
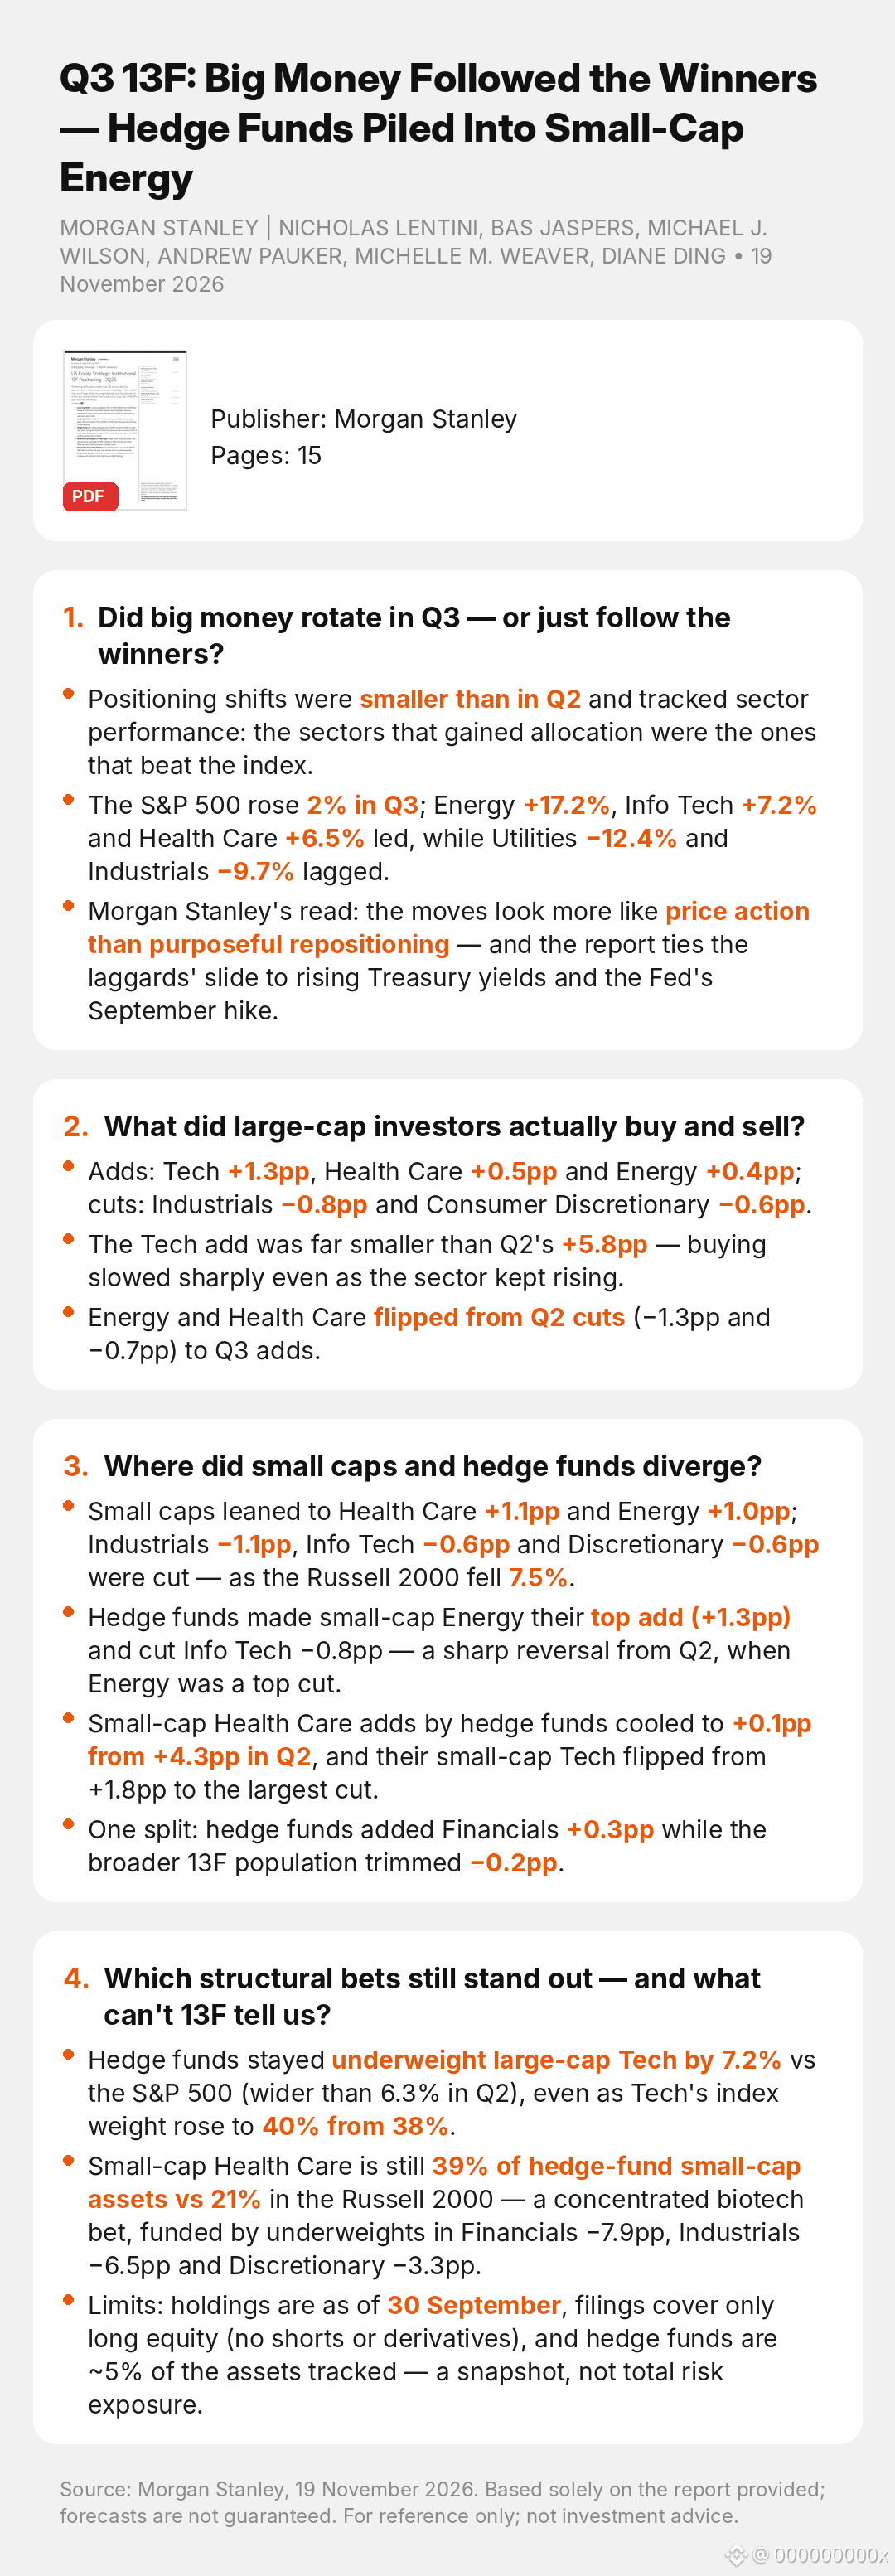
Q3 13F: Big Money Followed the Winners — Hedge Funds Piled Into Small-Cap EnergyQ3 13F: Big Money Followed the Winners — Hedge Funds Piled Into Small-Cap Energy
$SPX $BTC
After Friday's broad selloff, here is what the big money was actually holding at the end of Q3:
Source: Morgan Stanley | Nicholas Lentini, Bas Jaspers, Michael J. Wilson, Andrew Pauker, Michelle M. Weaver, Diane Ding • 19 November 2026
1. Did big money rotate in Q3 — or just follow the winners?
• Positioning shifts were smaller than in Q2 and tracked sector performance: the sectors that gained allocation were the ones that beat the index.
• The S&P 500 rose 2% in Q3; Energy +17.2%, Info Tech +7.2% and Health Care +6.5% led, while Utilities −12.4% and Industrials −9.7% lagged.
• Morgan Stanley's read: the moves look more like price action than purposeful repositioning — and the report ties the laggards' slide to rising Treasury yields and the Fed's September hike.
2. What did large-cap investors actually buy and sell?
• Adds: Tech +1.3pp, Health Care +0.5pp and Energy +0.4pp; cuts: Industrials −0.8pp and Consumer Discretionary −0.6pp.
• The Tech add was far smaller than Q2's +5.8pp — buying slowed sharply even as the sector kept rising.
• Energy and Health Care flipped from Q2 cuts (−1.3pp and −0.7pp) to Q3 adds.
3. Where did small caps and hedge funds diverge?
• Small caps leaned to Health Care +1.1pp and Energy +1.0pp; Industrials −1.1pp, Info Tech −0.6pp and Discretionary −0.6pp were cut — as the Russell 2000 fell 7.5%.
• Hedge funds made small-cap Energy their top add (+1.3pp) and cut Info Tech −0.8pp — a sharp reversal from Q2, when Energy was a top cut.
• Small-cap Health Care adds by hedge funds cooled to +0.1pp from +4.3pp in Q2, and their small-cap Tech flipped from +1.8pp to the largest cut.
• One split: hedge funds added Financials +0.3pp while the broader 13F population trimmed −0.2pp.
4. Which structural bets still stand out — and what can't 13F tell us?
• Hedge funds stayed underweight large-cap Tech by 7.2% vs the S&P 500 (wider than 6.3% in Q2), even as Tech's index weight rose to 40% from 38%.
• Small-cap Health Care is still 39% of hedge-fund small-cap assets vs 21% in the Russell 2000 — a concentrated biotech bet, funded by underweights in Financials −7.9pp, Industrials −6.5pp and Discretionary −3.3pp.
• Limits: holdings are as of 30 September, filings cover only long equity (no shorts or derivatives), and hedge funds are ~5% of the assets tracked — a snapshot, not total risk exposure.
#SP500 #13F #HedgeFunds #Energy #SmallCaps
Source: Morgan Stanley, "US Equity Strategy: Institutional 13F Positioning — 3Q26", 19 November 2026. Holdings as of 30 September 2026. For reference only; not investment advice.
Read the full breakdown on Unhidea: https://unhidea.com/en/articles/research-08f88aea5bab40b4857854422a56126a-en
Visit unhidea.com for more of the latest sell-side research interpretations.
Q3 13F: Big Money Followed the Winners — Hedge Funds Piled Into Small-Cap Energy
Q3 13F: Big Money Followed the Winners — Hedge Funds Piled Into Small-Cap Energy
$SPX $BTC
After Friday's broad selloff, here is what the big money was actually holding at the end of Q3:
Source: Morgan Stanley | Nicholas Lentini, Bas Jaspers, Michael J. Wilson, Andrew Pauker, Michelle M. Weaver, Diane Ding • 19 November 2026
1. Did big money rotate in Q3 — or just follow the winners?
• Positioning shifts were smaller than in Q2 and tracked sector performance: the sectors that gained allocation were the ones that beat the index.
• The S&P 500 rose 2% in Q3; Energy +17.2%, Info Tech +7.2% and Health Care +6.5% led, while Utilities −12.4% and Industrials −9.7% lagged.
• Morgan Stanley's read: the moves look more like price action than purposeful repositioning — and the report ties the laggards' slide to rising Treasury yields and the Fed's September hike.
2. What did large-cap investors actually buy and sell?
• Adds: Tech +1.3pp, Health Care +0.5pp and Energy +0.4pp; cuts: Industrials −0.8pp and Consumer Discretionary −0.6pp.
• The Tech add was far smaller than Q2's +5.8pp — buying slowed sharply even as the sector kept rising.
• Energy and Health Care flipped from Q2 cuts (−1.3pp and −0.7pp) to Q3 adds.
3. Where did small caps and hedge funds diverge?
• Small caps leaned to Health Care +1.1pp and Energy +1.0pp; Industrials −1.1pp, Info Tech −0.6pp and Discretionary −0.6pp were cut — as the Russell 2000 fell 7.5%.
• Hedge funds made small-cap Energy their top add (+1.3pp) and cut Info Tech −0.8pp — a sharp reversal from Q2, when Energy was a top cut.
• Small-cap Health Care adds by hedge funds cooled to +0.1pp from +4.3pp in Q2, and their small-cap Tech flipped from +1.8pp to the largest cut.
• One split: hedge funds added Financials +0.3pp while the broader 13F population trimmed −0.2pp.
4. Which structural bets still stand out — and what can't 13F tell us?
• Hedge funds stayed underweight large-cap Tech by 7.2% vs the S&P 500 (wider than 6.3% in Q2), even as Tech's index weight rose to 40% from 38%.
• Small-cap Health Care is still 39% of hedge-fund small-cap assets vs 21% in the Russell 2000 — a concentrated biotech bet, funded by underweights in Financials −7.9pp, Industrials −6.5pp and Discretionary −3.3pp.
• Limits: holdings are as of 30 September, filings cover only long equity (no shorts or derivatives), and hedge funds are ~5% of the assets tracked — a snapshot, not total risk exposure.
#SP500 #13F #HedgeFunds #Energy #SmallCaps
Source: Morgan Stanley, "US Equity Strategy: Institutional 13F Positioning — 3Q26", 19 November 2026. Holdings as of 30 September 2026. For reference only; not investment advice.
Read the full breakdown on Unhidea: https://unhidea.com/en/articles/research-08f88aea5bab40b4857854422a56126a-en
Visit unhidea.com for more of the latest sell-side research interpretations.
$SPX $BTC
After Friday's broad selloff, here is what the big money was actually holding at the end of Q3:
Source: Morgan Stanley | Nicholas Lentini, Bas Jaspers, Michael J. Wilson, Andrew Pauker, Michelle M. Weaver, Diane Ding • 19 November 2026
1. Did big money rotate in Q3 — or just follow the winners?
• Positioning shifts were smaller than in Q2 and tracked sector performance: the sectors that gained allocation were the ones that beat the index.
• The S&P 500 rose 2% in Q3; Energy +17.2%, Info Tech +7.2% and Health Care +6.5% led, while Utilities −12.4% and Industrials −9.7% lagged.
• Morgan Stanley's read: the moves look more like price action than purposeful repositioning — and the report ties the laggards' slide to rising Treasury yields and the Fed's September hike.
2. What did large-cap investors actually buy and sell?
• Adds: Tech +1.3pp, Health Care +0.5pp and Energy +0.4pp; cuts: Industrials −0.8pp and Consumer Discretionary −0.6pp.
• The Tech add was far smaller than Q2's +5.8pp — buying slowed sharply even as the sector kept rising.
• Energy and Health Care flipped from Q2 cuts (−1.3pp and −0.7pp) to Q3 adds.
3. Where did small caps and hedge funds diverge?
• Small caps leaned to Health Care +1.1pp and Energy +1.0pp; Industrials −1.1pp, Info Tech −0.6pp and Discretionary −0.6pp were cut — as the Russell 2000 fell 7.5%.
• Hedge funds made small-cap Energy their top add (+1.3pp) and cut Info Tech −0.8pp — a sharp reversal from Q2, when Energy was a top cut.
• Small-cap Health Care adds by hedge funds cooled to +0.1pp from +4.3pp in Q2, and their small-cap Tech flipped from +1.8pp to the largest cut.
• One split: hedge funds added Financials +0.3pp while the broader 13F population trimmed −0.2pp.
4. Which structural bets still stand out — and what can't 13F tell us?
• Hedge funds stayed underweight large-cap Tech by 7.2% vs the S&P 500 (wider than 6.3% in Q2), even as Tech's index weight rose to 40% from 38%.
• Small-cap Health Care is still 39% of hedge-fund small-cap assets vs 21% in the Russell 2000 — a concentrated biotech bet, funded by underweights in Financials −7.9pp, Industrials −6.5pp and Discretionary −3.3pp.
• Limits: holdings are as of 30 September, filings cover only long equity (no shorts or derivatives), and hedge funds are ~5% of the assets tracked — a snapshot, not total risk exposure.
#SP500 #13F #HedgeFunds #Energy #SmallCaps
Source: Morgan Stanley, "US Equity Strategy: Institutional 13F Positioning — 3Q26", 19 November 2026. Holdings as of 30 September 2026. For reference only; not investment advice.
Read the full breakdown on Unhidea: https://unhidea.com/en/articles/research-08f88aea5bab40b4857854422a56126a-en
Visit unhidea.com for more of the latest sell-side research interpretations.
79
·
--
Article
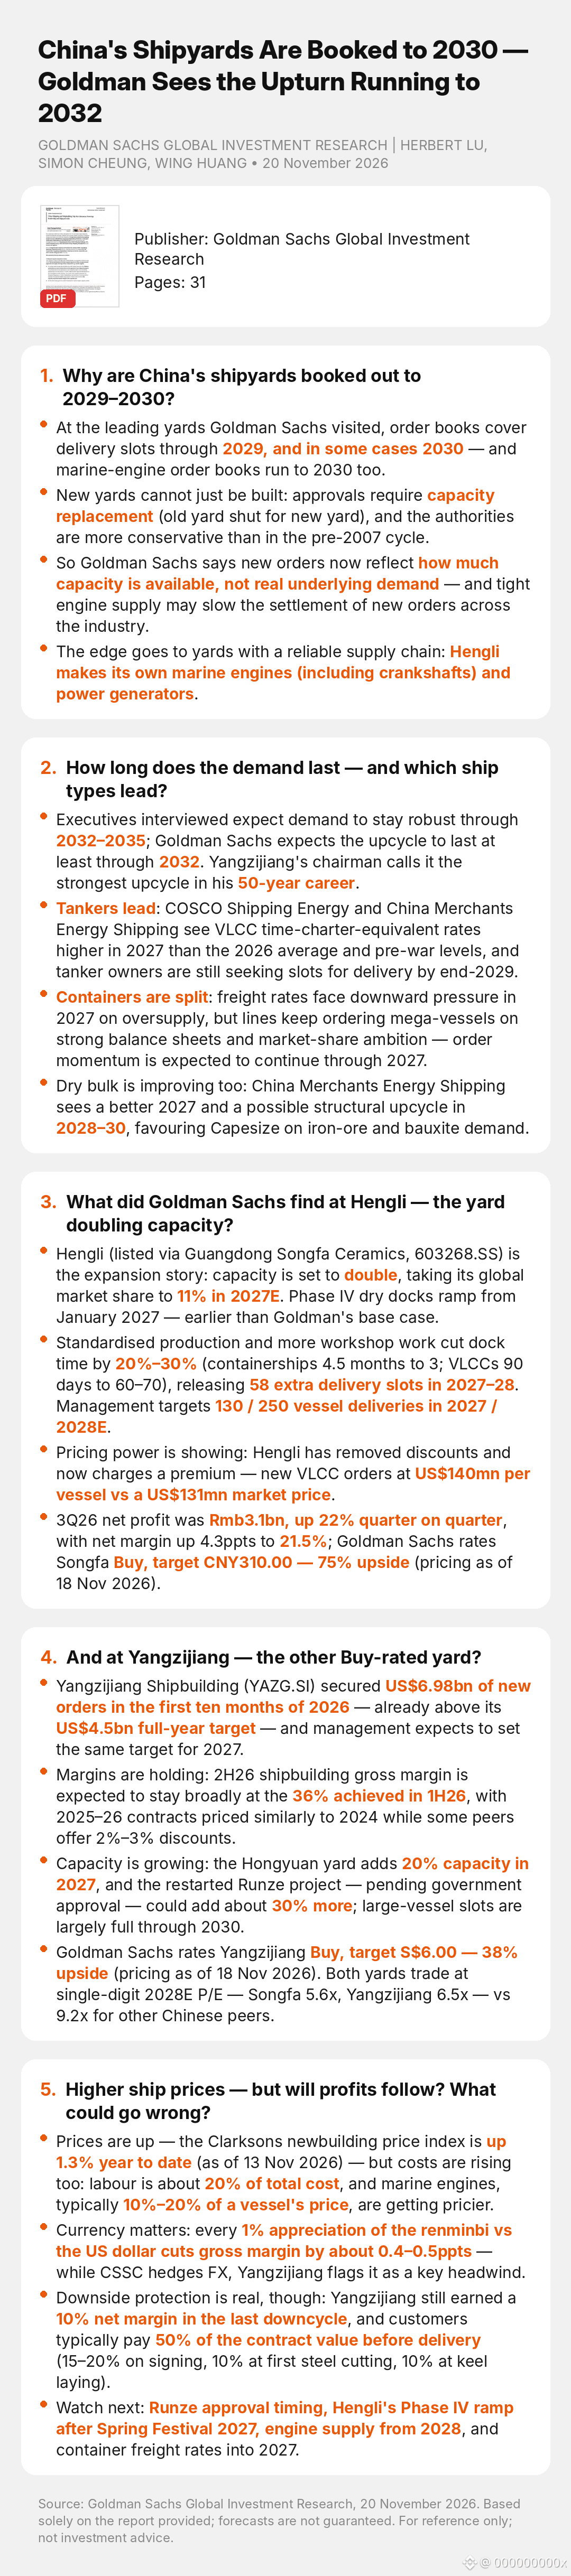
China's Shipyards Are Booked to 2030 — Goldman Sees the Upturn Running to 2032China's Shipyards Are Booked to 2030 — Goldman Sees the Upturn Running to 2032
$BS6.SI $603268.SS $BTC
GOLDMAN SACHS GLOBAL INVESTMENT RESEARCH | HERBERT LU, SIMON CHEUNG, WING HUANG • 20 November 2026
1. Why are China's shipyards booked out to 2029–2030?
• At the leading yards Goldman Sachs visited, order books cover slots through 2029, even 2030 — engine order books too.
• New yards need approvals requiring capacity replacement, and the authorities are more conservative than before the 2007 cycle.
• So new orders reflect available capacity, not real demand — and tight engine supply may slow new orders industry-wide.
• The edge goes to yards with reliable supply chains: Hengli makes its own marine engines and power generators.
2. How long does the demand last — and which ship types lead?
• Executives expect demand robust through 2032–2035; Goldman Sachs sees the upcycle lasting at least through 2032 — Yangzijiang's chairman calls it the strongest in his 50-year career.
• Tankers lead: COSCO Shipping Energy and CMES see VLCC rates higher in 2027 than the 2026 average and pre-war levels; owners still seek end-2029 slots.
• Containers are split: freight rates face pressure in 2027, but lines keep ordering mega-vessels — momentum should continue through 2027.
3. What did Goldman Sachs find at Hengli — the yard doubling capacity?
• Hengli (via Songfa Ceramics, 603268.SS): capacity set to double, global share to 11% in 2027E; Phase IV dry docks ramp from January 2027 — earlier than Goldman's base case.
• Standardised production cuts dock time 20%–30%, releasing 58 extra delivery slots in 2027–28; management targets 130 / 250 deliveries in 2027 / 2028E.
• Pricing power shows: Hengli removed discounts — new VLCC orders at US$140mn vs a US$131mn market price.
• 3Q26 net profit Rmb3.1bn, +22% QoQ, net margin 21.5%; Songfa Buy, target CNY310.00 — 75% upside (18 Nov 2026 prices).
4. And at Yangzijiang — the other Buy-rated yard?
• Yangzijiang (YAZG.SI) won US$6.98bn of new orders in 10M26 — above its US$4.5bn FY26 target — and expects the same target for 2027.
• Margins hold: 2H26 gross margin seen near 1H26's 36%, with 2025–26 contracts priced like 2024 while peers discount 2%–3%.
• Capacity grows: Hongyuan adds 20% in 2027; restarted Runze — pending approval — could add ~30% more; large-vessel slots are largely full through 2030.
• Yangzijiang Buy, target S$6.00 — 38% upside (18 Nov 2026 prices). Both yards trade at single-digit 2028E P/E (5.6x / 6.5x) vs 9.2x for other Chinese peers.
5. Higher ship prices — but will profits follow? What could go wrong?
• Prices are up — Clarksons newbuilding index +1.3% YTD (13 Nov 2026) — but so are costs: labour ~20% of total cost; engines 10%–20% of a vessel's price.
• Currency matters: every 1% renminbi gain vs the dollar cuts gross margin ~0.4–0.5ppts.
• Protection is real: Yangzijiang earned 10% net margin even in the last downcycle, and customers pay 50% before delivery.
• Watch: Runze approval, Hengli's Phase IV ramp after Spring Festival 2027, engine supply from 2028, container rates into 2027.
#Shipbuilding #Shipping #ChinaStocks #Tankers #Commodities
Source: Goldman Sachs Global Investment Research, 20 November 2026. Based solely on the report provided; forecasts are not guaranteed. For reference only; not investment advice.
Read the full breakdown on Unhidea: https://unhidea.com/en/articles/research-432428126b3f4851a52ef0ef87730858-en
Visit unhidea.com for more of the latest sell-side research interpretations.
China's Shipyards Are Booked to 2030 — Goldman Sees the Upturn Running to 2032
China's Shipyards Are Booked to 2030 — Goldman Sees the Upturn Running to 2032
$BS6.SI $603268.SS $BTC
GOLDMAN SACHS GLOBAL INVESTMENT RESEARCH | HERBERT LU, SIMON CHEUNG, WING HUANG • 20 November 2026
1. Why are China's shipyards booked out to 2029–2030?
• At the leading yards Goldman Sachs visited, order books cover slots through 2029, even 2030 — engine order books too.
• New yards need approvals requiring capacity replacement, and the authorities are more conservative than before the 2007 cycle.
• So new orders reflect available capacity, not real demand — and tight engine supply may slow new orders industry-wide.
• The edge goes to yards with reliable supply chains: Hengli makes its own marine engines and power generators.
2. How long does the demand last — and which ship types lead?
• Executives expect demand robust through 2032–2035; Goldman Sachs sees the upcycle lasting at least through 2032 — Yangzijiang's chairman calls it the strongest in his 50-year career.
• Tankers lead: COSCO Shipping Energy and CMES see VLCC rates higher in 2027 than the 2026 average and pre-war levels; owners still seek end-2029 slots.
• Containers are split: freight rates face pressure in 2027, but lines keep ordering mega-vessels — momentum should continue through 2027.
3. What did Goldman Sachs find at Hengli — the yard doubling capacity?
• Hengli (via Songfa Ceramics, 603268.SS): capacity set to double, global share to 11% in 2027E; Phase IV dry docks ramp from January 2027 — earlier than Goldman's base case.
• Standardised production cuts dock time 20%–30%, releasing 58 extra delivery slots in 2027–28; management targets 130 / 250 deliveries in 2027 / 2028E.
• Pricing power shows: Hengli removed discounts — new VLCC orders at US$140mn vs a US$131mn market price.
• 3Q26 net profit Rmb3.1bn, +22% QoQ, net margin 21.5%; Songfa Buy, target CNY310.00 — 75% upside (18 Nov 2026 prices).
4. And at Yangzijiang — the other Buy-rated yard?
• Yangzijiang (YAZG.SI) won US$6.98bn of new orders in 10M26 — above its US$4.5bn FY26 target — and expects the same target for 2027.
• Margins hold: 2H26 gross margin seen near 1H26's 36%, with 2025–26 contracts priced like 2024 while peers discount 2%–3%.
• Capacity grows: Hongyuan adds 20% in 2027; restarted Runze — pending approval — could add ~30% more; large-vessel slots are largely full through 2030.
• Yangzijiang Buy, target S$6.00 — 38% upside (18 Nov 2026 prices). Both yards trade at single-digit 2028E P/E (5.6x / 6.5x) vs 9.2x for other Chinese peers.
5. Higher ship prices — but will profits follow? What could go wrong?
• Prices are up — Clarksons newbuilding index +1.3% YTD (13 Nov 2026) — but so are costs: labour ~20% of total cost; engines 10%–20% of a vessel's price.
• Currency matters: every 1% renminbi gain vs the dollar cuts gross margin ~0.4–0.5ppts.
• Protection is real: Yangzijiang earned 10% net margin even in the last downcycle, and customers pay 50% before delivery.
• Watch: Runze approval, Hengli's Phase IV ramp after Spring Festival 2027, engine supply from 2028, container rates into 2027.
#Shipbuilding #Shipping #ChinaStocks #Tankers #Commodities
Source: Goldman Sachs Global Investment Research, 20 November 2026. Based solely on the report provided; forecasts are not guaranteed. For reference only; not investment advice.
Read the full breakdown on Unhidea: https://unhidea.com/en/articles/research-432428126b3f4851a52ef0ef87730858-en
Visit unhidea.com for more of the latest sell-side research interpretations.
$BS6.SI $603268.SS $BTC
GOLDMAN SACHS GLOBAL INVESTMENT RESEARCH | HERBERT LU, SIMON CHEUNG, WING HUANG • 20 November 2026
1. Why are China's shipyards booked out to 2029–2030?
• At the leading yards Goldman Sachs visited, order books cover slots through 2029, even 2030 — engine order books too.
• New yards need approvals requiring capacity replacement, and the authorities are more conservative than before the 2007 cycle.
• So new orders reflect available capacity, not real demand — and tight engine supply may slow new orders industry-wide.
• The edge goes to yards with reliable supply chains: Hengli makes its own marine engines and power generators.
2. How long does the demand last — and which ship types lead?
• Executives expect demand robust through 2032–2035; Goldman Sachs sees the upcycle lasting at least through 2032 — Yangzijiang's chairman calls it the strongest in his 50-year career.
• Tankers lead: COSCO Shipping Energy and CMES see VLCC rates higher in 2027 than the 2026 average and pre-war levels; owners still seek end-2029 slots.
• Containers are split: freight rates face pressure in 2027, but lines keep ordering mega-vessels — momentum should continue through 2027.
3. What did Goldman Sachs find at Hengli — the yard doubling capacity?
• Hengli (via Songfa Ceramics, 603268.SS): capacity set to double, global share to 11% in 2027E; Phase IV dry docks ramp from January 2027 — earlier than Goldman's base case.
• Standardised production cuts dock time 20%–30%, releasing 58 extra delivery slots in 2027–28; management targets 130 / 250 deliveries in 2027 / 2028E.
• Pricing power shows: Hengli removed discounts — new VLCC orders at US$140mn vs a US$131mn market price.
• 3Q26 net profit Rmb3.1bn, +22% QoQ, net margin 21.5%; Songfa Buy, target CNY310.00 — 75% upside (18 Nov 2026 prices).
4. And at Yangzijiang — the other Buy-rated yard?
• Yangzijiang (YAZG.SI) won US$6.98bn of new orders in 10M26 — above its US$4.5bn FY26 target — and expects the same target for 2027.
• Margins hold: 2H26 gross margin seen near 1H26's 36%, with 2025–26 contracts priced like 2024 while peers discount 2%–3%.
• Capacity grows: Hongyuan adds 20% in 2027; restarted Runze — pending approval — could add ~30% more; large-vessel slots are largely full through 2030.
• Yangzijiang Buy, target S$6.00 — 38% upside (18 Nov 2026 prices). Both yards trade at single-digit 2028E P/E (5.6x / 6.5x) vs 9.2x for other Chinese peers.
5. Higher ship prices — but will profits follow? What could go wrong?
• Prices are up — Clarksons newbuilding index +1.3% YTD (13 Nov 2026) — but so are costs: labour ~20% of total cost; engines 10%–20% of a vessel's price.
• Currency matters: every 1% renminbi gain vs the dollar cuts gross margin ~0.4–0.5ppts.
• Protection is real: Yangzijiang earned 10% net margin even in the last downcycle, and customers pay 50% before delivery.
• Watch: Runze approval, Hengli's Phase IV ramp after Spring Festival 2027, engine supply from 2028, container rates into 2027.
#Shipbuilding #Shipping #ChinaStocks #Tankers #Commodities
Source: Goldman Sachs Global Investment Research, 20 November 2026. Based solely on the report provided; forecasts are not guaranteed. For reference only; not investment advice.
Read the full breakdown on Unhidea: https://unhidea.com/en/articles/research-432428126b3f4851a52ef0ef87730858-en
Visit unhidea.com for more of the latest sell-side research interpretations.
36
·
--
Article
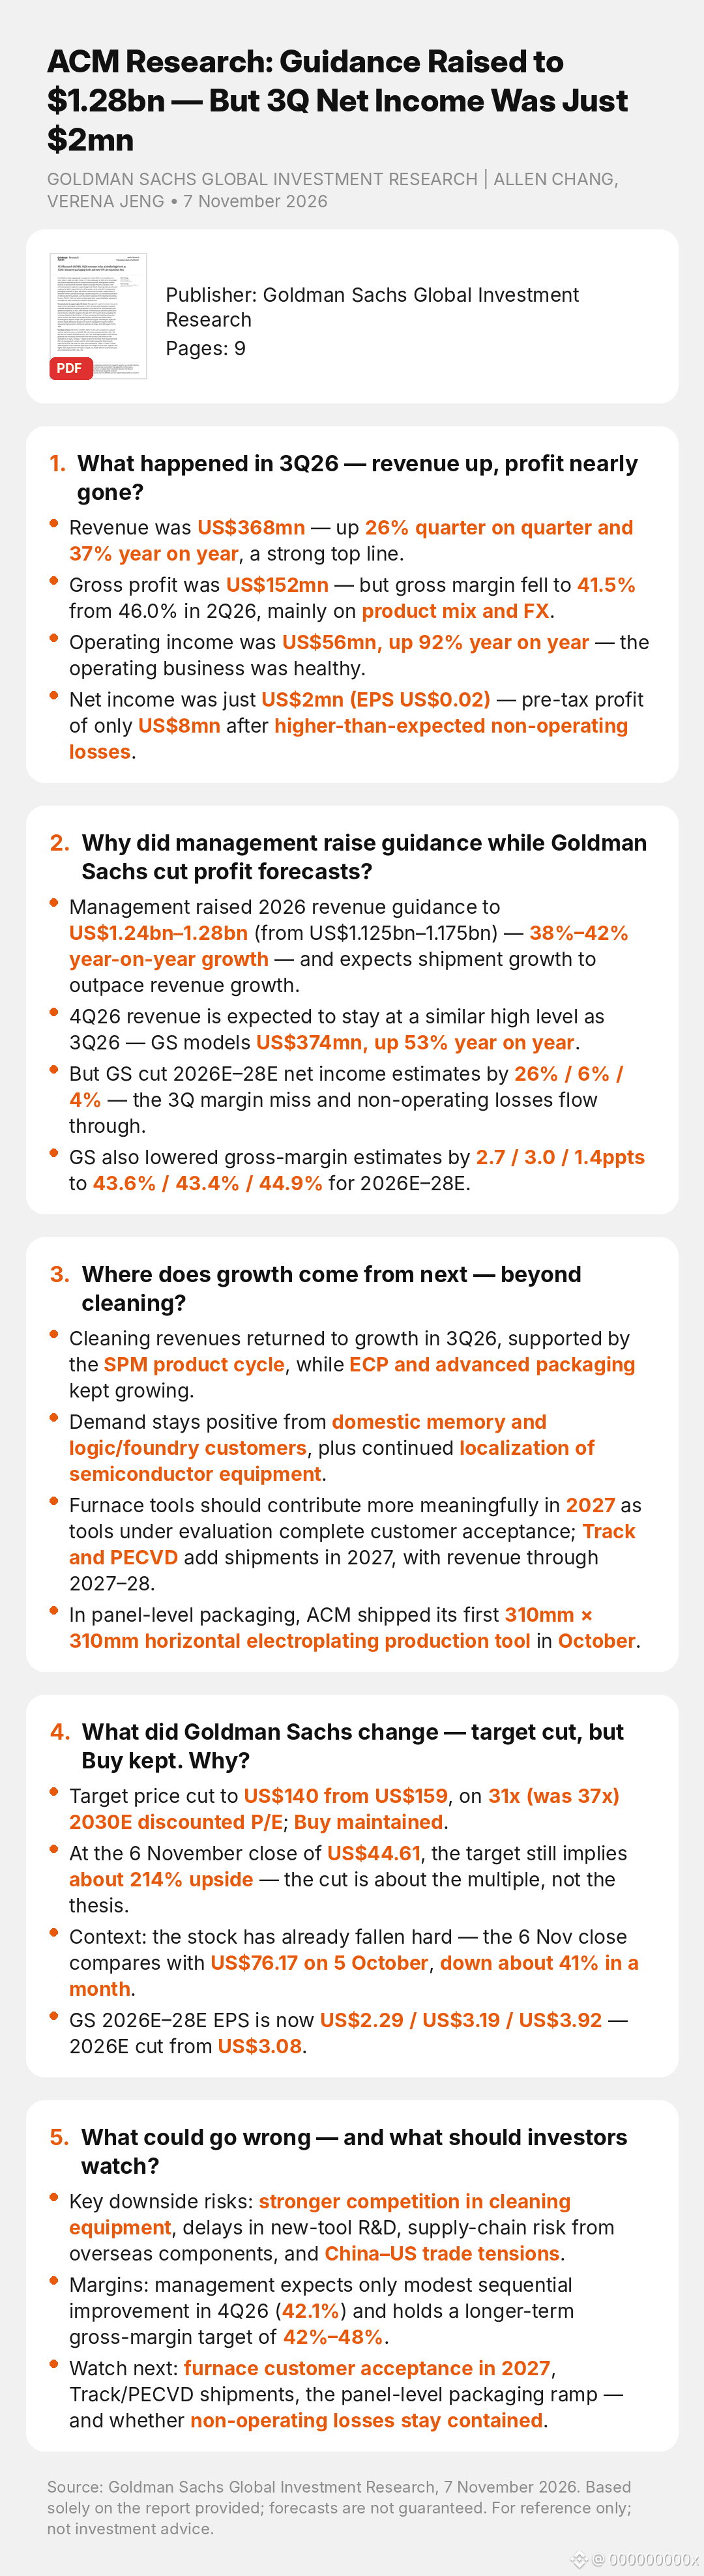
ACM Research: Guidance Raised to $1.28bn — But 3Q Net Income Was Just $2mnACM Research: Guidance Raised to $1.28bn — But 3Q Net Income Was Just $2mn
$ACMR
GOLDMAN SACHS GLOBAL INVESTMENT RESEARCH | ALLEN CHANG, VERENA JENG • 7 November 2026
1. What happened in 3Q26 — revenue up, profit nearly gone?
• Revenue was US$368mn — up 26% quarter on quarter and 37% year on year, a strong top line.
• Gross profit was US$152mn — but gross margin fell to 41.5% from 46.0% in 2Q26, mainly on product mix and FX.
• Operating income was US$56mn, up 92% year on year — the operating business was healthy.
• Net income was just US$2mn (EPS US$0.02) — pre-tax profit of only US$8mn after higher-than-expected non-operating losses.
2. Why did management raise guidance while Goldman Sachs cut profit forecasts?
• Management raised 2026 revenue guidance to US$1.24bn–1.28bn (from US$1.125bn–1.175bn) — 38%–42% year-on-year growth — and expects shipment growth to outpace revenue growth.
• 4Q26 revenue is expected to stay at a similar high level as 3Q26 — GS models US$374mn, up 53% year on year.
• But GS cut 2026E–28E net income estimates by 26% / 6% / 4% — the 3Q margin miss and non-operating losses flow through.
• GS also lowered gross-margin estimates by 2.7 / 3.0 / 1.4ppts to 43.6% / 43.4% / 44.9% for 2026E–28E.
3. Where does growth come from next — beyond cleaning?
• Cleaning revenues returned to growth in 3Q26, supported by the SPM product cycle, while ECP and advanced packaging kept growing.
• Demand stays positive from domestic memory and logic/foundry customers, plus continued localization of semiconductor equipment.
• Furnace tools should contribute more meaningfully in 2027 as tools under evaluation complete customer acceptance; Track and PECVD add shipments in 2027, with revenue through 2027–28.
• In panel-level packaging, ACM shipped its first 310mm × 310mm horizontal electroplating production tool in October.
4. What did Goldman Sachs change — target cut, but Buy kept. Why?
• Target price cut to US$140 from US$159, on 31x (was 37x) 2030E discounted P/E; Buy maintained.
• At the 6 November close of US$44.61, the target still implies about 214% upside — the cut is about the multiple, not the thesis.
• Context: the stock has already fallen hard — the 6 Nov close compares with US$76.17 on 5 October, down about 41% in a month.
• GS 2026E–28E EPS is now US$2.29 / US$3.19 / US$3.92 — 2026E cut from US$3.08.
5. What could go wrong — and what should investors watch?
• Key downside risks: stronger competition in cleaning equipment, delays in new-tool R&D, supply-chain risk from overseas components, and China–US trade tensions.
• Margins: management expects only modest sequential improvement in 4Q26 (42.1%) and holds a longer-term gross-margin target of 42%–48%.
• Watch next: furnace customer acceptance in 2027, Track/PECVD shipments, the panel-level packaging ramp — and whether non-operating losses stay contained.
Since the report (20 Nov): AI hardware sold off sharply — Nvidia -14%, Nasdaq -5.3% in a day — a reminder that the datacenter chain is not immune to valuation resets. (Market reports, 21 Nov 2026.)
#Semiconductors #AI #ChinaTech #ChipEquipment #AdvancedPackaging
Source: Goldman Sachs Global Investment Research, 7 November 2026. Based solely on the report provided; forecasts are not guaranteed. For reference only; not investment advice.
Read the full breakdown on Unhidea: https://unhidea.com/en/articles/research-b12f72e6b0e549dc8891c713b598a994-en
Visit unhidea.com for more of the latest sell-side research interpretations.
ACM Research: Guidance Raised to $1.28bn — But 3Q Net Income Was Just $2mn
ACM Research: Guidance Raised to $1.28bn — But 3Q Net Income Was Just $2mn
$ACMR
GOLDMAN SACHS GLOBAL INVESTMENT RESEARCH | ALLEN CHANG, VERENA JENG • 7 November 2026
1. What happened in 3Q26 — revenue up, profit nearly gone?
• Revenue was US$368mn — up 26% quarter on quarter and 37% year on year, a strong top line.
• Gross profit was US$152mn — but gross margin fell to 41.5% from 46.0% in 2Q26, mainly on product mix and FX.
• Operating income was US$56mn, up 92% year on year — the operating business was healthy.
• Net income was just US$2mn (EPS US$0.02) — pre-tax profit of only US$8mn after higher-than-expected non-operating losses.
2. Why did management raise guidance while Goldman Sachs cut profit forecasts?
• Management raised 2026 revenue guidance to US$1.24bn–1.28bn (from US$1.125bn–1.175bn) — 38%–42% year-on-year growth — and expects shipment growth to outpace revenue growth.
• 4Q26 revenue is expected to stay at a similar high level as 3Q26 — GS models US$374mn, up 53% year on year.
• But GS cut 2026E–28E net income estimates by 26% / 6% / 4% — the 3Q margin miss and non-operating losses flow through.
• GS also lowered gross-margin estimates by 2.7 / 3.0 / 1.4ppts to 43.6% / 43.4% / 44.9% for 2026E–28E.
3. Where does growth come from next — beyond cleaning?
• Cleaning revenues returned to growth in 3Q26, supported by the SPM product cycle, while ECP and advanced packaging kept growing.
• Demand stays positive from domestic memory and logic/foundry customers, plus continued localization of semiconductor equipment.
• Furnace tools should contribute more meaningfully in 2027 as tools under evaluation complete customer acceptance; Track and PECVD add shipments in 2027, with revenue through 2027–28.
• In panel-level packaging, ACM shipped its first 310mm × 310mm horizontal electroplating production tool in October.
4. What did Goldman Sachs change — target cut, but Buy kept. Why?
• Target price cut to US$140 from US$159, on 31x (was 37x) 2030E discounted P/E; Buy maintained.
• At the 6 November close of US$44.61, the target still implies about 214% upside — the cut is about the multiple, not the thesis.
• Context: the stock has already fallen hard — the 6 Nov close compares with US$76.17 on 5 October, down about 41% in a month.
• GS 2026E–28E EPS is now US$2.29 / US$3.19 / US$3.92 — 2026E cut from US$3.08.
5. What could go wrong — and what should investors watch?
• Key downside risks: stronger competition in cleaning equipment, delays in new-tool R&D, supply-chain risk from overseas components, and China–US trade tensions.
• Margins: management expects only modest sequential improvement in 4Q26 (42.1%) and holds a longer-term gross-margin target of 42%–48%.
• Watch next: furnace customer acceptance in 2027, Track/PECVD shipments, the panel-level packaging ramp — and whether non-operating losses stay contained.
Since the report (20 Nov): AI hardware sold off sharply — Nvidia -14%, Nasdaq -5.3% in a day — a reminder that the datacenter chain is not immune to valuation resets. (Market reports, 21 Nov 2026.)
#Semiconductors #AI #ChinaTech #ChipEquipment #AdvancedPackaging
Source: Goldman Sachs Global Investment Research, 7 November 2026. Based solely on the report provided; forecasts are not guaranteed. For reference only; not investment advice.
Read the full breakdown on Unhidea: https://unhidea.com/en/articles/research-b12f72e6b0e549dc8891c713b598a994-en
Visit unhidea.com for more of the latest sell-side research interpretations.
$ACMR
GOLDMAN SACHS GLOBAL INVESTMENT RESEARCH | ALLEN CHANG, VERENA JENG • 7 November 2026
1. What happened in 3Q26 — revenue up, profit nearly gone?
• Revenue was US$368mn — up 26% quarter on quarter and 37% year on year, a strong top line.
• Gross profit was US$152mn — but gross margin fell to 41.5% from 46.0% in 2Q26, mainly on product mix and FX.
• Operating income was US$56mn, up 92% year on year — the operating business was healthy.
• Net income was just US$2mn (EPS US$0.02) — pre-tax profit of only US$8mn after higher-than-expected non-operating losses.
2. Why did management raise guidance while Goldman Sachs cut profit forecasts?
• Management raised 2026 revenue guidance to US$1.24bn–1.28bn (from US$1.125bn–1.175bn) — 38%–42% year-on-year growth — and expects shipment growth to outpace revenue growth.
• 4Q26 revenue is expected to stay at a similar high level as 3Q26 — GS models US$374mn, up 53% year on year.
• But GS cut 2026E–28E net income estimates by 26% / 6% / 4% — the 3Q margin miss and non-operating losses flow through.
• GS also lowered gross-margin estimates by 2.7 / 3.0 / 1.4ppts to 43.6% / 43.4% / 44.9% for 2026E–28E.
3. Where does growth come from next — beyond cleaning?
• Cleaning revenues returned to growth in 3Q26, supported by the SPM product cycle, while ECP and advanced packaging kept growing.
• Demand stays positive from domestic memory and logic/foundry customers, plus continued localization of semiconductor equipment.
• Furnace tools should contribute more meaningfully in 2027 as tools under evaluation complete customer acceptance; Track and PECVD add shipments in 2027, with revenue through 2027–28.
• In panel-level packaging, ACM shipped its first 310mm × 310mm horizontal electroplating production tool in October.
4. What did Goldman Sachs change — target cut, but Buy kept. Why?
• Target price cut to US$140 from US$159, on 31x (was 37x) 2030E discounted P/E; Buy maintained.
• At the 6 November close of US$44.61, the target still implies about 214% upside — the cut is about the multiple, not the thesis.
• Context: the stock has already fallen hard — the 6 Nov close compares with US$76.17 on 5 October, down about 41% in a month.
• GS 2026E–28E EPS is now US$2.29 / US$3.19 / US$3.92 — 2026E cut from US$3.08.
5. What could go wrong — and what should investors watch?
• Key downside risks: stronger competition in cleaning equipment, delays in new-tool R&D, supply-chain risk from overseas components, and China–US trade tensions.
• Margins: management expects only modest sequential improvement in 4Q26 (42.1%) and holds a longer-term gross-margin target of 42%–48%.
• Watch next: furnace customer acceptance in 2027, Track/PECVD shipments, the panel-level packaging ramp — and whether non-operating losses stay contained.
Since the report (20 Nov): AI hardware sold off sharply — Nvidia -14%, Nasdaq -5.3% in a day — a reminder that the datacenter chain is not immune to valuation resets. (Market reports, 21 Nov 2026.)
#Semiconductors #AI #ChinaTech #ChipEquipment #AdvancedPackaging
Source: Goldman Sachs Global Investment Research, 7 November 2026. Based solely on the report provided; forecasts are not guaranteed. For reference only; not investment advice.
Read the full breakdown on Unhidea: https://unhidea.com/en/articles/research-b12f72e6b0e549dc8891c713b598a994-en
Visit unhidea.com for more of the latest sell-side research interpretations.
ACMRUS-11.54%
·
--
Article
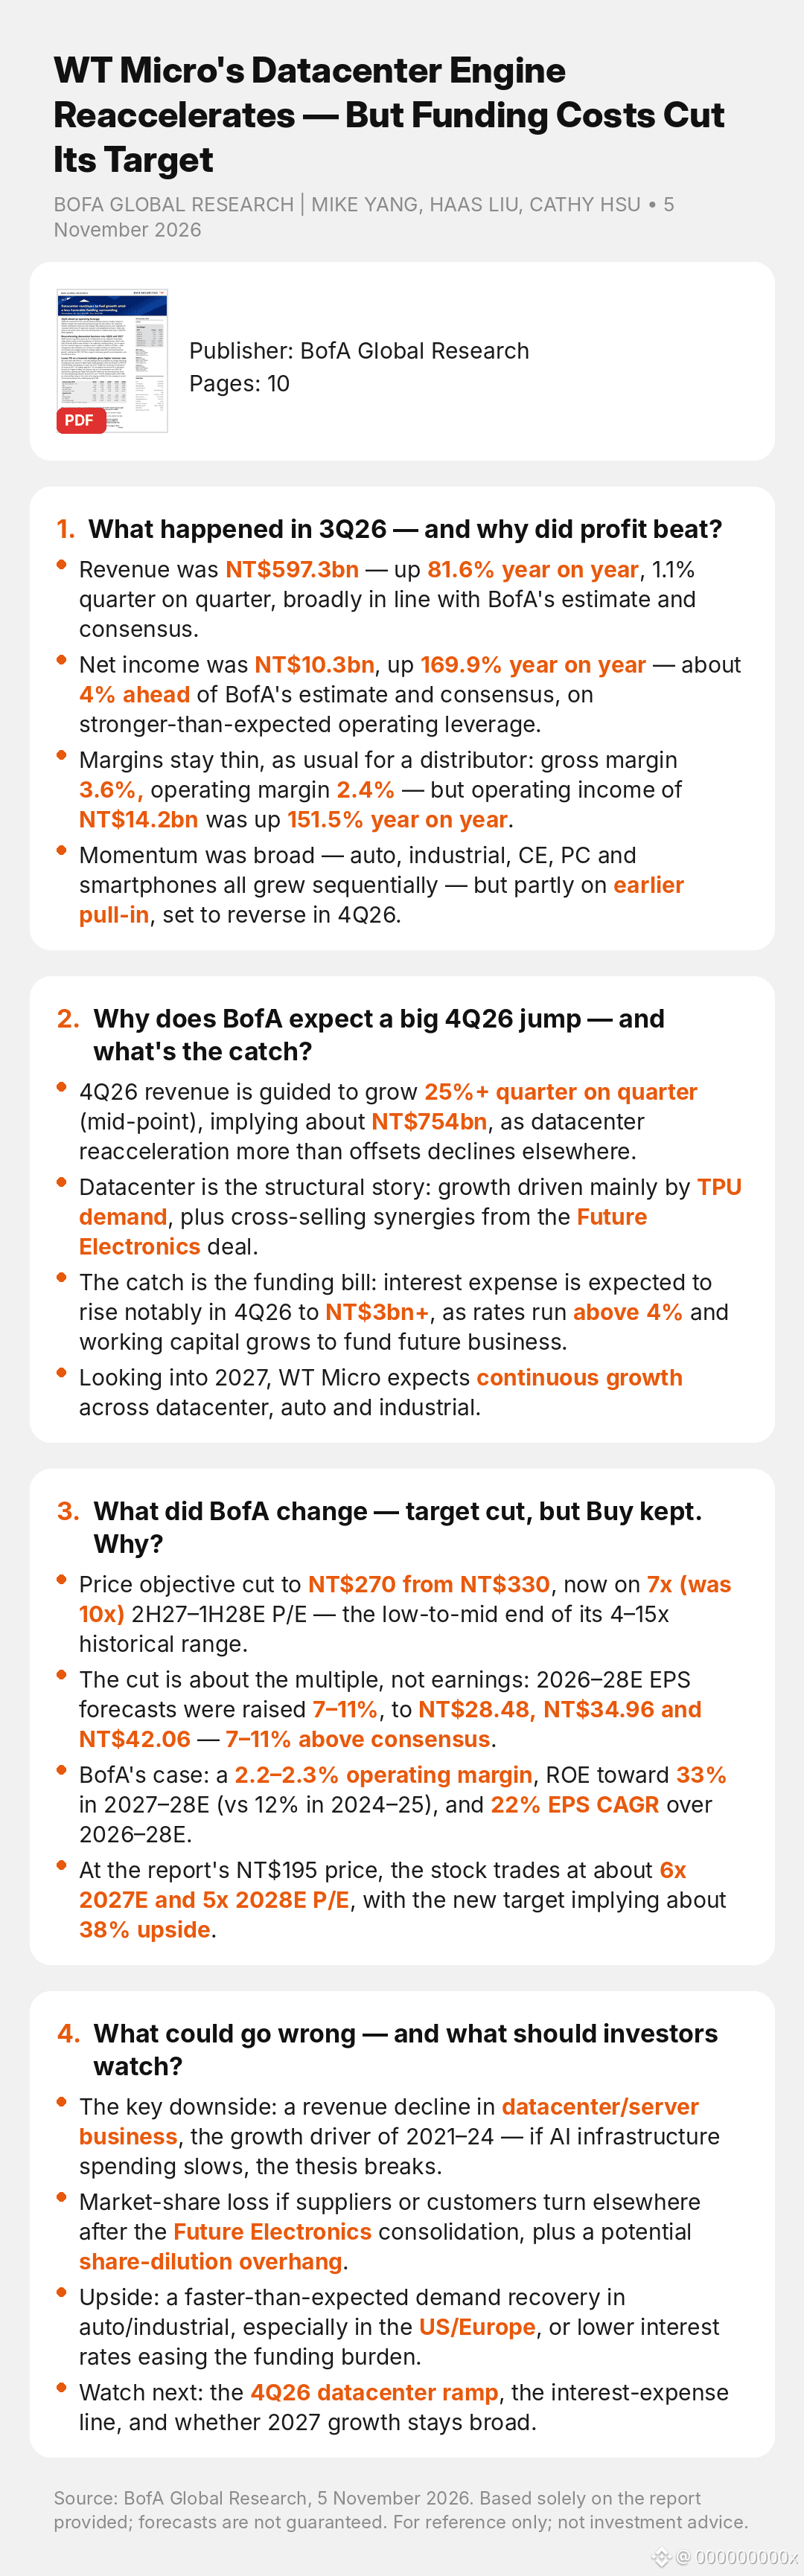
WT Micro's Datacenter Engine Reaccelerates — But Funding Costs Cut Its TargetWT Micro's Datacenter Engine Reaccelerates — But Funding Costs Cut Its Target
$3036.TW
BOFA GLOBAL RESEARCH | MIKE YANG, HAAS LIU, CATHY HSU • 5 November 2026
1. What happened in 3Q26 — and why did profit beat?
• Revenue was NT$597.3bn — up 81.6% year on year, 1.1% quarter on quarter, broadly in line with BofA's estimate and consensus.
• Net income was NT$10.3bn, up 169.9% year on year — about 4% ahead of BofA's estimate and consensus, on stronger-than-expected operating leverage.
• Margins stay thin, as usual for a distributor: gross margin 3.6%, operating margin 2.4% — but operating income of NT$14.2bn was up 151.5% year on year.
• Momentum was broad — auto, industrial, CE, PC and smartphones all grew sequentially — but partly on earlier pull-in, set to reverse in 4Q26.
2. Why does BofA expect a big 4Q26 jump — and what's the catch?
• 4Q26 revenue is guided to grow 25%+ quarter on quarter (mid-point), implying about NT$754bn, as datacenter reacceleration more than offsets declines elsewhere.
• Datacenter is the structural story: growth driven mainly by TPU demand, plus cross-selling synergies from the Future Electronics deal.
• The catch is the funding bill: interest expense is expected to rise notably in 4Q26 to NT$3bn+, as rates run above 4% and working capital grows to fund future business.
• Looking into 2027, WT Micro expects continuous growth across datacenter, auto and industrial.
3. What did BofA change — target cut, but Buy kept. Why?
• Price objective cut to NT$270 from NT$330, now on 7x (was 10x) 2H27–1H28E P/E — the low-to-mid end of its 4–15x historical range.
• The cut is about the multiple, not earnings: 2026–28E EPS forecasts were raised 7–11%, to NT$28.48, NT$34.96 and NT$42.06 — 7–11% above consensus.
• BofA's case: a 2.2–2.3% operating margin, ROE toward 33% in 2027–28E (vs 12% in 2024–25), and 22% EPS CAGR over 2026–28E.
• At the report's NT$195 price, the stock trades at about 6x 2027E and 5x 2028E P/E, with the new target implying about 38% upside.
4. What could go wrong — and what should investors watch?
• The key downside: a revenue decline in datacenter/server business, the growth driver of 2021–24 — if AI infrastructure spending slows, the thesis breaks.
• Market-share loss if suppliers or customers turn elsewhere after the Future Electronics consolidation, plus a potential share-dilution overhang.
• Upside: a faster-than-expected demand recovery in auto/industrial, especially in the US/Europe, or lower interest rates easing the funding burden.
• Watch next: the 4Q26 datacenter ramp, the interest-expense line, and whether 2027 growth stays broad.
Since the report (20 Nov): AI hardware sold off sharply — Nvidia -14%, Nasdaq -5.3% in a day — a reminder that the datacenter chain is not immune to valuation resets. (Market reports, 21 Nov 2026.)
#DataCenters #Semiconductors #AI #Taiwan #TPU
Source: BofA Global Research, 5 November 2026. Based solely on the report provided; forecasts are not guaranteed. For reference only; not investment advice.
Read the full breakdown on Unhidea: https://unhidea.com/en/articles/research-6567fd40fc4e4224941a1c18332915fc-en
Visit unhidea.com for more of the latest sell-side research interpretations.
WT Micro's Datacenter Engine Reaccelerates — But Funding Costs Cut Its Target
WT Micro's Datacenter Engine Reaccelerates — But Funding Costs Cut Its Target
$3036.TW
BOFA GLOBAL RESEARCH | MIKE YANG, HAAS LIU, CATHY HSU • 5 November 2026
1. What happened in 3Q26 — and why did profit beat?
• Revenue was NT$597.3bn — up 81.6% year on year, 1.1% quarter on quarter, broadly in line with BofA's estimate and consensus.
• Net income was NT$10.3bn, up 169.9% year on year — about 4% ahead of BofA's estimate and consensus, on stronger-than-expected operating leverage.
• Margins stay thin, as usual for a distributor: gross margin 3.6%, operating margin 2.4% — but operating income of NT$14.2bn was up 151.5% year on year.
• Momentum was broad — auto, industrial, CE, PC and smartphones all grew sequentially — but partly on earlier pull-in, set to reverse in 4Q26.
2. Why does BofA expect a big 4Q26 jump — and what's the catch?
• 4Q26 revenue is guided to grow 25%+ quarter on quarter (mid-point), implying about NT$754bn, as datacenter reacceleration more than offsets declines elsewhere.
• Datacenter is the structural story: growth driven mainly by TPU demand, plus cross-selling synergies from the Future Electronics deal.
• The catch is the funding bill: interest expense is expected to rise notably in 4Q26 to NT$3bn+, as rates run above 4% and working capital grows to fund future business.
• Looking into 2027, WT Micro expects continuous growth across datacenter, auto and industrial.
3. What did BofA change — target cut, but Buy kept. Why?
• Price objective cut to NT$270 from NT$330, now on 7x (was 10x) 2H27–1H28E P/E — the low-to-mid end of its 4–15x historical range.
• The cut is about the multiple, not earnings: 2026–28E EPS forecasts were raised 7–11%, to NT$28.48, NT$34.96 and NT$42.06 — 7–11% above consensus.
• BofA's case: a 2.2–2.3% operating margin, ROE toward 33% in 2027–28E (vs 12% in 2024–25), and 22% EPS CAGR over 2026–28E.
• At the report's NT$195 price, the stock trades at about 6x 2027E and 5x 2028E P/E, with the new target implying about 38% upside.
4. What could go wrong — and what should investors watch?
• The key downside: a revenue decline in datacenter/server business, the growth driver of 2021–24 — if AI infrastructure spending slows, the thesis breaks.
• Market-share loss if suppliers or customers turn elsewhere after the Future Electronics consolidation, plus a potential share-dilution overhang.
• Upside: a faster-than-expected demand recovery in auto/industrial, especially in the US/Europe, or lower interest rates easing the funding burden.
• Watch next: the 4Q26 datacenter ramp, the interest-expense line, and whether 2027 growth stays broad.
Since the report (20 Nov): AI hardware sold off sharply — Nvidia -14%, Nasdaq -5.3% in a day — a reminder that the datacenter chain is not immune to valuation resets. (Market reports, 21 Nov 2026.)
#DataCenters #Semiconductors #AI #Taiwan #TPU
Source: BofA Global Research, 5 November 2026. Based solely on the report provided; forecasts are not guaranteed. For reference only; not investment advice.
Read the full breakdown on Unhidea: https://unhidea.com/en/articles/research-6567fd40fc4e4224941a1c18332915fc-en
Visit unhidea.com for more of the latest sell-side research interpretations.
$3036.TW
BOFA GLOBAL RESEARCH | MIKE YANG, HAAS LIU, CATHY HSU • 5 November 2026
1. What happened in 3Q26 — and why did profit beat?
• Revenue was NT$597.3bn — up 81.6% year on year, 1.1% quarter on quarter, broadly in line with BofA's estimate and consensus.
• Net income was NT$10.3bn, up 169.9% year on year — about 4% ahead of BofA's estimate and consensus, on stronger-than-expected operating leverage.
• Margins stay thin, as usual for a distributor: gross margin 3.6%, operating margin 2.4% — but operating income of NT$14.2bn was up 151.5% year on year.
• Momentum was broad — auto, industrial, CE, PC and smartphones all grew sequentially — but partly on earlier pull-in, set to reverse in 4Q26.
2. Why does BofA expect a big 4Q26 jump — and what's the catch?
• 4Q26 revenue is guided to grow 25%+ quarter on quarter (mid-point), implying about NT$754bn, as datacenter reacceleration more than offsets declines elsewhere.
• Datacenter is the structural story: growth driven mainly by TPU demand, plus cross-selling synergies from the Future Electronics deal.
• The catch is the funding bill: interest expense is expected to rise notably in 4Q26 to NT$3bn+, as rates run above 4% and working capital grows to fund future business.
• Looking into 2027, WT Micro expects continuous growth across datacenter, auto and industrial.
3. What did BofA change — target cut, but Buy kept. Why?
• Price objective cut to NT$270 from NT$330, now on 7x (was 10x) 2H27–1H28E P/E — the low-to-mid end of its 4–15x historical range.
• The cut is about the multiple, not earnings: 2026–28E EPS forecasts were raised 7–11%, to NT$28.48, NT$34.96 and NT$42.06 — 7–11% above consensus.
• BofA's case: a 2.2–2.3% operating margin, ROE toward 33% in 2027–28E (vs 12% in 2024–25), and 22% EPS CAGR over 2026–28E.
• At the report's NT$195 price, the stock trades at about 6x 2027E and 5x 2028E P/E, with the new target implying about 38% upside.
4. What could go wrong — and what should investors watch?
• The key downside: a revenue decline in datacenter/server business, the growth driver of 2021–24 — if AI infrastructure spending slows, the thesis breaks.
• Market-share loss if suppliers or customers turn elsewhere after the Future Electronics consolidation, plus a potential share-dilution overhang.
• Upside: a faster-than-expected demand recovery in auto/industrial, especially in the US/Europe, or lower interest rates easing the funding burden.
• Watch next: the 4Q26 datacenter ramp, the interest-expense line, and whether 2027 growth stays broad.
Since the report (20 Nov): AI hardware sold off sharply — Nvidia -14%, Nasdaq -5.3% in a day — a reminder that the datacenter chain is not immune to valuation resets. (Market reports, 21 Nov 2026.)
#DataCenters #Semiconductors #AI #Taiwan #TPU
Source: BofA Global Research, 5 November 2026. Based solely on the report provided; forecasts are not guaranteed. For reference only; not investment advice.
Read the full breakdown on Unhidea: https://unhidea.com/en/articles/research-6567fd40fc4e4224941a1c18332915fc-en
Visit unhidea.com for more of the latest sell-side research interpretations.
46
·
--
Article
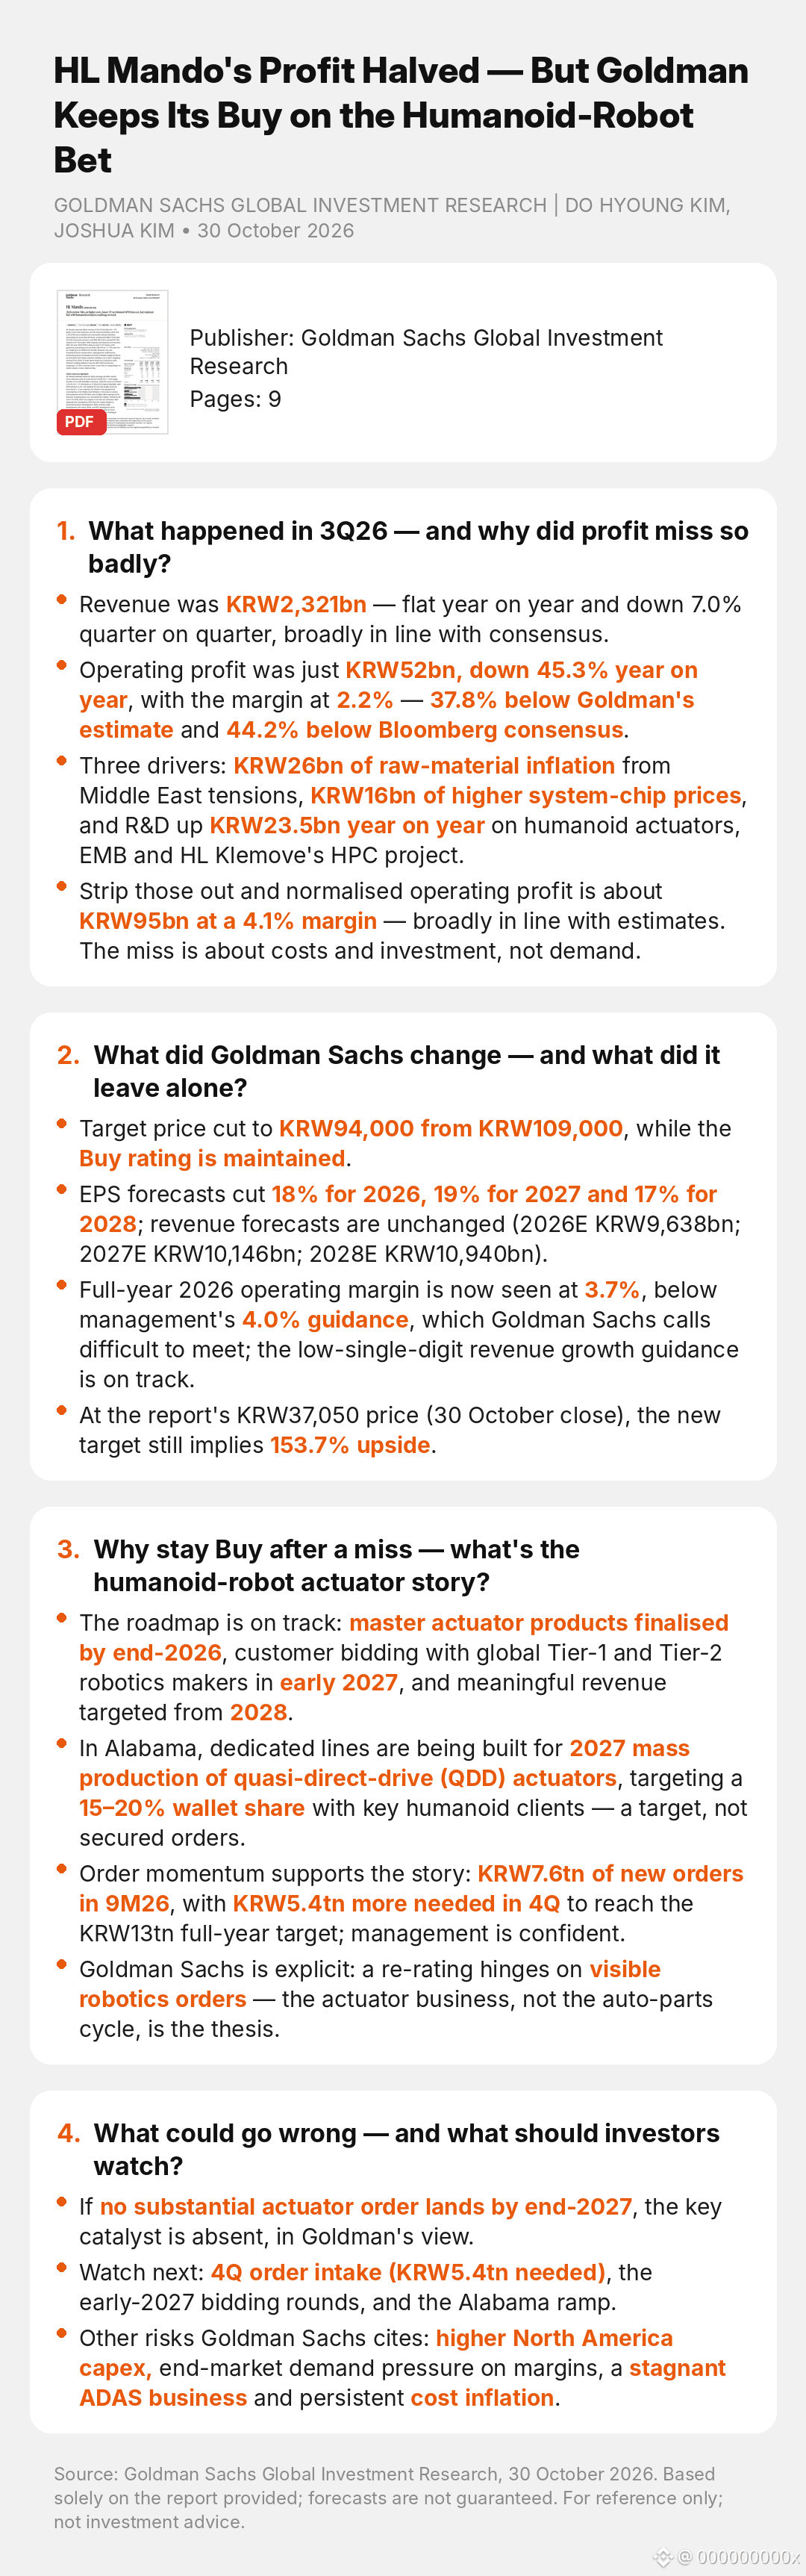
HL Mando's Profit Halved — But Goldman Keeps Its Buy on the Humanoid-Robot BetHL Mando's Profit Halved — But Goldman Keeps Its Buy on the Humanoid-Robot Bet
$204320.KS
GOLDMAN SACHS GLOBAL INVESTMENT RESEARCH | DO HYOUNG KIM, JOSHUA KIM • 30 October 2026
1. What happened in 3Q26 — and why did profit miss so badly?
• Revenue was KRW2,321bn — flat year on year and down 7.0% quarter on quarter, broadly in line with consensus.
• Operating profit was just KRW52bn, down 45.3% year on year, with the margin at 2.2% — 37.8% below Goldman's estimate and 44.2% below Bloomberg consensus.
• Three drivers: KRW26bn of raw-material inflation from Middle East tensions, KRW16bn of higher system-chip prices, and R&D up KRW23.5bn year on year on humanoid actuators, EMB and HL Klemove's HPC project.
• Strip those out and normalised operating profit is about KRW95bn at a 4.1% margin — broadly in line with estimates. The miss is about costs and investment, not demand.
2. What did Goldman Sachs change — and what did it leave alone?
• Target price cut to KRW94,000 from KRW109,000, while the Buy rating is maintained.
• EPS forecasts cut 18% for 2026, 19% for 2027 and 17% for 2028; revenue forecasts are unchanged (2026E KRW9,638bn; 2027E KRW10,146bn; 2028E KRW10,940bn).
• Full-year 2026 operating margin is now seen at 3.7%, below management's 4.0% guidance, which Goldman Sachs calls difficult to meet; the low-single-digit revenue growth guidance is on track.
• At the report's KRW37,050 price (30 October close), the new target still implies 153.7% upside.
3. Why stay Buy after a miss — what's the humanoid-robot actuator story?
• The roadmap is on track: master actuator products finalised by end-2026, customer bidding with global Tier-1 and Tier-2 robotics makers in early 2027, and meaningful revenue targeted from 2028.
• In Alabama, dedicated lines are being built for 2027 mass production of quasi-direct-drive (QDD) actuators, targeting a 15–20% wallet share with key humanoid clients — a target, not secured orders.
• Order momentum supports the story: KRW7.6tn of new orders in 9M26, with KRW5.4tn more needed in 4Q to reach the KRW13tn full-year target; management is confident.
• Goldman Sachs is explicit: a re-rating hinges on visible robotics orders — the actuator business, not the auto-parts cycle, is the thesis.
4. What could go wrong — and what should investors watch?
• If no substantial actuator order lands by end-2027, the key catalyst is absent, in Goldman's view.
• Watch next: 4Q order intake (KRW5.4tn needed), the early-2027 bidding rounds, and the Alabama ramp.
• Other risks Goldman Sachs cites: higher North America capex, end-market demand pressure on margins, a stagnant ADAS business and persistent cost inflation.
#HumanoidRobots #Robotics #AI #AutoParts #Korea
Source: Goldman Sachs Global Investment Research, 30 October 2026. Based solely on the report provided; forecasts are not guaranteed. For reference only; not investment advice.
Read the full breakdown on Unhidea: https://unhidea.com/en/articles/research-c3a686906990453489fcfb879a5a76fc-en
Visit unhidea.com for more of the latest sell-side research interpretations.
HL Mando's Profit Halved — But Goldman Keeps Its Buy on the Humanoid-Robot Bet
HL Mando's Profit Halved — But Goldman Keeps Its Buy on the Humanoid-Robot Bet
$204320.KS
GOLDMAN SACHS GLOBAL INVESTMENT RESEARCH | DO HYOUNG KIM, JOSHUA KIM • 30 October 2026
1. What happened in 3Q26 — and why did profit miss so badly?
• Revenue was KRW2,321bn — flat year on year and down 7.0% quarter on quarter, broadly in line with consensus.
• Operating profit was just KRW52bn, down 45.3% year on year, with the margin at 2.2% — 37.8% below Goldman's estimate and 44.2% below Bloomberg consensus.
• Three drivers: KRW26bn of raw-material inflation from Middle East tensions, KRW16bn of higher system-chip prices, and R&D up KRW23.5bn year on year on humanoid actuators, EMB and HL Klemove's HPC project.
• Strip those out and normalised operating profit is about KRW95bn at a 4.1% margin — broadly in line with estimates. The miss is about costs and investment, not demand.
2. What did Goldman Sachs change — and what did it leave alone?
• Target price cut to KRW94,000 from KRW109,000, while the Buy rating is maintained.
• EPS forecasts cut 18% for 2026, 19% for 2027 and 17% for 2028; revenue forecasts are unchanged (2026E KRW9,638bn; 2027E KRW10,146bn; 2028E KRW10,940bn).
• Full-year 2026 operating margin is now seen at 3.7%, below management's 4.0% guidance, which Goldman Sachs calls difficult to meet; the low-single-digit revenue growth guidance is on track.
• At the report's KRW37,050 price (30 October close), the new target still implies 153.7% upside.
3. Why stay Buy after a miss — what's the humanoid-robot actuator story?
• The roadmap is on track: master actuator products finalised by end-2026, customer bidding with global Tier-1 and Tier-2 robotics makers in early 2027, and meaningful revenue targeted from 2028.
• In Alabama, dedicated lines are being built for 2027 mass production of quasi-direct-drive (QDD) actuators, targeting a 15–20% wallet share with key humanoid clients — a target, not secured orders.
• Order momentum supports the story: KRW7.6tn of new orders in 9M26, with KRW5.4tn more needed in 4Q to reach the KRW13tn full-year target; management is confident.
• Goldman Sachs is explicit: a re-rating hinges on visible robotics orders — the actuator business, not the auto-parts cycle, is the thesis.
4. What could go wrong — and what should investors watch?
• If no substantial actuator order lands by end-2027, the key catalyst is absent, in Goldman's view.
• Watch next: 4Q order intake (KRW5.4tn needed), the early-2027 bidding rounds, and the Alabama ramp.
• Other risks Goldman Sachs cites: higher North America capex, end-market demand pressure on margins, a stagnant ADAS business and persistent cost inflation.
#HumanoidRobots #Robotics #AI #AutoParts #Korea
Source: Goldman Sachs Global Investment Research, 30 October 2026. Based solely on the report provided; forecasts are not guaranteed. For reference only; not investment advice.
Read the full breakdown on Unhidea: https://unhidea.com/en/articles/research-c3a686906990453489fcfb879a5a76fc-en
Visit unhidea.com for more of the latest sell-side research interpretations.
$204320.KS
GOLDMAN SACHS GLOBAL INVESTMENT RESEARCH | DO HYOUNG KIM, JOSHUA KIM • 30 October 2026
1. What happened in 3Q26 — and why did profit miss so badly?
• Revenue was KRW2,321bn — flat year on year and down 7.0% quarter on quarter, broadly in line with consensus.
• Operating profit was just KRW52bn, down 45.3% year on year, with the margin at 2.2% — 37.8% below Goldman's estimate and 44.2% below Bloomberg consensus.
• Three drivers: KRW26bn of raw-material inflation from Middle East tensions, KRW16bn of higher system-chip prices, and R&D up KRW23.5bn year on year on humanoid actuators, EMB and HL Klemove's HPC project.
• Strip those out and normalised operating profit is about KRW95bn at a 4.1% margin — broadly in line with estimates. The miss is about costs and investment, not demand.
2. What did Goldman Sachs change — and what did it leave alone?
• Target price cut to KRW94,000 from KRW109,000, while the Buy rating is maintained.
• EPS forecasts cut 18% for 2026, 19% for 2027 and 17% for 2028; revenue forecasts are unchanged (2026E KRW9,638bn; 2027E KRW10,146bn; 2028E KRW10,940bn).
• Full-year 2026 operating margin is now seen at 3.7%, below management's 4.0% guidance, which Goldman Sachs calls difficult to meet; the low-single-digit revenue growth guidance is on track.
• At the report's KRW37,050 price (30 October close), the new target still implies 153.7% upside.
3. Why stay Buy after a miss — what's the humanoid-robot actuator story?
• The roadmap is on track: master actuator products finalised by end-2026, customer bidding with global Tier-1 and Tier-2 robotics makers in early 2027, and meaningful revenue targeted from 2028.
• In Alabama, dedicated lines are being built for 2027 mass production of quasi-direct-drive (QDD) actuators, targeting a 15–20% wallet share with key humanoid clients — a target, not secured orders.
• Order momentum supports the story: KRW7.6tn of new orders in 9M26, with KRW5.4tn more needed in 4Q to reach the KRW13tn full-year target; management is confident.
• Goldman Sachs is explicit: a re-rating hinges on visible robotics orders — the actuator business, not the auto-parts cycle, is the thesis.
4. What could go wrong — and what should investors watch?
• If no substantial actuator order lands by end-2027, the key catalyst is absent, in Goldman's view.
• Watch next: 4Q order intake (KRW5.4tn needed), the early-2027 bidding rounds, and the Alabama ramp.
• Other risks Goldman Sachs cites: higher North America capex, end-market demand pressure on margins, a stagnant ADAS business and persistent cost inflation.
#HumanoidRobots #Robotics #AI #AutoParts #Korea
Source: Goldman Sachs Global Investment Research, 30 October 2026. Based solely on the report provided; forecasts are not guaranteed. For reference only; not investment advice.
Read the full breakdown on Unhidea: https://unhidea.com/en/articles/research-c3a686906990453489fcfb879a5a76fc-en
Visit unhidea.com for more of the latest sell-side research interpretations.
1
·
--
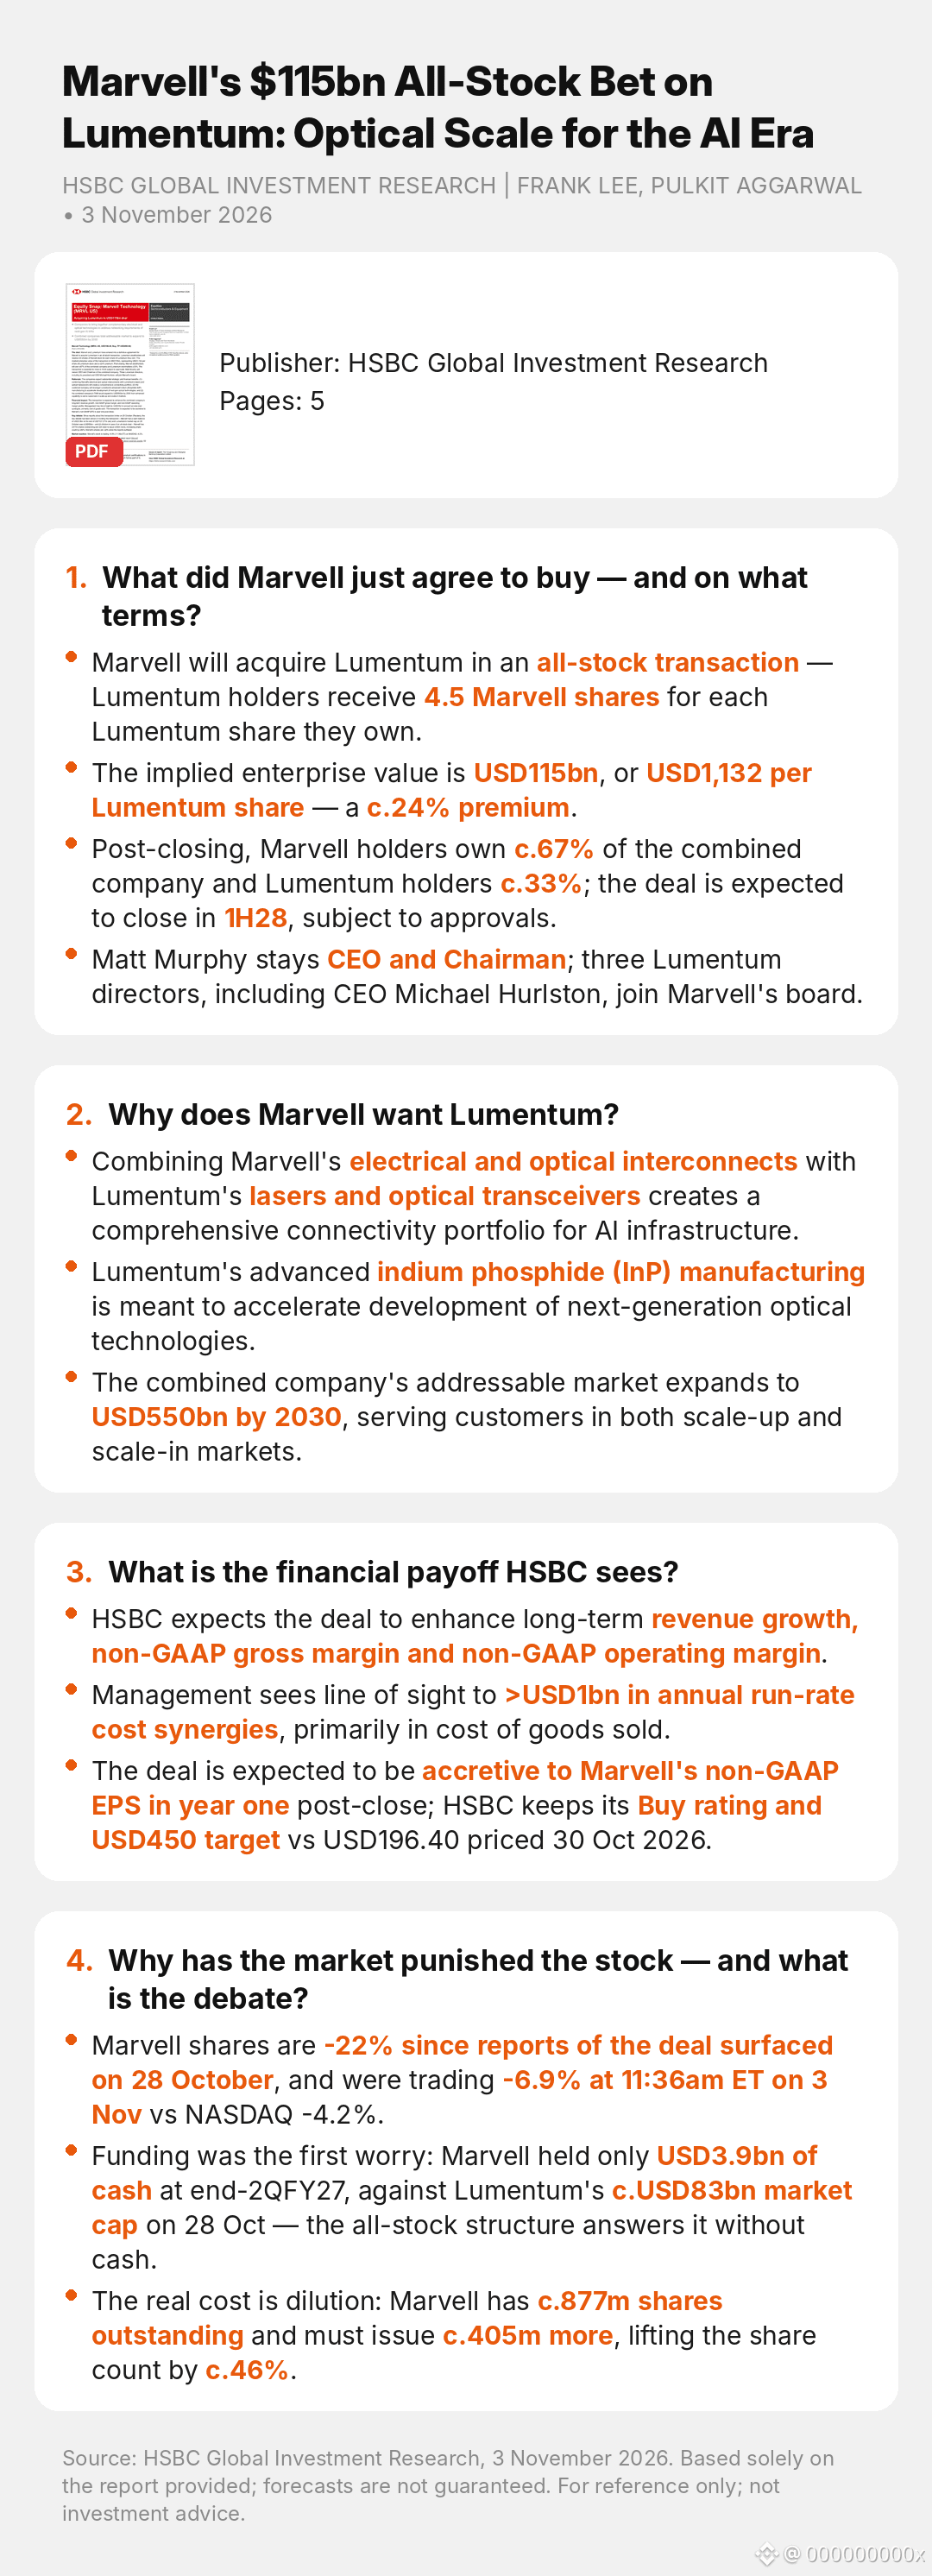
Article
Marvell's $115bn All-Stock Bet on Lumentum: Optical Scale for the AI EraMarvell's $115bn All-Stock Bet on Lumentum: Optical Scale for the AI Era
$MRVL $LITE
HSBC GLOBAL INVESTMENT RESEARCH | FRANK LEE, PULKIT AGGARWAL • 3 November 2026
1. What did Marvell just agree to buy — and on what terms?
• Marvell will acquire Lumentum in an all-stock transaction — Lumentum holders receive 4.5 Marvell shares for each Lumentum share they own.
• The implied enterprise value is USD115bn, or USD1,132 per Lumentum share — a c.24% premium.
• Post-closing, Marvell holders own c.67% of the combined company and Lumentum holders c.33%; the deal is expected to close in 1H28, subject to approvals.
• Matt Murphy stays CEO and Chairman; three Lumentum directors, including CEO Michael Hurlston, join Marvell's board.
2. Why does Marvell want Lumentum?
• Combining Marvell's electrical and optical interconnects with Lumentum's lasers and optical transceivers creates a comprehensive connectivity portfolio for AI infrastructure.
• Lumentum's advanced indium phosphide (InP) manufacturing is meant to accelerate development of next-generation optical technologies.
• The combined company's addressable market expands to USD550bn by 2030, serving customers in both scale-up and scale-in markets.
3. What is the financial payoff HSBC sees?
• HSBC expects the deal to enhance long-term revenue growth, non-GAAP gross margin and non-GAAP operating margin.
• Management sees line of sight to >USD1bn in annual run-rate cost synergies, primarily in cost of goods sold.
• The deal is expected to be accretive to Marvell's non-GAAP EPS in year one post-close; HSBC keeps its Buy rating and USD450 target vs USD196.40 priced 30 Oct 2026.
4. Why has the market punished the stock — and what is the debate?
• Marvell shares are -22% since reports of the deal surfaced on 28 October, and were trading -6.9% at 11:36am ET on 3 Nov vs NASDAQ -4.2%.
• Funding was the first worry: Marvell held only USD3.9bn of cash at end-2QFY27, against Lumentum's c.USD83bn market cap on 28 Oct — the all-stock structure answers it without cash.
• The real cost is dilution: Marvell has c.877m shares outstanding and must issue c.405m more, lifting the share count by c.46%.
#Semiconductors #AI #OpticalNetworking #MandA #DataCenters
Source: HSBC Global Investment Research, 3 November 2026. Based solely on the report provided; forecasts are not guaranteed. For reference only; not investment advice.
Read the full breakdown on Unhidea: https://unhidea.com/en/articles/research-977f6482c925423184db71de8f5bd293-en
Visit unhidea.com for more of the latest sell-side research interpretations.
Marvell's $115bn All-Stock Bet on Lumentum: Optical Scale for the AI Era
Marvell's $115bn All-Stock Bet on Lumentum: Optical Scale for the AI Era
$MRVL $LITE
HSBC GLOBAL INVESTMENT RESEARCH | FRANK LEE, PULKIT AGGARWAL • 3 November 2026
1. What did Marvell just agree to buy — and on what terms?
• Marvell will acquire Lumentum in an all-stock transaction — Lumentum holders receive 4.5 Marvell shares for each Lumentum share they own.
• The implied enterprise value is USD115bn, or USD1,132 per Lumentum share — a c.24% premium.
• Post-closing, Marvell holders own c.67% of the combined company and Lumentum holders c.33%; the deal is expected to close in 1H28, subject to approvals.
• Matt Murphy stays CEO and Chairman; three Lumentum directors, including CEO Michael Hurlston, join Marvell's board.
2. Why does Marvell want Lumentum?
• Combining Marvell's electrical and optical interconnects with Lumentum's lasers and optical transceivers creates a comprehensive connectivity portfolio for AI infrastructure.
• Lumentum's advanced indium phosphide (InP) manufacturing is meant to accelerate development of next-generation optical technologies.
• The combined company's addressable market expands to USD550bn by 2030, serving customers in both scale-up and scale-in markets.
3. What is the financial payoff HSBC sees?
• HSBC expects the deal to enhance long-term revenue growth, non-GAAP gross margin and non-GAAP operating margin.
• Management sees line of sight to >USD1bn in annual run-rate cost synergies, primarily in cost of goods sold.
• The deal is expected to be accretive to Marvell's non-GAAP EPS in year one post-close; HSBC keeps its Buy rating and USD450 target vs USD196.40 priced 30 Oct 2026.
4. Why has the market punished the stock — and what is the debate?
• Marvell shares are -22% since reports of the deal surfaced on 28 October, and were trading -6.9% at 11:36am ET on 3 Nov vs NASDAQ -4.2%.
• Funding was the first worry: Marvell held only USD3.9bn of cash at end-2QFY27, against Lumentum's c.USD83bn market cap on 28 Oct — the all-stock structure answers it without cash.
• The real cost is dilution: Marvell has c.877m shares outstanding and must issue c.405m more, lifting the share count by c.46%.
#Semiconductors #AI #OpticalNetworking #MandA #DataCenters
Source: HSBC Global Investment Research, 3 November 2026. Based solely on the report provided; forecasts are not guaranteed. For reference only; not investment advice.
Read the full breakdown on Unhidea: https://unhidea.com/en/articles/research-977f6482c925423184db71de8f5bd293-en
Visit unhidea.com for more of the latest sell-side research interpretations.
$MRVL $LITE
HSBC GLOBAL INVESTMENT RESEARCH | FRANK LEE, PULKIT AGGARWAL • 3 November 2026
1. What did Marvell just agree to buy — and on what terms?
• Marvell will acquire Lumentum in an all-stock transaction — Lumentum holders receive 4.5 Marvell shares for each Lumentum share they own.
• The implied enterprise value is USD115bn, or USD1,132 per Lumentum share — a c.24% premium.
• Post-closing, Marvell holders own c.67% of the combined company and Lumentum holders c.33%; the deal is expected to close in 1H28, subject to approvals.
• Matt Murphy stays CEO and Chairman; three Lumentum directors, including CEO Michael Hurlston, join Marvell's board.
2. Why does Marvell want Lumentum?
• Combining Marvell's electrical and optical interconnects with Lumentum's lasers and optical transceivers creates a comprehensive connectivity portfolio for AI infrastructure.
• Lumentum's advanced indium phosphide (InP) manufacturing is meant to accelerate development of next-generation optical technologies.
• The combined company's addressable market expands to USD550bn by 2030, serving customers in both scale-up and scale-in markets.
3. What is the financial payoff HSBC sees?
• HSBC expects the deal to enhance long-term revenue growth, non-GAAP gross margin and non-GAAP operating margin.
• Management sees line of sight to >USD1bn in annual run-rate cost synergies, primarily in cost of goods sold.
• The deal is expected to be accretive to Marvell's non-GAAP EPS in year one post-close; HSBC keeps its Buy rating and USD450 target vs USD196.40 priced 30 Oct 2026.
4. Why has the market punished the stock — and what is the debate?
• Marvell shares are -22% since reports of the deal surfaced on 28 October, and were trading -6.9% at 11:36am ET on 3 Nov vs NASDAQ -4.2%.
• Funding was the first worry: Marvell held only USD3.9bn of cash at end-2QFY27, against Lumentum's c.USD83bn market cap on 28 Oct — the all-stock structure answers it without cash.
• The real cost is dilution: Marvell has c.877m shares outstanding and must issue c.405m more, lifting the share count by c.46%.
#Semiconductors #AI #OpticalNetworking #MandA #DataCenters
Source: HSBC Global Investment Research, 3 November 2026. Based solely on the report provided; forecasts are not guaranteed. For reference only; not investment advice.
Read the full breakdown on Unhidea: https://unhidea.com/en/articles/research-977f6482c925423184db71de8f5bd293-en
Visit unhidea.com for more of the latest sell-side research interpretations.
45
·
--
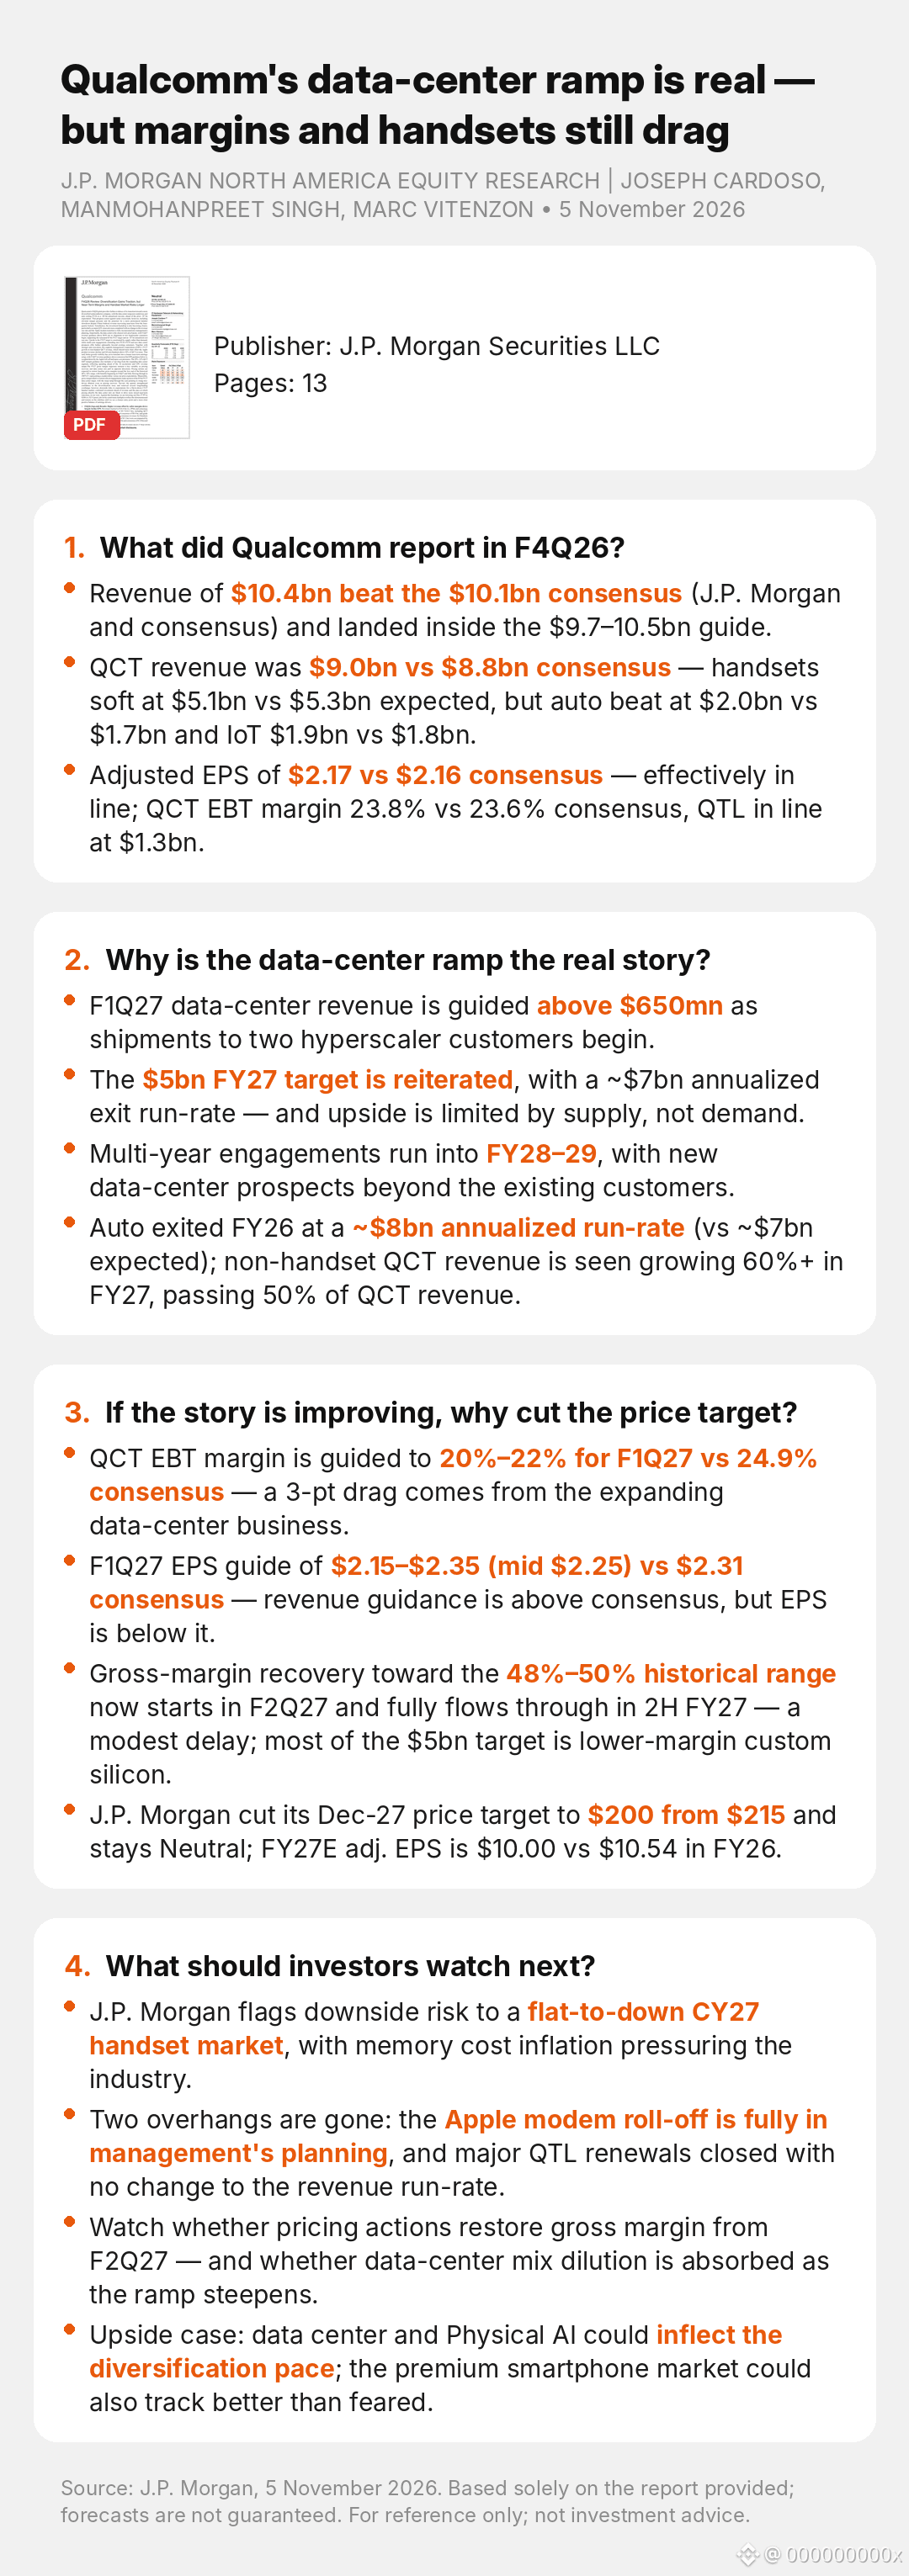
Article
Qualcomm's data-center ramp is real — but margins and handsets still dragQualcomm's data-center ramp is real — but margins and handsets still drag
$QCOM
J.P. MORGAN NORTH AMERICA EQUITY RESEARCH | JOSEPH CARDOSO, MANMOHANPREET SINGH, MARC VITENZON • 5 November 2026
1. What did Qualcomm report in F4Q26?
• Revenue of $10.4bn beat the $10.1bn consensus (J.P. Morgan and consensus) and landed inside the $9.7–10.5bn guide.
• QCT revenue was $9.0bn vs $8.8bn consensus — handsets soft at $5.1bn vs $5.3bn expected, but auto beat at $2.0bn vs $1.7bn and IoT $1.9bn vs $1.8bn.
• Adjusted EPS of $2.17 vs $2.16 consensus — effectively in line; QCT EBT margin 23.8% vs 23.6% consensus, QTL in line at $1.3bn.
2. Why is the data-center ramp the real story?
• F1Q27 data-center revenue is guided above $650mn as shipments to two hyperscaler customers begin.
• The $5bn FY27 target is reiterated, with a ~$7bn annualized exit run-rate — and upside is limited by supply, not demand.
• Multi-year engagements run into FY28–29, with new data-center prospects beyond the existing customers.
• Auto exited FY26 at a ~$8bn annualized run-rate (vs ~$7bn expected); non-handset QCT revenue is seen growing 60%+ in FY27, passing 50% of QCT revenue.
3. If the story is improving, why cut the price target?
• QCT EBT margin is guided to 20%–22% for F1Q27 vs 24.9% consensus — a 3-pt drag comes from the expanding data-center business.
• F1Q27 EPS guide of $2.15–$2.35 (mid $2.25) vs $2.31 consensus — revenue guidance is above consensus, but EPS is below it.
• Gross-margin recovery toward the 48%–50% historical range now starts in F2Q27 and fully flows through in 2H FY27 — a modest delay; most of the $5bn target is lower-margin custom silicon.
• J.P. Morgan cut its Dec-27 price target to $200 from $215 and stays Neutral; FY27E adj. EPS is $10.00 vs $10.54 in FY26.
4. What should investors watch next?
• J.P. Morgan flags downside risk to a flat-to-down CY27 handset market, with memory cost inflation pressuring the industry.
• Two overhangs are gone: the Apple modem roll-off is fully in management's planning, and major QTL renewals closed with no change to the revenue run-rate.
• Watch whether pricing actions restore gross margin from F2Q27 — and whether data-center mix dilution is absorbed as the ramp steepens.
• Upside case: data center and Physical AI could inflect the diversification pace; the premium smartphone market could also track better than feared.
#Qualcomm #Semiconductors #AI #DataCenter #Smartphones
Source: J.P. Morgan, 5 November 2026. Research summary for reference only; forecasts are not guaranteed. Not investment advice.
Read the full breakdown on Unhidea: https://unhidea.com/en/articles/research-3b12e316dbb84f2c9de3299332384e53-en
Visit unhidea.com for more of the latest sell-side research interpretations.
Qualcomm's data-center ramp is real — but margins and handsets still drag
Qualcomm's data-center ramp is real — but margins and handsets still drag
$QCOM
J.P. MORGAN NORTH AMERICA EQUITY RESEARCH | JOSEPH CARDOSO, MANMOHANPREET SINGH, MARC VITENZON • 5 November 2026
1. What did Qualcomm report in F4Q26?
• Revenue of $10.4bn beat the $10.1bn consensus (J.P. Morgan and consensus) and landed inside the $9.7–10.5bn guide.
• QCT revenue was $9.0bn vs $8.8bn consensus — handsets soft at $5.1bn vs $5.3bn expected, but auto beat at $2.0bn vs $1.7bn and IoT $1.9bn vs $1.8bn.
• Adjusted EPS of $2.17 vs $2.16 consensus — effectively in line; QCT EBT margin 23.8% vs 23.6% consensus, QTL in line at $1.3bn.
2. Why is the data-center ramp the real story?
• F1Q27 data-center revenue is guided above $650mn as shipments to two hyperscaler customers begin.
• The $5bn FY27 target is reiterated, with a ~$7bn annualized exit run-rate — and upside is limited by supply, not demand.
• Multi-year engagements run into FY28–29, with new data-center prospects beyond the existing customers.
• Auto exited FY26 at a ~$8bn annualized run-rate (vs ~$7bn expected); non-handset QCT revenue is seen growing 60%+ in FY27, passing 50% of QCT revenue.
3. If the story is improving, why cut the price target?
• QCT EBT margin is guided to 20%–22% for F1Q27 vs 24.9% consensus — a 3-pt drag comes from the expanding data-center business.
• F1Q27 EPS guide of $2.15–$2.35 (mid $2.25) vs $2.31 consensus — revenue guidance is above consensus, but EPS is below it.
• Gross-margin recovery toward the 48%–50% historical range now starts in F2Q27 and fully flows through in 2H FY27 — a modest delay; most of the $5bn target is lower-margin custom silicon.
• J.P. Morgan cut its Dec-27 price target to $200 from $215 and stays Neutral; FY27E adj. EPS is $10.00 vs $10.54 in FY26.
4. What should investors watch next?
• J.P. Morgan flags downside risk to a flat-to-down CY27 handset market, with memory cost inflation pressuring the industry.
• Two overhangs are gone: the Apple modem roll-off is fully in management's planning, and major QTL renewals closed with no change to the revenue run-rate.
• Watch whether pricing actions restore gross margin from F2Q27 — and whether data-center mix dilution is absorbed as the ramp steepens.
• Upside case: data center and Physical AI could inflect the diversification pace; the premium smartphone market could also track better than feared.
#Qualcomm #Semiconductors #AI #DataCenter #Smartphones
Source: J.P. Morgan, 5 November 2026. Research summary for reference only; forecasts are not guaranteed. Not investment advice.
Read the full breakdown on Unhidea: https://unhidea.com/en/articles/research-3b12e316dbb84f2c9de3299332384e53-en
Visit unhidea.com for more of the latest sell-side research interpretations.
$QCOM
J.P. MORGAN NORTH AMERICA EQUITY RESEARCH | JOSEPH CARDOSO, MANMOHANPREET SINGH, MARC VITENZON • 5 November 2026
1. What did Qualcomm report in F4Q26?
• Revenue of $10.4bn beat the $10.1bn consensus (J.P. Morgan and consensus) and landed inside the $9.7–10.5bn guide.
• QCT revenue was $9.0bn vs $8.8bn consensus — handsets soft at $5.1bn vs $5.3bn expected, but auto beat at $2.0bn vs $1.7bn and IoT $1.9bn vs $1.8bn.
• Adjusted EPS of $2.17 vs $2.16 consensus — effectively in line; QCT EBT margin 23.8% vs 23.6% consensus, QTL in line at $1.3bn.
2. Why is the data-center ramp the real story?
• F1Q27 data-center revenue is guided above $650mn as shipments to two hyperscaler customers begin.
• The $5bn FY27 target is reiterated, with a ~$7bn annualized exit run-rate — and upside is limited by supply, not demand.
• Multi-year engagements run into FY28–29, with new data-center prospects beyond the existing customers.
• Auto exited FY26 at a ~$8bn annualized run-rate (vs ~$7bn expected); non-handset QCT revenue is seen growing 60%+ in FY27, passing 50% of QCT revenue.
3. If the story is improving, why cut the price target?
• QCT EBT margin is guided to 20%–22% for F1Q27 vs 24.9% consensus — a 3-pt drag comes from the expanding data-center business.
• F1Q27 EPS guide of $2.15–$2.35 (mid $2.25) vs $2.31 consensus — revenue guidance is above consensus, but EPS is below it.
• Gross-margin recovery toward the 48%–50% historical range now starts in F2Q27 and fully flows through in 2H FY27 — a modest delay; most of the $5bn target is lower-margin custom silicon.
• J.P. Morgan cut its Dec-27 price target to $200 from $215 and stays Neutral; FY27E adj. EPS is $10.00 vs $10.54 in FY26.
4. What should investors watch next?
• J.P. Morgan flags downside risk to a flat-to-down CY27 handset market, with memory cost inflation pressuring the industry.
• Two overhangs are gone: the Apple modem roll-off is fully in management's planning, and major QTL renewals closed with no change to the revenue run-rate.
• Watch whether pricing actions restore gross margin from F2Q27 — and whether data-center mix dilution is absorbed as the ramp steepens.
• Upside case: data center and Physical AI could inflect the diversification pace; the premium smartphone market could also track better than feared.
#Qualcomm #Semiconductors #AI #DataCenter #Smartphones
Source: J.P. Morgan, 5 November 2026. Research summary for reference only; forecasts are not guaranteed. Not investment advice.
Read the full breakdown on Unhidea: https://unhidea.com/en/articles/research-3b12e316dbb84f2c9de3299332384e53-en
Visit unhidea.com for more of the latest sell-side research interpretations.
5
·
--
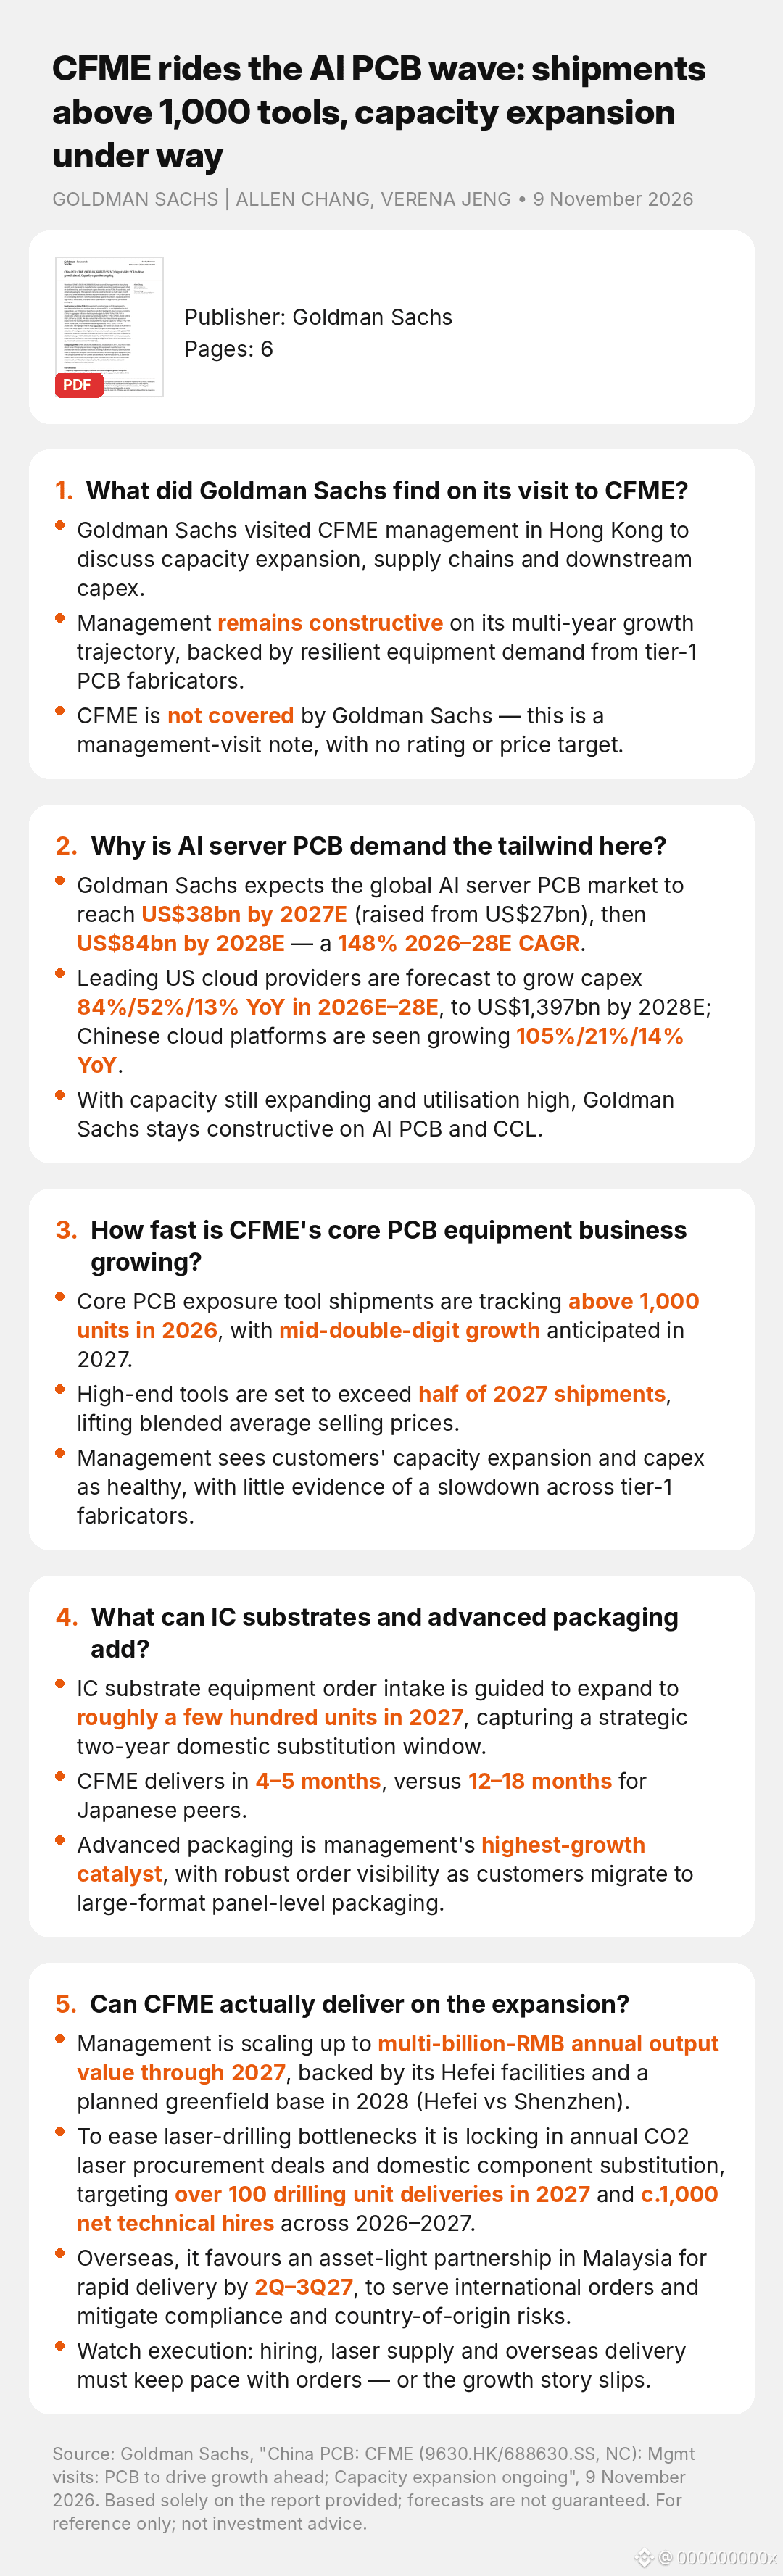
Article
CFME rides the AI PCB wave: shipments above 1,000 tools, capacity expansion under wayCFME rides the AI PCB wave: shipments above 1,000 tools, capacity expansion under way
$9630.HK
GOLDMAN SACHS | ALLEN CHANG, VERENA JENG • 9 November 2026
1. What did Goldman Sachs find on its visit to CFME?
• Goldman Sachs visited CFME management in Hong Kong to discuss capacity expansion, supply chains and downstream capex.
• Management remains constructive on its multi-year growth trajectory, backed by resilient equipment demand from tier-1 PCB fabricators.
• CFME is not covered by Goldman Sachs — this is a management-visit note, with no rating or price target.
2. Why is AI server PCB demand the tailwind here?
• Goldman Sachs expects the global AI server PCB market to reach US$38bn by 2027E (raised from US$27bn), then US$84bn by 2028E — a 148% 2026–28E CAGR.
• Leading US cloud providers are forecast to grow capex 84%/52%/13% YoY in 2026E–28E, to US$1,397bn by 2028E; Chinese cloud platforms are seen growing 105%/21%/14% YoY.
• With capacity still expanding and utilisation high, Goldman Sachs stays constructive on AI PCB and CCL.
3. How fast is CFME's core PCB equipment business growing?
• Core PCB exposure tool shipments are tracking above 1,000 units in 2026, with mid-double-digit growth anticipated in 2027.
• High-end tools are set to exceed half of 2027 shipments, lifting blended average selling prices.
• Management sees customers' capacity expansion and capex as healthy, with little evidence of a slowdown across tier-1 fabricators.
4. What can IC substrates and advanced packaging add?
• IC substrate equipment order intake is guided to expand to roughly a few hundred units in 2027, capturing a strategic two-year domestic substitution window.
• CFME delivers in 4–5 months, versus 12–18 months for Japanese peers.
• Advanced packaging is management's highest-growth catalyst, with robust order visibility as customers migrate to large-format panel-level packaging.
5. Can CFME actually deliver on the expansion?
• Management is scaling up to multi-billion-RMB annual output value through 2027, backed by its Hefei facilities and a planned greenfield base in 2028 (Hefei vs Shenzhen).
• To ease laser-drilling bottlenecks it is locking in annual CO2 laser procurement deals and domestic component substitution, targeting over 100 drilling unit deliveries in 2027 and c.1,000 net technical hires across 2026–2027.
• Overseas, it favours an asset-light partnership in Malaysia for rapid delivery by 2Q–3Q27, to serve international orders and mitigate compliance and country-of-origin risks.
• Watch execution: hiring, laser supply and overseas delivery must keep pace with orders — or the growth story slips.
#PCB #AIServers #Semiconductors #ChinaTech #AdvancedPackaging
Source: Goldman Sachs, "China PCB: CFME (9630.HK/688630.SS, NC): Mgmt visits: PCB to drive growth ahead; Capacity expansion ongoing", 9 November 2026. Based solely on the report provided; forecasts are not guaranteed. For reference only; not investment advice.
Read the full breakdown on Unhidea: https://unhidea.com/en/articles/research-e89d12082b51444ea649f2905787cb0e-en
Visit unhidea.com for more of the latest sell-side research interpretations.
CFME rides the AI PCB wave: shipments above 1,000 tools, capacity expansion under way
CFME rides the AI PCB wave: shipments above 1,000 tools, capacity expansion under way
$9630.HK
GOLDMAN SACHS | ALLEN CHANG, VERENA JENG • 9 November 2026
1. What did Goldman Sachs find on its visit to CFME?
• Goldman Sachs visited CFME management in Hong Kong to discuss capacity expansion, supply chains and downstream capex.
• Management remains constructive on its multi-year growth trajectory, backed by resilient equipment demand from tier-1 PCB fabricators.
• CFME is not covered by Goldman Sachs — this is a management-visit note, with no rating or price target.
2. Why is AI server PCB demand the tailwind here?
• Goldman Sachs expects the global AI server PCB market to reach US$38bn by 2027E (raised from US$27bn), then US$84bn by 2028E — a 148% 2026–28E CAGR.
• Leading US cloud providers are forecast to grow capex 84%/52%/13% YoY in 2026E–28E, to US$1,397bn by 2028E; Chinese cloud platforms are seen growing 105%/21%/14% YoY.
• With capacity still expanding and utilisation high, Goldman Sachs stays constructive on AI PCB and CCL.
3. How fast is CFME's core PCB equipment business growing?
• Core PCB exposure tool shipments are tracking above 1,000 units in 2026, with mid-double-digit growth anticipated in 2027.
• High-end tools are set to exceed half of 2027 shipments, lifting blended average selling prices.
• Management sees customers' capacity expansion and capex as healthy, with little evidence of a slowdown across tier-1 fabricators.
4. What can IC substrates and advanced packaging add?
• IC substrate equipment order intake is guided to expand to roughly a few hundred units in 2027, capturing a strategic two-year domestic substitution window.
• CFME delivers in 4–5 months, versus 12–18 months for Japanese peers.
• Advanced packaging is management's highest-growth catalyst, with robust order visibility as customers migrate to large-format panel-level packaging.
5. Can CFME actually deliver on the expansion?
• Management is scaling up to multi-billion-RMB annual output value through 2027, backed by its Hefei facilities and a planned greenfield base in 2028 (Hefei vs Shenzhen).
• To ease laser-drilling bottlenecks it is locking in annual CO2 laser procurement deals and domestic component substitution, targeting over 100 drilling unit deliveries in 2027 and c.1,000 net technical hires across 2026–2027.
• Overseas, it favours an asset-light partnership in Malaysia for rapid delivery by 2Q–3Q27, to serve international orders and mitigate compliance and country-of-origin risks.
• Watch execution: hiring, laser supply and overseas delivery must keep pace with orders — or the growth story slips.
#PCB #AIServers #Semiconductors #ChinaTech #AdvancedPackaging
Source: Goldman Sachs, "China PCB: CFME (9630.HK/688630.SS, NC): Mgmt visits: PCB to drive growth ahead; Capacity expansion ongoing", 9 November 2026. Based solely on the report provided; forecasts are not guaranteed. For reference only; not investment advice.
Read the full breakdown on Unhidea: https://unhidea.com/en/articles/research-e89d12082b51444ea649f2905787cb0e-en
Visit unhidea.com for more of the latest sell-side research interpretations.
$9630.HK
GOLDMAN SACHS | ALLEN CHANG, VERENA JENG • 9 November 2026
1. What did Goldman Sachs find on its visit to CFME?
• Goldman Sachs visited CFME management in Hong Kong to discuss capacity expansion, supply chains and downstream capex.
• Management remains constructive on its multi-year growth trajectory, backed by resilient equipment demand from tier-1 PCB fabricators.
• CFME is not covered by Goldman Sachs — this is a management-visit note, with no rating or price target.
2. Why is AI server PCB demand the tailwind here?
• Goldman Sachs expects the global AI server PCB market to reach US$38bn by 2027E (raised from US$27bn), then US$84bn by 2028E — a 148% 2026–28E CAGR.
• Leading US cloud providers are forecast to grow capex 84%/52%/13% YoY in 2026E–28E, to US$1,397bn by 2028E; Chinese cloud platforms are seen growing 105%/21%/14% YoY.
• With capacity still expanding and utilisation high, Goldman Sachs stays constructive on AI PCB and CCL.
3. How fast is CFME's core PCB equipment business growing?
• Core PCB exposure tool shipments are tracking above 1,000 units in 2026, with mid-double-digit growth anticipated in 2027.
• High-end tools are set to exceed half of 2027 shipments, lifting blended average selling prices.
• Management sees customers' capacity expansion and capex as healthy, with little evidence of a slowdown across tier-1 fabricators.
4. What can IC substrates and advanced packaging add?
• IC substrate equipment order intake is guided to expand to roughly a few hundred units in 2027, capturing a strategic two-year domestic substitution window.
• CFME delivers in 4–5 months, versus 12–18 months for Japanese peers.
• Advanced packaging is management's highest-growth catalyst, with robust order visibility as customers migrate to large-format panel-level packaging.
5. Can CFME actually deliver on the expansion?
• Management is scaling up to multi-billion-RMB annual output value through 2027, backed by its Hefei facilities and a planned greenfield base in 2028 (Hefei vs Shenzhen).
• To ease laser-drilling bottlenecks it is locking in annual CO2 laser procurement deals and domestic component substitution, targeting over 100 drilling unit deliveries in 2027 and c.1,000 net technical hires across 2026–2027.
• Overseas, it favours an asset-light partnership in Malaysia for rapid delivery by 2Q–3Q27, to serve international orders and mitigate compliance and country-of-origin risks.
• Watch execution: hiring, laser supply and overseas delivery must keep pace with orders — or the growth story slips.
#PCB #AIServers #Semiconductors #ChinaTech #AdvancedPackaging
Source: Goldman Sachs, "China PCB: CFME (9630.HK/688630.SS, NC): Mgmt visits: PCB to drive growth ahead; Capacity expansion ongoing", 9 November 2026. Based solely on the report provided; forecasts are not guaranteed. For reference only; not investment advice.
Read the full breakdown on Unhidea: https://unhidea.com/en/articles/research-e89d12082b51444ea649f2905787cb0e-en
Visit unhidea.com for more of the latest sell-side research interpretations.
·
--
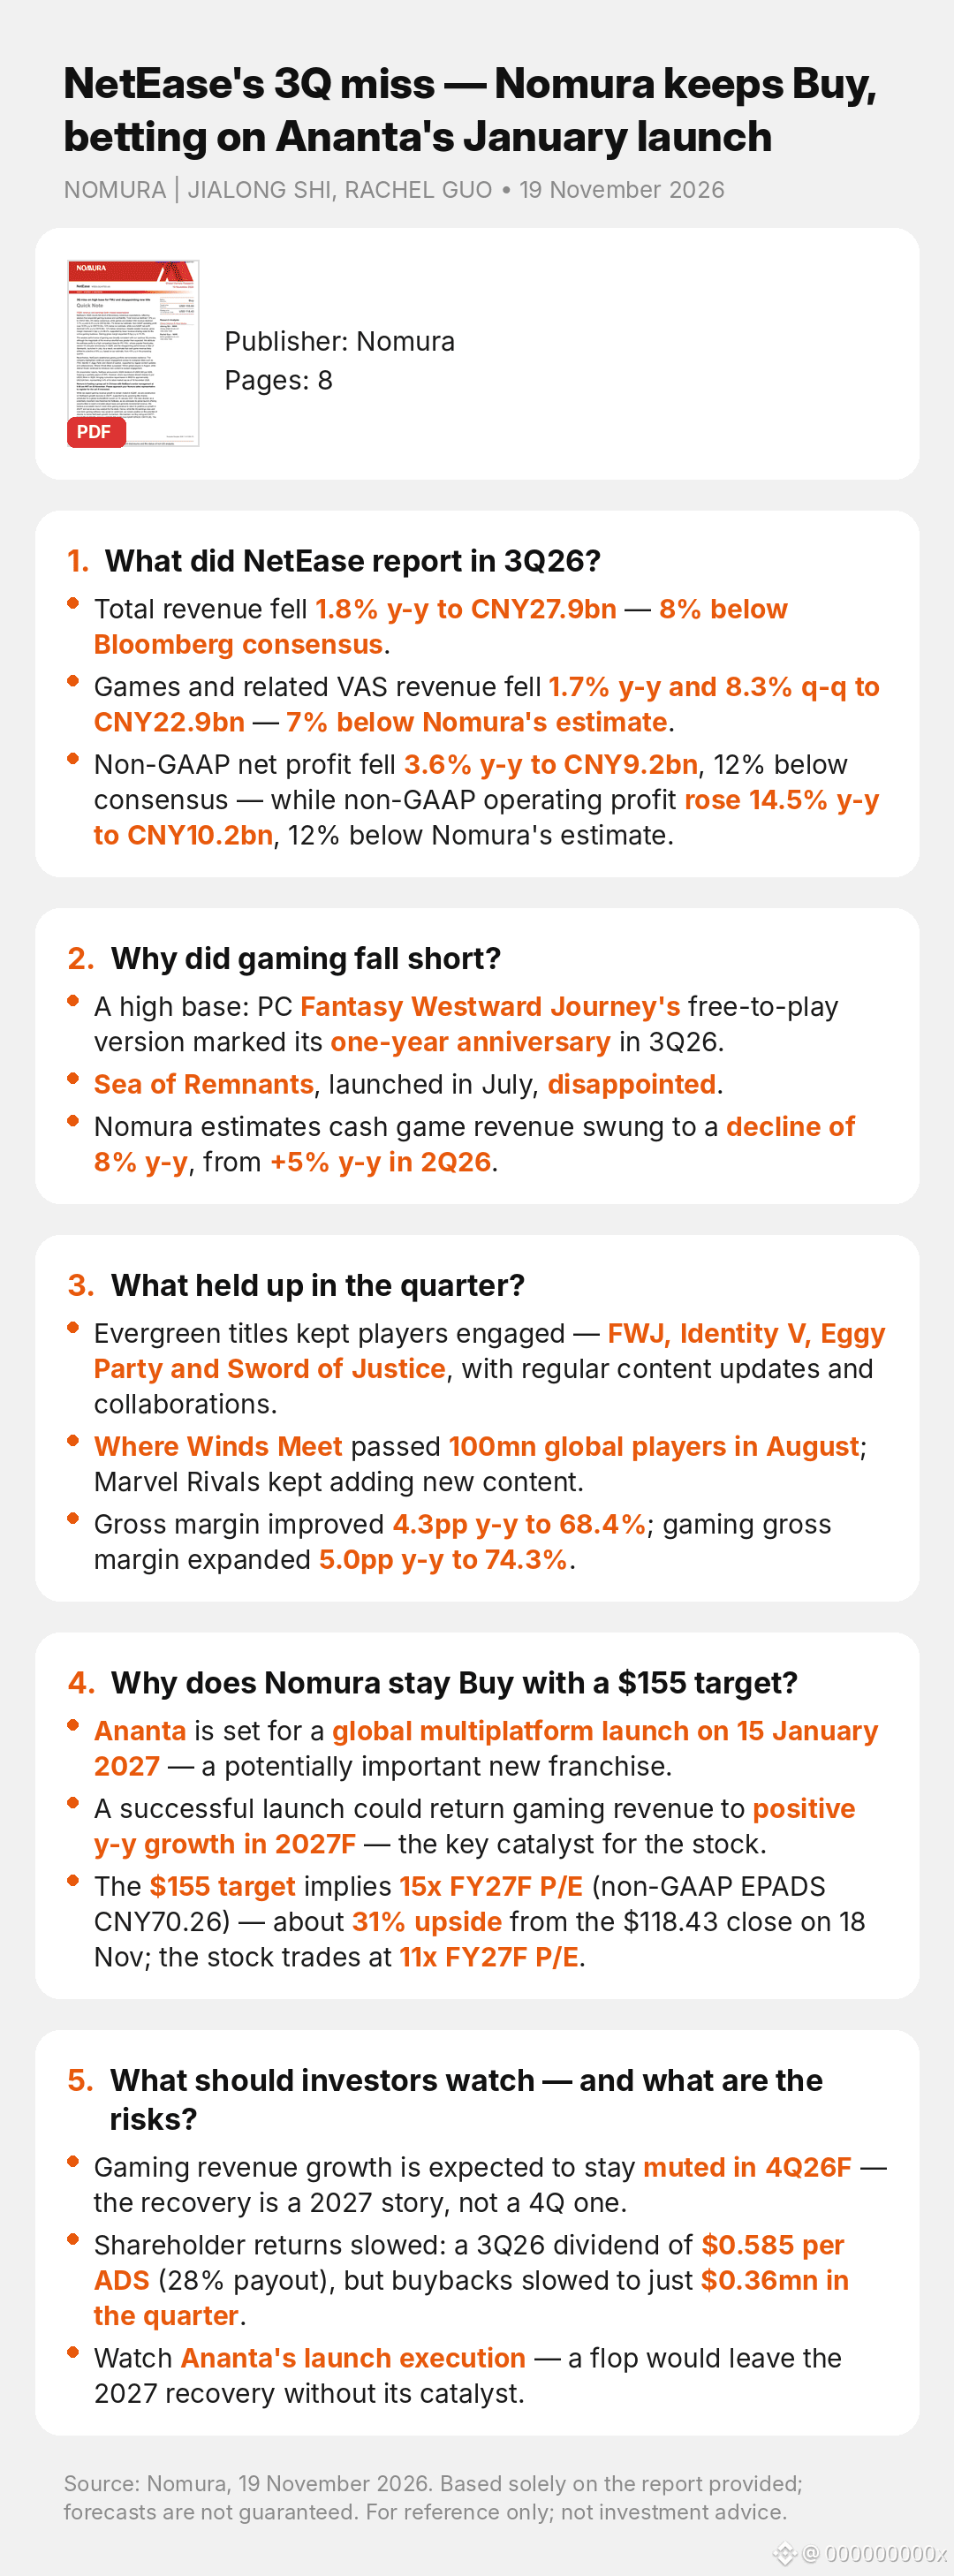
Article
NetEase's 3Q miss — Nomura keeps Buy, betting on Ananta's January launchNetEase's 3Q miss — Nomura keeps Buy, betting on Ananta's January launch
$NTES
NOMURA | JIALONG SHI, RACHEL GUO • 19 November 2026
1. What did NetEase report in 3Q26?
• Total revenue fell 1.8% y-y to CNY27.9bn — 8% below Bloomberg consensus.
• Games and related VAS revenue fell 1.7% y-y and 8.3% q-q to CNY22.9bn — 7% below Nomura's estimate.
• Non-GAAP net profit fell 3.6% y-y to CNY9.2bn, 12% below consensus — while non-GAAP operating profit rose 14.5% y-y to CNY10.2bn, 12% below Nomura's estimate.
2. Why did gaming fall short?
• A high base: PC Fantasy Westward Journey's free-to-play version marked its one-year anniversary in 3Q26.
• Sea of Remnants, launched in July, disappointed.
• Nomura estimates cash game revenue swung to a decline of 8% y-y, from +5% y-y in 2Q26.
3. What held up in the quarter?
• Evergreen titles kept players engaged — FWJ, Identity V, Eggy Party and Sword of Justice, with regular content updates and collaborations.
• Where Winds Meet passed 100mn global players in August; Marvel Rivals kept adding new content.
• Gross margin improved 4.3pp y-y to 68.4%; gaming gross margin expanded 5.0pp y-y to 74.3%.
4. Why does Nomura stay Buy with a $155 target?
• Ananta is set for a global multiplatform launch on 15 January 2027 — a potentially important new franchise.
• A successful launch could return gaming revenue to positive y-y growth in 2027F — the key catalyst for the stock.
• The $155 target implies 15x FY27F P/E (non-GAAP EPADS CNY70.26) — about 31% upside from the $118.43 close on 18 Nov; the stock trades at 11x FY27F P/E.
5. What should investors watch — and what are the risks?
• Gaming revenue growth is expected to stay muted in 4Q26F — the recovery is a 2027 story, not a 4Q one.
• Shareholder returns slowed: a 3Q26 dividend of $0.585 per ADS (28% payout), but buybacks slowed to just $0.36mn in the quarter.
• Watch Ananta's launch execution — a flop would leave the 2027 recovery without its catalyst.
#Gaming #ChinaTech #Ananta #MobileGames #Earnings
Source: Nomura, "3Q miss on high base for FWJ and disappointing new title", 19 November 2026. Based solely on the report provided; forecasts are not guaranteed. For reference only; not investment advice.
Since the report: NTES ADSs fell 11.4% to $104.94 on 19 Nov, and Hong Kong-listed shares fell 17.6% to HK$154 on 20 Nov (Yicai). NetEase's CEO also flagged AI-generated short dramas competing for gamers' time.
Visit unhidea.com for more of the latest sell-side research interpretations: https://unhidea.com/en/
NetEase's 3Q miss — Nomura keeps Buy, betting on Ananta's January launch
NetEase's 3Q miss — Nomura keeps Buy, betting on Ananta's January launch
$NTES
NOMURA | JIALONG SHI, RACHEL GUO • 19 November 2026
1. What did NetEase report in 3Q26?
• Total revenue fell 1.8% y-y to CNY27.9bn — 8% below Bloomberg consensus.
• Games and related VAS revenue fell 1.7% y-y and 8.3% q-q to CNY22.9bn — 7% below Nomura's estimate.
• Non-GAAP net profit fell 3.6% y-y to CNY9.2bn, 12% below consensus — while non-GAAP operating profit rose 14.5% y-y to CNY10.2bn, 12% below Nomura's estimate.
2. Why did gaming fall short?
• A high base: PC Fantasy Westward Journey's free-to-play version marked its one-year anniversary in 3Q26.
• Sea of Remnants, launched in July, disappointed.
• Nomura estimates cash game revenue swung to a decline of 8% y-y, from +5% y-y in 2Q26.
3. What held up in the quarter?
• Evergreen titles kept players engaged — FWJ, Identity V, Eggy Party and Sword of Justice, with regular content updates and collaborations.
• Where Winds Meet passed 100mn global players in August; Marvel Rivals kept adding new content.
• Gross margin improved 4.3pp y-y to 68.4%; gaming gross margin expanded 5.0pp y-y to 74.3%.
4. Why does Nomura stay Buy with a $155 target?
• Ananta is set for a global multiplatform launch on 15 January 2027 — a potentially important new franchise.
• A successful launch could return gaming revenue to positive y-y growth in 2027F — the key catalyst for the stock.
• The $155 target implies 15x FY27F P/E (non-GAAP EPADS CNY70.26) — about 31% upside from the $118.43 close on 18 Nov; the stock trades at 11x FY27F P/E.
5. What should investors watch — and what are the risks?
• Gaming revenue growth is expected to stay muted in 4Q26F — the recovery is a 2027 story, not a 4Q one.
• Shareholder returns slowed: a 3Q26 dividend of $0.585 per ADS (28% payout), but buybacks slowed to just $0.36mn in the quarter.
• Watch Ananta's launch execution — a flop would leave the 2027 recovery without its catalyst.
#Gaming #ChinaTech #Ananta #MobileGames #Earnings
Source: Nomura, "3Q miss on high base for FWJ and disappointing new title", 19 November 2026. Based solely on the report provided; forecasts are not guaranteed. For reference only; not investment advice.
Since the report: NTES ADSs fell 11.4% to $104.94 on 19 Nov, and Hong Kong-listed shares fell 17.6% to HK$154 on 20 Nov (Yicai). NetEase's CEO also flagged AI-generated short dramas competing for gamers' time.
Visit unhidea.com for more of the latest sell-side research interpretations: https://unhidea.com/en/
$NTES
NOMURA | JIALONG SHI, RACHEL GUO • 19 November 2026
1. What did NetEase report in 3Q26?
• Total revenue fell 1.8% y-y to CNY27.9bn — 8% below Bloomberg consensus.
• Games and related VAS revenue fell 1.7% y-y and 8.3% q-q to CNY22.9bn — 7% below Nomura's estimate.
• Non-GAAP net profit fell 3.6% y-y to CNY9.2bn, 12% below consensus — while non-GAAP operating profit rose 14.5% y-y to CNY10.2bn, 12% below Nomura's estimate.
2. Why did gaming fall short?
• A high base: PC Fantasy Westward Journey's free-to-play version marked its one-year anniversary in 3Q26.
• Sea of Remnants, launched in July, disappointed.
• Nomura estimates cash game revenue swung to a decline of 8% y-y, from +5% y-y in 2Q26.
3. What held up in the quarter?
• Evergreen titles kept players engaged — FWJ, Identity V, Eggy Party and Sword of Justice, with regular content updates and collaborations.
• Where Winds Meet passed 100mn global players in August; Marvel Rivals kept adding new content.
• Gross margin improved 4.3pp y-y to 68.4%; gaming gross margin expanded 5.0pp y-y to 74.3%.
4. Why does Nomura stay Buy with a $155 target?
• Ananta is set for a global multiplatform launch on 15 January 2027 — a potentially important new franchise.
• A successful launch could return gaming revenue to positive y-y growth in 2027F — the key catalyst for the stock.
• The $155 target implies 15x FY27F P/E (non-GAAP EPADS CNY70.26) — about 31% upside from the $118.43 close on 18 Nov; the stock trades at 11x FY27F P/E.
5. What should investors watch — and what are the risks?
• Gaming revenue growth is expected to stay muted in 4Q26F — the recovery is a 2027 story, not a 4Q one.
• Shareholder returns slowed: a 3Q26 dividend of $0.585 per ADS (28% payout), but buybacks slowed to just $0.36mn in the quarter.
• Watch Ananta's launch execution — a flop would leave the 2027 recovery without its catalyst.
#Gaming #ChinaTech #Ananta #MobileGames #Earnings
Source: Nomura, "3Q miss on high base for FWJ and disappointing new title", 19 November 2026. Based solely on the report provided; forecasts are not guaranteed. For reference only; not investment advice.
Since the report: NTES ADSs fell 11.4% to $104.94 on 19 Nov, and Hong Kong-listed shares fell 17.6% to HK$154 on 20 Nov (Yicai). NetEase's CEO also flagged AI-generated short dramas competing for gamers' time.
Visit unhidea.com for more of the latest sell-side research interpretations: https://unhidea.com/en/
NTESUS-3.48%
2
·
--
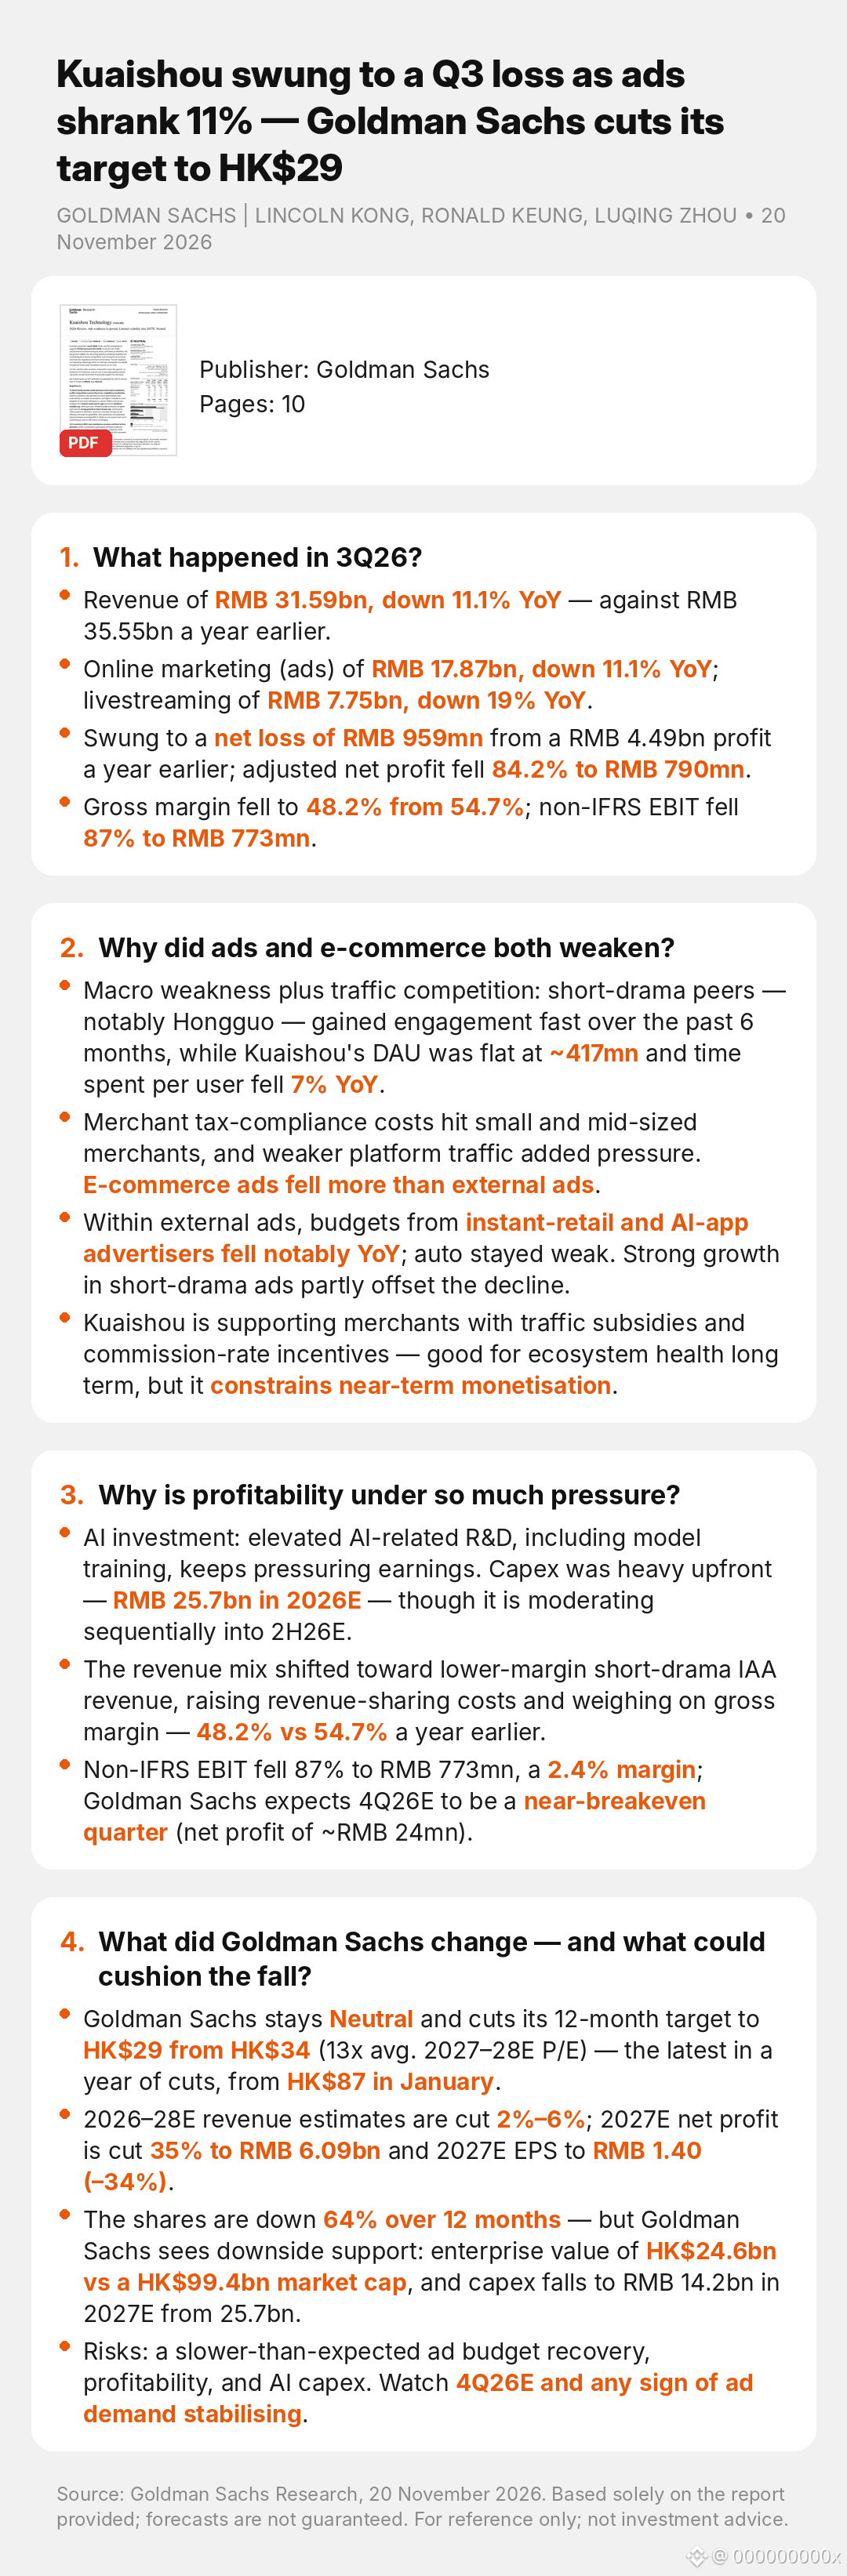
Article
Kuaishou swung to a Q3 loss as ads shrank 11% — Goldman Sachs cuts its target to HK$29Kuaishou swung to a Q3 loss as ads shrank 11% — Goldman Sachs cuts its target to HK$29
$1024.HK
GOLDMAN SACHS | LINCOLN KONG, RONALD KEUNG, LUQING ZHOU • 20 November 2026
1. What happened in 3Q26?
• Revenue of RMB 31.59bn, down 11.1% YoY — against RMB 35.55bn a year earlier.
• Online marketing (ads) of RMB 17.87bn, down 11.1% YoY; livestreaming of RMB 7.75bn, down 19% YoY.
• Swung to a net loss of RMB 959mn from a RMB 4.49bn profit a year earlier; adjusted net profit fell 84.2% to RMB 790mn.
• Gross margin fell to 48.2% from 54.7%; non-IFRS EBIT fell 87% to RMB 773mn.
2. Why did ads and e-commerce both weaken?
• Macro weakness plus traffic competition: short-drama peers — notably Hongguo — gained engagement fast over the past 6 months, while Kuaishou's DAU was flat at ~417mn and time spent per user fell 7% YoY.
• Merchant tax-compliance costs hit small and mid-sized merchants, and weaker platform traffic added pressure. E-commerce ads fell more than external ads.
• Within external ads, budgets from instant-retail and AI-app advertisers fell notably YoY; auto stayed weak. Strong growth in short-drama ads partly offset the decline.
• Kuaishou is supporting merchants with traffic subsidies and commission-rate incentives — good for ecosystem health long term, but it constrains near-term monetisation.
3. Why is profitability under so much pressure?
• AI investment: elevated AI-related R&D, including model training, keeps pressuring earnings. Capex was heavy upfront — RMB 25.7bn in 2026E — though it is moderating sequentially into 2H26E.
• The revenue mix shifted toward lower-margin short-drama IAA revenue, raising revenue-sharing costs and weighing on gross margin — 48.2% vs 54.7% a year earlier.
• Non-IFRS EBIT fell 87% to RMB 773mn, a 2.4% margin; Goldman Sachs expects 4Q26E to be a near-breakeven quarter (net profit of ~RMB 24mn).
4. What did Goldman Sachs change — and what could cushion the fall?
• Goldman Sachs stays Neutral and cuts its 12-month target to HK$29 from HK$34 (13x avg. 2027–28E P/E) — the latest in a year of cuts, from HK$87 in January.
• 2026–28E revenue estimates are cut 2%–6%; 2027E net profit is cut 35% to RMB 6.09bn and 2027E EPS to RMB 1.40 (–34%).
• The shares are down 64% over 12 months — but Goldman Sachs sees downside support: enterprise value of HK$24.6bn vs a HK$99.4bn market cap, and capex falls to RMB 14.2bn in 2027E from 25.7bn.
• Risks: a slower-than-expected ad budget recovery, profitability, and AI capex. Watch 4Q26E and any sign of ad demand stabilising.
Post-report market data, 20 Nov: shares fell 11.4% to HK$20.42 after the results, hitting a record intraday low of HK$19.97 (Yicai / Finwire).
#Kuaishou #ChinaTech #ShortVideo #Advertising #AI
Source: Goldman Sachs, "3Q26 Review: Ads weakness to persist; Limited visibility into 2027E", 20 November 2026. Based solely on the report provided; forecasts are not guaranteed. For reference only; not investment advice.
Visit unhidea.com for more of the latest sell-side research interpretations: https://unhidea.com/en/
Kuaishou swung to a Q3 loss as ads shrank 11% — Goldman Sachs cuts its target to HK$29
Kuaishou swung to a Q3 loss as ads shrank 11% — Goldman Sachs cuts its target to HK$29
$1024.HK
GOLDMAN SACHS | LINCOLN KONG, RONALD KEUNG, LUQING ZHOU • 20 November 2026
1. What happened in 3Q26?
• Revenue of RMB 31.59bn, down 11.1% YoY — against RMB 35.55bn a year earlier.
• Online marketing (ads) of RMB 17.87bn, down 11.1% YoY; livestreaming of RMB 7.75bn, down 19% YoY.
• Swung to a net loss of RMB 959mn from a RMB 4.49bn profit a year earlier; adjusted net profit fell 84.2% to RMB 790mn.
• Gross margin fell to 48.2% from 54.7%; non-IFRS EBIT fell 87% to RMB 773mn.
2. Why did ads and e-commerce both weaken?
• Macro weakness plus traffic competition: short-drama peers — notably Hongguo — gained engagement fast over the past 6 months, while Kuaishou's DAU was flat at ~417mn and time spent per user fell 7% YoY.
• Merchant tax-compliance costs hit small and mid-sized merchants, and weaker platform traffic added pressure. E-commerce ads fell more than external ads.
• Within external ads, budgets from instant-retail and AI-app advertisers fell notably YoY; auto stayed weak. Strong growth in short-drama ads partly offset the decline.
• Kuaishou is supporting merchants with traffic subsidies and commission-rate incentives — good for ecosystem health long term, but it constrains near-term monetisation.
3. Why is profitability under so much pressure?
• AI investment: elevated AI-related R&D, including model training, keeps pressuring earnings. Capex was heavy upfront — RMB 25.7bn in 2026E — though it is moderating sequentially into 2H26E.
• The revenue mix shifted toward lower-margin short-drama IAA revenue, raising revenue-sharing costs and weighing on gross margin — 48.2% vs 54.7% a year earlier.
• Non-IFRS EBIT fell 87% to RMB 773mn, a 2.4% margin; Goldman Sachs expects 4Q26E to be a near-breakeven quarter (net profit of ~RMB 24mn).
4. What did Goldman Sachs change — and what could cushion the fall?
• Goldman Sachs stays Neutral and cuts its 12-month target to HK$29 from HK$34 (13x avg. 2027–28E P/E) — the latest in a year of cuts, from HK$87 in January.
• 2026–28E revenue estimates are cut 2%–6%; 2027E net profit is cut 35% to RMB 6.09bn and 2027E EPS to RMB 1.40 (–34%).
• The shares are down 64% over 12 months — but Goldman Sachs sees downside support: enterprise value of HK$24.6bn vs a HK$99.4bn market cap, and capex falls to RMB 14.2bn in 2027E from 25.7bn.
• Risks: a slower-than-expected ad budget recovery, profitability, and AI capex. Watch 4Q26E and any sign of ad demand stabilising.
Post-report market data, 20 Nov: shares fell 11.4% to HK$20.42 after the results, hitting a record intraday low of HK$19.97 (Yicai / Finwire).
#Kuaishou #ChinaTech #ShortVideo #Advertising #AI
Source: Goldman Sachs, "3Q26 Review: Ads weakness to persist; Limited visibility into 2027E", 20 November 2026. Based solely on the report provided; forecasts are not guaranteed. For reference only; not investment advice.
Visit unhidea.com for more of the latest sell-side research interpretations: https://unhidea.com/en/
$1024.HK
GOLDMAN SACHS | LINCOLN KONG, RONALD KEUNG, LUQING ZHOU • 20 November 2026
1. What happened in 3Q26?
• Revenue of RMB 31.59bn, down 11.1% YoY — against RMB 35.55bn a year earlier.
• Online marketing (ads) of RMB 17.87bn, down 11.1% YoY; livestreaming of RMB 7.75bn, down 19% YoY.
• Swung to a net loss of RMB 959mn from a RMB 4.49bn profit a year earlier; adjusted net profit fell 84.2% to RMB 790mn.
• Gross margin fell to 48.2% from 54.7%; non-IFRS EBIT fell 87% to RMB 773mn.
2. Why did ads and e-commerce both weaken?
• Macro weakness plus traffic competition: short-drama peers — notably Hongguo — gained engagement fast over the past 6 months, while Kuaishou's DAU was flat at ~417mn and time spent per user fell 7% YoY.
• Merchant tax-compliance costs hit small and mid-sized merchants, and weaker platform traffic added pressure. E-commerce ads fell more than external ads.
• Within external ads, budgets from instant-retail and AI-app advertisers fell notably YoY; auto stayed weak. Strong growth in short-drama ads partly offset the decline.
• Kuaishou is supporting merchants with traffic subsidies and commission-rate incentives — good for ecosystem health long term, but it constrains near-term monetisation.
3. Why is profitability under so much pressure?
• AI investment: elevated AI-related R&D, including model training, keeps pressuring earnings. Capex was heavy upfront — RMB 25.7bn in 2026E — though it is moderating sequentially into 2H26E.
• The revenue mix shifted toward lower-margin short-drama IAA revenue, raising revenue-sharing costs and weighing on gross margin — 48.2% vs 54.7% a year earlier.
• Non-IFRS EBIT fell 87% to RMB 773mn, a 2.4% margin; Goldman Sachs expects 4Q26E to be a near-breakeven quarter (net profit of ~RMB 24mn).
4. What did Goldman Sachs change — and what could cushion the fall?
• Goldman Sachs stays Neutral and cuts its 12-month target to HK$29 from HK$34 (13x avg. 2027–28E P/E) — the latest in a year of cuts, from HK$87 in January.
• 2026–28E revenue estimates are cut 2%–6%; 2027E net profit is cut 35% to RMB 6.09bn and 2027E EPS to RMB 1.40 (–34%).
• The shares are down 64% over 12 months — but Goldman Sachs sees downside support: enterprise value of HK$24.6bn vs a HK$99.4bn market cap, and capex falls to RMB 14.2bn in 2027E from 25.7bn.
• Risks: a slower-than-expected ad budget recovery, profitability, and AI capex. Watch 4Q26E and any sign of ad demand stabilising.
Post-report market data, 20 Nov: shares fell 11.4% to HK$20.42 after the results, hitting a record intraday low of HK$19.97 (Yicai / Finwire).
#Kuaishou #ChinaTech #ShortVideo #Advertising #AI
Source: Goldman Sachs, "3Q26 Review: Ads weakness to persist; Limited visibility into 2027E", 20 November 2026. Based solely on the report provided; forecasts are not guaranteed. For reference only; not investment advice.
Visit unhidea.com for more of the latest sell-side research interpretations: https://unhidea.com/en/
BILIUS-3.23%
32
·
--
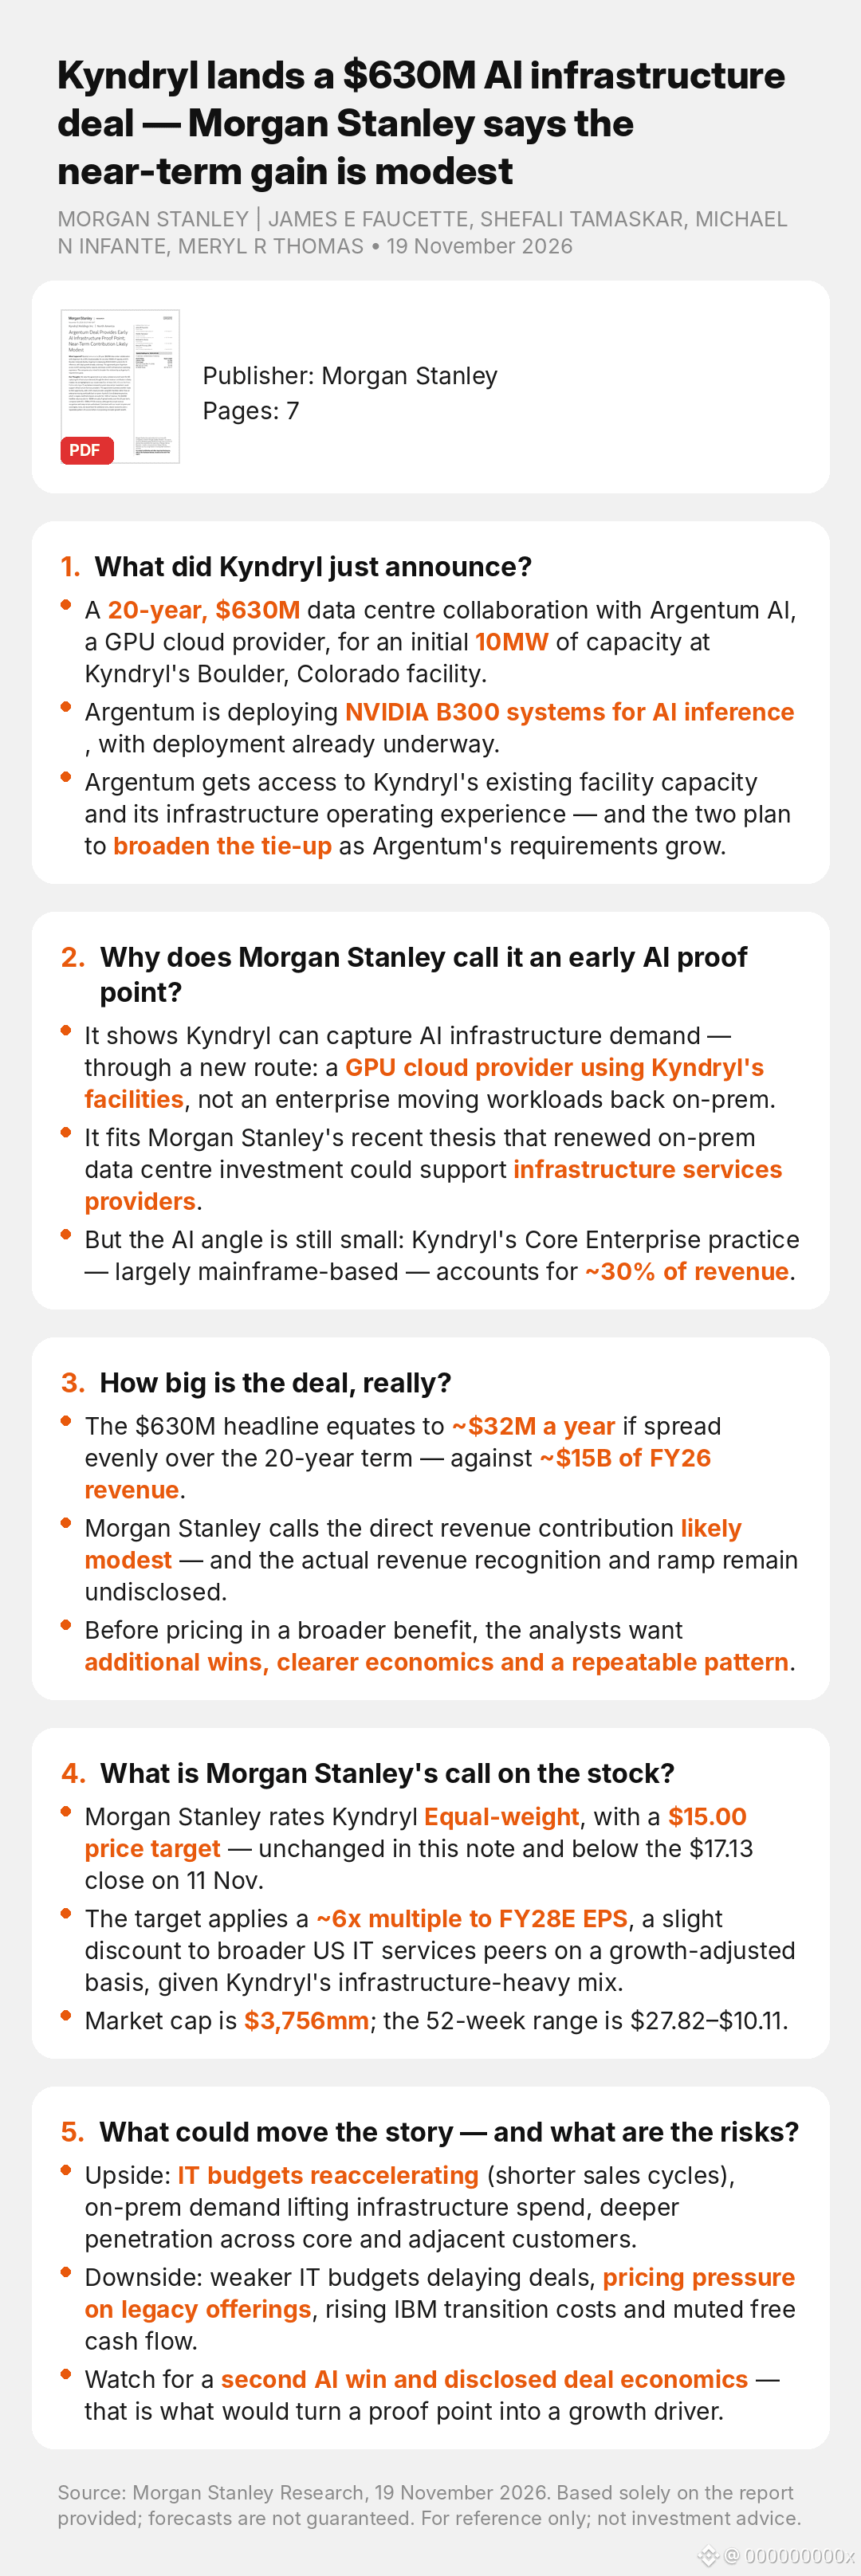
Article
Kyndryl lands a $630M AI infrastructure deal — Morgan Stanley says the near-term gain is modestKyndryl lands a $630M AI infrastructure deal — Morgan Stanley says the near-term gain is modest
$KD
MORGAN STANLEY | JAMES E FAUCETTE, SHEFALI TAMASKAR, MICHAEL N INFANTE, MERYL R THOMAS • 19 November 2026
1. What did Kyndryl just announce?
• A 20-year, $630M data centre collaboration with Argentum AI, a GPU cloud provider, for an initial 10MW of capacity at Kyndryl's Boulder, Colorado facility.
• Argentum is deploying NVIDIA B300 systems for AI inference, with deployment already underway.
• Argentum gets access to Kyndryl's existing facility capacity and its infrastructure operating experience — and the two plan to broaden the tie-up as Argentum's requirements grow.
2. Why does Morgan Stanley call it an early AI proof point?
• It shows Kyndryl can capture AI infrastructure demand — through a new route: a GPU cloud provider using Kyndryl's facilities, not an enterprise moving workloads back on-prem.
• It fits Morgan Stanley's recent thesis that renewed on-prem data centre investment could support infrastructure services providers.
• But the AI angle is still small: Kyndryl's Core Enterprise practice — largely mainframe-based — accounts for ~30% of revenue.
3. How big is the deal, really?
• The $630M headline equates to ~$32M a year if spread evenly over the 20-year term — against ~$15B of FY26 revenue.
• Morgan Stanley calls the direct revenue contribution likely modest — and the actual revenue recognition and ramp remain undisclosed.
• Before pricing in a broader benefit, the analysts want additional wins, clearer economics and a repeatable pattern.
4. What is Morgan Stanley's call on the stock?
• Morgan Stanley rates Kyndryl Equal-weight, with a $15.00 price target — unchanged in this note and below the $17.13 close on 11 Nov.
• The target applies a ~6x multiple to FY28E EPS, a slight discount to broader US IT services peers on a growth-adjusted basis, given Kyndryl's infrastructure-heavy mix.
• Market cap is $3,756mm; the 52-week range is $27.82–$10.11.
5. What could move the story — and what are the risks?
• Upside: IT budgets reaccelerating (shorter sales cycles), on-prem demand lifting infrastructure spend, deeper penetration across core and adjacent customers.
• Downside: weaker IT budgets delaying deals, pricing pressure on legacy offerings, rising IBM transition costs and muted free cash flow.
• Watch for a second AI win and disclosed deal economics — that is what would turn a proof point into a growth driver.
#AI #DataCenters #GPUCloud #ITServices #Inference
Source: Morgan Stanley, "Argentum Deal Provides Early AI Infrastructure Proof Point; Near-Term Contribution Likely Modest", 19 November 2026. Based solely on the report provided; forecasts are not guaranteed. For reference only; not investment advice.
Visit unhidea.com for more of the latest sell-side research interpretations: https://unhidea.com/en/
Kyndryl lands a $630M AI infrastructure deal — Morgan Stanley says the near-term gain is modest
Kyndryl lands a $630M AI infrastructure deal — Morgan Stanley says the near-term gain is modest
$KD
MORGAN STANLEY | JAMES E FAUCETTE, SHEFALI TAMASKAR, MICHAEL N INFANTE, MERYL R THOMAS • 19 November 2026
1. What did Kyndryl just announce?
• A 20-year, $630M data centre collaboration with Argentum AI, a GPU cloud provider, for an initial 10MW of capacity at Kyndryl's Boulder, Colorado facility.
• Argentum is deploying NVIDIA B300 systems for AI inference, with deployment already underway.
• Argentum gets access to Kyndryl's existing facility capacity and its infrastructure operating experience — and the two plan to broaden the tie-up as Argentum's requirements grow.
2. Why does Morgan Stanley call it an early AI proof point?
• It shows Kyndryl can capture AI infrastructure demand — through a new route: a GPU cloud provider using Kyndryl's facilities, not an enterprise moving workloads back on-prem.
• It fits Morgan Stanley's recent thesis that renewed on-prem data centre investment could support infrastructure services providers.
• But the AI angle is still small: Kyndryl's Core Enterprise practice — largely mainframe-based — accounts for ~30% of revenue.
3. How big is the deal, really?
• The $630M headline equates to ~$32M a year if spread evenly over the 20-year term — against ~$15B of FY26 revenue.
• Morgan Stanley calls the direct revenue contribution likely modest — and the actual revenue recognition and ramp remain undisclosed.
• Before pricing in a broader benefit, the analysts want additional wins, clearer economics and a repeatable pattern.
4. What is Morgan Stanley's call on the stock?
• Morgan Stanley rates Kyndryl Equal-weight, with a $15.00 price target — unchanged in this note and below the $17.13 close on 11 Nov.
• The target applies a ~6x multiple to FY28E EPS, a slight discount to broader US IT services peers on a growth-adjusted basis, given Kyndryl's infrastructure-heavy mix.
• Market cap is $3,756mm; the 52-week range is $27.82–$10.11.
5. What could move the story — and what are the risks?
• Upside: IT budgets reaccelerating (shorter sales cycles), on-prem demand lifting infrastructure spend, deeper penetration across core and adjacent customers.
• Downside: weaker IT budgets delaying deals, pricing pressure on legacy offerings, rising IBM transition costs and muted free cash flow.
• Watch for a second AI win and disclosed deal economics — that is what would turn a proof point into a growth driver.
#AI #DataCenters #GPUCloud #ITServices #Inference
Source: Morgan Stanley, "Argentum Deal Provides Early AI Infrastructure Proof Point; Near-Term Contribution Likely Modest", 19 November 2026. Based solely on the report provided; forecasts are not guaranteed. For reference only; not investment advice.
Visit unhidea.com for more of the latest sell-side research interpretations: https://unhidea.com/en/
$KD
MORGAN STANLEY | JAMES E FAUCETTE, SHEFALI TAMASKAR, MICHAEL N INFANTE, MERYL R THOMAS • 19 November 2026
1. What did Kyndryl just announce?
• A 20-year, $630M data centre collaboration with Argentum AI, a GPU cloud provider, for an initial 10MW of capacity at Kyndryl's Boulder, Colorado facility.
• Argentum is deploying NVIDIA B300 systems for AI inference, with deployment already underway.
• Argentum gets access to Kyndryl's existing facility capacity and its infrastructure operating experience — and the two plan to broaden the tie-up as Argentum's requirements grow.
2. Why does Morgan Stanley call it an early AI proof point?
• It shows Kyndryl can capture AI infrastructure demand — through a new route: a GPU cloud provider using Kyndryl's facilities, not an enterprise moving workloads back on-prem.
• It fits Morgan Stanley's recent thesis that renewed on-prem data centre investment could support infrastructure services providers.
• But the AI angle is still small: Kyndryl's Core Enterprise practice — largely mainframe-based — accounts for ~30% of revenue.
3. How big is the deal, really?
• The $630M headline equates to ~$32M a year if spread evenly over the 20-year term — against ~$15B of FY26 revenue.
• Morgan Stanley calls the direct revenue contribution likely modest — and the actual revenue recognition and ramp remain undisclosed.
• Before pricing in a broader benefit, the analysts want additional wins, clearer economics and a repeatable pattern.
4. What is Morgan Stanley's call on the stock?
• Morgan Stanley rates Kyndryl Equal-weight, with a $15.00 price target — unchanged in this note and below the $17.13 close on 11 Nov.
• The target applies a ~6x multiple to FY28E EPS, a slight discount to broader US IT services peers on a growth-adjusted basis, given Kyndryl's infrastructure-heavy mix.
• Market cap is $3,756mm; the 52-week range is $27.82–$10.11.
5. What could move the story — and what are the risks?
• Upside: IT budgets reaccelerating (shorter sales cycles), on-prem demand lifting infrastructure spend, deeper penetration across core and adjacent customers.
• Downside: weaker IT budgets delaying deals, pricing pressure on legacy offerings, rising IBM transition costs and muted free cash flow.
• Watch for a second AI win and disclosed deal economics — that is what would turn a proof point into a growth driver.
#AI #DataCenters #GPUCloud #ITServices #Inference
Source: Morgan Stanley, "Argentum Deal Provides Early AI Infrastructure Proof Point; Near-Term Contribution Likely Modest", 19 November 2026. Based solely on the report provided; forecasts are not guaranteed. For reference only; not investment advice.
Visit unhidea.com for more of the latest sell-side research interpretations: https://unhidea.com/en/
NVDA+1.38%
MSUS-3.94%
102
·
--
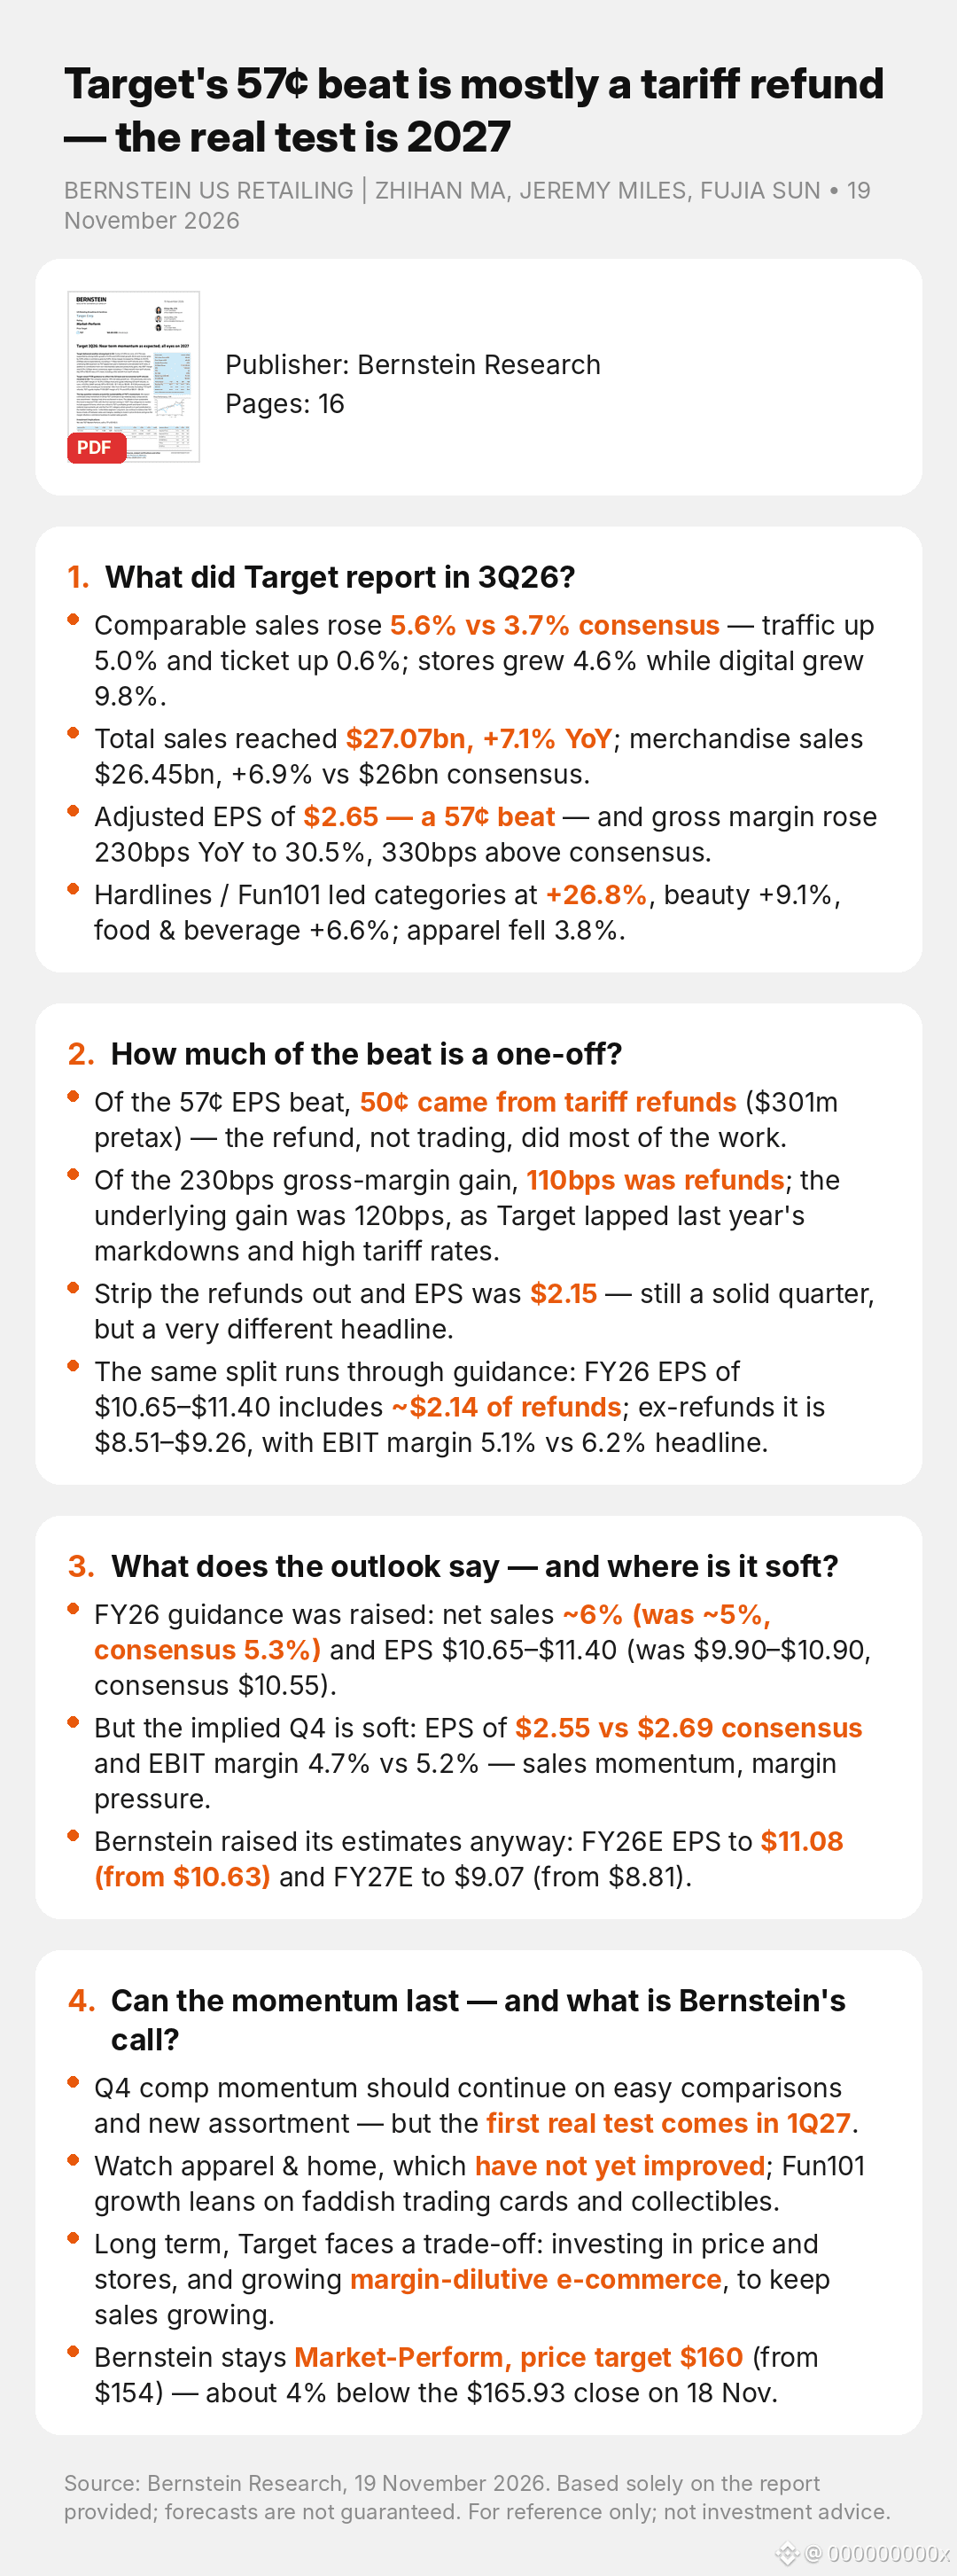
Article
Target's 57¢ beat is mostly a tariff refund — the real test is 2027Target's 57¢ beat is mostly a tariff refund — the real test is 2027
$TGT
BERNSTEIN US RETAILING | ZHIHAN MA, JEREMY MILES, FUJIA SUN • 19 November 2026
1. What did Target report in 3Q26?
• Comparable sales rose 5.6% vs 3.7% consensus — traffic up 5.0% and ticket up 0.6%; stores grew 4.6% while digital grew 9.8%.
• Total sales reached $27.07bn, +7.1% YoY; merchandise sales $26.45bn, +6.9% vs $26bn consensus.
• Adjusted EPS of $2.65 — a 57¢ beat — and gross margin rose 230bps YoY to 30.5%, 330bps above consensus.
• Hardlines / Fun101 led categories at +26.8%, beauty +9.1%, food & beverage +6.6%; apparel fell 3.8%.
2. How much of the beat is a one-off?
• Of the 57¢ EPS beat, 50¢ came from tariff refunds ($301m pretax) — the refund, not trading, did most of the work.
• Of the 230bps gross-margin gain, 110bps was refunds; the underlying gain was 120bps, as Target lapped last year's markdowns and high tariff rates.
• Strip the refunds out and EPS was $2.15 — still a solid quarter, but a very different headline.
• The same split runs through guidance: FY26 EPS of $10.65–$11.40 includes ~$2.14 of refunds; ex-refunds it is $8.51–$9.26, with EBIT margin 5.1% vs 6.2% headline.
3. What does the outlook say — and where is it soft?
• FY26 guidance was raised: net sales ~6% (was ~5%, consensus 5.3%) and EPS $10.65–$11.40 (was $9.90–$10.90, consensus $10.55).
• But the implied Q4 is soft: EPS of $2.55 vs $2.69 consensus and EBIT margin 4.7% vs 5.2% — sales momentum, margin pressure.
• Bernstein raised its estimates anyway: FY26E EPS to $11.08 (from $10.63) and FY27E to $9.07 (from $8.81).
4. Can the momentum last — and what is Bernstein's call?
• Q4 comp momentum should continue on easy comparisons and new assortment — but the first real test comes in 1Q27.
• Watch apparel & home, which have not yet improved; Fun101 growth leans on faddish trading cards and collectibles.
• Long term, Target faces a trade-off: investing in price and stores, and growing margin-dilutive e-commerce, to keep sales growing.
• Bernstein stays Market-Perform, price target $160 (from $154) — about 4% below the $165.93 close on 18 Nov.
Since the report: shares rose 4% on 18 Nov to $165.93; $167.46 on 19 Nov; $165.83 at the 20 Nov close (Finnhub).
#Target #Retail #Earnings #Consumer #Tariffs
Source: Bernstein Research, 19 November 2026. Research summary for reference only; forecasts are not guaranteed. Not investment advice.
Target's 57¢ beat is mostly a tariff refund — the real test is 2027
Target's 57¢ beat is mostly a tariff refund — the real test is 2027
$TGT
BERNSTEIN US RETAILING | ZHIHAN MA, JEREMY MILES, FUJIA SUN • 19 November 2026
1. What did Target report in 3Q26?
• Comparable sales rose 5.6% vs 3.7% consensus — traffic up 5.0% and ticket up 0.6%; stores grew 4.6% while digital grew 9.8%.
• Total sales reached $27.07bn, +7.1% YoY; merchandise sales $26.45bn, +6.9% vs $26bn consensus.
• Adjusted EPS of $2.65 — a 57¢ beat — and gross margin rose 230bps YoY to 30.5%, 330bps above consensus.
• Hardlines / Fun101 led categories at +26.8%, beauty +9.1%, food & beverage +6.6%; apparel fell 3.8%.
2. How much of the beat is a one-off?
• Of the 57¢ EPS beat, 50¢ came from tariff refunds ($301m pretax) — the refund, not trading, did most of the work.
• Of the 230bps gross-margin gain, 110bps was refunds; the underlying gain was 120bps, as Target lapped last year's markdowns and high tariff rates.
• Strip the refunds out and EPS was $2.15 — still a solid quarter, but a very different headline.
• The same split runs through guidance: FY26 EPS of $10.65–$11.40 includes ~$2.14 of refunds; ex-refunds it is $8.51–$9.26, with EBIT margin 5.1% vs 6.2% headline.
3. What does the outlook say — and where is it soft?
• FY26 guidance was raised: net sales ~6% (was ~5%, consensus 5.3%) and EPS $10.65–$11.40 (was $9.90–$10.90, consensus $10.55).
• But the implied Q4 is soft: EPS of $2.55 vs $2.69 consensus and EBIT margin 4.7% vs 5.2% — sales momentum, margin pressure.
• Bernstein raised its estimates anyway: FY26E EPS to $11.08 (from $10.63) and FY27E to $9.07 (from $8.81).
4. Can the momentum last — and what is Bernstein's call?
• Q4 comp momentum should continue on easy comparisons and new assortment — but the first real test comes in 1Q27.
• Watch apparel & home, which have not yet improved; Fun101 growth leans on faddish trading cards and collectibles.
• Long term, Target faces a trade-off: investing in price and stores, and growing margin-dilutive e-commerce, to keep sales growing.
• Bernstein stays Market-Perform, price target $160 (from $154) — about 4% below the $165.93 close on 18 Nov.
Since the report: shares rose 4% on 18 Nov to $165.93; $167.46 on 19 Nov; $165.83 at the 20 Nov close (Finnhub).
#Target #Retail #Earnings #Consumer #Tariffs
Source: Bernstein Research, 19 November 2026. Research summary for reference only; forecasts are not guaranteed. Not investment advice.
$TGT
BERNSTEIN US RETAILING | ZHIHAN MA, JEREMY MILES, FUJIA SUN • 19 November 2026
1. What did Target report in 3Q26?
• Comparable sales rose 5.6% vs 3.7% consensus — traffic up 5.0% and ticket up 0.6%; stores grew 4.6% while digital grew 9.8%.
• Total sales reached $27.07bn, +7.1% YoY; merchandise sales $26.45bn, +6.9% vs $26bn consensus.
• Adjusted EPS of $2.65 — a 57¢ beat — and gross margin rose 230bps YoY to 30.5%, 330bps above consensus.
• Hardlines / Fun101 led categories at +26.8%, beauty +9.1%, food & beverage +6.6%; apparel fell 3.8%.
2. How much of the beat is a one-off?
• Of the 57¢ EPS beat, 50¢ came from tariff refunds ($301m pretax) — the refund, not trading, did most of the work.
• Of the 230bps gross-margin gain, 110bps was refunds; the underlying gain was 120bps, as Target lapped last year's markdowns and high tariff rates.
• Strip the refunds out and EPS was $2.15 — still a solid quarter, but a very different headline.
• The same split runs through guidance: FY26 EPS of $10.65–$11.40 includes ~$2.14 of refunds; ex-refunds it is $8.51–$9.26, with EBIT margin 5.1% vs 6.2% headline.
3. What does the outlook say — and where is it soft?
• FY26 guidance was raised: net sales ~6% (was ~5%, consensus 5.3%) and EPS $10.65–$11.40 (was $9.90–$10.90, consensus $10.55).
• But the implied Q4 is soft: EPS of $2.55 vs $2.69 consensus and EBIT margin 4.7% vs 5.2% — sales momentum, margin pressure.
• Bernstein raised its estimates anyway: FY26E EPS to $11.08 (from $10.63) and FY27E to $9.07 (from $8.81).
4. Can the momentum last — and what is Bernstein's call?
• Q4 comp momentum should continue on easy comparisons and new assortment — but the first real test comes in 1Q27.
• Watch apparel & home, which have not yet improved; Fun101 growth leans on faddish trading cards and collectibles.
• Long term, Target faces a trade-off: investing in price and stores, and growing margin-dilutive e-commerce, to keep sales growing.
• Bernstein stays Market-Perform, price target $160 (from $154) — about 4% below the $165.93 close on 18 Nov.
Since the report: shares rose 4% on 18 Nov to $165.93; $167.46 on 19 Nov; $165.83 at the 20 Nov close (Finnhub).
#Target #Retail #Earnings #Consumer #Tariffs
Source: Bernstein Research, 19 November 2026. Research summary for reference only; forecasts are not guaranteed. Not investment advice.
39
·
--
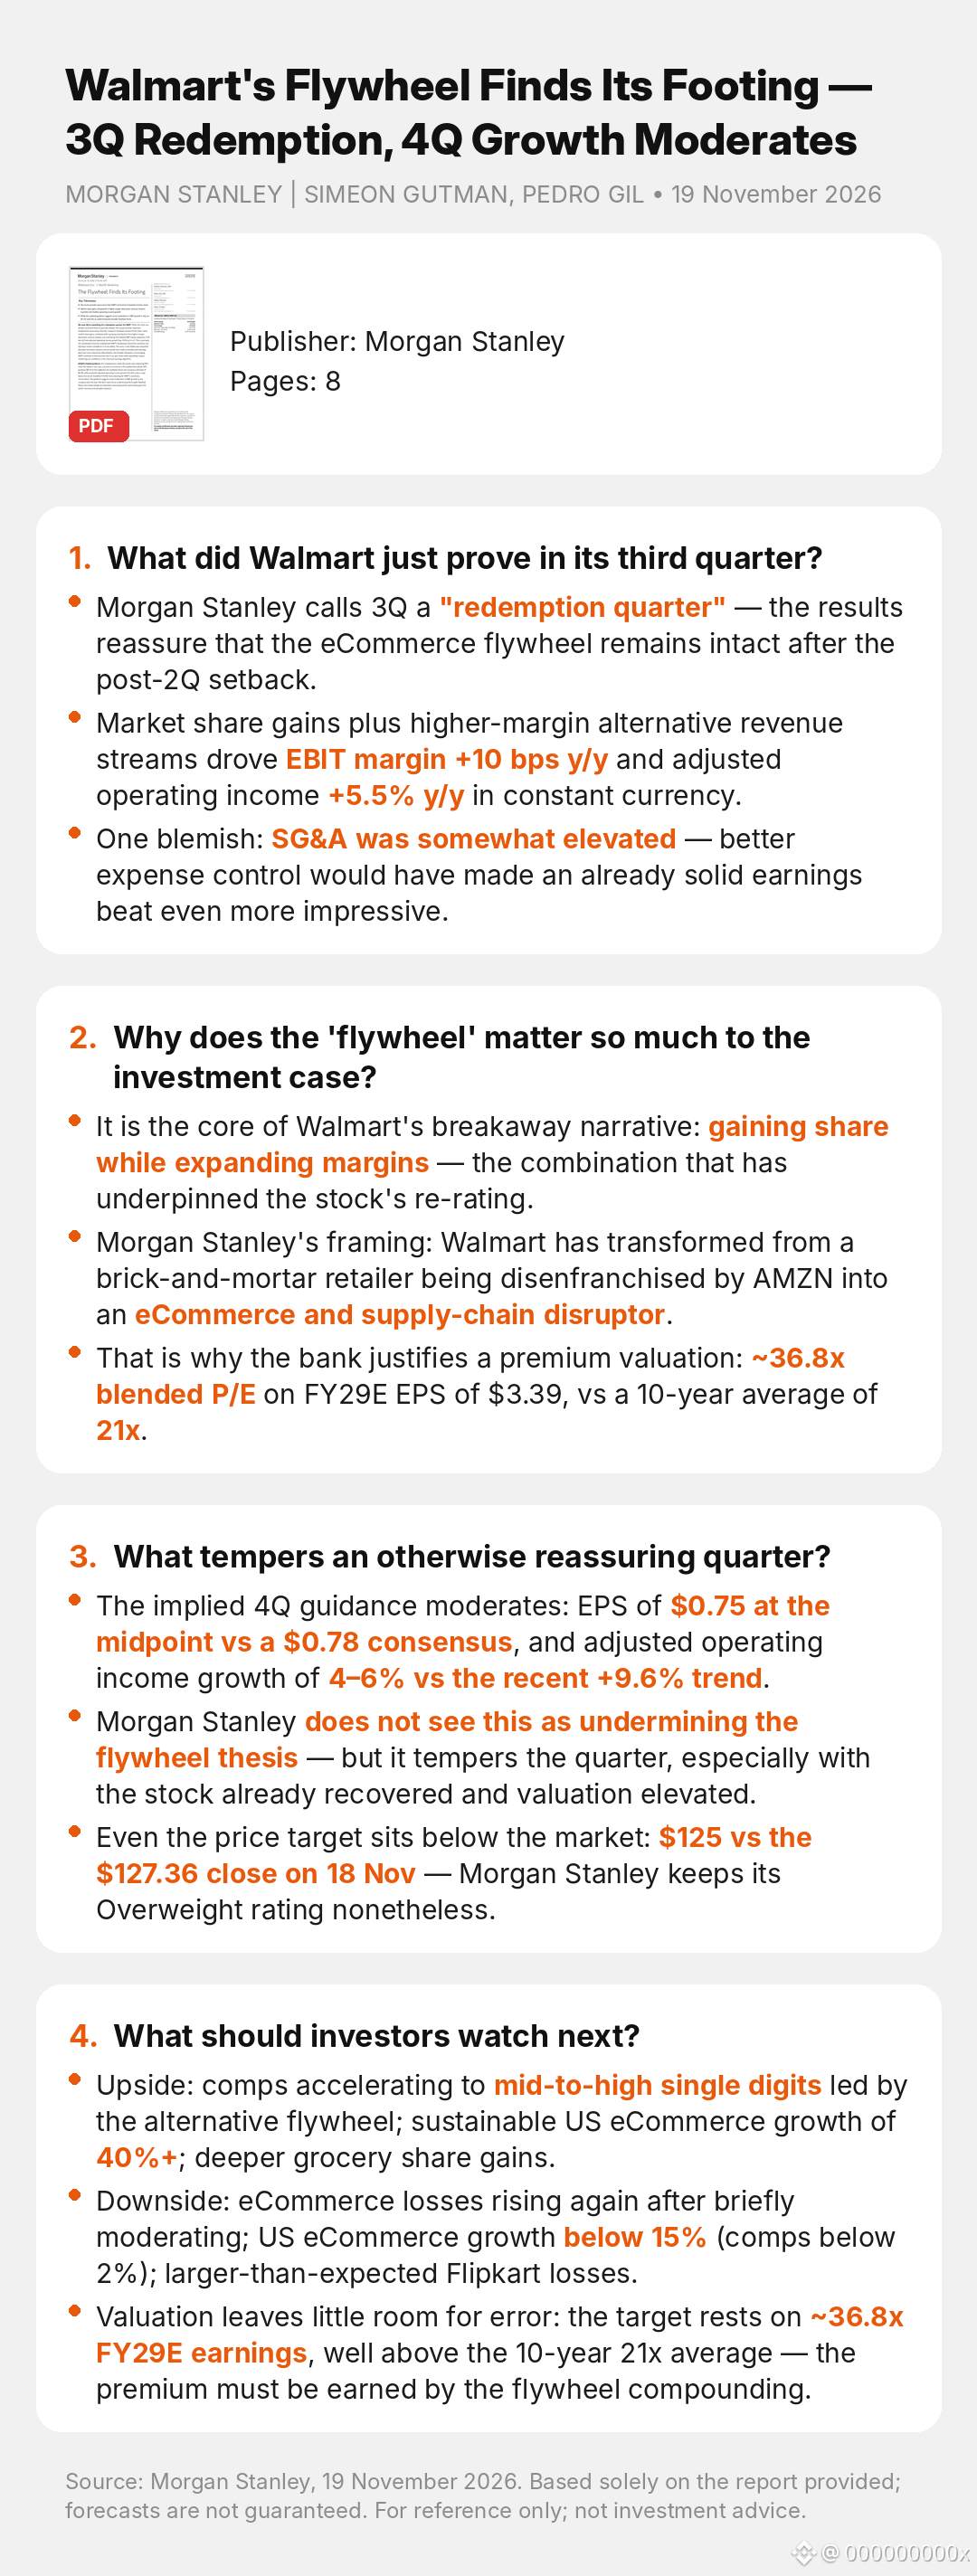
Article
Walmart's Flywheel Finds Its Footing — 3Q Redemption, 4Q Growth ModeratesWalmart's Flywheel Finds Its Footing — 3Q Redemption, 4Q Growth Moderates
$WMT
MORGAN STANLEY | SIMEON GUTMAN, PEDRO GIL • 19 November 2026
1. What did Walmart just prove in its third quarter?
• Morgan Stanley calls 3Q a "redemption quarter" — the results reassure that the eCommerce flywheel remains intact after the post-2Q setback.
• Market share gains plus higher-margin alternative revenue streams drove EBIT margin +10 bps y/y and adjusted operating income +5.5% y/y in constant currency.
• One blemish: SG&A was somewhat elevated — better expense control would have made an already solid earnings beat even more impressive.
2. Why does the 'flywheel' matter so much to the investment case?
• It is the core of Walmart's breakaway narrative: gaining share while expanding margins — the combination that has underpinned the stock's re-rating.
• Morgan Stanley's framing: Walmart has transformed from a brick-and-mortar retailer being disenfranchised by AMZN into an eCommerce and supply-chain disruptor.
• That is why the bank justifies a premium valuation: ~36.8x blended P/E on FY29E EPS of $3.39, vs a 10-year average of 21x.
3. What tempers an otherwise reassuring quarter?
• The implied 4Q guidance moderates: EPS of $0.75 at the midpoint vs a $0.78 consensus, and adjusted operating income growth of 4–6% vs the recent +9.6% trend.
• Morgan Stanley does not see this as undermining the flywheel thesis — but it tempers the quarter, especially with the stock already recovered and valuation elevated.
• Even the price target sits below the market: $125 vs the $127.36 close on 18 Nov — Morgan Stanley keeps its Overweight rating nonetheless.
4. What should investors watch next?
• Upside: comps accelerating to mid-to-high single digits led by the alternative flywheel; sustainable US eCommerce growth of 40%+; deeper grocery share gains.
• Downside: eCommerce losses rising again after briefly moderating; US eCommerce growth below 15% (comps below 2%); larger-than-expected Flipkart losses.
• Valuation leaves little room for error: the target rests on ~36.8x FY29E earnings, well above the 10-year 21x average — the premium must be earned by the flywheel compounding.
Update after this report (not in the Morgan Stanley note): Walmart reported 3Q adjusted EPS of $0.65 vs $0.64 expected and revenue of $188.8bn (+5.2%) vs ~$187.3bn expected. Shares fell 1.0% to $126.04 on 19 Nov, then rose ~1.5% to $127.95 on 20 Nov as money rotated out of AI names. Morgan Stanley has since raised its price target to $135 from $125 (Benzinga, 20 Nov).
Source: Morgan Stanley, "The Flywheel Finds Its Footing", 19 November 2026. Based solely on the report provided; forecasts are not guaranteed. For reference only; not investment advice.
#Retail #Earnings #ConsumerStocks #USStocks #Walmart
Walmart's Flywheel Finds Its Footing — 3Q Redemption, 4Q Growth Moderates
Walmart's Flywheel Finds Its Footing — 3Q Redemption, 4Q Growth Moderates
$WMT
MORGAN STANLEY | SIMEON GUTMAN, PEDRO GIL • 19 November 2026
1. What did Walmart just prove in its third quarter?
• Morgan Stanley calls 3Q a "redemption quarter" — the results reassure that the eCommerce flywheel remains intact after the post-2Q setback.
• Market share gains plus higher-margin alternative revenue streams drove EBIT margin +10 bps y/y and adjusted operating income +5.5% y/y in constant currency.
• One blemish: SG&A was somewhat elevated — better expense control would have made an already solid earnings beat even more impressive.
2. Why does the 'flywheel' matter so much to the investment case?
• It is the core of Walmart's breakaway narrative: gaining share while expanding margins — the combination that has underpinned the stock's re-rating.
• Morgan Stanley's framing: Walmart has transformed from a brick-and-mortar retailer being disenfranchised by AMZN into an eCommerce and supply-chain disruptor.
• That is why the bank justifies a premium valuation: ~36.8x blended P/E on FY29E EPS of $3.39, vs a 10-year average of 21x.
3. What tempers an otherwise reassuring quarter?
• The implied 4Q guidance moderates: EPS of $0.75 at the midpoint vs a $0.78 consensus, and adjusted operating income growth of 4–6% vs the recent +9.6% trend.
• Morgan Stanley does not see this as undermining the flywheel thesis — but it tempers the quarter, especially with the stock already recovered and valuation elevated.
• Even the price target sits below the market: $125 vs the $127.36 close on 18 Nov — Morgan Stanley keeps its Overweight rating nonetheless.
4. What should investors watch next?
• Upside: comps accelerating to mid-to-high single digits led by the alternative flywheel; sustainable US eCommerce growth of 40%+; deeper grocery share gains.
• Downside: eCommerce losses rising again after briefly moderating; US eCommerce growth below 15% (comps below 2%); larger-than-expected Flipkart losses.
• Valuation leaves little room for error: the target rests on ~36.8x FY29E earnings, well above the 10-year 21x average — the premium must be earned by the flywheel compounding.
Update after this report (not in the Morgan Stanley note): Walmart reported 3Q adjusted EPS of $0.65 vs $0.64 expected and revenue of $188.8bn (+5.2%) vs ~$187.3bn expected. Shares fell 1.0% to $126.04 on 19 Nov, then rose ~1.5% to $127.95 on 20 Nov as money rotated out of AI names. Morgan Stanley has since raised its price target to $135 from $125 (Benzinga, 20 Nov).
Source: Morgan Stanley, "The Flywheel Finds Its Footing", 19 November 2026. Based solely on the report provided; forecasts are not guaranteed. For reference only; not investment advice.
#Retail #Earnings #ConsumerStocks #USStocks #Walmart
$WMT
MORGAN STANLEY | SIMEON GUTMAN, PEDRO GIL • 19 November 2026
1. What did Walmart just prove in its third quarter?
• Morgan Stanley calls 3Q a "redemption quarter" — the results reassure that the eCommerce flywheel remains intact after the post-2Q setback.
• Market share gains plus higher-margin alternative revenue streams drove EBIT margin +10 bps y/y and adjusted operating income +5.5% y/y in constant currency.
• One blemish: SG&A was somewhat elevated — better expense control would have made an already solid earnings beat even more impressive.
2. Why does the 'flywheel' matter so much to the investment case?
• It is the core of Walmart's breakaway narrative: gaining share while expanding margins — the combination that has underpinned the stock's re-rating.
• Morgan Stanley's framing: Walmart has transformed from a brick-and-mortar retailer being disenfranchised by AMZN into an eCommerce and supply-chain disruptor.
• That is why the bank justifies a premium valuation: ~36.8x blended P/E on FY29E EPS of $3.39, vs a 10-year average of 21x.
3. What tempers an otherwise reassuring quarter?
• The implied 4Q guidance moderates: EPS of $0.75 at the midpoint vs a $0.78 consensus, and adjusted operating income growth of 4–6% vs the recent +9.6% trend.
• Morgan Stanley does not see this as undermining the flywheel thesis — but it tempers the quarter, especially with the stock already recovered and valuation elevated.
• Even the price target sits below the market: $125 vs the $127.36 close on 18 Nov — Morgan Stanley keeps its Overweight rating nonetheless.
4. What should investors watch next?
• Upside: comps accelerating to mid-to-high single digits led by the alternative flywheel; sustainable US eCommerce growth of 40%+; deeper grocery share gains.
• Downside: eCommerce losses rising again after briefly moderating; US eCommerce growth below 15% (comps below 2%); larger-than-expected Flipkart losses.
• Valuation leaves little room for error: the target rests on ~36.8x FY29E earnings, well above the 10-year 21x average — the premium must be earned by the flywheel compounding.
Update after this report (not in the Morgan Stanley note): Walmart reported 3Q adjusted EPS of $0.65 vs $0.64 expected and revenue of $188.8bn (+5.2%) vs ~$187.3bn expected. Shares fell 1.0% to $126.04 on 19 Nov, then rose ~1.5% to $127.95 on 20 Nov as money rotated out of AI names. Morgan Stanley has since raised its price target to $135 from $125 (Benzinga, 20 Nov).
Source: Morgan Stanley, "The Flywheel Finds Its Footing", 19 November 2026. Based solely on the report provided; forecasts are not guaranteed. For reference only; not investment advice.
#Retail #Earnings #ConsumerStocks #USStocks #Walmart
93
·
--
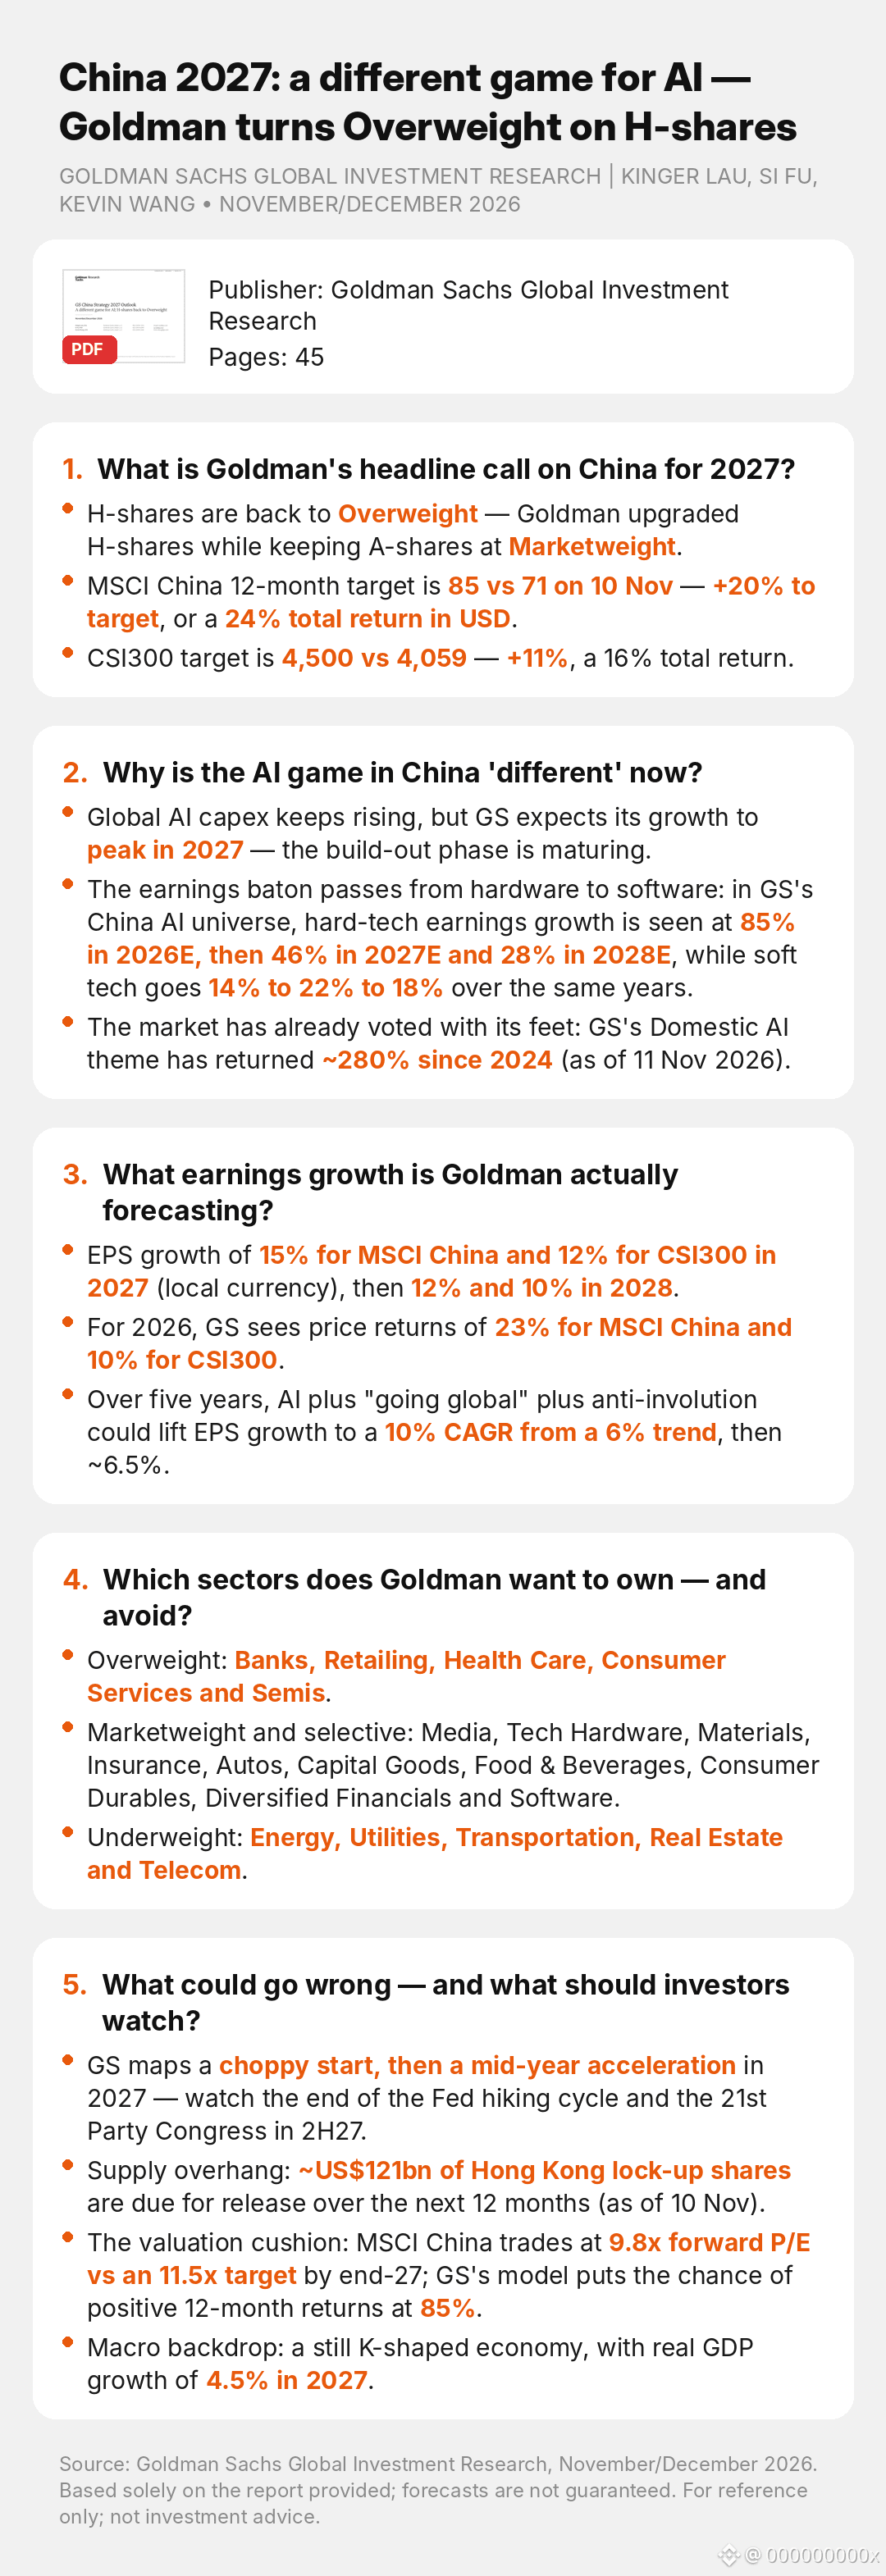
Article
China 2027: a different game for AI — Goldman turns Overweight on H-sharesChina 2027: a different game for AI — Goldman turns Overweight on H-shares
$FXI
Goldman Sachs Global Investment Research | Kinger Lau, Si Fu, Kevin Wang • November/December 2026
1. What is Goldman's headline call on China for 2027?
• H-shares are back to Overweight — Goldman upgraded H-shares while keeping A-shares at Marketweight.
• MSCI China 12-month target is 85 vs 71 on 10 Nov — +20% to target, or a 24% total return in USD.
• CSI300 target is 4,500 vs 4,059 — +11%, a 16% total return.
2. Why is the AI game in China 'different' now?
• Global AI capex keeps rising, but GS expects its growth to peak in 2027 — the build-out phase is maturing.
• The earnings baton passes from hardware to software: in GS's China AI universe, hard-tech earnings growth is seen at 85% in 2026E, then 46% in 2027E and 28% in 2028E, while soft tech goes 14% to 22% to 18% over the same years.
• The market has already voted with its feet: GS's Domestic AI theme has returned ~280% since 2024 (as of 11 Nov 2026).
3. What earnings growth is Goldman actually forecasting?
• EPS growth of 15% for MSCI China and 12% for CSI300 in 2027 (local currency), then 12% and 10% in 2028.
• For 2026, GS sees price returns of 23% for MSCI China and 10% for CSI300.
• Over five years, AI plus "going global" plus anti-involution could lift EPS growth to a 10% CAGR from a 6% trend, then ~6.5%.
4. Which sectors does Goldman want to own — and avoid?
• Overweight: Banks, Retailing, Health Care, Consumer Services and Semis.
• Marketweight and selective: Media, Tech Hardware, Materials, Insurance, Autos, Capital Goods, Food & Beverages, Consumer Durables, Diversified Financials and Software.
• Underweight: Energy, Utilities, Transportation, Real Estate and Telecom.
5. What could go wrong — and what should investors watch?
• GS maps a choppy start, then a mid-year acceleration in 2027 — watch the end of the Fed hiking cycle and the 21st Party Congress in 2H27.
• Supply overhang: ~US$121bn of Hong Kong lock-up shares are due for release over the next 12 months (as of 10 Nov).
• The valuation cushion: MSCI China trades at 9.8x forward P/E vs an 11.5x target by end-27; GS's model puts the chance of positive 12-month returns at 85%.
• Macro backdrop: a still K-shaped economy, with real GDP growth of 4.5% in 2027.
Source: Goldman Sachs, "GS China Strategy 2027 Outlook", 20 November 2026. Based solely on the report provided; forecasts are not guaranteed. For reference only; not investment advice.
#ChinaStocks #AI #HSI #EmergingMarkets #GoldmanSachs
China 2027: a different game for AI — Goldman turns Overweight on H-shares
China 2027: a different game for AI — Goldman turns Overweight on H-shares
$FXI
Goldman Sachs Global Investment Research | Kinger Lau, Si Fu, Kevin Wang • November/December 2026
1. What is Goldman's headline call on China for 2027?
• H-shares are back to Overweight — Goldman upgraded H-shares while keeping A-shares at Marketweight.
• MSCI China 12-month target is 85 vs 71 on 10 Nov — +20% to target, or a 24% total return in USD.
• CSI300 target is 4,500 vs 4,059 — +11%, a 16% total return.
2. Why is the AI game in China 'different' now?
• Global AI capex keeps rising, but GS expects its growth to peak in 2027 — the build-out phase is maturing.
• The earnings baton passes from hardware to software: in GS's China AI universe, hard-tech earnings growth is seen at 85% in 2026E, then 46% in 2027E and 28% in 2028E, while soft tech goes 14% to 22% to 18% over the same years.
• The market has already voted with its feet: GS's Domestic AI theme has returned ~280% since 2024 (as of 11 Nov 2026).
3. What earnings growth is Goldman actually forecasting?
• EPS growth of 15% for MSCI China and 12% for CSI300 in 2027 (local currency), then 12% and 10% in 2028.
• For 2026, GS sees price returns of 23% for MSCI China and 10% for CSI300.
• Over five years, AI plus "going global" plus anti-involution could lift EPS growth to a 10% CAGR from a 6% trend, then ~6.5%.
4. Which sectors does Goldman want to own — and avoid?
• Overweight: Banks, Retailing, Health Care, Consumer Services and Semis.
• Marketweight and selective: Media, Tech Hardware, Materials, Insurance, Autos, Capital Goods, Food & Beverages, Consumer Durables, Diversified Financials and Software.
• Underweight: Energy, Utilities, Transportation, Real Estate and Telecom.
5. What could go wrong — and what should investors watch?
• GS maps a choppy start, then a mid-year acceleration in 2027 — watch the end of the Fed hiking cycle and the 21st Party Congress in 2H27.
• Supply overhang: ~US$121bn of Hong Kong lock-up shares are due for release over the next 12 months (as of 10 Nov).
• The valuation cushion: MSCI China trades at 9.8x forward P/E vs an 11.5x target by end-27; GS's model puts the chance of positive 12-month returns at 85%.
• Macro backdrop: a still K-shaped economy, with real GDP growth of 4.5% in 2027.
Source: Goldman Sachs, "GS China Strategy 2027 Outlook", 20 November 2026. Based solely on the report provided; forecasts are not guaranteed. For reference only; not investment advice.
#ChinaStocks #AI #HSI #EmergingMarkets #GoldmanSachs
$FXI
Goldman Sachs Global Investment Research | Kinger Lau, Si Fu, Kevin Wang • November/December 2026
1. What is Goldman's headline call on China for 2027?
• H-shares are back to Overweight — Goldman upgraded H-shares while keeping A-shares at Marketweight.
• MSCI China 12-month target is 85 vs 71 on 10 Nov — +20% to target, or a 24% total return in USD.
• CSI300 target is 4,500 vs 4,059 — +11%, a 16% total return.
2. Why is the AI game in China 'different' now?
• Global AI capex keeps rising, but GS expects its growth to peak in 2027 — the build-out phase is maturing.
• The earnings baton passes from hardware to software: in GS's China AI universe, hard-tech earnings growth is seen at 85% in 2026E, then 46% in 2027E and 28% in 2028E, while soft tech goes 14% to 22% to 18% over the same years.
• The market has already voted with its feet: GS's Domestic AI theme has returned ~280% since 2024 (as of 11 Nov 2026).
3. What earnings growth is Goldman actually forecasting?
• EPS growth of 15% for MSCI China and 12% for CSI300 in 2027 (local currency), then 12% and 10% in 2028.
• For 2026, GS sees price returns of 23% for MSCI China and 10% for CSI300.
• Over five years, AI plus "going global" plus anti-involution could lift EPS growth to a 10% CAGR from a 6% trend, then ~6.5%.
4. Which sectors does Goldman want to own — and avoid?
• Overweight: Banks, Retailing, Health Care, Consumer Services and Semis.
• Marketweight and selective: Media, Tech Hardware, Materials, Insurance, Autos, Capital Goods, Food & Beverages, Consumer Durables, Diversified Financials and Software.
• Underweight: Energy, Utilities, Transportation, Real Estate and Telecom.
5. What could go wrong — and what should investors watch?
• GS maps a choppy start, then a mid-year acceleration in 2027 — watch the end of the Fed hiking cycle and the 21st Party Congress in 2H27.
• Supply overhang: ~US$121bn of Hong Kong lock-up shares are due for release over the next 12 months (as of 10 Nov).
• The valuation cushion: MSCI China trades at 9.8x forward P/E vs an 11.5x target by end-27; GS's model puts the chance of positive 12-month returns at 85%.
• Macro backdrop: a still K-shaped economy, with real GDP growth of 4.5% in 2027.
Source: Goldman Sachs, "GS China Strategy 2027 Outlook", 20 November 2026. Based solely on the report provided; forecasts are not guaranteed. For reference only; not investment advice.
#ChinaStocks #AI #HSI #EmergingMarkets #GoldmanSachs
FXIETF-1.46%
85
·
--
$KBE: global banks beat the world by 4.9pts since October — and HSBC stays positive on US banks.
- HSBC, 20 Nov: global banks +2.2% vs FTSE All-World −2.7% since its October edition; ~1% ahead YTD as yields normalised from their October peak.
- US banks stay Positive: solid fundamentals, regulatory tailwinds for capital returns, Basel III endgame due by year-end. Risk-reward "more attractive after recent underperformance".
- India raised to Positive — best performers since October; EPS downgrades have ended, rate hikes support NIM. South Korea stays Positive on AI-capex demand.
- HK and Singapore cut to Neutral; Turkey raised to Positive; Brazil preferred after a sharp de-rating.
- The Q3 lesson: deposit beta. Funding costs repriced ahead of asset yields, squeezing NIM; median deposit mix is 40% time / 60% sight.
Unhidea take: a recovery, not a re-rating — banks won because yields normalised. The trade is country selection, not the sector.
Unhidea take: watch deposit beta, not just rates. Where deposits reprice fast, higher rates help banks less.
Post-report, 20 Nov: S&P 500 −3.8%, Nasdaq −5.1%.
Risks: fiscal consolidation (HSBC's main 2027 risk), deposit-cost pressure, AI-spending worries.
Source: HSBC, 20 Nov 2026. Not financial advice.
$KBE: global banks beat the world by 4.9pts since October — and HSBC stays positive on US banks.
- HSBC, 20 Nov: global banks +2.2% vs FTSE All-World −2.7% since its October edition; ~1% ahead YTD as yields normalised from their October peak.
- US banks stay Positive: solid fundamentals, regulatory tailwinds for capital returns, Basel III endgame due by year-end. Risk-reward "more attractive after recent underperformance".
- India raised to Positive — best performers since October; EPS downgrades have ended, rate hikes support NIM. South Korea stays Positive on AI-capex demand.
- HK and Singapore cut to Neutral; Turkey raised to Positive; Brazil preferred after a sharp de-rating.
- The Q3 lesson: deposit beta. Funding costs repriced ahead of asset yields, squeezing NIM; median deposit mix is 40% time / 60% sight.
Unhidea take: a recovery, not a re-rating — banks won because yields normalised. The trade is country selection, not the sector.
Unhidea take: watch deposit beta, not just rates. Where deposits reprice fast, higher rates help banks less.
Post-report, 20 Nov: S&P 500 −3.8%, Nasdaq −5.1%.
Risks: fiscal consolidation (HSBC's main 2027 risk), deposit-cost pressure, AI-spending worries.
Source: HSBC, 20 Nov 2026. Not financial advice.
- HSBC, 20 Nov: global banks +2.2% vs FTSE All-World −2.7% since its October edition; ~1% ahead YTD as yields normalised from their October peak.
- US banks stay Positive: solid fundamentals, regulatory tailwinds for capital returns, Basel III endgame due by year-end. Risk-reward "more attractive after recent underperformance".
- India raised to Positive — best performers since October; EPS downgrades have ended, rate hikes support NIM. South Korea stays Positive on AI-capex demand.
- HK and Singapore cut to Neutral; Turkey raised to Positive; Brazil preferred after a sharp de-rating.
- The Q3 lesson: deposit beta. Funding costs repriced ahead of asset yields, squeezing NIM; median deposit mix is 40% time / 60% sight.
Unhidea take: a recovery, not a re-rating — banks won because yields normalised. The trade is country selection, not the sector.
Unhidea take: watch deposit beta, not just rates. Where deposits reprice fast, higher rates help banks less.
Post-report, 20 Nov: S&P 500 −3.8%, Nasdaq −5.1%.
Risks: fiscal consolidation (HSBC's main 2027 risk), deposit-cost pressure, AI-spending worries.
Source: HSBC, 20 Nov 2026. Not financial advice.
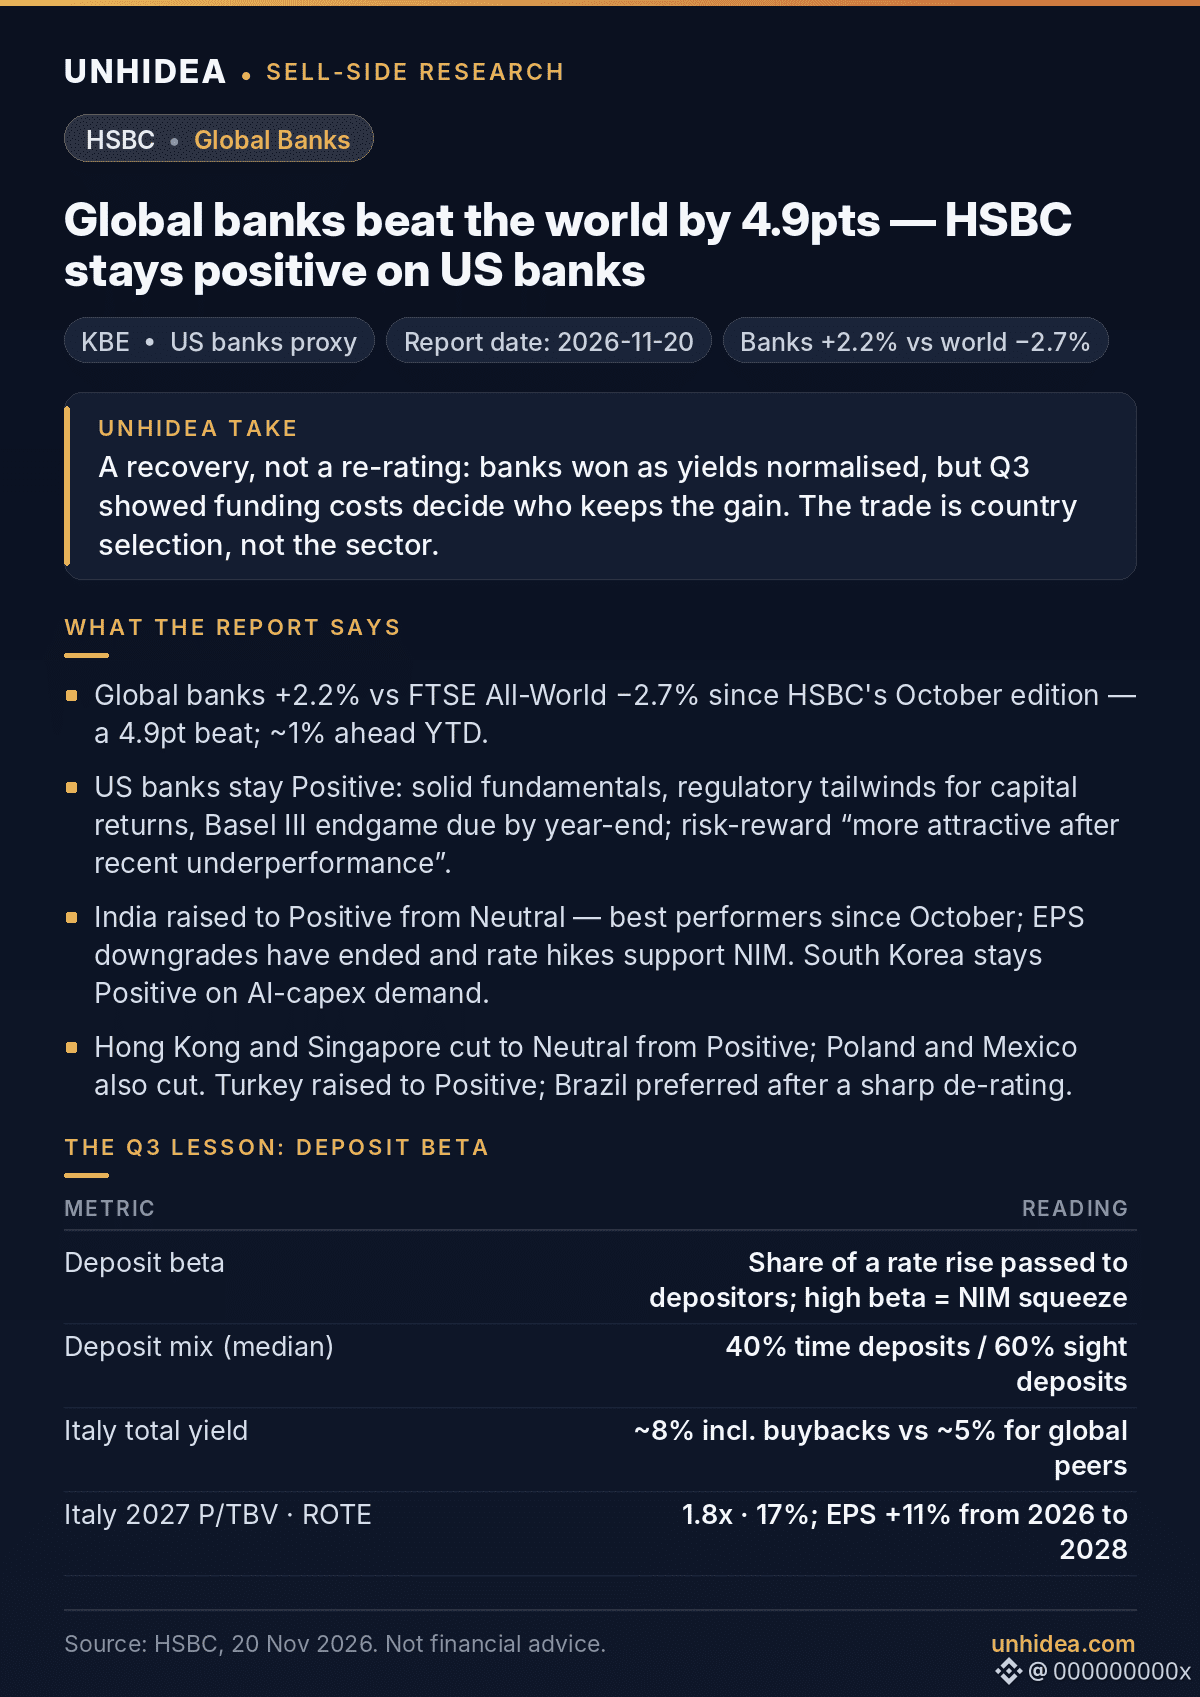
HSBCUS-3.62%
KBEETF-0.72%
·
--
Partly True
$QQQ: mutual funds were underweight AI before Friday's rout — and it is paying off.
- Goldman Sachs, 19 Nov: the average large-cap fund was 130bp underweight AI-exposed stocks ex-mega-caps (12% weight vs benchmark), narrowed from 175bp in Q2. Including mega-caps: 34% vs a 40% benchmark weight.
- Mag7: funds were 722bp underweight at end-Q3, flat on the quarter. AMZN is the only Mag7 overweight — the first since 2016. Most funds cut GOOGL and AAPL the most.
- In Q3 funds added AI infra (AMD, WDC, STX, SNDK) and software (PLTR, SNOW, TWLO, PANW, CRWD), and cut semi-equipment (AMAT, LRCX, KLAC).
- 42% of large-cap funds are beating benchmarks YTD vs a 37% historical average; growth funds 81% — the highest in over a decade. Value funds returned +14% YTD but only 4% beat.
- Cash sits at 1.1% of assets, matching the December 2025 record low. Active funds saw ~$350bn of outflows YTD, on track for a 12th straight year, vs ~$960bn into US equity ETFs.
Unhidea take: selectivity, not timing, is doing the work — the funds beating their benchmarks didn't dodge AI, they picked infra and software and skipped equipment.
Unhidea take: cash at a record low means no dry powder for the dip. The marginal buyer is ETF flow — ~$210bn into US equity ETFs since Q4 began.
Post-report market data, 20 Nov: Nasdaq -5.28%, S&P 500 -3.7%; NVDA -14%, AMD -13%.
Risks: AI capex slowdown, Mag7 concentration, ETF flows reversing, narrow breadth.
Source: Goldman Sachs, 19 Nov 2026. Not financial advice.
$QQQ : mutual funds were underweight AI before Friday's rout — and it is paying off.
- Goldman Sachs, 19 Nov: the average large-cap fund was 130bp underweight AI-exposed stocks ex-mega-caps (12% weight vs benchmark), narrowed from 175bp in Q2. Including mega-caps: 34% vs a 40% benchmark weight.
- Mag7: funds were 722bp underweight at end-Q3, flat on the quarter. AMZN is the only Mag7 overweight — the first since 2016. Most funds cut GOOGL and AAPL the most.
- In Q3 funds added AI infra (AMD, WDC, STX, SNDK) and software (PLTR, SNOW, TWLO, PANW, CRWD), and cut semi-equipment (AMAT, LRCX, KLAC).
- 42% of large-cap funds are beating benchmarks YTD vs a 37% historical average; growth funds 81% — the highest in over a decade. Value funds returned +14% YTD but only 4% beat.
- Cash sits at 1.1% of assets, matching the December 2025 record low. Active funds saw ~$350bn of outflows YTD, on track for a 12th straight year, vs ~$960bn into US equity ETFs.
Unhidea take: selectivity, not timing, is doing the work — the funds beating their benchmarks didn't dodge AI, they picked infra and software and skipped equipment.
Unhidea take: cash at a record low means no dry powder for the dip. The marginal buyer is ETF flow — ~$210bn into US equity ETFs since Q4 began.
Post-report market data, 20 Nov: Nasdaq -5.28%, S&P 500 -3.7%; NVDA -14%, AMD -13%.
Risks: AI capex slowdown, Mag7 concentration, ETF flows reversing, narrow breadth.
Source: Goldman Sachs, 19 Nov 2026. Not financial advice.
- Goldman Sachs, 19 Nov: the average large-cap fund was 130bp underweight AI-exposed stocks ex-mega-caps (12% weight vs benchmark), narrowed from 175bp in Q2. Including mega-caps: 34% vs a 40% benchmark weight.
- Mag7: funds were 722bp underweight at end-Q3, flat on the quarter. AMZN is the only Mag7 overweight — the first since 2016. Most funds cut GOOGL and AAPL the most.
- In Q3 funds added AI infra (AMD, WDC, STX, SNDK) and software (PLTR, SNOW, TWLO, PANW, CRWD), and cut semi-equipment (AMAT, LRCX, KLAC).
- 42% of large-cap funds are beating benchmarks YTD vs a 37% historical average; growth funds 81% — the highest in over a decade. Value funds returned +14% YTD but only 4% beat.
- Cash sits at 1.1% of assets, matching the December 2025 record low. Active funds saw ~$350bn of outflows YTD, on track for a 12th straight year, vs ~$960bn into US equity ETFs.
Unhidea take: selectivity, not timing, is doing the work — the funds beating their benchmarks didn't dodge AI, they picked infra and software and skipped equipment.
Unhidea take: cash at a record low means no dry powder for the dip. The marginal buyer is ETF flow — ~$210bn into US equity ETFs since Q4 began.
Post-report market data, 20 Nov: Nasdaq -5.28%, S&P 500 -3.7%; NVDA -14%, AMD -13%.
Risks: AI capex slowdown, Mag7 concentration, ETF flows reversing, narrow breadth.
Source: Goldman Sachs, 19 Nov 2026. Not financial advice.
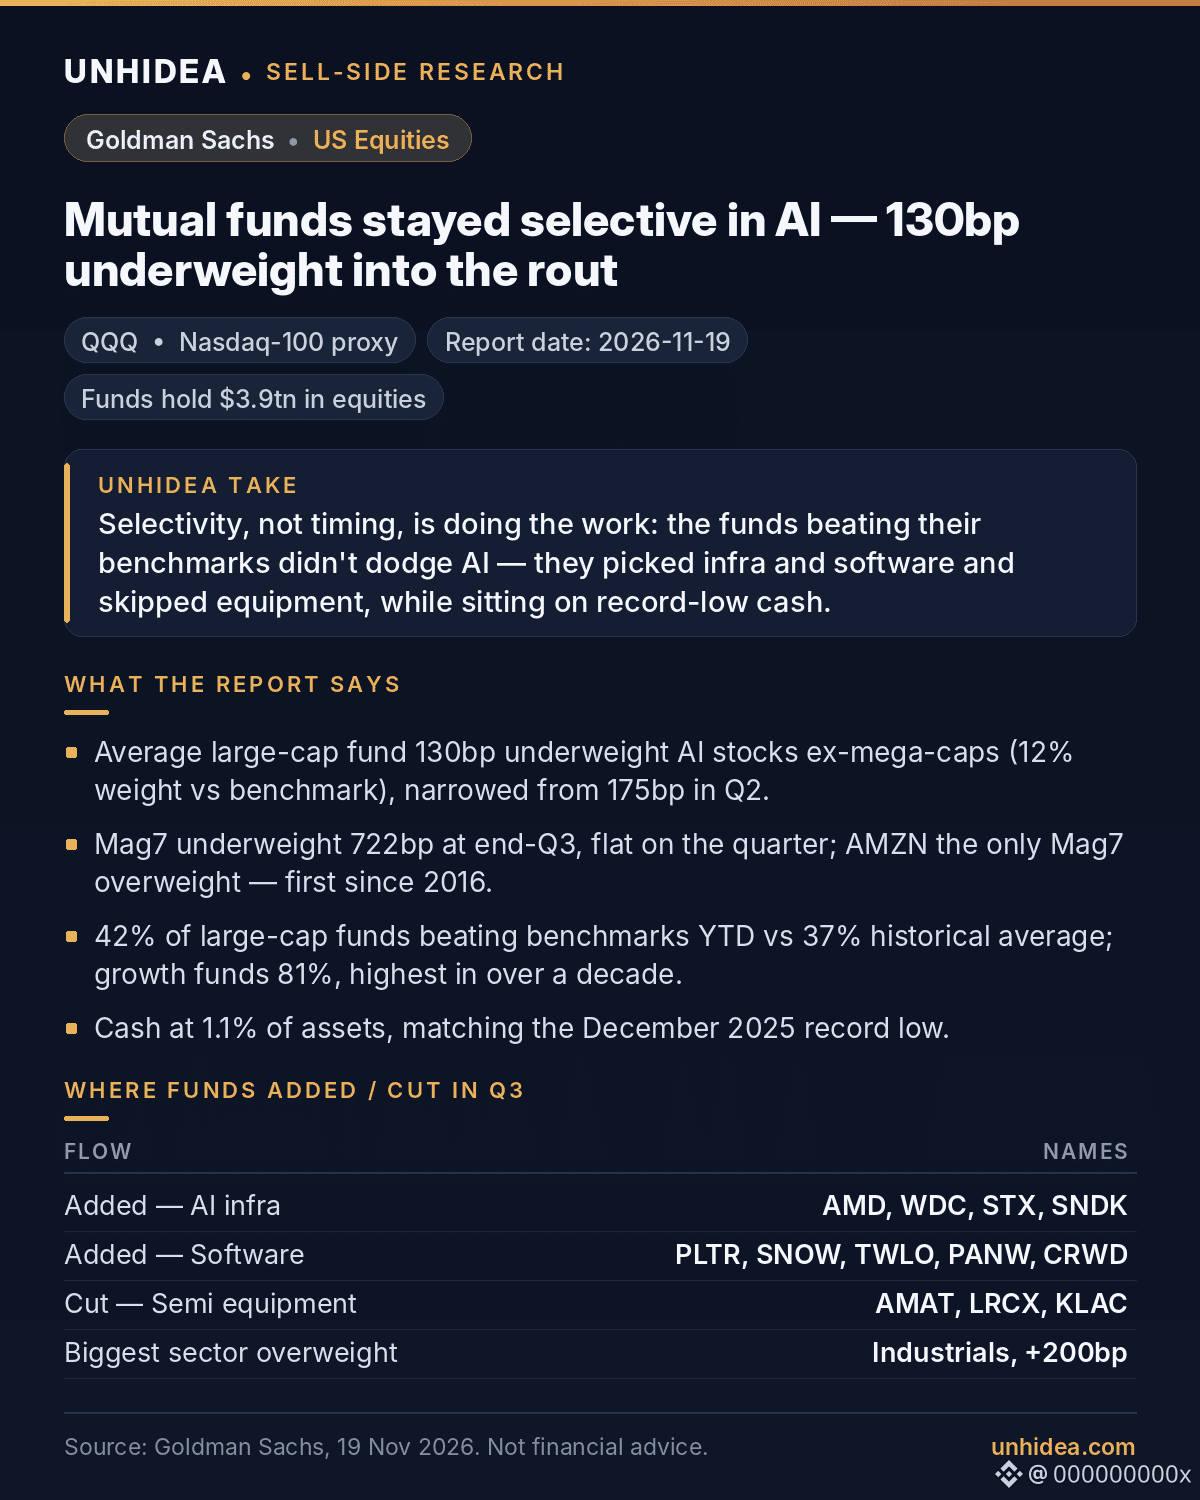
113
·
--
$LPLA: Goldman Sachs keeps Buy, $400 target (~13x forward P/E) after October metrics — steady, not spectacular.
- Net new assets $7.0bn in October, a 3.3% annualized organic growth rate — in line with the ~3% flagged at earnings. Weaker than recent months on one large attrition item, reversing August's big win.
- Advisory NNA ~$8.2bn; brokerage saw ~$1.2bn of net outflows — the mix keeps shifting toward recurring-fee assets.
- Total client assets $2.561tn, flat m/m, +9% y/y. Net buying activity was $12.6bn in October.
- Client cash $55.9bn (2.2% of assets), down from $56.6bn in September — a $2.6bn drag from quarterly fee billings. Ex-billings, cash grew +$1.9bn (+3% m/m).
Unhidea take: the NNA softness is one attrition item, already flagged — the cleaner signal is advisory +$8.2bn. Cash is the quiet positive: balances rebuilt 3% ex-billings while clients bought $12.6bn net.
Unhidea take: $400 is ~13x forward P/E — GS is paying for flows, not a re-rating. If organic growth slips below 3%, the multiple compresses first.
Risks: lower rates, softer organic growth, slower cash-balance growth, weaker equity markets.
Source: Goldman Sachs, 19 Nov 2026. Not financial advice.
$LPLA: Goldman Sachs keeps Buy, $400 target (~13x forward P/E) after October metrics — steady, not spectacular.
- Net new assets $7.0bn in October, a 3.3% annualized organic growth rate — in line with the ~3% flagged at earnings. Weaker than recent months on one large attrition item, reversing August's big win.
- Advisory NNA ~$8.2bn; brokerage saw ~$1.2bn of net outflows — the mix keeps shifting toward recurring-fee assets.
- Total client assets $2.561tn, flat m/m, +9% y/y. Net buying activity was $12.6bn in October.
- Client cash $55.9bn (2.2% of assets), down from $56.6bn in September — a $2.6bn drag from quarterly fee billings. Ex-billings, cash grew +$1.9bn (+3% m/m).
Unhidea take: the NNA softness is one attrition item, already flagged — the cleaner signal is advisory +$8.2bn. Cash is the quiet positive: balances rebuilt 3% ex-billings while clients bought $12.6bn net.
Unhidea take: $400 is ~13x forward P/E — GS is paying for flows, not a re-rating. If organic growth slips below 3%, the multiple compresses first.
Risks: lower rates, softer organic growth, slower cash-balance growth, weaker equity markets.
Source: Goldman Sachs, 19 Nov 2026. Not financial advice.
- Net new assets $7.0bn in October, a 3.3% annualized organic growth rate — in line with the ~3% flagged at earnings. Weaker than recent months on one large attrition item, reversing August's big win.
- Advisory NNA ~$8.2bn; brokerage saw ~$1.2bn of net outflows — the mix keeps shifting toward recurring-fee assets.
- Total client assets $2.561tn, flat m/m, +9% y/y. Net buying activity was $12.6bn in October.
- Client cash $55.9bn (2.2% of assets), down from $56.6bn in September — a $2.6bn drag from quarterly fee billings. Ex-billings, cash grew +$1.9bn (+3% m/m).
Unhidea take: the NNA softness is one attrition item, already flagged — the cleaner signal is advisory +$8.2bn. Cash is the quiet positive: balances rebuilt 3% ex-billings while clients bought $12.6bn net.
Unhidea take: $400 is ~13x forward P/E — GS is paying for flows, not a re-rating. If organic growth slips below 3%, the multiple compresses first.
Risks: lower rates, softer organic growth, slower cash-balance growth, weaker equity markets.
Source: Goldman Sachs, 19 Nov 2026. Not financial advice.
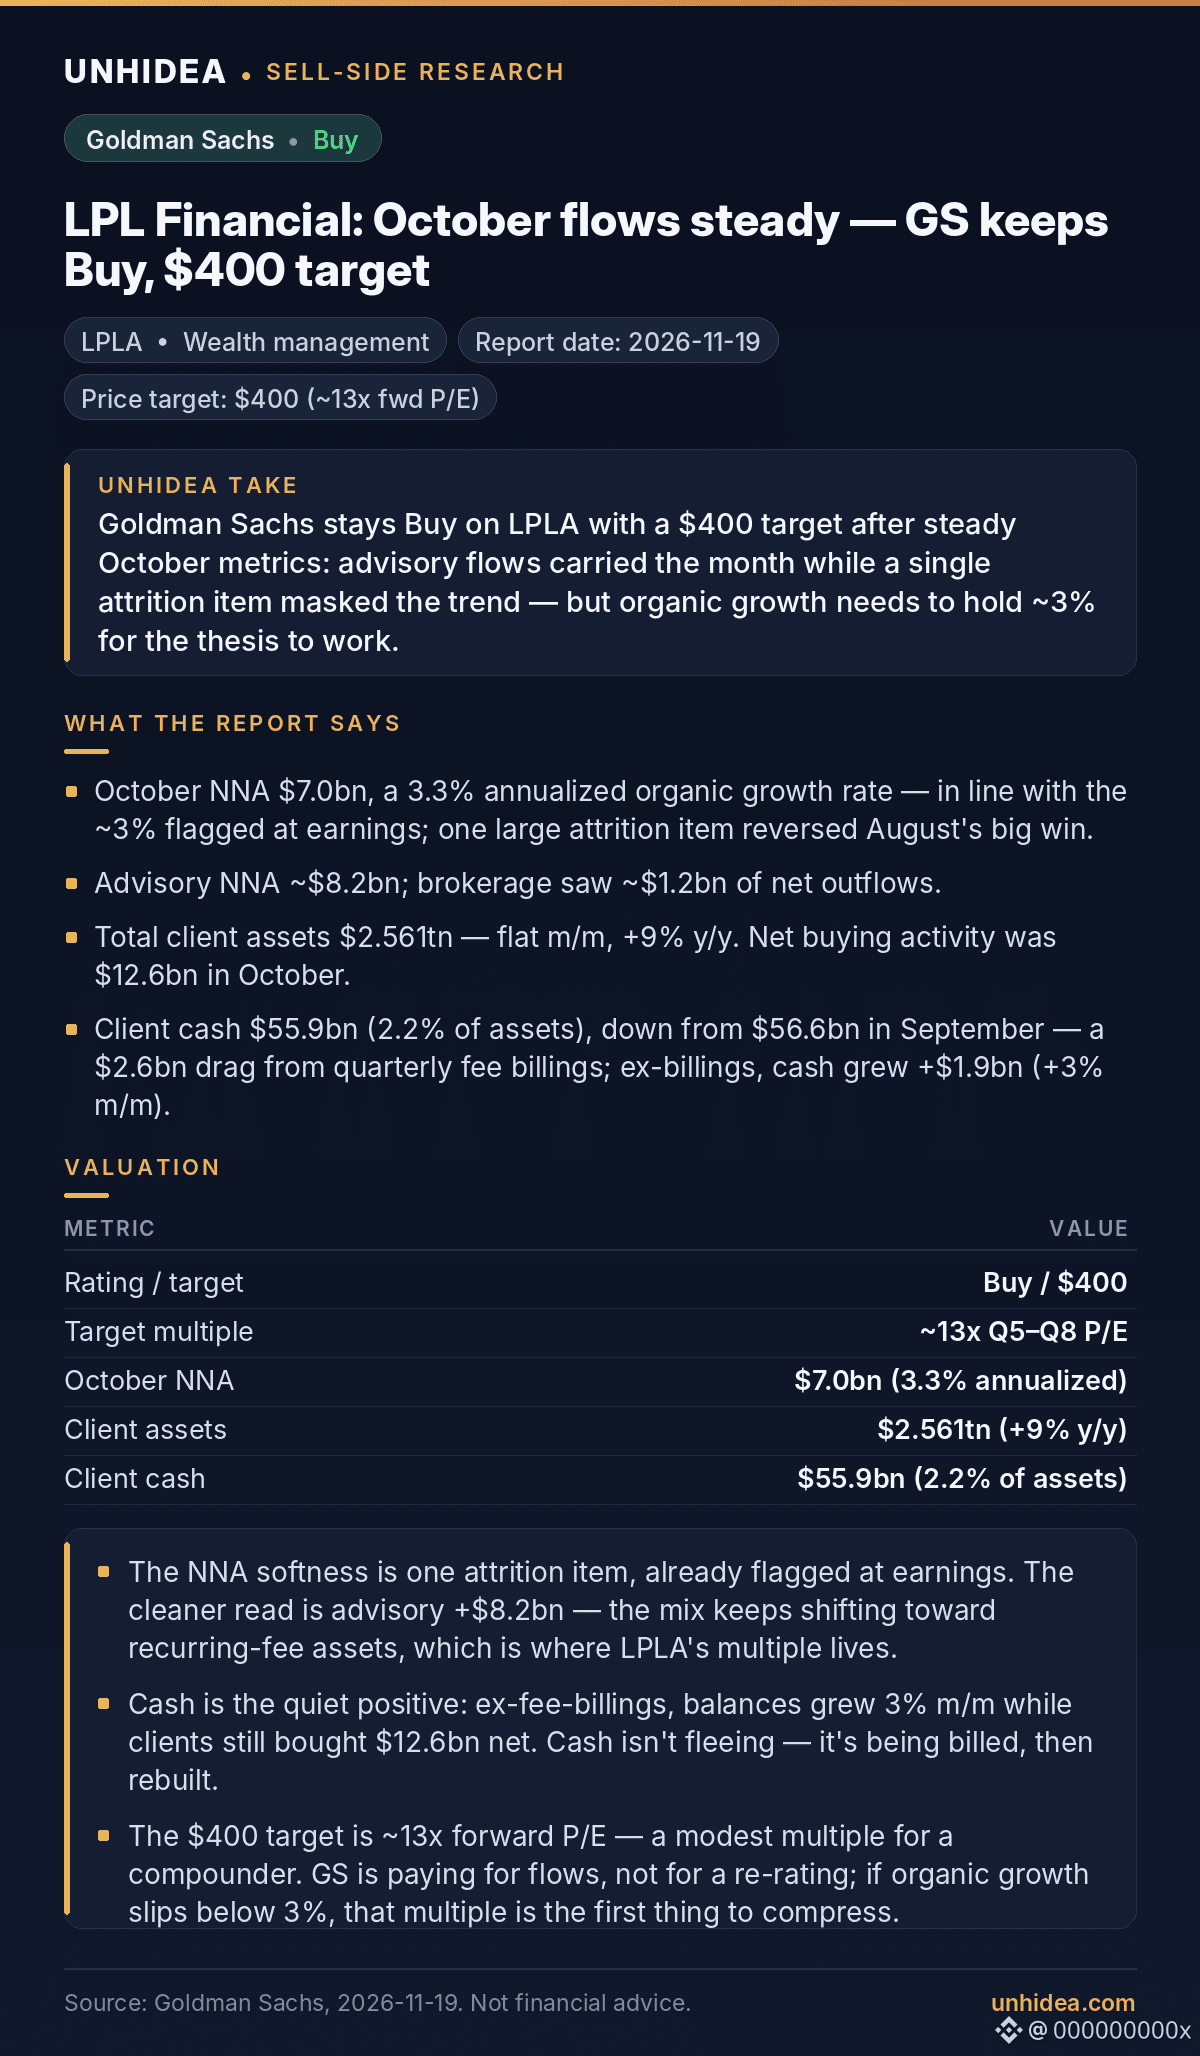
LPLAUS+1.41%
Log in to explore more content
Join global crypto users on Binance Square
⚡️ Get latest and useful information about crypto.
💬 Trusted by the world’s largest crypto exchange.
👍 Discover real insights from verified creators.
Email / Phone number
Trending Topics
BTCReboundsAbove$60KAmidWhaleDipBuying
1,568 views
30 Discussing
Abraxas Capital, Other Whales Buy the BTC Dip as Bitcoin Briefly Reclaims $60,000
Binance News
·7 Likes
·5.3k views
NvidiaLoses$2.7TrillionInMonthAndAHalf
38,357 views
190 Discussing
GlobalStocksFaceLongestLosingStreakSince2023
368,114 views
2,381 Discussing