
Current market data highlights a high-risk scenario where massive exchange inflows are coinciding with the loss of critical technical support levels.
On-Chain Analysis: The Supply Shock
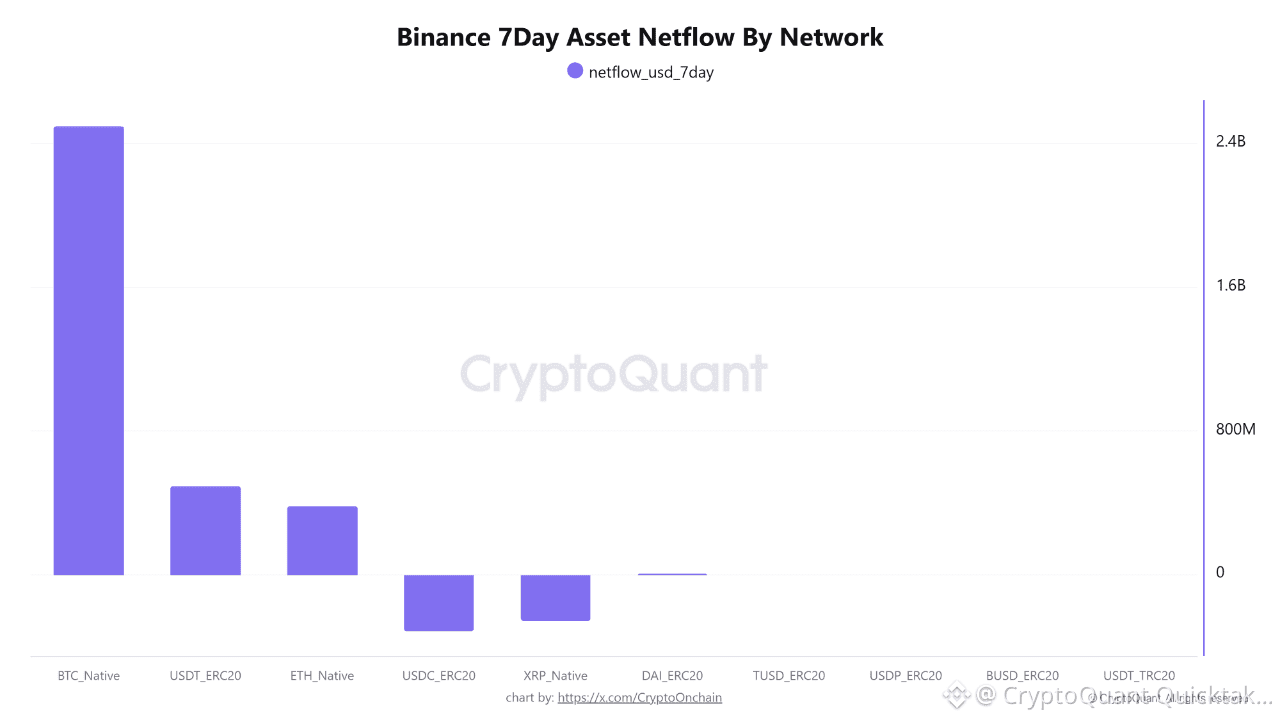
According to the Binance 7-Day Asset Netflow chart, the market is witnessing a significant liquidity event: over $2.5 billion worth of Bitcoin (BTC native) has flowed into Binance in just the past week.
From an on-chain perspective, such sharp spikes in exchange inflows are historically bearish signals. This migration of assets from cold storage to exchange wallets typically indicates that whales or institutional entities are preparing for potential distribution (spot selling) or using BTC as collateral for derivative positions, both of which increase overhead selling pressure.
Technical Analysis: Structural Breakdown
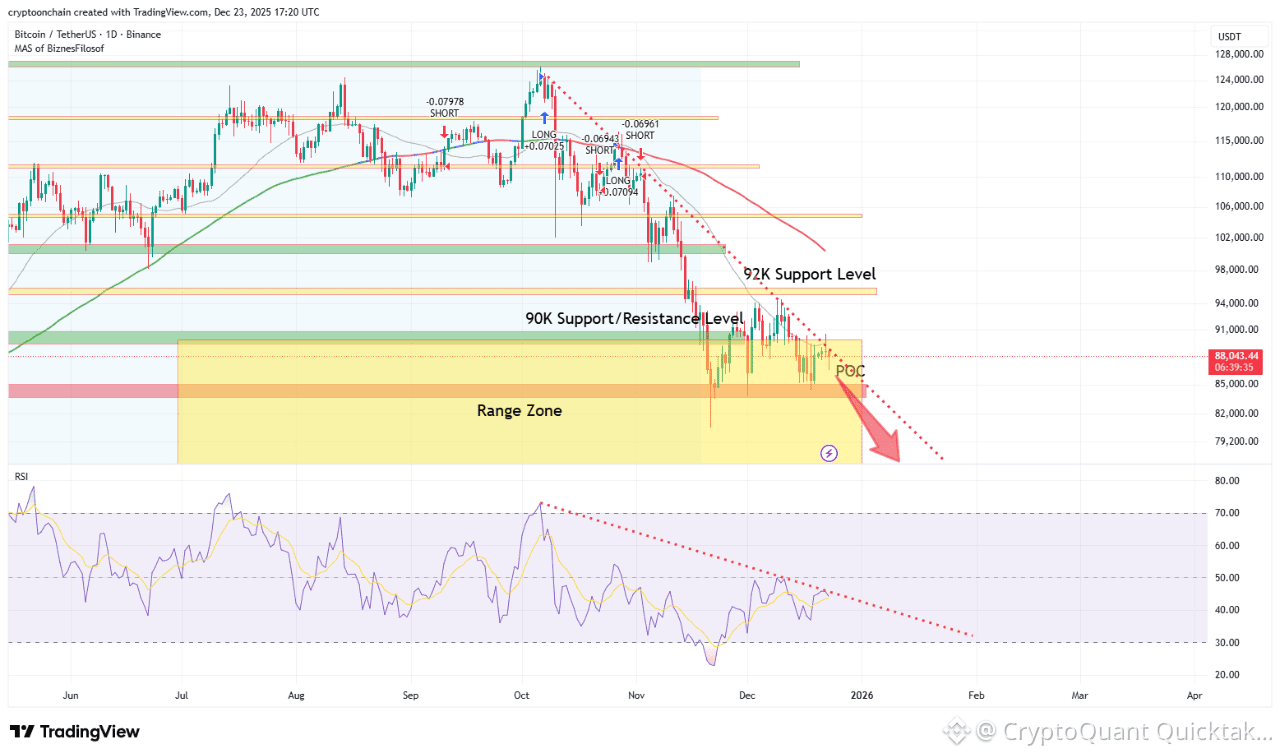
This on-chain warning aligns closely with the deterioration visible in the daily price structure:
Support Lost: Bitcoin has failed to hold the $92K and $90K psychological levels. These zones have now flipped from support into immediate resistance.
Trend Weakness: Price action remains firmly suppressed below key moving averages and a steep descending trendline.
Momentum Failure: The RSI recently tested its own descending trendline and faced a sharp rejection, confirming that buyers currently lack the momentum required to reverse the trend.
Conclusion
The injection of $2.5 billion in sell-side liquidity into Binance, occurring precisely as price breaks key support levels, creates a “perfect storm” for further downside risk.
As a result, the probability of a retest of the lower range zone between $79K and $85K has increased meaningfully. Traders are advised to exercise caution until RSI breaks its downtrend and exchange flows begin to normalize.
Written by CryptoOnchain
