
#willanthropiclistontime
willanthropiclistontime
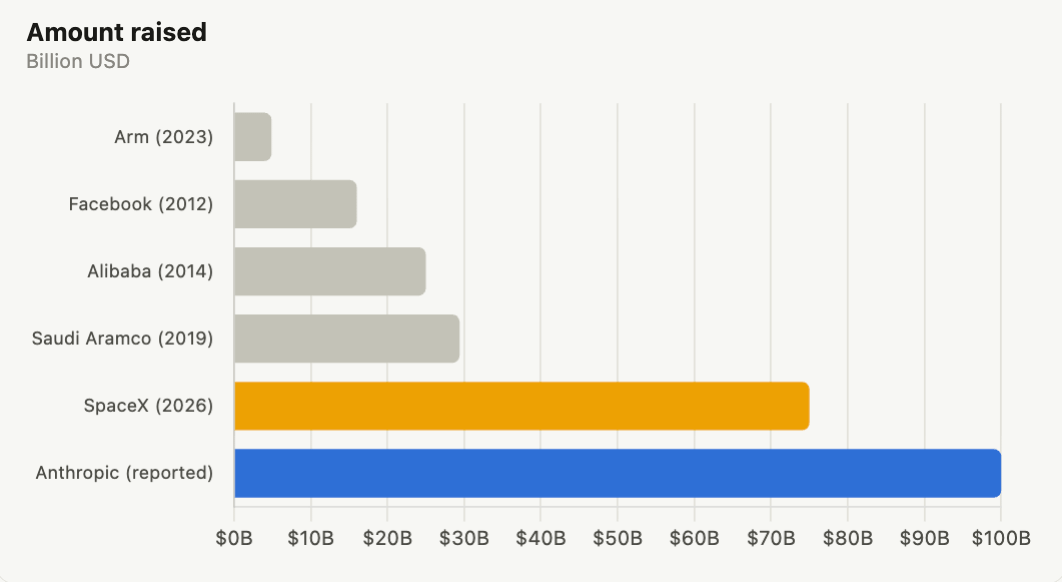
Anthropic's IPO could raise up to $100B (reported), with valuation estimates from $150B to $2T. Polymarket odds of a November listing fell from about 88% to 51% after the AI selloff. The reported target is the week of Nov 16. Past mega-IPOs rose 0.6% to 38% on day one, and SpaceX gained 19%. Will Anthropic list in November? 👇
Hot
Latest


·
--
Article
TradFi News | Anthropic IPO: Valuation Estimates, Listing Date and First-Day OutlookAnthropic’s IPO, which could raise up to $100 billion, is shaping up as a test of how much investors will pay for AI after this week’s selloff. Its valuation, listing date and first-day trading are all still open.Valuation Estimates Range From $150 Billion to $2 TrillionEstimateValuationNew Constructs (independent research)$150 billionSeries H private round (May 2026)$965 billionOne prospective investor (reported Nov 6)~$1 trillionRecently discussed target~$1.5 trillionEarlier investor hopesUp to $2 trillionInvestors want a more attractive valuation before committing, and some see $1.5 trillion as the high end, according to Reuters. The Wall Street Journal reported investor skepticism about that figure.Here’s what each valuation means against Anthropic’s revenue (calculated from its filings):ValuationMultiple of Q3 annualized revenue ($68B)Multiple of trailing 12-month revenue ($35.3B)$100B raise as a share of the company$1.0 trillion14.7x28.3x10.0%$1.5 trillion22.1x42.5x6.7%$2.0 trillion29.4x56.6x5.0%November Listing Odds Fall to 51%The reported target is the week of November 16, with the roadshow expected to start the week of November 9. Potential investors doubt that timeline can hold after the AI selloff, Reuters reported, and Anthropic could wait for steadier markets if pressure continues. On Polymarket, the odds of a November listing have fallen from about 88% to about 51%, according to The Block.The next signal is an S-1 amendment setting a price range. Anthropic declined to comment.Past Mega-IPOs Rose Between 0.6% and 38% on Day OneIPOYearRaisedFirst-day moveFacebook2012$16 billion+0.6%Alibaba2014$25 billion+38%Saudi Aramco2019$29.4 billion+10% (daily limit)Arm2023$4.9 billion+25%SpaceX2026$75 billion+19%Anthropic2026Up to $100 billion (reported)—SpaceX is the closest recent comparison. It priced at $135 in June, valuing it at about $1.75 trillion, and closed its first day near $161. It later fell below its IPO price by mid-July, a reminder that a first-day gain doesn’t guarantee later performance.Market Sentiment Is SplitHeadwinds: The Nasdaq fell about 5.5% on November 5 on concerns that a Democratic-led Congress could slow the data center buildout. Truist’s Keith Lerner described “something of a buyers’ strike in tech.” Fed rate hike odds for December rose to 77% after a strong jobs report.Tailwinds: Chip stocks rebounded on November 6, with AMD up 11.86% and Nvidia up 6.50% early. Yardeni Research called the data center backlash “speed bumps, not roadblocks.” Anthropic’s Q3 revenue rose to $17.0 billion from $1.4 billion a year earlier.Supply: At up to $100 billion, the offering would be about a third larger than SpaceX’s $75 billion and about 3.4 times Saudi Aramco’s $29.4 billion. The market has to absorb a lot of new stock at once, which can limit a first-day rise.
TradFi News | Anthropic IPO: Valuation Estimates, Listing Date and First-Day Outlook
Anthropic’s IPO, which could raise up to $100 billion, is shaping up as a test of how much investors will pay for AI after this week’s selloff. Its valuation, listing date and first-day trading are all still open.Valuation Estimates Range From $150 Billion to $2 TrillionEstimateValuationNew Constructs (independent research)$150 billionSeries H private round (May 2026)$965 billionOne prospective investor (reported Nov 6)~$1 trillionRecently discussed target~$1.5 trillionEarlier investor hopesUp to $2 trillionInvestors want a more attractive valuation before committing, and some see $1.5 trillion as the high end, according to Reuters. The Wall Street Journal reported investor skepticism about that figure.Here’s what each valuation means against Anthropic’s revenue (calculated from its filings):ValuationMultiple of Q3 annualized revenue ($68B)Multiple of trailing 12-month revenue ($35.3B)$100B raise as a share of the company$1.0 trillion14.7x28.3x10.0%$1.5 trillion22.1x42.5x6.7%$2.0 trillion29.4x56.6x5.0%November Listing Odds Fall to 51%The reported target is the week of November 16, with the roadshow expected to start the week of November 9. Potential investors doubt that timeline can hold after the AI selloff, Reuters reported, and Anthropic could wait for steadier markets if pressure continues. On Polymarket, the odds of a November listing have fallen from about 88% to about 51%, according to The Block.The next signal is an S-1 amendment setting a price range. Anthropic declined to comment.Past Mega-IPOs Rose Between 0.6% and 38% on Day OneIPOYearRaisedFirst-day moveFacebook2012$16 billion+0.6%Alibaba2014$25 billion+38%Saudi Aramco2019$29.4 billion+10% (daily limit)Arm2023$4.9 billion+25%SpaceX2026$75 billion+19%Anthropic2026Up to $100 billion (reported)—SpaceX is the closest recent comparison. It priced at $135 in June, valuing it at about $1.75 trillion, and closed its first day near $161. It later fell below its IPO price by mid-July, a reminder that a first-day gain doesn’t guarantee later performance.Market Sentiment Is SplitHeadwinds: The Nasdaq fell about 5.5% on November 5 on concerns that a Democratic-led Congress could slow the data center buildout. Truist’s Keith Lerner described “something of a buyers’ strike in tech.” Fed rate hike odds for December rose to 77% after a strong jobs report.Tailwinds: Chip stocks rebounded on November 6, with AMD up 11.86% and Nvidia up 6.50% early. Yardeni Research called the data center backlash “speed bumps, not roadblocks.” Anthropic’s Q3 revenue rose to $17.0 billion from $1.4 billion a year earlier.Supply: At up to $100 billion, the offering would be about a third larger than SpaceX’s $75 billion and about 3.4 times Saudi Aramco’s $29.4 billion. The market has to absorb a lot of new stock at once, which can limit a first-day rise.
3
1.5k

·
--
Verified
#willanthropiclistontime 🚨 ANTHROPIC IPO ALERT: WILL THE AI GIANT GO PUBLIC IN NOVEMBER 2026? 🤖📈
One of the biggest potential AI stock market debuts could be approaching!
🔥 ANTHROPIC IPO: WHAT WE KNOW
Reports suggest that Anthropic is preparing for a potential IPO targeting mid-November 2026, with ANT reportedly being considered as its Nasdaq ticker.
But several challenges could affect the timeline.
📊 WHAT INVESTORS ARE WATCHING:
IPO Timing: Will Anthropic go public as early as mid-November?
Nasdaq Ticker: ANT is reportedly being considered.
Valuation: Investor expectations and the company's valuation could become major talking points.
Market Conditions: Current stock market volatility could influence the IPO.
Regulatory Approval: Required filings and procedures could affect the launch date.
💡 WHY DOES THIS MATTER?
Anthropic is one of the major players in the artificial intelligence industry.
A successful IPO could attract significant institutional attention and potentially create fresh momentum across AI-related stocks.
Companies connected to AI infrastructure, semiconductors, and cloud computing could also attract renewed investor interest.
⚠️ IMPORTANT: The reported IPO timeline and ticker should not be treated as officially confirmed until Anthropic or Nasdaq makes an announcement.
🚀 THE BIG QUESTION:
Will Anthropic become one of the biggest AI IPOs of 2026, or will market conditions force another delay?
👇 Are you interested in investing in Anthropic if it goes public?
#Anthropic #IPO #AI #ArtificialIntelligence
CLICK TO BELOW TRADE👇
$ANTHROPIC
{future}(ANTHROPICUSDT)
#willanthropiclistontime 🚨 ANTHROPIC IPO ALERT: WILL THE AI GIANT GO PUBLIC IN NOVEMBER 2026? 🤖📈
One of the biggest potential AI stock market debuts could be approaching!
🔥 ANTHROPIC IPO: WHAT WE KNOW
Reports suggest that Anthropic is preparing for a potential IPO targeting mid-November 2026, with ANT reportedly being considered as its Nasdaq ticker.
But several challenges could affect the timeline.
📊 WHAT INVESTORS ARE WATCHING:
IPO Timing: Will Anthropic go public as early as mid-November?
Nasdaq Ticker: ANT is reportedly being considered.
Valuation: Investor expectations and the company's valuation could become major talking points.
Market Conditions: Current stock market volatility could influence the IPO.
Regulatory Approval: Required filings and procedures could affect the launch date.
💡 WHY DOES THIS MATTER?
Anthropic is one of the major players in the artificial intelligence industry.
A successful IPO could attract significant institutional attention and potentially create fresh momentum across AI-related stocks.
Companies connected to AI infrastructure, semiconductors, and cloud computing could also attract renewed investor interest.
⚠️ IMPORTANT: The reported IPO timeline and ticker should not be treated as officially confirmed until Anthropic or Nasdaq makes an announcement.
🚀 THE BIG QUESTION:
Will Anthropic become one of the biggest AI IPOs of 2026, or will market conditions force another delay?
👇 Are you interested in investing in Anthropic if it goes public?
#Anthropic #IPO #AI #ArtificialIntelligence
CLICK TO BELOW TRADE👇
$ANTHROPIC
One of the biggest potential AI stock market debuts could be approaching!
🔥 ANTHROPIC IPO: WHAT WE KNOW
Reports suggest that Anthropic is preparing for a potential IPO targeting mid-November 2026, with ANT reportedly being considered as its Nasdaq ticker.
But several challenges could affect the timeline.
📊 WHAT INVESTORS ARE WATCHING:
IPO Timing: Will Anthropic go public as early as mid-November?
Nasdaq Ticker: ANT is reportedly being considered.
Valuation: Investor expectations and the company's valuation could become major talking points.
Market Conditions: Current stock market volatility could influence the IPO.
Regulatory Approval: Required filings and procedures could affect the launch date.
💡 WHY DOES THIS MATTER?
Anthropic is one of the major players in the artificial intelligence industry.
A successful IPO could attract significant institutional attention and potentially create fresh momentum across AI-related stocks.
Companies connected to AI infrastructure, semiconductors, and cloud computing could also attract renewed investor interest.
⚠️ IMPORTANT: The reported IPO timeline and ticker should not be treated as officially confirmed until Anthropic or Nasdaq makes an announcement.
🚀 THE BIG QUESTION:
Will Anthropic become one of the biggest AI IPOs of 2026, or will market conditions force another delay?
👇 Are you interested in investing in Anthropic if it goes public?
#Anthropic #IPO #AI #ArtificialIntelligence
CLICK TO BELOW TRADE👇
$ANTHROPIC

2
1.2k

·
--
🚨 Will Anthropic List On Time? The $2 Trillion Question Everyone Is Asking!
ill Anthropic list on time? This is now the biggest question in AI and markets.
As of now, Anthropic is NOT yet public. It filed its public S-1 on October 26, and Amendment No. 1 on November 2, to list on Nasdaq under ticker $ANT. But still, no official trading date, no price range, no share count.
Here is what most people don't know:
Under the SEC's 15-day rule, the roadshow CANNOT even begin before November 10. So a listing before mid-November is legally impossible. The Wall Street Journal reports Anthropic is aiming for the week of November 16, with pricing expected between November 17-20.
The original plan was October. It was pushed to November because Anthropic wanted to show strong Q3 results first, and because of US midterm uncertainty.
The stakes? A reported valuation of $1.5 Trillion to $2 Trillion, with a raise of $100 Billion+. If it lists on time, it will be the biggest AI IPO ever — bigger than most countries' GDP.
If it delays again, it will shake AI stocks, $NVDA, and even crypto AI coins.
Do you think $ANT will list in the week of Nov 16, or delay again?
#WillAnthropicListOnTime #Anthropic #ANT #IPO #AI #Claude #StockMarket #Crypto#willanthropiclistontime
🚨 Will Anthropic List On Time? The $2 Trillion Question Everyone Is Asking!
ill Anthropic list on time? This is now the biggest question in AI and markets.
As of now, Anthropic is NOT yet public. It filed its public S-1 on October 26, and Amendment No. 1 on November 2, to list on Nasdaq under ticker $ANT. But still, no official trading date, no price range, no share count.
Here is what most people don't know:
Under the SEC's 15-day rule, the roadshow CANNOT even begin before November 10. So a listing before mid-November is legally impossible. The Wall Street Journal reports Anthropic is aiming for the week of November 16, with pricing expected between November 17-20.
The original plan was October. It was pushed to November because Anthropic wanted to show strong Q3 results first, and because of US midterm uncertainty.
The stakes? A reported valuation of $1.5 Trillion to $2 Trillion, with a raise of $100 Billion+. If it lists on time, it will be the biggest AI IPO ever — bigger than most countries' GDP.
If it delays again, it will shake AI stocks, $NVDA, and even crypto AI coins.
Do you think $ANT will list in the week of Nov 16, or delay again?
#WillAnthropicListOnTime #Anthropic #ANT #IPO #AI #Claude #StockMarket #Crypto#willanthropiclistontime
ill Anthropic list on time? This is now the biggest question in AI and markets.
As of now, Anthropic is NOT yet public. It filed its public S-1 on October 26, and Amendment No. 1 on November 2, to list on Nasdaq under ticker $ANT. But still, no official trading date, no price range, no share count.
Here is what most people don't know:
Under the SEC's 15-day rule, the roadshow CANNOT even begin before November 10. So a listing before mid-November is legally impossible. The Wall Street Journal reports Anthropic is aiming for the week of November 16, with pricing expected between November 17-20.
The original plan was October. It was pushed to November because Anthropic wanted to show strong Q3 results first, and because of US midterm uncertainty.
The stakes? A reported valuation of $1.5 Trillion to $2 Trillion, with a raise of $100 Billion+. If it lists on time, it will be the biggest AI IPO ever — bigger than most countries' GDP.
If it delays again, it will shake AI stocks, $NVDA, and even crypto AI coins.
Do you think $ANT will list in the week of Nov 16, or delay again?
#WillAnthropicListOnTime #Anthropic #ANT #IPO #AI #Claude #StockMarket #Crypto#willanthropiclistontime

78

·
--
Verified
🔥🚀BREAKING: Anthropic’s expected IPO valuation is facing another downward adjustment as investors reassess the artificial-intelligence trade following Thursday’s brutal tech selloff.
Some prospective investors are now discussing a valuation of approximately $1.2 trillion to $1.3 trillion for the Claude developer, Bloomberg News reported Friday.
That's far below the $2 trillion buyers were projecting just last month when stocks were flying high.
The latest reassessment follows Thursday’s sharp selloff in technology stocks, when the Nasdaq 100 plunged 6.4%, wiping out approximately $2.3 trillion in market value in its largest single-day decline on record.
#WillAnthropicListOnTime
#BinancePick #JobsReportRaisesHikeOdds #USMidtermsCouldShakeUpUS-IranTies #USNovemberMichiganExpectationsIndexPrelimAt50.9 $TSMB $SPCXB $NVDAB
🔥🚀BREAKING: Anthropic’s expected IPO valuation is facing another downward adjustment as investors reassess the artificial-intelligence trade following Thursday’s brutal tech selloff.
Some prospective investors are now discussing a valuation of approximately $1.2 trillion to $1.3 trillion for the Claude developer, Bloomberg News reported Friday.
That's far below the $2 trillion buyers were projecting just last month when stocks were flying high.
The latest reassessment follows Thursday’s sharp selloff in technology stocks, when the Nasdaq 100 plunged 6.4%, wiping out approximately $2.3 trillion in market value in its largest single-day decline on record.
#WillAnthropicListOnTime
#BinancePick #JobsReportRaisesHikeOdds #USMidtermsCouldShakeUpUS-IranTies #USNovemberMichiganExpectationsIndexPrelimAt50.9 $TSMB $SPCXB $NVDAB
Some prospective investors are now discussing a valuation of approximately $1.2 trillion to $1.3 trillion for the Claude developer, Bloomberg News reported Friday.
That's far below the $2 trillion buyers were projecting just last month when stocks were flying high.
The latest reassessment follows Thursday’s sharp selloff in technology stocks, when the Nasdaq 100 plunged 6.4%, wiping out approximately $2.3 trillion in market value in its largest single-day decline on record.
#WillAnthropicListOnTime
#BinancePick #JobsReportRaisesHikeOdds #USMidtermsCouldShakeUpUS-IranTies #USNovemberMichiganExpectationsIndexPrelimAt50.9 $TSMB $SPCXB $NVDAB

1
251
#WillAnthropicListOnTime
🤖 *WILL ANTHROPIC LIST ON TIME?*
Claude maker Anthropic is racing toward one of the biggest IPOs ever!
📊 *Timeline:*
- Oct 26: Public S-1 filed
- Nov 2: Amendment No.1 — Q3 results added
- Nov 9-10: Roadshow expected to start
- Week of Nov 16: Target listing window
- Ticker: *ANT* on Nasdaq
💰 *The Numbers:*
- Valuation target: *$1.5T - $2T*
- Raise target: *$100B+*
- H1 2026 Revenue: *$16.3B* (+1,300% YoY)
- Q3 Revenue: *$16.8B*
- Last private valuation: *$965B* (May 2026)
⚠️ *Risk:* No price range / share count yet. Market swings, weak roadshow demand, or SEC delay could push it past Thanksgiving (Nov 26).
Will Anthropic hit Nov 16 or slip? 👇
#Anthropic #Claude #ANT #IPO $ANT $NVDA
$GOOGL
#WillAnthropicListOnTime
🤖 *WILL ANTHROPIC LIST ON TIME?*
Claude maker Anthropic is racing toward one of the biggest IPOs ever!
📊 *Timeline:*
- Oct 26: Public S-1 filed
- Nov 2: Amendment No.1 — Q3 results added
- Nov 9-10: Roadshow expected to start
- Week of Nov 16: Target listing window
- Ticker: *ANT* on Nasdaq
💰 *The Numbers:*
- Valuation target: *$1.5T - $2T*
- Raise target: *$100B+*
- H1 2026 Revenue: *$16.3B* (+1,300% YoY)
- Q3 Revenue: *$16.8B*
- Last private valuation: *$965B* (May 2026)
⚠️ *Risk:* No price range / share count yet. Market swings, weak roadshow demand, or SEC delay could push it past Thanksgiving (Nov 26).
Will Anthropic hit Nov 16 or slip? 👇
#Anthropic #Claude #ANT #IPO $ANT $NVDA
$GOOGL
🤖 *WILL ANTHROPIC LIST ON TIME?*
Claude maker Anthropic is racing toward one of the biggest IPOs ever!
📊 *Timeline:*
- Oct 26: Public S-1 filed
- Nov 2: Amendment No.1 — Q3 results added
- Nov 9-10: Roadshow expected to start
- Week of Nov 16: Target listing window
- Ticker: *ANT* on Nasdaq
💰 *The Numbers:*
- Valuation target: *$1.5T - $2T*
- Raise target: *$100B+*
- H1 2026 Revenue: *$16.3B* (+1,300% YoY)
- Q3 Revenue: *$16.8B*
- Last private valuation: *$965B* (May 2026)
⚠️ *Risk:* No price range / share count yet. Market swings, weak roadshow demand, or SEC delay could push it past Thanksgiving (Nov 26).
Will Anthropic hit Nov 16 or slip? 👇
#Anthropic #Claude #ANT #IPO $ANT $NVDA
$GOOGL

1
146

·
--
Verified
ANTHROPIC IPO: WILL IT GO PUBLIC ON TIME?
Anthropic is preparing for a highly anticipated stock market debut, with its IPO reportedly targeting mid-November 2026 under the Nasdaq ticker **ANT**. However, market volatility, investor concerns over its valuation, and regulatory procedures could affect the timeline. Investors are watching closely as this could become one of the biggest AI listings in history. Will Anthropic make its debut on schedule, or face another delay?
#willanthropiclistontime $ANTHROPIC
{future}(ANTHROPICUSDT)
ANTHROPIC IPO: WILL IT GO PUBLIC ON TIME?
Anthropic is preparing for a highly anticipated stock market debut, with its IPO reportedly targeting mid-November 2026 under the Nasdaq ticker **ANT**. However, market volatility, investor concerns over its valuation, and regulatory procedures could affect the timeline. Investors are watching closely as this could become one of the biggest AI listings in history. Will Anthropic make its debut on schedule, or face another delay?
#willanthropiclistontime $ANTHROPIC
Anthropic is preparing for a highly anticipated stock market debut, with its IPO reportedly targeting mid-November 2026 under the Nasdaq ticker **ANT**. However, market volatility, investor concerns over its valuation, and regulatory procedures could affect the timeline. Investors are watching closely as this could become one of the biggest AI listings in history. Will Anthropic make its debut on schedule, or face another delay?
#willanthropiclistontime $ANTHROPIC

397

·
--
ANTHROPIC’s price action looks weak, but counterintuitively, the next rebound may be what really matters.
Binance TradFi Perpetuals (traditional financial assets, with high gap risk outside trading hours) | ANTHROPIC is down 11.96% over the past 24 hours, and weakness persists. For signs of recovery, first watch whether selling pressure eases. The current price is around 1322.5, with 24-hour trading volume of about 125 million; absolute trading volume does not necessarily mean relative volume is rising. Market positioning: 79% of accounts are long; the taker buy/sell ratio is 0.91 (taker activity is nearly balanced); funding rate: +0.0050%.
Reference indicators: The 30m RSI is 20.76, in oversold territory, suggesting short-term panic is already elevated; the 30m ATR trend-band reference level is 1439.700464. The current price is below this level, suggesting the trend support level is coming under pressure.
The divide here is very specific: some expect a further breakdown, while others expect a recovery from panic. I’m more interested in whether the taker buy/sell ratio of 0.91 can move away from the balance zone around 1. If it can’t, even a sharp rebound could easily turn into a weak recovery.
#ANTHROPIC #异动警报 #WillAnthropicListOnTime
ANTHROPIC’s price action looks weak, but counterintuitively, the next rebound may be what really matters.
Binance TradFi Perpetuals (traditional financial assets, with high gap risk outside trading hours) | ANTHROPIC is down 11.96% over the past 24 hours, and weakness persists. For signs of recovery, first watch whether selling pressure eases. The current price is around 1322.5, with 24-hour trading volume of about 125 million; absolute trading volume does not necessarily mean relative volume is rising. Market positioning: 79% of accounts are long; the taker buy/sell ratio is 0.91 (taker activity is nearly balanced); funding rate: +0.0050%.
Reference indicators: The 30m RSI is 20.76, in oversold territory, suggesting short-term panic is already elevated; the 30m ATR trend-band reference level is 1439.700464. The current price is below this level, suggesting the trend support level is coming under pressure.
The divide here is very specific: some expect a further breakdown, while others expect a recovery from panic. I’m more interested in whether the taker buy/sell ratio of 0.91 can move away from the balance zone around 1. If it can’t, even a sharp rebound could easily turn into a weak recovery.
#ANTHROPIC #异动警报 #WillAnthropicListOnTime
Binance TradFi Perpetuals (traditional financial assets, with high gap risk outside trading hours) | ANTHROPIC is down 11.96% over the past 24 hours, and weakness persists. For signs of recovery, first watch whether selling pressure eases. The current price is around 1322.5, with 24-hour trading volume of about 125 million; absolute trading volume does not necessarily mean relative volume is rising. Market positioning: 79% of accounts are long; the taker buy/sell ratio is 0.91 (taker activity is nearly balanced); funding rate: +0.0050%.
Reference indicators: The 30m RSI is 20.76, in oversold territory, suggesting short-term panic is already elevated; the 30m ATR trend-band reference level is 1439.700464. The current price is below this level, suggesting the trend support level is coming under pressure.
The divide here is very specific: some expect a further breakdown, while others expect a recovery from panic. I’m more interested in whether the taker buy/sell ratio of 0.91 can move away from the balance zone around 1. If it can’t, even a sharp rebound could easily turn into a weak recovery.
#ANTHROPIC #异动警报 #WillAnthropicListOnTime
1
6


Article
Gold Buyer :- 1st China, 2nd Japan. Previously Both had Largest Block of US Treasuries.🚨 WARNING: SOMETHING EXTREMELY BAD JUST HAPPENED
Japan has dumped $160 BILLION in U.S. Treasuries after its stock market crashed 8% in just a few hours.
This is the largest treasury sell-off in decades.
They've officially hit the PANIC button.
Japan is sitting on a massive ¥30 TRILLION in bond losses.
And it's getting worse by the minute.
Over ¥21,000,000,000,000 has been wiped from Japan's stock market today.
This is NOT a normal market correction.
Something much bigger is happening behind the scenes.
Japan is aggressively selling U.S. Treasuries to stabilize the yen and prevent a total collapse.
Meanwhile, its gold reserves have climbed to an ALL-TIME HIGH.
Japan is reducing its exposure to dollar-based assets while continuing to accumulate gold.
And there's a clear reason behind it.
Japan is fighting to protect its currency.
The Bank of Japan is deploying its enormous foreign exchange reserves.
And U.S. Treasuries remain one of the largest and most liquid assets available.
But Japan isn't alone.
China is following a remarkably similar strategy.
China continues reducing its U.S. Treasury holdings while its gold reserves reach new ALL-TIME HIGHS.
Two of the world's largest economies are now moving in the same direction.
→ Japan is dumping U.S. Treasuries
→ Japan is expanding its gold reserves
→ China is dumping U.S. Treasuries
→ China is expanding its gold reserves
This is a major shift away from traditional dollar-based reserves.
And it's not necessarily because countries don't want dollars.
It's because they have NO OTHER OPTION.
The AI bubble is collapsing, and foreign markets are dumping every day.
China's AI stocks have collapsed nearly 50% in 3 months.
And this will extend far beyond Japan and China.
Japan has to save its own market and defend the yen.
China also wants to save its own market and gain financial independence.
And GOLD is becoming a central part of both strategies.
This is where the situation becomes extremely dangerous.
If Japan continues selling Treasuries, additional pressure will build across bond markets.
And China's selling will add even more pressure.
→ Increasing Treasury liquidations
→ Growing pressure on U.S. bond markets
→ Aggressive currency intervention
→ Accelerating gold accumulation
→ Declining dependence on the U.S. dollar
Japan isn't deliberately trying to destroy global markets.
They're trying to prevent a much larger financial crisis.
But those actions will create consequences throughout the global financial system.
And if other economies adopt the same strategy, the pressure on the U.S. market will intensify.
This is how the biggest market crash in history starts.
First, gradually.
Then, all at once.
And we're watching it all in real time.
I've spent decades studying financial markets and have called nearly every market top and bottom.
And I'm warning you right now:
The 2026-2027 cycle will be life-changing for those who are prepared.
Make sure you're one of them.
Follow and turn on notifications NOW.
Because by the time everyone else realizes what's happening, it will already be too late.
#US Data Center Rules May Constrain AI Expansion #JobsReportRaisesHikeOdds #BitcoinRebounds$75KAsChipsLead #$2TWipedOutHedgeFundsFaceLiquidation #WillAnthropicListOnTime
Gold Buyer :- 1st China, 2nd Japan. Previously Both had Largest Block of US Treasuries.
🚨 WARNING: SOMETHING EXTREMELY BAD JUST HAPPENED
Japan has dumped $160 BILLION in U.S. Treasuries after its stock market crashed 8% in just a few hours.
This is the largest treasury sell-off in decades.
They've officially hit the PANIC button.
Japan is sitting on a massive ¥30 TRILLION in bond losses.
And it's getting worse by the minute.
Over ¥21,000,000,000,000 has been wiped from Japan's stock market today.
This is NOT a normal market correction.
Something much bigger is happening behind the scenes.
Japan is aggressively selling U.S. Treasuries to stabilize the yen and prevent a total collapse.
Meanwhile, its gold reserves have climbed to an ALL-TIME HIGH.
Japan is reducing its exposure to dollar-based assets while continuing to accumulate gold.
And there's a clear reason behind it.
Japan is fighting to protect its currency.
The Bank of Japan is deploying its enormous foreign exchange reserves.
And U.S. Treasuries remain one of the largest and most liquid assets available.
But Japan isn't alone.
China is following a remarkably similar strategy.
China continues reducing its U.S. Treasury holdings while its gold reserves reach new ALL-TIME HIGHS.
Two of the world's largest economies are now moving in the same direction.
→ Japan is dumping U.S. Treasuries
→ Japan is expanding its gold reserves
→ China is dumping U.S. Treasuries
→ China is expanding its gold reserves
This is a major shift away from traditional dollar-based reserves.
And it's not necessarily because countries don't want dollars.
It's because they have NO OTHER OPTION.
The AI bubble is collapsing, and foreign markets are dumping every day.
China's AI stocks have collapsed nearly 50% in 3 months.
And this will extend far beyond Japan and China.
Japan has to save its own market and defend the yen.
China also wants to save its own market and gain financial independence.
And GOLD is becoming a central part of both strategies.
This is where the situation becomes extremely dangerous.
If Japan continues selling Treasuries, additional pressure will build across bond markets.
And China's selling will add even more pressure.
→ Increasing Treasury liquidations
→ Growing pressure on U.S. bond markets
→ Aggressive currency intervention
→ Accelerating gold accumulation
→ Declining dependence on the U.S. dollar
Japan isn't deliberately trying to destroy global markets.
They're trying to prevent a much larger financial crisis.
But those actions will create consequences throughout the global financial system.
And if other economies adopt the same strategy, the pressure on the U.S. market will intensify.
This is how the biggest market crash in history starts.
First, gradually.
Then, all at once.
And we're watching it all in real time.
I've spent decades studying financial markets and have called nearly every market top and bottom.
And I'm warning you right now:
The 2026-2027 cycle will be life-changing for those who are prepared.
Make sure you're one of them.
Follow and turn on notifications NOW.
Because by the time everyone else realizes what's happening, it will already be too late.
#US Data Center Rules May Constrain AI Expansion #JobsReportRaisesHikeOdds #BitcoinRebounds$75KAsChipsLead #$2TWipedOutHedgeFundsFaceLiquidation #WillAnthropicListOnTime
Japan has dumped $160 BILLION in U.S. Treasuries after its stock market crashed 8% in just a few hours.
This is the largest treasury sell-off in decades.
They've officially hit the PANIC button.
Japan is sitting on a massive ¥30 TRILLION in bond losses.
And it's getting worse by the minute.
Over ¥21,000,000,000,000 has been wiped from Japan's stock market today.
This is NOT a normal market correction.
Something much bigger is happening behind the scenes.
Japan is aggressively selling U.S. Treasuries to stabilize the yen and prevent a total collapse.
Meanwhile, its gold reserves have climbed to an ALL-TIME HIGH.
Japan is reducing its exposure to dollar-based assets while continuing to accumulate gold.
And there's a clear reason behind it.
Japan is fighting to protect its currency.
The Bank of Japan is deploying its enormous foreign exchange reserves.
And U.S. Treasuries remain one of the largest and most liquid assets available.
But Japan isn't alone.
China is following a remarkably similar strategy.
China continues reducing its U.S. Treasury holdings while its gold reserves reach new ALL-TIME HIGHS.
Two of the world's largest economies are now moving in the same direction.
→ Japan is dumping U.S. Treasuries
→ Japan is expanding its gold reserves
→ China is dumping U.S. Treasuries
→ China is expanding its gold reserves
This is a major shift away from traditional dollar-based reserves.
And it's not necessarily because countries don't want dollars.
It's because they have NO OTHER OPTION.
The AI bubble is collapsing, and foreign markets are dumping every day.
China's AI stocks have collapsed nearly 50% in 3 months.
And this will extend far beyond Japan and China.
Japan has to save its own market and defend the yen.
China also wants to save its own market and gain financial independence.
And GOLD is becoming a central part of both strategies.
This is where the situation becomes extremely dangerous.
If Japan continues selling Treasuries, additional pressure will build across bond markets.
And China's selling will add even more pressure.
→ Increasing Treasury liquidations
→ Growing pressure on U.S. bond markets
→ Aggressive currency intervention
→ Accelerating gold accumulation
→ Declining dependence on the U.S. dollar
Japan isn't deliberately trying to destroy global markets.
They're trying to prevent a much larger financial crisis.
But those actions will create consequences throughout the global financial system.
And if other economies adopt the same strategy, the pressure on the U.S. market will intensify.
This is how the biggest market crash in history starts.
First, gradually.
Then, all at once.
And we're watching it all in real time.
I've spent decades studying financial markets and have called nearly every market top and bottom.
And I'm warning you right now:
The 2026-2027 cycle will be life-changing for those who are prepared.
Make sure you're one of them.
Follow and turn on notifications NOW.
Because by the time everyone else realizes what's happening, it will already be too late.
#US Data Center Rules May Constrain AI Expansion #JobsReportRaisesHikeOdds #BitcoinRebounds$75KAsChipsLead #$2TWipedOutHedgeFundsFaceLiquidation #WillAnthropicListOnTime
163

·
--
Bullish
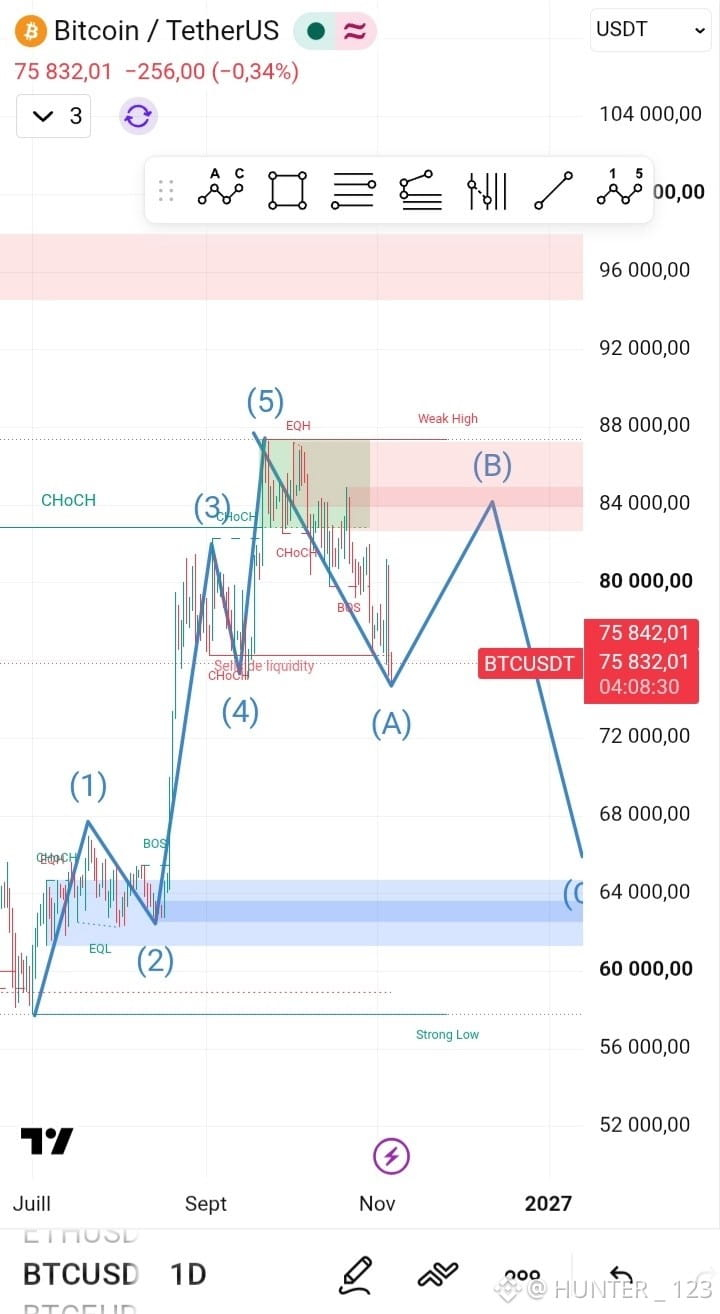
$BTC Bitcoin rose from a low of 57000 to a high of 87000 in five impulse waves.
It is now undergoing a correction in three ABC waves.
The first wave, A, has now ended after the strong rebound. If you look at the Bitcoin chart, you’ll see that the low preceding the 87000 high is the same area Bitcoin has now bounced from.
Therefore, bullish wave B will begin, and may exceed 84000, followed by the final wave C, which will reach 67000. We’ll take advantage of each wave and enter a buy position now with the following targets:
TP1: 79000
TP2: 81000
TP3: 83000
STOP :74000
#JobsReportRaisesHikeOdds #WillAnthropicListOnTime #USNovemberMichiganExpectationsIndexPrelimAt50.9 #TradFiForBeginners #USMidtermsCouldShakeUpUS-IranTies
$BTC Bitcoin rose from a low of 57000 to a high of 87000 in five impulse waves.
It is now undergoing a correction in three ABC waves.
The first wave, A, has now ended after the strong rebound. If you look at the Bitcoin chart, you’ll see that the low preceding the 87000 high is the same area Bitcoin has now bounced from.
Therefore, bullish wave B will begin, and may exceed 84000, followed by the final wave C, which will reach 67000. We’ll take advantage of each wave and enter a buy position now with the following targets:
TP1: 79000
TP2: 81000
TP3: 83000
STOP :74000
#JobsReportRaisesHikeOdds #WillAnthropicListOnTime #USNovemberMichiganExpectationsIndexPrelimAt50.9 #TradFiForBeginners #USMidtermsCouldShakeUpUS-IranTies
It is now undergoing a correction in three ABC waves.
The first wave, A, has now ended after the strong rebound. If you look at the Bitcoin chart, you’ll see that the low preceding the 87000 high is the same area Bitcoin has now bounced from.
Therefore, bullish wave B will begin, and may exceed 84000, followed by the final wave C, which will reach 67000. We’ll take advantage of each wave and enter a buy position now with the following targets:
TP1: 79000
TP2: 81000
TP3: 83000
STOP :74000
#JobsReportRaisesHikeOdds #WillAnthropicListOnTime #USNovemberMichiganExpectationsIndexPrelimAt50.9 #TradFiForBeginners #USMidtermsCouldShakeUpUS-IranTies

1
76

·
--
I have a very close relationship 😍💞 with snacks 🥨😋 but our family are not happy 😁 with this ..$UAI $CYBER $AKE #JobsReportRaisesHikeOdds #WillAnthropicListOnTime #USNovemberMichiganExpectationsIndexPrelimAt50.9 #TradFiForBeginners #USMidtermsCouldShakeUpUS-IranTies
I have a very close relationship 😍💞 with snacks 🥨😋 but our family are not happy 😁 with this ..$UAI $CYBER $AKE #JobsReportRaisesHikeOdds #WillAnthropicListOnTime #USNovemberMichiganExpectationsIndexPrelimAt50.9 #TradFiForBeginners #USMidtermsCouldShakeUpUS-IranTies


65


·
--
Bearish
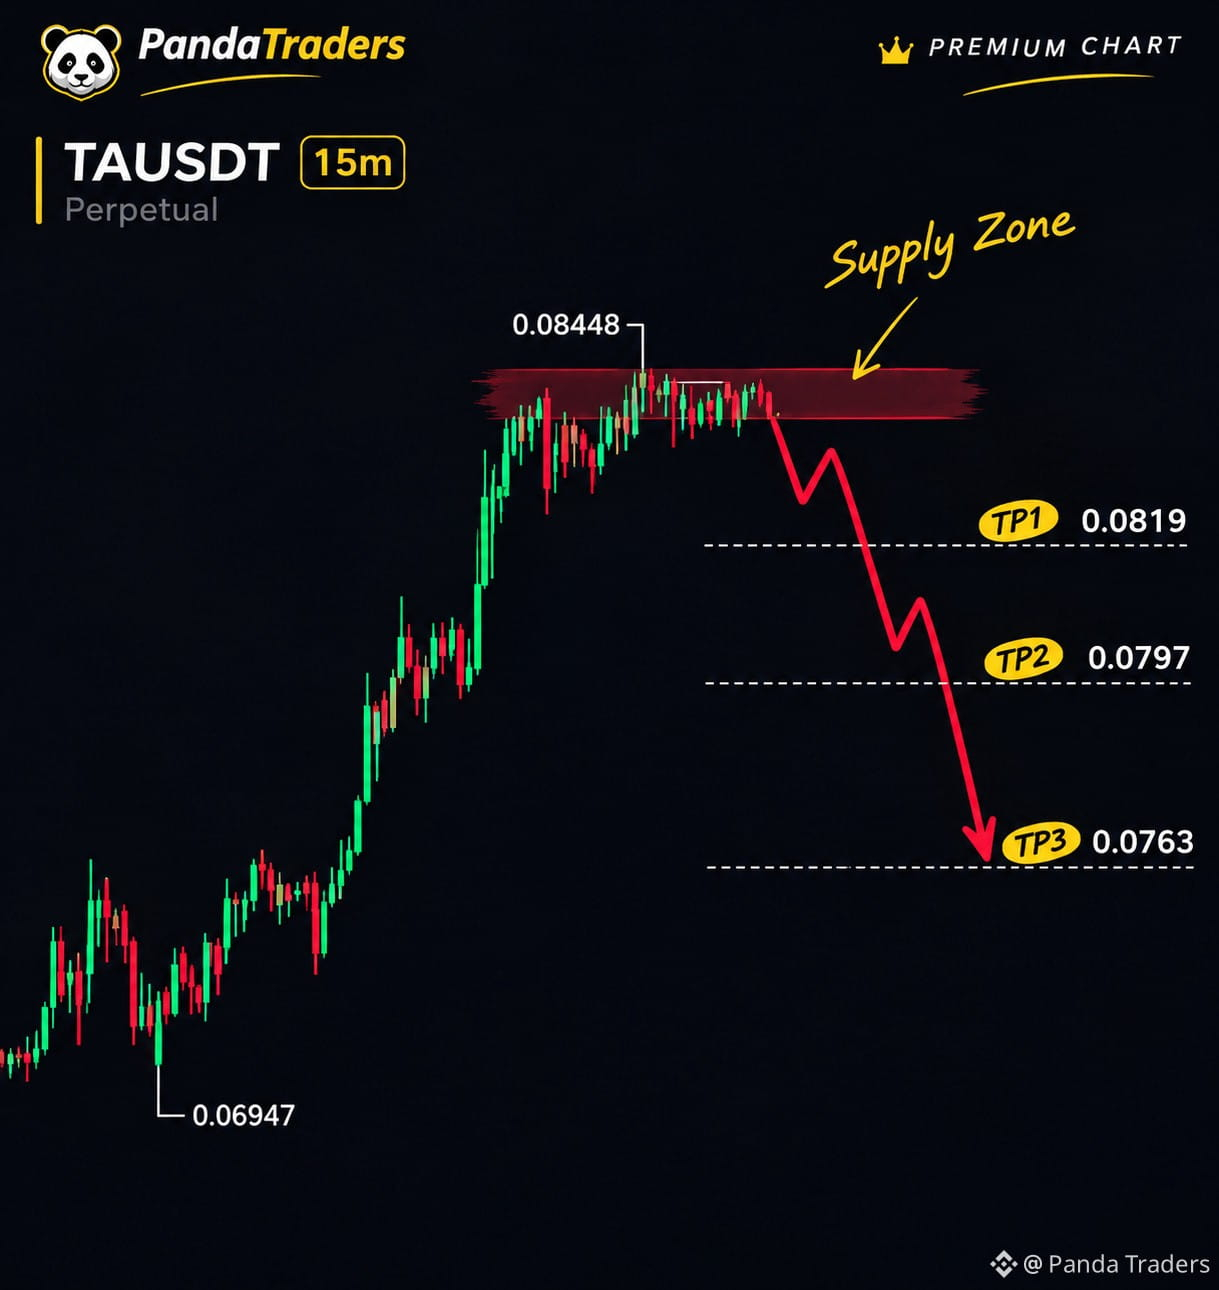
🚨$TA USDT SHORT SETUP 📉
Let's Open short and make money
Entry: $0.0832–$0.0842
DCA 1: $0.0850
DCA 2: $0.0865
SL: $0.0895
🎯 TP1: $0.0819
🎯 TP2: $0.0797
🎯 TP3: $0.0763
Always DYOR And Never invest all in one trade
Trade here 👇👇
{future}(TAUSDT)
#TA #WillAnthropicListOnTime
🚨$TA USDT SHORT SETUP 📉
Let's Open short and make money
Entry: $0.0832–$0.0842
DCA 1: $0.0850
DCA 2: $0.0865
SL: $0.0895
🎯 TP1: $0.0819
🎯 TP2: $0.0797
🎯 TP3: $0.0763
Always DYOR And Never invest all in one trade
Trade here 👇👇
#TA #WillAnthropicListOnTime
Let's Open short and make money
Entry: $0.0832–$0.0842
DCA 1: $0.0850
DCA 2: $0.0865
SL: $0.0895
🎯 TP1: $0.0819
🎯 TP2: $0.0797
🎯 TP3: $0.0763
Always DYOR And Never invest all in one trade
Trade here 👇👇
#TA #WillAnthropicListOnTime
Hany Fouad:
Fake setup
12
1
7
4.1k

·
--
Bullish
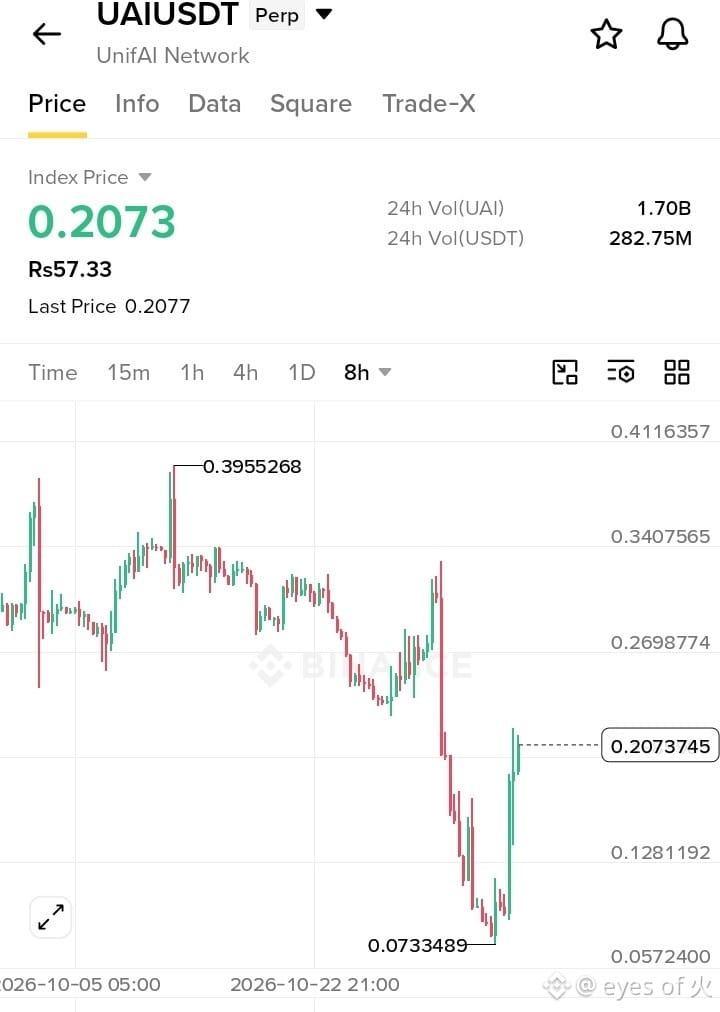
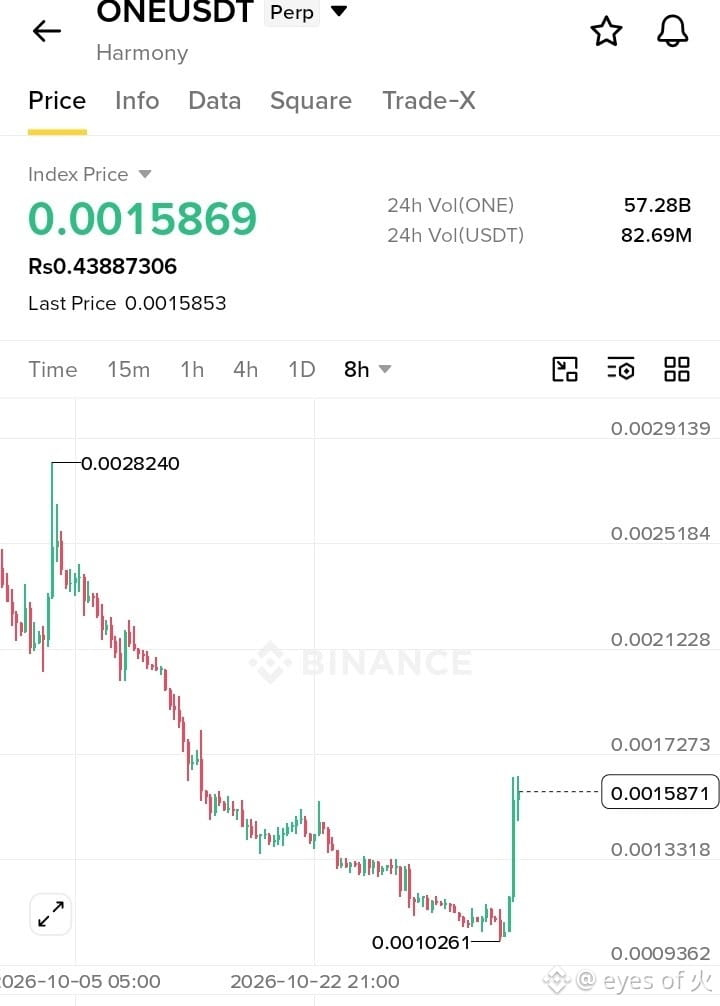
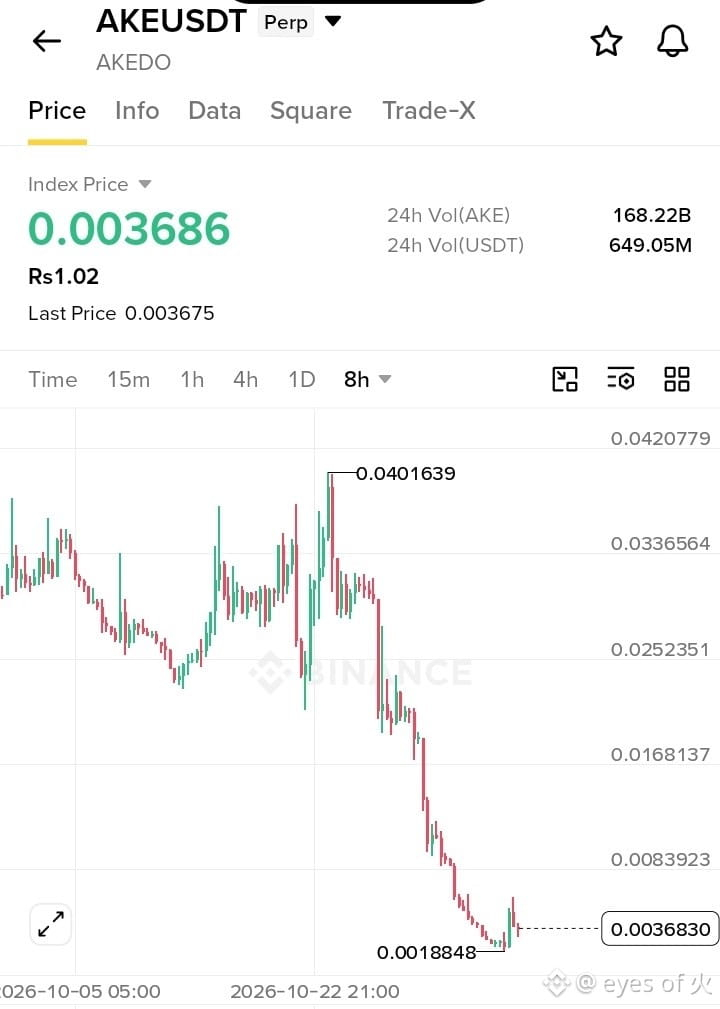
🚀 3 Coins Worth Keeping an Eye On! | $UAI , $ONE & $AKE
The market has been interesting lately, and these three coins are showing some noticeable movement on their 8H charts. 👀
🔹 UAIUSDT: Currently around $0.2073, with $282.75M in 24-hour trading volume. It has bounced strongly from its recent low of $0.0733.
🔹 ONEUSDT: Trading near $0.0015869, with $82.69M in volume. After a long downtrend, buyers have started showing some strength.
🔹 AKEUSDT: Currently around $0.003686, with an impressive $649.05M in 24-hour volume. It's also showing signs of a recovery after a major decline.
All three have caught my attention because of their recent price action and volume. The big question now is whether buyers can maintain this momentum.
Keep an eye on these charts, stay patient, and never forget risk management. No guaranteed moves in crypto!
What's your favorite among these three? 👇
#USMidtermsCouldShakeUpUS-IranTies #TradFiForBeginners #USNovemberMichiganExpectationsIndexPrelimAt50.9 #WillAnthropicListOnTime #JobsReportRaisesHikeOdds
{future}(UAIUSDT)
{future}(ONEUSDT)
{future}(AKEUSDT)
🚀 3 Coins Worth Keeping an Eye On! | $UAI , $ONE & $AKE
The market has been interesting lately, and these three coins are showing some noticeable movement on their 8H charts. 👀
🔹 UAIUSDT: Currently around $0.2073, with $282.75M in 24-hour trading volume. It has bounced strongly from its recent low of $0.0733.
🔹 ONEUSDT: Trading near $0.0015869, with $82.69M in volume. After a long downtrend, buyers have started showing some strength.
🔹 AKEUSDT: Currently around $0.003686, with an impressive $649.05M in 24-hour volume. It's also showing signs of a recovery after a major decline.
All three have caught my attention because of their recent price action and volume. The big question now is whether buyers can maintain this momentum.
Keep an eye on these charts, stay patient, and never forget risk management. No guaranteed moves in crypto!
What's your favorite among these three? 👇
#USMidtermsCouldShakeUpUS-IranTies #TradFiForBeginners #USNovemberMichiganExpectationsIndexPrelimAt50.9 #WillAnthropicListOnTime #JobsReportRaisesHikeOdds
The market has been interesting lately, and these three coins are showing some noticeable movement on their 8H charts. 👀
🔹 UAIUSDT: Currently around $0.2073, with $282.75M in 24-hour trading volume. It has bounced strongly from its recent low of $0.0733.
🔹 ONEUSDT: Trading near $0.0015869, with $82.69M in volume. After a long downtrend, buyers have started showing some strength.
🔹 AKEUSDT: Currently around $0.003686, with an impressive $649.05M in 24-hour volume. It's also showing signs of a recovery after a major decline.
All three have caught my attention because of their recent price action and volume. The big question now is whether buyers can maintain this momentum.
Keep an eye on these charts, stay patient, and never forget risk management. No guaranteed moves in crypto!
What's your favorite among these three? 👇
#USMidtermsCouldShakeUpUS-IranTies #TradFiForBeginners #USNovemberMichiganExpectationsIndexPrelimAt50.9 #WillAnthropicListOnTime #JobsReportRaisesHikeOdds
2
134

·
--
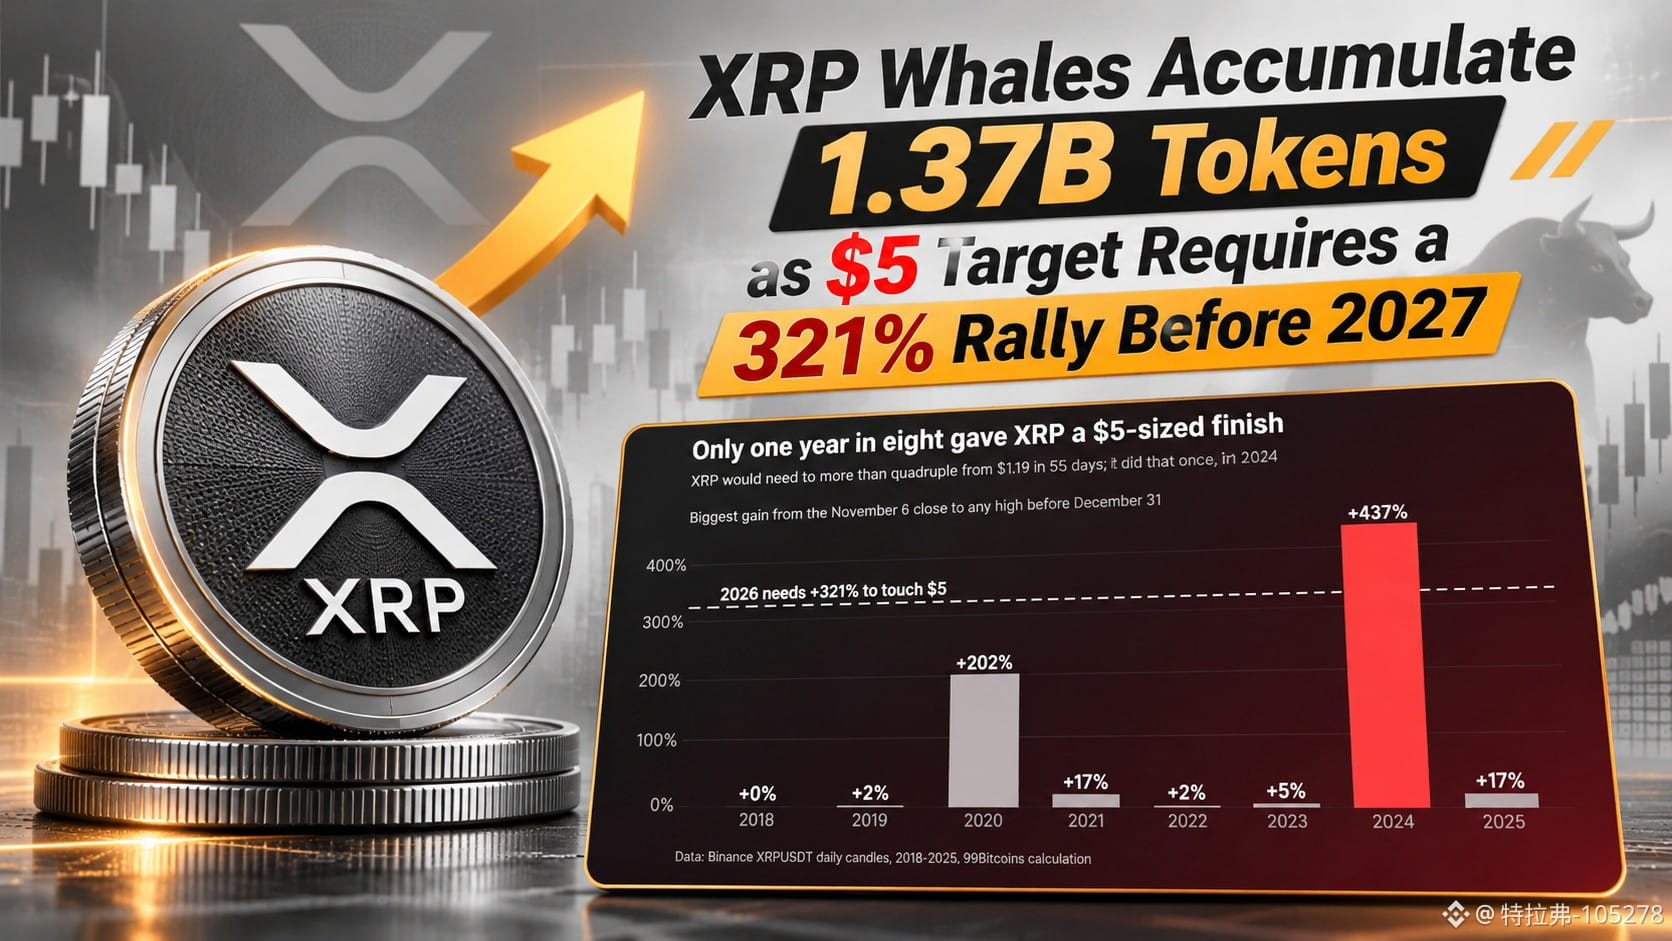
XRP Whales Accumulate 1.37 Billion Tokens as $5 Target Requires a 321% Rally Before 2027;
XRP is showing an interesting market contradiction. While its price continues to struggle, large holders are steadily increasing their positions.
According to the latest on-chain data highlighted in the report, wallets holding at least 1 million XRP increased from 1,657 to 1,764. Wallets holding more than 10 million XRP rose from 317 to 338, while those holding over 100 million XRP increased from 22 to 24.
Overall, large holders accumulated approximately 1.37 billion XRP, worth around $1.6 billion at the reported price, despite XRP declining approximately 18%.
Can XRP Reach $5 Before 2027?
With XRP trading near $1.19, reaching $5 would require an approximately 321% rally in just 55 days.
XRP has demonstrated similar explosive momentum before. During November and December 2024, the token surged approximately 437%.
However, historical performance does not guarantee another rally of the same magnitude.
At $5, XRP's market capitalization would approach approximately $318 billion.
XRP's weekly chart remains under pressure, with the price trading below its key moving averages.
Key levels to monitor:
- $1.18: Immediate support.
- $0.99: Major downside support.
- $1.32: 20-week EMA.
- $1.48: 50-week EMA.
- $1.70: Important resistance.
- $2.42: 2026 high.
A recovery above $1.32 and $1.48 could improve the technical outlook, while a stronger breakout above $1.70 would signal improving momentum.
On the downside, losing $1.18 could expose XRP to another decline toward $0.99.
However, whale accumulation alone cannot guarantee a recovery. Stronger market demand and a breakout above key resistance levels are still needed.
The key question is whether whale accumulation can translate into enough buying pressure to reverse XRP's current weakness.
A move toward $5 remains an ambitious scenario rather than a confirmed outcome. For now, $1.18 support and the $1.48–$1.70 recovery zone deserve close attention.
$XRP
{future}(XRPUSDT)
#WillAnthropicListOnTime
XRP Whales Accumulate 1.37 Billion Tokens as $5 Target Requires a 321% Rally Before 2027;
XRP is showing an interesting market contradiction. While its price continues to struggle, large holders are steadily increasing their positions.
According to the latest on-chain data highlighted in the report, wallets holding at least 1 million XRP increased from 1,657 to 1,764. Wallets holding more than 10 million XRP rose from 317 to 338, while those holding over 100 million XRP increased from 22 to 24.
Overall, large holders accumulated approximately 1.37 billion XRP, worth around $1.6 billion at the reported price, despite XRP declining approximately 18%.
Can XRP Reach $5 Before 2027?
With XRP trading near $1.19, reaching $5 would require an approximately 321% rally in just 55 days.
XRP has demonstrated similar explosive momentum before. During November and December 2024, the token surged approximately 437%.
However, historical performance does not guarantee another rally of the same magnitude.
At $5, XRP's market capitalization would approach approximately $318 billion.
XRP's weekly chart remains under pressure, with the price trading below its key moving averages.
Key levels to monitor:
- $1.18: Immediate support.
- $0.99: Major downside support.
- $1.32: 20-week EMA.
- $1.48: 50-week EMA.
- $1.70: Important resistance.
- $2.42: 2026 high.
A recovery above $1.32 and $1.48 could improve the technical outlook, while a stronger breakout above $1.70 would signal improving momentum.
On the downside, losing $1.18 could expose XRP to another decline toward $0.99.
However, whale accumulation alone cannot guarantee a recovery. Stronger market demand and a breakout above key resistance levels are still needed.
The key question is whether whale accumulation can translate into enough buying pressure to reverse XRP's current weakness.
A move toward $5 remains an ambitious scenario rather than a confirmed outcome. For now, $1.18 support and the $1.48–$1.70 recovery zone deserve close attention.
$XRP
#WillAnthropicListOnTime
XRP is showing an interesting market contradiction. While its price continues to struggle, large holders are steadily increasing their positions.
According to the latest on-chain data highlighted in the report, wallets holding at least 1 million XRP increased from 1,657 to 1,764. Wallets holding more than 10 million XRP rose from 317 to 338, while those holding over 100 million XRP increased from 22 to 24.
Overall, large holders accumulated approximately 1.37 billion XRP, worth around $1.6 billion at the reported price, despite XRP declining approximately 18%.
Can XRP Reach $5 Before 2027?
With XRP trading near $1.19, reaching $5 would require an approximately 321% rally in just 55 days.
XRP has demonstrated similar explosive momentum before. During November and December 2024, the token surged approximately 437%.
However, historical performance does not guarantee another rally of the same magnitude.
At $5, XRP's market capitalization would approach approximately $318 billion.
XRP's weekly chart remains under pressure, with the price trading below its key moving averages.
Key levels to monitor:
- $1.18: Immediate support.
- $0.99: Major downside support.
- $1.32: 20-week EMA.
- $1.48: 50-week EMA.
- $1.70: Important resistance.
- $2.42: 2026 high.
A recovery above $1.32 and $1.48 could improve the technical outlook, while a stronger breakout above $1.70 would signal improving momentum.
On the downside, losing $1.18 could expose XRP to another decline toward $0.99.
However, whale accumulation alone cannot guarantee a recovery. Stronger market demand and a breakout above key resistance levels are still needed.
The key question is whether whale accumulation can translate into enough buying pressure to reverse XRP's current weakness.
A move toward $5 remains an ambitious scenario rather than a confirmed outcome. For now, $1.18 support and the $1.48–$1.70 recovery zone deserve close attention.
$XRP
#WillAnthropicListOnTime
1
263
·
--
What's this 🤔 is this Real Or Anyone know about this 👇🏼#JobsReportRaisesHikeOdds #WillAnthropicListOnTime #USNovemberMichiganExpectationsIndexPrelimAt50.9 #TradFiForBeginners #USMidtermsCouldShakeUpUS-IranTies $UAI $AKE $CYBER
What's this 🤔 is this Real Or Anyone know about this 👇🏼#JobsReportRaisesHikeOdds #WillAnthropicListOnTime #USNovemberMichiganExpectationsIndexPrelimAt50.9 #TradFiForBeginners #USMidtermsCouldShakeUpUS-IranTies $UAI $AKE $CYBER
24

·
--
$TUT Price ~$0.0170, up +5% on the day;
day range $0.01569–$0.01733; market cap $14.2M. Down 6.3% over 5 days and 27% over the month.
👉Trend: bouncing after yesterday's sharp drop to $0.0159 (down 9% on a market-wide long-liquidation cascade).
👉Support $0.0155–$0.0166 held — today's low ($0.01569) sat right on it.
👉Resistance $0.0205–$0.0211, then $0.0288.
Verdict: relief bounce inside the range, bearish bias intact — needs a daily close above $0.0211 to turn constructive.
{spot}(TUTUSDT)
#JobsReportRaisesHikeOdds #WillAnthropicListOnTime #USNovemberMichiganExpectationsIndexPrelimAt50.9 #TradFiForBeginners #USMidtermsCouldShakeUpUS-IranTies
$TUT Price ~$0.0170, up +5% on the day;
day range $0.01569–$0.01733; market cap $14.2M. Down 6.3% over 5 days and 27% over the month.
👉Trend: bouncing after yesterday's sharp drop to $0.0159 (down 9% on a market-wide long-liquidation cascade).
👉Support $0.0155–$0.0166 held — today's low ($0.01569) sat right on it.
👉Resistance $0.0205–$0.0211, then $0.0288.
Verdict: relief bounce inside the range, bearish bias intact — needs a daily close above $0.0211 to turn constructive.
#JobsReportRaisesHikeOdds #WillAnthropicListOnTime #USNovemberMichiganExpectationsIndexPrelimAt50.9 #TradFiForBeginners #USMidtermsCouldShakeUpUS-IranTies
day range $0.01569–$0.01733; market cap $14.2M. Down 6.3% over 5 days and 27% over the month.
👉Trend: bouncing after yesterday's sharp drop to $0.0159 (down 9% on a market-wide long-liquidation cascade).
👉Support $0.0155–$0.0166 held — today's low ($0.01569) sat right on it.
👉Resistance $0.0205–$0.0211, then $0.0288.
Verdict: relief bounce inside the range, bearish bias intact — needs a daily close above $0.0211 to turn constructive.
#JobsReportRaisesHikeOdds #WillAnthropicListOnTime #USNovemberMichiganExpectationsIndexPrelimAt50.9 #TradFiForBeginners #USMidtermsCouldShakeUpUS-IranTies
161

·
--
Partly True
🚨 $SNDK SHORT SQUEEZE ALERT — BEARS UNDER PRESSURE! 🟢
A notable liquidation event has hit $SNDK, with $50.9K in short positions wiped out at $856.21.
🐻 What Just Happened?
Short sellers betting against SNDK were forced out of their positions, potentially adding buying pressure and creating room for further upside momentum.
📊 My Market Outlook:
- Bullish Scenario: If buyers defend the $856 area, SNDK could attract fresh momentum and attempt another upward move.
- Bearish Scenario: Failure to hold this zone may trigger profit-taking and a possible pullback.
- Key Signal: Watch trading volume and price acceptance above $856.21 for confirmation.
🎯 My Trading Opinion:
The liquidation gives bulls an interesting advantage, but one event doesn't confirm a sustained breakout. I'd favor a cautious bullish bias while monitoring follow-through.
⚡ Stay alert — the next move could catch overleveraged traders off guard!
⚠️ Risk management is essential. Always wait for confirmation before entering a position.
#JobsReportRaisesHikeOdds #WillAnthropicListOnTime #TradFiForBeginners #AnthropicIPOValuationDoubts
#USMidtermsCouldShakeUpUS-IranTies
{stock_us}(SNDK.US)
🚨 $SNDK SHORT SQUEEZE ALERT — BEARS UNDER PRESSURE! 🟢
A notable liquidation event has hit $SNDK, with $50.9K in short positions wiped out at $856.21.
🐻 What Just Happened?
Short sellers betting against SNDK were forced out of their positions, potentially adding buying pressure and creating room for further upside momentum.
📊 My Market Outlook:
- Bullish Scenario: If buyers defend the $856 area, SNDK could attract fresh momentum and attempt another upward move.
- Bearish Scenario: Failure to hold this zone may trigger profit-taking and a possible pullback.
- Key Signal: Watch trading volume and price acceptance above $856.21 for confirmation.
🎯 My Trading Opinion:
The liquidation gives bulls an interesting advantage, but one event doesn't confirm a sustained breakout. I'd favor a cautious bullish bias while monitoring follow-through.
⚡ Stay alert — the next move could catch overleveraged traders off guard!
⚠️ Risk management is essential. Always wait for confirmation before entering a position.
#JobsReportRaisesHikeOdds #WillAnthropicListOnTime #TradFiForBeginners #AnthropicIPOValuationDoubts
#USMidtermsCouldShakeUpUS-IranTies
A notable liquidation event has hit $SNDK, with $50.9K in short positions wiped out at $856.21.
🐻 What Just Happened?
Short sellers betting against SNDK were forced out of their positions, potentially adding buying pressure and creating room for further upside momentum.
📊 My Market Outlook:
- Bullish Scenario: If buyers defend the $856 area, SNDK could attract fresh momentum and attempt another upward move.
- Bearish Scenario: Failure to hold this zone may trigger profit-taking and a possible pullback.
- Key Signal: Watch trading volume and price acceptance above $856.21 for confirmation.
🎯 My Trading Opinion:
The liquidation gives bulls an interesting advantage, but one event doesn't confirm a sustained breakout. I'd favor a cautious bullish bias while monitoring follow-through.
⚡ Stay alert — the next move could catch overleveraged traders off guard!
⚠️ Risk management is essential. Always wait for confirmation before entering a position.
#JobsReportRaisesHikeOdds #WillAnthropicListOnTime #TradFiForBeginners #AnthropicIPOValuationDoubts
#USMidtermsCouldShakeUpUS-IranTies
SNDK+0.78%
SNDKUS+3.34%
730

·
--
Bearish
$GRAM is trading around $1.10, down 0.63% daily. The price action remains relatively weak, with buyers yet to show convincing recovery strength.
GRAM — SHORT
Entry: 1.095 – 1.105
SL: 1.125
TP1: 1.085
TP2: 1.070
TP3: 1.055
TP4: 1.035
GRAM is struggling to build upward momentum around its current price. If sellers continue defending the $1.10–$1.12 region, downside continuation remains possible. A strong reclaim above resistance could invalidate this setup.
#WillAnthropicListOnTime #TradFiForBeginners #JobsReportRaisesHikeOdds
#Binance
$GRAM is trading around $1.10, down 0.63% daily. The price action remains relatively weak, with buyers yet to show convincing recovery strength.
GRAM — SHORT
Entry: 1.095 – 1.105
SL: 1.125
TP1: 1.085
TP2: 1.070
TP3: 1.055
TP4: 1.035
GRAM is struggling to build upward momentum around its current price. If sellers continue defending the $1.10–$1.12 region, downside continuation remains possible. A strong reclaim above resistance could invalidate this setup.
#WillAnthropicListOnTime #TradFiForBeginners #JobsReportRaisesHikeOdds
#Binance
GRAM — SHORT
Entry: 1.095 – 1.105
SL: 1.125
TP1: 1.085
TP2: 1.070
TP3: 1.055
TP4: 1.035
GRAM is struggling to build upward momentum around its current price. If sellers continue defending the $1.10–$1.12 region, downside continuation remains possible. A strong reclaim above resistance could invalidate this setup.
#WillAnthropicListOnTime #TradFiForBeginners #JobsReportRaisesHikeOdds
#Binance
267
{spot}(ARBUSDT)
$ARB is standing out while several major altcoins remain under pressure.
💰 Price: ~$0.169 | 24H: +4.1%
Its recent performance suggests buyers are showing interest.
Sustained volume could support further recovery, but market weakness remains a risk.
👀 Can ARB maintain its momentum?
#TradFiForBeginners #WillAnthropicListOnTime #JobsReportRaisesHikeOdds #ARB🔥🔥🔥 #ArbitrumBOLD
$ARB is standing out while several major altcoins remain under pressure.
💰 Price: ~$0.169 | 24H: +4.1%
Its recent performance suggests buyers are showing interest.
Sustained volume could support further recovery, but market weakness remains a risk.
👀 Can ARB maintain its momentum?
#TradFiForBeginners #WillAnthropicListOnTime #JobsReportRaisesHikeOdds #ARB🔥🔥🔥 #ArbitrumBOLD
💰 Price: ~$0.169 | 24H: +4.1%
Its recent performance suggests buyers are showing interest.
Sustained volume could support further recovery, but market weakness remains a risk.
👀 Can ARB maintain its momentum?
#TradFiForBeginners #WillAnthropicListOnTime #JobsReportRaisesHikeOdds #ARB🔥🔥🔥 #ArbitrumBOLD
161

Oooops Guy's 😬 RED ALERT!
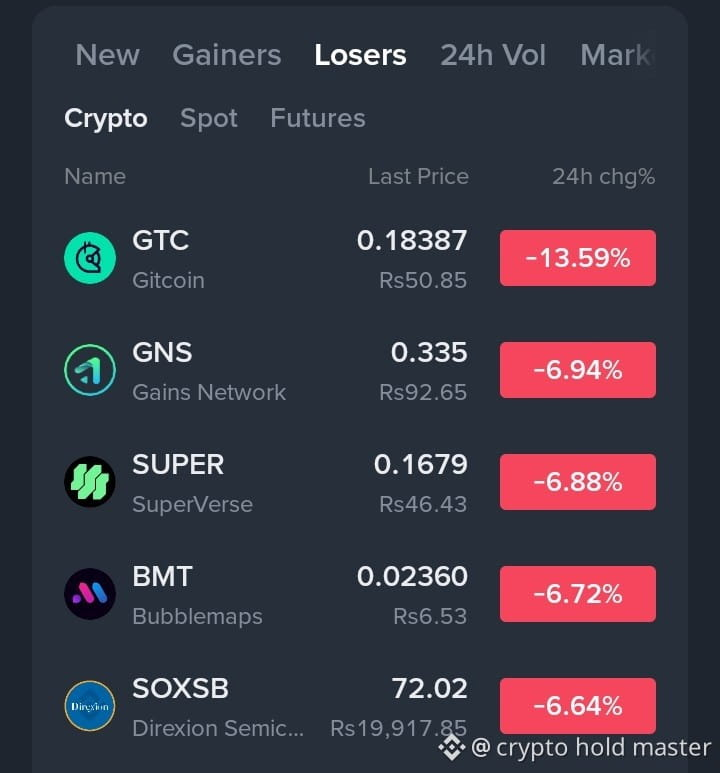
Not every coin is enjoying the green market today. Some projects are taking a serious hit, with #GTC leading the losers list.
Here's what the latest Binance leaderboard shows:
🔴 $GTC — -13.59%
🔴 $GNS — -6.94%
🔴 $SUPER — -6.88%
🔴 $BMT — -6.72%
🔴 $SOXSB — -6.64%
#GTC is clearly under the most pressure, while the others are also struggling to hold their ground.
This is a reminder that market momentum can change quickly. Avoid panic trading and wait for proper confirmation before taking any position.
Do you think these coins will recover, or is another correction coming? 👀
#JobsReportRaisesHikeOdds #WillAnthropicListOnTime #USNovemberMichiganExpectationsIndexPrelimAt50.9
Oooops Guy's 😬 RED ALERT!
Not every coin is enjoying the green market today. Some projects are taking a serious hit, with #GTC leading the losers list.
Here's what the latest Binance leaderboard shows:
🔴 $GTC — -13.59%
🔴 $GNS — -6.94%
🔴 $SUPER — -6.88%
🔴 $BMT — -6.72%
🔴 $SOXSB — -6.64%
#GTC is clearly under the most pressure, while the others are also struggling to hold their ground.
This is a reminder that market momentum can change quickly. Avoid panic trading and wait for proper confirmation before taking any position.
Do you think these coins will recover, or is another correction coming? 👀
#JobsReportRaisesHikeOdds #WillAnthropicListOnTime #USNovemberMichiganExpectationsIndexPrelimAt50.9
Not every coin is enjoying the green market today. Some projects are taking a serious hit, with #GTC leading the losers list.
Here's what the latest Binance leaderboard shows:
🔴 $GTC — -13.59%
🔴 $GNS — -6.94%
🔴 $SUPER — -6.88%
🔴 $BMT — -6.72%
🔴 $SOXSB — -6.64%
#GTC is clearly under the most pressure, while the others are also struggling to hold their ground.
This is a reminder that market momentum can change quickly. Avoid panic trading and wait for proper confirmation before taking any position.
Do you think these coins will recover, or is another correction coming? 👀
#JobsReportRaisesHikeOdds #WillAnthropicListOnTime #USNovemberMichiganExpectationsIndexPrelimAt50.9
1
244

Article
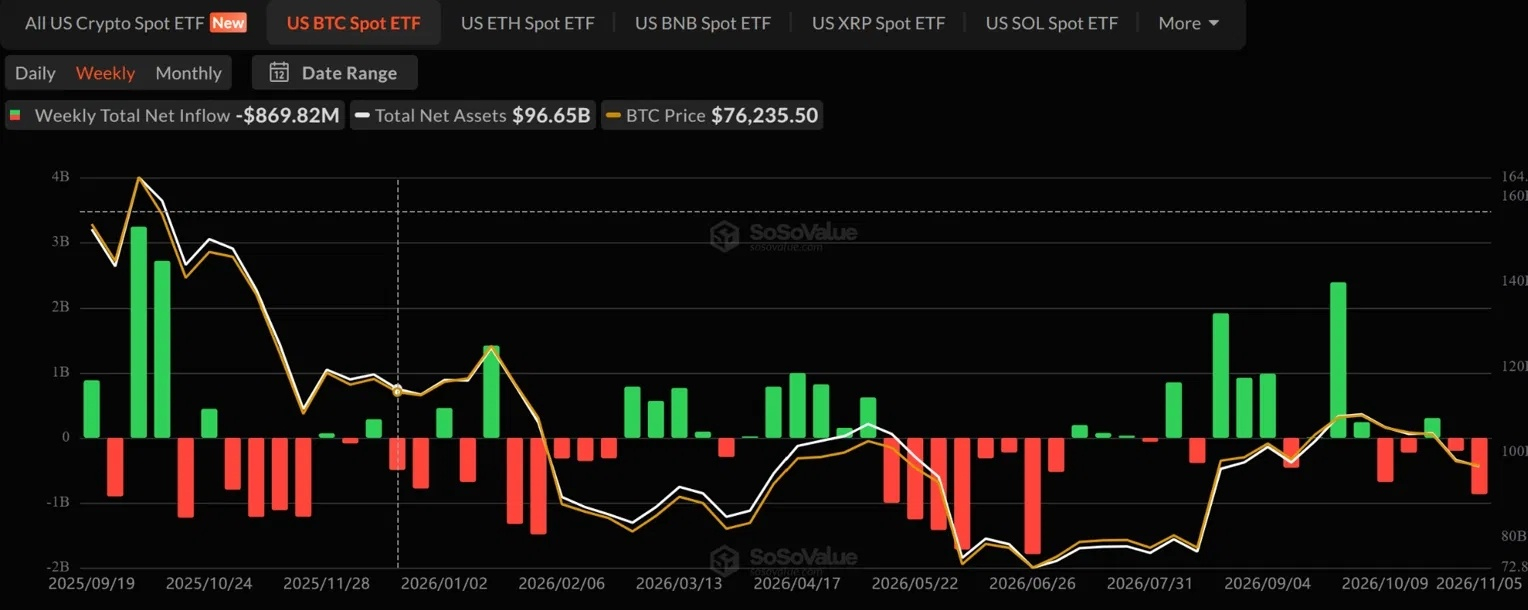
Massive $26B Bitcoin ETF Selloff Erases All 2026 Inflows: Net Flows Flip NegativeThe institutional hype around Wall Street’s spot Bitcoin ETFs has officially hit its biggest roadblock yet. In a dramatic shift for the market, a massive wave of outflows has completely wiped out all the net positive inflows built up throughout 2026.
Data from SoSoValue through November 5 shows a stark reversal in how capital is moving. Year-to-date, US spot Bitcoin ETFs managed to bring in an impressive $25.6 billion. However, that momentum was completely swallowed up by a staggering $26.1 billion in total payouts over the same period.
This aggressive capital flight leaves total net flows for 2026 sitting in negative territory at minus $502 million.
From Market Catalyst to Major Overhead Pressure
For most of this cycle, the dominant narrative was that relentless buying from spot ETFs would act as a permanent cushion for Bitcoin's price. For months, these funds reliably absorbed circulating supply and drove the market forward.
This sudden reversal tells a different story. It suggests that institutional players and retail investors using traditional brokerage accounts are quickly pulling back. This multi-billion-dollar liquidation has turned a former demand catalyst into a heavy source of selling pressure, contributing heavily to the recent choppiness across the crypto space.
What is Driving the Capital Flight?
Several macroeconomic shifts explain why investors are hitting the exit button:
Broad De-risking: Heightened economic uncertainty and recent corrections in the tech sector have prompted fund managers to trim their exposure to high-volatility assets.Aggressive Profit-Taking: Following major political and economic milestones earlier in the quarter, large entities are choosing to lock in their gains rather than ride out potential volatility.Rotation to Cash: Capital is temporarily moving back into traditional yields or cash positions until a clear, directional trend re-emerges.
The Silver Lining for Spot Markets
While hitting a negative net flow milestone looks bad on paper, it isn't entirely grim. Analysts note that this massive distribution phase effectively flushes out speculative, short-term institutional capital.
The fact that the market has absorbed over $26 billion in outflows without a complete systemic collapse shows robust organic demand independent of Wall Street. For long-term investors, this reset establishes a healthier, cleaner foundation by separating true network adoption from macro-driven fund flows.
#BitcoinRebounds$75KAsChipsLead #WillAnthropicListOnTime $BTC #$2TWipedOutHedgeFundsFaceLiquidation #USMidtermsCouldShakeUpUS-IranTies #RussianCentralBankNamesBTCETHUSDTForNonQualifiedInvestors
Massive $26B Bitcoin ETF Selloff Erases All 2026 Inflows: Net Flows Flip Negative
The institutional hype around Wall Street’s spot Bitcoin ETFs has officially hit its biggest roadblock yet. In a dramatic shift for the market, a massive wave of outflows has completely wiped out all the net positive inflows built up throughout 2026.
Data from SoSoValue through November 5 shows a stark reversal in how capital is moving. Year-to-date, US spot Bitcoin ETFs managed to bring in an impressive $25.6 billion. However, that momentum was completely swallowed up by a staggering $26.1 billion in total payouts over the same period.
This aggressive capital flight leaves total net flows for 2026 sitting in negative territory at minus $502 million.
From Market Catalyst to Major Overhead Pressure
For most of this cycle, the dominant narrative was that relentless buying from spot ETFs would act as a permanent cushion for Bitcoin's price. For months, these funds reliably absorbed circulating supply and drove the market forward.
This sudden reversal tells a different story. It suggests that institutional players and retail investors using traditional brokerage accounts are quickly pulling back. This multi-billion-dollar liquidation has turned a former demand catalyst into a heavy source of selling pressure, contributing heavily to the recent choppiness across the crypto space.
What is Driving the Capital Flight?
Several macroeconomic shifts explain why investors are hitting the exit button:
Broad De-risking: Heightened economic uncertainty and recent corrections in the tech sector have prompted fund managers to trim their exposure to high-volatility assets.Aggressive Profit-Taking: Following major political and economic milestones earlier in the quarter, large entities are choosing to lock in their gains rather than ride out potential volatility.Rotation to Cash: Capital is temporarily moving back into traditional yields or cash positions until a clear, directional trend re-emerges.
The Silver Lining for Spot Markets
While hitting a negative net flow milestone looks bad on paper, it isn't entirely grim. Analysts note that this massive distribution phase effectively flushes out speculative, short-term institutional capital.
The fact that the market has absorbed over $26 billion in outflows without a complete systemic collapse shows robust organic demand independent of Wall Street. For long-term investors, this reset establishes a healthier, cleaner foundation by separating true network adoption from macro-driven fund flows.
#BitcoinRebounds$75KAsChipsLead #WillAnthropicListOnTime $BTC #$2TWipedOutHedgeFundsFaceLiquidation #USMidtermsCouldShakeUpUS-IranTies #RussianCentralBankNamesBTCETHUSDTForNonQualifiedInvestors
Data from SoSoValue through November 5 shows a stark reversal in how capital is moving. Year-to-date, US spot Bitcoin ETFs managed to bring in an impressive $25.6 billion. However, that momentum was completely swallowed up by a staggering $26.1 billion in total payouts over the same period.
This aggressive capital flight leaves total net flows for 2026 sitting in negative territory at minus $502 million.
From Market Catalyst to Major Overhead Pressure
For most of this cycle, the dominant narrative was that relentless buying from spot ETFs would act as a permanent cushion for Bitcoin's price. For months, these funds reliably absorbed circulating supply and drove the market forward.
This sudden reversal tells a different story. It suggests that institutional players and retail investors using traditional brokerage accounts are quickly pulling back. This multi-billion-dollar liquidation has turned a former demand catalyst into a heavy source of selling pressure, contributing heavily to the recent choppiness across the crypto space.
What is Driving the Capital Flight?
Several macroeconomic shifts explain why investors are hitting the exit button:
Broad De-risking: Heightened economic uncertainty and recent corrections in the tech sector have prompted fund managers to trim their exposure to high-volatility assets.Aggressive Profit-Taking: Following major political and economic milestones earlier in the quarter, large entities are choosing to lock in their gains rather than ride out potential volatility.Rotation to Cash: Capital is temporarily moving back into traditional yields or cash positions until a clear, directional trend re-emerges.
The Silver Lining for Spot Markets
While hitting a negative net flow milestone looks bad on paper, it isn't entirely grim. Analysts note that this massive distribution phase effectively flushes out speculative, short-term institutional capital.
The fact that the market has absorbed over $26 billion in outflows without a complete systemic collapse shows robust organic demand independent of Wall Street. For long-term investors, this reset establishes a healthier, cleaner foundation by separating true network adoption from macro-driven fund flows.
#BitcoinRebounds$75KAsChipsLead #WillAnthropicListOnTime $BTC #$2TWipedOutHedgeFundsFaceLiquidation #USMidtermsCouldShakeUpUS-IranTies #RussianCentralBankNamesBTCETHUSDTForNonQualifiedInvestors
1
157
·
--
I need some snacks 🥨🥨 but my account. 😭😭😔
$UAI $CYBER $AKE
#USMidtermsCouldShakeUpUS-IranTies #JobsReportRaisesHikeOdds #USNovemberMichiganExpectationsIndexPrelimAt50.9 #TradFiForBeginners #WillAnthropicListOnTime
I need some snacks 🥨🥨 but my account. 😭😭😔
$UAI $CYBER $AKE
#USMidtermsCouldShakeUpUS-IranTies #JobsReportRaisesHikeOdds #USNovemberMichiganExpectationsIndexPrelimAt50.9 #TradFiForBeginners #WillAnthropicListOnTime
$UAI $CYBER $AKE
#USMidtermsCouldShakeUpUS-IranTies #JobsReportRaisesHikeOdds #USNovemberMichiganExpectationsIndexPrelimAt50.9 #TradFiForBeginners #WillAnthropicListOnTime
27
Log in to explore more content
Join global crypto users on Binance Square
⚡️ Get latest and useful information about crypto.
💬 Trusted by the world’s largest crypto exchange.
👍 Discover real insights from verified creators.
Email / Phone number
Trending Topics
1
#BitcoinRebounds$75KAsChipsLead
3,212 views
83 Discussing
2
#JobsReportRaisesHikeOdds
66,670 views
756 Discussing
3
#US Data Center Rules May Constrain AI Expansion
7,963 views
88 Discussing
4
#$2TWipedOutHedgeFundsFaceLiquidation
10,172 views
91 Discussing
5
#WillAnthropicListOnTime
6,905 views
180 Discussing
6
#USNovemberMichiganExpectationsIndexPrelimAt50.9
13,916 views
286 Discussing
7
#OilPlungesBelow$100
15,523 views
37 Discussing
8
#TradFiForBeginners
8,429 views
169 Discussing
9
#USMidtermsCouldShakeUpUS-IranTies
31,160 views
454 Discussing
10
#RussianCentralBankNamesBTCETHUSDTForNonQualifiedInvestors
545 views
10 Discussing