
#strk
strk
13.9M views
19,820 Discussing
Hot
Latest

{spot}(STRKUSDT)
🚨 $STRK: SELLING PRESSURE IS DOMINATING!
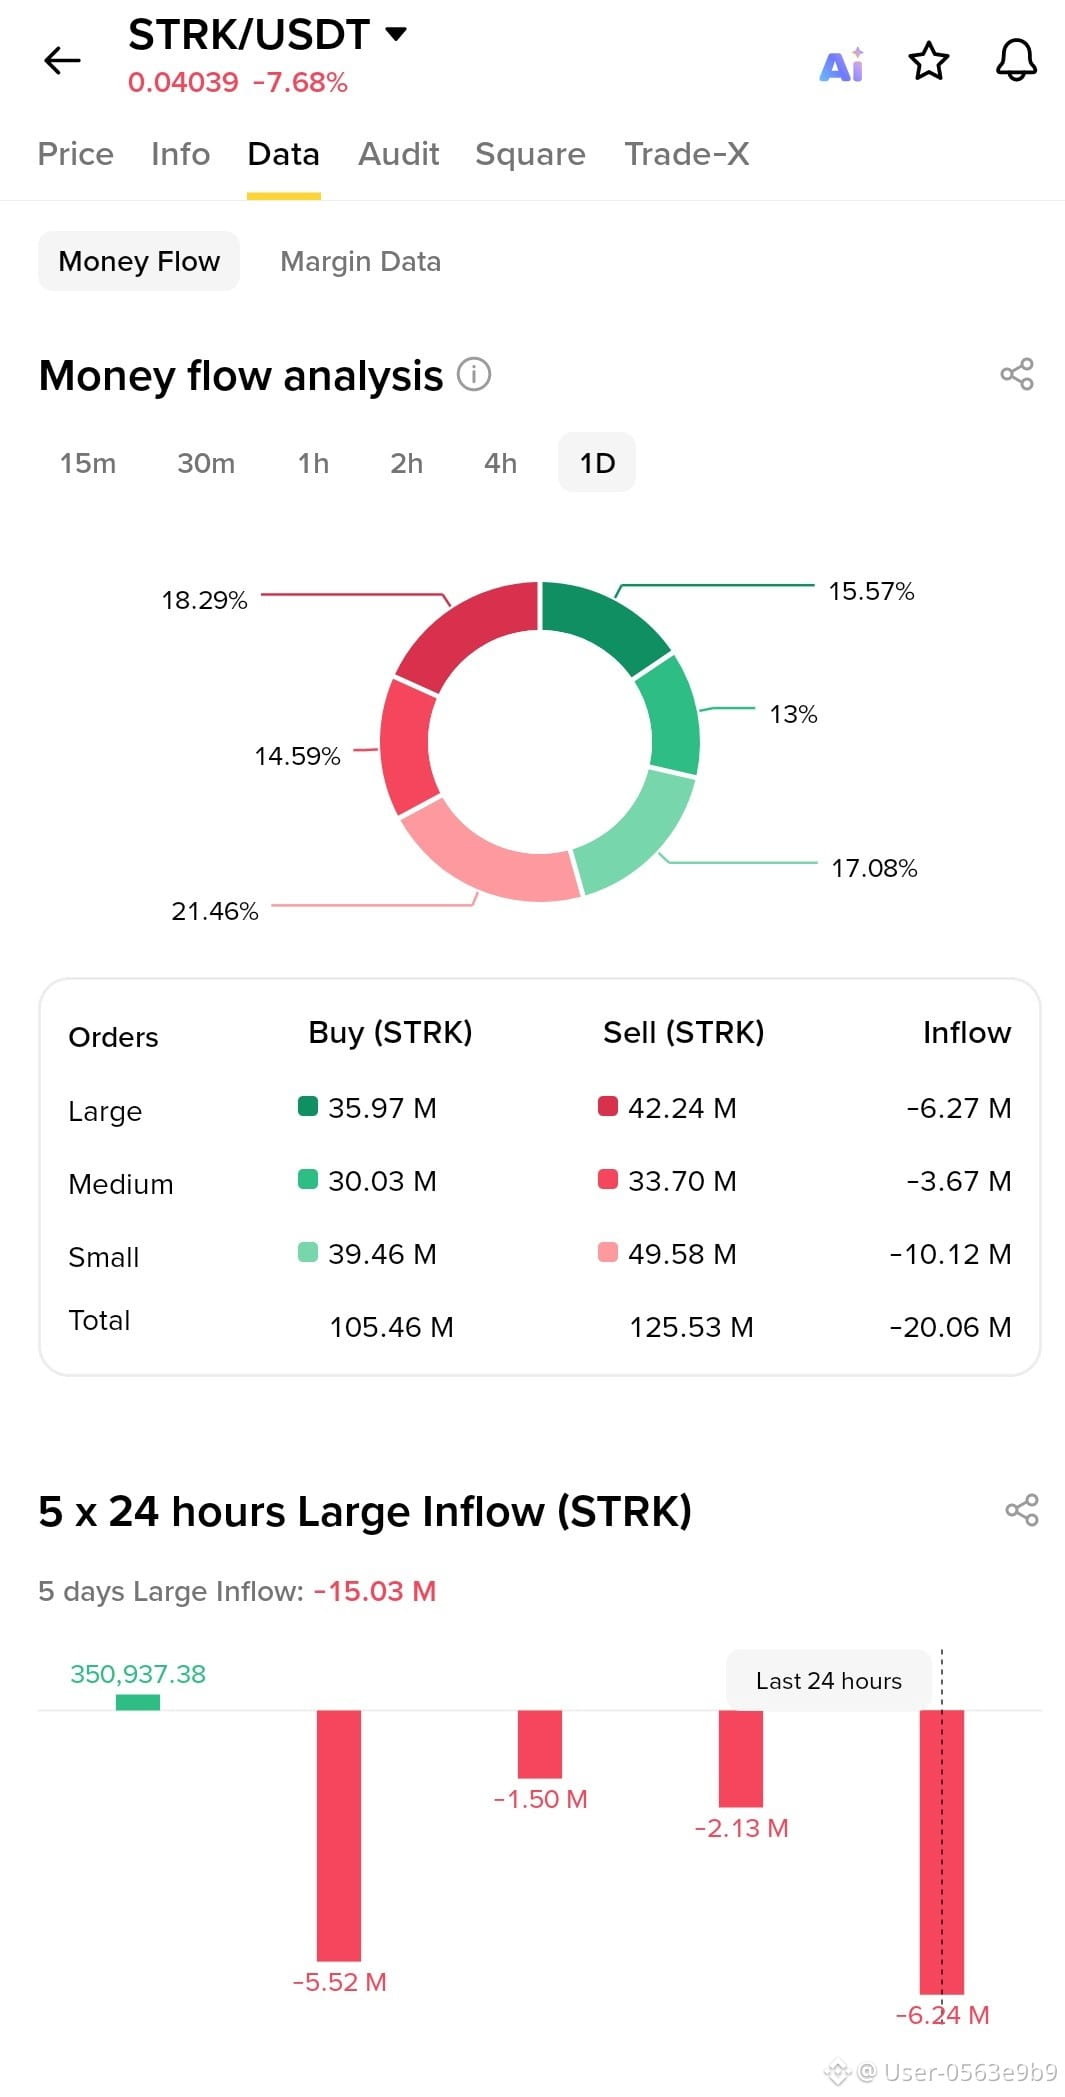
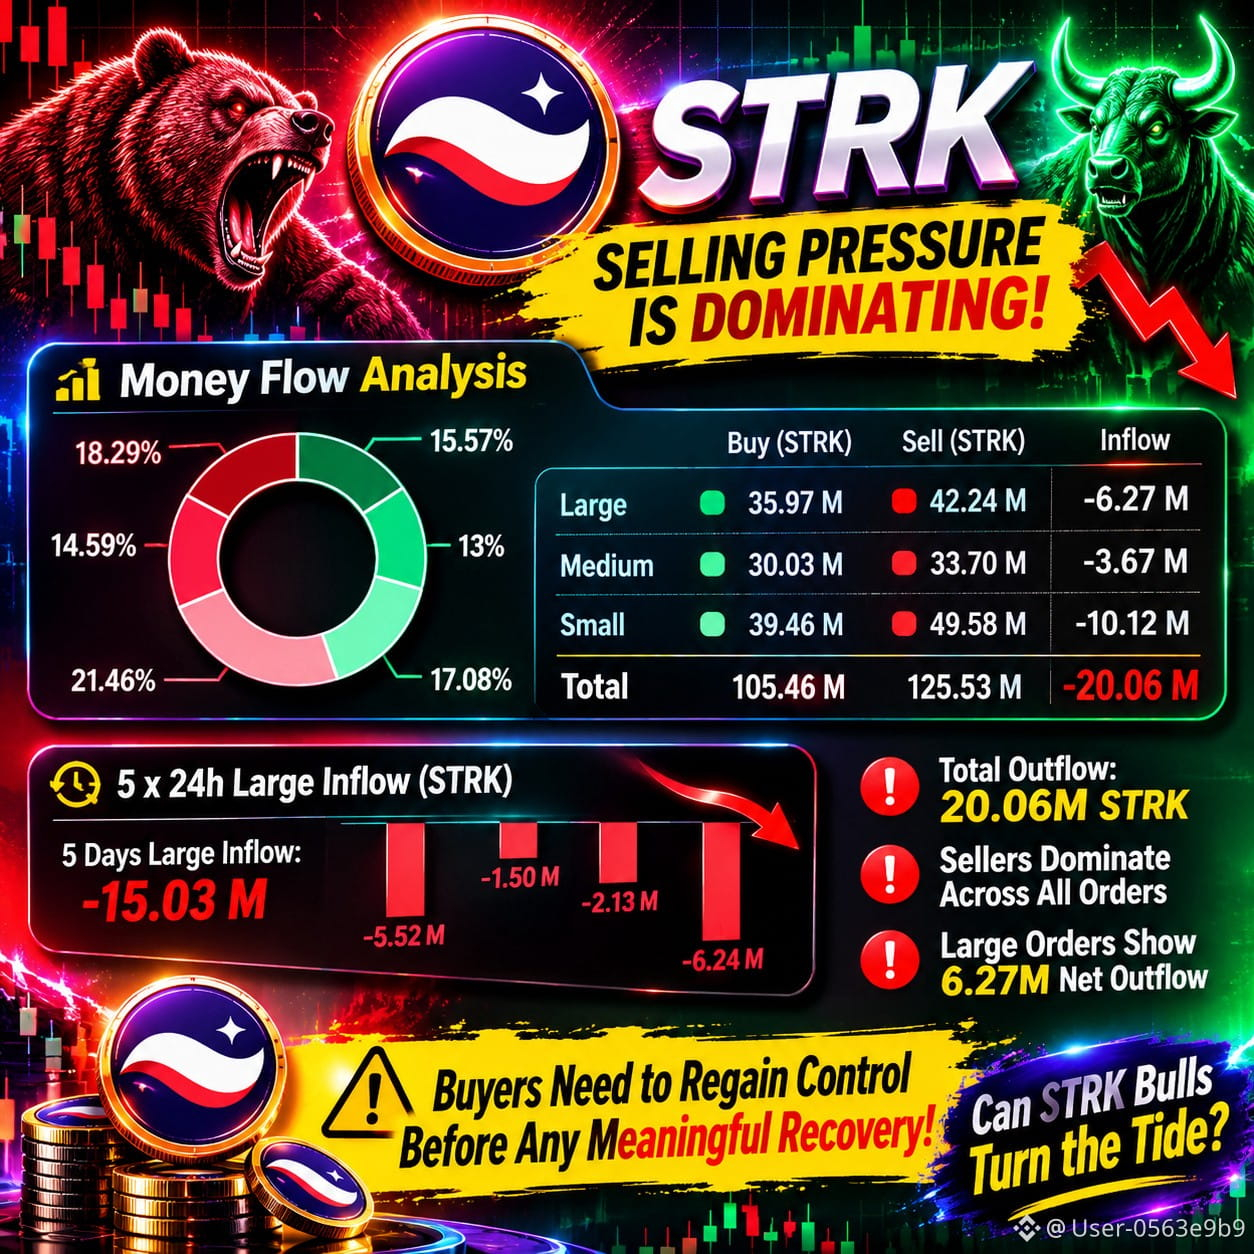
📉 Money flow reveals strong bearish sentiment: 🔴 Total outflow: 20.06M $STRK 🔴 Sellers dominate across all order sizes. 🔴 Large orders show 6.27M net outflow. 🔴 5-day large inflow remains negative at 15.03M.
⚠️ Buyers need to regain control before any meaningful recovery.
Can $STRK bulls turn the tide, or will selling pressure continue? 👀
👉 Please Note: This is for informational and learning purpose only. Not financial advice. Do your own research and analysis before jump into trading.
#STRK #CryptoAnalysis #MoneyFlow #BİNANCESQUARE
🚨 $STRK: SELLING PRESSURE IS DOMINATING!
📉 Money flow reveals strong bearish sentiment: 🔴 Total outflow: 20.06M $STRK 🔴 Sellers dominate across all order sizes. 🔴 Large orders show 6.27M net outflow. 🔴 5-day large inflow remains negative at 15.03M.
⚠️ Buyers need to regain control before any meaningful recovery.
Can $STRK bulls turn the tide, or will selling pressure continue? 👀
👉 Please Note: This is for informational and learning purpose only. Not financial advice. Do your own research and analysis before jump into trading.
#STRK #CryptoAnalysis #MoneyFlow #BİNANCESQUARE
📉 Money flow reveals strong bearish sentiment: 🔴 Total outflow: 20.06M $STRK 🔴 Sellers dominate across all order sizes. 🔴 Large orders show 6.27M net outflow. 🔴 5-day large inflow remains negative at 15.03M.
⚠️ Buyers need to regain control before any meaningful recovery.
Can $STRK bulls turn the tide, or will selling pressure continue? 👀
👉 Please Note: This is for informational and learning purpose only. Not financial advice. Do your own research and analysis before jump into trading.
#STRK #CryptoAnalysis #MoneyFlow #BİNANCESQUARE
2
1.1k

$STRK UNLOCKS THE $1.75 TRILLION PRIVATE CREDIT MARKET WITH ZK PRIVACY TECH ⚡ 🦈
Real World Assets are evolving far beyond basic treasury bills, and Starknet is quietly carving out a massive institutional footprint. Credi Labs is deploying on $STRK using its native STRK20 framework to bridge the behemoth $1.75 trillion private credit sector directly onto Layer 2. 🌊
By harnessing $ZK zero-knowledge architecture, institutions get the non-negotiable transactional privacy they demand while tapping into permissionless speed. This is structural financial infrastructure capturing one of global finance's largest untapped pools. 🔍
Smart liquidity flows where strict compliance meets scalability, positioning the network for a powerful fundamental shift. 💬 Will private credit tokenization become the dominant narrative driving the next RWA expansion cycle? 👇
⚠️ Not financial advice. Always manage your risk. 🛡️
🏷️ #STRK #RWA #Starknet #Crypto #ZK
🔥 💎
$STRK UNLOCKS THE $1.75 TRILLION PRIVATE CREDIT MARKET WITH ZK PRIVACY TECH ⚡ 🦈
Real World Assets are evolving far beyond basic treasury bills, and Starknet is quietly carving out a massive institutional footprint. Credi Labs is deploying on $STRK using its native STRK20 framework to bridge the behemoth $1.75 trillion private credit sector directly onto Layer 2. 🌊
By harnessing $ZK zero-knowledge architecture, institutions get the non-negotiable transactional privacy they demand while tapping into permissionless speed. This is structural financial infrastructure capturing one of global finance's largest untapped pools. 🔍
Smart liquidity flows where strict compliance meets scalability, positioning the network for a powerful fundamental shift. 💬 Will private credit tokenization become the dominant narrative driving the next RWA expansion cycle? 👇
⚠️ Not financial advice. Always manage your risk. 🛡️
🏷️ #STRK #RWA #Starknet #Crypto #ZK
🔥 💎
Real World Assets are evolving far beyond basic treasury bills, and Starknet is quietly carving out a massive institutional footprint. Credi Labs is deploying on $STRK using its native STRK20 framework to bridge the behemoth $1.75 trillion private credit sector directly onto Layer 2. 🌊
By harnessing $ZK zero-knowledge architecture, institutions get the non-negotiable transactional privacy they demand while tapping into permissionless speed. This is structural financial infrastructure capturing one of global finance's largest untapped pools. 🔍
Smart liquidity flows where strict compliance meets scalability, positioning the network for a powerful fundamental shift. 💬 Will private credit tokenization become the dominant narrative driving the next RWA expansion cycle? 👇
⚠️ Not financial advice. Always manage your risk. 🛡️
🏷️ #STRK #RWA #Starknet #Crypto #ZK
🔥 💎
9

🦈 SMART MONEY LOCKS 1.5B $STRK AS NETWORK REVENUE EXPLODES 1,200% YOY! 💥
While the broader market chops sideways, institutional capital is silently pulling supply off the open market. 🔒 With 1.5 billion $STRK now locked in staking—representing 22% of circulating supply—and private staking making its debut, smart money is aggressively positioning. 🦈
Fundamentals are outpacing price action in a massive way. 📊 Starknet network revenue surged 1,200% year-over-year while ecosystem dApps printed $40 million, signaling deep structural demand despite market turbulence. ⚡ When supply dries up during an accumulation phase, price usually follows network velocity.
💬 Are you stacking $STRK while supply shrinks or waiting for price action to confirm? 👇
⚠️ Not financial advice. Always manage your risk. 🛡️
🏷️ #STRK #Starknet #Layer2 #Crypto #SmartMoney
💎 🦈
🦈 SMART MONEY LOCKS 1.5B $STRK AS NETWORK REVENUE EXPLODES 1,200% YOY! 💥
While the broader market chops sideways, institutional capital is silently pulling supply off the open market. 🔒 With 1.5 billion $STRK now locked in staking—representing 22% of circulating supply—and private staking making its debut, smart money is aggressively positioning. 🦈
Fundamentals are outpacing price action in a massive way. 📊 Starknet network revenue surged 1,200% year-over-year while ecosystem dApps printed $40 million, signaling deep structural demand despite market turbulence. ⚡ When supply dries up during an accumulation phase, price usually follows network velocity.
💬 Are you stacking $STRK while supply shrinks or waiting for price action to confirm? 👇
⚠️ Not financial advice. Always manage your risk. 🛡️
🏷️ #STRK #Starknet #Layer2 #Crypto #SmartMoney
💎 🦈
While the broader market chops sideways, institutional capital is silently pulling supply off the open market. 🔒 With 1.5 billion $STRK now locked in staking—representing 22% of circulating supply—and private staking making its debut, smart money is aggressively positioning. 🦈
Fundamentals are outpacing price action in a massive way. 📊 Starknet network revenue surged 1,200% year-over-year while ecosystem dApps printed $40 million, signaling deep structural demand despite market turbulence. ⚡ When supply dries up during an accumulation phase, price usually follows network velocity.
💬 Are you stacking $STRK while supply shrinks or waiting for price action to confirm? 👇
⚠️ Not financial advice. Always manage your risk. 🛡️
🏷️ #STRK #Starknet #Layer2 #Crypto #SmartMoney
💎 🦈
1


·
--
Bullish
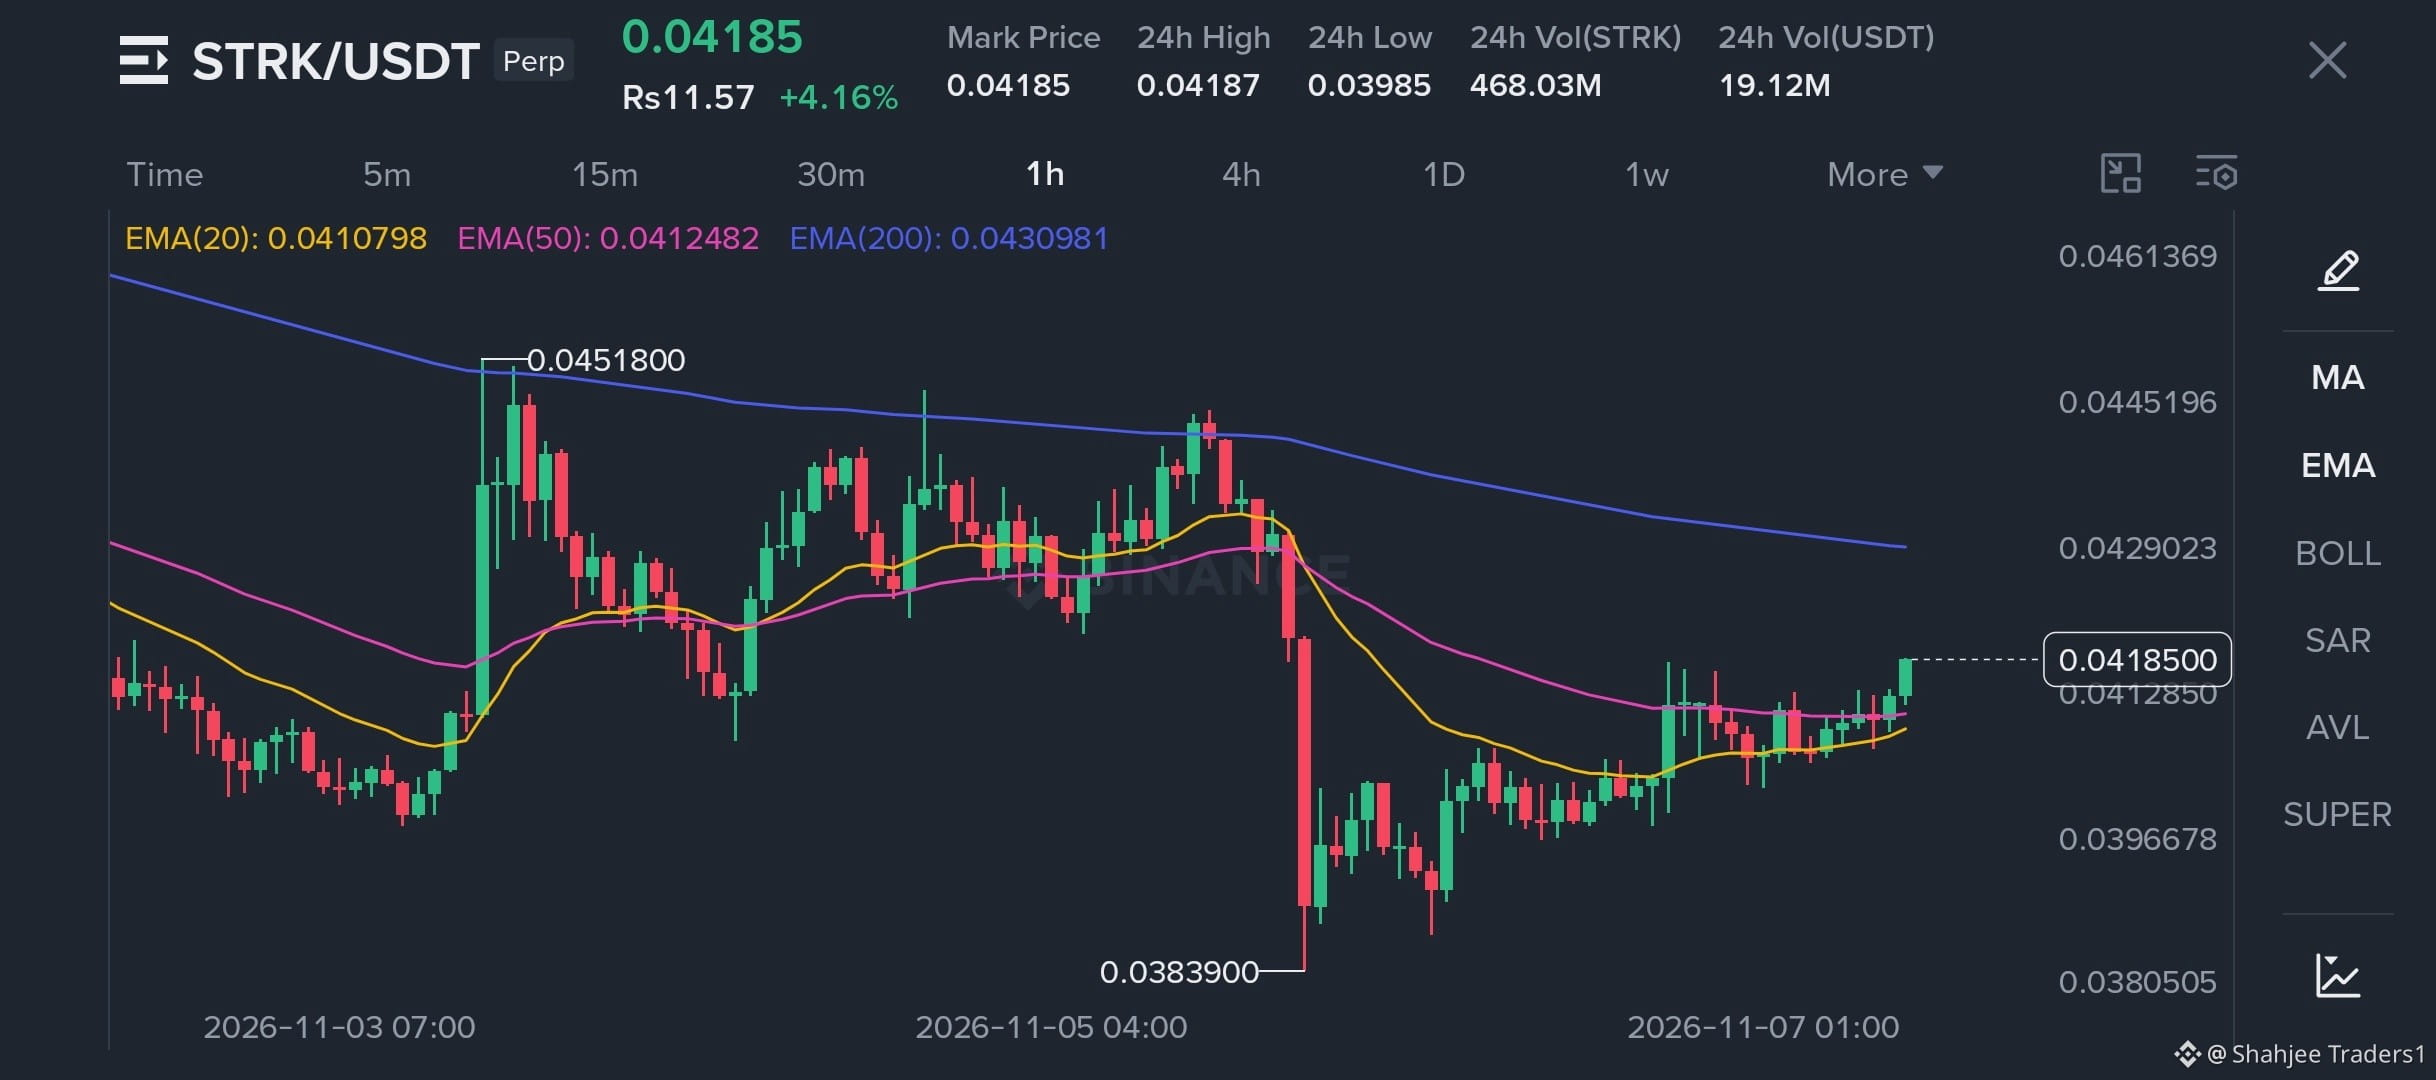
$STRK is finally showing some signs of strength, but there's still one level to clear.
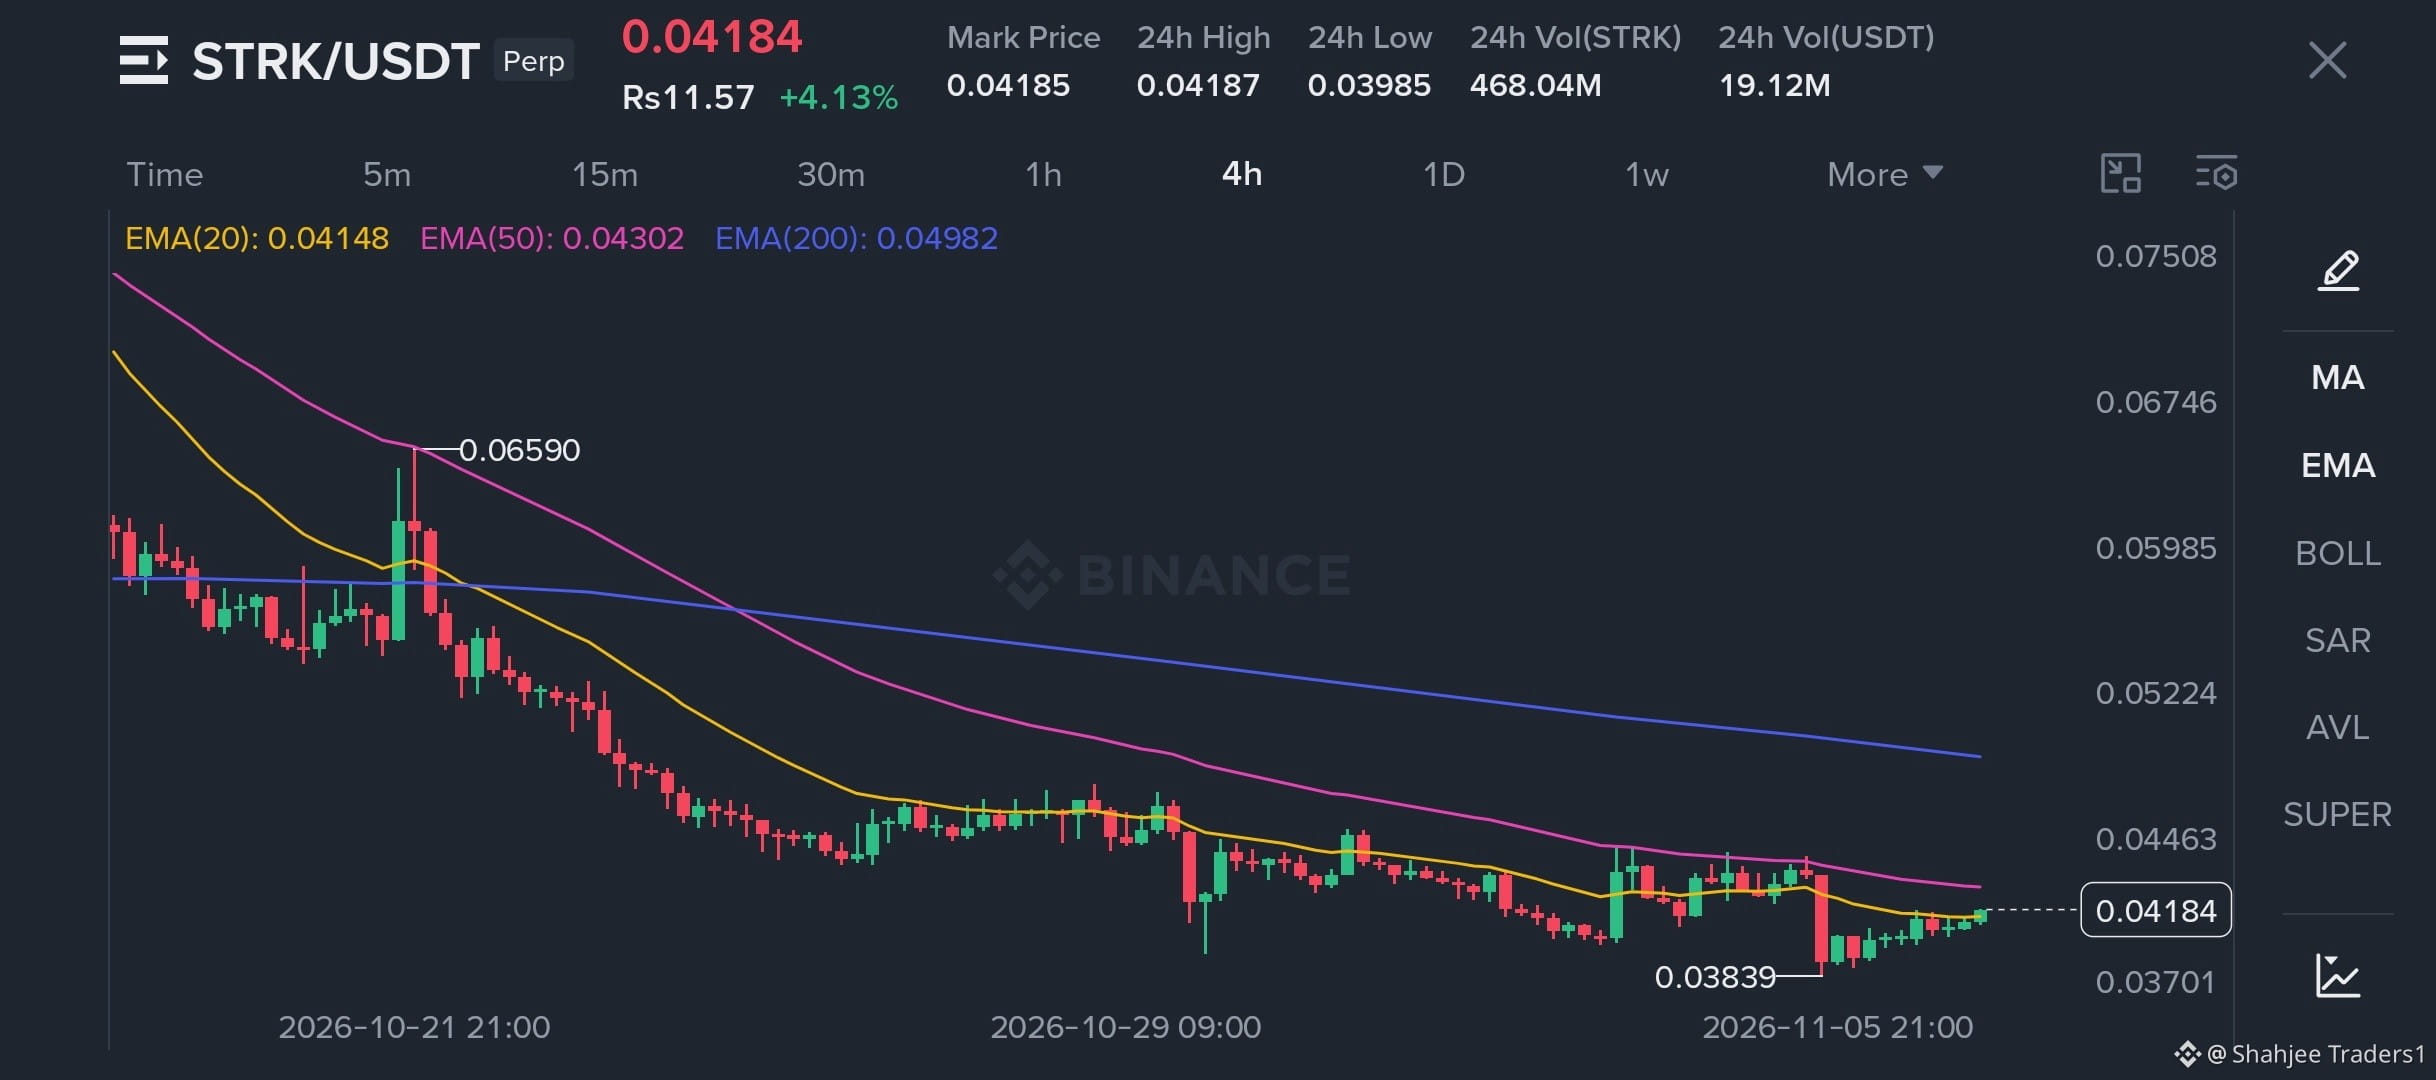
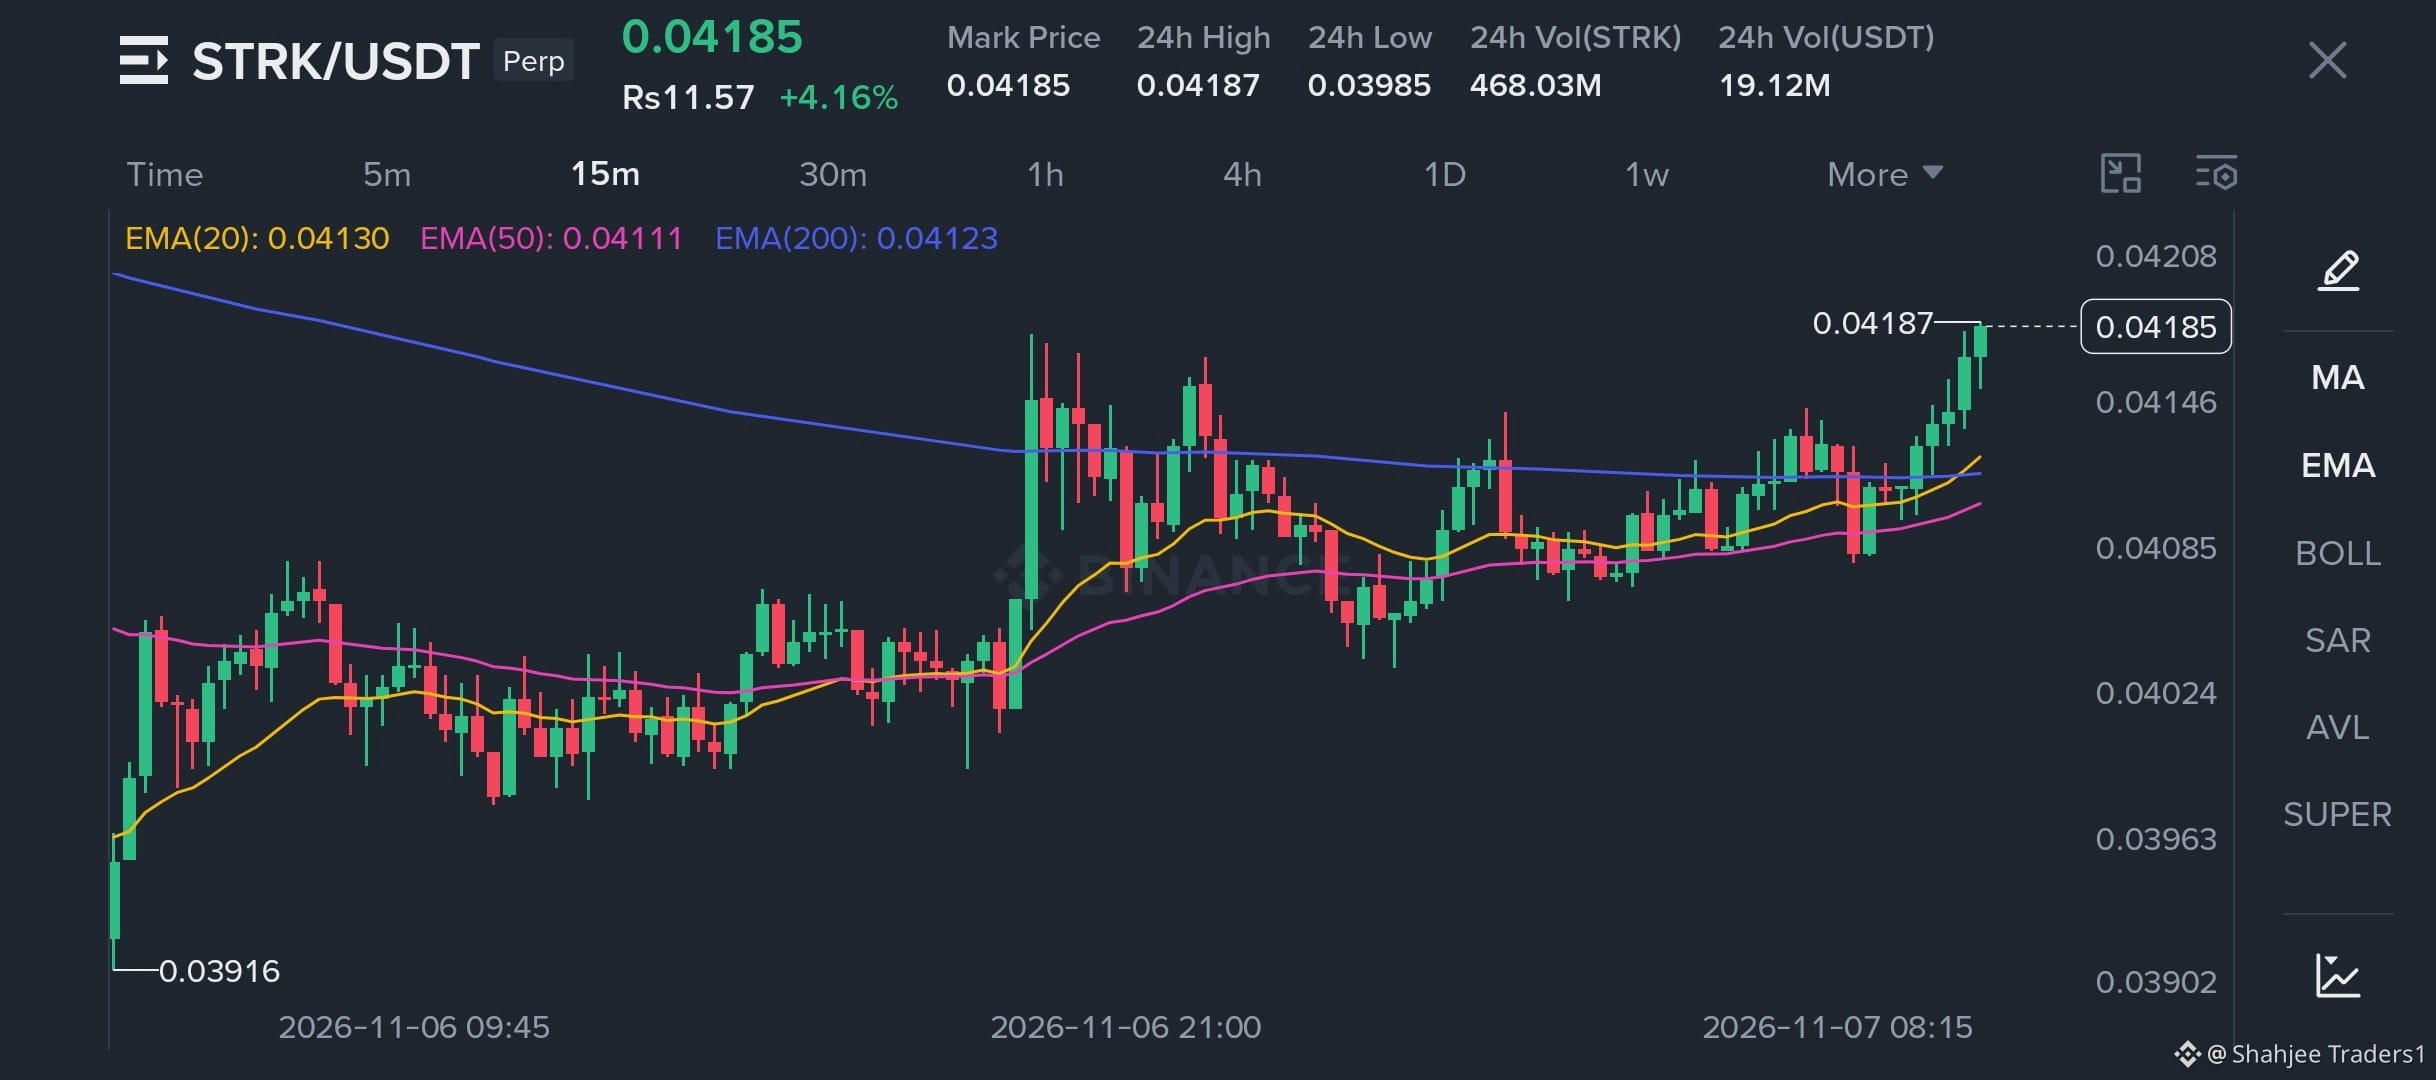
After bouncing from 0.03839, buyers have slowly pushed price higher. The 15M chart is now trading above EMA20, EMA50 and EMA200, which is a positive short-term development.
But the bigger picture isn't fully bullish yet. The 1H and 4H charts still have resistance overhead.
I'm keeping my eyes on 0.04183. A clean candle close above it could make things more interesting.
What do you think? Is $STRK preparing for another push up, or will sellers reject it again?
#strk #crypto #Binance $ONE
{future}(STRKUSDT)
{future}(ONEUSDT)
$STRK is finally showing some signs of strength, but there's still one level to clear.
After bouncing from 0.03839, buyers have slowly pushed price higher. The 15M chart is now trading above EMA20, EMA50 and EMA200, which is a positive short-term development.
But the bigger picture isn't fully bullish yet. The 1H and 4H charts still have resistance overhead.
I'm keeping my eyes on 0.04183. A clean candle close above it could make things more interesting.
What do you think? Is $STRK preparing for another push up, or will sellers reject it again?
#strk #crypto #Binance $ONE
After bouncing from 0.03839, buyers have slowly pushed price higher. The 15M chart is now trading above EMA20, EMA50 and EMA200, which is a positive short-term development.
But the bigger picture isn't fully bullish yet. The 1H and 4H charts still have resistance overhead.
I'm keeping my eyes on 0.04183. A clean candle close above it could make things more interesting.
What do you think? Is $STRK preparing for another push up, or will sellers reject it again?
#strk #crypto #Binance $ONE
242

$ZK — ZKsync's zero-knowledge technology remains important to Ethereum scaling; stronger ecosystem adoption could support renewed interest if buyers confirm a technical recovery.
{spot}(ZKUSDT)
$STRK — Starknet's advanced scaling technology gives it a meaningful position in the Ethereum ecosystem; watch whether buyers can reclaim resistance and maintain the breakout.
{spot}(STRKUSDT)
$MINA — Mina Protocol's lightweight blockchain design makes it distinctive among Layer-1 projects; improving momentum and stronger volume could make its next recovery interesting.
{spot}(MINAUSDT)
#ZK #STRK #MINA #Blockchain #CryptoTrading
$ZK — ZKsync's zero-knowledge technology remains important to Ethereum scaling; stronger ecosystem adoption could support renewed interest if buyers confirm a technical recovery.
$STRK — Starknet's advanced scaling technology gives it a meaningful position in the Ethereum ecosystem; watch whether buyers can reclaim resistance and maintain the breakout.
$MINA — Mina Protocol's lightweight blockchain design makes it distinctive among Layer-1 projects; improving momentum and stronger volume could make its next recovery interesting.
#ZK #STRK #MINA #Blockchain #CryptoTrading
$STRK — Starknet's advanced scaling technology gives it a meaningful position in the Ethereum ecosystem; watch whether buyers can reclaim resistance and maintain the breakout.
$MINA — Mina Protocol's lightweight blockchain design makes it distinctive among Layer-1 projects; improving momentum and stronger volume could make its next recovery interesting.
#ZK #STRK #MINA #Blockchain #CryptoTrading
5
·
--
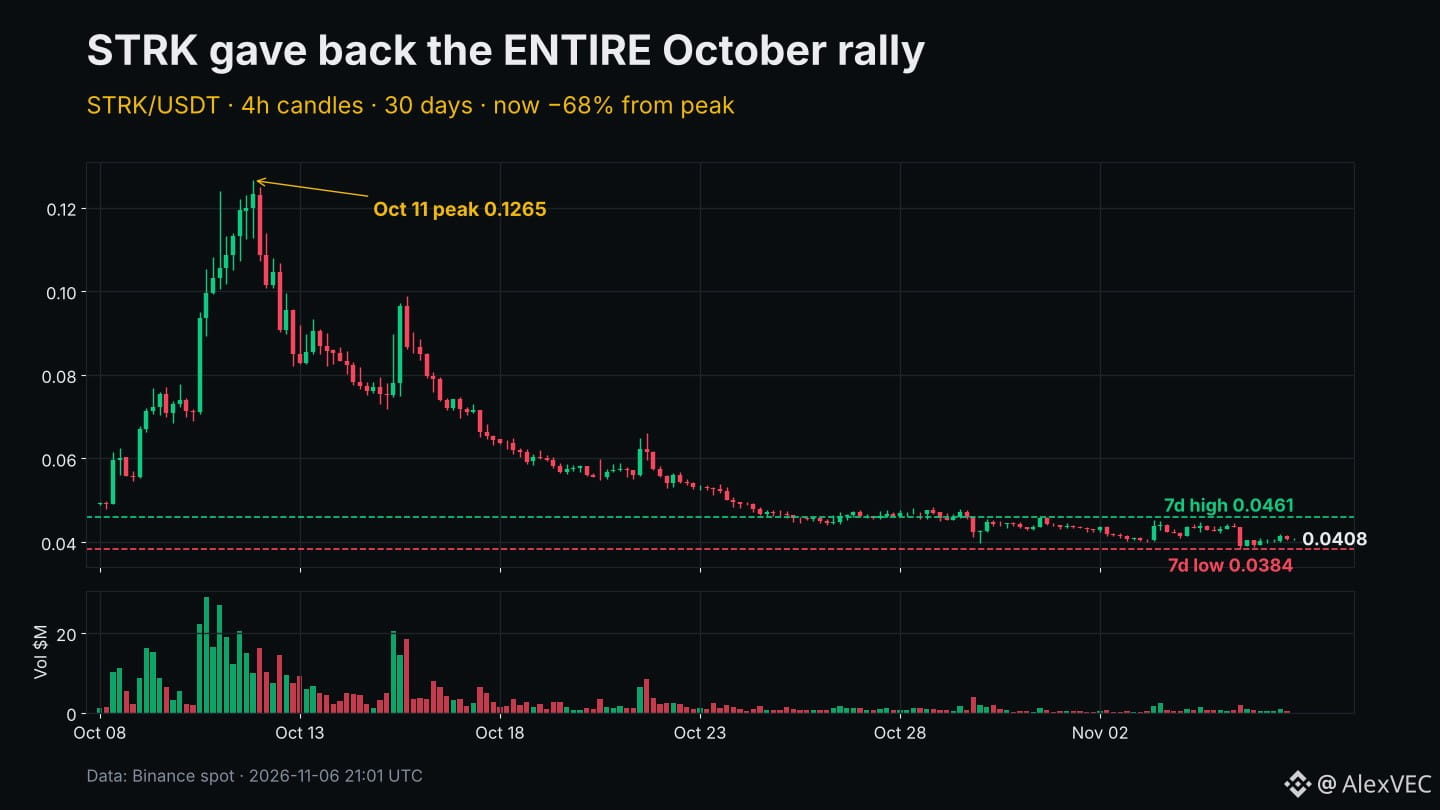
$STRK has now given back its ENTIRE October rally.
The run that started near 0.043 on Oct 3 topped at 0.1265 on Oct 11. Today it trades around 0.0408, about 68% off that peak and below where the move began.
What fueled it was real news: on Oct 8 StarkWare CEO Eli Ben-Sasson said Starknet is actively considering becoming an independent Layer 1, and strkBTC incentives were drawing Bitcoin DeFi attention. Then came the Oct 15 unlock of roughly 127M STRK to early contributors and investors, and the bid never recovered. Speculation on a narrative is not the same as a shipped plan.
The chart now:
• 24h: +2.6%, range 0.0389 – 0.0419
• 7d: -7.9%, low 0.0384 (Nov 5), high 0.0461
• 24h volume ~$3.1M vs ~$5.5M daily average over the past two weeks. Interest has dried up.
0.0384 is the line. Lose it and STRK prints its lowest level since early October. Reclaim 0.046 and the downtrend from the peak finally gets questioned. Thin volume means either break can be sharp, and this is a high-volatility small cap, so size accordingly.
Is the L1 story priced out completely, or is this where patient money starts paying attention?
Not financial advice.
#Starknet #STRK #Altcoins
$STRK has now given back its ENTIRE October rally.
The run that started near 0.043 on Oct 3 topped at 0.1265 on Oct 11. Today it trades around 0.0408, about 68% off that peak and below where the move began.
What fueled it was real news: on Oct 8 StarkWare CEO Eli Ben-Sasson said Starknet is actively considering becoming an independent Layer 1, and strkBTC incentives were drawing Bitcoin DeFi attention. Then came the Oct 15 unlock of roughly 127M STRK to early contributors and investors, and the bid never recovered. Speculation on a narrative is not the same as a shipped plan.
The chart now:
• 24h: +2.6%, range 0.0389 – 0.0419
• 7d: -7.9%, low 0.0384 (Nov 5), high 0.0461
• 24h volume ~$3.1M vs ~$5.5M daily average over the past two weeks. Interest has dried up.
0.0384 is the line. Lose it and STRK prints its lowest level since early October. Reclaim 0.046 and the downtrend from the peak finally gets questioned. Thin volume means either break can be sharp, and this is a high-volatility small cap, so size accordingly.
Is the L1 story priced out completely, or is this where patient money starts paying attention?
Not financial advice.
#Starknet #STRK #Altcoins
The run that started near 0.043 on Oct 3 topped at 0.1265 on Oct 11. Today it trades around 0.0408, about 68% off that peak and below where the move began.
What fueled it was real news: on Oct 8 StarkWare CEO Eli Ben-Sasson said Starknet is actively considering becoming an independent Layer 1, and strkBTC incentives were drawing Bitcoin DeFi attention. Then came the Oct 15 unlock of roughly 127M STRK to early contributors and investors, and the bid never recovered. Speculation on a narrative is not the same as a shipped plan.
The chart now:
• 24h: +2.6%, range 0.0389 – 0.0419
• 7d: -7.9%, low 0.0384 (Nov 5), high 0.0461
• 24h volume ~$3.1M vs ~$5.5M daily average over the past two weeks. Interest has dried up.
0.0384 is the line. Lose it and STRK prints its lowest level since early October. Reclaim 0.046 and the downtrend from the peak finally gets questioned. Thin volume means either break can be sharp, and this is a high-volatility small cap, so size accordingly.
Is the L1 story priced out completely, or is this where patient money starts paying attention?
Not financial advice.
#Starknet #STRK #Altcoins
16

·
--
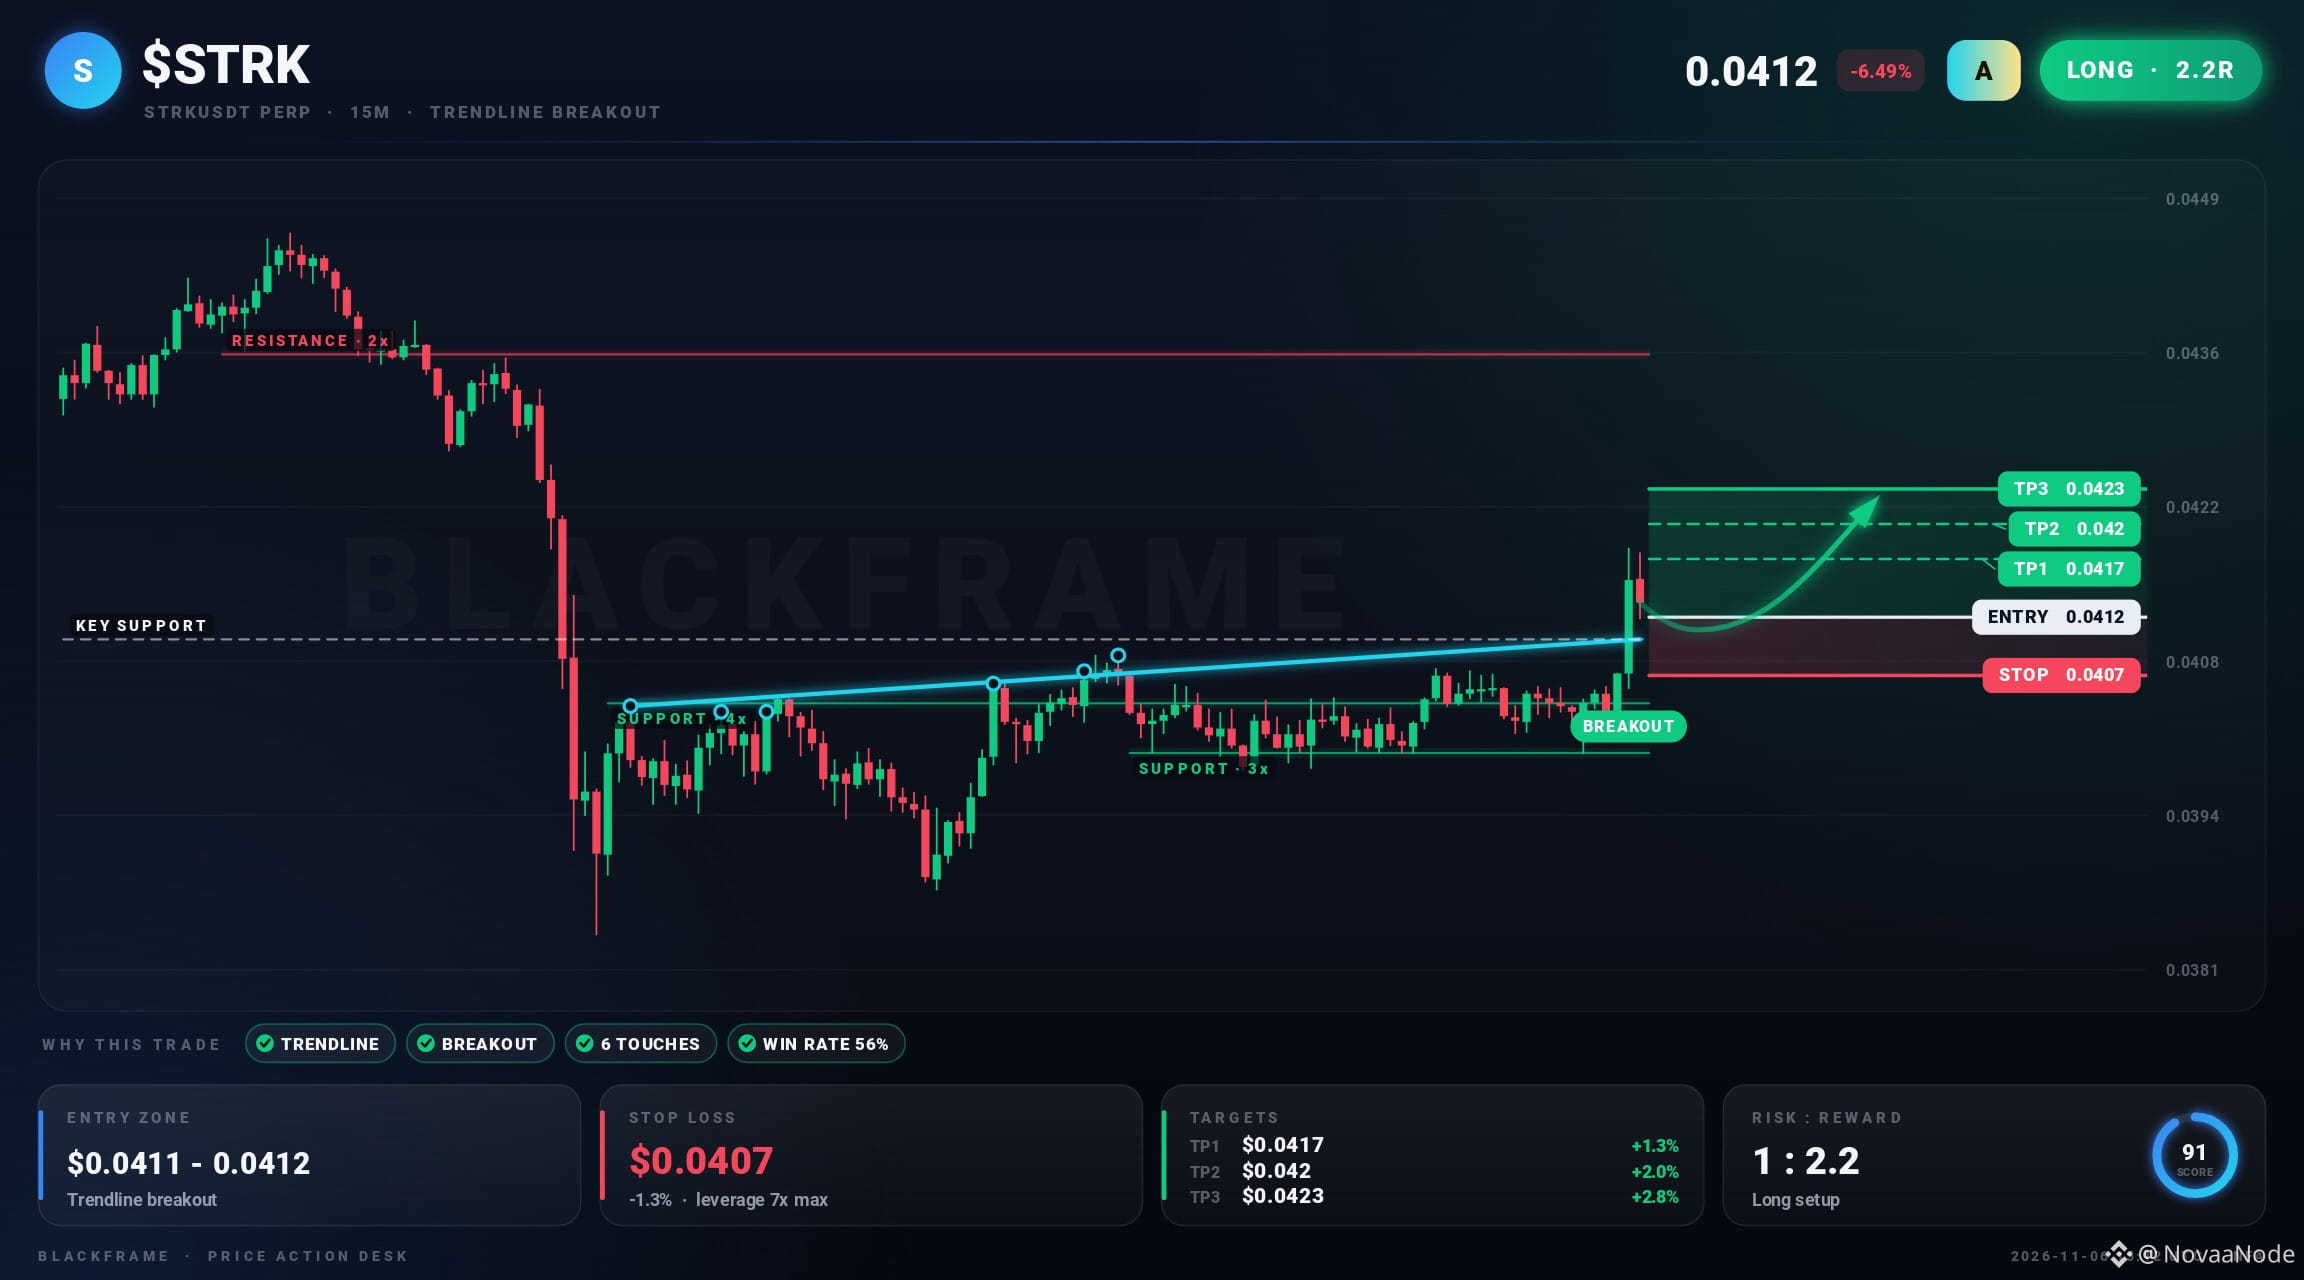
⚡ Breakout on $STRK, and it looks clean
LONG · 15M
Entry: $0.0411 - $0.0412
TP1: $0.0417
TP2: $0.042
TP3: $0.0423
SL: $0.0407
Price broke above a trendline near $0.041 and is holding it. Risk is defined just beyond the level.
#STRK #PriceAction #CryptoMarket · NFA
⚡ Breakout on $STRK , and it looks clean
LONG · 15M
Entry: $0.0411 - $0.0412
TP1: $0.0417
TP2: $0.042
TP3: $0.0423
SL: $0.0407
Price broke above a trendline near $0.041 and is holding it. Risk is defined just beyond the level.
#STRK #PriceAction #CryptoMarket · NFA
LONG · 15M
Entry: $0.0411 - $0.0412
TP1: $0.0417
TP2: $0.042
TP3: $0.0423
SL: $0.0407
Price broke above a trendline near $0.041 and is holding it. Risk is defined just beyond the level.
#STRK #PriceAction #CryptoMarket · NFA
2

·
--
STRK buy pressure is strengthening.
Buy Share
15m 86.1% | 1h 67.1%
4h 60.1% | 12h 55.1% | 1D 46.9%
15m Flow
Buy $106K | Sell $17.09K
Net +$88.87K | B/S 6.20
Cash Share 0.4%
Market
12h 53.1% | 1D 48.7%
Order Book: Bid-heavy (1.20)
Buy-side flow is also supported by bid-heavy order-book depth.
RADAVOX Market Intelligence
#STRK #Crypto
STRK buy pressure is strengthening.
Buy Share
15m 86.1% | 1h 67.1%
4h 60.1% | 12h 55.1% | 1D 46.9%
15m Flow
Buy $106K | Sell $17.09K
Net +$88.87K | B/S 6.20
Cash Share 0.4%
Market
12h 53.1% | 1D 48.7%
Order Book: Bid-heavy (1.20)
Buy-side flow is also supported by bid-heavy order-book depth.
RADAVOX Market Intelligence
#STRK #Crypto
Buy Share
15m 86.1% | 1h 67.1%
4h 60.1% | 12h 55.1% | 1D 46.9%
15m Flow
Buy $106K | Sell $17.09K
Net +$88.87K | B/S 6.20
Cash Share 0.4%
Market
12h 53.1% | 1D 48.7%
Order Book: Bid-heavy (1.20)
Buy-side flow is also supported by bid-heavy order-book depth.
RADAVOX Market Intelligence
#STRK #Crypto
7

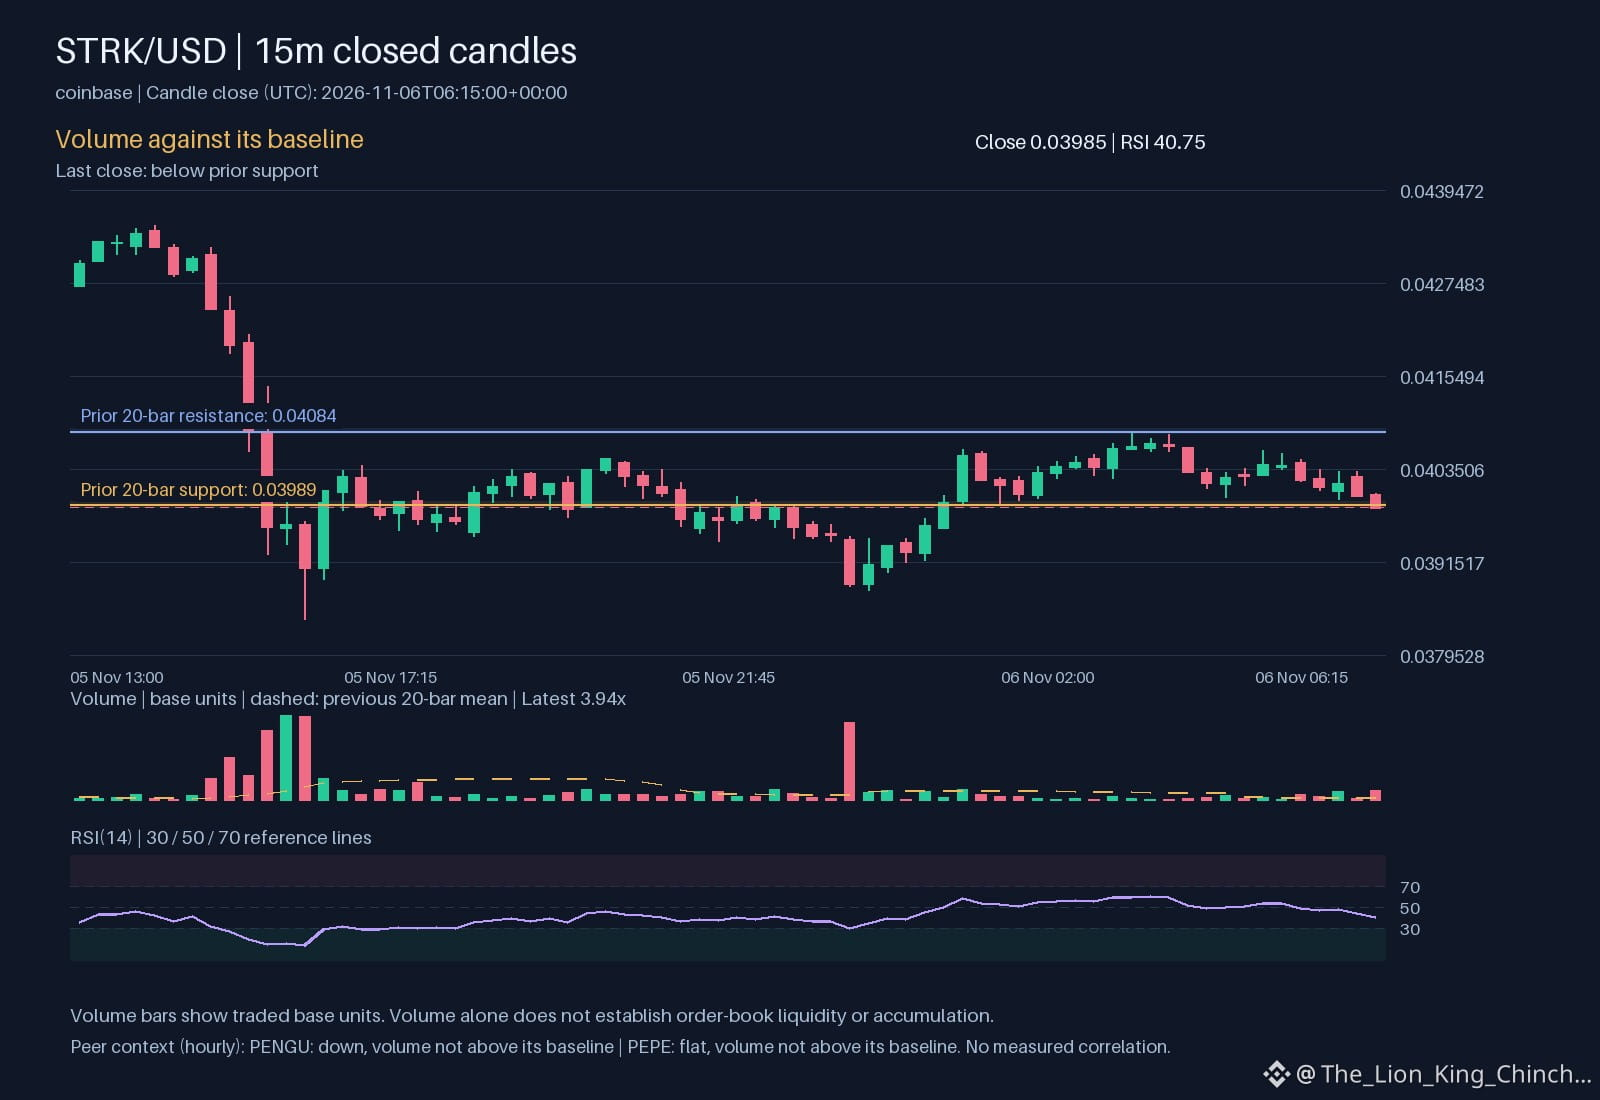
$STRK: A Leaderboard Is Only the Starting Point: For a Clearer Watchlist
Primary Asset Question
The primary asset shows an hourly direction down while volume sits above baseline. This combination raises a question about the strength of the move. A downward direction alone does not guarantee persistence; the accompanying volume suggests active participation that may support the trend.
What the Peer Observations Add
Peer one, PENGU, records an hourly direction down but volume not above baseline. Peer two, PEPE, records a flat hourly direction and also volume not above baseline. Both peers share a down or flat direction without elevated volume. The contrast highlights that STRK’s higher volume distinguishes its move from the peers, even though the direction aligns with PENGU.
Interpretation Limits
Direction and volume are separate signals. A shared direction does not prove a common driver such as capital rotation or sector influence. The fact that STRK’s volume exceeds baseline while peers do not means the move may be more robust, but it does not guarantee continuation. Traders should watch whether the down move can hold above the support level observed and whether volume remains elevated in subsequent hourly periods.
Reassessment Guidance
Monitor the next hourly candle for a change in volume relative to baseline. If volume falls back to baseline while the price stays down, the move may be losing momentum. Conversely, sustained above‑baseline volume would reinforce the current direction.
Probabilistic market research, not a recommendation or guaranteed return.
The comparison to keep in mind: $PENGU has hourly direction down and volume not above its baseline; $PEPE has hourly direction flat and volume not above its baseline. This alone does not establish correlation.
Which matters more in this comparison: direction or how the move holds?
#STRK #PENGU #PEPE
$STRK : A Leaderboard Is Only the Starting Point: For a Clearer Watchlist
Primary Asset Question
The primary asset shows an hourly direction down while volume sits above baseline. This combination raises a question about the strength of the move. A downward direction alone does not guarantee persistence; the accompanying volume suggests active participation that may support the trend.
What the Peer Observations Add
Peer one, PENGU, records an hourly direction down but volume not above baseline. Peer two, PEPE, records a flat hourly direction and also volume not above baseline. Both peers share a down or flat direction without elevated volume. The contrast highlights that STRK’s higher volume distinguishes its move from the peers, even though the direction aligns with PENGU.
Interpretation Limits
Direction and volume are separate signals. A shared direction does not prove a common driver such as capital rotation or sector influence. The fact that STRK’s volume exceeds baseline while peers do not means the move may be more robust, but it does not guarantee continuation. Traders should watch whether the down move can hold above the support level observed and whether volume remains elevated in subsequent hourly periods.
Reassessment Guidance
Monitor the next hourly candle for a change in volume relative to baseline. If volume falls back to baseline while the price stays down, the move may be losing momentum. Conversely, sustained above‑baseline volume would reinforce the current direction.
Probabilistic market research, not a recommendation or guaranteed return.
The comparison to keep in mind: $PENGU has hourly direction down and volume not above its baseline; $PEPE has hourly direction flat and volume not above its baseline. This alone does not establish correlation.
Which matters more in this comparison: direction or how the move holds?
#STRK #PENGU #PEPE
Primary Asset Question
The primary asset shows an hourly direction down while volume sits above baseline. This combination raises a question about the strength of the move. A downward direction alone does not guarantee persistence; the accompanying volume suggests active participation that may support the trend.
What the Peer Observations Add
Peer one, PENGU, records an hourly direction down but volume not above baseline. Peer two, PEPE, records a flat hourly direction and also volume not above baseline. Both peers share a down or flat direction without elevated volume. The contrast highlights that STRK’s higher volume distinguishes its move from the peers, even though the direction aligns with PENGU.
Interpretation Limits
Direction and volume are separate signals. A shared direction does not prove a common driver such as capital rotation or sector influence. The fact that STRK’s volume exceeds baseline while peers do not means the move may be more robust, but it does not guarantee continuation. Traders should watch whether the down move can hold above the support level observed and whether volume remains elevated in subsequent hourly periods.
Reassessment Guidance
Monitor the next hourly candle for a change in volume relative to baseline. If volume falls back to baseline while the price stays down, the move may be losing momentum. Conversely, sustained above‑baseline volume would reinforce the current direction.
Probabilistic market research, not a recommendation or guaranteed return.
The comparison to keep in mind: $PENGU has hourly direction down and volume not above its baseline; $PEPE has hourly direction flat and volume not above its baseline. This alone does not establish correlation.
Which matters more in this comparison: direction or how the move holds?
#STRK #PENGU #PEPE
44


·
--
🔴 $STRK HEAVY INSTITUTIONAL SHORT DISTRIBUTION SIGNALING CRITICAL PULLBACK! 🐻
Entry: 0.02720 - 0.02800 ⚡
Target: 0.02500 - 0.02150 🚀
Stop Loss: 0.02920 ⚠️
Smart money locked in heavy short liquidity up near 0.0344, leaving retail buyers trapped in underwater positions on every relief bounce. 🦈 Institutional supply continues to cap upside recovery while the path of least resistance tilts decisively downward toward lower demand floors. 📉
Any corrective push into the retest zone offers a high-conviction entry before the next downward leg accelerates. 📊 With order flow clearly aligned with the bears, sellers remain firmly in control of the tape. 💡 Are you riding this institutional breakdown lower or waiting for a deeper liquidity flush first? 👇
⚠️ Not financial advice. Always manage your risk. 🛡️
🏷️ #STRK #ShortSetup #Trading #Crypto #Bearish
🔴 📉
🔴 $STRK HEAVY INSTITUTIONAL SHORT DISTRIBUTION SIGNALING CRITICAL PULLBACK! 🐻
Entry: 0.02720 - 0.02800 ⚡
Target: 0.02500 - 0.02150 🚀
Stop Loss: 0.02920 ⚠️
Smart money locked in heavy short liquidity up near 0.0344, leaving retail buyers trapped in underwater positions on every relief bounce. 🦈 Institutional supply continues to cap upside recovery while the path of least resistance tilts decisively downward toward lower demand floors. 📉
Any corrective push into the retest zone offers a high-conviction entry before the next downward leg accelerates. 📊 With order flow clearly aligned with the bears, sellers remain firmly in control of the tape. 💡 Are you riding this institutional breakdown lower or waiting for a deeper liquidity flush first? 👇
⚠️ Not financial advice. Always manage your risk. 🛡️
🏷️ #STRK #ShortSetup #Trading #Crypto #Bearish
🔴 📉
Entry: 0.02720 - 0.02800 ⚡
Target: 0.02500 - 0.02150 🚀
Stop Loss: 0.02920 ⚠️
Smart money locked in heavy short liquidity up near 0.0344, leaving retail buyers trapped in underwater positions on every relief bounce. 🦈 Institutional supply continues to cap upside recovery while the path of least resistance tilts decisively downward toward lower demand floors. 📉
Any corrective push into the retest zone offers a high-conviction entry before the next downward leg accelerates. 📊 With order flow clearly aligned with the bears, sellers remain firmly in control of the tape. 💡 Are you riding this institutional breakdown lower or waiting for a deeper liquidity flush first? 👇
⚠️ Not financial advice. Always manage your risk. 🛡️
🏷️ #STRK #ShortSetup #Trading #Crypto #Bearish
🔴 📉
11
·
--
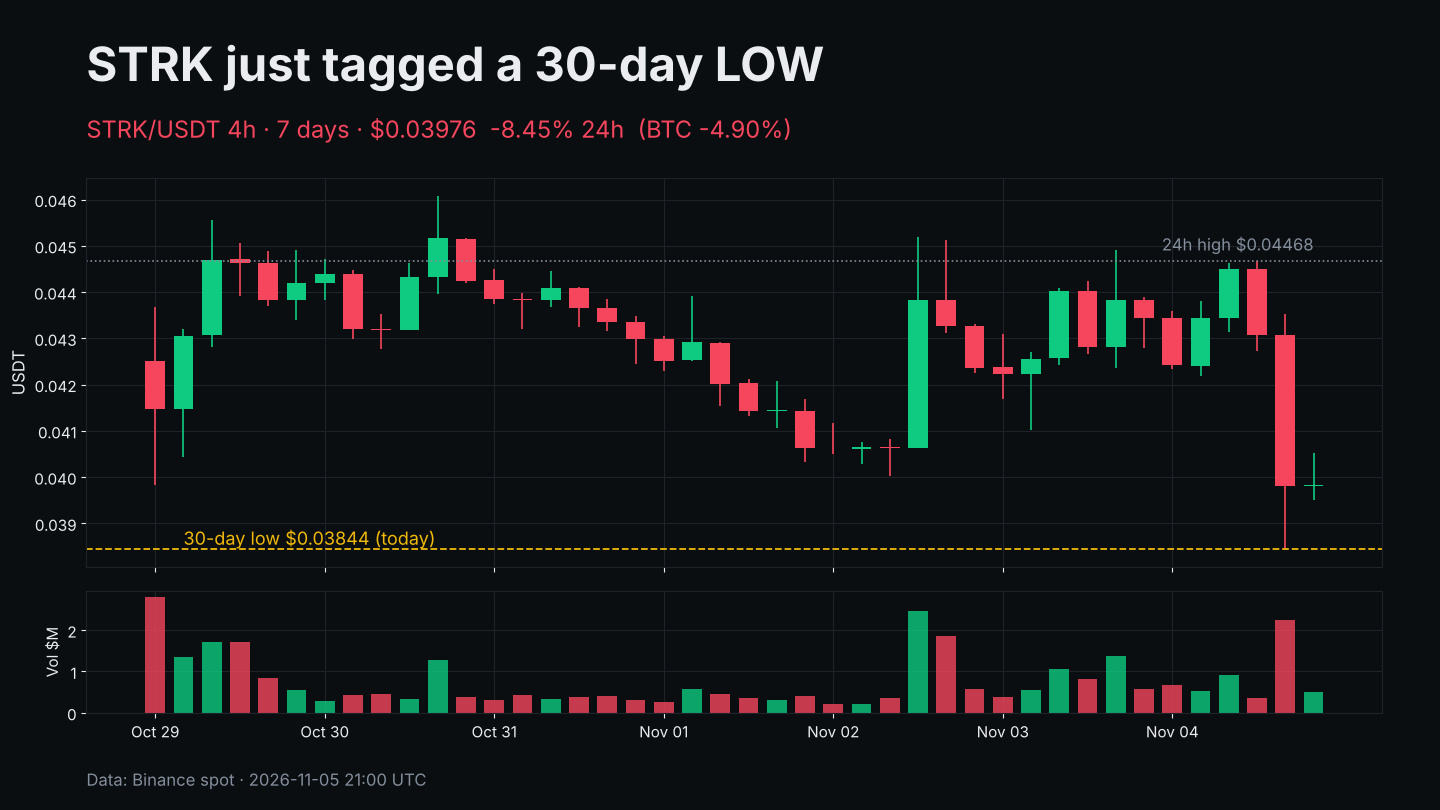
$STRK just wicked to $0.03844, its lowest print in 30 days, while $BTC slipped "only" 4.9%.
The numbers right now:
• Price $0.03976, -8.45% in 24h
• 24h range $0.03844 – $0.04468
• -6.3% over 7 days, -23% over 30 days
• 24h volume about $5.2M, in line with its recent daily range
The chart tells a simple story. For a week STRK chopped between roughly $0.040 and $0.046, then lost the floor in one heavy 4h candle as BTC dropped from above $80K toward $76K. The selling candle carried one of the biggest 4h volume bars of the week, so this wasn't just thin air.
Levels I'm watching: $0.0384 is the line in the sand. A daily close back above $0.042 would turn this into a fake breakdown; losing $0.038 opens fresh lows for the month.
Project angle: supply is a recurring headwind. Under StarkWare's revised schedule (reported by The Block), about 127M STRK unlock on the 15th of every month through March 2027. The next one is November 15, ten days out, and the token has often been soft around these dates.
High beta, thin liquidity, unlock overhang: size small if you play it.
Bounce from the 30-day low, or one more leg down before the 15th?
Not financial advice.
#Starknet #STRK #CryptoTrading
$STRK just wicked to $0.03844, its lowest print in 30 days, while $BTC slipped "only" 4.9%.
The numbers right now:
• Price $0.03976, -8.45% in 24h
• 24h range $0.03844 – $0.04468
• -6.3% over 7 days, -23% over 30 days
• 24h volume about $5.2M, in line with its recent daily range
The chart tells a simple story. For a week STRK chopped between roughly $0.040 and $0.046, then lost the floor in one heavy 4h candle as BTC dropped from above $80K toward $76K. The selling candle carried one of the biggest 4h volume bars of the week, so this wasn't just thin air.
Levels I'm watching: $0.0384 is the line in the sand. A daily close back above $0.042 would turn this into a fake breakdown; losing $0.038 opens fresh lows for the month.
Project angle: supply is a recurring headwind. Under StarkWare's revised schedule (reported by The Block), about 127M STRK unlock on the 15th of every month through March 2027. The next one is November 15, ten days out, and the token has often been soft around these dates.
High beta, thin liquidity, unlock overhang: size small if you play it.
Bounce from the 30-day low, or one more leg down before the 15th?
Not financial advice.
#Starknet #STRK #CryptoTrading
The numbers right now:
• Price $0.03976, -8.45% in 24h
• 24h range $0.03844 – $0.04468
• -6.3% over 7 days, -23% over 30 days
• 24h volume about $5.2M, in line with its recent daily range
The chart tells a simple story. For a week STRK chopped between roughly $0.040 and $0.046, then lost the floor in one heavy 4h candle as BTC dropped from above $80K toward $76K. The selling candle carried one of the biggest 4h volume bars of the week, so this wasn't just thin air.
Levels I'm watching: $0.0384 is the line in the sand. A daily close back above $0.042 would turn this into a fake breakdown; losing $0.038 opens fresh lows for the month.
Project angle: supply is a recurring headwind. Under StarkWare's revised schedule (reported by The Block), about 127M STRK unlock on the 15th of every month through March 2027. The next one is November 15, ten days out, and the token has often been soft around these dates.
High beta, thin liquidity, unlock overhang: size small if you play it.
Bounce from the 30-day low, or one more leg down before the 15th?
Not financial advice.
#Starknet #STRK #CryptoTrading
9

🚨 INSTITUTIONAL WHALES ARE TRAPPING RETAIL LONGS ON $STRK FOR A MASSIVE PULLBACK DOWNWARD 📉
Entry: 0.02720 - 0.02800 ⚡
Target: 0.02500 - 0.02150 🎯
Stop Loss: 0.02920 ⚠️
Smart money is systematically capping upside moves from 0.0344, leaving underwater retail buyers holding the bag on every minor bounce. 🦈 This current relief sweep into resistance is printing a classic liquidity trap while sellers maintain absolute control.
Order flow continues to favor aggressive downside expansion toward unmitigated demand below. 📊 The path of least resistance is heavily skewed downward until institutional bid defense steps in. 💬 Are you riding this short setup with the whales or waiting for breakdown confirmation? 👇
⚠️ Not financial advice. Always manage your risk. 🛡️
🏷️ #STRK #ShortSetup #Bearish #Crypto
🚨 🔻
🚨 INSTITUTIONAL WHALES ARE TRAPPING RETAIL LONGS ON $STRK FOR A MASSIVE PULLBACK DOWNWARD 📉
Entry: 0.02720 - 0.02800 ⚡
Target: 0.02500 - 0.02150 🎯
Stop Loss: 0.02920 ⚠️
Smart money is systematically capping upside moves from 0.0344, leaving underwater retail buyers holding the bag on every minor bounce. 🦈 This current relief sweep into resistance is printing a classic liquidity trap while sellers maintain absolute control.
Order flow continues to favor aggressive downside expansion toward unmitigated demand below. 📊 The path of least resistance is heavily skewed downward until institutional bid defense steps in. 💬 Are you riding this short setup with the whales or waiting for breakdown confirmation? 👇
⚠️ Not financial advice. Always manage your risk. 🛡️
🏷️ #STRK #ShortSetup #Bearish #Crypto
🚨 🔻
Entry: 0.02720 - 0.02800 ⚡
Target: 0.02500 - 0.02150 🎯
Stop Loss: 0.02920 ⚠️
Smart money is systematically capping upside moves from 0.0344, leaving underwater retail buyers holding the bag on every minor bounce. 🦈 This current relief sweep into resistance is printing a classic liquidity trap while sellers maintain absolute control.
Order flow continues to favor aggressive downside expansion toward unmitigated demand below. 📊 The path of least resistance is heavily skewed downward until institutional bid defense steps in. 💬 Are you riding this short setup with the whales or waiting for breakdown confirmation? 👇
⚠️ Not financial advice. Always manage your risk. 🛡️
🏷️ #STRK #ShortSetup #Bearish #Crypto
🚨 🔻
23
·
--
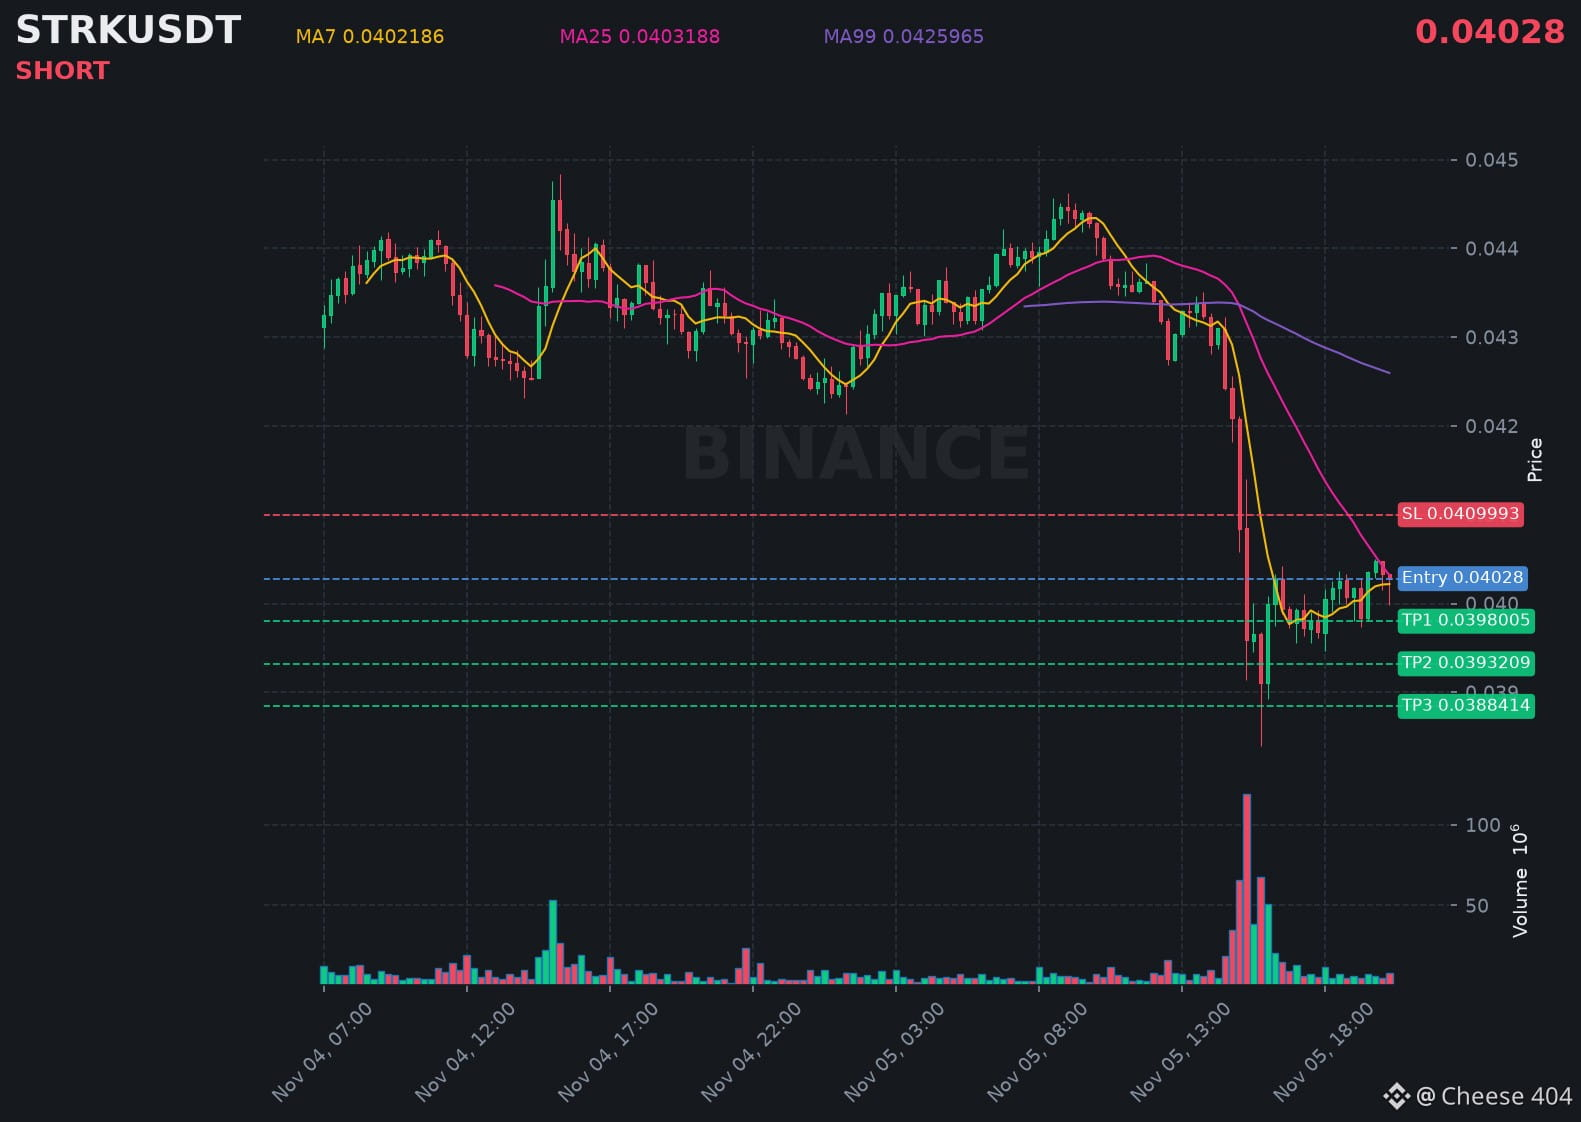
$STRK just printed a strong bearish candle, signaling more downside pressure building right now.
📍 @ 0.04028 | Volume: 0.32M USD
RSI 43 | EMA20: 0.0404524 USD
📈 Trade Plan:
📈 Entry: 0.0401361 – 0.0404239
🛑 Stop Loss: 0.0409993
🎯 TP1: 0.0398005
🎯 TP2: 0.0393209
🎯 TP3: 0.0388414
Waiting for confirmation, then riding the downtrend.
👉 $STRK 👈 Catch it
#STRK
$STRK just printed a strong bearish candle, signaling more downside pressure building right now.
📍 @ 0.04028 | Volume: 0.32M USD
RSI 43 | EMA20: 0.0404524 USD
📈 Trade Plan:
📈 Entry: 0.0401361 – 0.0404239
🛑 Stop Loss: 0.0409993
🎯 TP1: 0.0398005
🎯 TP2: 0.0393209
🎯 TP3: 0.0388414
Waiting for confirmation, then riding the downtrend.
👉 $STRK 👈 Catch it
#STRK
📍 @ 0.04028 | Volume: 0.32M USD
RSI 43 | EMA20: 0.0404524 USD
📈 Trade Plan:
📈 Entry: 0.0401361 – 0.0404239
🛑 Stop Loss: 0.0409993
🎯 TP1: 0.0398005
🎯 TP2: 0.0393209
🎯 TP3: 0.0388414
Waiting for confirmation, then riding the downtrend.
👉 $STRK 👈 Catch it
#STRK
120
·
--
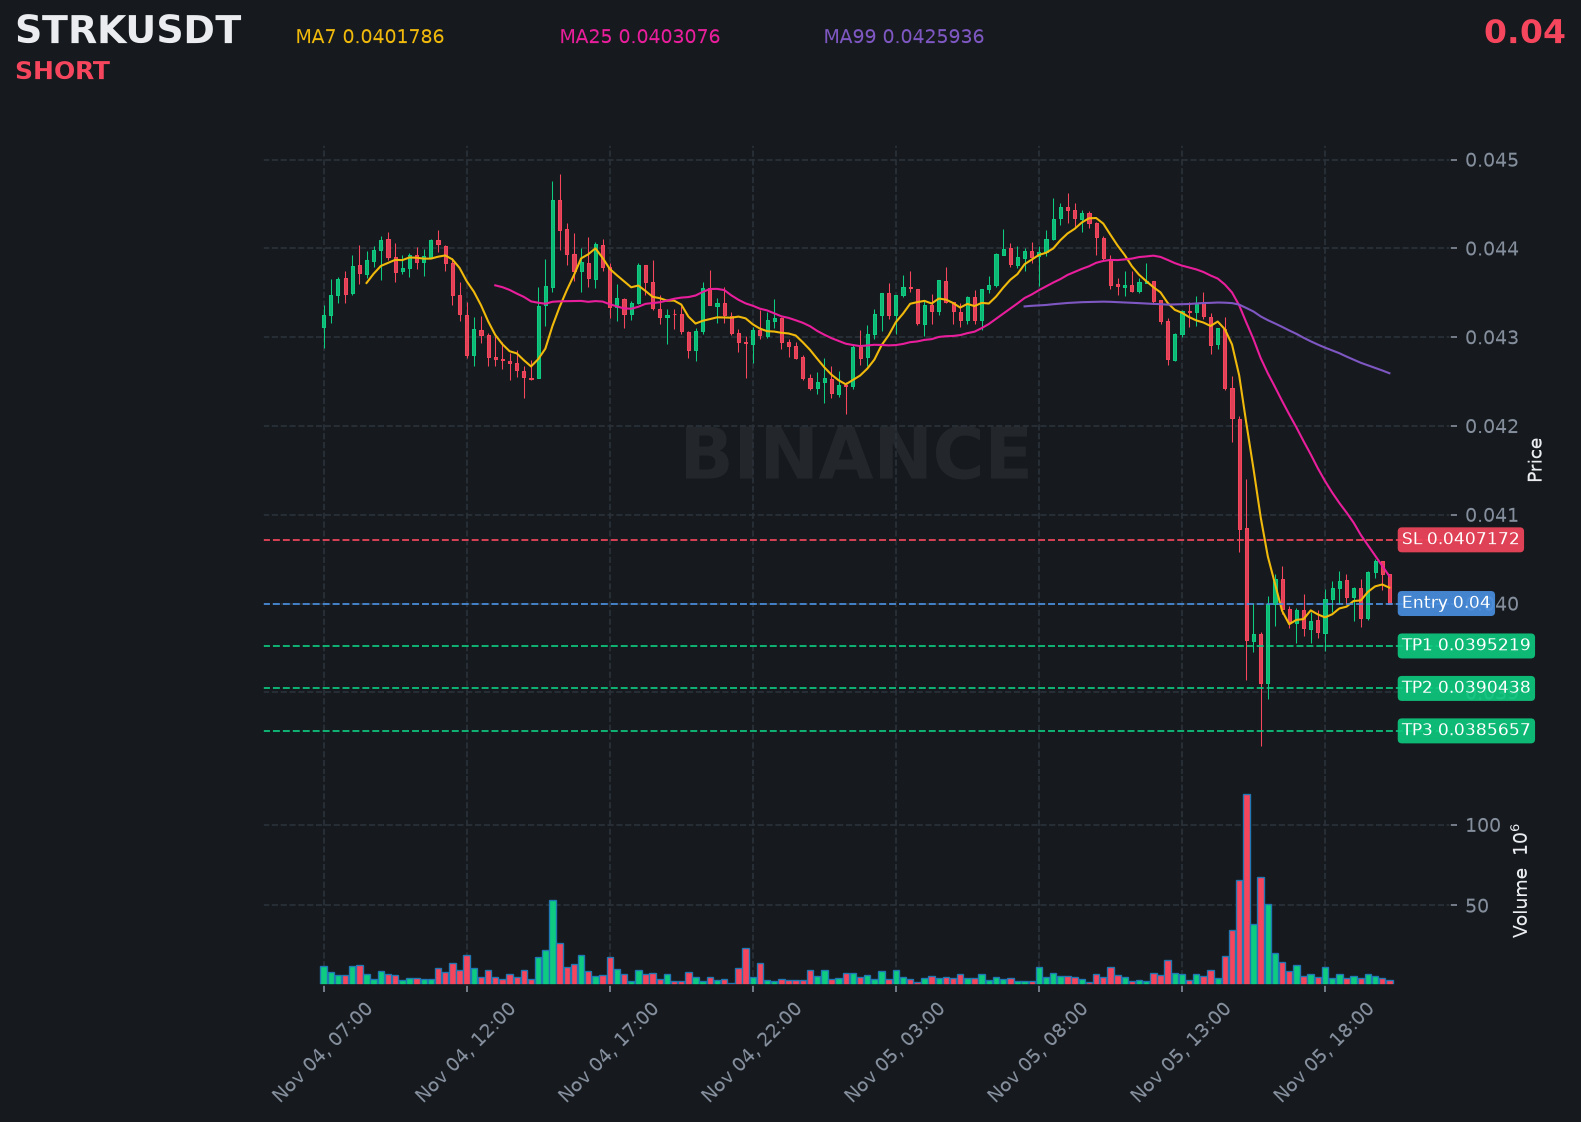
$STRK is trending down with real conviction, sellers capping every bounce along the way.
📍 @ 0.04 | Volume: 0.16M USD
RSI 40 | EMA20: 0.0404257 USD
📈 Trade Plan:
📈 Entry: 0.0398566 – 0.0401434
🛑 Stop Loss: 0.0407172
🎯 TP1: 0.0395219
🎯 TP2: 0.0390438
🎯 TP3: 0.0385657
Waiting for confirmation, then riding the downtrend.
👉 $STRK 👈 Catch it
#STRK
$STRK is trending down with real conviction, sellers capping every bounce along the way.
📍 @ 0.04 | Volume: 0.16M USD
RSI 40 | EMA20: 0.0404257 USD
📈 Trade Plan:
📈 Entry: 0.0398566 – 0.0401434
🛑 Stop Loss: 0.0407172
🎯 TP1: 0.0395219
🎯 TP2: 0.0390438
🎯 TP3: 0.0385657
Waiting for confirmation, then riding the downtrend.
👉 $STRK 👈 Catch it
#STRK
📍 @ 0.04 | Volume: 0.16M USD
RSI 40 | EMA20: 0.0404257 USD
📈 Trade Plan:
📈 Entry: 0.0398566 – 0.0401434
🛑 Stop Loss: 0.0407172
🎯 TP1: 0.0395219
🎯 TP2: 0.0390438
🎯 TP3: 0.0385657
Waiting for confirmation, then riding the downtrend.
👉 $STRK 👈 Catch it
#STRK
112
·
--
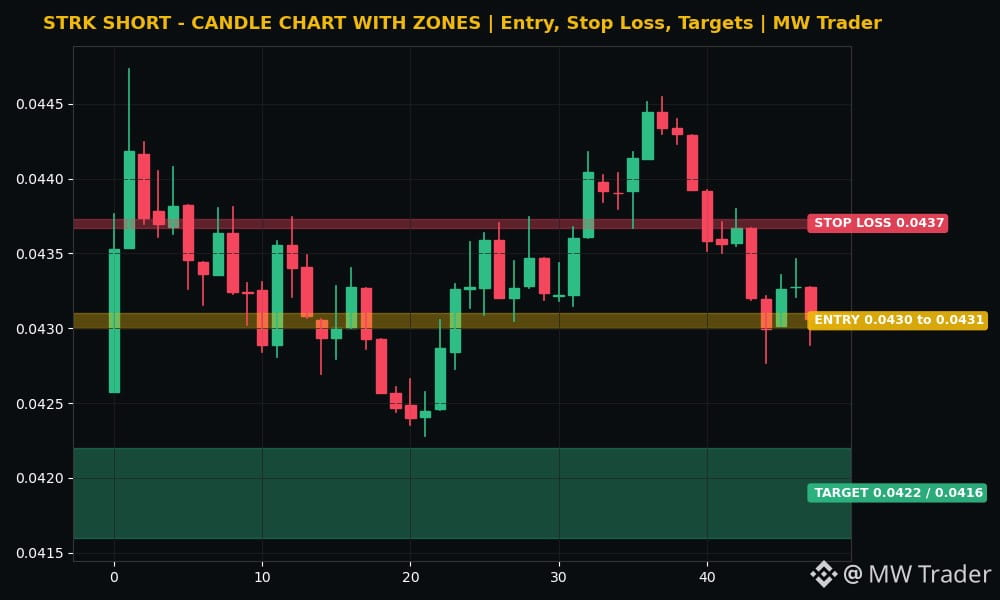
$STRK #STRK 📉
Direction: SHORT
Entry zone: 0.0430 to 0.0431
Stop loss: 0.0437
Target 1: 0.0422
Target 2: 0.0416
Starknet is trading near 0.0431 dollars, inside a range of 0.0423 to 0.0447, and the recent hourly closes show a slow drift down, 0.0432, then 0.0430, then 0.0433, then 0.0433, then 0.0431. 🔴 My reading is that STRK is drifting lower while the market cools, because it keeps making lower closes near the middle of its range instead of defending a bounce, and Bitcoin slipping under 80,000 dollars gives sellers the cover they need. A short from the current zone, with a stop above 0.0437, targets 0.0422 first and then 0.0416 if sellers push through the range low. A rise above 0.0437 kills the idea without debate.
Futures trading is risky. Trade small, use a stop loss, and do your own research. This is my reading, not a guaranteed signal.
Does Starknet fall to 0.0422 first, or rise above 0.0437? 🤔
Follow for more trades.
#Starknet #Crypto #FuturesTrading #TradingSignals
$STRK #STRK 📉
Direction: SHORT
Entry zone: 0.0430 to 0.0431
Stop loss: 0.0437
Target 1: 0.0422
Target 2: 0.0416
Starknet is trading near 0.0431 dollars, inside a range of 0.0423 to 0.0447, and the recent hourly closes show a slow drift down, 0.0432, then 0.0430, then 0.0433, then 0.0433, then 0.0431. 🔴 My reading is that STRK is drifting lower while the market cools, because it keeps making lower closes near the middle of its range instead of defending a bounce, and Bitcoin slipping under 80,000 dollars gives sellers the cover they need. A short from the current zone, with a stop above 0.0437, targets 0.0422 first and then 0.0416 if sellers push through the range low. A rise above 0.0437 kills the idea without debate.
Futures trading is risky. Trade small, use a stop loss, and do your own research. This is my reading, not a guaranteed signal.
Does Starknet fall to 0.0422 first, or rise above 0.0437? 🤔
Follow for more trades.
#Starknet #Crypto #FuturesTrading #TradingSignals
Direction: SHORT
Entry zone: 0.0430 to 0.0431
Stop loss: 0.0437
Target 1: 0.0422
Target 2: 0.0416
Starknet is trading near 0.0431 dollars, inside a range of 0.0423 to 0.0447, and the recent hourly closes show a slow drift down, 0.0432, then 0.0430, then 0.0433, then 0.0433, then 0.0431. 🔴 My reading is that STRK is drifting lower while the market cools, because it keeps making lower closes near the middle of its range instead of defending a bounce, and Bitcoin slipping under 80,000 dollars gives sellers the cover they need. A short from the current zone, with a stop above 0.0437, targets 0.0422 first and then 0.0416 if sellers push through the range low. A rise above 0.0437 kills the idea without debate.
Futures trading is risky. Trade small, use a stop loss, and do your own research. This is my reading, not a guaranteed signal.
Does Starknet fall to 0.0422 first, or rise above 0.0437? 🤔
Follow for more trades.
#Starknet #Crypto #FuturesTrading #TradingSignals
6

·
--
Bullish
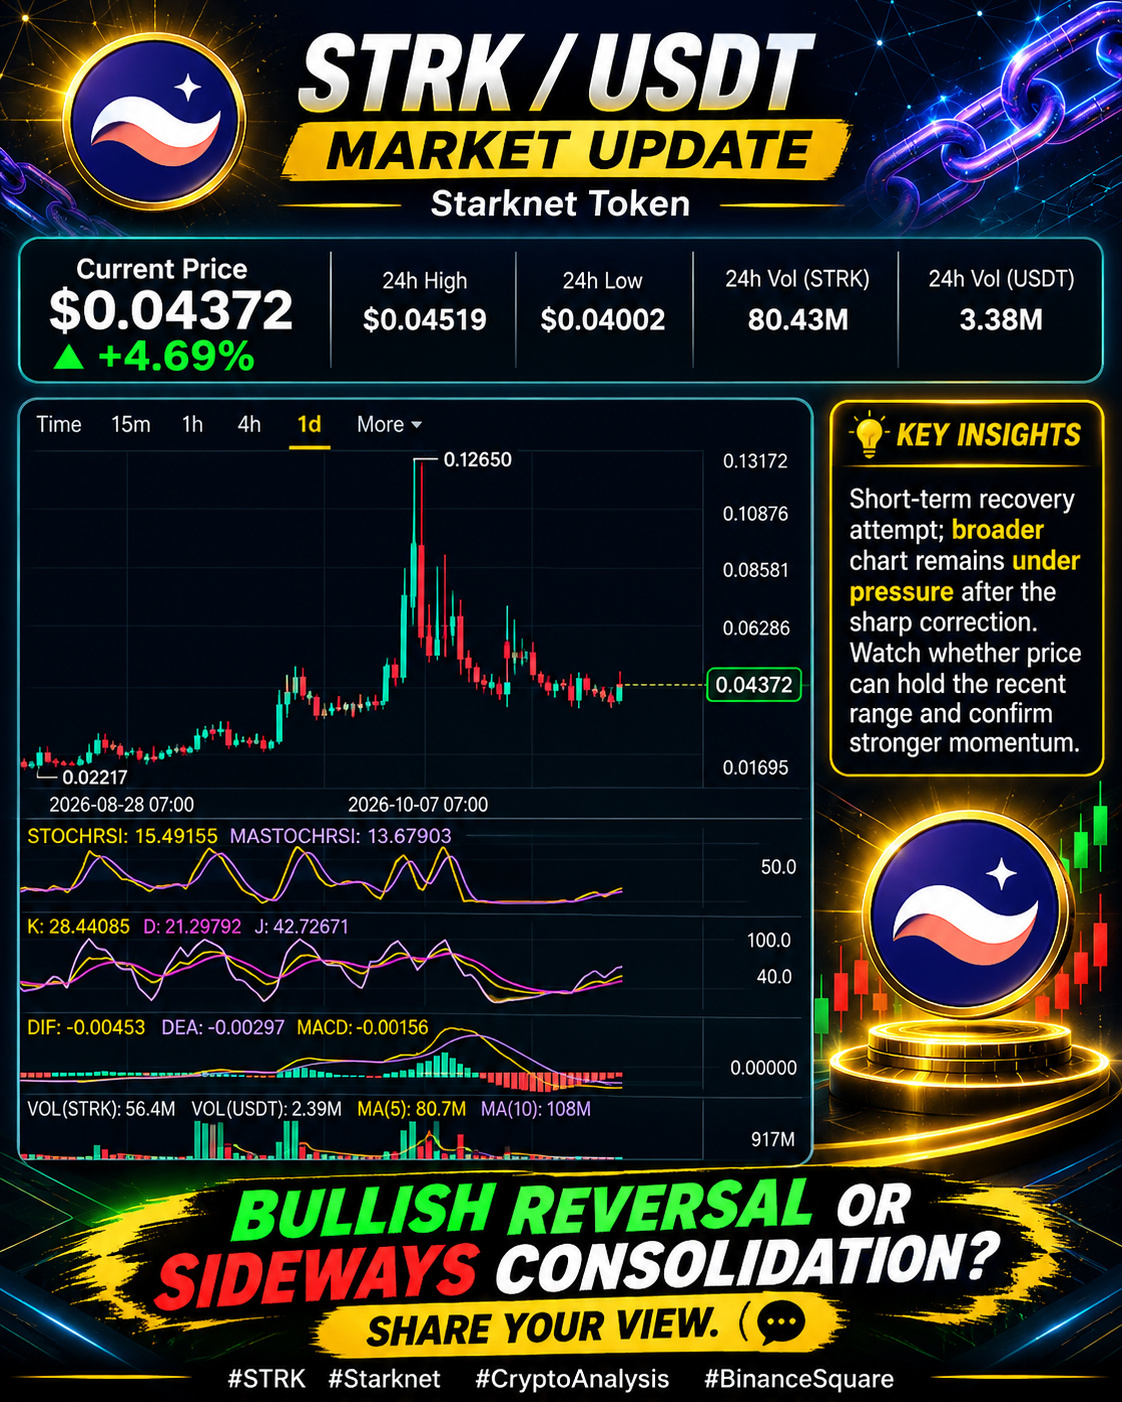
🚀$ $STRK (Starknet) – Market Analysis & Recovery Watch
📊 Current Price: $0.04372
🟢 24H Change: +4.69%
📈 24H High: $0.04519
📉 24H Low: $0.04002
🔍 Market Overview
STRK is showing early signs of recovery after an extended downtrend. Buyers are attempting to build momentum around the $0.043 level.
The daily chart shows a slight improvement in momentum, while MACD remains in negative territory. A stronger confirmation is still needed before calling a full bullish reversal.
🎯 Key Levels to Watch
- Resistance 1: $0.04520
- Resistance 2: $0.05000
- Support 1: $0.04000
- Major Support: $0.02217
📈 Bullish Scenario
A confirmed breakout above $0.04520 with strong trading volume could open the door toward $0.05000.
📉 Bearish Scenario
If STRK loses the $0.04000 support, selling pressure could increase and lead to another downward move.
💡 My Market Outlook
STRK is showing a potential recovery signal, but confirmation is important. Watch volume, momentum, and key support levels before making any trading decision.
🔥 Recovery or Another Dip? What's Your STRK Prediction?
{spot}(STRKUSDT)
Share your analysis in the comments!
#STRK #Starknet #CryptoAnalysis #Binance #Altcoins #CryptoMarket #TechnicalAnalysis #TradingUpdate
🚀$ $STRK (Starknet) – Market Analysis & Recovery Watch
📊 Current Price: $0.04372
🟢 24H Change: +4.69%
📈 24H High: $0.04519
📉 24H Low: $0.04002
🔍 Market Overview
STRK is showing early signs of recovery after an extended downtrend. Buyers are attempting to build momentum around the $0.043 level.
The daily chart shows a slight improvement in momentum, while MACD remains in negative territory. A stronger confirmation is still needed before calling a full bullish reversal.
🎯 Key Levels to Watch
- Resistance 1: $0.04520
- Resistance 2: $0.05000
- Support 1: $0.04000
- Major Support: $0.02217
📈 Bullish Scenario
A confirmed breakout above $0.04520 with strong trading volume could open the door toward $0.05000.
📉 Bearish Scenario
If STRK loses the $0.04000 support, selling pressure could increase and lead to another downward move.
💡 My Market Outlook
STRK is showing a potential recovery signal, but confirmation is important. Watch volume, momentum, and key support levels before making any trading decision.
🔥 Recovery or Another Dip? What's Your STRK Prediction?
Share your analysis in the comments!
#STRK #Starknet #CryptoAnalysis #Binance #Altcoins #CryptoMarket #TechnicalAnalysis #TradingUpdate
📊 Current Price: $0.04372
🟢 24H Change: +4.69%
📈 24H High: $0.04519
📉 24H Low: $0.04002
🔍 Market Overview
STRK is showing early signs of recovery after an extended downtrend. Buyers are attempting to build momentum around the $0.043 level.
The daily chart shows a slight improvement in momentum, while MACD remains in negative territory. A stronger confirmation is still needed before calling a full bullish reversal.
🎯 Key Levels to Watch
- Resistance 1: $0.04520
- Resistance 2: $0.05000
- Support 1: $0.04000
- Major Support: $0.02217
📈 Bullish Scenario
A confirmed breakout above $0.04520 with strong trading volume could open the door toward $0.05000.
📉 Bearish Scenario
If STRK loses the $0.04000 support, selling pressure could increase and lead to another downward move.
💡 My Market Outlook
STRK is showing a potential recovery signal, but confirmation is important. Watch volume, momentum, and key support levels before making any trading decision.
🔥 Recovery or Another Dip? What's Your STRK Prediction?
Share your analysis in the comments!
#STRK #Starknet #CryptoAnalysis #Binance #Altcoins #CryptoMarket #TechnicalAnalysis #TradingUpdate
2
88
$STRK: A Patient View: A Price Move Is Also a Lesson in Liquidity: After the Excitement
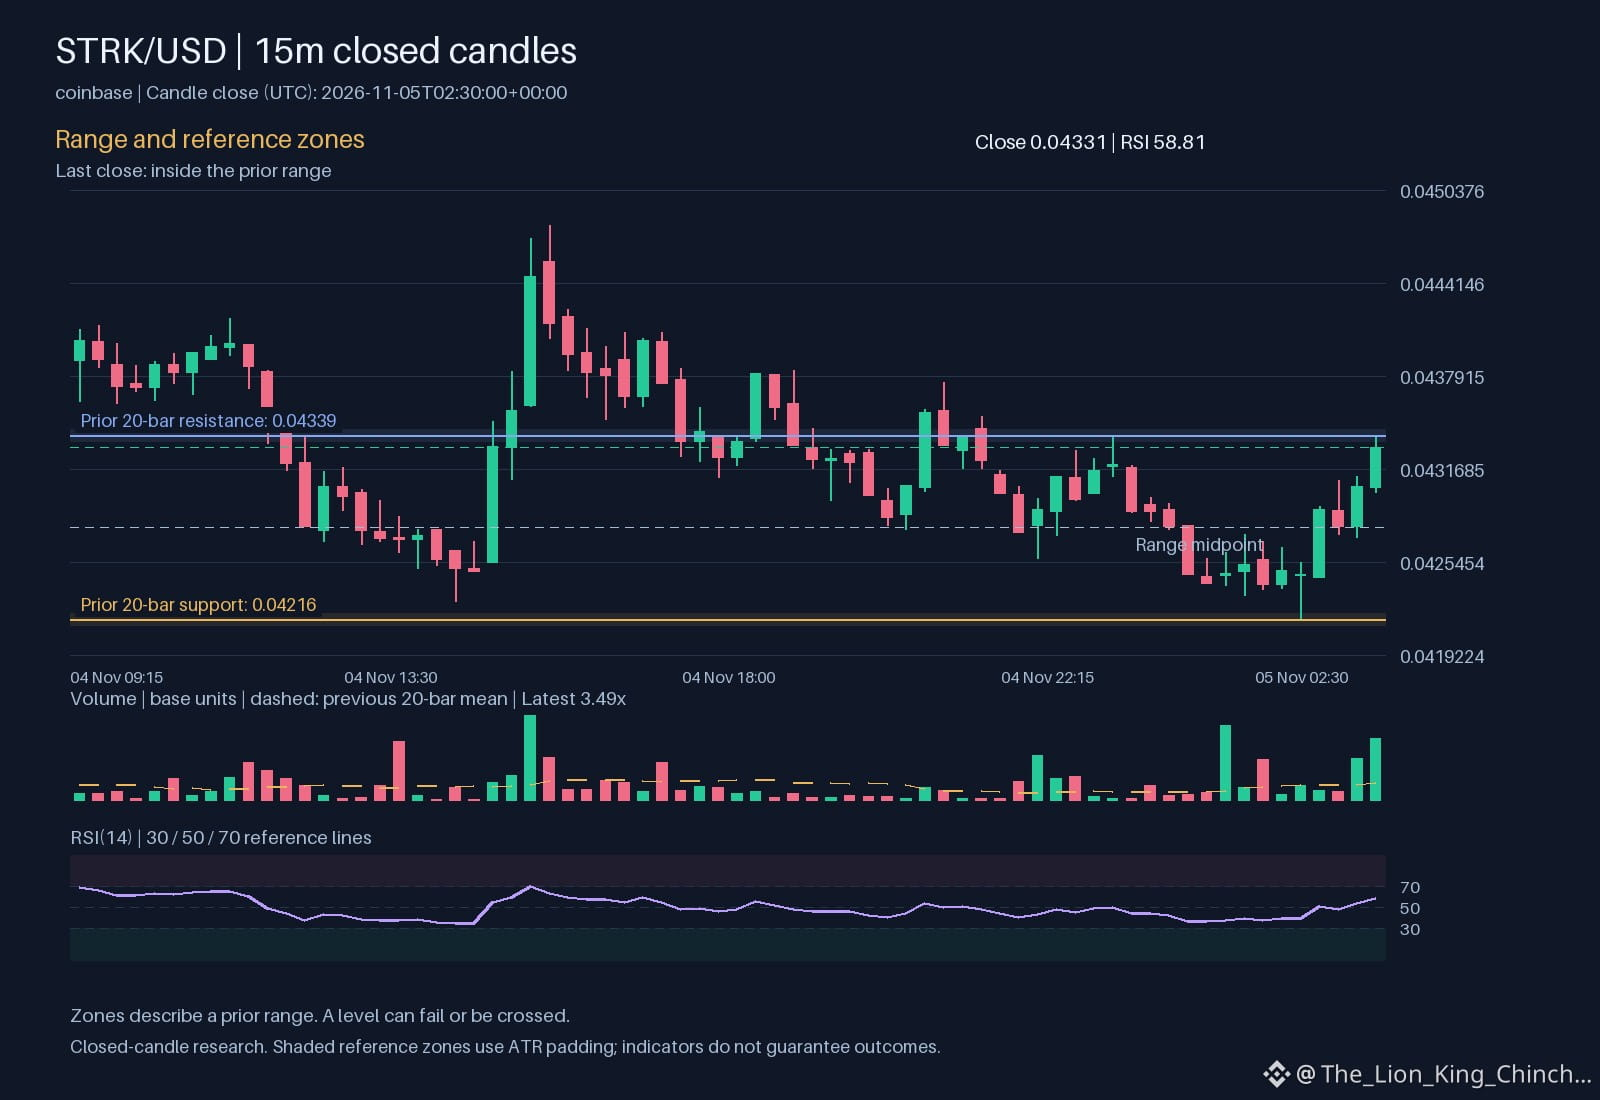
The concept worth exploring is whether today’s move for $STRK represents deep liquidity or thin supply. Often the current chart feels decisive, implying the price will respect key zones. Think of liquidity as a shallow pool with ladders. When the water is shallow, adding or removing a single runner makes the water level rise or fall quickly. The volume being above baseline means more runners are entering the pool. The current up direction shows the water is rising, but we must ask if the pool is deep enough to support it. If runners leave, the water level drops just as fast. A thin order book is less stable. This distinction is important. A price move near a mid-term average line should be treated with caution. The RSI value suggests where the energy stands, but it is not a guarantee of the future. Traders should never assume thicker volume implies a solid foundation. Instead, use a simple mental test. If your order size equals a large fraction of the visible liquidity, you will push the price significantly. If your size is tiny compared to the pool, your entry is more likely to be stable. The observation is that the price is up and volume is high. The mechanism is about supply and demand reacting to the available depth. To reassess this interpretation, check the depth around the current level. Do not guess if the level holds without seeing the actual bids and asks. A short pause after the move helps observers see if the price continues or stalls.
The key takeaway is that volume is not just a summary of activity. It is a proxy for how much impact a trade can have. Keep in fear, keep in check. Ensure your position size respects the available liquidity.
Probabilistic market research, not a recommendation or guaranteed return.
Which crypto concept becomes clearer when you look at an actual chart?
#STRK #CryptoEducation #CryptoLearning
$STRK : A Patient View: A Price Move Is Also a Lesson in Liquidity: After the Excitement
The concept worth exploring is whether today’s move for $STRK represents deep liquidity or thin supply. Often the current chart feels decisive, implying the price will respect key zones. Think of liquidity as a shallow pool with ladders. When the water is shallow, adding or removing a single runner makes the water level rise or fall quickly. The volume being above baseline means more runners are entering the pool. The current up direction shows the water is rising, but we must ask if the pool is deep enough to support it. If runners leave, the water level drops just as fast. A thin order book is less stable. This distinction is important. A price move near a mid-term average line should be treated with caution. The RSI value suggests where the energy stands, but it is not a guarantee of the future. Traders should never assume thicker volume implies a solid foundation. Instead, use a simple mental test. If your order size equals a large fraction of the visible liquidity, you will push the price significantly. If your size is tiny compared to the pool, your entry is more likely to be stable. The observation is that the price is up and volume is high. The mechanism is about supply and demand reacting to the available depth. To reassess this interpretation, check the depth around the current level. Do not guess if the level holds without seeing the actual bids and asks. A short pause after the move helps observers see if the price continues or stalls.
The key takeaway is that volume is not just a summary of activity. It is a proxy for how much impact a trade can have. Keep in fear, keep in check. Ensure your position size respects the available liquidity.
Probabilistic market research, not a recommendation or guaranteed return.
Which crypto concept becomes clearer when you look at an actual chart?
#STRK #CryptoEducation #CryptoLearning
The concept worth exploring is whether today’s move for $STRK represents deep liquidity or thin supply. Often the current chart feels decisive, implying the price will respect key zones. Think of liquidity as a shallow pool with ladders. When the water is shallow, adding or removing a single runner makes the water level rise or fall quickly. The volume being above baseline means more runners are entering the pool. The current up direction shows the water is rising, but we must ask if the pool is deep enough to support it. If runners leave, the water level drops just as fast. A thin order book is less stable. This distinction is important. A price move near a mid-term average line should be treated with caution. The RSI value suggests where the energy stands, but it is not a guarantee of the future. Traders should never assume thicker volume implies a solid foundation. Instead, use a simple mental test. If your order size equals a large fraction of the visible liquidity, you will push the price significantly. If your size is tiny compared to the pool, your entry is more likely to be stable. The observation is that the price is up and volume is high. The mechanism is about supply and demand reacting to the available depth. To reassess this interpretation, check the depth around the current level. Do not guess if the level holds without seeing the actual bids and asks. A short pause after the move helps observers see if the price continues or stalls.
The key takeaway is that volume is not just a summary of activity. It is a proxy for how much impact a trade can have. Keep in fear, keep in check. Ensure your position size respects the available liquidity.
Probabilistic market research, not a recommendation or guaranteed return.
Which crypto concept becomes clearer when you look at an actual chart?
#STRK #CryptoEducation #CryptoLearning
1
72

·
--
🚨 AGGRESSIVE ACCUMULATION DETECTED: $STRK
CVD shows HEAVY institutional absorption at current levels. Retail is selling, but BIG MONEY is absorbing every dip. Liquidity sweep completed; momentum shifting LONG.
EXECUTION:
ENTRY: 0.04322 $STRK
SL: 0.04200
TP1: 0.04484
RR: 1.6:1
The order flow is shifting. Is $STRK preparing for a massive supply flip or just a dead cat bounce? Drop your bias below.
#STRK #BinanceSquare #SlowSclap #TradingAnalysis
🚨 AGGRESSIVE ACCUMULATION DETECTED: $STRK
CVD shows HEAVY institutional absorption at current levels. Retail is selling, but BIG MONEY is absorbing every dip. Liquidity sweep completed; momentum shifting LONG.
EXECUTION:
ENTRY: 0.04322 $STRK
SL: 0.04200
TP1: 0.04484
RR: 1.6:1
The order flow is shifting. Is $STRK preparing for a massive supply flip or just a dead cat bounce? Drop your bias below.
#STRK #BinanceSquare #SlowSclap #TradingAnalysis
CVD shows HEAVY institutional absorption at current levels. Retail is selling, but BIG MONEY is absorbing every dip. Liquidity sweep completed; momentum shifting LONG.
EXECUTION:
ENTRY: 0.04322 $STRK
SL: 0.04200
TP1: 0.04484
RR: 1.6:1
The order flow is shifting. Is $STRK preparing for a massive supply flip or just a dead cat bounce? Drop your bias below.
#STRK #BinanceSquare #SlowSclap #TradingAnalysis
55
·
--
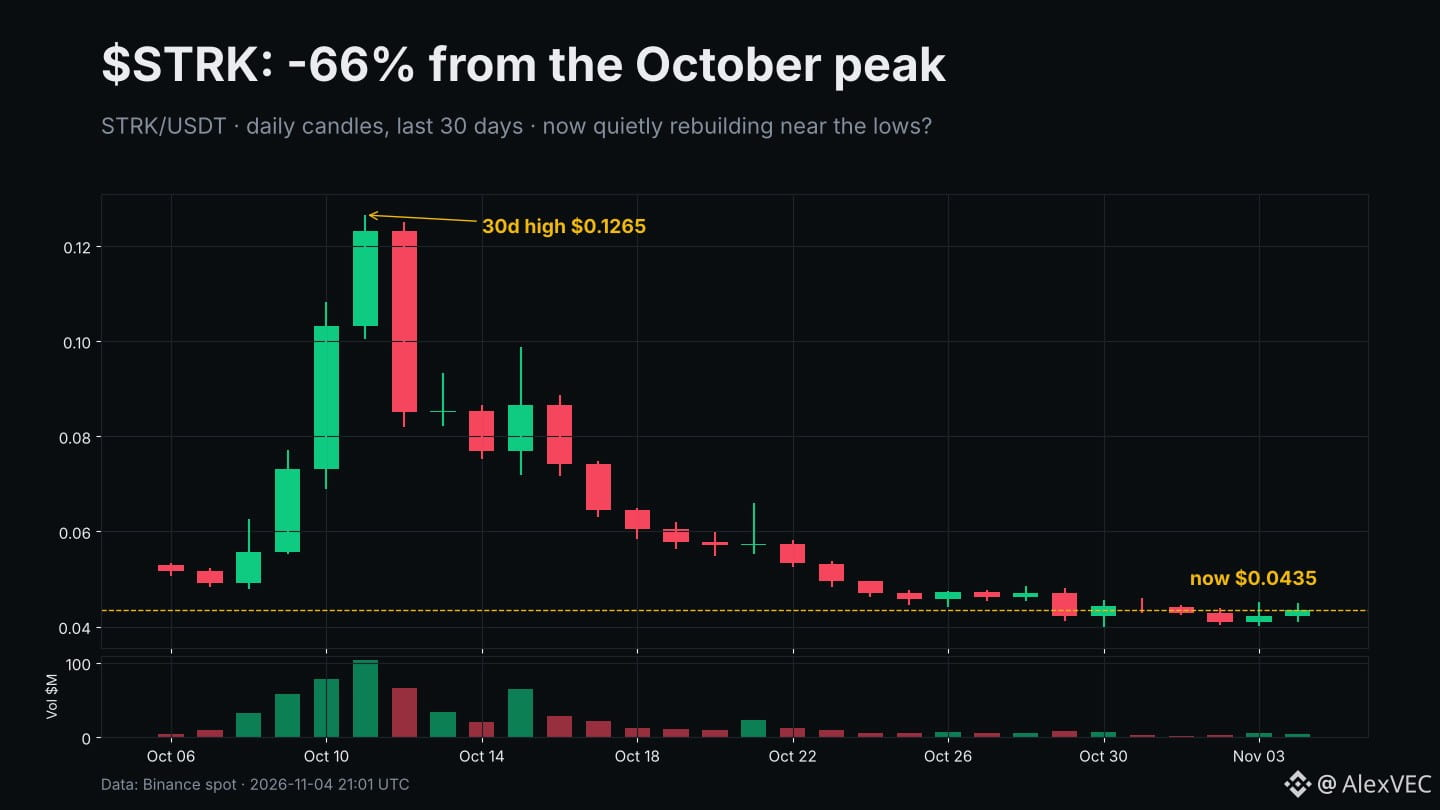
$STRK went from $0.1265 to $0.0435 in 24 days. Nobody's talking about it anymore, and that may be the interesting part.
The price action:
• 24h: +2.6%, range $0.0410–$0.0449
• 7d: -7.5%, with a weekly low of $0.0398
• Down ~66% from the Oct 11 high
• Daily volume has shrunk from $103.8M on the peak day to about $4.7M over the last 24h
Candles have gone from huge red bodies to tiny ones sitting on $0.040–$0.044. That's what exhaustion looks like, though it isn't the same as a bottom. A clean daily close back above $0.048 would be the first sign buyers are returning. Losing $0.040 opens fresh lows.
The ecosystem angle: in October a non-binding Starknet governance poll backed researching a move to an independent, quantum-resistant L1 (about 93.5% of voting power in favor, research only, not a migration). StarkWare says a draft whitepaper is due this month, and on Nov 2 it demoed a wallet migrating to post-quantum signatures on Sepolia testnet.
So the narrative is still active while the chart is dead quiet. Does the whitepaper wake STRK up, or is it already a "sell the news" setup?
Small-cap, very volatile, size accordingly.
Not financial advice.
#Starknet #STRK #Crypto
$STRK went from $0.1265 to $0.0435 in 24 days. Nobody's talking about it anymore, and that may be the interesting part.
The price action:
• 24h: +2.6%, range $0.0410–$0.0449
• 7d: -7.5%, with a weekly low of $0.0398
• Down ~66% from the Oct 11 high
• Daily volume has shrunk from $103.8M on the peak day to about $4.7M over the last 24h
Candles have gone from huge red bodies to tiny ones sitting on $0.040–$0.044. That's what exhaustion looks like, though it isn't the same as a bottom. A clean daily close back above $0.048 would be the first sign buyers are returning. Losing $0.040 opens fresh lows.
The ecosystem angle: in October a non-binding Starknet governance poll backed researching a move to an independent, quantum-resistant L1 (about 93.5% of voting power in favor, research only, not a migration). StarkWare says a draft whitepaper is due this month, and on Nov 2 it demoed a wallet migrating to post-quantum signatures on Sepolia testnet.
So the narrative is still active while the chart is dead quiet. Does the whitepaper wake STRK up, or is it already a "sell the news" setup?
Small-cap, very volatile, size accordingly.
Not financial advice.
#Starknet #STRK #Crypto
The price action:
• 24h: +2.6%, range $0.0410–$0.0449
• 7d: -7.5%, with a weekly low of $0.0398
• Down ~66% from the Oct 11 high
• Daily volume has shrunk from $103.8M on the peak day to about $4.7M over the last 24h
Candles have gone from huge red bodies to tiny ones sitting on $0.040–$0.044. That's what exhaustion looks like, though it isn't the same as a bottom. A clean daily close back above $0.048 would be the first sign buyers are returning. Losing $0.040 opens fresh lows.
The ecosystem angle: in October a non-binding Starknet governance poll backed researching a move to an independent, quantum-resistant L1 (about 93.5% of voting power in favor, research only, not a migration). StarkWare says a draft whitepaper is due this month, and on Nov 2 it demoed a wallet migrating to post-quantum signatures on Sepolia testnet.
So the narrative is still active while the chart is dead quiet. Does the whitepaper wake STRK up, or is it already a "sell the news" setup?
Small-cap, very volatile, size accordingly.
Not financial advice.
#Starknet #STRK #Crypto
47
Log in to explore more content
Join global crypto users on Binance Square
⚡️ Get latest and useful information about crypto.
💬 Trusted by the world’s largest crypto exchange.
👍 Discover real insights from verified creators.
Email / Phone number
Trending Topics
1
#CPITestsDecemberRateOutlook
0 views
6 Discussing
2
#BitcoinRebounds$75KAsChipsLead
15,144 views
183 Discussing
3
#JobsReportRaisesHikeOdds
173,953 views
1,485 Discussing
4
#US Data Center Rules May Constrain AI Expansion
28,233 views
137 Discussing
5
#WillAnthropicListOnTime
38,685 views
518 Discussing
6
#BitcoinETFsSee$412MNetOutflows
205 views
30 Discussing
7
#HKSFCPlansToRestrictCryptoAndExchangeTerms
2,736 views
103 Discussing
8
#AnthropicStillPlansPreThanksgivingIPO
12,877 views
184 Discussing
9
#FinCENAndFedWithdraw$250CryptoTransferProposal
3,890 views
13 Discussing
10
#TradFiForBeginners
26,998 views
437 Discussing