
#starknet
starknet
967,297 views
2,433 Discussing
Hot
Latest
·
--
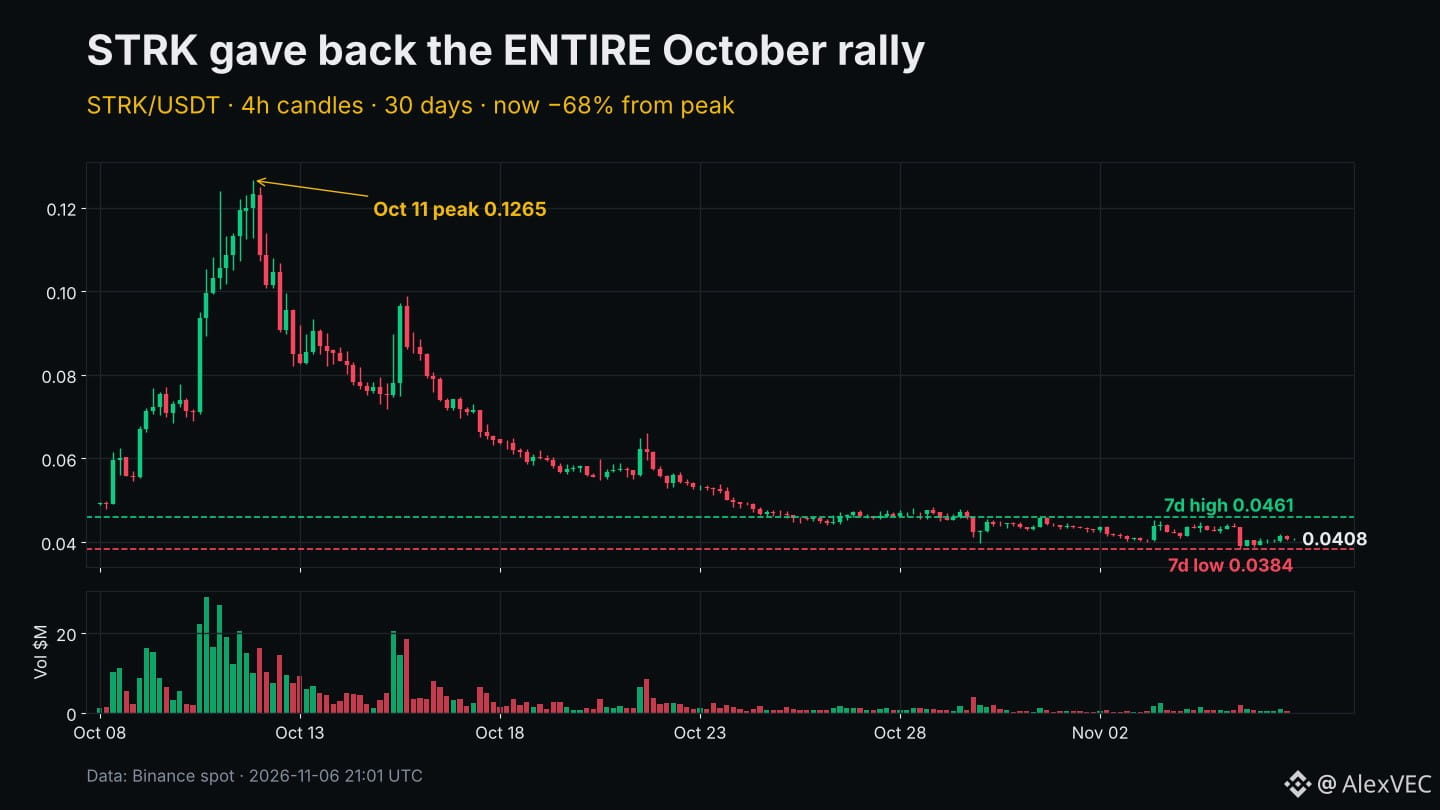
$STRK has now given back its ENTIRE October rally.
The run that started near 0.043 on Oct 3 topped at 0.1265 on Oct 11. Today it trades around 0.0408, about 68% off that peak and below where the move began.
What fueled it was real news: on Oct 8 StarkWare CEO Eli Ben-Sasson said Starknet is actively considering becoming an independent Layer 1, and strkBTC incentives were drawing Bitcoin DeFi attention. Then came the Oct 15 unlock of roughly 127M STRK to early contributors and investors, and the bid never recovered. Speculation on a narrative is not the same as a shipped plan.
The chart now:
• 24h: +2.6%, range 0.0389 – 0.0419
• 7d: -7.9%, low 0.0384 (Nov 5), high 0.0461
• 24h volume ~$3.1M vs ~$5.5M daily average over the past two weeks. Interest has dried up.
0.0384 is the line. Lose it and STRK prints its lowest level since early October. Reclaim 0.046 and the downtrend from the peak finally gets questioned. Thin volume means either break can be sharp, and this is a high-volatility small cap, so size accordingly.
Is the L1 story priced out completely, or is this where patient money starts paying attention?
Not financial advice.
#Starknet #STRK #Altcoins
$STRK has now given back its ENTIRE October rally.
The run that started near 0.043 on Oct 3 topped at 0.1265 on Oct 11. Today it trades around 0.0408, about 68% off that peak and below where the move began.
What fueled it was real news: on Oct 8 StarkWare CEO Eli Ben-Sasson said Starknet is actively considering becoming an independent Layer 1, and strkBTC incentives were drawing Bitcoin DeFi attention. Then came the Oct 15 unlock of roughly 127M STRK to early contributors and investors, and the bid never recovered. Speculation on a narrative is not the same as a shipped plan.
The chart now:
• 24h: +2.6%, range 0.0389 – 0.0419
• 7d: -7.9%, low 0.0384 (Nov 5), high 0.0461
• 24h volume ~$3.1M vs ~$5.5M daily average over the past two weeks. Interest has dried up.
0.0384 is the line. Lose it and STRK prints its lowest level since early October. Reclaim 0.046 and the downtrend from the peak finally gets questioned. Thin volume means either break can be sharp, and this is a high-volatility small cap, so size accordingly.
Is the L1 story priced out completely, or is this where patient money starts paying attention?
Not financial advice.
#Starknet #STRK #Altcoins
The run that started near 0.043 on Oct 3 topped at 0.1265 on Oct 11. Today it trades around 0.0408, about 68% off that peak and below where the move began.
What fueled it was real news: on Oct 8 StarkWare CEO Eli Ben-Sasson said Starknet is actively considering becoming an independent Layer 1, and strkBTC incentives were drawing Bitcoin DeFi attention. Then came the Oct 15 unlock of roughly 127M STRK to early contributors and investors, and the bid never recovered. Speculation on a narrative is not the same as a shipped plan.
The chart now:
• 24h: +2.6%, range 0.0389 – 0.0419
• 7d: -7.9%, low 0.0384 (Nov 5), high 0.0461
• 24h volume ~$3.1M vs ~$5.5M daily average over the past two weeks. Interest has dried up.
0.0384 is the line. Lose it and STRK prints its lowest level since early October. Reclaim 0.046 and the downtrend from the peak finally gets questioned. Thin volume means either break can be sharp, and this is a high-volatility small cap, so size accordingly.
Is the L1 story priced out completely, or is this where patient money starts paying attention?
Not financial advice.
#Starknet #STRK #Altcoins
9
·
--
Article
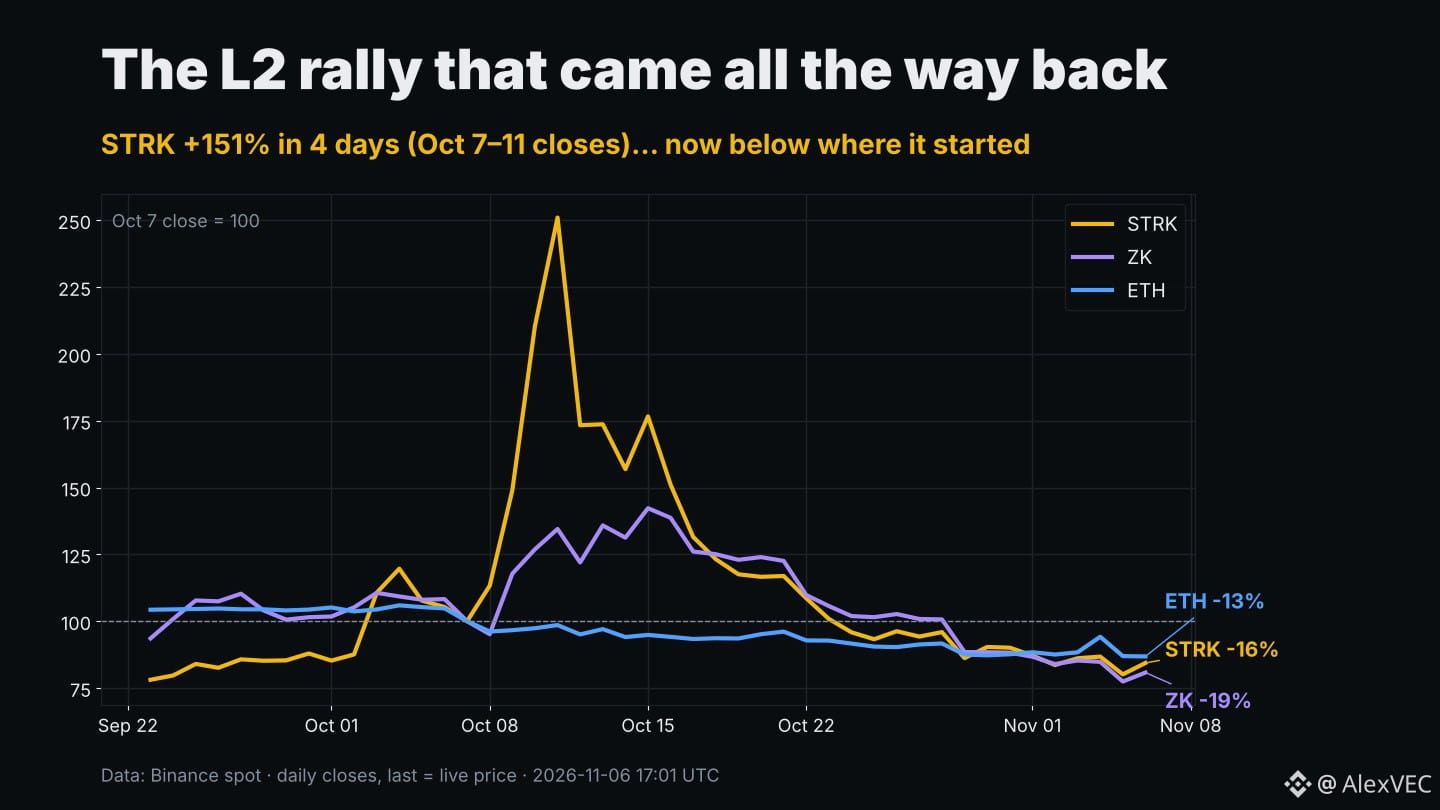
STRK Ran 151% in 4 Days. Now It's Below Where It StartedFour weeks ago $STRK did +151% in four daily candles. Today it trades below the candle where that run started. If you're wondering what happened to the October L2 trade, the chart above tells most of the story.
The numbers (Binance spot, daily closes)
STRK closed Oct 7 at 0.04907 and Oct 11 at 0.12316. That's +151% in four days, on a single-day volume of about $104M, roughly 11x what it printed on Oct 7. It now sits near 0.0414, which is about 66% below the Oct 11 close and roughly 16% below Oct 7.
$ZK ran later and softer: from 0.01197 on Oct 7 to 0.01703 on Oct 15, about +42%. It's now around 0.00967, about 43% off that close and about 19% below its own Oct 7 level.
$ETH, the chain both of these settle to, never joined the party. It closed Oct 7 at 2,574 and is around 2,235 now, about -13%. Its latest bounce stalled too: a wick to 2,450 on Nov 4, then a close back at 2,238 the next day.
So all three are below the Oct 7 baseline, and the two L2 tokens are below it by more than ETH. Every bit of the October outperformance is gone.
Why round-trips like this happen
A move that size, on that much volume and with no follow-through from the base asset, is usually a liquidity event rather than a repricing. Volume is the tell. STRK's daily volume over the last two weeks has been about $2–9M, a small fraction of the $104M peak day. ZK's 24h volume is under $1M. The buyers who drove the spike haven't come back, and thin books cut both ways: they let a token run fast, and they let it bleed without much resistance.
It's also a useful reminder of the beta problem with L2 tokens. When the market is risk-on, they move like leveraged ETH. When ETH drifts lower, as it has for a month, they tend to drift lower faster.
The longer view isn't as ugly
Zoom out to 90 days and STRK is still up about 76% from its early-August close of 0.02345. Measured in ETH, STRK is about 62% below its Oct 11 peak ratio but still around 50% above where it was in early August. So October didn't come from nothing, but the spike priced in far more than the market was willing to hold.
Levels I'm watching on STRK
- Support: 0.0384–0.0398. Those are the Nov 5 and Oct 30 lows. Losing that zone on a daily close would put the rally fully in the rear-view.
- Resistance: 0.0455–0.0485. That's the late-October range ceiling, and above it sits 0.0495, where Oct 23 closed.
- Today it's up about 3.9% in 24h, with a range of 0.0389–0.0419, but on only about $3.4M of volume. Small green candles on thin volume don't prove much yet.
For ZK, the Nov 5 low near 0.0090 is the line in the sand. It's the lowest print since mid-September.
What would change the picture
1. ETH reclaiming the 2,400s and holding there. Nov 4 showed buyers can push it, but they couldn't keep it. L2 tokens rarely lead when ETH is weak.
2. Volume coming back to L2 tokens. A move on $20M+ days means something; a move on $3M days usually doesn't.
3. STRK/ETH stabilising. If the ratio stops making lower lows, rotation interest is returning.
Until then I'd treat L2 bounces as bounces, not trend changes. STRK and ZK are small, volatile and thinly traded right now. Size accordingly, and know where you're wrong before you get in.
Did you trade the October spike, or did you watch it from the sidelines? And what would get you back into L2 tokens: an ETH breakout, or a cheaper price?
Not financial advice.
#Starknet #Layer2 #CryptoAnalysis
STRK Ran 151% in 4 Days. Now It's Below Where It Started
Four weeks ago $STRK did +151% in four daily candles. Today it trades below the candle where that run started. If you're wondering what happened to the October L2 trade, the chart above tells most of the story.
The numbers (Binance spot, daily closes)
STRK closed Oct 7 at 0.04907 and Oct 11 at 0.12316. That's +151% in four days, on a single-day volume of about $104M, roughly 11x what it printed on Oct 7. It now sits near 0.0414, which is about 66% below the Oct 11 close and roughly 16% below Oct 7.
$ZK ran later and softer: from 0.01197 on Oct 7 to 0.01703 on Oct 15, about +42%. It's now around 0.00967, about 43% off that close and about 19% below its own Oct 7 level.
$ETH , the chain both of these settle to, never joined the party. It closed Oct 7 at 2,574 and is around 2,235 now, about -13%. Its latest bounce stalled too: a wick to 2,450 on Nov 4, then a close back at 2,238 the next day.
So all three are below the Oct 7 baseline, and the two L2 tokens are below it by more than ETH. Every bit of the October outperformance is gone.
Why round-trips like this happen
A move that size, on that much volume and with no follow-through from the base asset, is usually a liquidity event rather than a repricing. Volume is the tell. STRK's daily volume over the last two weeks has been about $2–9M, a small fraction of the $104M peak day. ZK's 24h volume is under $1M. The buyers who drove the spike haven't come back, and thin books cut both ways: they let a token run fast, and they let it bleed without much resistance.
It's also a useful reminder of the beta problem with L2 tokens. When the market is risk-on, they move like leveraged ETH. When ETH drifts lower, as it has for a month, they tend to drift lower faster.
The longer view isn't as ugly
Zoom out to 90 days and STRK is still up about 76% from its early-August close of 0.02345. Measured in ETH, STRK is about 62% below its Oct 11 peak ratio but still around 50% above where it was in early August. So October didn't come from nothing, but the spike priced in far more than the market was willing to hold.
Levels I'm watching on STRK
- Support: 0.0384–0.0398. Those are the Nov 5 and Oct 30 lows. Losing that zone on a daily close would put the rally fully in the rear-view.
- Resistance: 0.0455–0.0485. That's the late-October range ceiling, and above it sits 0.0495, where Oct 23 closed.
- Today it's up about 3.9% in 24h, with a range of 0.0389–0.0419, but on only about $3.4M of volume. Small green candles on thin volume don't prove much yet.
For ZK, the Nov 5 low near 0.0090 is the line in the sand. It's the lowest print since mid-September.
What would change the picture
1. ETH reclaiming the 2,400s and holding there. Nov 4 showed buyers can push it, but they couldn't keep it. L2 tokens rarely lead when ETH is weak.
2. Volume coming back to L2 tokens. A move on $20M+ days means something; a move on $3M days usually doesn't.
3. STRK/ETH stabilising. If the ratio stops making lower lows, rotation interest is returning.
Until then I'd treat L2 bounces as bounces, not trend changes. STRK and ZK are small, volatile and thinly traded right now. Size accordingly, and know where you're wrong before you get in.
Did you trade the October spike, or did you watch it from the sidelines? And what would get you back into L2 tokens: an ETH breakout, or a cheaper price?
Not financial advice.
#Starknet #Layer2 #CryptoAnalysis
The numbers (Binance spot, daily closes)
STRK closed Oct 7 at 0.04907 and Oct 11 at 0.12316. That's +151% in four days, on a single-day volume of about $104M, roughly 11x what it printed on Oct 7. It now sits near 0.0414, which is about 66% below the Oct 11 close and roughly 16% below Oct 7.
$ZK ran later and softer: from 0.01197 on Oct 7 to 0.01703 on Oct 15, about +42%. It's now around 0.00967, about 43% off that close and about 19% below its own Oct 7 level.
$ETH , the chain both of these settle to, never joined the party. It closed Oct 7 at 2,574 and is around 2,235 now, about -13%. Its latest bounce stalled too: a wick to 2,450 on Nov 4, then a close back at 2,238 the next day.
So all three are below the Oct 7 baseline, and the two L2 tokens are below it by more than ETH. Every bit of the October outperformance is gone.
Why round-trips like this happen
A move that size, on that much volume and with no follow-through from the base asset, is usually a liquidity event rather than a repricing. Volume is the tell. STRK's daily volume over the last two weeks has been about $2–9M, a small fraction of the $104M peak day. ZK's 24h volume is under $1M. The buyers who drove the spike haven't come back, and thin books cut both ways: they let a token run fast, and they let it bleed without much resistance.
It's also a useful reminder of the beta problem with L2 tokens. When the market is risk-on, they move like leveraged ETH. When ETH drifts lower, as it has for a month, they tend to drift lower faster.
The longer view isn't as ugly
Zoom out to 90 days and STRK is still up about 76% from its early-August close of 0.02345. Measured in ETH, STRK is about 62% below its Oct 11 peak ratio but still around 50% above where it was in early August. So October didn't come from nothing, but the spike priced in far more than the market was willing to hold.
Levels I'm watching on STRK
- Support: 0.0384–0.0398. Those are the Nov 5 and Oct 30 lows. Losing that zone on a daily close would put the rally fully in the rear-view.
- Resistance: 0.0455–0.0485. That's the late-October range ceiling, and above it sits 0.0495, where Oct 23 closed.
- Today it's up about 3.9% in 24h, with a range of 0.0389–0.0419, but on only about $3.4M of volume. Small green candles on thin volume don't prove much yet.
For ZK, the Nov 5 low near 0.0090 is the line in the sand. It's the lowest print since mid-September.
What would change the picture
1. ETH reclaiming the 2,400s and holding there. Nov 4 showed buyers can push it, but they couldn't keep it. L2 tokens rarely lead when ETH is weak.
2. Volume coming back to L2 tokens. A move on $20M+ days means something; a move on $3M days usually doesn't.
3. STRK/ETH stabilising. If the ratio stops making lower lows, rotation interest is returning.
Until then I'd treat L2 bounces as bounces, not trend changes. STRK and ZK are small, volatile and thinly traded right now. Size accordingly, and know where you're wrong before you get in.
Did you trade the October spike, or did you watch it from the sidelines? And what would get you back into L2 tokens: an ETH breakout, or a cheaper price?
Not financial advice.
#Starknet #Layer2 #CryptoAnalysis
5

·
--
🚀 $STRK – Starknet: A Project to Watch!
Starknet continues to build its Layer 2 ecosystem with a focus on scalability, privacy, and advanced blockchain technology.
📊 The market is showing mixed signals, but long-term development remains worth watching.
🔥 My focus is on network growth, ecosystem adoption, and future opportunities.
Patience and research are key in crypto!
💎 Stay focused. Stay strong.
#STRK #Starknet #Crypto #Binance #blockchain $STRK
{spot}(STRKUSDT)
🚀 $STRK – Starknet: A Project to Watch!
Starknet continues to build its Layer 2 ecosystem with a focus on scalability, privacy, and advanced blockchain technology.
📊 The market is showing mixed signals, but long-term development remains worth watching.
🔥 My focus is on network growth, ecosystem adoption, and future opportunities.
Patience and research are key in crypto!
💎 Stay focused. Stay strong.
#STRK #Starknet #Crypto #Binance #blockchain $STRK
Starknet continues to build its Layer 2 ecosystem with a focus on scalability, privacy, and advanced blockchain technology.
📊 The market is showing mixed signals, but long-term development remains worth watching.
🔥 My focus is on network growth, ecosystem adoption, and future opportunities.
Patience and research are key in crypto!
💎 Stay focused. Stay strong.
#STRK #Starknet #Crypto #Binance #blockchain $STRK

4
1.2k
·
--
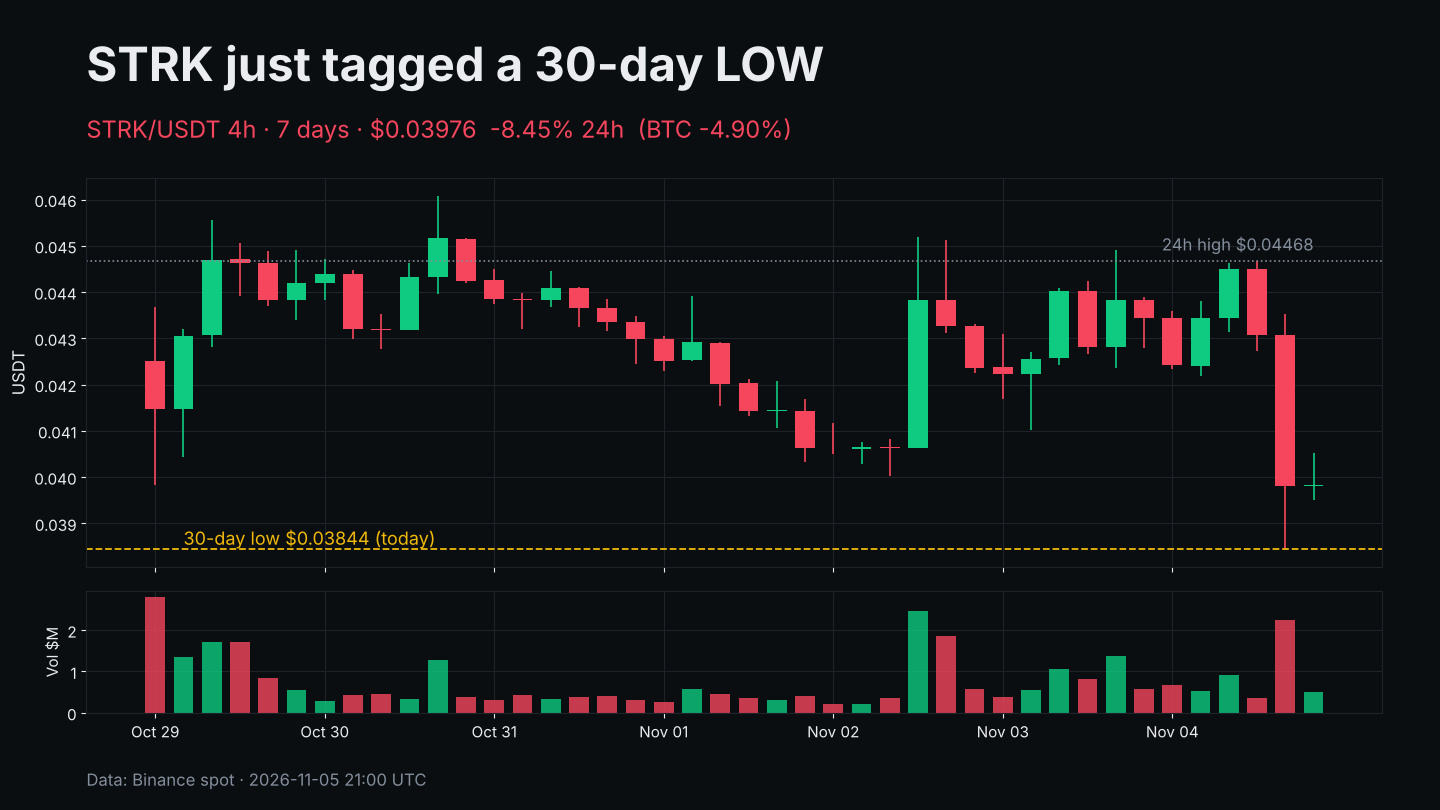
$STRK just wicked to $0.03844, its lowest print in 30 days, while $BTC slipped "only" 4.9%.
The numbers right now:
• Price $0.03976, -8.45% in 24h
• 24h range $0.03844 – $0.04468
• -6.3% over 7 days, -23% over 30 days
• 24h volume about $5.2M, in line with its recent daily range
The chart tells a simple story. For a week STRK chopped between roughly $0.040 and $0.046, then lost the floor in one heavy 4h candle as BTC dropped from above $80K toward $76K. The selling candle carried one of the biggest 4h volume bars of the week, so this wasn't just thin air.
Levels I'm watching: $0.0384 is the line in the sand. A daily close back above $0.042 would turn this into a fake breakdown; losing $0.038 opens fresh lows for the month.
Project angle: supply is a recurring headwind. Under StarkWare's revised schedule (reported by The Block), about 127M STRK unlock on the 15th of every month through March 2027. The next one is November 15, ten days out, and the token has often been soft around these dates.
High beta, thin liquidity, unlock overhang: size small if you play it.
Bounce from the 30-day low, or one more leg down before the 15th?
Not financial advice.
#Starknet #STRK #CryptoTrading
$STRK just wicked to $0.03844, its lowest print in 30 days, while $BTC slipped "only" 4.9%.
The numbers right now:
• Price $0.03976, -8.45% in 24h
• 24h range $0.03844 – $0.04468
• -6.3% over 7 days, -23% over 30 days
• 24h volume about $5.2M, in line with its recent daily range
The chart tells a simple story. For a week STRK chopped between roughly $0.040 and $0.046, then lost the floor in one heavy 4h candle as BTC dropped from above $80K toward $76K. The selling candle carried one of the biggest 4h volume bars of the week, so this wasn't just thin air.
Levels I'm watching: $0.0384 is the line in the sand. A daily close back above $0.042 would turn this into a fake breakdown; losing $0.038 opens fresh lows for the month.
Project angle: supply is a recurring headwind. Under StarkWare's revised schedule (reported by The Block), about 127M STRK unlock on the 15th of every month through March 2027. The next one is November 15, ten days out, and the token has often been soft around these dates.
High beta, thin liquidity, unlock overhang: size small if you play it.
Bounce from the 30-day low, or one more leg down before the 15th?
Not financial advice.
#Starknet #STRK #CryptoTrading
The numbers right now:
• Price $0.03976, -8.45% in 24h
• 24h range $0.03844 – $0.04468
• -6.3% over 7 days, -23% over 30 days
• 24h volume about $5.2M, in line with its recent daily range
The chart tells a simple story. For a week STRK chopped between roughly $0.040 and $0.046, then lost the floor in one heavy 4h candle as BTC dropped from above $80K toward $76K. The selling candle carried one of the biggest 4h volume bars of the week, so this wasn't just thin air.
Levels I'm watching: $0.0384 is the line in the sand. A daily close back above $0.042 would turn this into a fake breakdown; losing $0.038 opens fresh lows for the month.
Project angle: supply is a recurring headwind. Under StarkWare's revised schedule (reported by The Block), about 127M STRK unlock on the 15th of every month through March 2027. The next one is November 15, ten days out, and the token has often been soft around these dates.
High beta, thin liquidity, unlock overhang: size small if you play it.
Bounce from the 30-day low, or one more leg down before the 15th?
Not financial advice.
#Starknet #STRK #CryptoTrading
9
·
--
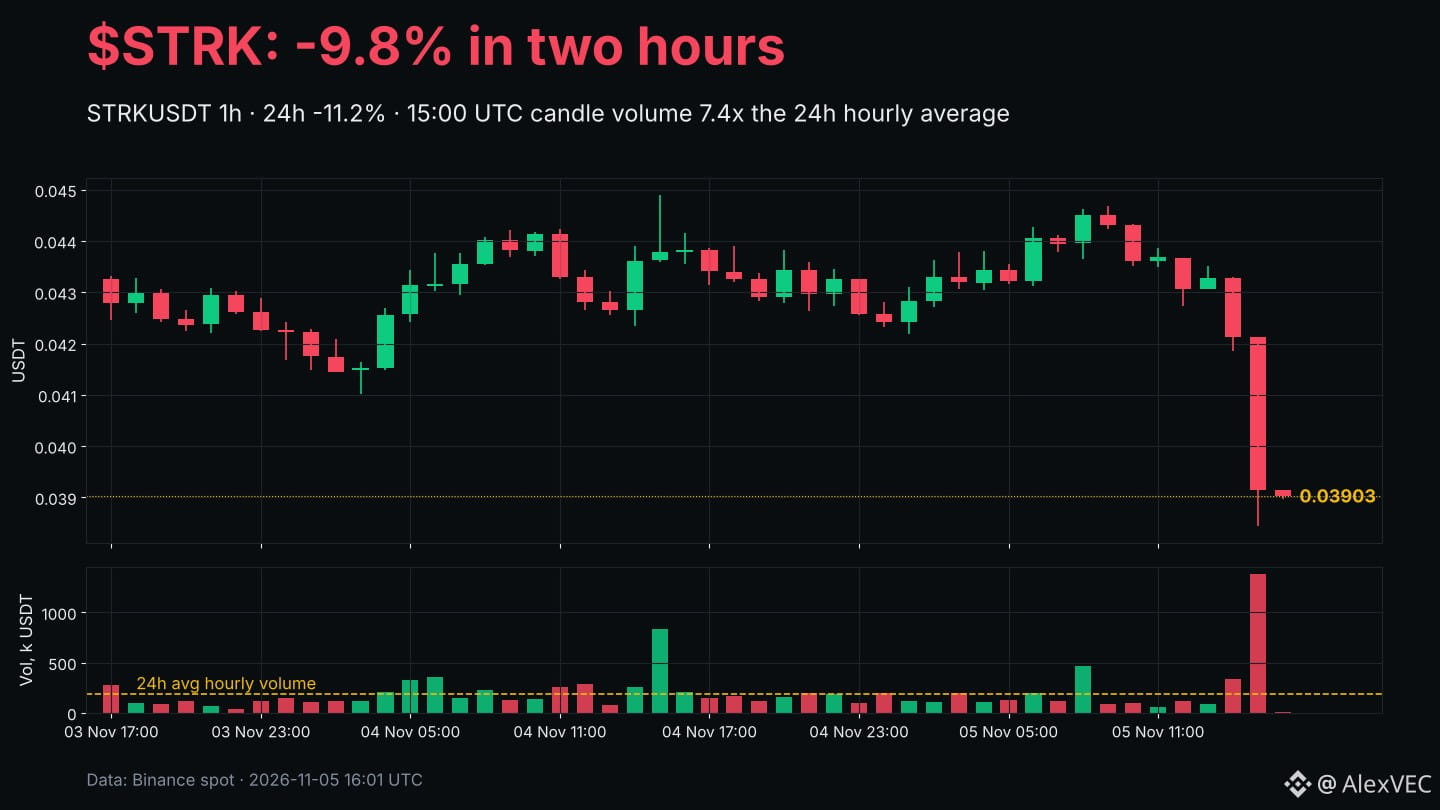
$STRK just dropped 9.8% in two hours, and the volume says it wasn't a quiet slide.
From the 14:00 UTC open at 0.04328 it fell to a low of 0.03844 before settling near 0.0390. The 15:00 UTC candle alone printed about 7.4x the average hourly volume of the past day. That's down 11.2% over 24h.
It didn't happen alone. In the same window $BTC slid from roughly 79,660 to a 75,568 low and $ETH lost 2,300, hitting 2,236. Broad risk-off hour: STRK just fell harder, as small caps usually do.
What I'm watching: does STRK reclaim the 0.042 area it broke from, or does 0.0384 get retested once the dust settles? Thin-cap coins can whip both ways after a flush like this, so size accordingly.
Are you buying this dip, waiting for BTC to stabilize first, or staying out?
Not financial advice.
#Starknet #CryptoMarket #Altcoins
$STRK just dropped 9.8% in two hours, and the volume says it wasn't a quiet slide.
From the 14:00 UTC open at 0.04328 it fell to a low of 0.03844 before settling near 0.0390. The 15:00 UTC candle alone printed about 7.4x the average hourly volume of the past day. That's down 11.2% over 24h.
It didn't happen alone. In the same window $BTC slid from roughly 79,660 to a 75,568 low and $ETH lost 2,300, hitting 2,236. Broad risk-off hour: STRK just fell harder, as small caps usually do.
What I'm watching: does STRK reclaim the 0.042 area it broke from, or does 0.0384 get retested once the dust settles? Thin-cap coins can whip both ways after a flush like this, so size accordingly.
Are you buying this dip, waiting for BTC to stabilize first, or staying out?
Not financial advice.
#Starknet #CryptoMarket #Altcoins
From the 14:00 UTC open at 0.04328 it fell to a low of 0.03844 before settling near 0.0390. The 15:00 UTC candle alone printed about 7.4x the average hourly volume of the past day. That's down 11.2% over 24h.
It didn't happen alone. In the same window $BTC slid from roughly 79,660 to a 75,568 low and $ETH lost 2,300, hitting 2,236. Broad risk-off hour: STRK just fell harder, as small caps usually do.
What I'm watching: does STRK reclaim the 0.042 area it broke from, or does 0.0384 get retested once the dust settles? Thin-cap coins can whip both ways after a flush like this, so size accordingly.
Are you buying this dip, waiting for BTC to stabilize first, or staying out?
Not financial advice.
#Starknet #CryptoMarket #Altcoins
7
·
--
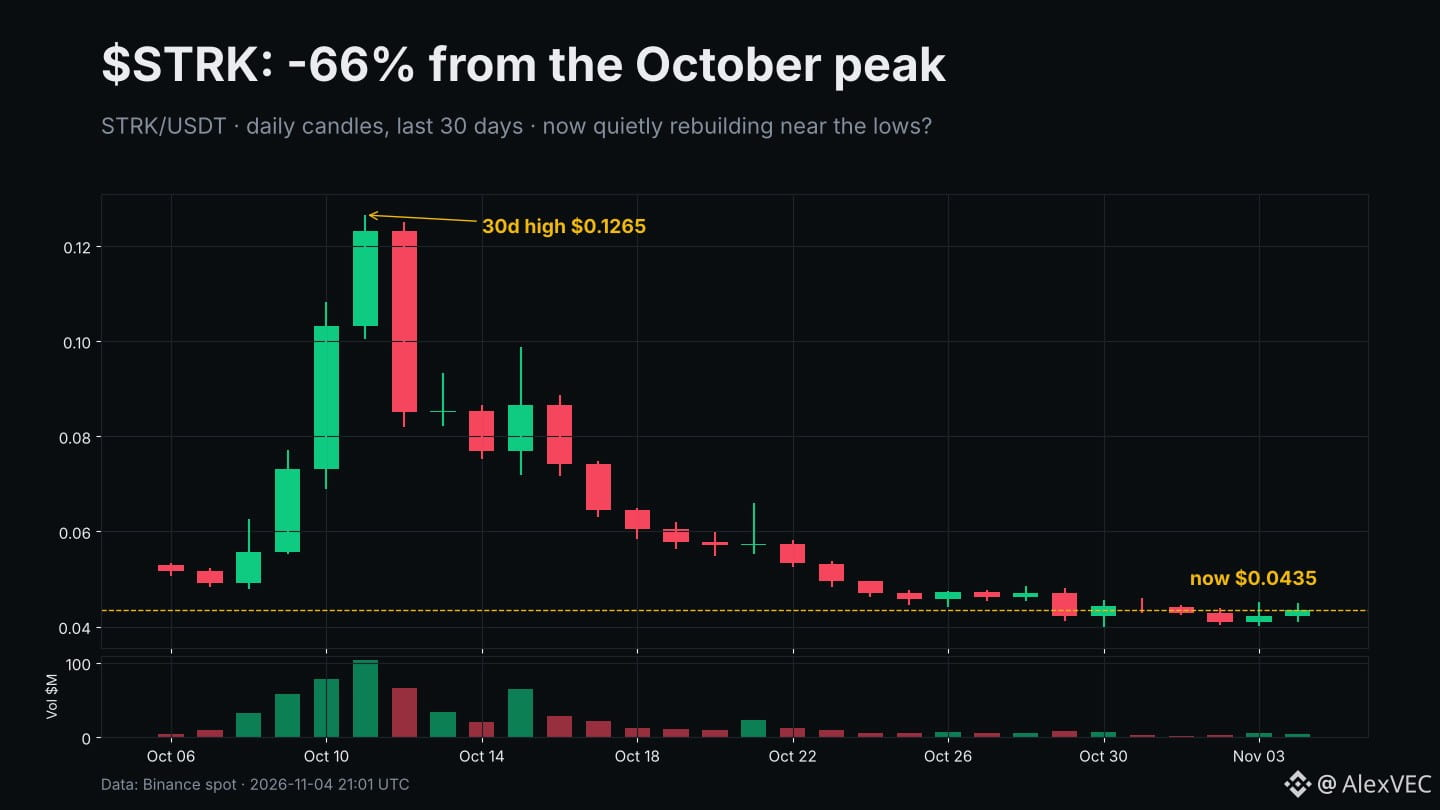
$STRK went from $0.1265 to $0.0435 in 24 days. Nobody's talking about it anymore, and that may be the interesting part.
The price action:
• 24h: +2.6%, range $0.0410–$0.0449
• 7d: -7.5%, with a weekly low of $0.0398
• Down ~66% from the Oct 11 high
• Daily volume has shrunk from $103.8M on the peak day to about $4.7M over the last 24h
Candles have gone from huge red bodies to tiny ones sitting on $0.040–$0.044. That's what exhaustion looks like, though it isn't the same as a bottom. A clean daily close back above $0.048 would be the first sign buyers are returning. Losing $0.040 opens fresh lows.
The ecosystem angle: in October a non-binding Starknet governance poll backed researching a move to an independent, quantum-resistant L1 (about 93.5% of voting power in favor, research only, not a migration). StarkWare says a draft whitepaper is due this month, and on Nov 2 it demoed a wallet migrating to post-quantum signatures on Sepolia testnet.
So the narrative is still active while the chart is dead quiet. Does the whitepaper wake STRK up, or is it already a "sell the news" setup?
Small-cap, very volatile, size accordingly.
Not financial advice.
#Starknet #STRK #Crypto
$STRK went from $0.1265 to $0.0435 in 24 days. Nobody's talking about it anymore, and that may be the interesting part.
The price action:
• 24h: +2.6%, range $0.0410–$0.0449
• 7d: -7.5%, with a weekly low of $0.0398
• Down ~66% from the Oct 11 high
• Daily volume has shrunk from $103.8M on the peak day to about $4.7M over the last 24h
Candles have gone from huge red bodies to tiny ones sitting on $0.040–$0.044. That's what exhaustion looks like, though it isn't the same as a bottom. A clean daily close back above $0.048 would be the first sign buyers are returning. Losing $0.040 opens fresh lows.
The ecosystem angle: in October a non-binding Starknet governance poll backed researching a move to an independent, quantum-resistant L1 (about 93.5% of voting power in favor, research only, not a migration). StarkWare says a draft whitepaper is due this month, and on Nov 2 it demoed a wallet migrating to post-quantum signatures on Sepolia testnet.
So the narrative is still active while the chart is dead quiet. Does the whitepaper wake STRK up, or is it already a "sell the news" setup?
Small-cap, very volatile, size accordingly.
Not financial advice.
#Starknet #STRK #Crypto
The price action:
• 24h: +2.6%, range $0.0410–$0.0449
• 7d: -7.5%, with a weekly low of $0.0398
• Down ~66% from the Oct 11 high
• Daily volume has shrunk from $103.8M on the peak day to about $4.7M over the last 24h
Candles have gone from huge red bodies to tiny ones sitting on $0.040–$0.044. That's what exhaustion looks like, though it isn't the same as a bottom. A clean daily close back above $0.048 would be the first sign buyers are returning. Losing $0.040 opens fresh lows.
The ecosystem angle: in October a non-binding Starknet governance poll backed researching a move to an independent, quantum-resistant L1 (about 93.5% of voting power in favor, research only, not a migration). StarkWare says a draft whitepaper is due this month, and on Nov 2 it demoed a wallet migrating to post-quantum signatures on Sepolia testnet.
So the narrative is still active while the chart is dead quiet. Does the whitepaper wake STRK up, or is it already a "sell the news" setup?
Small-cap, very volatile, size accordingly.
Not financial advice.
#Starknet #STRK #Crypto
47
·
--
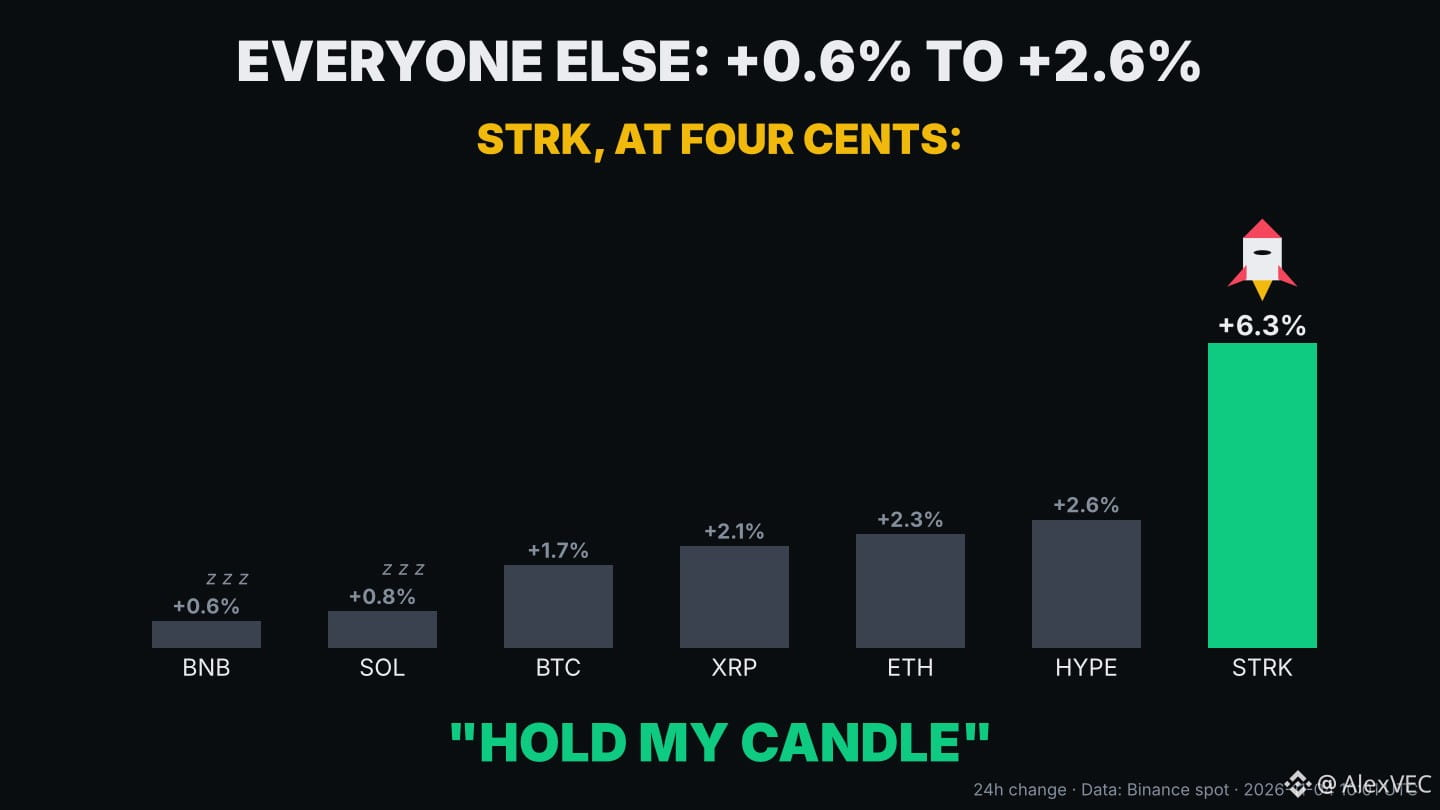
The whole market had a polite little green day. $STRK showed up with a rocket 🚀
24h on Binance spot: BNB +0.6%, SOL +0.8%, BTC +1.7%, ETH +2.3%, HYPE +2.6%... and STRK +6.3% to $0.0438, after tagging $0.0452 at the high.
Plot twist: it's still about 7% below where it closed a week ago. So is this the start of a comeback arc, or just a very dramatic stretch before going back to sleep? 😅
Small caps move fast in both directions, so size accordingly.
#Starknet #STRK #CryptoMemes
The whole market had a polite little green day. $STRK showed up with a rocket 🚀
24h on Binance spot: BNB +0.6%, SOL +0.8%, BTC +1.7%, ETH +2.3%, HYPE +2.6%... and STRK +6.3% to $0.0438, after tagging $0.0452 at the high.
Plot twist: it's still about 7% below where it closed a week ago. So is this the start of a comeback arc, or just a very dramatic stretch before going back to sleep? 😅
Small caps move fast in both directions, so size accordingly.
#Starknet #STRK #CryptoMemes
24h on Binance spot: BNB +0.6%, SOL +0.8%, BTC +1.7%, ETH +2.3%, HYPE +2.6%... and STRK +6.3% to $0.0438, after tagging $0.0452 at the high.
Plot twist: it's still about 7% below where it closed a week ago. So is this the start of a comeback arc, or just a very dramatic stretch before going back to sleep? 😅
Small caps move fast in both directions, so size accordingly.
#Starknet #STRK #CryptoMemes
6
·
--
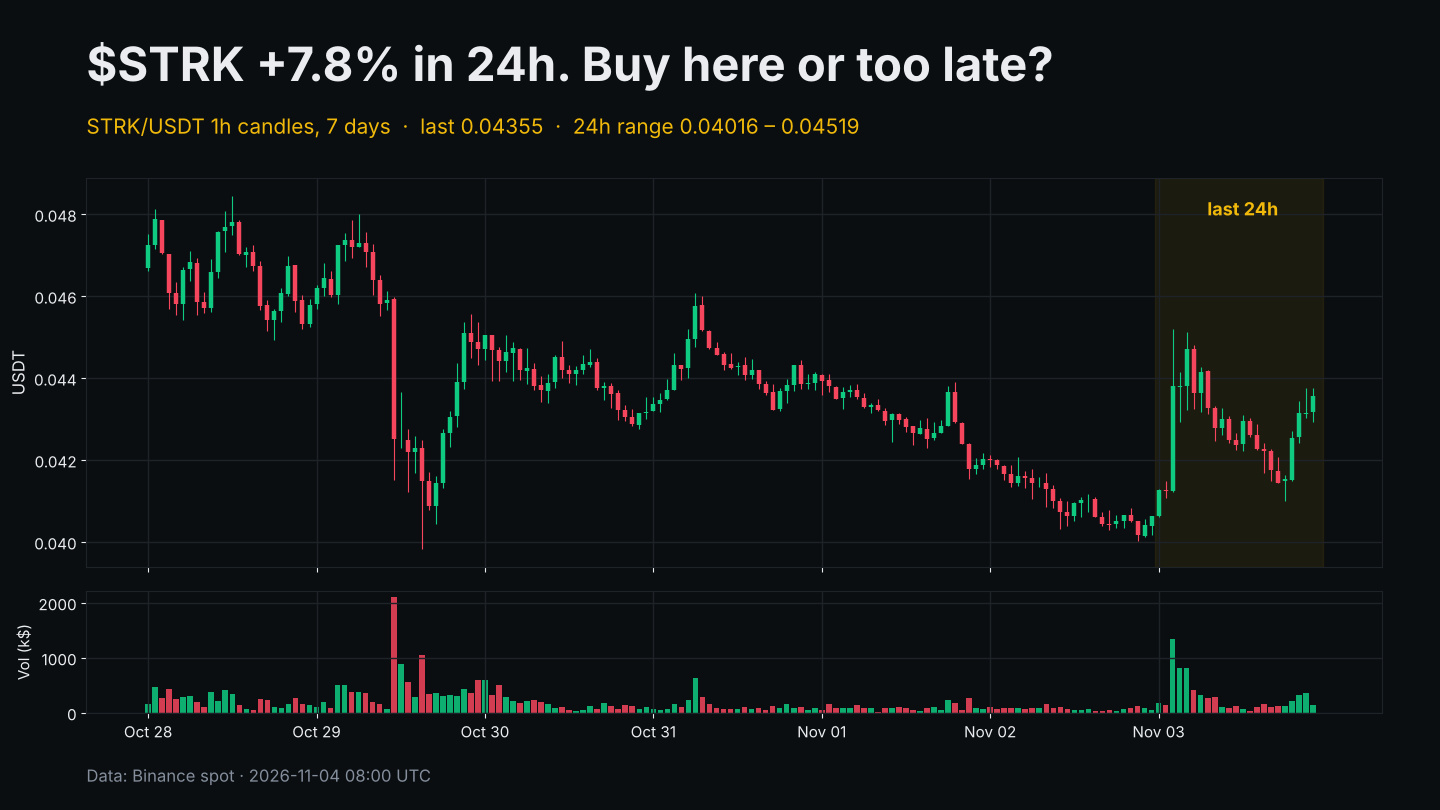
$STRK is up 7.8% in 24h, the best move of the majors I track today. Would you put $500 in at 0.0436, or is it too late?
Quick context from the 1h chart: price bounced off ~0.0402 (the 24h low and basically the weekly floor), spiked to 0.0452, faded, and is now grinding back up. 24h volume is about $6.7M vs a ~$4.7M daily average over the prior six days, so there's real participation behind it.
Case for buying: the 0.040 area held twice this week, and buyers stepped in on volume, not on fumes.
Case for waiting: STRK is still down ~6.7% on the week and well below the 0.048 highs from Oct 28. The first pop to 0.045 got sold quickly, so that's the level to reclaim before calling it a trend change. Small cap, high volatility, size accordingly.
Buy here, wait for 0.045, or skip it entirely? Tell me below 👇
Not financial advice.
#Starknet #Altcoins #CryptoTrading
$STRK is up 7.8% in 24h, the best move of the majors I track today. Would you put $500 in at 0.0436, or is it too late?
Quick context from the 1h chart: price bounced off ~0.0402 (the 24h low and basically the weekly floor), spiked to 0.0452, faded, and is now grinding back up. 24h volume is about $6.7M vs a ~$4.7M daily average over the prior six days, so there's real participation behind it.
Case for buying: the 0.040 area held twice this week, and buyers stepped in on volume, not on fumes.
Case for waiting: STRK is still down ~6.7% on the week and well below the 0.048 highs from Oct 28. The first pop to 0.045 got sold quickly, so that's the level to reclaim before calling it a trend change. Small cap, high volatility, size accordingly.
Buy here, wait for 0.045, or skip it entirely? Tell me below 👇
Not financial advice.
#Starknet #Altcoins #CryptoTrading
Quick context from the 1h chart: price bounced off ~0.0402 (the 24h low and basically the weekly floor), spiked to 0.0452, faded, and is now grinding back up. 24h volume is about $6.7M vs a ~$4.7M daily average over the prior six days, so there's real participation behind it.
Case for buying: the 0.040 area held twice this week, and buyers stepped in on volume, not on fumes.
Case for waiting: STRK is still down ~6.7% on the week and well below the 0.048 highs from Oct 28. The first pop to 0.045 got sold quickly, so that's the level to reclaim before calling it a trend change. Small cap, high volatility, size accordingly.
Buy here, wait for 0.045, or skip it entirely? Tell me below 👇
Not financial advice.
#Starknet #Altcoins #CryptoTrading
18
·
--
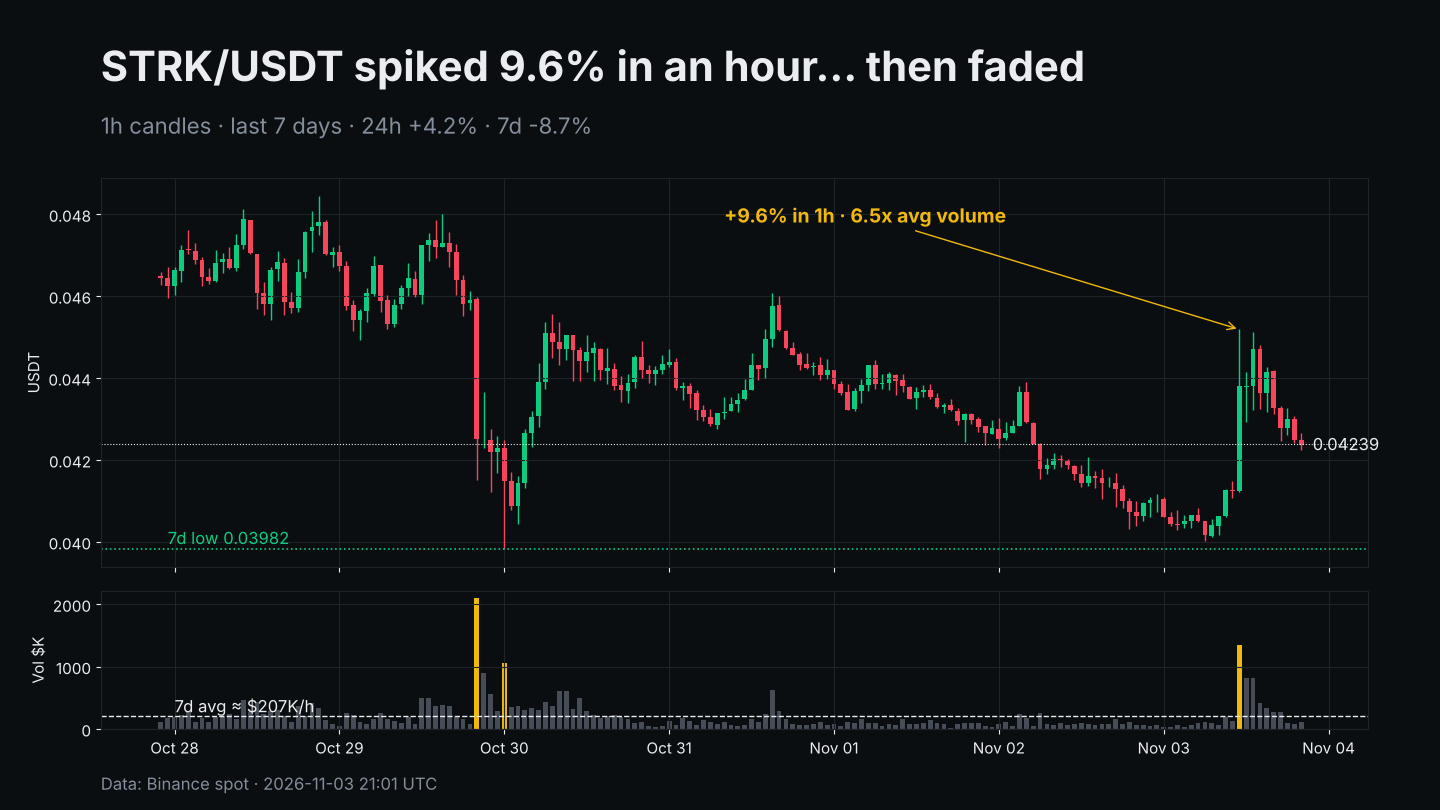
$STRK ripped 9.6% in a single hour today on ~6.5x its average volume. By evening it had handed back most of it.
The tape (Binance spot, 1h):
• 11:00 UTC candle: 0.04124 → high 0.04519, about $1.34M traded vs a 7d hourly average near $207K
• Now 0.04239: still +4.2% on 24h, but -8.7% over 7 days
• Since the high, a slow bleed with shrinking volume, which reads more like a squeeze fading than fresh buyers stepping in
Levels I'm watching:
• 0.0452: today's spike high, the line bulls need to reclaim
• 0.0400–0.0398: the round number plus the 7d low from Oct 30. Lose that and the range breaks down
The bigger story is still the L1 question. In October, a non-binding Snapshot vote passed with 93.5% of voting power in favor of researching a move from Ethereum L2 to an independent, post-quantum L1. Reports say StarkWare plans a draft whitepaper this month, and any actual switch would need separate governance votes. STRK topped near $0.1265 on Oct 11 during that hype and now sits roughly 66% lower.
So the whitepaper is a real catalyst, but this is a high-volatility, low-liquidity coin. Size accordingly.
What gets you interested here: a reclaim of 0.045, or a retest of 0.040?
Not financial advice.
#Starknet #STRK #Altcoins
$STRK ripped 9.6% in a single hour today on ~6.5x its average volume. By evening it had handed back most of it.
The tape (Binance spot, 1h):
• 11:00 UTC candle: 0.04124 → high 0.04519, about $1.34M traded vs a 7d hourly average near $207K
• Now 0.04239: still +4.2% on 24h, but -8.7% over 7 days
• Since the high, a slow bleed with shrinking volume, which reads more like a squeeze fading than fresh buyers stepping in
Levels I'm watching:
• 0.0452: today's spike high, the line bulls need to reclaim
• 0.0400–0.0398: the round number plus the 7d low from Oct 30. Lose that and the range breaks down
The bigger story is still the L1 question. In October, a non-binding Snapshot vote passed with 93.5% of voting power in favor of researching a move from Ethereum L2 to an independent, post-quantum L1. Reports say StarkWare plans a draft whitepaper this month, and any actual switch would need separate governance votes. STRK topped near $0.1265 on Oct 11 during that hype and now sits roughly 66% lower.
So the whitepaper is a real catalyst, but this is a high-volatility, low-liquidity coin. Size accordingly.
What gets you interested here: a reclaim of 0.045, or a retest of 0.040?
Not financial advice.
#Starknet #STRK #Altcoins
The tape (Binance spot, 1h):
• 11:00 UTC candle: 0.04124 → high 0.04519, about $1.34M traded vs a 7d hourly average near $207K
• Now 0.04239: still +4.2% on 24h, but -8.7% over 7 days
• Since the high, a slow bleed with shrinking volume, which reads more like a squeeze fading than fresh buyers stepping in
Levels I'm watching:
• 0.0452: today's spike high, the line bulls need to reclaim
• 0.0400–0.0398: the round number plus the 7d low from Oct 30. Lose that and the range breaks down
The bigger story is still the L1 question. In October, a non-binding Snapshot vote passed with 93.5% of voting power in favor of researching a move from Ethereum L2 to an independent, post-quantum L1. Reports say StarkWare plans a draft whitepaper this month, and any actual switch would need separate governance votes. STRK topped near $0.1265 on Oct 11 during that hype and now sits roughly 66% lower.
So the whitepaper is a real catalyst, but this is a high-volatility, low-liquidity coin. Size accordingly.
What gets you interested here: a reclaim of 0.045, or a retest of 0.040?
Not financial advice.
#Starknet #STRK #Altcoins
16

·
--
$STRK is back on the trending list overnight, and this time the price is actually cooperating — up about 3.9% near $0.0425 on roughly $49M in volume. That is a different feel from the last time it trended, when it was sliding while everyone watched. $BTC is steadier in the background, up around 0.8% near $77,690, so this looks like its own bounce rather than the market lifting everything. I am watching whether $STRK holds above $0.042 — if it does, the trending attention probably sticks around a bit longer. #Starknet
$STRK is back on the trending list overnight, and this time the price is actually cooperating — up about 3.9% near $0.0425 on roughly $49M in volume. That is a different feel from the last time it trended, when it was sliding while everyone watched. $BTC is steadier in the background, up around 0.8% near $77,690, so this looks like its own bounce rather than the market lifting everything. I am watching whether $STRK holds above $0.042 — if it does, the trending attention probably sticks around a bit longer. #Starknet
1
·
--
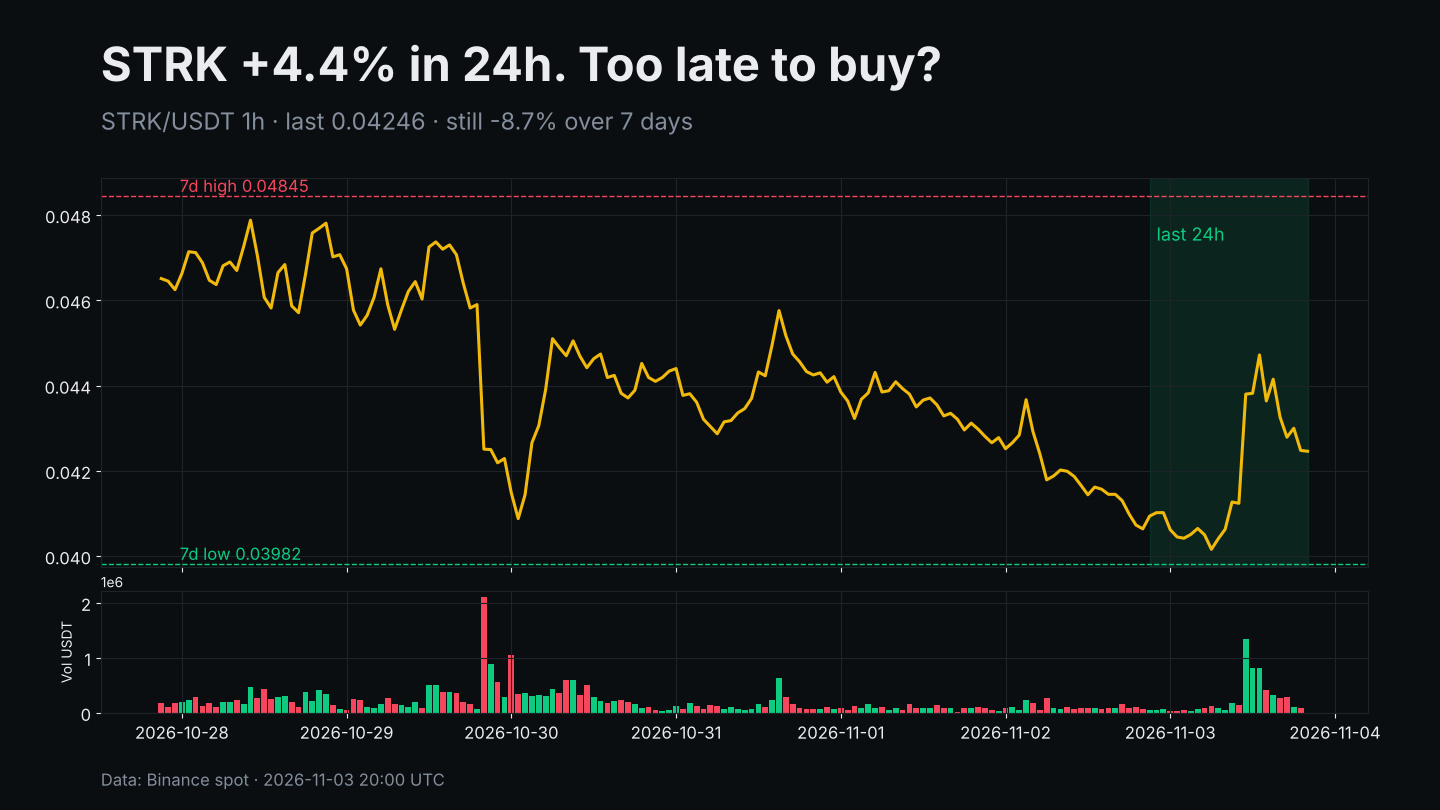
$STRK bounced 4.4% in 24h. Would you put $500 in at 0.0425, or is it already too late?
Quick context from the chart:
• Bottomed near 0.0400, spiked to 0.0452, now giving back part of it
• Still down 8.7% on the week, 7d range 0.0398 – 0.0485
• 24h volume ~$5.6M vs ~$4.9M daily average over the prior 6 days
Case for buying: the 7-day low held, volume came in on the bounce, and price is still near the bottom of the weekly range, so the risk to the low is small.
Case for waiting: the spike already faded about 6% from its high, the weekly trend is still lower highs, and small caps like this can swing 10% in a session without warning.
What's your call: $500 in now, wait for a retest of 0.040, or skip it?
Not financial advice.
#STRK #Starknet #Altcoins
$STRK bounced 4.4% in 24h. Would you put $500 in at 0.0425, or is it already too late?
Quick context from the chart:
• Bottomed near 0.0400, spiked to 0.0452, now giving back part of it
• Still down 8.7% on the week, 7d range 0.0398 – 0.0485
• 24h volume ~$5.6M vs ~$4.9M daily average over the prior 6 days
Case for buying: the 7-day low held, volume came in on the bounce, and price is still near the bottom of the weekly range, so the risk to the low is small.
Case for waiting: the spike already faded about 6% from its high, the weekly trend is still lower highs, and small caps like this can swing 10% in a session without warning.
What's your call: $500 in now, wait for a retest of 0.040, or skip it?
Not financial advice.
#STRK #Starknet #Altcoins
Quick context from the chart:
• Bottomed near 0.0400, spiked to 0.0452, now giving back part of it
• Still down 8.7% on the week, 7d range 0.0398 – 0.0485
• 24h volume ~$5.6M vs ~$4.9M daily average over the prior 6 days
Case for buying: the 7-day low held, volume came in on the bounce, and price is still near the bottom of the weekly range, so the risk to the low is small.
Case for waiting: the spike already faded about 6% from its high, the weekly trend is still lower highs, and small caps like this can swing 10% in a session without warning.
What's your call: $500 in now, wait for a retest of 0.040, or skip it?
Not financial advice.
#STRK #Starknet #Altcoins
29
·
--
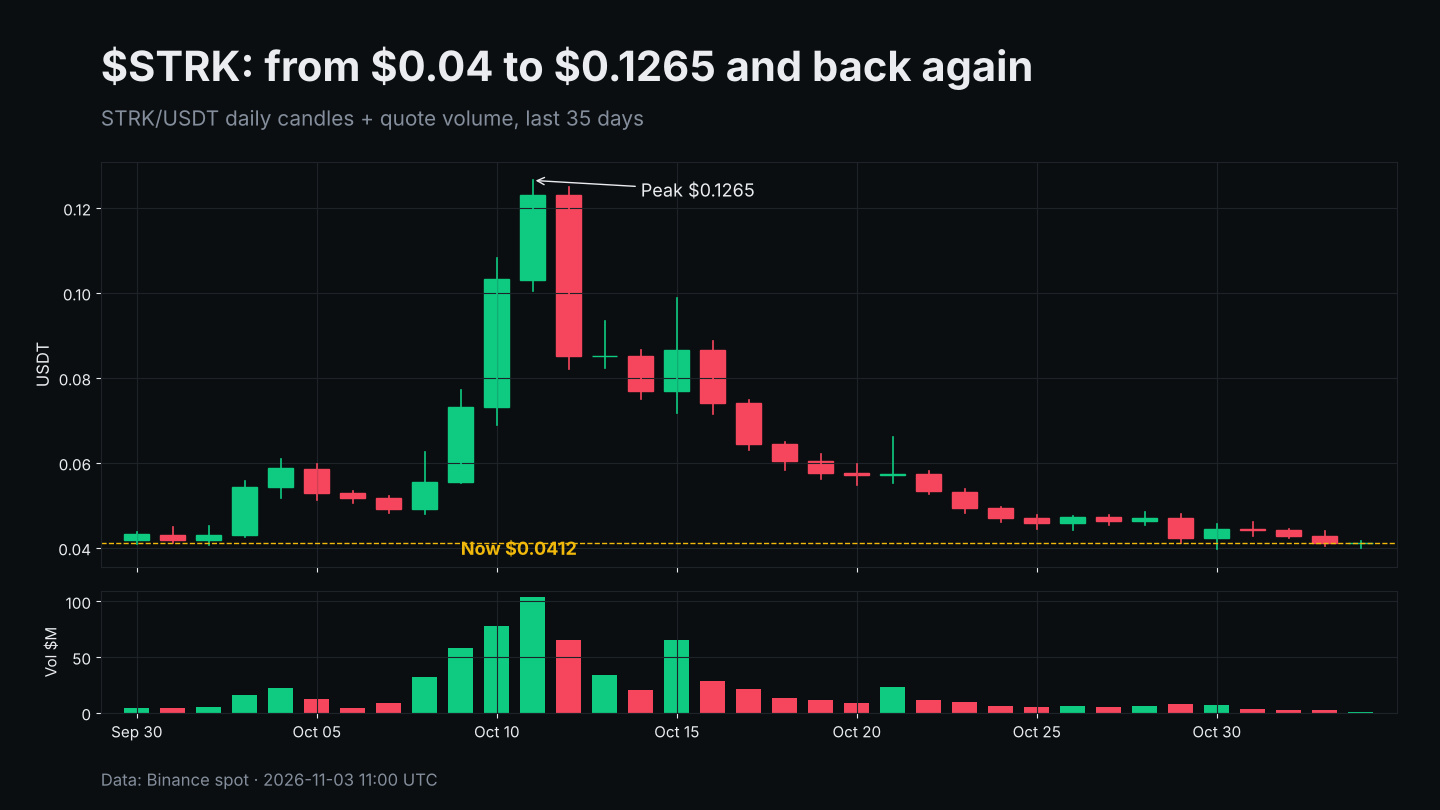
$STRK has now erased almost its ENTIRE October pump.
Peak on Oct 11: $0.1265. Right now: $0.04124. That's roughly -67% from the top, and price is sitting about where the run started in late September.
What the tape says:
• 24h: -1.5%, range $0.04002–$0.04208
• 7 days: down from $0.0457, with a low at $0.03982
• Volume: ~$2.0M in the last 24h vs ~$104M on the peak day. The crowd has left the building.
Context: the October rally was fuelled by talk of Starknet expanding beyond its role as an Ethereum L2, plus the strkBTC / Bitcoin liquidity push, and then ran straight into a mid-October token unlock. The narrative didn't vanish, but the speculative money clearly did.
Levels I'm watching: $0.040 is the line. Lose it on a daily close and the weekly low near $0.0398 is the last floor in sight. Reclaim $0.046 (where it chopped Oct 25–28) and the bleed at least pauses.
Low volume at a full round-trip can mean exhaustion, or just apathy. STRK is volatile and supply-heavy, so size accordingly.
Is this quiet accumulation or a slow fade?
Not financial advice.
#Starknet #Layer2 #CryptoTrading
$STRK has now erased almost its ENTIRE October pump.
Peak on Oct 11: $0.1265. Right now: $0.04124. That's roughly -67% from the top, and price is sitting about where the run started in late September.
What the tape says:
• 24h: -1.5%, range $0.04002–$0.04208
• 7 days: down from $0.0457, with a low at $0.03982
• Volume: ~$2.0M in the last 24h vs ~$104M on the peak day. The crowd has left the building.
Context: the October rally was fuelled by talk of Starknet expanding beyond its role as an Ethereum L2, plus the strkBTC / Bitcoin liquidity push, and then ran straight into a mid-October token unlock. The narrative didn't vanish, but the speculative money clearly did.
Levels I'm watching: $0.040 is the line. Lose it on a daily close and the weekly low near $0.0398 is the last floor in sight. Reclaim $0.046 (where it chopped Oct 25–28) and the bleed at least pauses.
Low volume at a full round-trip can mean exhaustion, or just apathy. STRK is volatile and supply-heavy, so size accordingly.
Is this quiet accumulation or a slow fade?
Not financial advice.
#Starknet #Layer2 #CryptoTrading
Peak on Oct 11: $0.1265. Right now: $0.04124. That's roughly -67% from the top, and price is sitting about where the run started in late September.
What the tape says:
• 24h: -1.5%, range $0.04002–$0.04208
• 7 days: down from $0.0457, with a low at $0.03982
• Volume: ~$2.0M in the last 24h vs ~$104M on the peak day. The crowd has left the building.
Context: the October rally was fuelled by talk of Starknet expanding beyond its role as an Ethereum L2, plus the strkBTC / Bitcoin liquidity push, and then ran straight into a mid-October token unlock. The narrative didn't vanish, but the speculative money clearly did.
Levels I'm watching: $0.040 is the line. Lose it on a daily close and the weekly low near $0.0398 is the last floor in sight. Reclaim $0.046 (where it chopped Oct 25–28) and the bleed at least pauses.
Low volume at a full round-trip can mean exhaustion, or just apathy. STRK is volatile and supply-heavy, so size accordingly.
Is this quiet accumulation or a slow fade?
Not financial advice.
#Starknet #Layer2 #CryptoTrading
16
·
--
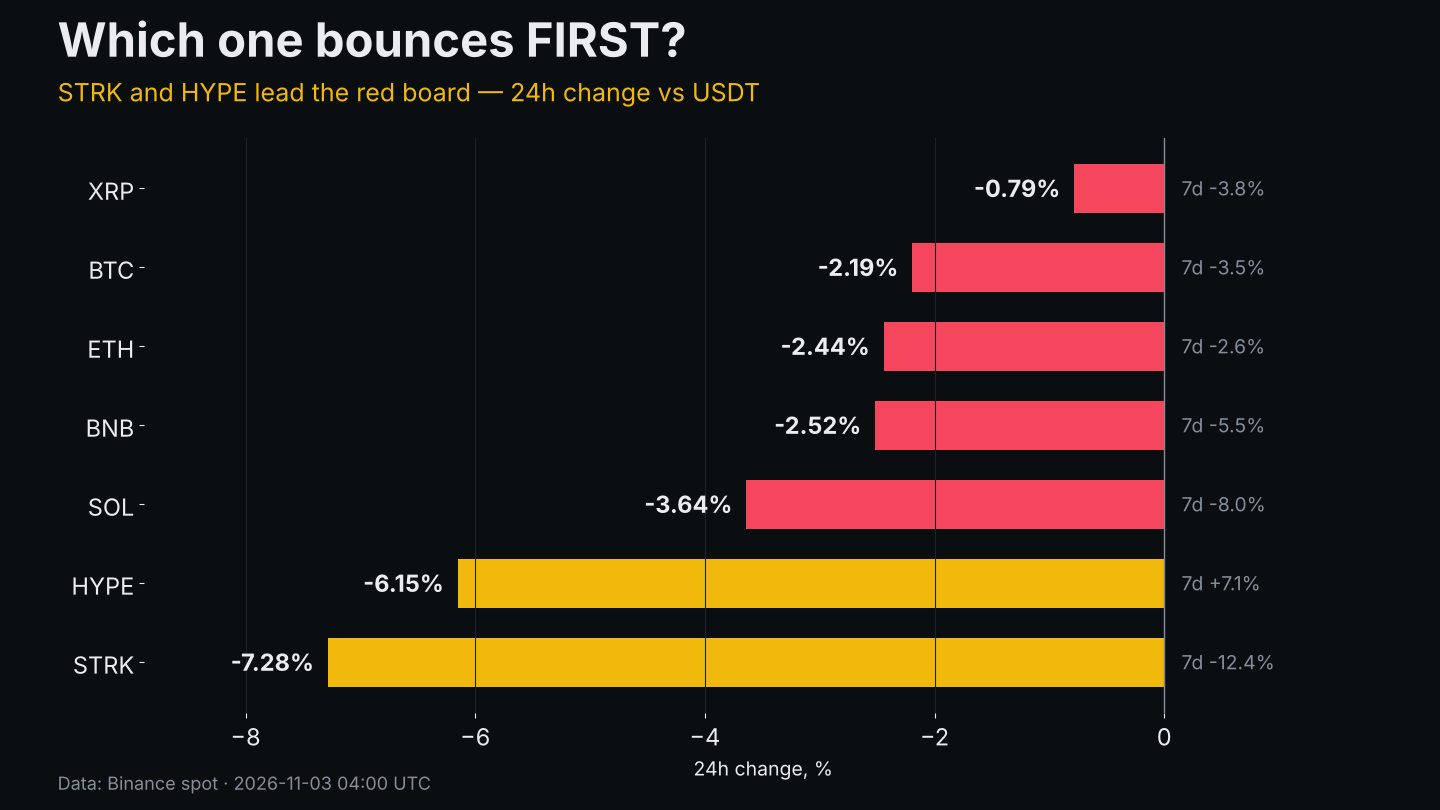
$STRK is down 7.3% in 24h. $HYPE is down 6.2%. Only one of them can bounce first.
Whole board is red this morning: BTC -2.2% near 76,900, ETH -2.4%, SOL -3.6%. But the two small caps took the hardest hit, and they arrive here from opposite directions.
STRK sits around 0.0405, lost 12.4% over 7 days and is printing near its 24h low (0.0403). Stretched, or still sliding?
HYPE is at 83.2, still +7.1% on the week even after dropping from 89.1. Healthy pullback, or the start of giving back the run?
Quick poll, reply with a letter:
A) STRK bounces first
B) HYPE bounces first
C) Neither, $BTC has to hold 76.5K before alts move
D) More downside for both
Both are high-volatility names, so size accordingly.
Not financial advice.
#Starknet #Hyperliquid #CryptoPoll
$STRK is down 7.3% in 24h. $HYPE is down 6.2%. Only one of them can bounce first.
Whole board is red this morning: BTC -2.2% near 76,900, ETH -2.4%, SOL -3.6%. But the two small caps took the hardest hit, and they arrive here from opposite directions.
STRK sits around 0.0405, lost 12.4% over 7 days and is printing near its 24h low (0.0403). Stretched, or still sliding?
HYPE is at 83.2, still +7.1% on the week even after dropping from 89.1. Healthy pullback, or the start of giving back the run?
Quick poll, reply with a letter:
A) STRK bounces first
B) HYPE bounces first
C) Neither, $BTC has to hold 76.5K before alts move
D) More downside for both
Both are high-volatility names, so size accordingly.
Not financial advice.
#Starknet #Hyperliquid #CryptoPoll
Whole board is red this morning: BTC -2.2% near 76,900, ETH -2.4%, SOL -3.6%. But the two small caps took the hardest hit, and they arrive here from opposite directions.
STRK sits around 0.0405, lost 12.4% over 7 days and is printing near its 24h low (0.0403). Stretched, or still sliding?
HYPE is at 83.2, still +7.1% on the week even after dropping from 89.1. Healthy pullback, or the start of giving back the run?
Quick poll, reply with a letter:
A) STRK bounces first
B) HYPE bounces first
C) Neither, $BTC has to hold 76.5K before alts move
D) More downside for both
Both are high-volatility names, so size accordingly.
Not financial advice.
#Starknet #Hyperliquid #CryptoPoll
33
·
--
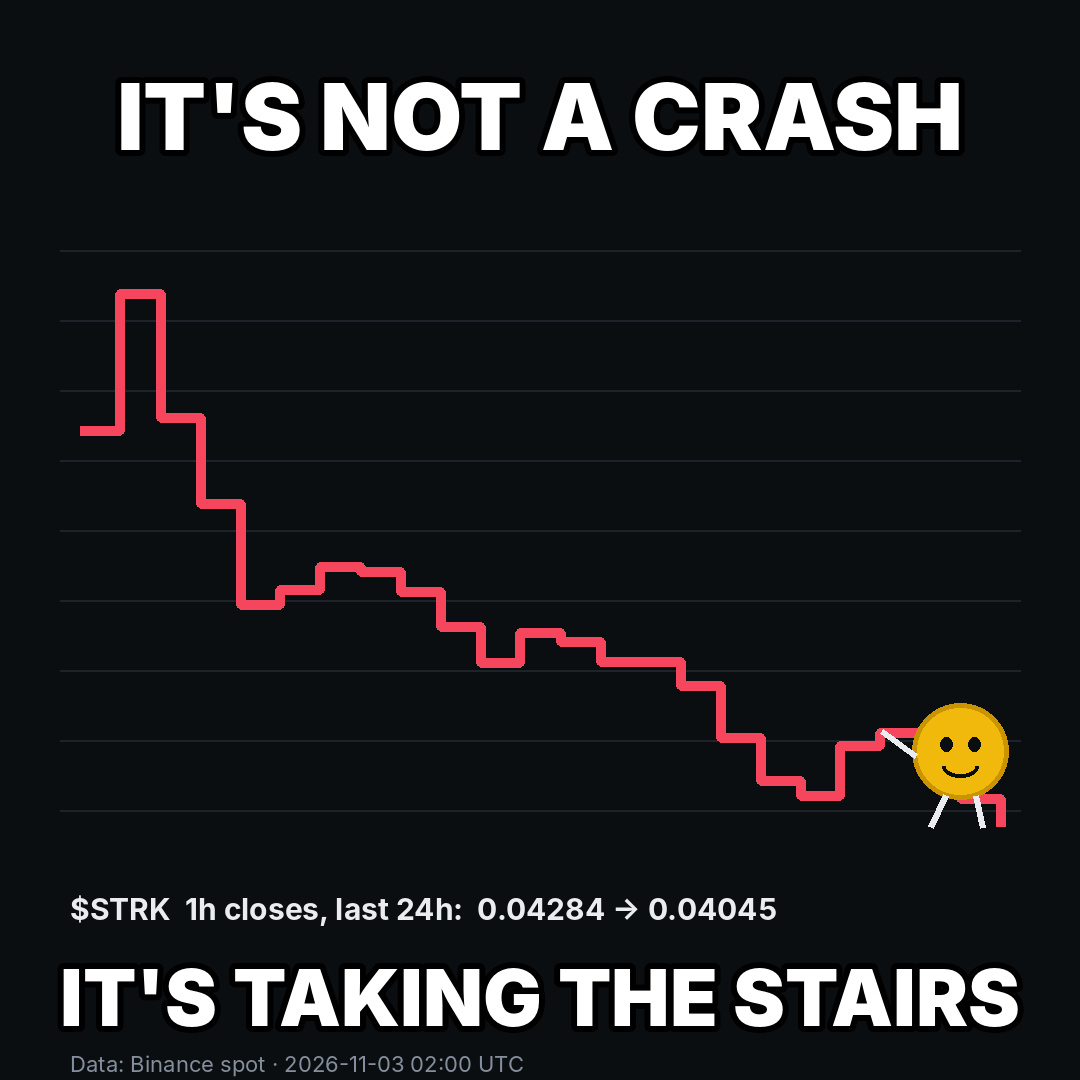
$STRK chose violence against its own chart today: -5.2% in 24h, but politely. One step at a time. 🪜
No elevator, no panic jump. Just a slow walk down from 0.0439 to 0.0405, pausing on almost every landing like it forgot why it came downstairs.
At least it's getting its steps in. 😅
Honest question: is this the staircase to a basement, or is the bottom floor close? What's your read?
#STRK #Starknet #CryptoMemes
$STRK chose violence against its own chart today: -5.2% in 24h, but politely. One step at a time. 🪜
No elevator, no panic jump. Just a slow walk down from 0.0439 to 0.0405, pausing on almost every landing like it forgot why it came downstairs.
At least it's getting its steps in. 😅
Honest question: is this the staircase to a basement, or is the bottom floor close? What's your read?
#STRK #Starknet #CryptoMemes
No elevator, no panic jump. Just a slow walk down from 0.0439 to 0.0405, pausing on almost every landing like it forgot why it came downstairs.
At least it's getting its steps in. 😅
Honest question: is this the staircase to a basement, or is the bottom floor close? What's your read?
#STRK #Starknet #CryptoMemes
90
·
--
$STRK just showed up on the trending board again, and it's not a pretty look — down about 4.4% near $0.041 on roughly $25M in volume, sliding a bit harder than $BTC, which is down around 1.6% near $76,700. Feels like the trending attention is meeting real selling rather than fresh buying for once. I'm watching whether $STRK holds above $0.04 — if it does, a bounce attempt wouldn't surprise me; lose it and the crowd probably moves on fast. Are you watching that level too? #Starknet
$STRK just showed up on the trending board again, and it's not a pretty look — down about 4.4% near $0.041 on roughly $25M in volume, sliding a bit harder than $BTC , which is down around 1.6% near $76,700. Feels like the trending attention is meeting real selling rather than fresh buying for once. I'm watching whether $STRK holds above $0.04 — if it does, a bounce attempt wouldn't surprise me; lose it and the crowd probably moves on fast. Are you watching that level too? #Starknet
11
·
--
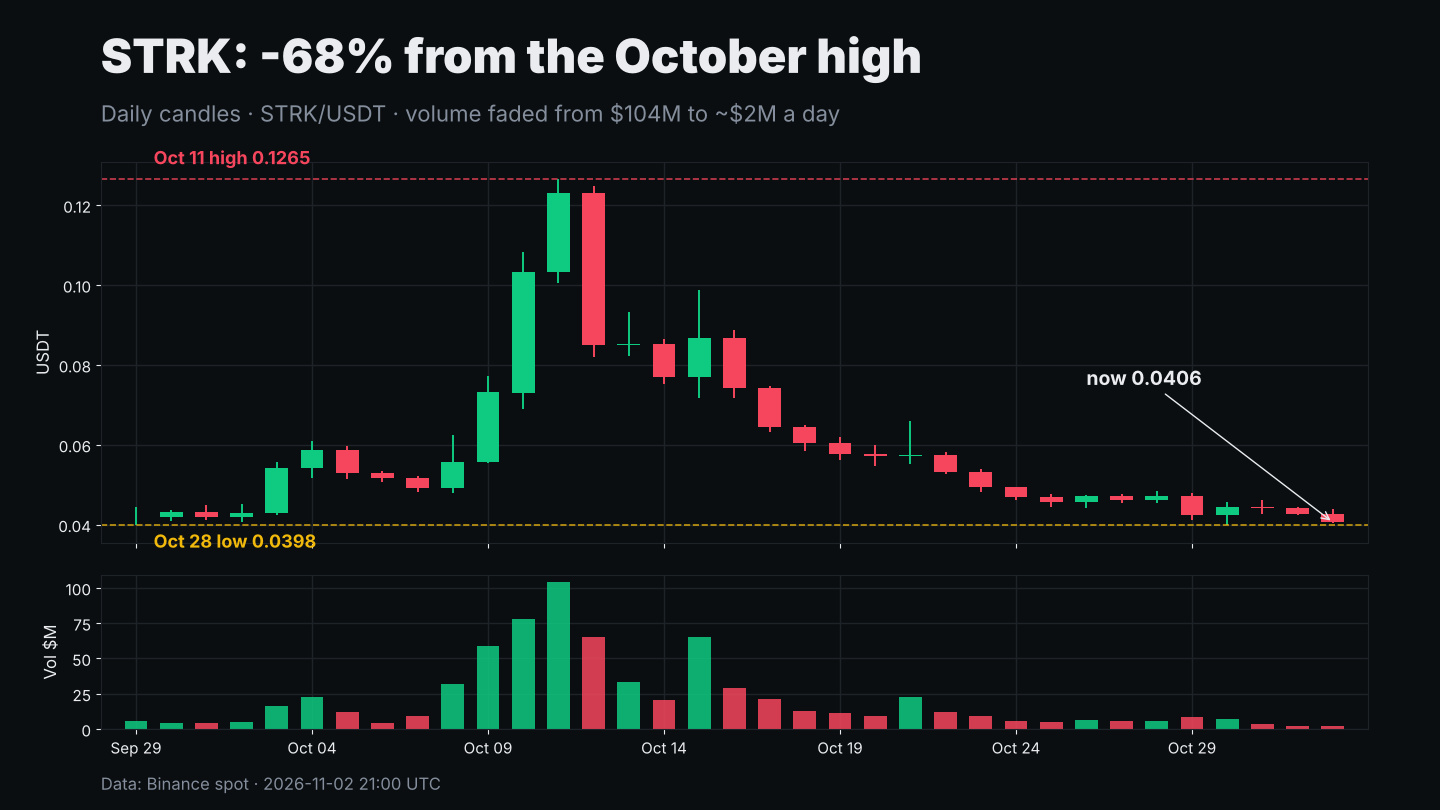
$STRK is down 68% from its October high, and the crowd has quietly left the room.
On Oct 11 it printed 0.1265 on roughly $104M of daily spot volume. Today it sits at 0.0406 (-5.5% in 24h, range 0.0403–0.0439) with about $2.2M traded so far. Down 14% on the week.
Levels I'm watching:
• 0.0398, the Oct 28 low. Price is only ~2% above it. Lose that on a daily close and the September base near 0.029–0.031 is the next real reference.
• 0.0439–0.0450, today's high and the area it chopped in all of last week. Reclaiming it would be the first sign sellers are tired.
The project angle: the October pump came on StarkWare's proposal to research turning Starknet into its own quantum-resistant L1. The non-binding governance poll closed Oct 22 with 93.52% backing further research, but that's research only, not a migration. CEO Eli Ben-Sasson said a draft whitepaper is expected in November, and any actual move needs a separate binding vote. That paper is the next catalyst on the calendar.
Thin volume near support cuts both ways: small flows can push it hard in either direction. Size small if you touch this one.
Does the 0.0398 floor hold, or is a retest of the September base coming first?
Not financial advice.
#Starknet #Layer2 #CryptoAnalysis
$STRK is down 68% from its October high, and the crowd has quietly left the room.
On Oct 11 it printed 0.1265 on roughly $104M of daily spot volume. Today it sits at 0.0406 (-5.5% in 24h, range 0.0403–0.0439) with about $2.2M traded so far. Down 14% on the week.
Levels I'm watching:
• 0.0398, the Oct 28 low. Price is only ~2% above it. Lose that on a daily close and the September base near 0.029–0.031 is the next real reference.
• 0.0439–0.0450, today's high and the area it chopped in all of last week. Reclaiming it would be the first sign sellers are tired.
The project angle: the October pump came on StarkWare's proposal to research turning Starknet into its own quantum-resistant L1. The non-binding governance poll closed Oct 22 with 93.52% backing further research, but that's research only, not a migration. CEO Eli Ben-Sasson said a draft whitepaper is expected in November, and any actual move needs a separate binding vote. That paper is the next catalyst on the calendar.
Thin volume near support cuts both ways: small flows can push it hard in either direction. Size small if you touch this one.
Does the 0.0398 floor hold, or is a retest of the September base coming first?
Not financial advice.
#Starknet #Layer2 #CryptoAnalysis
On Oct 11 it printed 0.1265 on roughly $104M of daily spot volume. Today it sits at 0.0406 (-5.5% in 24h, range 0.0403–0.0439) with about $2.2M traded so far. Down 14% on the week.
Levels I'm watching:
• 0.0398, the Oct 28 low. Price is only ~2% above it. Lose that on a daily close and the September base near 0.029–0.031 is the next real reference.
• 0.0439–0.0450, today's high and the area it chopped in all of last week. Reclaiming it would be the first sign sellers are tired.
The project angle: the October pump came on StarkWare's proposal to research turning Starknet into its own quantum-resistant L1. The non-binding governance poll closed Oct 22 with 93.52% backing further research, but that's research only, not a migration. CEO Eli Ben-Sasson said a draft whitepaper is expected in November, and any actual move needs a separate binding vote. That paper is the next catalyst on the calendar.
Thin volume near support cuts both ways: small flows can push it hard in either direction. Size small if you touch this one.
Does the 0.0398 floor hold, or is a retest of the September base coming first?
Not financial advice.
#Starknet #Layer2 #CryptoAnalysis
1
54
·
--
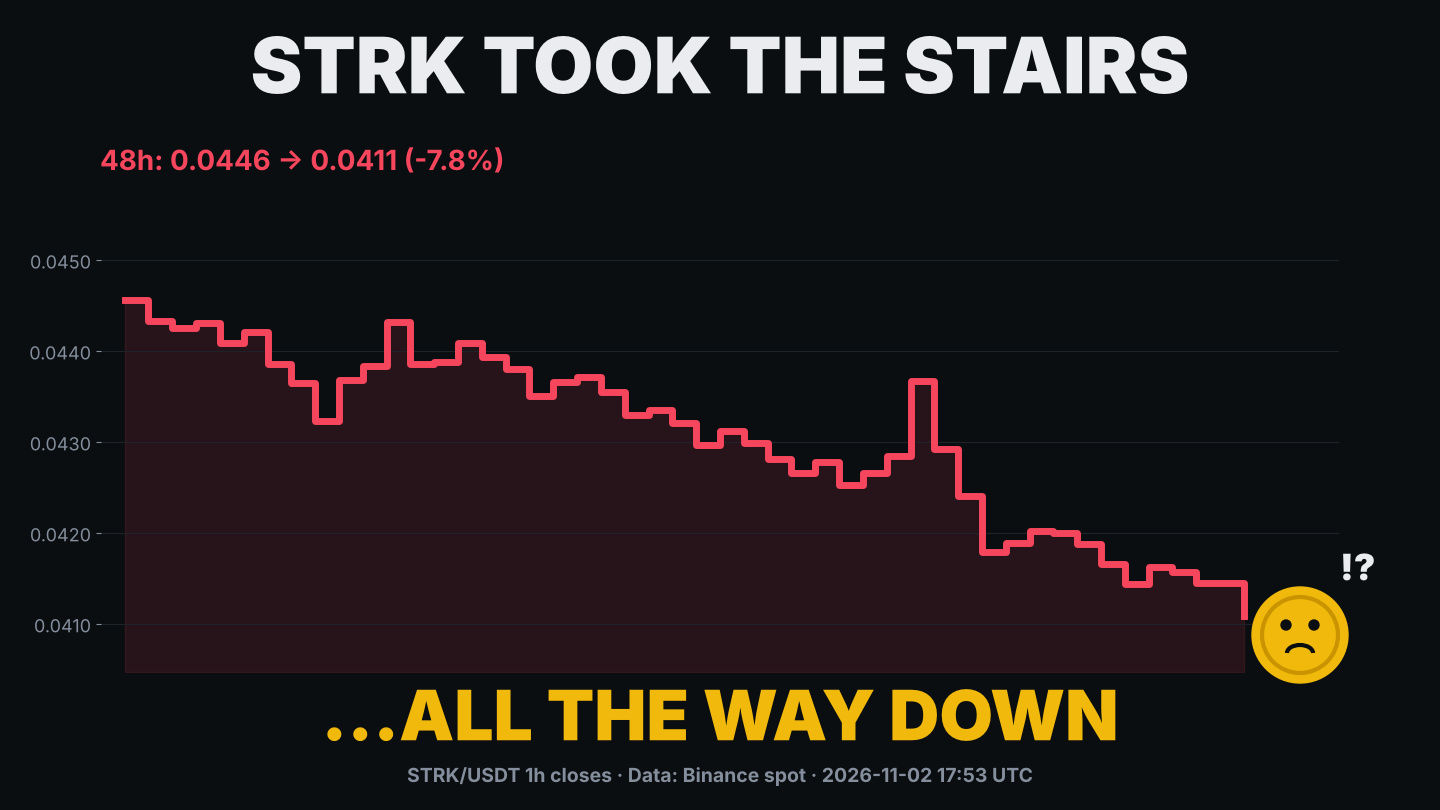
$STRK said "no elevator for me" and took the stairs down instead 🪜
48 hours of 1h candles: 0.0446 → 0.0411, about -7.8%, and today's -5.1% is the worst of the big 7 I track. Every little bounce just turned into a landing before the next step down.
At least it's getting its cardio in 😅
Real question: is this a staircase you'd sit on and wait, or are you waiting for it to find the ground floor first?
#STRK #Starknet #CryptoMeme
$STRK said "no elevator for me" and took the stairs down instead 🪜
48 hours of 1h candles: 0.0446 → 0.0411, about -7.8%, and today's -5.1% is the worst of the big 7 I track. Every little bounce just turned into a landing before the next step down.
At least it's getting its cardio in 😅
Real question: is this a staircase you'd sit on and wait, or are you waiting for it to find the ground floor first?
#STRK #Starknet #CryptoMeme
48 hours of 1h candles: 0.0446 → 0.0411, about -7.8%, and today's -5.1% is the worst of the big 7 I track. Every little bounce just turned into a landing before the next step down.
At least it's getting its cardio in 😅
Real question: is this a staircase you'd sit on and wait, or are you waiting for it to find the ground floor first?
#STRK #Starknet #CryptoMeme
56

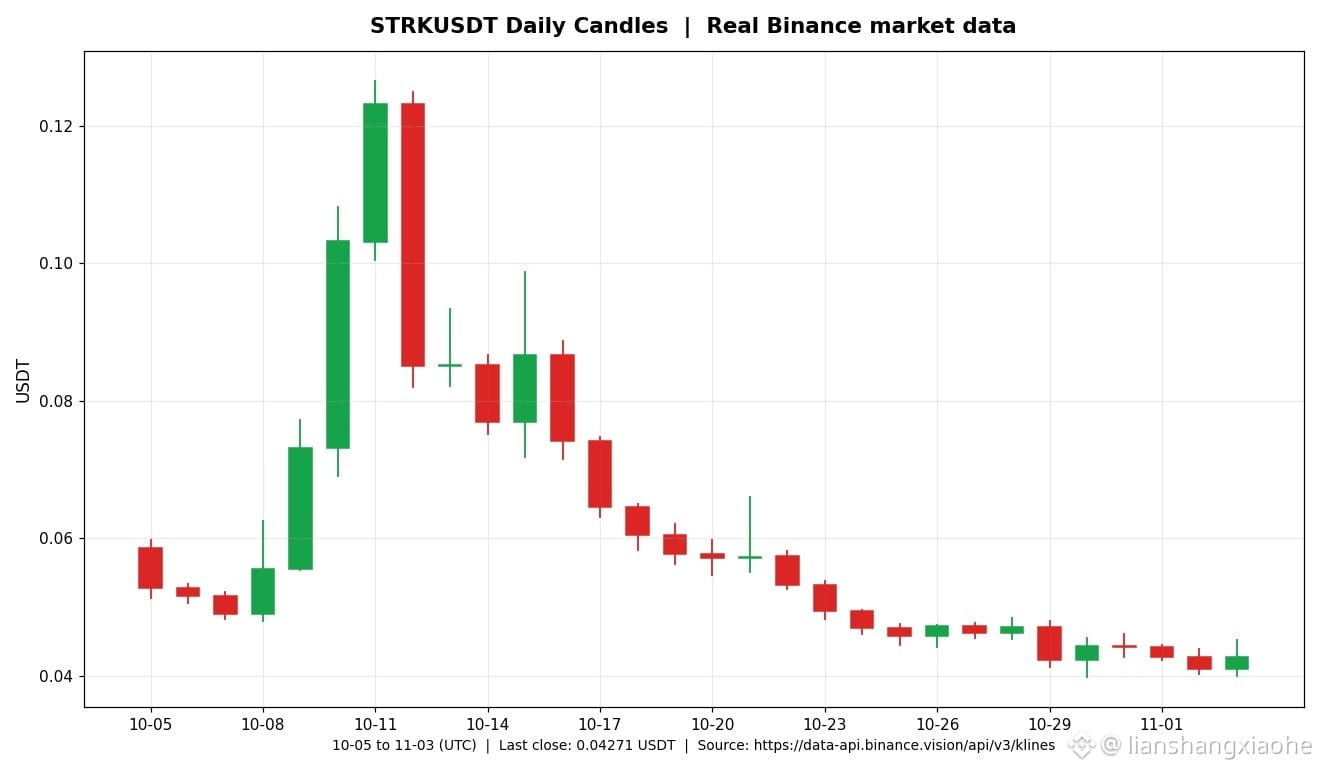
The whole market is falling, but $STRK is bucking the trend and pushing higher: around $0.043 today, up about 5% in 24 hours, putting it among the top gainers out of 200 coins. If you had put in 10,000 U yesterday, it would be worth about 10,500 U today. Don’t dismiss that 5% as insignificant—in a market where BTC has fallen below 77,000 and ZEC is down 10% in a day, few coins are managing to stay in the green. But let’s not get carried away: STRK is still down about 15% over the past 30 days and about 5% over the past 7 days. Whether today’s bullish candle is just an oversold bounce or a genuine reversal is clear to see on Binance’s 30-day candlestick chart. Don’t chase the rally or go all in—the key is whether the rebound can hold above $0.045. #Starknet
The whole market is falling, but $STRK is bucking the trend and pushing higher: around $0.043 today, up about 5% in 24 hours, putting it among the top gainers out of 200 coins. If you had put in 10,000 U yesterday, it would be worth about 10,500 U today. Don’t dismiss that 5% as insignificant—in a market where BTC has fallen below 77,000 and ZEC is down 10% in a day, few coins are managing to stay in the green. But let’s not get carried away: STRK is still down about 15% over the past 30 days and about 5% over the past 7 days. Whether today’s bullish candle is just an oversold bounce or a genuine reversal is clear to see on Binance’s 30-day candlestick chart. Don’t chase the rally or go all in—the key is whether the rebound can hold above $0.045. #Starknet
212

·
--
😮 $STRK STARKNET SURPRISE: RISING ALONE WHILE LAYER 2s LAG
South Korea asked its biggest banks to measure how a major crypto hack could affect them. To me, when an entire country has its banks run that exercise, the market separates the serious players from the rest—and today, the serious Layer 2 play is STRK, which is rising on its own.
Look at the detail nobody is seeing:
→ South Korea asked its biggest banks to calculate the impact of a major crypto hack, according to CoinDesk.
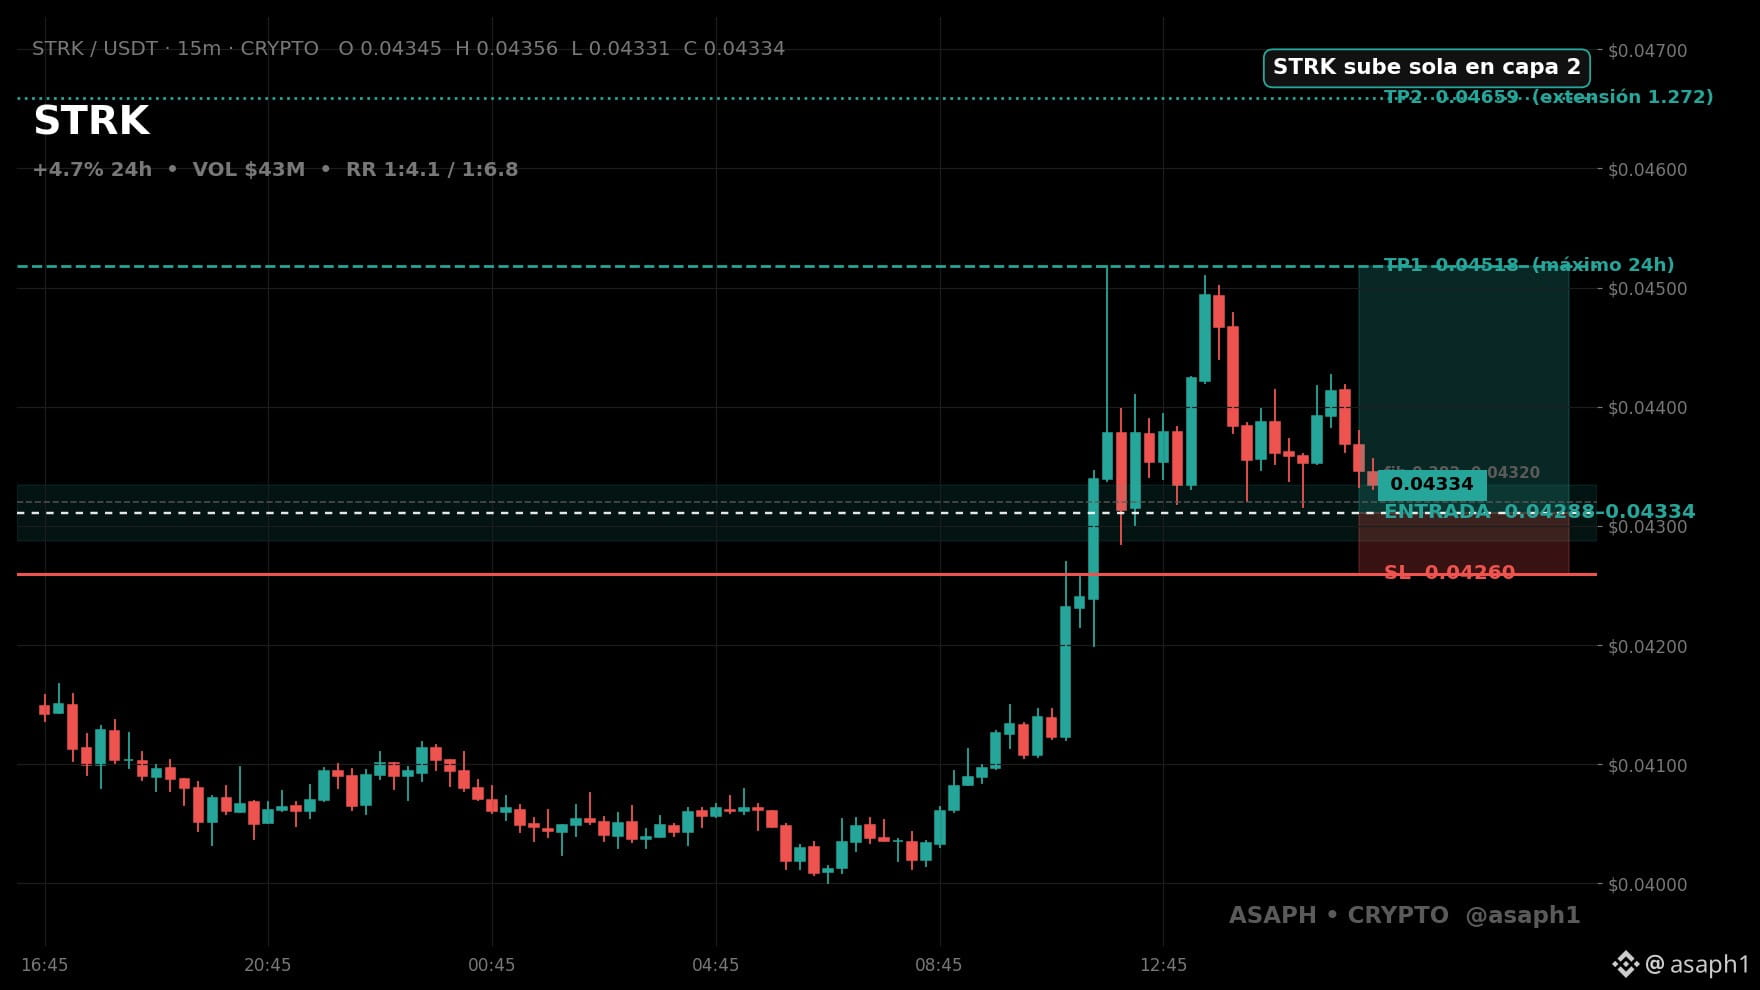
→ STRK +4.7% with $43.2M, rising much more than $ZK (0.0%) and $OP (-1.4%) among Layer 2s: it’s breaking away from the pack.
→ Entry $0.0428775–$0.04334, SL $0.0426, TP1 $0.04518 (+4.8%) → TP2 $0.046589 (+8.1%).
Do you see STRK breaking $0.04659 today or pulling back to $0.0426? 👇
$STRK $ZK $OP
#Starknet #Capa2 #Trading
😮 $STRK STARKNET SURPRISE: RISING ALONE WHILE LAYER 2s LAG
South Korea asked its biggest banks to measure how a major crypto hack could affect them. To me, when an entire country has its banks run that exercise, the market separates the serious players from the rest—and today, the serious Layer 2 play is STRK, which is rising on its own.
Look at the detail nobody is seeing:
→ South Korea asked its biggest banks to calculate the impact of a major crypto hack, according to CoinDesk.
→ STRK +4.7% with $43.2M, rising much more than $ZK (0.0%) and $OP (-1.4%) among Layer 2s: it’s breaking away from the pack.
→ Entry $0.0428775–$0.04334, SL $0.0426, TP1 $0.04518 (+4.8%) → TP2 $0.046589 (+8.1%).
Do you see STRK breaking $0.04659 today or pulling back to $0.0426? 👇
$STRK $ZK $OP
#Starknet #Capa2 #Trading
South Korea asked its biggest banks to measure how a major crypto hack could affect them. To me, when an entire country has its banks run that exercise, the market separates the serious players from the rest—and today, the serious Layer 2 play is STRK, which is rising on its own.
Look at the detail nobody is seeing:
→ South Korea asked its biggest banks to calculate the impact of a major crypto hack, according to CoinDesk.
→ STRK +4.7% with $43.2M, rising much more than $ZK (0.0%) and $OP (-1.4%) among Layer 2s: it’s breaking away from the pack.
→ Entry $0.0428775–$0.04334, SL $0.0426, TP1 $0.04518 (+4.8%) → TP2 $0.046589 (+8.1%).
Do you see STRK breaking $0.04659 today or pulling back to $0.0426? 👇
$STRK $ZK $OP
#Starknet #Capa2 #Trading
167
·
--
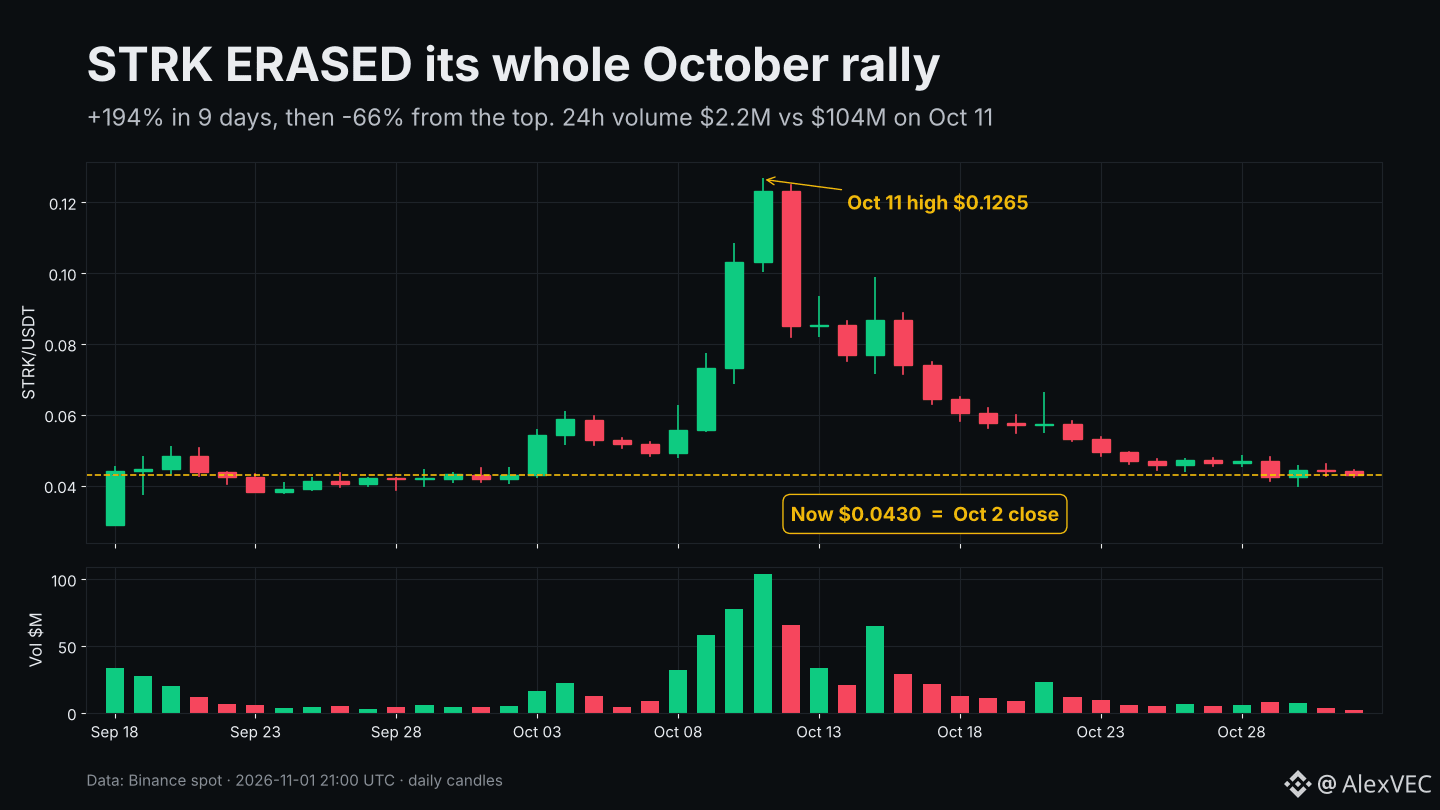
$STRK just gave back its ENTIRE October rally. To the cent.
Oct 2 close: $0.04297. Now: $0.04298. In between, a run to $0.1265 on Oct 11 (+194% in 9 days) and a 66% slide from that top.
What the chart says today:
• 24h: -2.9%, range $0.04245–0.04451
• 7-day: -4.8%, low $0.03982 (Oct 30), high $0.04845 (Oct 28)
• 24h volume ~$2.2M vs $104M on Oct 11 peak day
That volume collapse is the real story. Sellers aren't panicking anymore, but buyers aren't showing up either. Sunday liquidity explains part of it, not all of it. Meanwhile BTC is flat (+0.4% 24h), so this isn't a market-wide flush.
Levels I'm watching: $0.0398 (this week's low) as the floor, and $0.0485 as the ceiling that has capped every daily high since Oct 25.
Ecosystem side: StarkWare and the Starknet Foundation reported cutting the gas cost of verifying Falcon-512 post-quantum signatures by about 46% (Oct 29), the kind of long-game research that rarely moves price in the short run. On the supply side, the monthly 127M STRK unlock lands again on Nov 15, worth keeping on the calendar.
Low-volume bases can break either way, and STRK has shown how fast it moves in both directions. Size accordingly.
Base building here, or just a pause before the next leg down?
Not financial advice.
#Starknet #Altcoins #CryptoTrading
$STRK just gave back its ENTIRE October rally. To the cent.
Oct 2 close: $0.04297. Now: $0.04298. In between, a run to $0.1265 on Oct 11 (+194% in 9 days) and a 66% slide from that top.
What the chart says today:
• 24h: -2.9%, range $0.04245–0.04451
• 7-day: -4.8%, low $0.03982 (Oct 30), high $0.04845 (Oct 28)
• 24h volume ~$2.2M vs $104M on Oct 11 peak day
That volume collapse is the real story. Sellers aren't panicking anymore, but buyers aren't showing up either. Sunday liquidity explains part of it, not all of it. Meanwhile BTC is flat (+0.4% 24h), so this isn't a market-wide flush.
Levels I'm watching: $0.0398 (this week's low) as the floor, and $0.0485 as the ceiling that has capped every daily high since Oct 25.
Ecosystem side: StarkWare and the Starknet Foundation reported cutting the gas cost of verifying Falcon-512 post-quantum signatures by about 46% (Oct 29), the kind of long-game research that rarely moves price in the short run. On the supply side, the monthly 127M STRK unlock lands again on Nov 15, worth keeping on the calendar.
Low-volume bases can break either way, and STRK has shown how fast it moves in both directions. Size accordingly.
Base building here, or just a pause before the next leg down?
Not financial advice.
#Starknet #Altcoins #CryptoTrading
Oct 2 close: $0.04297. Now: $0.04298. In between, a run to $0.1265 on Oct 11 (+194% in 9 days) and a 66% slide from that top.
What the chart says today:
• 24h: -2.9%, range $0.04245–0.04451
• 7-day: -4.8%, low $0.03982 (Oct 30), high $0.04845 (Oct 28)
• 24h volume ~$2.2M vs $104M on Oct 11 peak day
That volume collapse is the real story. Sellers aren't panicking anymore, but buyers aren't showing up either. Sunday liquidity explains part of it, not all of it. Meanwhile BTC is flat (+0.4% 24h), so this isn't a market-wide flush.
Levels I'm watching: $0.0398 (this week's low) as the floor, and $0.0485 as the ceiling that has capped every daily high since Oct 25.
Ecosystem side: StarkWare and the Starknet Foundation reported cutting the gas cost of verifying Falcon-512 post-quantum signatures by about 46% (Oct 29), the kind of long-game research that rarely moves price in the short run. On the supply side, the monthly 127M STRK unlock lands again on Nov 15, worth keeping on the calendar.
Low-volume bases can break either way, and STRK has shown how fast it moves in both directions. Size accordingly.
Base building here, or just a pause before the next leg down?
Not financial advice.
#Starknet #Altcoins #CryptoTrading
26
Log in to explore more content
Join global crypto users on Binance Square
⚡️ Get latest and useful information about crypto.
💬 Trusted by the world’s largest crypto exchange.
👍 Discover real insights from verified creators.
Email / Phone number
Trending Topics
1
#BitcoinRebounds$75KAsChipsLead
6,623 views
107 Discussing
2
#JobsReportRaisesHikeOdds
90,765 views
886 Discussing
3
#US Data Center Rules May Constrain AI Expansion
11,825 views
94 Discussing
4
#$2TWipedOutHedgeFundsFaceLiquidation
14,913 views
99 Discussing
5
#WillAnthropicListOnTime
13,418 views
258 Discussing
6
#USNovemberMichiganExpectationsIndexPrelimAt50.9
21,216 views
346 Discussing
7
#OilPlungesBelow$100
21,301 views
38 Discussing
8
#TradFiForBeginners
13,098 views
224 Discussing
9
#USMidtermsCouldShakeUpUS-IranTies
41,320 views
522 Discussing
10
#RussianCentralBankNamesBTCETHUSDTForNonQualifiedInvestors
775 views
11 Discussing