
#strk
strk
13.9M views
19,916 Discussing
Hot
Latest

·
--
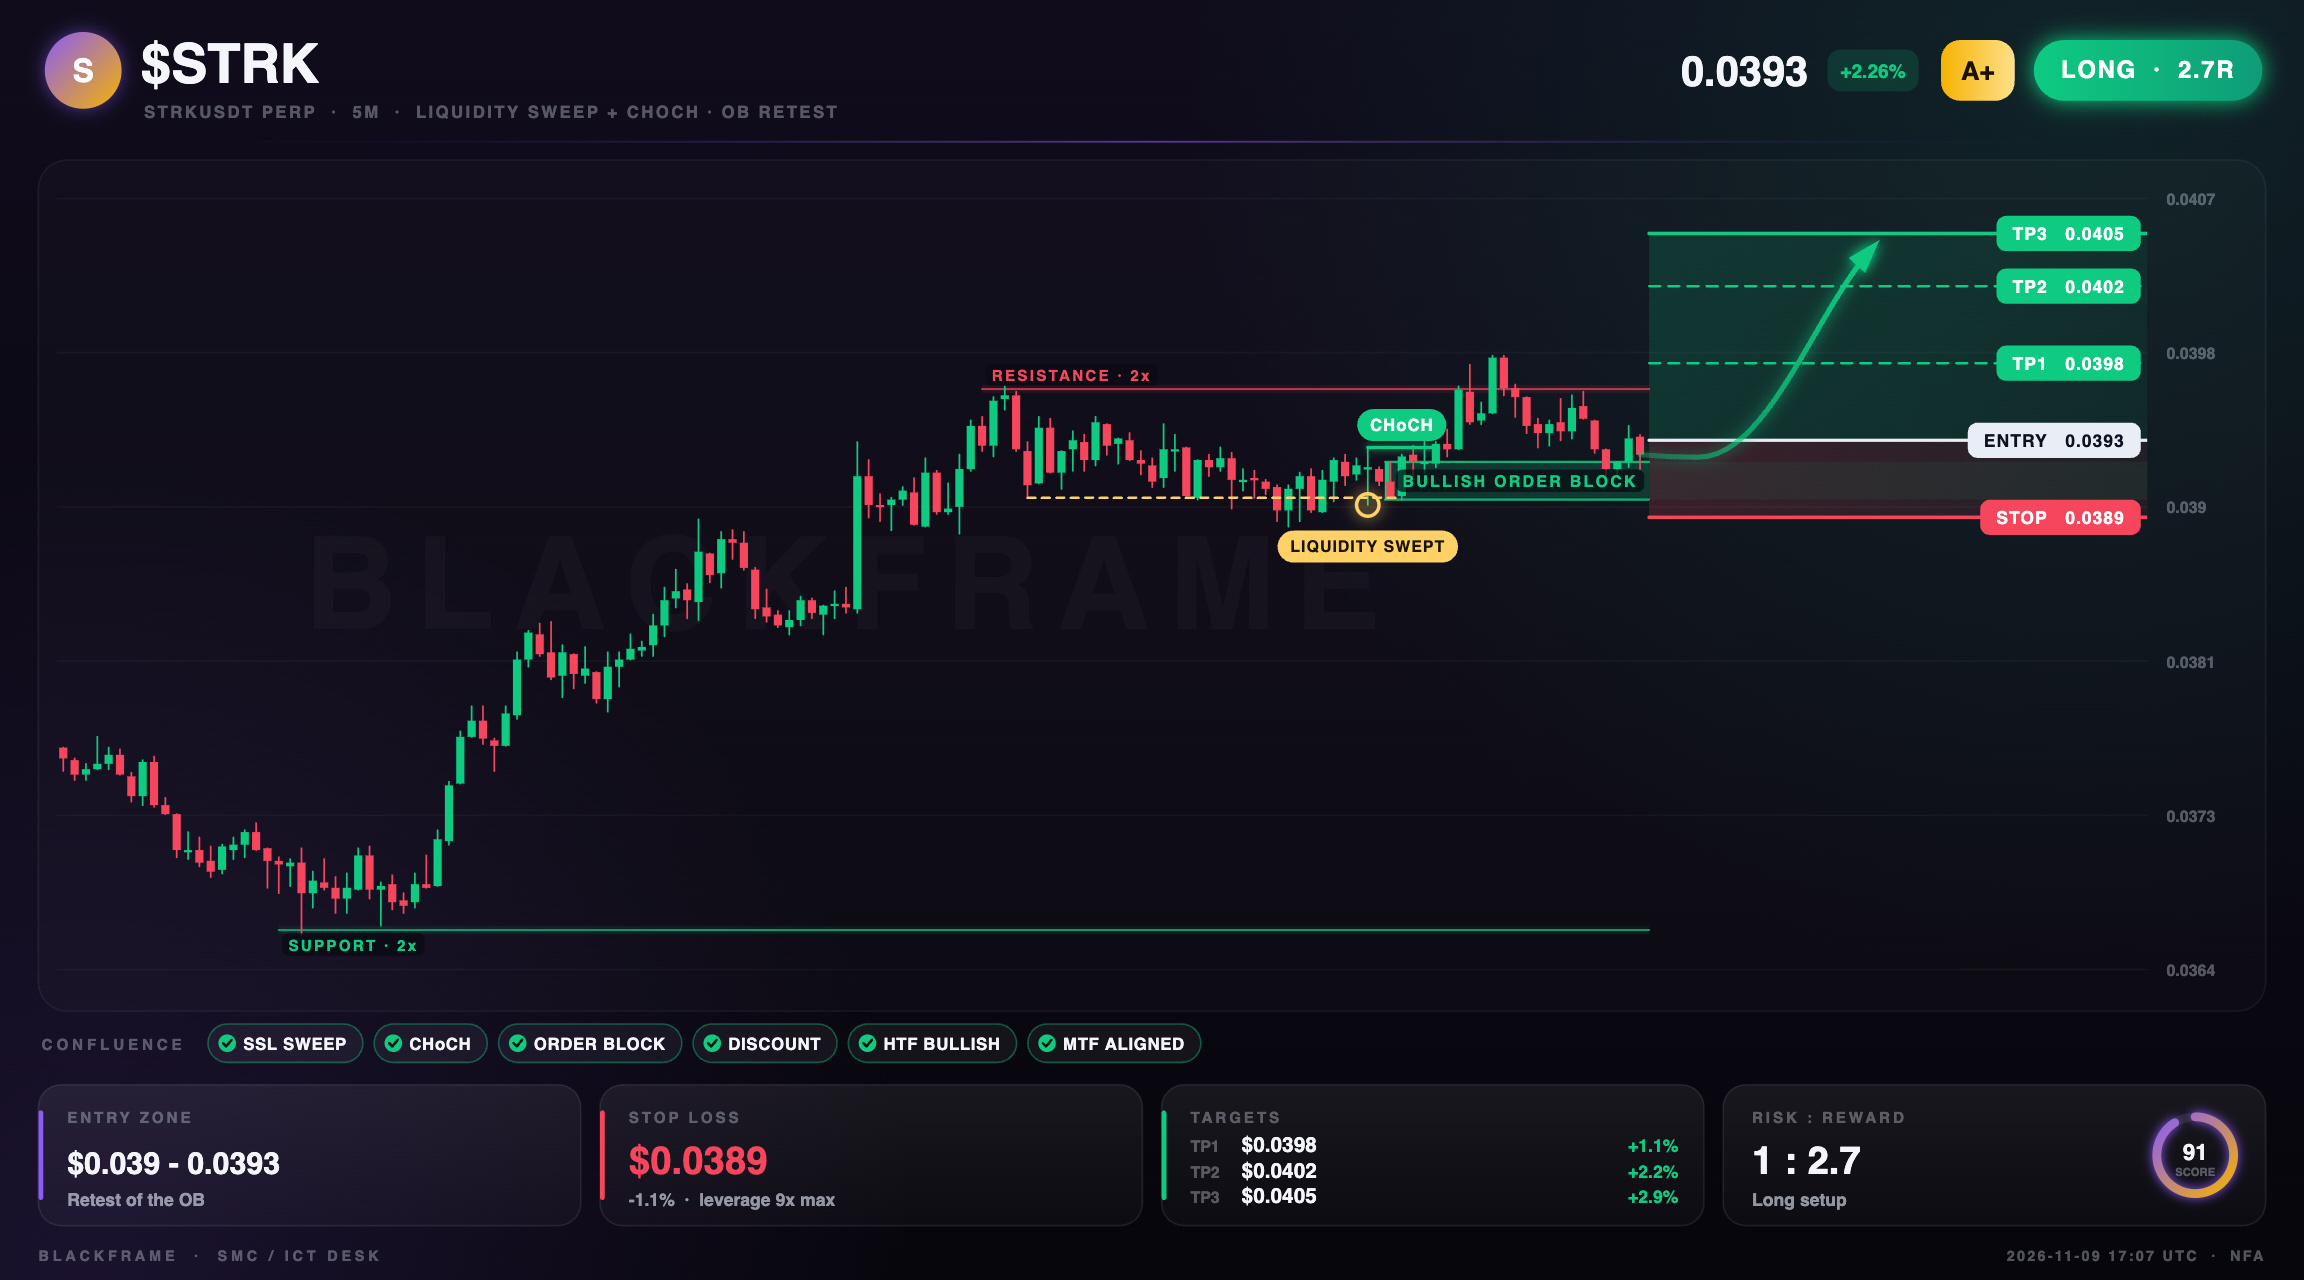
🌟 $STRK clears sell‑side liquidity, bullish setup emerges
LONG · 5M
Entry: $0.0392 - $0.0393
TP1: $0.0398
TP2: $0.0402
TP3: $0.0405
SL: $0.0389
Sell‑side liquidity was swept and CHoCH confirmed on the 5M. A fresh bullish order block retested at discount, aligning with higher‑timeframe bias. Enter at $0.0393, target $0.0405, stop $0.0389.
#STRK #ICT · NFA
🌟 $STRK clears sell‑side liquidity, bullish setup emerges
LONG · 5M
Entry: $0.0392 - $0.0393
TP1: $0.0398
TP2: $0.0402
TP3: $0.0405
SL: $0.0389
Sell‑side liquidity was swept and CHoCH confirmed on the 5M. A fresh bullish order block retested at discount, aligning with higher‑timeframe bias. Enter at $0.0393, target $0.0405, stop $0.0389.
#STRK #ICT · NFA
LONG · 5M
Entry: $0.0392 - $0.0393
TP1: $0.0398
TP2: $0.0402
TP3: $0.0405
SL: $0.0389
Sell‑side liquidity was swept and CHoCH confirmed on the 5M. A fresh bullish order block retested at discount, aligning with higher‑timeframe bias. Enter at $0.0393, target $0.0405, stop $0.0389.
#STRK #ICT · NFA
77

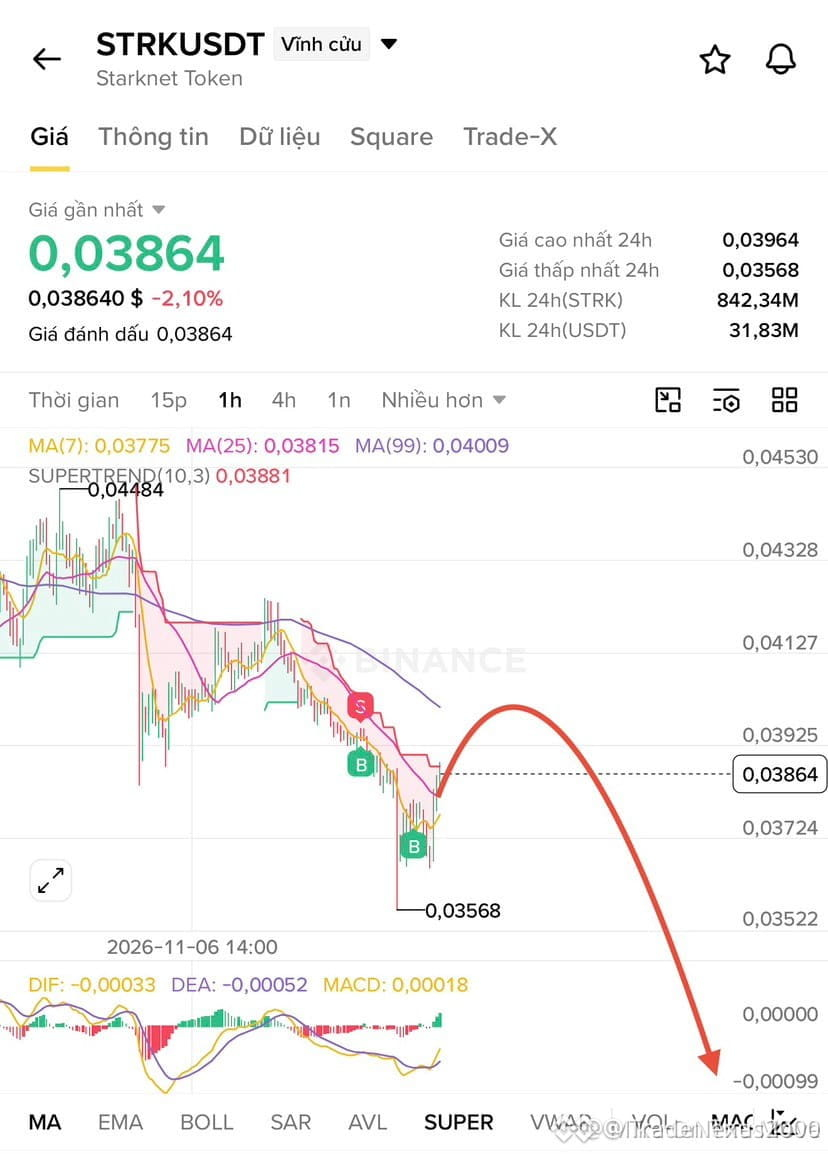
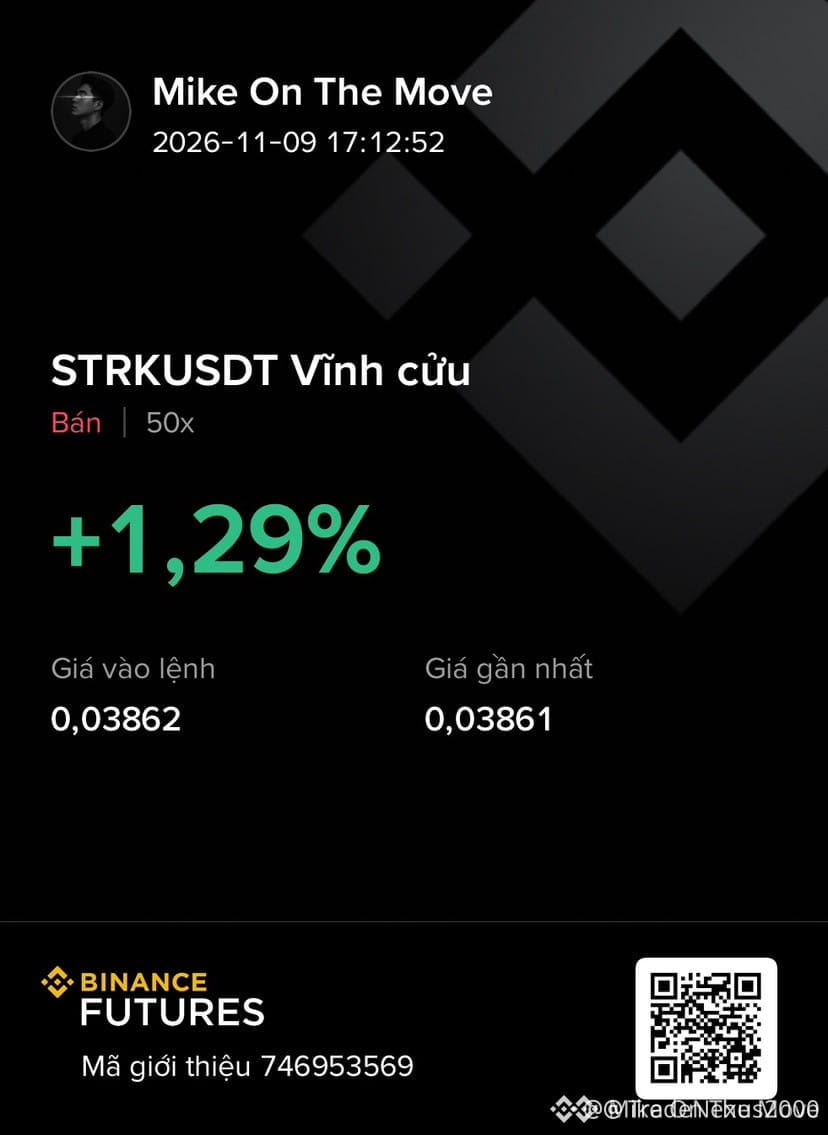
🔴 $STRK APPROACHING A MAJOR PREMIUM ARRAY FOR A CLEAN DISTRIBUTION SETUP 📉
Entry: 0.0382 - 0.0390 ⚡
Target: 0.0355 🚀
Stop Loss: 0.0420 ⚠️
Smart money is currently sweeping the liquidity pools above the recent range highs, leaving behind a clear inefficiency to be filled. 🦈
We are watching price tap into this premium order block where institutional sellers previously initiated aggressive distribution waves, while lower timeframes confirm seller dominance as bids dry up. 📊
Are you fading this retest or waiting for a confirmed breakdown of the local range low? 👇
⚠️ Not financial advice. Always manage your risk. 🛡️
🏷️ #STRK #ShortSetup #SmartMoney #OrderBlock
🦈 📉
🔴 $STRK APPROACHING A MAJOR PREMIUM ARRAY FOR A CLEAN DISTRIBUTION SETUP 📉
Entry: 0.0382 - 0.0390 ⚡
Target: 0.0355 🚀
Stop Loss: 0.0420 ⚠️
Smart money is currently sweeping the liquidity pools above the recent range highs, leaving behind a clear inefficiency to be filled. 🦈
We are watching price tap into this premium order block where institutional sellers previously initiated aggressive distribution waves, while lower timeframes confirm seller dominance as bids dry up. 📊
Are you fading this retest or waiting for a confirmed breakdown of the local range low? 👇
⚠️ Not financial advice. Always manage your risk. 🛡️
🏷️ #STRK #ShortSetup #SmartMoney #OrderBlock
🦈 📉
Entry: 0.0382 - 0.0390 ⚡
Target: 0.0355 🚀
Stop Loss: 0.0420 ⚠️
Smart money is currently sweeping the liquidity pools above the recent range highs, leaving behind a clear inefficiency to be filled. 🦈
We are watching price tap into this premium order block where institutional sellers previously initiated aggressive distribution waves, while lower timeframes confirm seller dominance as bids dry up. 📊
Are you fading this retest or waiting for a confirmed breakdown of the local range low? 👇
⚠️ Not financial advice. Always manage your risk. 🛡️
🏷️ #STRK #ShortSetup #SmartMoney #OrderBlock
🦈 📉
7


$STRK: The Partial View
Imagine feeling certain after looking at the $STRK chart. You might believe a strong move reveals the whole market's secret opinion. However, every screen shows just one door into a complex global space.
Think of your specific exchange as a single room. It represents a limited sample of all possible trades happening anywhere. Now, imagine a thought experiment. One venue shows a bright spike, suggesting buyers are eager. Meanwhile, outside that room, sellers may be quietly building a larger wall on other platforms. If you only watch the one room, your confidence feels dangerous and misplaced.
Writing about markets often feeds on this human need for certainty. Some creators are paid for posts, which can gently push them toward simpler stories. These narratives feel comfortable but can blur the line between facts and feelings. We must ask who benefits when we let a single screen speak for the whole field.
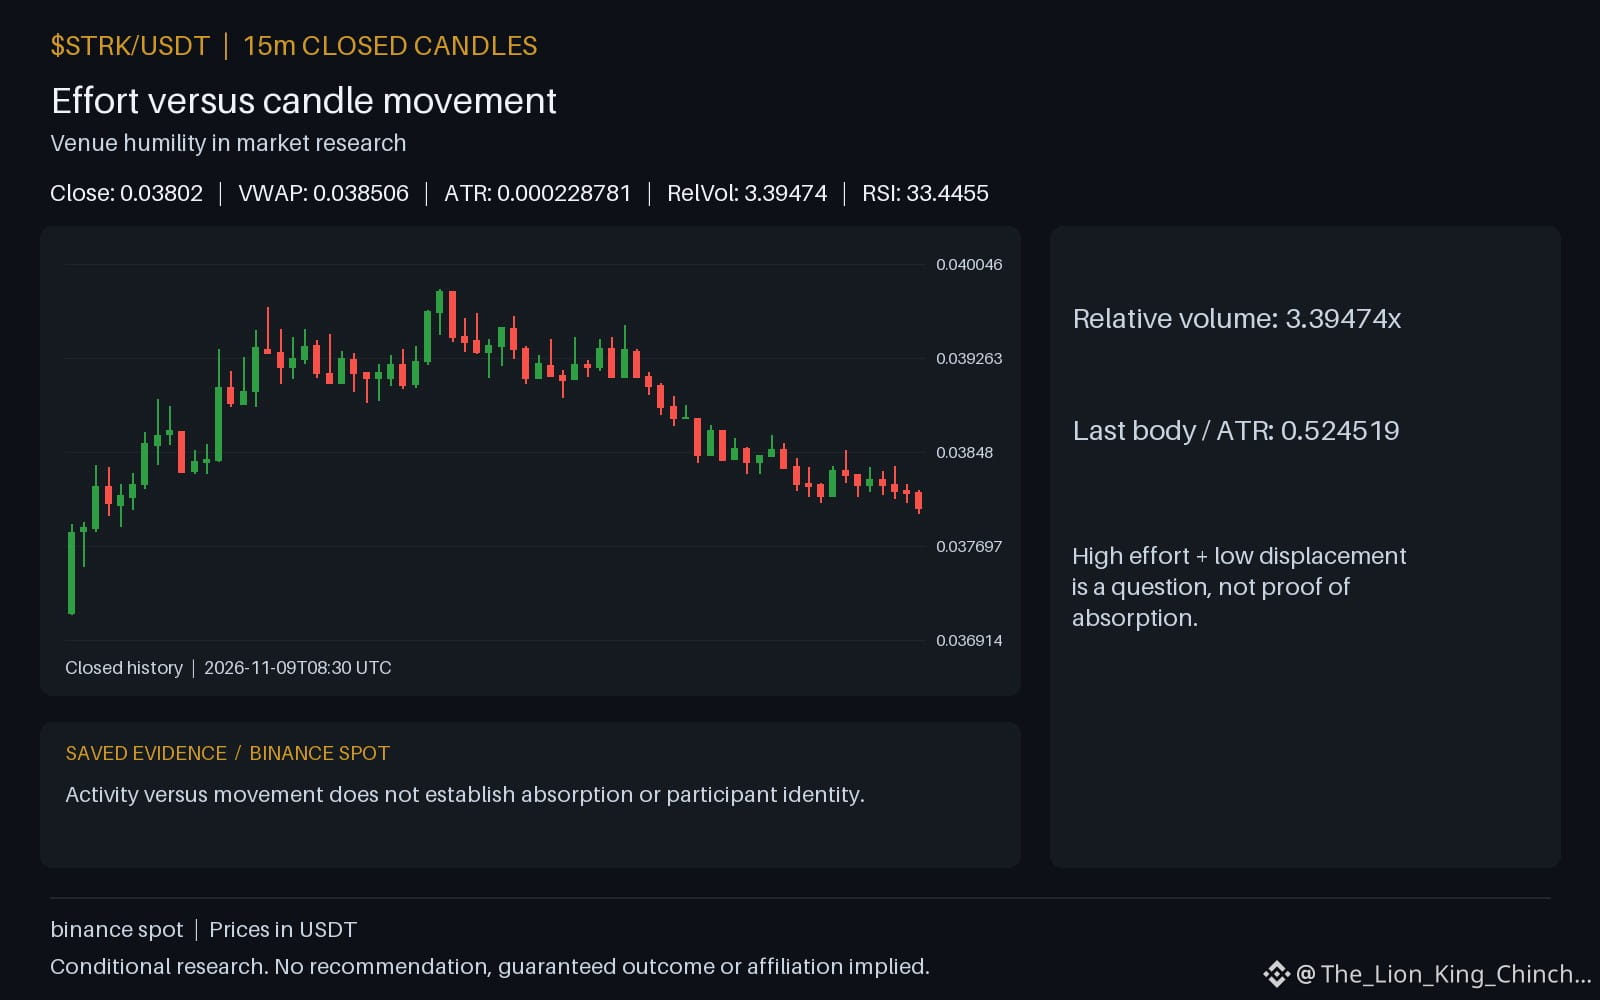
Look at the current data. The relative volume at 3.39474 seems active. Yet the price at 0.03802 remains below support marked at 0.03806. This mismatch is a reminder. One row of data does not equal a full picture. If another exchange shows weak buying, your whole view shifts immediately.
What specific tests could change this reading? You might cross-check order book depth on different sites or watch how peer assets react. Since $STRK moves with a specific timeframe, verify if wider market peers like $ETH show the same action first. Do not invent reasons for moves based on one screen. Accept the limits of your single view and keep your conclusions open to correction.
Probabilistic market research, not a recommendation or guaranteed return.
The comparison to keep in mind: $ETH has hourly direction up and volume above its baseline; $AMDB has hourly direction down and volume above its baseline. This alone does not establish correlation.
Why is it important to remember that a single exchange's spot candle is a sample of the market rather than the entire global picture?
#STRK #ETH
$STRK : The Partial View
Imagine feeling certain after looking at the $STRK chart. You might believe a strong move reveals the whole market's secret opinion. However, every screen shows just one door into a complex global space.
Think of your specific exchange as a single room. It represents a limited sample of all possible trades happening anywhere. Now, imagine a thought experiment. One venue shows a bright spike, suggesting buyers are eager. Meanwhile, outside that room, sellers may be quietly building a larger wall on other platforms. If you only watch the one room, your confidence feels dangerous and misplaced.
Writing about markets often feeds on this human need for certainty. Some creators are paid for posts, which can gently push them toward simpler stories. These narratives feel comfortable but can blur the line between facts and feelings. We must ask who benefits when we let a single screen speak for the whole field.
Look at the current data. The relative volume at 3.39474 seems active. Yet the price at 0.03802 remains below support marked at 0.03806. This mismatch is a reminder. One row of data does not equal a full picture. If another exchange shows weak buying, your whole view shifts immediately.
What specific tests could change this reading? You might cross-check order book depth on different sites or watch how peer assets react. Since $STRK moves with a specific timeframe, verify if wider market peers like $ETH show the same action first. Do not invent reasons for moves based on one screen. Accept the limits of your single view and keep your conclusions open to correction.
Probabilistic market research, not a recommendation or guaranteed return.
The comparison to keep in mind: $ETH has hourly direction up and volume above its baseline; $AMDB has hourly direction down and volume above its baseline. This alone does not establish correlation.
Why is it important to remember that a single exchange's spot candle is a sample of the market rather than the entire global picture?
#STRK #ETH
Imagine feeling certain after looking at the $STRK chart. You might believe a strong move reveals the whole market's secret opinion. However, every screen shows just one door into a complex global space.
Think of your specific exchange as a single room. It represents a limited sample of all possible trades happening anywhere. Now, imagine a thought experiment. One venue shows a bright spike, suggesting buyers are eager. Meanwhile, outside that room, sellers may be quietly building a larger wall on other platforms. If you only watch the one room, your confidence feels dangerous and misplaced.
Writing about markets often feeds on this human need for certainty. Some creators are paid for posts, which can gently push them toward simpler stories. These narratives feel comfortable but can blur the line between facts and feelings. We must ask who benefits when we let a single screen speak for the whole field.
Look at the current data. The relative volume at 3.39474 seems active. Yet the price at 0.03802 remains below support marked at 0.03806. This mismatch is a reminder. One row of data does not equal a full picture. If another exchange shows weak buying, your whole view shifts immediately.
What specific tests could change this reading? You might cross-check order book depth on different sites or watch how peer assets react. Since $STRK moves with a specific timeframe, verify if wider market peers like $ETH show the same action first. Do not invent reasons for moves based on one screen. Accept the limits of your single view and keep your conclusions open to correction.
Probabilistic market research, not a recommendation or guaranteed return.
The comparison to keep in mind: $ETH has hourly direction up and volume above its baseline; $AMDB has hourly direction down and volume above its baseline. This alone does not establish correlation.
Why is it important to remember that a single exchange's spot candle is a sample of the market rather than the entire global picture?
#STRK #ETH
95
·
--
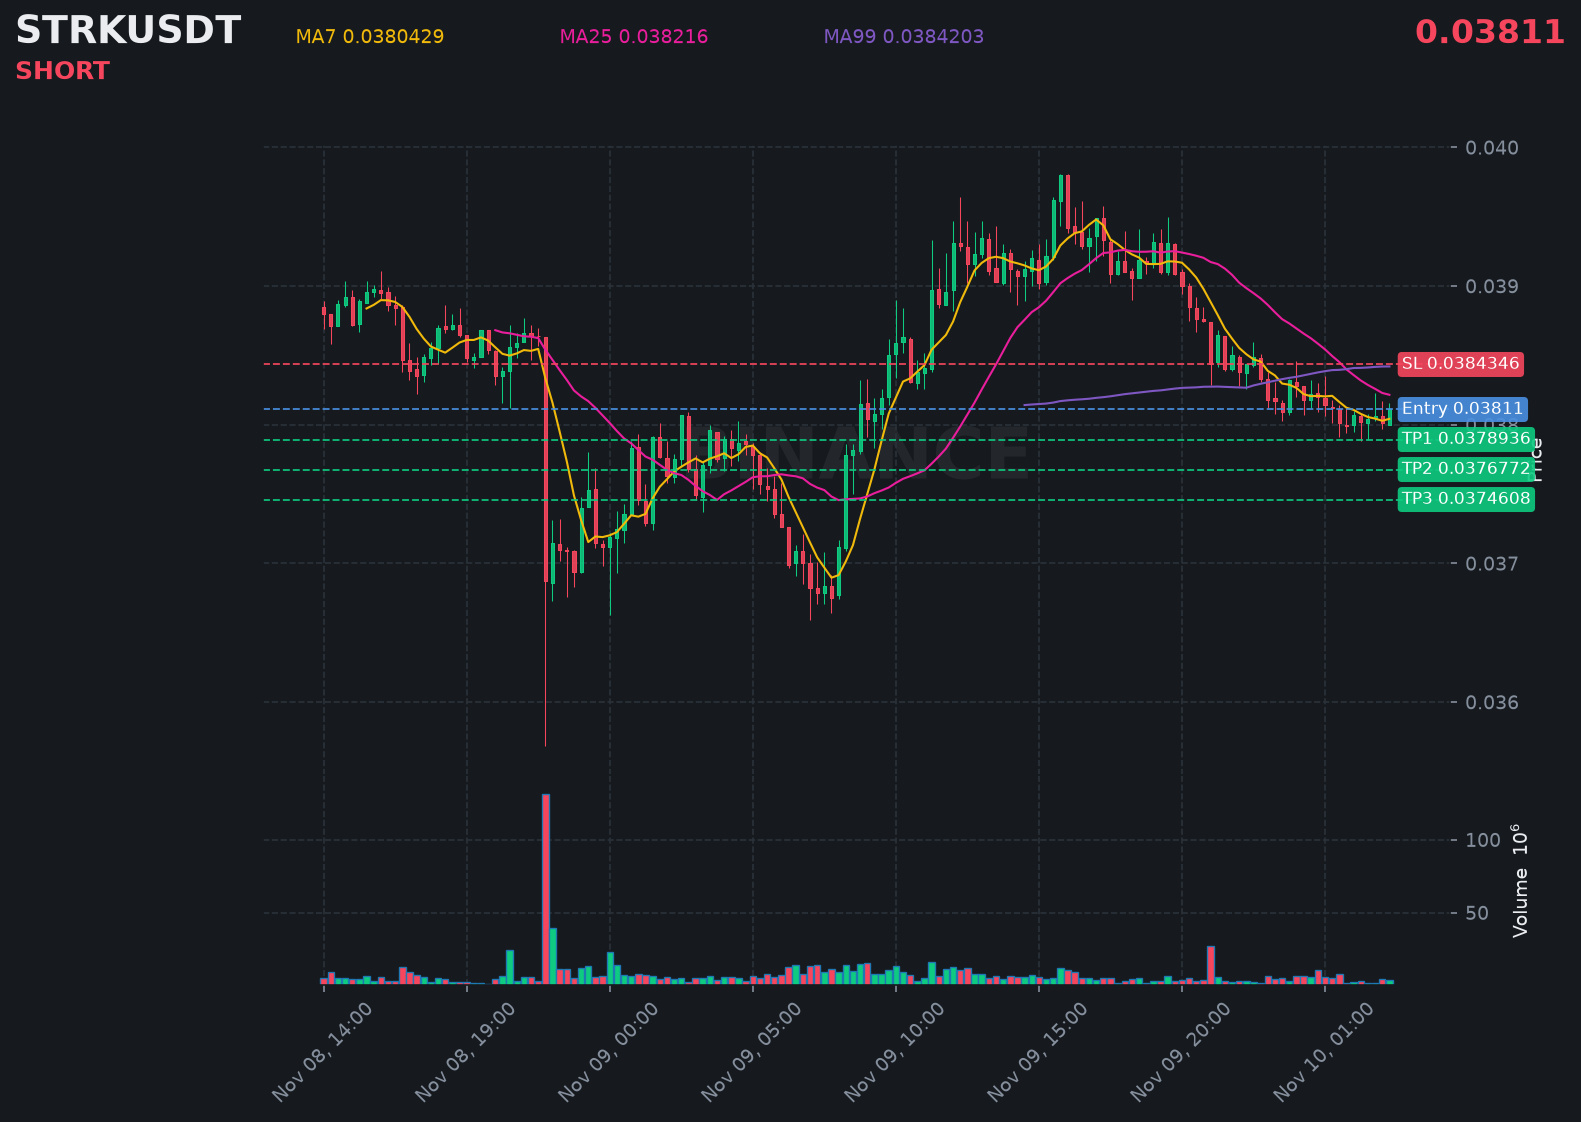
$STRK just printed a strong bearish candle, signaling more downside pressure building right now.
📍 @ 0.03811 | Volume: 0.14M USD
RSI 42 | EMA20: 0.0381963 USD
📈 Trade Plan:
📈 Entry: 0.0380451 – 0.0381749
🛑 Stop Loss: 0.0384346
🎯 TP1: 0.0378936
🎯 TP2: 0.0376772
🎯 TP3: 0.0374608
Waiting for confirmation, then riding the downtrend.
👉 $STRK 👈 Catch it
#STRK
$STRK just printed a strong bearish candle, signaling more downside pressure building right now.
📍 @ 0.03811 | Volume: 0.14M USD
RSI 42 | EMA20: 0.0381963 USD
📈 Trade Plan:
📈 Entry: 0.0380451 – 0.0381749
🛑 Stop Loss: 0.0384346
🎯 TP1: 0.0378936
🎯 TP2: 0.0376772
🎯 TP3: 0.0374608
Waiting for confirmation, then riding the downtrend.
👉 $STRK 👈 Catch it
#STRK
📍 @ 0.03811 | Volume: 0.14M USD
RSI 42 | EMA20: 0.0381963 USD
📈 Trade Plan:
📈 Entry: 0.0380451 – 0.0381749
🛑 Stop Loss: 0.0384346
🎯 TP1: 0.0378936
🎯 TP2: 0.0376772
🎯 TP3: 0.0374608
Waiting for confirmation, then riding the downtrend.
👉 $STRK 👈 Catch it
#STRK
91

🚨 $STRK IS CONSIDERING A MASSIVE SPLIT FROM ETHEREUM TO GO IT ALONE! ⚡
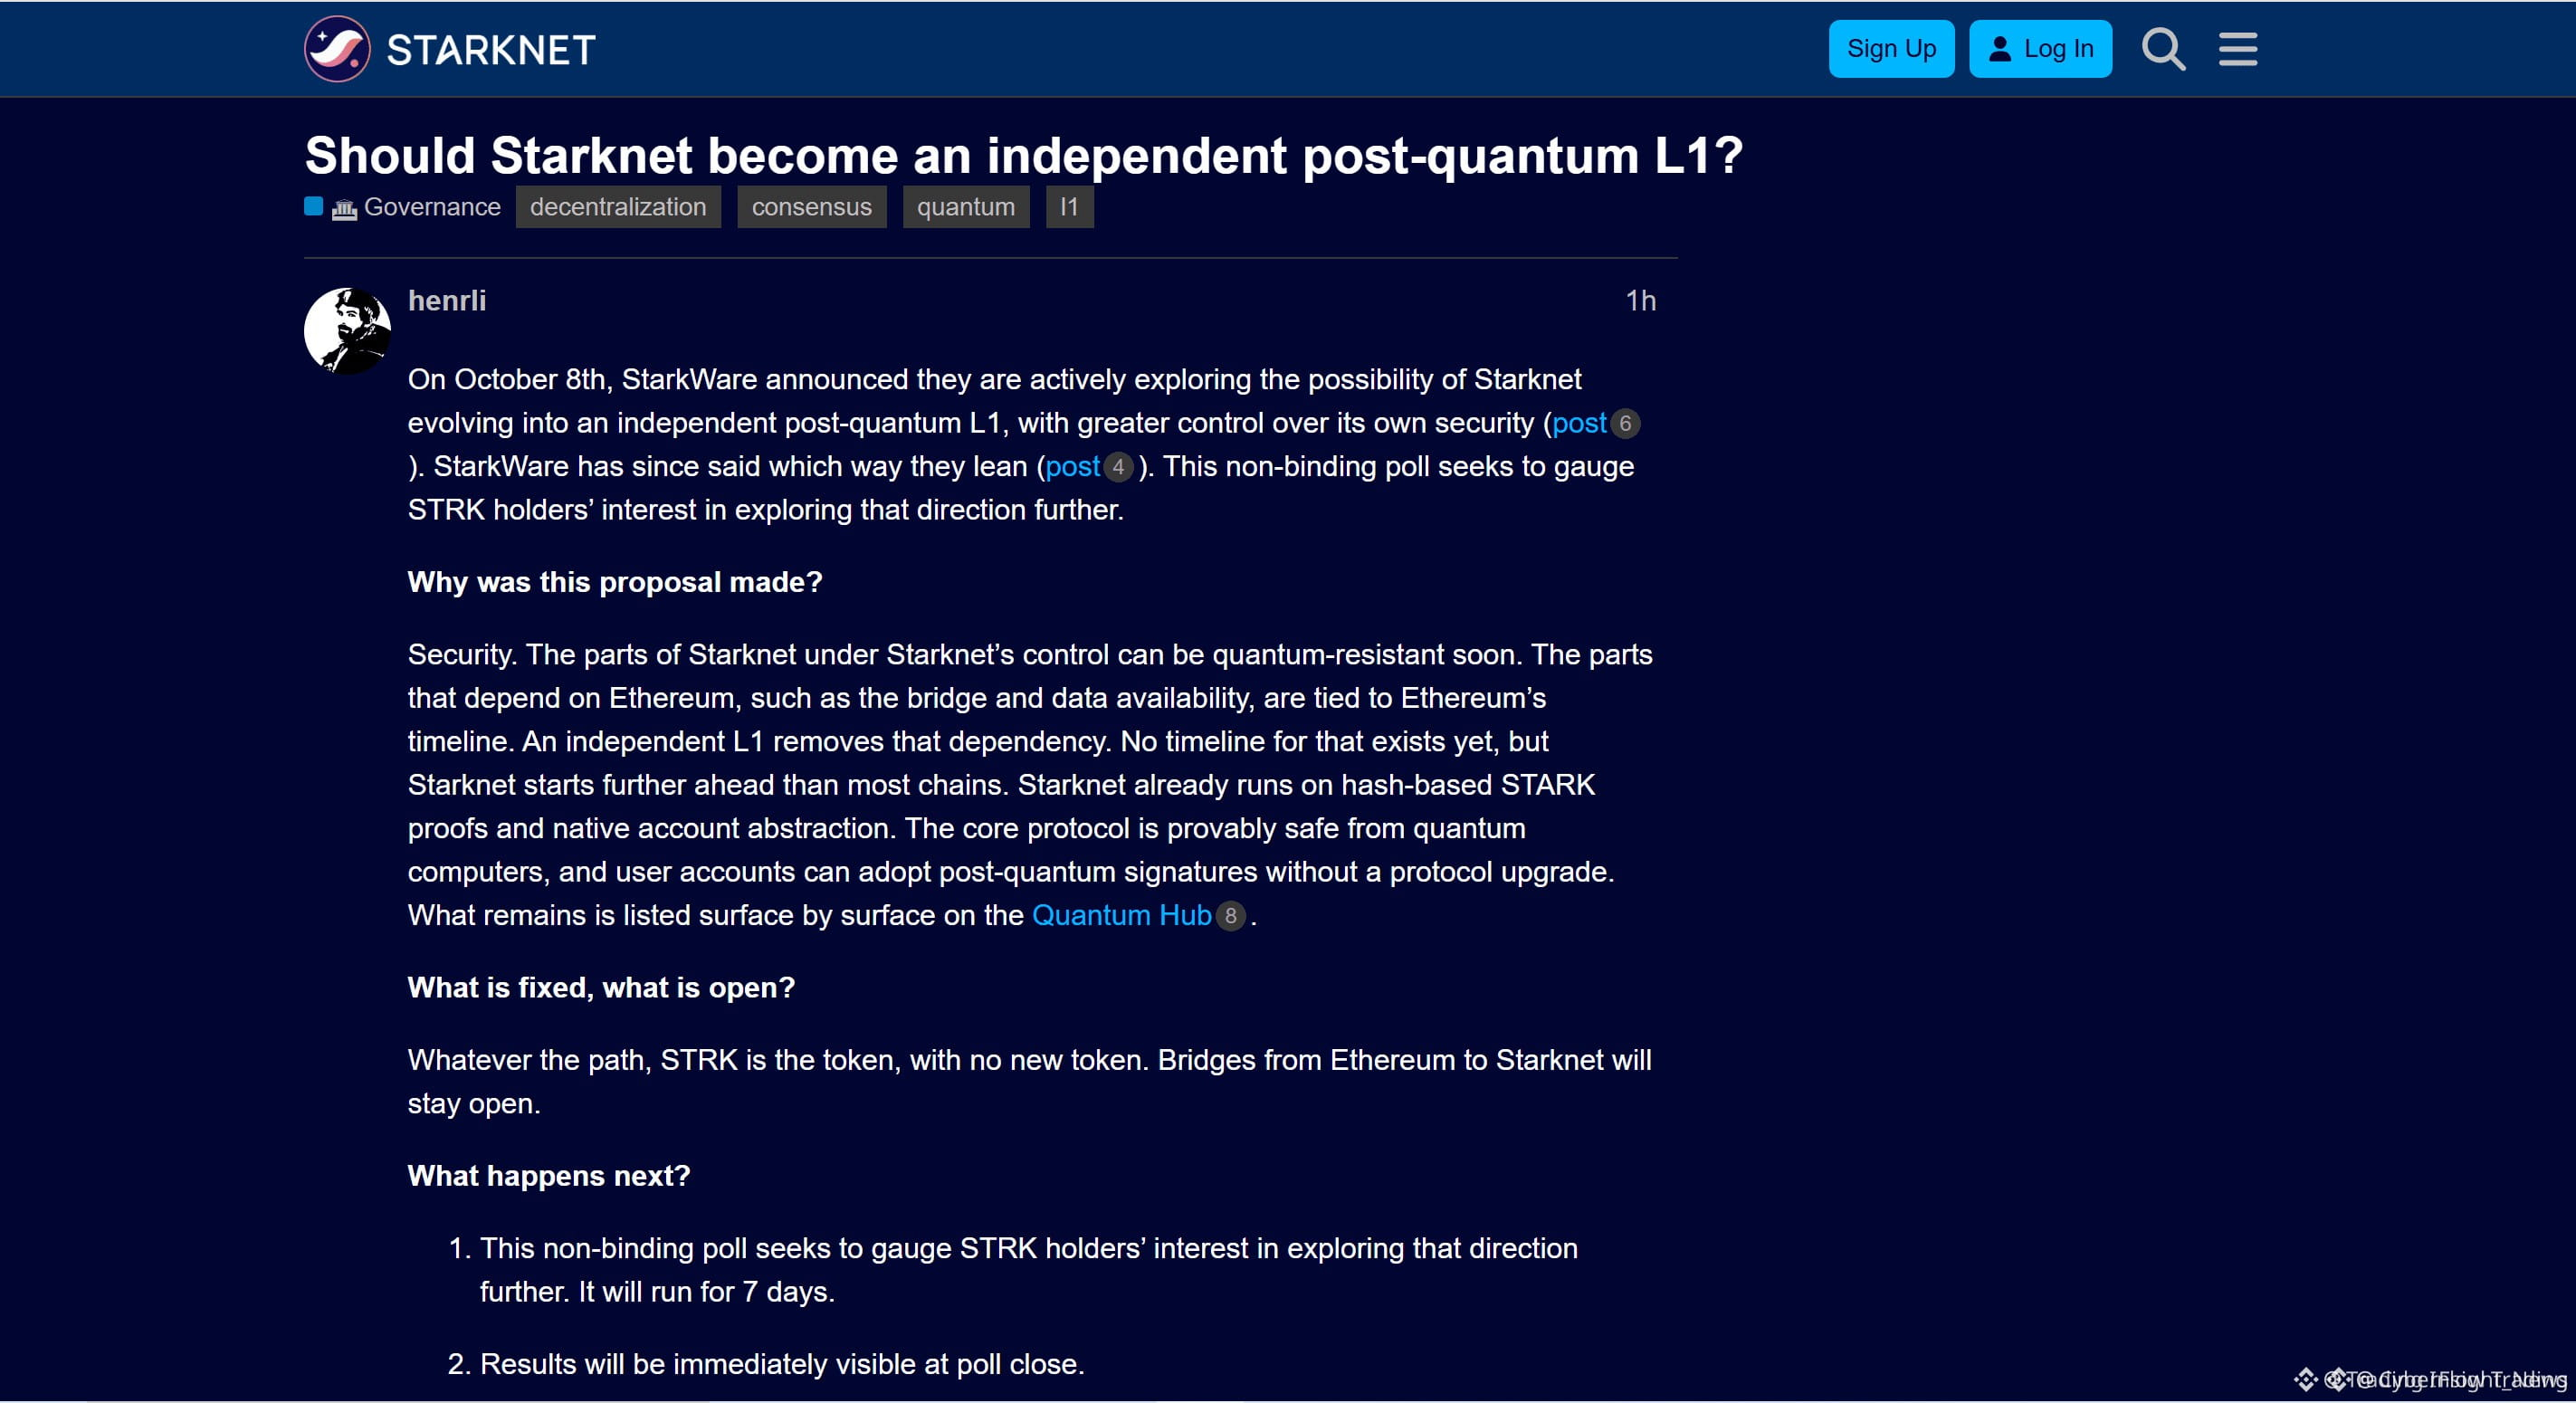
The Starknet community just kicked off a high-stakes sentiment vote on cutting ties with Ethereum to build a standalone quantum-resistant layer one. 📊 Removing reliance on external cross-chain bridges gives developers absolute technological autonomy, but it means walking away from the deepest liquidity pool and security network in crypto. ⚡
It is a bold gamble trading institutional network effects for pure cryptographic sovereignty. 🔍 Will holders vote to stand alone, or is the security of the broader ecosystem too heavy to leave behind? 🤔
⚠️ Not financial advice. Always manage your risk. 🛡️
🏷️ #STRK #Starknet #Crypto #Layer1 #Altcoins
🔥 💎
🚨 $STRK IS CONSIDERING A MASSIVE SPLIT FROM ETHEREUM TO GO IT ALONE! ⚡
The Starknet community just kicked off a high-stakes sentiment vote on cutting ties with Ethereum to build a standalone quantum-resistant layer one. 📊 Removing reliance on external cross-chain bridges gives developers absolute technological autonomy, but it means walking away from the deepest liquidity pool and security network in crypto. ⚡
It is a bold gamble trading institutional network effects for pure cryptographic sovereignty. 🔍 Will holders vote to stand alone, or is the security of the broader ecosystem too heavy to leave behind? 🤔
⚠️ Not financial advice. Always manage your risk. 🛡️
🏷️ #STRK #Starknet #Crypto #Layer1 #Altcoins
🔥 💎
The Starknet community just kicked off a high-stakes sentiment vote on cutting ties with Ethereum to build a standalone quantum-resistant layer one. 📊 Removing reliance on external cross-chain bridges gives developers absolute technological autonomy, but it means walking away from the deepest liquidity pool and security network in crypto. ⚡
It is a bold gamble trading institutional network effects for pure cryptographic sovereignty. 🔍 Will holders vote to stand alone, or is the security of the broader ecosystem too heavy to leave behind? 🤔
⚠️ Not financial advice. Always manage your risk. 🛡️
🏷️ #STRK #Starknet #Crypto #Layer1 #Altcoins
🔥 💎
49

·
--
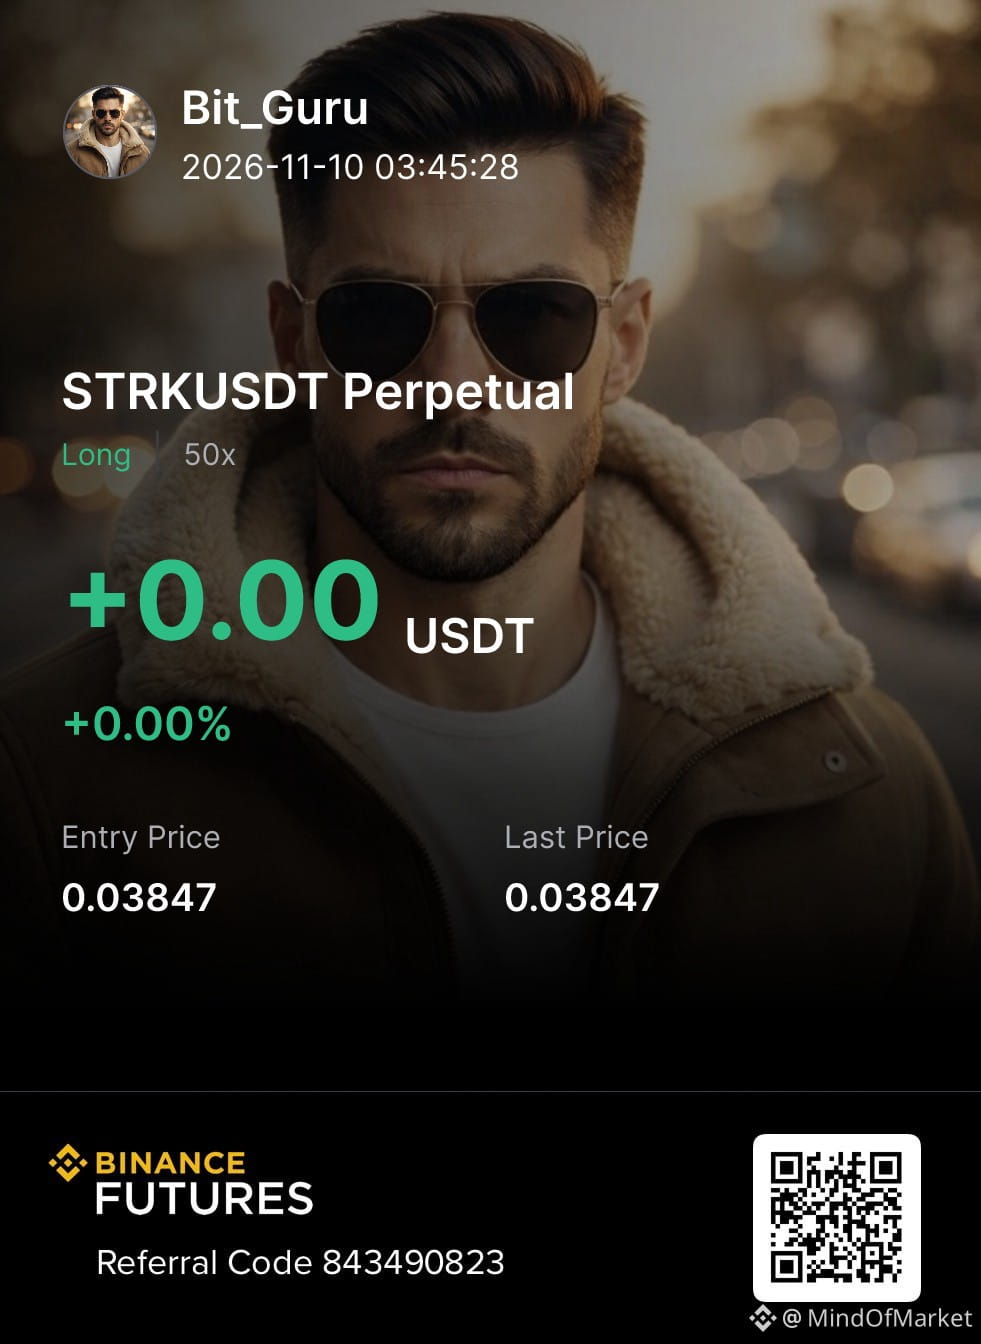
🦈 $STRK SWEEPING LIQUIDITY BELOW SUPPORT BEFORE A SHARP EXPANSION ⚡
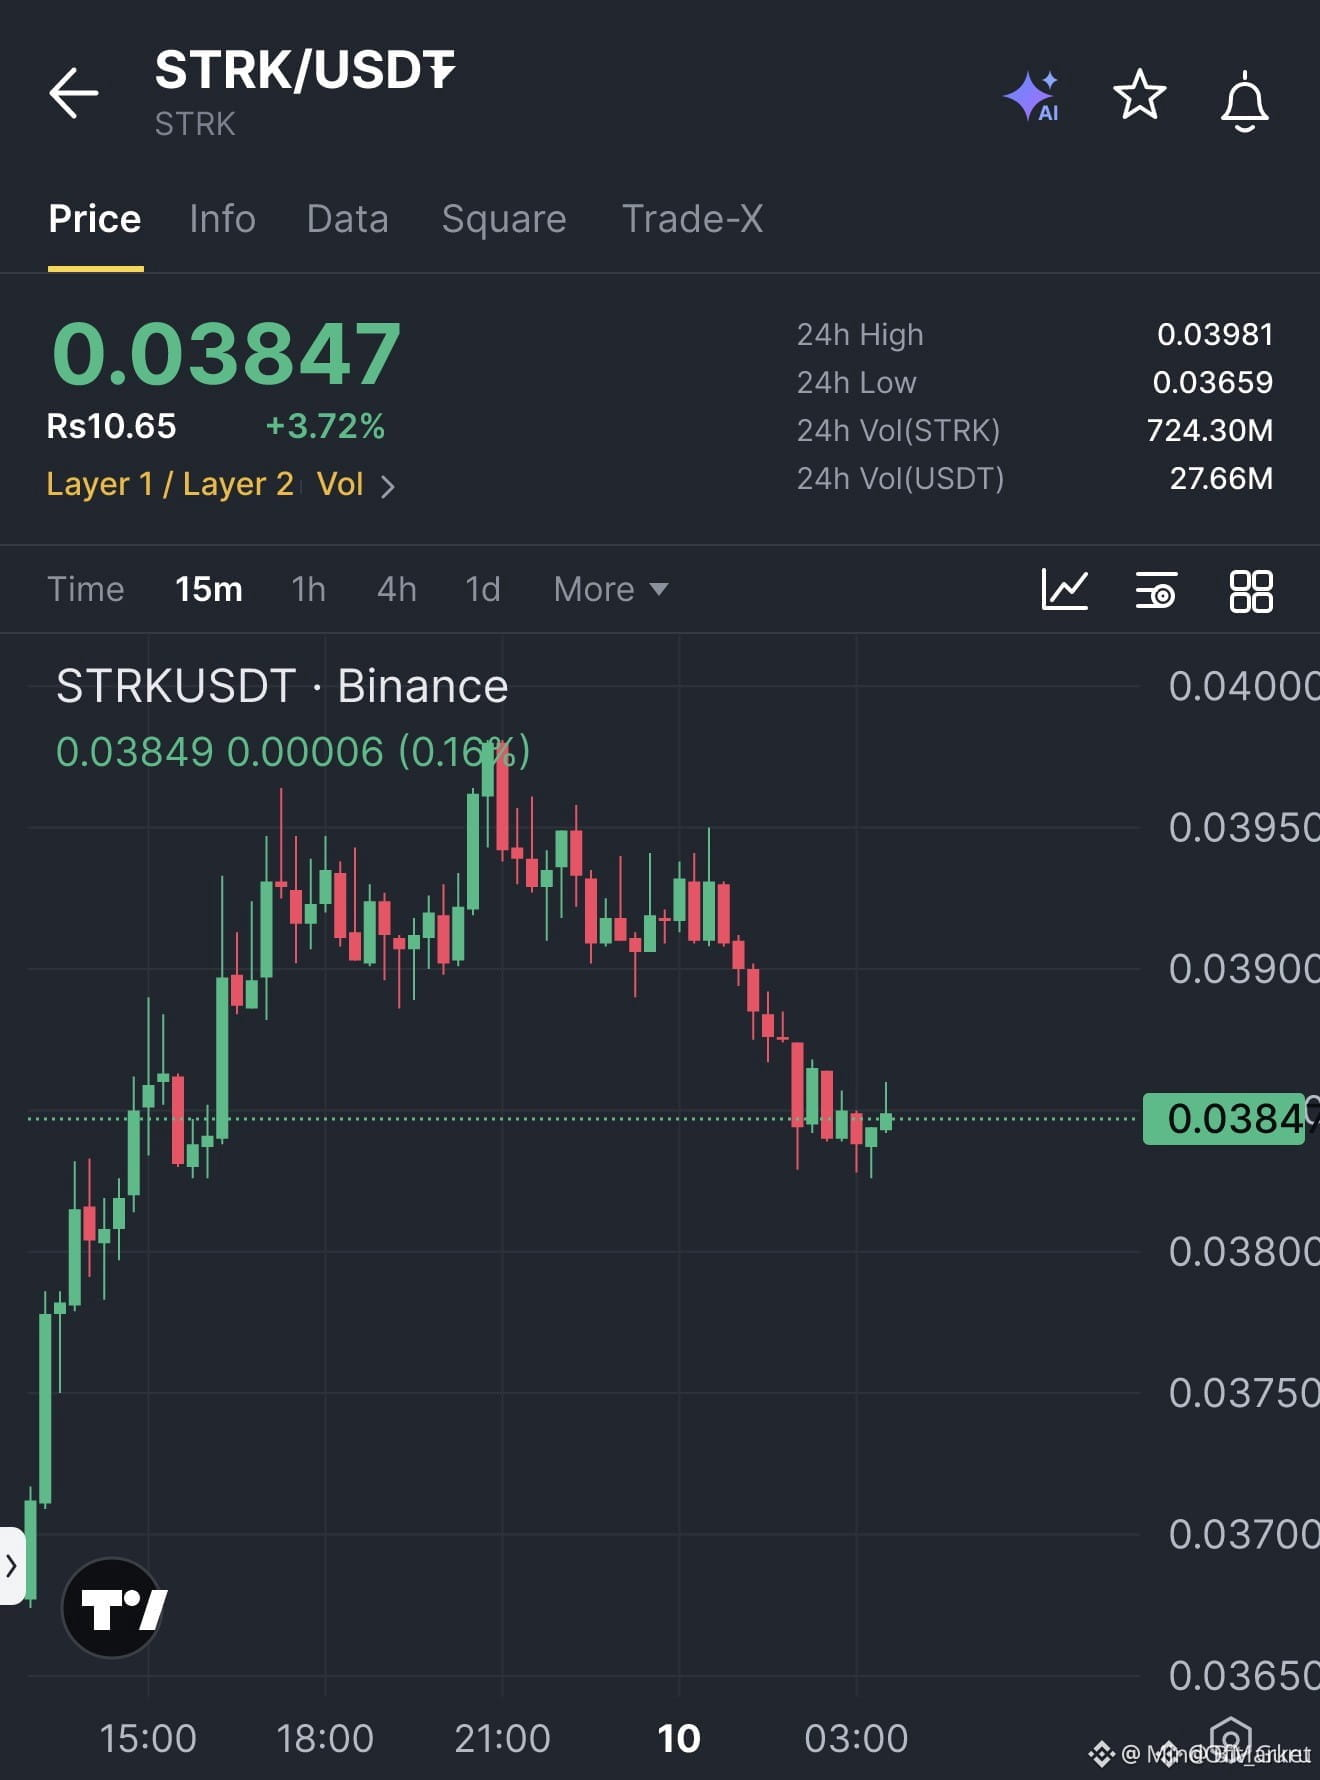
Entry: 0.03847 ⚡
Target: 0.03883 🚀
Stop Loss: 0.03823 ⚠️
Smart money just orchestrated a textbook liquidity sweep beneath 0.03828, trapping late shorts before printing a sharp reclaim on the lower timeframe. 🌊 Institutional buyers stepped in aggressively at the lows, absorbing the sell-side pressure and locking in structural demand. 📊
With price successfully defending the invalidation zone, order flow favors continuation toward initial overhead inefficiencies. 💡 Are you entering on this retest or waiting for a confirmed volume expansion above the range high? 👇
⚠️ Not financial advice. Always manage your risk. 🛡️
🏷️ #STRK #LongSetup #SmartMoney #Crypto #PriceAction
🦈 💎
🦈 $STRK SWEEPING LIQUIDITY BELOW SUPPORT BEFORE A SHARP EXPANSION ⚡
Entry: 0.03847 ⚡
Target: 0.03883 🚀
Stop Loss: 0.03823 ⚠️
Smart money just orchestrated a textbook liquidity sweep beneath 0.03828, trapping late shorts before printing a sharp reclaim on the lower timeframe. 🌊 Institutional buyers stepped in aggressively at the lows, absorbing the sell-side pressure and locking in structural demand. 📊
With price successfully defending the invalidation zone, order flow favors continuation toward initial overhead inefficiencies. 💡 Are you entering on this retest or waiting for a confirmed volume expansion above the range high? 👇
⚠️ Not financial advice. Always manage your risk. 🛡️
🏷️ #STRK #LongSetup #SmartMoney #Crypto #PriceAction
🦈 💎
Entry: 0.03847 ⚡
Target: 0.03883 🚀
Stop Loss: 0.03823 ⚠️
Smart money just orchestrated a textbook liquidity sweep beneath 0.03828, trapping late shorts before printing a sharp reclaim on the lower timeframe. 🌊 Institutional buyers stepped in aggressively at the lows, absorbing the sell-side pressure and locking in structural demand. 📊
With price successfully defending the invalidation zone, order flow favors continuation toward initial overhead inefficiencies. 💡 Are you entering on this retest or waiting for a confirmed volume expansion above the range high? 👇
⚠️ Not financial advice. Always manage your risk. 🛡️
🏷️ #STRK #LongSetup #SmartMoney #Crypto #PriceAction
🦈 💎
4

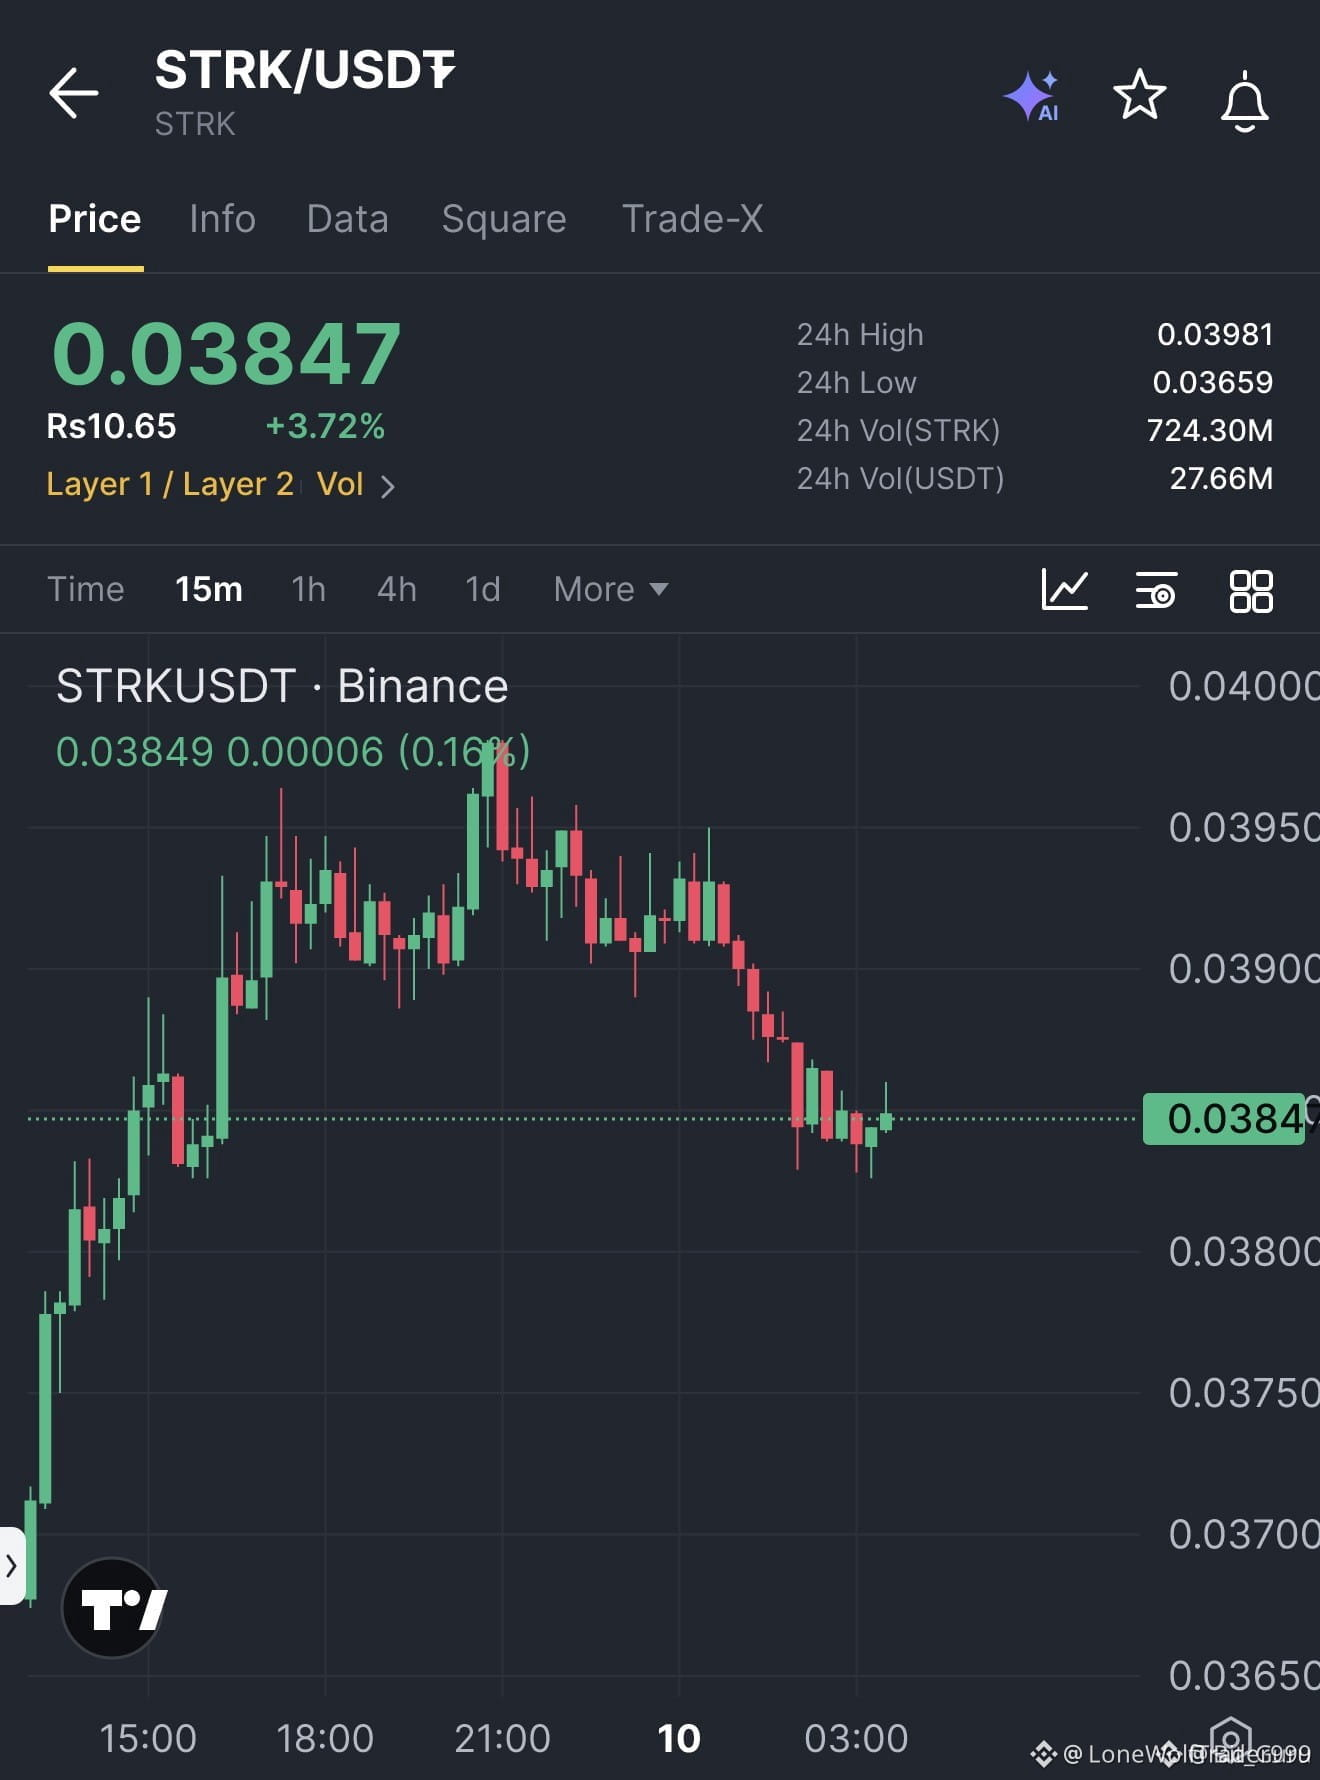
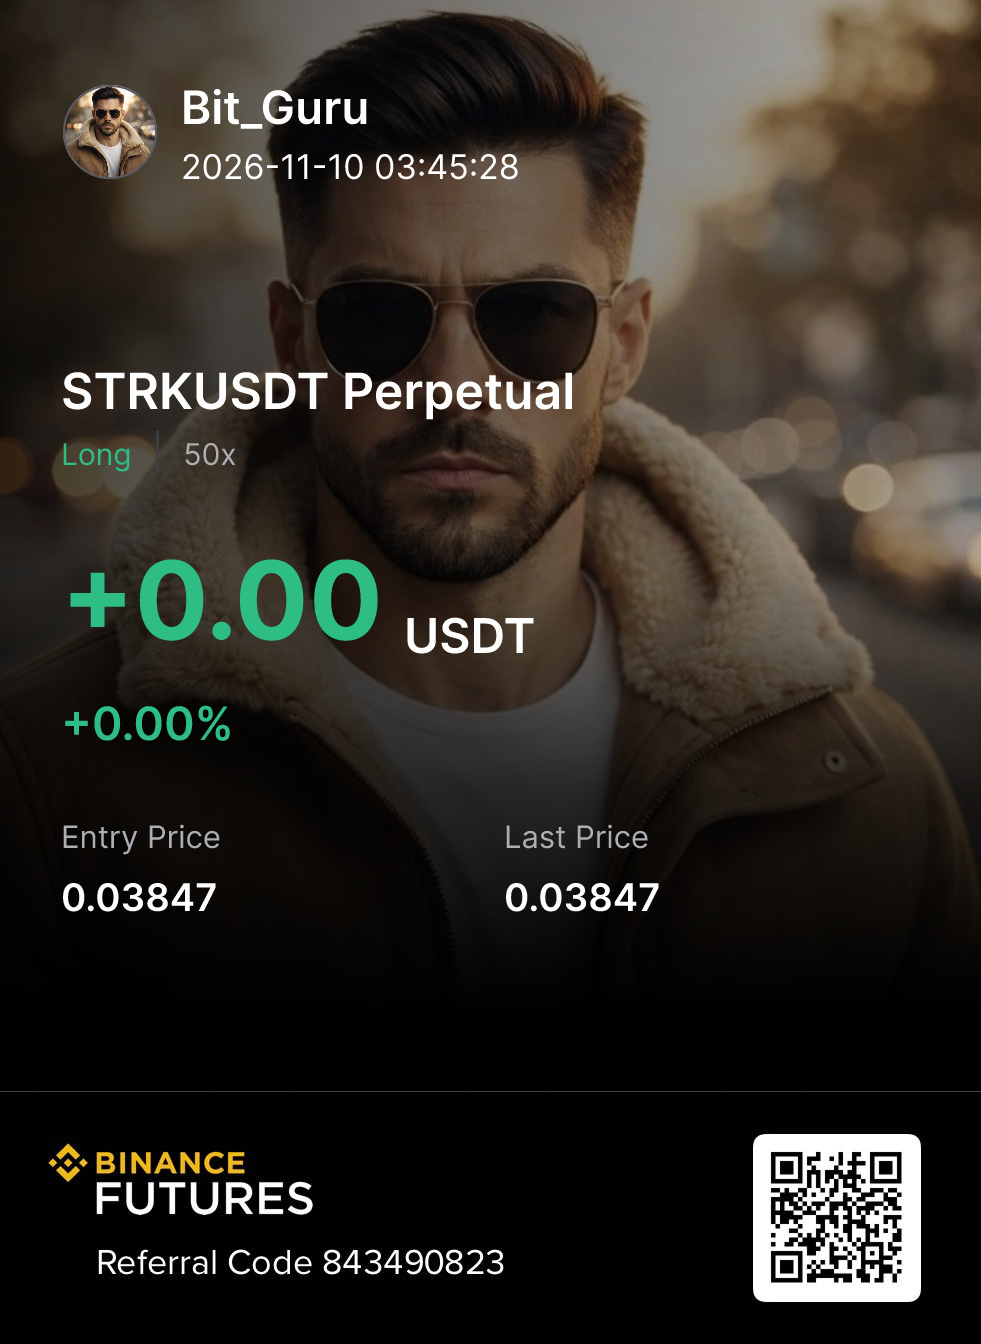
🚨 $STRK BULLS RECLAIM THE BREAKDOWN ZONE WITH FIERCE BUYING PRESSURE! 💥
Entry: 0.03847 ⚡
Target: 0.03883 🚀
Stop Loss: 0.03823 ⚠️
Price dipped below support at 0.03828 earlier, trying to trick weak hands into capitulating. Instead, responsive buyers stepped in aggressively, slamming bids and closing the candle right back above the line. 📊 This kind of bear trap reveals true institutional defense at the lows. 💡
Momentum is shifting as sellers exhaust their ammo on every failed flush attempt. ⚡ The order book is clearing out overhead resistance, opening a clean runway toward our primary objective. 🌊
💬 Are you positioning ahead of this momentum shift or waiting for a retest? 👇
⚠️ Not financial advice. Always manage your risk. 🛡️
🏷️ #STRK #LongSetup #Crypto #Breakout #Altcoins
🔥 💎
🚨 $STRK BULLS RECLAIM THE BREAKDOWN ZONE WITH FIERCE BUYING PRESSURE! 💥
Entry: 0.03847 ⚡
Target: 0.03883 🚀
Stop Loss: 0.03823 ⚠️
Price dipped below support at 0.03828 earlier, trying to trick weak hands into capitulating. Instead, responsive buyers stepped in aggressively, slamming bids and closing the candle right back above the line. 📊 This kind of bear trap reveals true institutional defense at the lows. 💡
Momentum is shifting as sellers exhaust their ammo on every failed flush attempt. ⚡ The order book is clearing out overhead resistance, opening a clean runway toward our primary objective. 🌊
💬 Are you positioning ahead of this momentum shift or waiting for a retest? 👇
⚠️ Not financial advice. Always manage your risk. 🛡️
🏷️ #STRK #LongSetup #Crypto #Breakout #Altcoins
🔥 💎
Entry: 0.03847 ⚡
Target: 0.03883 🚀
Stop Loss: 0.03823 ⚠️
Price dipped below support at 0.03828 earlier, trying to trick weak hands into capitulating. Instead, responsive buyers stepped in aggressively, slamming bids and closing the candle right back above the line. 📊 This kind of bear trap reveals true institutional defense at the lows. 💡
Momentum is shifting as sellers exhaust their ammo on every failed flush attempt. ⚡ The order book is clearing out overhead resistance, opening a clean runway toward our primary objective. 🌊
💬 Are you positioning ahead of this momentum shift or waiting for a retest? 👇
⚠️ Not financial advice. Always manage your risk. 🛡️
🏷️ #STRK #LongSetup #Crypto #Breakout #Altcoins
🔥 💎
4
·
--
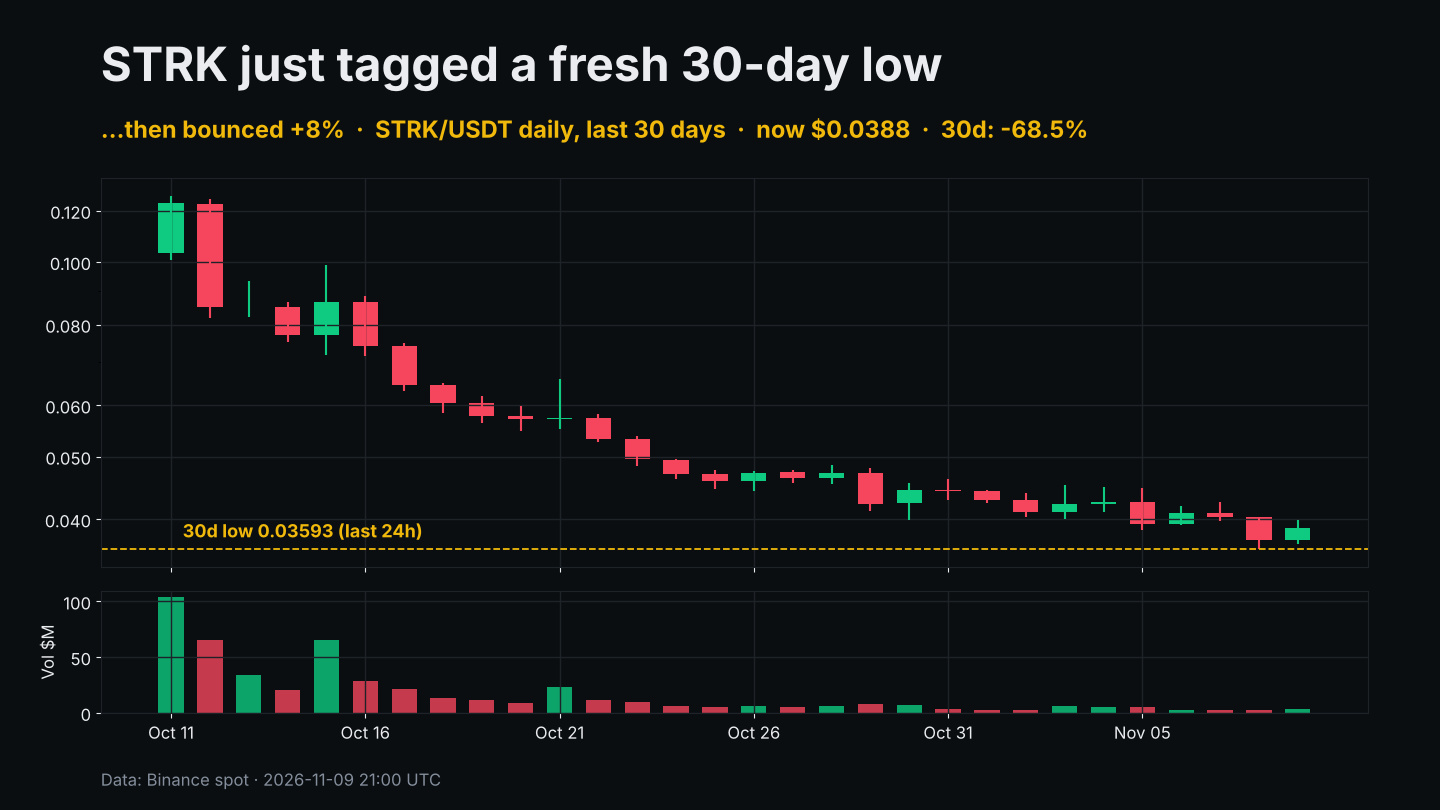
$STRK just tagged a fresh 30-day low at $0.03593 — and buyers stepped in for an 8% bounce.
Now around $0.0388 (+0.5% over 24h). Zoom out and the picture is rough: roughly -68% from the $0.1232 daily close 30 days ago, and -5.2% on the week.
What I'm watching:
• Volume: $4.6M on Binance spot in 24h, about 17% above the 7-day average. A pulse, but nowhere near the $100M+ day in mid-October. Interest has drained out.
• Levels: $0.0359 is the line in the sand. Reclaiming the 24h high at $0.0398 would be the first small win; the weekly high at $0.0452 is the real test.
• Supply: the next monthly unlock of 127M STRK lands Nov 15 (about 1.7% of circulating), with four more tranches through March. In a thin market that can weigh on any bounce.
Bounce or dead-cat? A low-volume pop after a 68% slide can easily fade, so I'd want to see 0.0359 hold through the unlock before calling a bottom. Small caps like this move fast both ways, size accordingly.
Do you think STRK holds 0.036 into Nov 15?
Not financial advice.
#Starknet #STRK #Altcoins
$STRK just tagged a fresh 30-day low at $0.03593 — and buyers stepped in for an 8% bounce.
Now around $0.0388 (+0.5% over 24h). Zoom out and the picture is rough: roughly -68% from the $0.1232 daily close 30 days ago, and -5.2% on the week.
What I'm watching:
• Volume: $4.6M on Binance spot in 24h, about 17% above the 7-day average. A pulse, but nowhere near the $100M+ day in mid-October. Interest has drained out.
• Levels: $0.0359 is the line in the sand. Reclaiming the 24h high at $0.0398 would be the first small win; the weekly high at $0.0452 is the real test.
• Supply: the next monthly unlock of 127M STRK lands Nov 15 (about 1.7% of circulating), with four more tranches through March. In a thin market that can weigh on any bounce.
Bounce or dead-cat? A low-volume pop after a 68% slide can easily fade, so I'd want to see 0.0359 hold through the unlock before calling a bottom. Small caps like this move fast both ways, size accordingly.
Do you think STRK holds 0.036 into Nov 15?
Not financial advice.
#Starknet #STRK #Altcoins
Now around $0.0388 (+0.5% over 24h). Zoom out and the picture is rough: roughly -68% from the $0.1232 daily close 30 days ago, and -5.2% on the week.
What I'm watching:
• Volume: $4.6M on Binance spot in 24h, about 17% above the 7-day average. A pulse, but nowhere near the $100M+ day in mid-October. Interest has drained out.
• Levels: $0.0359 is the line in the sand. Reclaiming the 24h high at $0.0398 would be the first small win; the weekly high at $0.0452 is the real test.
• Supply: the next monthly unlock of 127M STRK lands Nov 15 (about 1.7% of circulating), with four more tranches through March. In a thin market that can weigh on any bounce.
Bounce or dead-cat? A low-volume pop after a 68% slide can easily fade, so I'd want to see 0.0359 hold through the unlock before calling a bottom. Small caps like this move fast both ways, size accordingly.
Do you think STRK holds 0.036 into Nov 15?
Not financial advice.
#Starknet #STRK #Altcoins
15
🔴 $STRK BEARS ARE CRACKING RESISTANCE AND EYEING A DEEP LIQUIDITY FLUSH! 📉
Entry: 0.0382 - 0.0390 ⚡
Target: 0.0355 🚀
Stop Loss: 0.0420 ⚠️
Sellers are firmly in control as price rejects hard against overhead supply, leaving a trail of exhausted bids in its wake. 📊 Order flow shows aggressive distribution right below resistance while volume profile confirms a lack of buying momentum. ⚡
Patience pays when the trend flips and supply zones hold firm like concrete. 🔍 Are you looking to ride this downside continuation or waiting for a deeper flush before stepping in? 👇
⚠️ Not financial advice. Always manage your risk. 🛡️
🏷️ #STRK #ShortSetup #Bearish #OrderFlow #Crypto
📉 🩸
🔴 $STRK BEARS ARE CRACKING RESISTANCE AND EYEING A DEEP LIQUIDITY FLUSH! 📉
Entry: 0.0382 - 0.0390 ⚡
Target: 0.0355 🚀
Stop Loss: 0.0420 ⚠️
Sellers are firmly in control as price rejects hard against overhead supply, leaving a trail of exhausted bids in its wake. 📊 Order flow shows aggressive distribution right below resistance while volume profile confirms a lack of buying momentum. ⚡
Patience pays when the trend flips and supply zones hold firm like concrete. 🔍 Are you looking to ride this downside continuation or waiting for a deeper flush before stepping in? 👇
⚠️ Not financial advice. Always manage your risk. 🛡️
🏷️ #STRK #ShortSetup #Bearish #OrderFlow #Crypto
📉 🩸
Entry: 0.0382 - 0.0390 ⚡
Target: 0.0355 🚀
Stop Loss: 0.0420 ⚠️
Sellers are firmly in control as price rejects hard against overhead supply, leaving a trail of exhausted bids in its wake. 📊 Order flow shows aggressive distribution right below resistance while volume profile confirms a lack of buying momentum. ⚡
Patience pays when the trend flips and supply zones hold firm like concrete. 🔍 Are you looking to ride this downside continuation or waiting for a deeper flush before stepping in? 👇
⚠️ Not financial advice. Always manage your risk. 🛡️
🏷️ #STRK #ShortSetup #Bearish #OrderFlow #Crypto
📉 🩸
12

$STRK Coin Price Prediction 🔥🚀💥⚡☠️
If you invest $ 1,000.00 in StarkNet today and hold until Mar 08, 2027, our prediction suggests you could see a potential profit of $ 1,813.56, reflecting a 181.36% ROI over the next 152 days.
The coin is in a dip right now, so it can be a good buying opportunity for quick investment.
Price Prediction 2026
After the analysis of the prices of in previous years, it is assumed that in 2026, the minimum price of will be around $0.1182 The maximum expected STRK price may be around $0.4281. On average, the trading price might be $0.2518 in 2026.
Price Prediction 2027
Based on the technical analysis by cryptocurrency experts regarding the prices of , in 2027, STRK is expected to have the following minimum and maximum prices: about $0.4847 and $0.6833, respectively. The average expected trading cost is $0.5989.
Price Prediction 2028
The experts in the field of cryptocurrency have analyzed the prices of and their fluctuations during the previous years. It is assumed that in 2028, the minimum STRK price might drop to $0.5710, while its maximum can reach $0.7746. On average, the trading cost will be around $0.7410.
Stay tuned for more updates ❤
#strk
$STRK Coin Price Prediction 🔥🚀💥⚡☠️
If you invest $ 1,000.00 in StarkNet today and hold until Mar 08, 2027, our prediction suggests you could see a potential profit of $ 1,813.56, reflecting a 181.36% ROI over the next 152 days.
The coin is in a dip right now, so it can be a good buying opportunity for quick investment.
Price Prediction 2026
After the analysis of the prices of in previous years, it is assumed that in 2026, the minimum price of will be around $0.1182 The maximum expected STRK price may be around $0.4281. On average, the trading price might be $0.2518 in 2026.
Price Prediction 2027
Based on the technical analysis by cryptocurrency experts regarding the prices of , in 2027, STRK is expected to have the following minimum and maximum prices: about $0.4847 and $0.6833, respectively. The average expected trading cost is $0.5989.
Price Prediction 2028
The experts in the field of cryptocurrency have analyzed the prices of and their fluctuations during the previous years. It is assumed that in 2028, the minimum STRK price might drop to $0.5710, while its maximum can reach $0.7746. On average, the trading cost will be around $0.7410.
Stay tuned for more updates ❤
#strk
If you invest $ 1,000.00 in StarkNet today and hold until Mar 08, 2027, our prediction suggests you could see a potential profit of $ 1,813.56, reflecting a 181.36% ROI over the next 152 days.
The coin is in a dip right now, so it can be a good buying opportunity for quick investment.
Price Prediction 2026
After the analysis of the prices of in previous years, it is assumed that in 2026, the minimum price of will be around $0.1182 The maximum expected STRK price may be around $0.4281. On average, the trading price might be $0.2518 in 2026.
Price Prediction 2027
Based on the technical analysis by cryptocurrency experts regarding the prices of , in 2027, STRK is expected to have the following minimum and maximum prices: about $0.4847 and $0.6833, respectively. The average expected trading cost is $0.5989.
Price Prediction 2028
The experts in the field of cryptocurrency have analyzed the prices of and their fluctuations during the previous years. It is assumed that in 2028, the minimum STRK price might drop to $0.5710, while its maximum can reach $0.7746. On average, the trading cost will be around $0.7410.
Stay tuned for more updates ❤
#strk

Lazaro Palowoda ygaF:
Rác nhân loại
1
6
5.7k
·
--
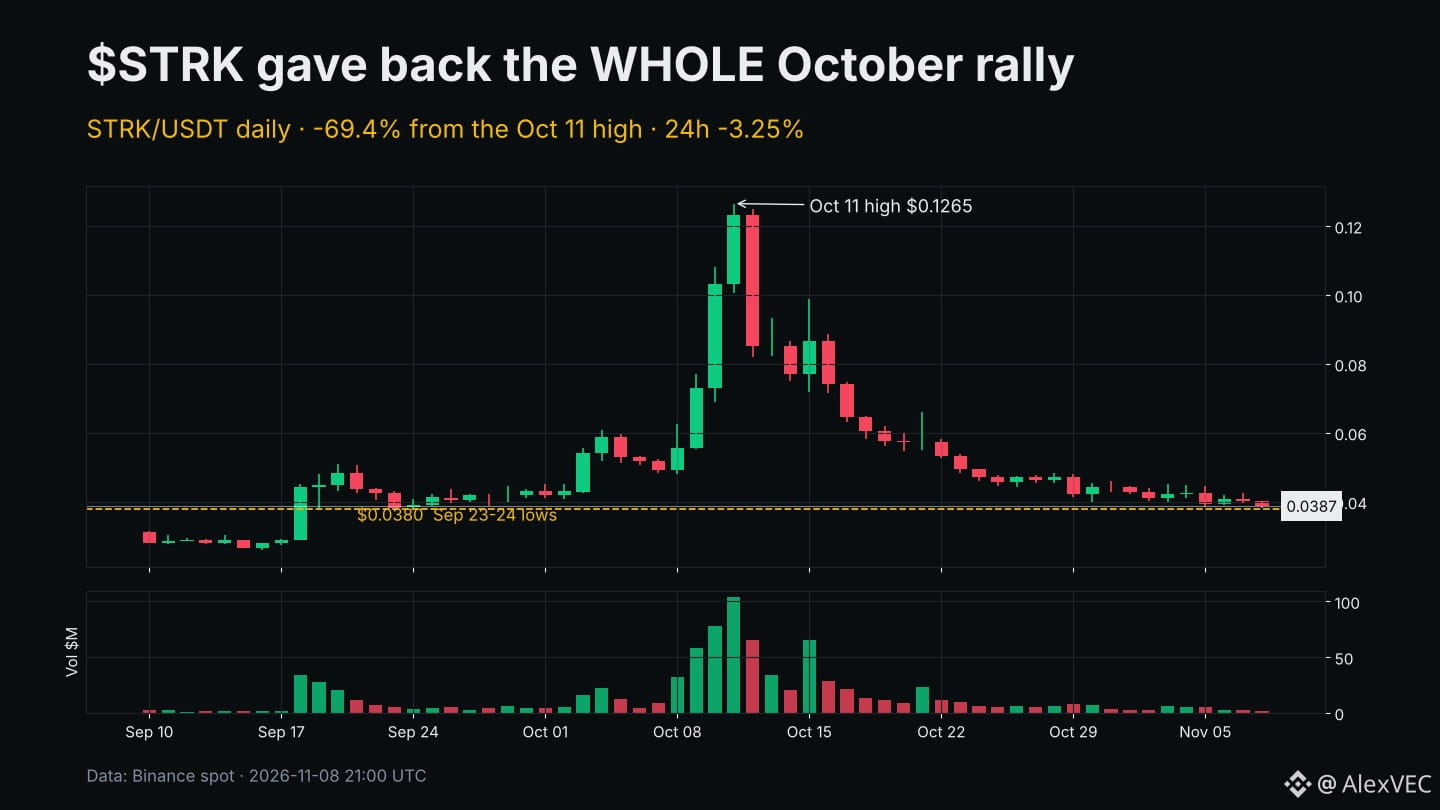
$STRK just gave back the WHOLE October rally.
Price is $0.0387, down 69% from the Oct 11 high at $0.1265 and back below where it traded on Oct 1. Today's low of $0.0382 sits right on the Sep 23–24 lows near $0.0380, which is the floor the October move launched from.
What stands out to me:
• Volume has dried up. About $1.8M traded on Binance spot in the last 24h. On Oct 11 it was over $100M in a single day. Sellers aren't panicking, but buyers aren't showing up either.
• Down 9.6% on the week and 3.3% on the day, with lower highs almost every session since mid-October.
• Supply is the elephant in the room. The next monthly unlock of 127M STRK (about 1.7% of circulating supply) is scheduled for Nov 15, and more tranches follow through March 2027.
Levels I'm watching: $0.0380 as the last line of September support. Above, $0.0400–0.0405 is the first lid, then the $0.0425–0.0450 early-November range.
Holding $0.0380 into the unlock would say a lot about demand. Losing it on daily closes opens the gap toward the September base.
Low-cap, unlock-heavy coins can move fast in both directions, so size accordingly.
Does $0.0380 hold before Nov 15, or does the unlock push it lower?
Not financial advice.
#Starknet #STRK #Altcoins
$STRK just gave back the WHOLE October rally.
Price is $0.0387, down 69% from the Oct 11 high at $0.1265 and back below where it traded on Oct 1. Today's low of $0.0382 sits right on the Sep 23–24 lows near $0.0380, which is the floor the October move launched from.
What stands out to me:
• Volume has dried up. About $1.8M traded on Binance spot in the last 24h. On Oct 11 it was over $100M in a single day. Sellers aren't panicking, but buyers aren't showing up either.
• Down 9.6% on the week and 3.3% on the day, with lower highs almost every session since mid-October.
• Supply is the elephant in the room. The next monthly unlock of 127M STRK (about 1.7% of circulating supply) is scheduled for Nov 15, and more tranches follow through March 2027.
Levels I'm watching: $0.0380 as the last line of September support. Above, $0.0400–0.0405 is the first lid, then the $0.0425–0.0450 early-November range.
Holding $0.0380 into the unlock would say a lot about demand. Losing it on daily closes opens the gap toward the September base.
Low-cap, unlock-heavy coins can move fast in both directions, so size accordingly.
Does $0.0380 hold before Nov 15, or does the unlock push it lower?
Not financial advice.
#Starknet #STRK #Altcoins
Price is $0.0387, down 69% from the Oct 11 high at $0.1265 and back below where it traded on Oct 1. Today's low of $0.0382 sits right on the Sep 23–24 lows near $0.0380, which is the floor the October move launched from.
What stands out to me:
• Volume has dried up. About $1.8M traded on Binance spot in the last 24h. On Oct 11 it was over $100M in a single day. Sellers aren't panicking, but buyers aren't showing up either.
• Down 9.6% on the week and 3.3% on the day, with lower highs almost every session since mid-October.
• Supply is the elephant in the room. The next monthly unlock of 127M STRK (about 1.7% of circulating supply) is scheduled for Nov 15, and more tranches follow through March 2027.
Levels I'm watching: $0.0380 as the last line of September support. Above, $0.0400–0.0405 is the first lid, then the $0.0425–0.0450 early-November range.
Holding $0.0380 into the unlock would say a lot about demand. Losing it on daily closes opens the gap toward the September base.
Low-cap, unlock-heavy coins can move fast in both directions, so size accordingly.
Does $0.0380 hold before Nov 15, or does the unlock push it lower?
Not financial advice.
#Starknet #STRK #Altcoins
24

·
--
$STRK sits 5.5 percent under $0.04059 right now
An hourly close above that resistance flips momentum
Failure to clear it keeps the pressure on $0.03828 support
Tap $STRK and check the hourly chart yourself
Break or reject? 👀
#STRK #PriceAction
$STRK sits 5.5 percent under $0.04059 right now
An hourly close above that resistance flips momentum
Failure to clear it keeps the pressure on $0.03828 support
Tap $STRK and check the hourly chart yourself
Break or reject? 👀
#STRK #PriceAction
An hourly close above that resistance flips momentum
Failure to clear it keeps the pressure on $0.03828 support
Tap $STRK and check the hourly chart yourself
Break or reject? 👀
#STRK #PriceAction
1
·
--
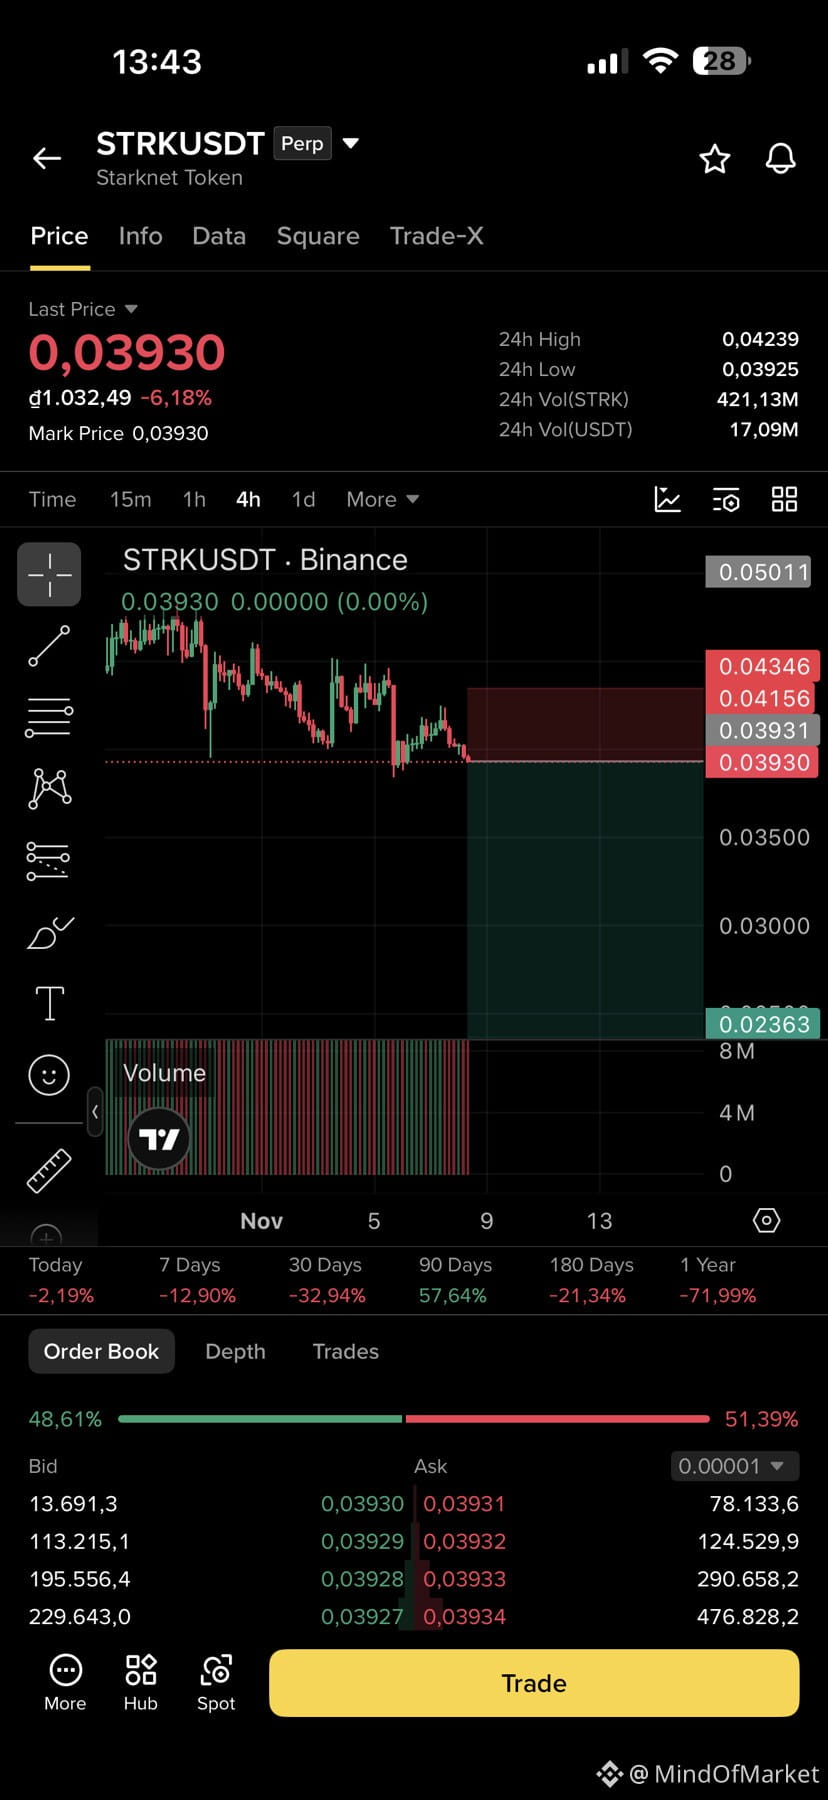
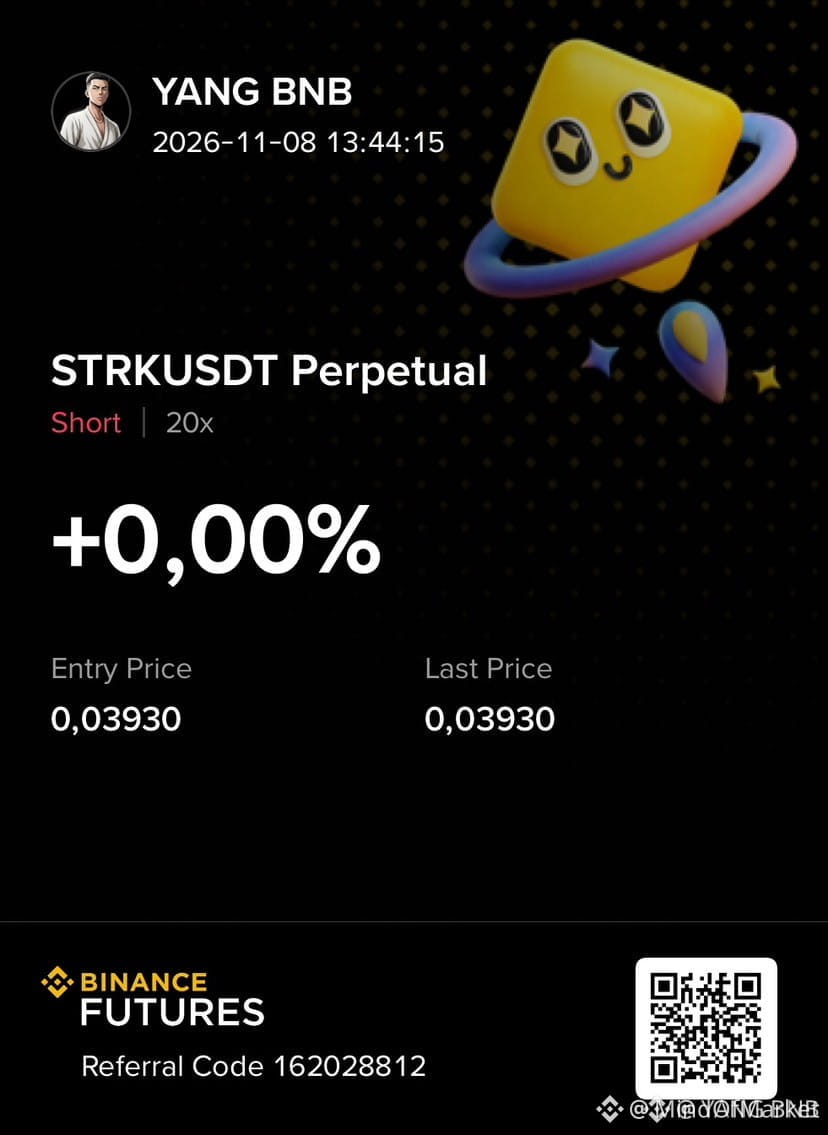
🚨 $STRK READY FOR A SHARP DISTRIBUTION DROP INTO LIQUIDITY! 📉
Entry: 0.03931 ⚡
Target: 0.02363 🎯
Institutional order flow on $STRK reveals heavy supply rejection around the 0.03931 threshold, setting up a pristine distribution phase. 📊 Smart money is aggressively filling sell-side imbalances as momentum shifts in favor of the bears toward lower structural liquidity pools. 🌊
The inefficiency overhead leaves little room for retail bids, clearing a clean structural path for a retest of the deeper demand shelf at 0.02363. 💡 Are you positioned for this continuation downside or waiting for a mid-range consolidation? 🤔
⚠️ Not financial advice. Always manage your risk. 🛡️
🏷️ #STRK #ShortSetup #MarketStructure #Crypto
📉 🦈
🚨 $STRK READY FOR A SHARP DISTRIBUTION DROP INTO LIQUIDITY! 📉
Entry: 0.03931 ⚡
Target: 0.02363 🎯
Institutional order flow on $STRK reveals heavy supply rejection around the 0.03931 threshold, setting up a pristine distribution phase. 📊 Smart money is aggressively filling sell-side imbalances as momentum shifts in favor of the bears toward lower structural liquidity pools. 🌊
The inefficiency overhead leaves little room for retail bids, clearing a clean structural path for a retest of the deeper demand shelf at 0.02363. 💡 Are you positioned for this continuation downside or waiting for a mid-range consolidation? 🤔
⚠️ Not financial advice. Always manage your risk. 🛡️
🏷️ #STRK #ShortSetup #MarketStructure #Crypto
📉 🦈
Entry: 0.03931 ⚡
Target: 0.02363 🎯
Institutional order flow on $STRK reveals heavy supply rejection around the 0.03931 threshold, setting up a pristine distribution phase. 📊 Smart money is aggressively filling sell-side imbalances as momentum shifts in favor of the bears toward lower structural liquidity pools. 🌊
The inefficiency overhead leaves little room for retail bids, clearing a clean structural path for a retest of the deeper demand shelf at 0.02363. 💡 Are you positioned for this continuation downside or waiting for a mid-range consolidation? 🤔
⚠️ Not financial advice. Always manage your risk. 🛡️
🏷️ #STRK #ShortSetup #MarketStructure #Crypto
📉 🦈
14

·
--
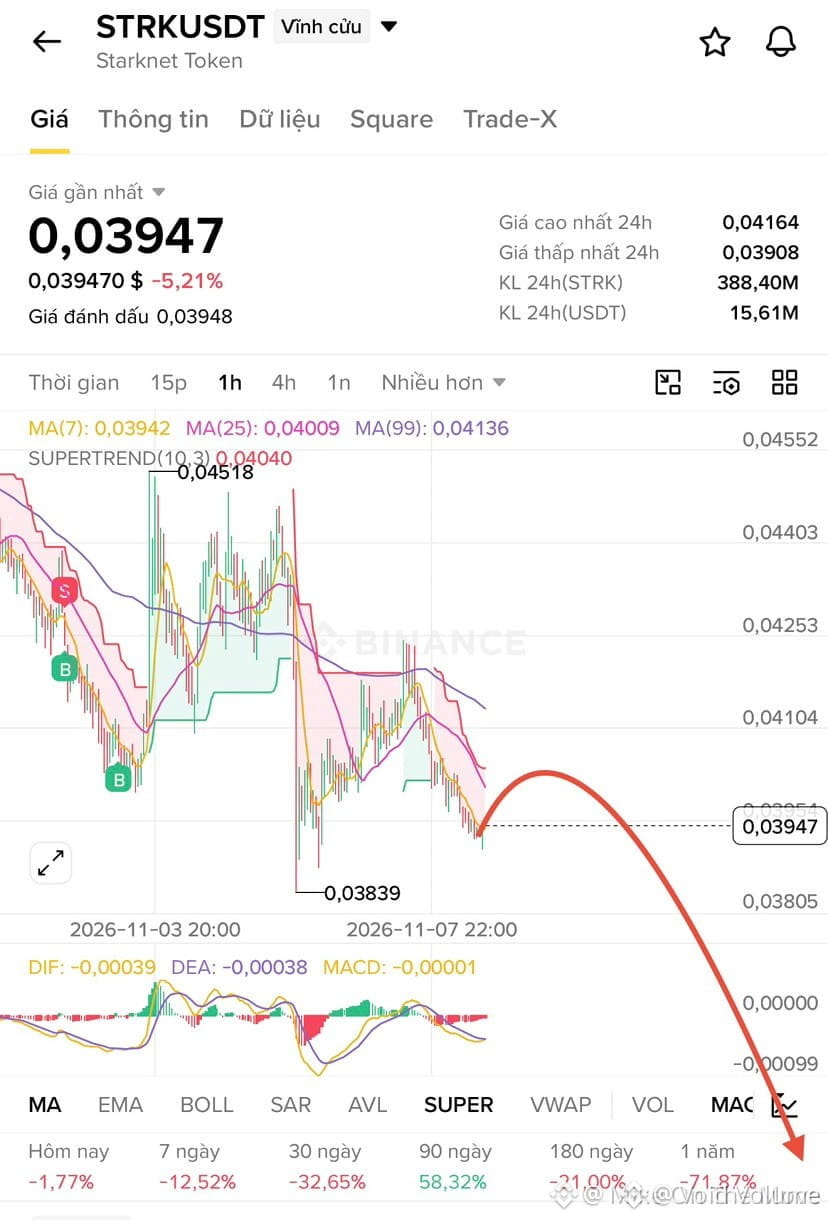
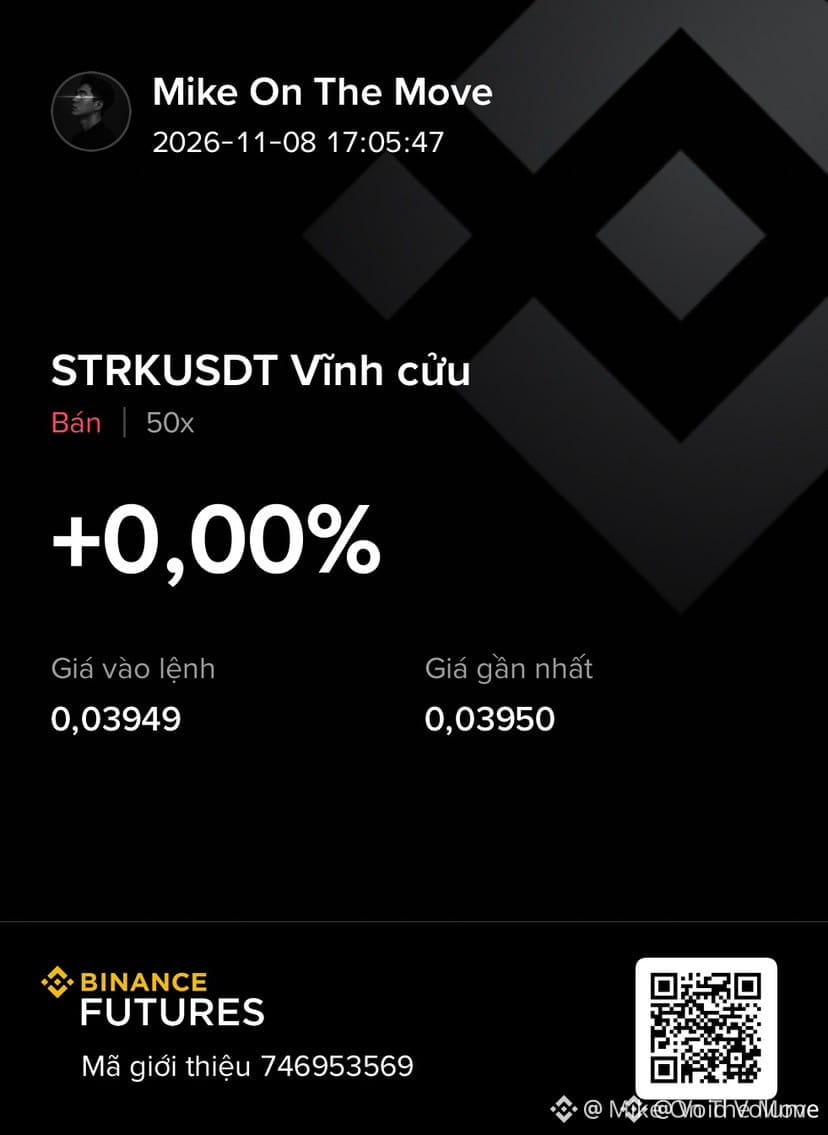
$STRK REJECTING MAJOR RESISTANCE AS SMART MONEY PREPARES FOR A DOWNSIDE SWEEP. 📉 🦈
Entry: 0.0390 - 0.0398 ⚡
Target: 0.0362 🚀
Stop Loss: 0.0430 ⚠️
Price action is currently rejecting an established institutional supply cluster, leaving a clean fair value gap overhead. Smart money distribution is active as passive bids thin out beneath the recent range high. 📊
A sustained breakdown through local structural support will likely sweep trapped long liquidity, accelerating downward momentum toward our primary downside objectives. 🌊
Are you positioning for this bearish continuation now or waiting for confirmation? 💬
⚠️ Not financial advice. Always manage your risk. 🛡️
🏷️ #STRK #ShortSetup #MarketStructure #OrderFlow
🦈 📉
$STRK REJECTING MAJOR RESISTANCE AS SMART MONEY PREPARES FOR A DOWNSIDE SWEEP. 📉 🦈
Entry: 0.0390 - 0.0398 ⚡
Target: 0.0362 🚀
Stop Loss: 0.0430 ⚠️
Price action is currently rejecting an established institutional supply cluster, leaving a clean fair value gap overhead. Smart money distribution is active as passive bids thin out beneath the recent range high. 📊
A sustained breakdown through local structural support will likely sweep trapped long liquidity, accelerating downward momentum toward our primary downside objectives. 🌊
Are you positioning for this bearish continuation now or waiting for confirmation? 💬
⚠️ Not financial advice. Always manage your risk. 🛡️
🏷️ #STRK #ShortSetup #MarketStructure #OrderFlow
🦈 📉
Entry: 0.0390 - 0.0398 ⚡
Target: 0.0362 🚀
Stop Loss: 0.0430 ⚠️
Price action is currently rejecting an established institutional supply cluster, leaving a clean fair value gap overhead. Smart money distribution is active as passive bids thin out beneath the recent range high. 📊
A sustained breakdown through local structural support will likely sweep trapped long liquidity, accelerating downward momentum toward our primary downside objectives. 🌊
Are you positioning for this bearish continuation now or waiting for confirmation? 💬
⚠️ Not financial advice. Always manage your risk. 🛡️
🏷️ #STRK #ShortSetup #MarketStructure #OrderFlow
🦈 📉
13
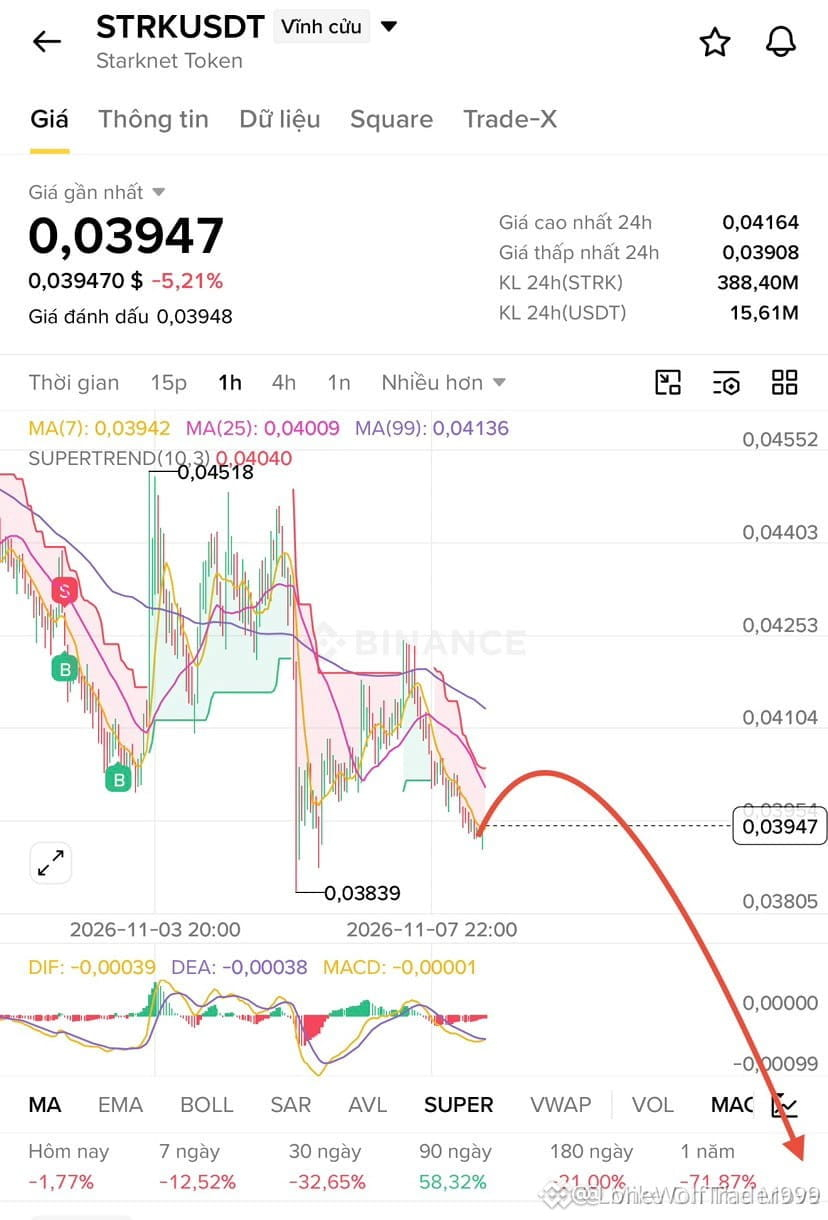
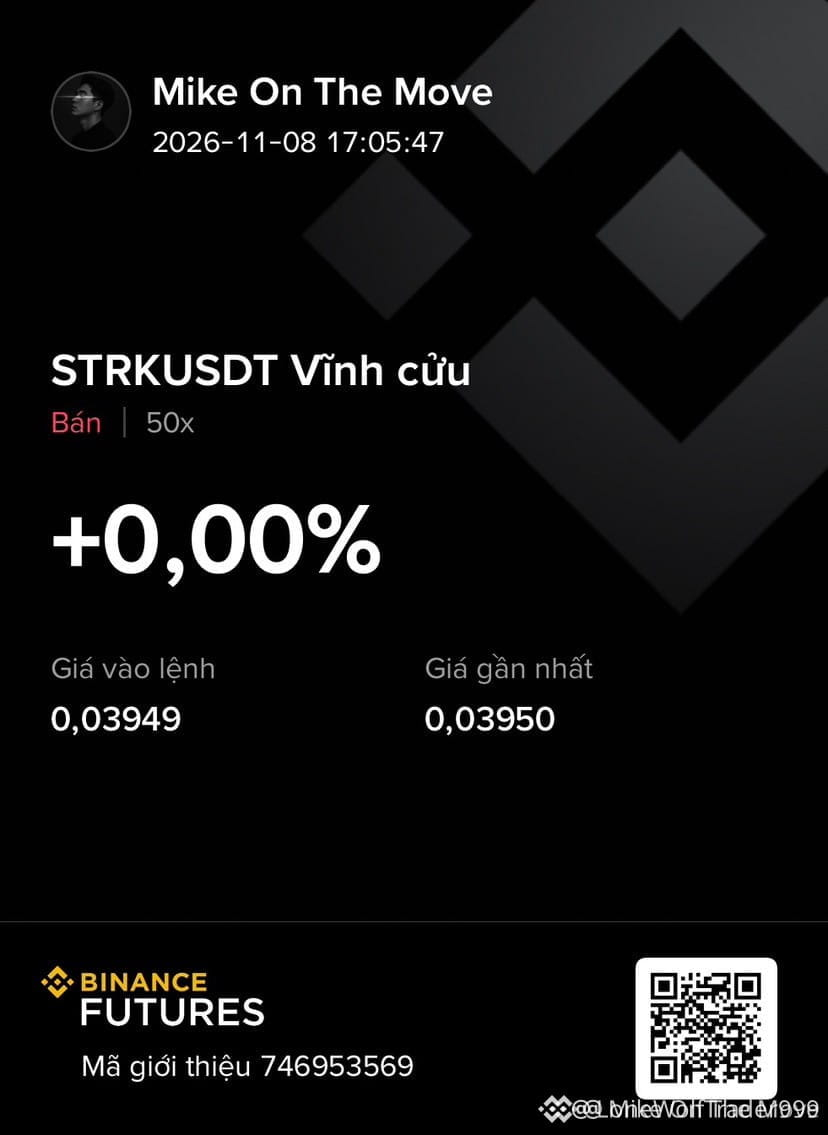
🔴 $STRK BEARISH MOMENTUM ACCELERATES AS SELLERS DEFEND KEY RESISTANCE! 📉
Entry: 0.0390 - 0.0398 ⚡
Target: 0.0362 🚀
Stop Loss: 0.0430 ⚠️
Bulls are completely losing their grip here as selling pressure stacks up against overhead resistance. Price action is breaking down cleanly through short-term structures, signaling a clear shift in control back to the bears. 📊
Volume profiles show aggressive distribution near the upper bound of this supply zone, leaving little room for a sustained recovery. We are tracking a clean downside continuation toward lower liquidity pockets. ⚡
💬 Are you positioning for this continuation or waiting for a deeper retest? 👇
⚠️ Not financial advice. Always manage your risk. 🛡️
🏷️ #STRK #ShortSetup #Crypto #MarketDownturn
📉 🦈
🔴 $STRK BEARISH MOMENTUM ACCELERATES AS SELLERS DEFEND KEY RESISTANCE! 📉
Entry: 0.0390 - 0.0398 ⚡
Target: 0.0362 🚀
Stop Loss: 0.0430 ⚠️
Bulls are completely losing their grip here as selling pressure stacks up against overhead resistance. Price action is breaking down cleanly through short-term structures, signaling a clear shift in control back to the bears. 📊
Volume profiles show aggressive distribution near the upper bound of this supply zone, leaving little room for a sustained recovery. We are tracking a clean downside continuation toward lower liquidity pockets. ⚡
💬 Are you positioning for this continuation or waiting for a deeper retest? 👇
⚠️ Not financial advice. Always manage your risk. 🛡️
🏷️ #STRK #ShortSetup #Crypto #MarketDownturn
📉 🦈
Entry: 0.0390 - 0.0398 ⚡
Target: 0.0362 🚀
Stop Loss: 0.0430 ⚠️
Bulls are completely losing their grip here as selling pressure stacks up against overhead resistance. Price action is breaking down cleanly through short-term structures, signaling a clear shift in control back to the bears. 📊
Volume profiles show aggressive distribution near the upper bound of this supply zone, leaving little room for a sustained recovery. We are tracking a clean downside continuation toward lower liquidity pockets. ⚡
💬 Are you positioning for this continuation or waiting for a deeper retest? 👇
⚠️ Not financial advice. Always manage your risk. 🛡️
🏷️ #STRK #ShortSetup #Crypto #MarketDownturn
📉 🦈
9

·
--
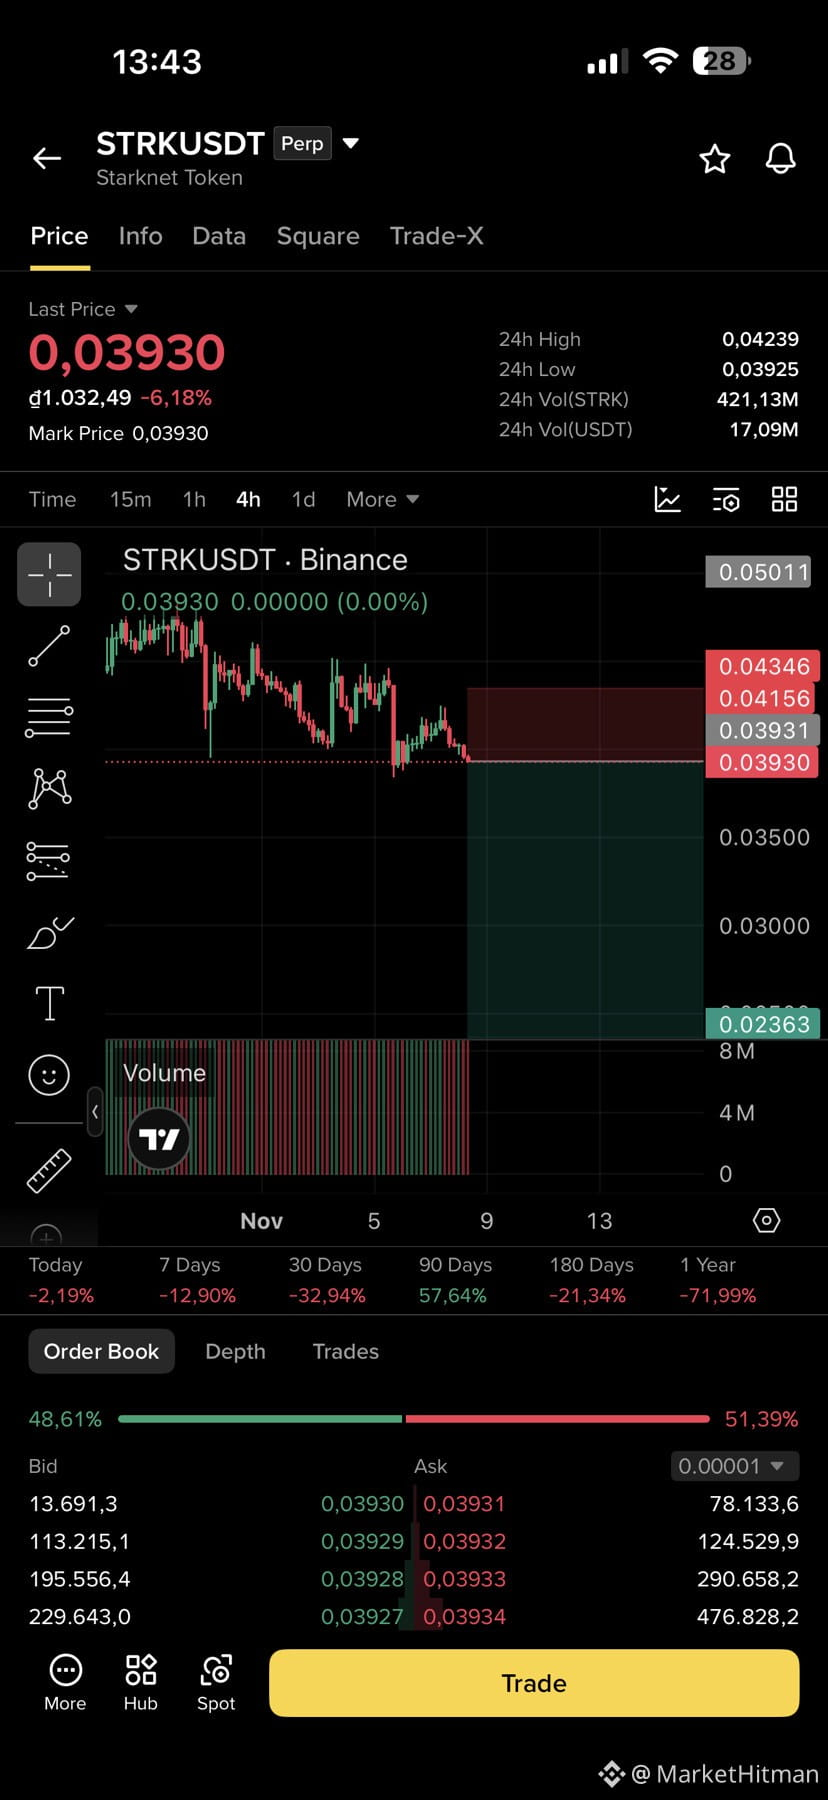
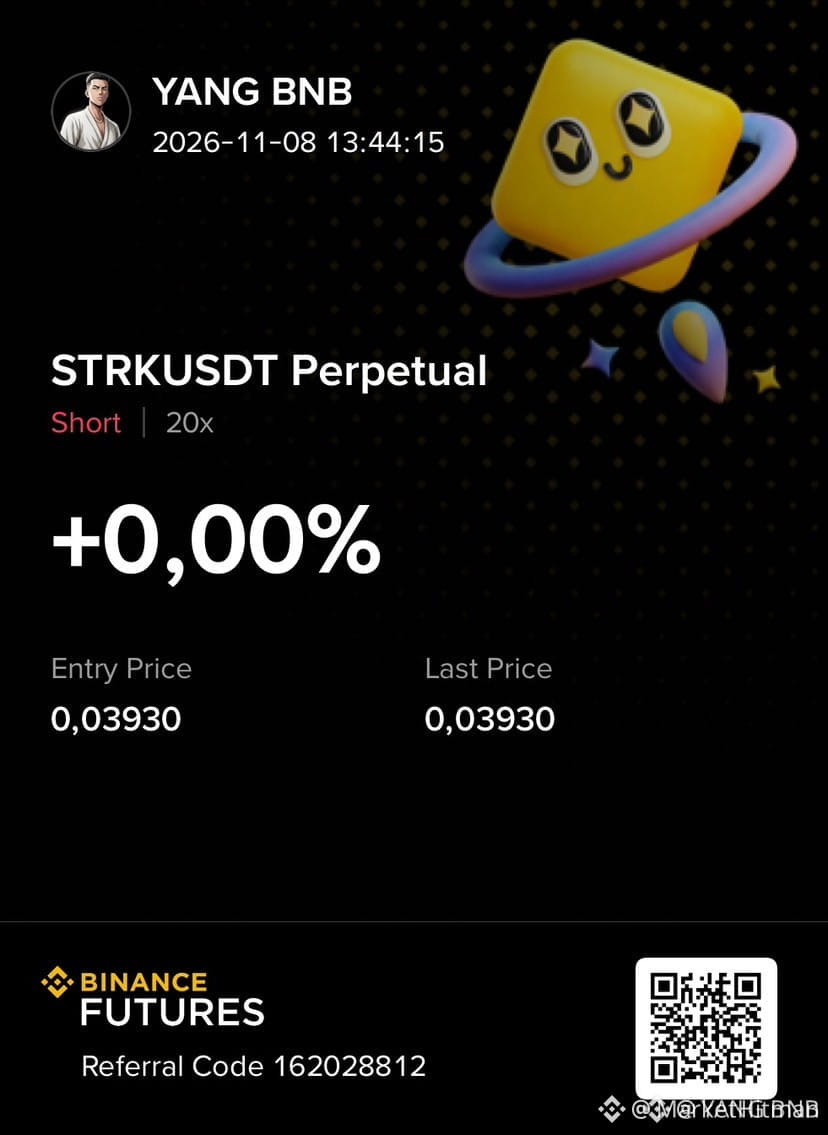
🔴 $STRK BEARISH MOMENTUM ACCELERATES AS SELLERS SEIZE TOTAL CONTROL! 📉
Entry: 0.03931 ⚡
Target: 0.02363 🎯
Sellers are pressing their advantage hard after breaking key structural support on high timeframe charts. Order flow shows aggressive distribution taking place right at current resistance as supply heavily outweighs demand. 📊
This downside continuation model points straight toward deeper liquidity pockets below. Momentum oscillators confirm heavy selling pressure with zero signs of buyer absorption yet. ⚡
Are you riding this downside wave down to the lower targets or waiting for a relief bounce? 🤔
⚠️ Not financial advice. Always manage your risk. 🛡️
🏷️ #STRK #ShortSetup #Bearish #OrderFlow
📉 🦈
🔴 $STRK BEARISH MOMENTUM ACCELERATES AS SELLERS SEIZE TOTAL CONTROL! 📉
Entry: 0.03931 ⚡
Target: 0.02363 🎯
Sellers are pressing their advantage hard after breaking key structural support on high timeframe charts. Order flow shows aggressive distribution taking place right at current resistance as supply heavily outweighs demand. 📊
This downside continuation model points straight toward deeper liquidity pockets below. Momentum oscillators confirm heavy selling pressure with zero signs of buyer absorption yet. ⚡
Are you riding this downside wave down to the lower targets or waiting for a relief bounce? 🤔
⚠️ Not financial advice. Always manage your risk. 🛡️
🏷️ #STRK #ShortSetup #Bearish #OrderFlow
📉 🦈
Entry: 0.03931 ⚡
Target: 0.02363 🎯
Sellers are pressing their advantage hard after breaking key structural support on high timeframe charts. Order flow shows aggressive distribution taking place right at current resistance as supply heavily outweighs demand. 📊
This downside continuation model points straight toward deeper liquidity pockets below. Momentum oscillators confirm heavy selling pressure with zero signs of buyer absorption yet. ⚡
Are you riding this downside wave down to the lower targets or waiting for a relief bounce? 🤔
⚠️ Not financial advice. Always manage your risk. 🛡️
🏷️ #STRK #ShortSetup #Bearish #OrderFlow
📉 🦈
18
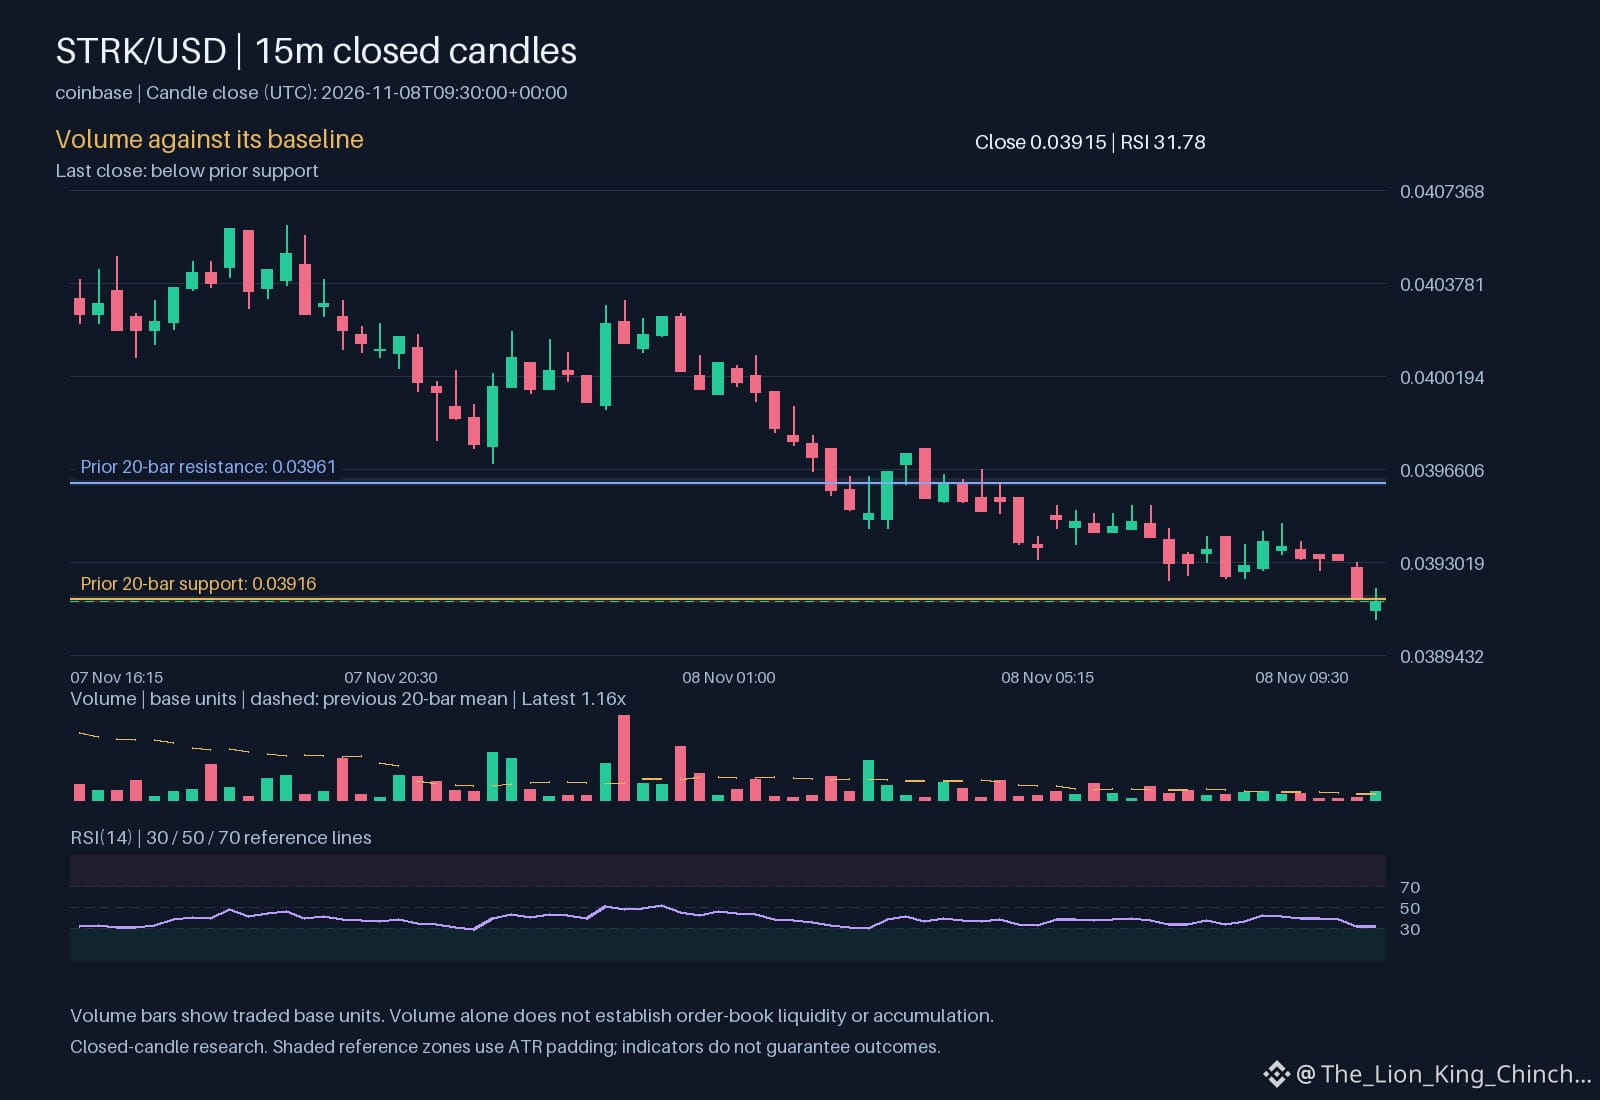
$STRK: STRK: Myth‑Busting Volume Assumptions
**Question**
Why do many traders treat a spike in volume as a guarantee that a down move will keep falling?
**Answer**
The belief stems from a shortcut: higher than normal volume, shown by 1.16398, is taken as a sign of strong commitment. In reality, volume alone does not tell who is on the aggressive side. It only indicates that more contracts changed hands than usual. If the market is already below support and the hourly direction is down, the extra trades may simply be sellers closing positions, or buyers stepping in at lower levels. The key mechanism is imbalance. When sellers dominate, price pressure pushes lower, but if buyers start to appear, the same volume surge can turn into a short‑term rally. Therefore, the same volume figure can accompany both continuation and reversal.
**Where the Answer Stops Applying**
If the price is above a clear moving average and the trend is upward, the same volume surge may more reliably support a breakout. Conversely, when the asset is stuck below support, as $STRK currently is, the volume signal loses certainty. A practical way to reassess is to pair volume with a simple price‑action filter, such as checking whether the candle closes beyond the recent swing low. If it does, the volume may be confirming pressure; if not, treat the spike as ambiguous.
**Takeaway**
Volume is a clue, not a verdict. Combine it with price context before assuming certainty.
Probabilistic market research, not a recommendation or guaranteed return.
Which trading assumption would you like to question next?
#STRK #CryptoLearning
$STRK : STRK: Myth‑Busting Volume Assumptions
**Question**
Why do many traders treat a spike in volume as a guarantee that a down move will keep falling?
**Answer**
The belief stems from a shortcut: higher than normal volume, shown by 1.16398, is taken as a sign of strong commitment. In reality, volume alone does not tell who is on the aggressive side. It only indicates that more contracts changed hands than usual. If the market is already below support and the hourly direction is down, the extra trades may simply be sellers closing positions, or buyers stepping in at lower levels. The key mechanism is imbalance. When sellers dominate, price pressure pushes lower, but if buyers start to appear, the same volume surge can turn into a short‑term rally. Therefore, the same volume figure can accompany both continuation and reversal.
**Where the Answer Stops Applying**
If the price is above a clear moving average and the trend is upward, the same volume surge may more reliably support a breakout. Conversely, when the asset is stuck below support, as $STRK currently is, the volume signal loses certainty. A practical way to reassess is to pair volume with a simple price‑action filter, such as checking whether the candle closes beyond the recent swing low. If it does, the volume may be confirming pressure; if not, treat the spike as ambiguous.
**Takeaway**
Volume is a clue, not a verdict. Combine it with price context before assuming certainty.
Probabilistic market research, not a recommendation or guaranteed return.
Which trading assumption would you like to question next?
#STRK #CryptoLearning
**Question**
Why do many traders treat a spike in volume as a guarantee that a down move will keep falling?
**Answer**
The belief stems from a shortcut: higher than normal volume, shown by 1.16398, is taken as a sign of strong commitment. In reality, volume alone does not tell who is on the aggressive side. It only indicates that more contracts changed hands than usual. If the market is already below support and the hourly direction is down, the extra trades may simply be sellers closing positions, or buyers stepping in at lower levels. The key mechanism is imbalance. When sellers dominate, price pressure pushes lower, but if buyers start to appear, the same volume surge can turn into a short‑term rally. Therefore, the same volume figure can accompany both continuation and reversal.
**Where the Answer Stops Applying**
If the price is above a clear moving average and the trend is upward, the same volume surge may more reliably support a breakout. Conversely, when the asset is stuck below support, as $STRK currently is, the volume signal loses certainty. A practical way to reassess is to pair volume with a simple price‑action filter, such as checking whether the candle closes beyond the recent swing low. If it does, the volume may be confirming pressure; if not, treat the spike as ambiguous.
**Takeaway**
Volume is a clue, not a verdict. Combine it with price context before assuming certainty.
Probabilistic market research, not a recommendation or guaranteed return.
Which trading assumption would you like to question next?
#STRK #CryptoLearning
142
·
--
$STRK volume sits at 0.5x its weekly average and most people misread that completely
Price drops 6.0 percent today to $0.03934 but the low volume tells the real story
When a coin falls on weak volume it usually means sellers lack real conviction
You check this ratio yourself in 20 seconds by dividing today volume into the seven day average
A drop with heavy volume signals panic while a drop with half average volume just means nobody cares
Always check if the volume backs the move before you open any chart
Open $STRK and set an alert at that level
What is your favorite filter to spot fake moves
#STRK #TradingTips
$STRK volume sits at 0.5x its weekly average and most people misread that completely
Price drops 6.0 percent today to $0.03934 but the low volume tells the real story
When a coin falls on weak volume it usually means sellers lack real conviction
You check this ratio yourself in 20 seconds by dividing today volume into the seven day average
A drop with heavy volume signals panic while a drop with half average volume just means nobody cares
Always check if the volume backs the move before you open any chart
Open $STRK and set an alert at that level
What is your favorite filter to spot fake moves
#STRK #TradingTips
Price drops 6.0 percent today to $0.03934 but the low volume tells the real story
When a coin falls on weak volume it usually means sellers lack real conviction
You check this ratio yourself in 20 seconds by dividing today volume into the seven day average
A drop with heavy volume signals panic while a drop with half average volume just means nobody cares
Always check if the volume backs the move before you open any chart
Open $STRK and set an alert at that level
What is your favorite filter to spot fake moves
#STRK #TradingTips
4

·
--
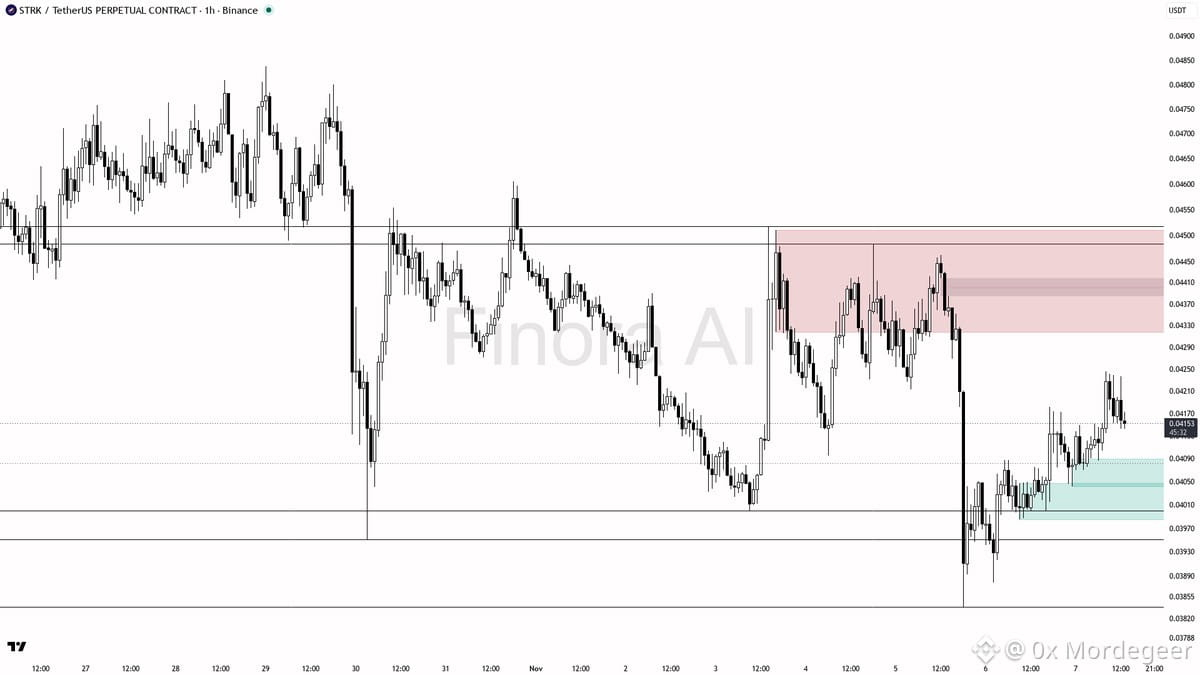
📊 $STRK Technical Analysis & Setup
$STRK is showing relative strength, gaining +2.6% over the last 24 hours despite recent BTC divergence. The 1h market structure maintains a short-term bullish edge as buyers step in on local dips.
• Key Support / Demand: $0.3800 and $0.3650
• Resistance / Supply Targets: $0.4150 and $0.4400
• Trigger / Confirmation: A clean 1h candle close above $0.4000 to confirm continuation
• Risk / Invalidation: A drop and close below $0.3550 breaks the structure
• Market Execution: Monitor order book depth and volume profiles closely before entry
Always manage your risk carefully and wait for confirmation.
DYOR — Educational setup, not financial advice.
#BinanceSquare #Crypto #STRK #Trading
$BTC
📊 $STRK Technical Analysis & Setup
$STRK is showing relative strength, gaining +2.6% over the last 24 hours despite recent BTC divergence. The 1h market structure maintains a short-term bullish edge as buyers step in on local dips.
• Key Support / Demand: $0.3800 and $0.3650
• Resistance / Supply Targets: $0.4150 and $0.4400
• Trigger / Confirmation: A clean 1h candle close above $0.4000 to confirm continuation
• Risk / Invalidation: A drop and close below $0.3550 breaks the structure
• Market Execution: Monitor order book depth and volume profiles closely before entry
Always manage your risk carefully and wait for confirmation.
DYOR — Educational setup, not financial advice.
#BinanceSquare #Crypto #STRK #Trading
$BTC
$STRK is showing relative strength, gaining +2.6% over the last 24 hours despite recent BTC divergence. The 1h market structure maintains a short-term bullish edge as buyers step in on local dips.
• Key Support / Demand: $0.3800 and $0.3650
• Resistance / Supply Targets: $0.4150 and $0.4400
• Trigger / Confirmation: A clean 1h candle close above $0.4000 to confirm continuation
• Risk / Invalidation: A drop and close below $0.3550 breaks the structure
• Market Execution: Monitor order book depth and volume profiles closely before entry
Always manage your risk carefully and wait for confirmation.
DYOR — Educational setup, not financial advice.
#BinanceSquare #Crypto #STRK #Trading
$BTC
72

·
--
$STRK #STRK 📉
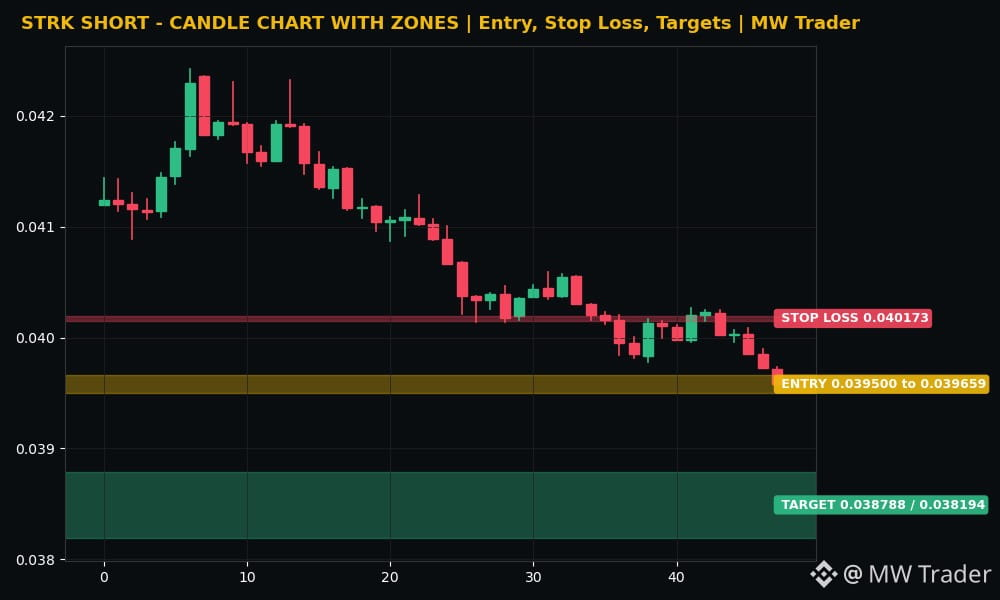
Direction: SHORT
Entry zone: 0.039500 to 0.039659
Stop loss: 0.040173
Target 1: 0.038788
Target 2: 0.038194
Starknet is trading near 0.03958 dollars, down 4.03 percent in 24 hours, inside a range of 0.0395599 to 0.0424224 dollars, and the recent closes show sellers in control with no real bounce, 0.04, then 0.04, then 0.0399, then 0.0397, then 0.0396. 🔴 My reading is that STRK is the weakest coin in my watchlist today, because it lost over 4 percent and is pinned at the very bottom of its range, and a coin sitting on its range low in a fear market usually breaks the low before it bounces. A short from the current zone, with a stop above 0.040173, targets 0.038788 first and then 0.038194 if sellers push through the range low. A rise above 0.040173 kills the idea without debate.
Futures trading is risky. Trade small, use a stop loss, and do your own research. This is my reading, not a guaranteed signal.
Does Starknet fall to 0.038788 first, or rise above 0.040173? 🤔
Follow for more trades.
#Starknet #Crypto #FuturesTrading #TradingSignals
$STRK #STRK 📉
Direction: SHORT
Entry zone: 0.039500 to 0.039659
Stop loss: 0.040173
Target 1: 0.038788
Target 2: 0.038194
Starknet is trading near 0.03958 dollars, down 4.03 percent in 24 hours, inside a range of 0.0395599 to 0.0424224 dollars, and the recent closes show sellers in control with no real bounce, 0.04, then 0.04, then 0.0399, then 0.0397, then 0.0396. 🔴 My reading is that STRK is the weakest coin in my watchlist today, because it lost over 4 percent and is pinned at the very bottom of its range, and a coin sitting on its range low in a fear market usually breaks the low before it bounces. A short from the current zone, with a stop above 0.040173, targets 0.038788 first and then 0.038194 if sellers push through the range low. A rise above 0.040173 kills the idea without debate.
Futures trading is risky. Trade small, use a stop loss, and do your own research. This is my reading, not a guaranteed signal.
Does Starknet fall to 0.038788 first, or rise above 0.040173? 🤔
Follow for more trades.
#Starknet #Crypto #FuturesTrading #TradingSignals
Direction: SHORT
Entry zone: 0.039500 to 0.039659
Stop loss: 0.040173
Target 1: 0.038788
Target 2: 0.038194
Starknet is trading near 0.03958 dollars, down 4.03 percent in 24 hours, inside a range of 0.0395599 to 0.0424224 dollars, and the recent closes show sellers in control with no real bounce, 0.04, then 0.04, then 0.0399, then 0.0397, then 0.0396. 🔴 My reading is that STRK is the weakest coin in my watchlist today, because it lost over 4 percent and is pinned at the very bottom of its range, and a coin sitting on its range low in a fear market usually breaks the low before it bounces. A short from the current zone, with a stop above 0.040173, targets 0.038788 first and then 0.038194 if sellers push through the range low. A rise above 0.040173 kills the idea without debate.
Futures trading is risky. Trade small, use a stop loss, and do your own research. This is my reading, not a guaranteed signal.
Does Starknet fall to 0.038788 first, or rise above 0.040173? 🤔
Follow for more trades.
#Starknet #Crypto #FuturesTrading #TradingSignals
8
Log in to explore more content
Join global crypto users on Binance Square
⚡️ Get latest and useful information about crypto.
💬 Trusted by the world’s largest crypto exchange.
👍 Discover real insights from verified creators.
Email / Phone number
Trending Topics
1
#CPITestsDecemberRateOutlook
689,087 views
3,041 Discussing
2
#NvidiaInvestigatesAfterHuang’sAffairApology
243,854 views
1,957 Discussing
3
#AnthropicRejectsIPODelayValuationinQuestion
57,179 views
546 Discussing
4
#US-IranTalksFuelStrongStockMarketRebound
4,002 views
75 Discussing
5
#BitcoinFiveWeeklyLosses
269,240 views
2,339 Discussing
6
#AIChipSlumpNasdaq
149,758 views
1,416 Discussing
7
#CryptoLiquidationsReach$1.16BIn24Hours
19,894 views
56 Discussing
8
#StrategyBuys1037BTCLastWeek
2,653 views
47 Discussing
9
#NYSEToUseAvalancheToSettleTokenizedStocks
1,697 views
30 Discussing
10
#TradFiForBeginners
376,198 views
2,657 Discussing