
#soxlb
soxlb
73,879 views
2,832 Discussing
Hot
Latest


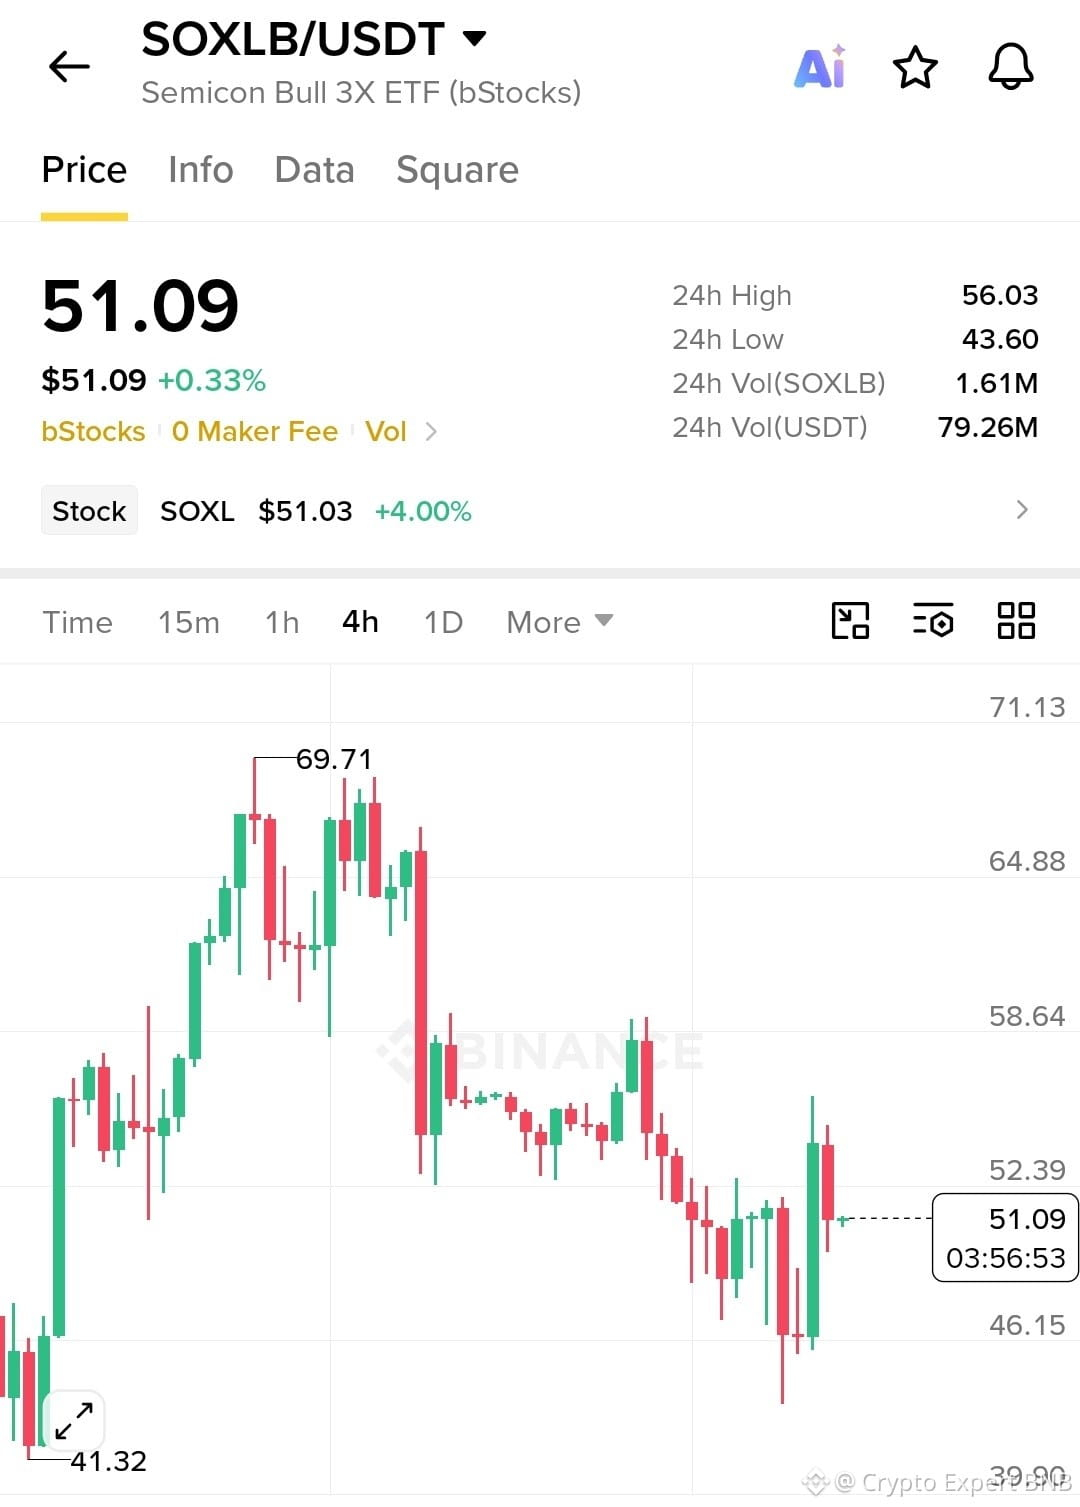
$SOXLB Market Snapshot 📊
Current Price: $51.09 (+0.33%)
24h Range: $43.60 – $56.03
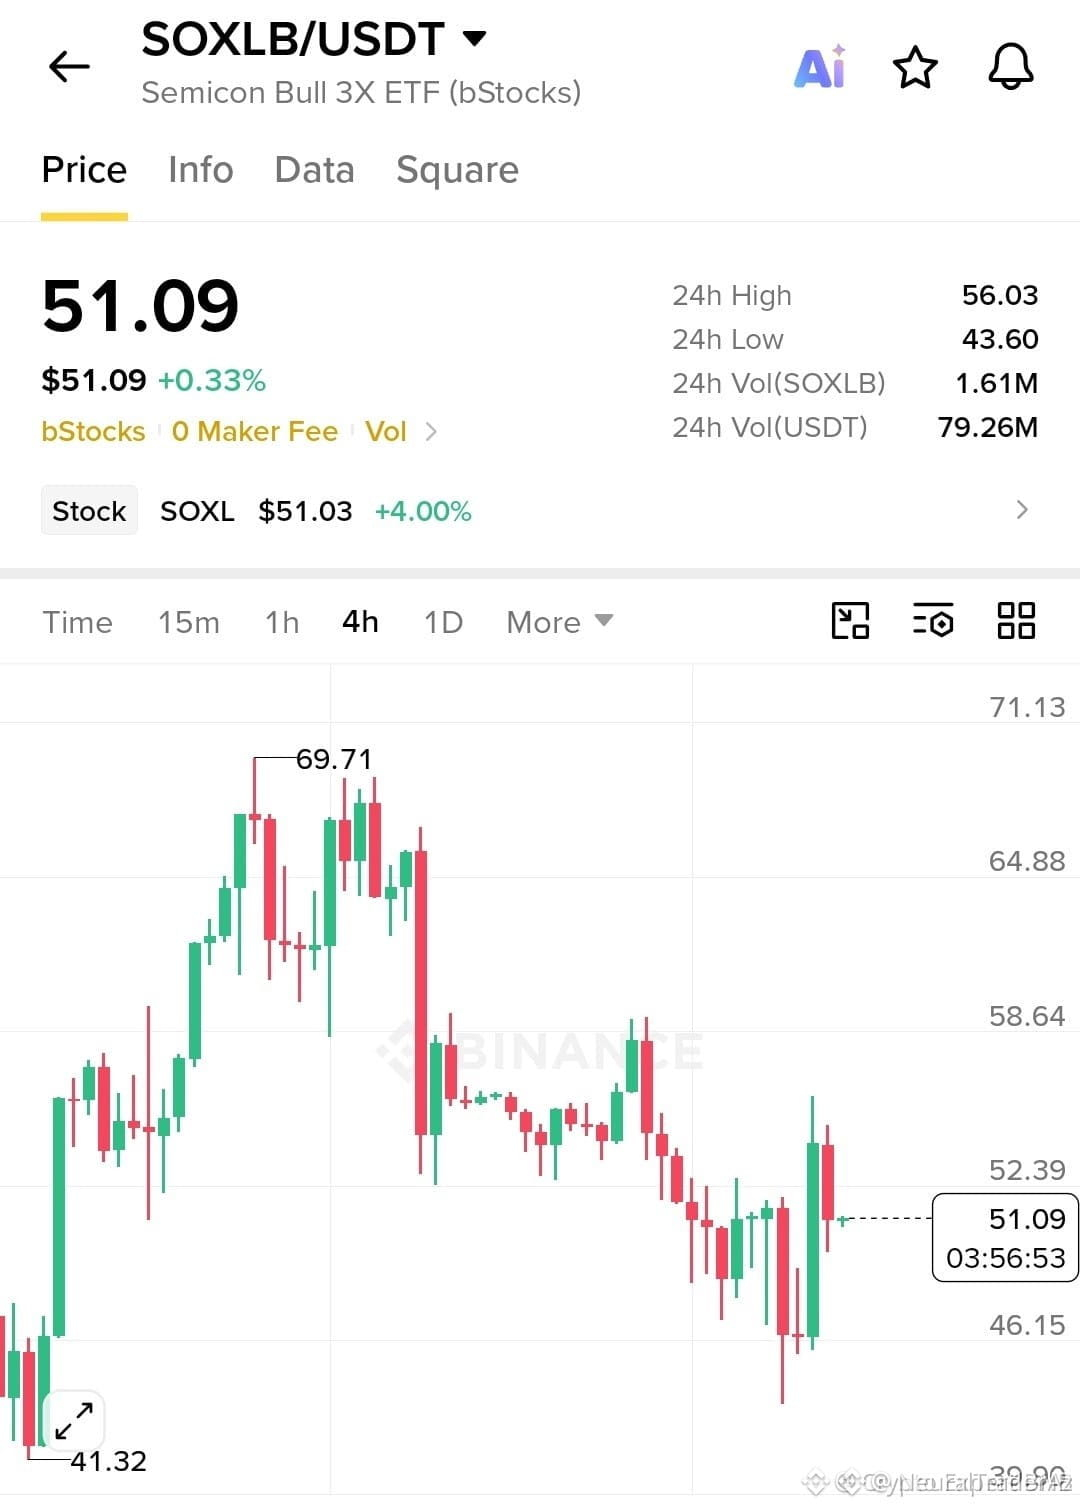
· Price is recovering from a steep selloff after topping at 69.71.
· Recent swing low near 41.32 found buyers; current bounce is testing the 52.39 resistance zone.
· Structure remains lower-highs/lower-lows on the 4H, but the latest green candle shows short-term momentum shifting.
· Key resistance: 52.39 → 58.64
· Key support: 46.15 → 41.32
Bias: Short-term bounce within a broader pullback. A clean break and hold above 52.39 could target 58.64; rejection risks retesting 46.15.
⚠️ 3x leveraged ETF high volatility, manage risk tightly.
#SOXLB #CryptoStocks $SOXLB
{spot}(SOXLBUSDT)
$SOXLB Market Snapshot 📊
Current Price: $51.09 (+0.33%)
24h Range: $43.60 – $56.03
· Price is recovering from a steep selloff after topping at 69.71.
· Recent swing low near 41.32 found buyers; current bounce is testing the 52.39 resistance zone.
· Structure remains lower-highs/lower-lows on the 4H, but the latest green candle shows short-term momentum shifting.
· Key resistance: 52.39 → 58.64
· Key support: 46.15 → 41.32
Bias: Short-term bounce within a broader pullback. A clean break and hold above 52.39 could target 58.64; rejection risks retesting 46.15.
⚠️ 3x leveraged ETF high volatility, manage risk tightly.
#SOXLB #CryptoStocks $SOXLB
Current Price: $51.09 (+0.33%)
24h Range: $43.60 – $56.03
· Price is recovering from a steep selloff after topping at 69.71.
· Recent swing low near 41.32 found buyers; current bounce is testing the 52.39 resistance zone.
· Structure remains lower-highs/lower-lows on the 4H, but the latest green candle shows short-term momentum shifting.
· Key resistance: 52.39 → 58.64
· Key support: 46.15 → 41.32
Bias: Short-term bounce within a broader pullback. A clean break and hold above 52.39 could target 58.64; rejection risks retesting 46.15.
⚠️ 3x leveraged ETF high volatility, manage risk tightly.
#SOXLB #CryptoStocks $SOXLB
1
2
373

·
--
$SOXLB
{spot}(SOXLBUSDT)
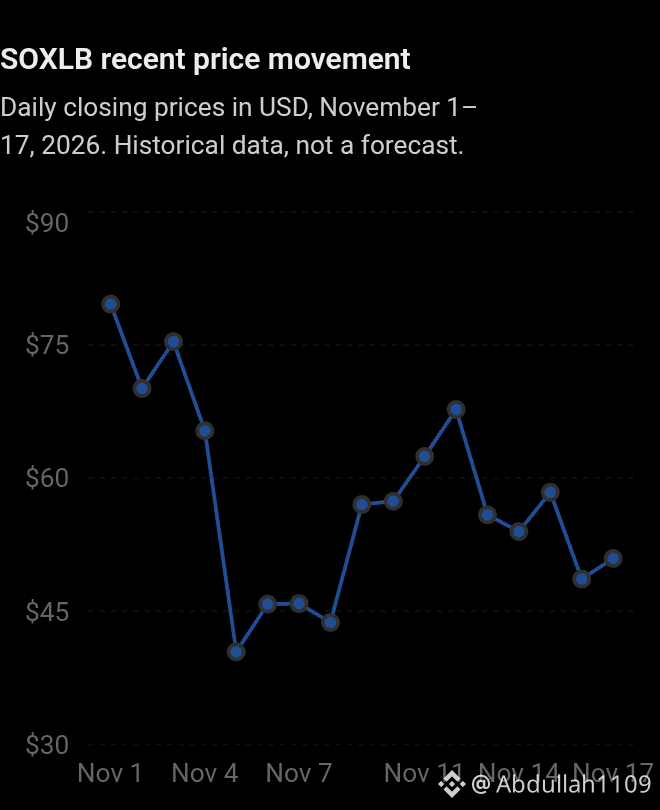
SOXLB has potential for recovery if semiconductor and technology stocks perform strongly, but its future remains highly uncertain. As of November 18, 2026, different market trackers show prices around $46–$51.
CoinMarketCap+1
SOXLB provides 3X leveraged exposure to semiconductor stocks, which means both profits and losses can be amplified. Its recent price history shows significant volatility and a substantial decline from its previous high of around $204.
CoinMarketCap+1
If semiconductor stocks recover, SOXLB could rise again, but another market decline could push it lower. My outlook is high-risk and speculative, so avoid investing money you cannot afford to lose.
#binance #squarecreator #soxlb
$SOXLB
SOXLB has potential for recovery if semiconductor and technology stocks perform strongly, but its future remains highly uncertain. As of November 18, 2026, different market trackers show prices around $46–$51.
CoinMarketCap+1
SOXLB provides 3X leveraged exposure to semiconductor stocks, which means both profits and losses can be amplified. Its recent price history shows significant volatility and a substantial decline from its previous high of around $204.
CoinMarketCap+1
If semiconductor stocks recover, SOXLB could rise again, but another market decline could push it lower. My outlook is high-risk and speculative, so avoid investing money you cannot afford to lose.
#binance #squarecreator #soxlb
SOXLB has potential for recovery if semiconductor and technology stocks perform strongly, but its future remains highly uncertain. As of November 18, 2026, different market trackers show prices around $46–$51.
CoinMarketCap+1
SOXLB provides 3X leveraged exposure to semiconductor stocks, which means both profits and losses can be amplified. Its recent price history shows significant volatility and a substantial decline from its previous high of around $204.
CoinMarketCap+1
If semiconductor stocks recover, SOXLB could rise again, but another market decline could push it lower. My outlook is high-risk and speculative, so avoid investing money you cannot afford to lose.
#binance #squarecreator #soxlb
90

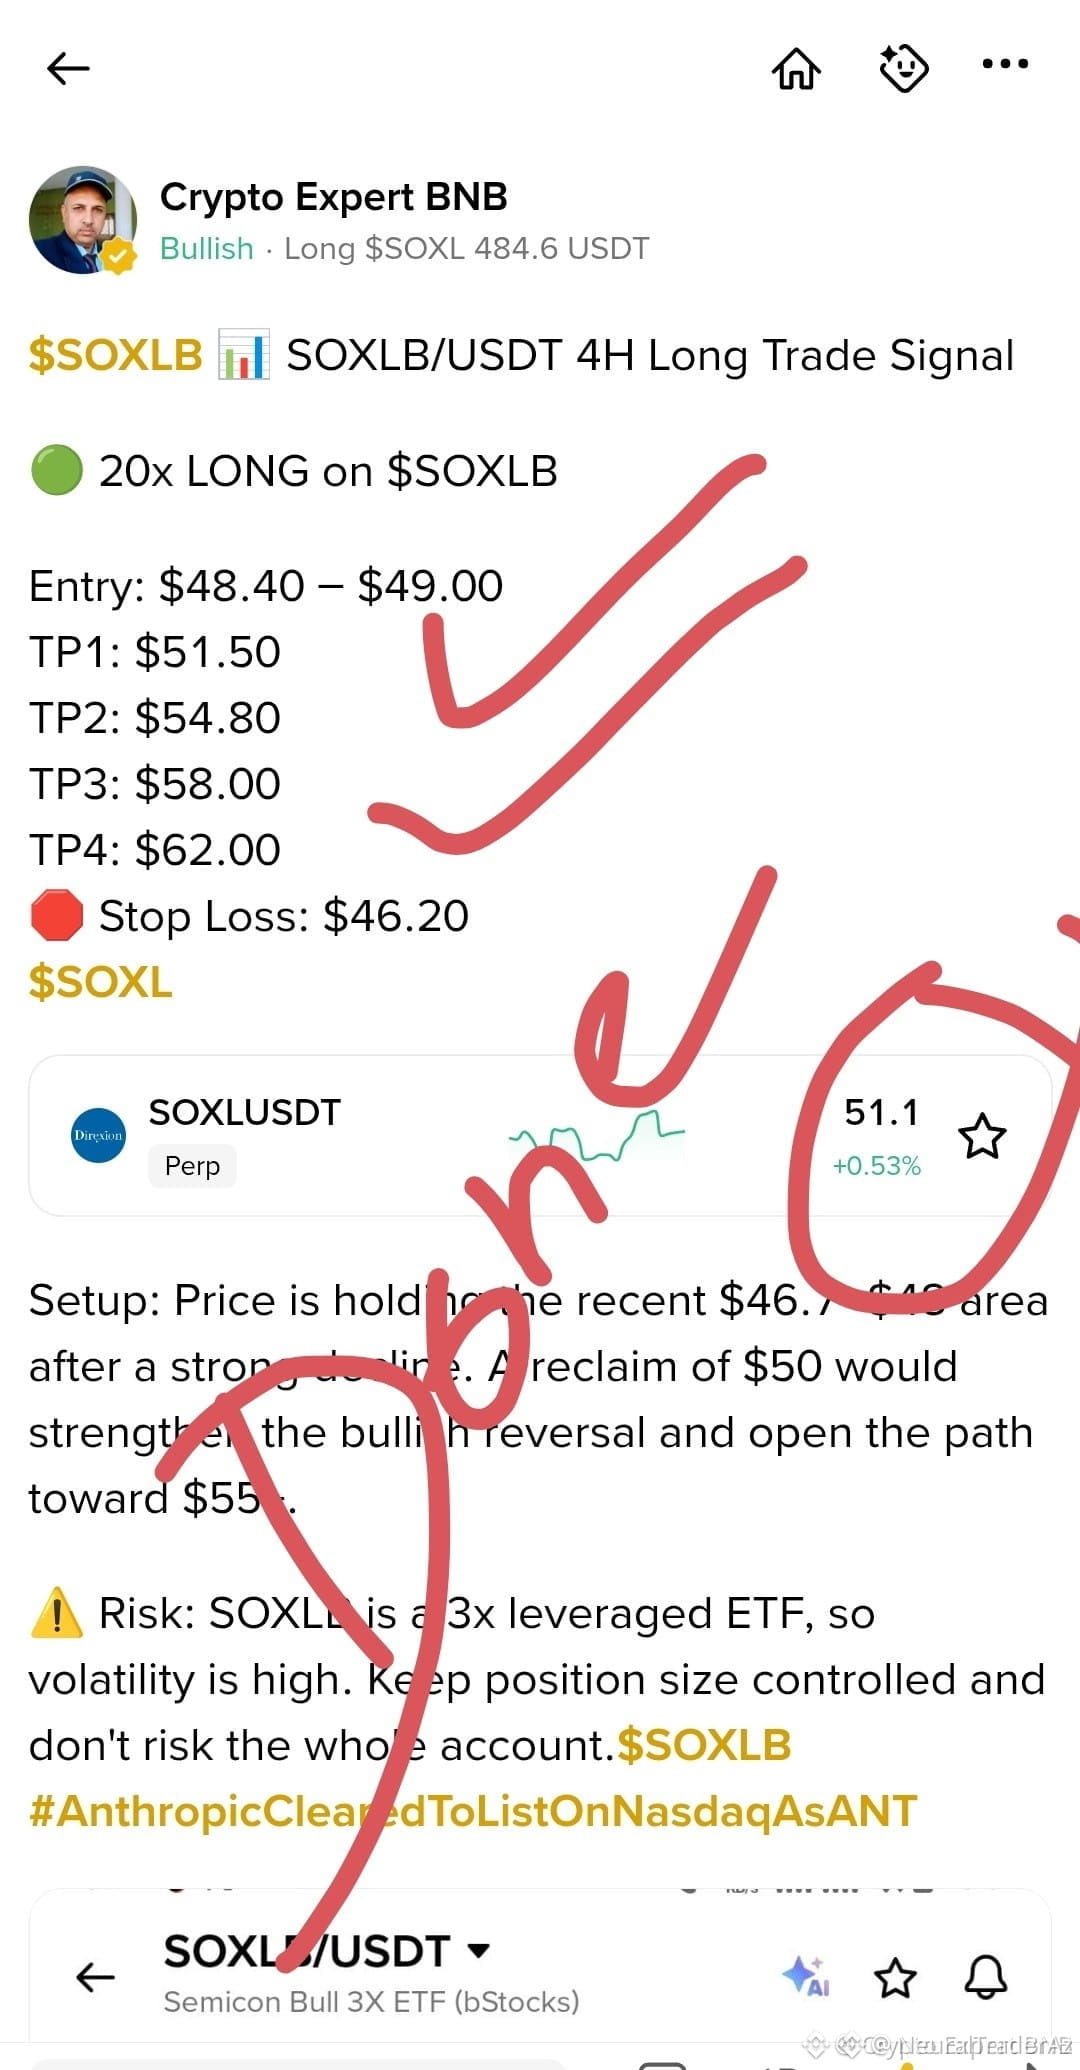
🎯 $SOXLB HITS OUR PRIMARY TARGET AS SMART MONEY LIQUIDITY SWEEPS THE RANGE HIGH! 🚀
Institutional distribution unfolded exactly as mapped once price pierced the external liquidity pool at the upper boundary. 📊 Volume profiles confirmed aggressive profit-taking from early participants while passive sell walls absorbed the final momentum push.
This clean expansion highlights how respecting structural imbalances allows us to capture clean moves before retail crowds catch up. 💡 💬 Are you locking in profits here or waiting for a structural reset? 👇
⚠️ Not financial advice. Always manage your risk. 🛡️
🏷️ #SOXLB #TargetHit #MarketStructure #SmartMoney #Trading
🔥 💎
🎯 $SOXLB HITS OUR PRIMARY TARGET AS SMART MONEY LIQUIDITY SWEEPS THE RANGE HIGH! 🚀
Institutional distribution unfolded exactly as mapped once price pierced the external liquidity pool at the upper boundary. 📊 Volume profiles confirmed aggressive profit-taking from early participants while passive sell walls absorbed the final momentum push.
This clean expansion highlights how respecting structural imbalances allows us to capture clean moves before retail crowds catch up. 💡 💬 Are you locking in profits here or waiting for a structural reset? 👇
⚠️ Not financial advice. Always manage your risk. 🛡️
🏷️ #SOXLB #TargetHit #MarketStructure #SmartMoney #Trading
🔥 💎
Institutional distribution unfolded exactly as mapped once price pierced the external liquidity pool at the upper boundary. 📊 Volume profiles confirmed aggressive profit-taking from early participants while passive sell walls absorbed the final momentum push.
This clean expansion highlights how respecting structural imbalances allows us to capture clean moves before retail crowds catch up. 💡 💬 Are you locking in profits here or waiting for a structural reset? 👇
⚠️ Not financial advice. Always manage your risk. 🛡️
🏷️ #SOXLB #TargetHit #MarketStructure #SmartMoney #Trading
🔥 💎
1

·
--
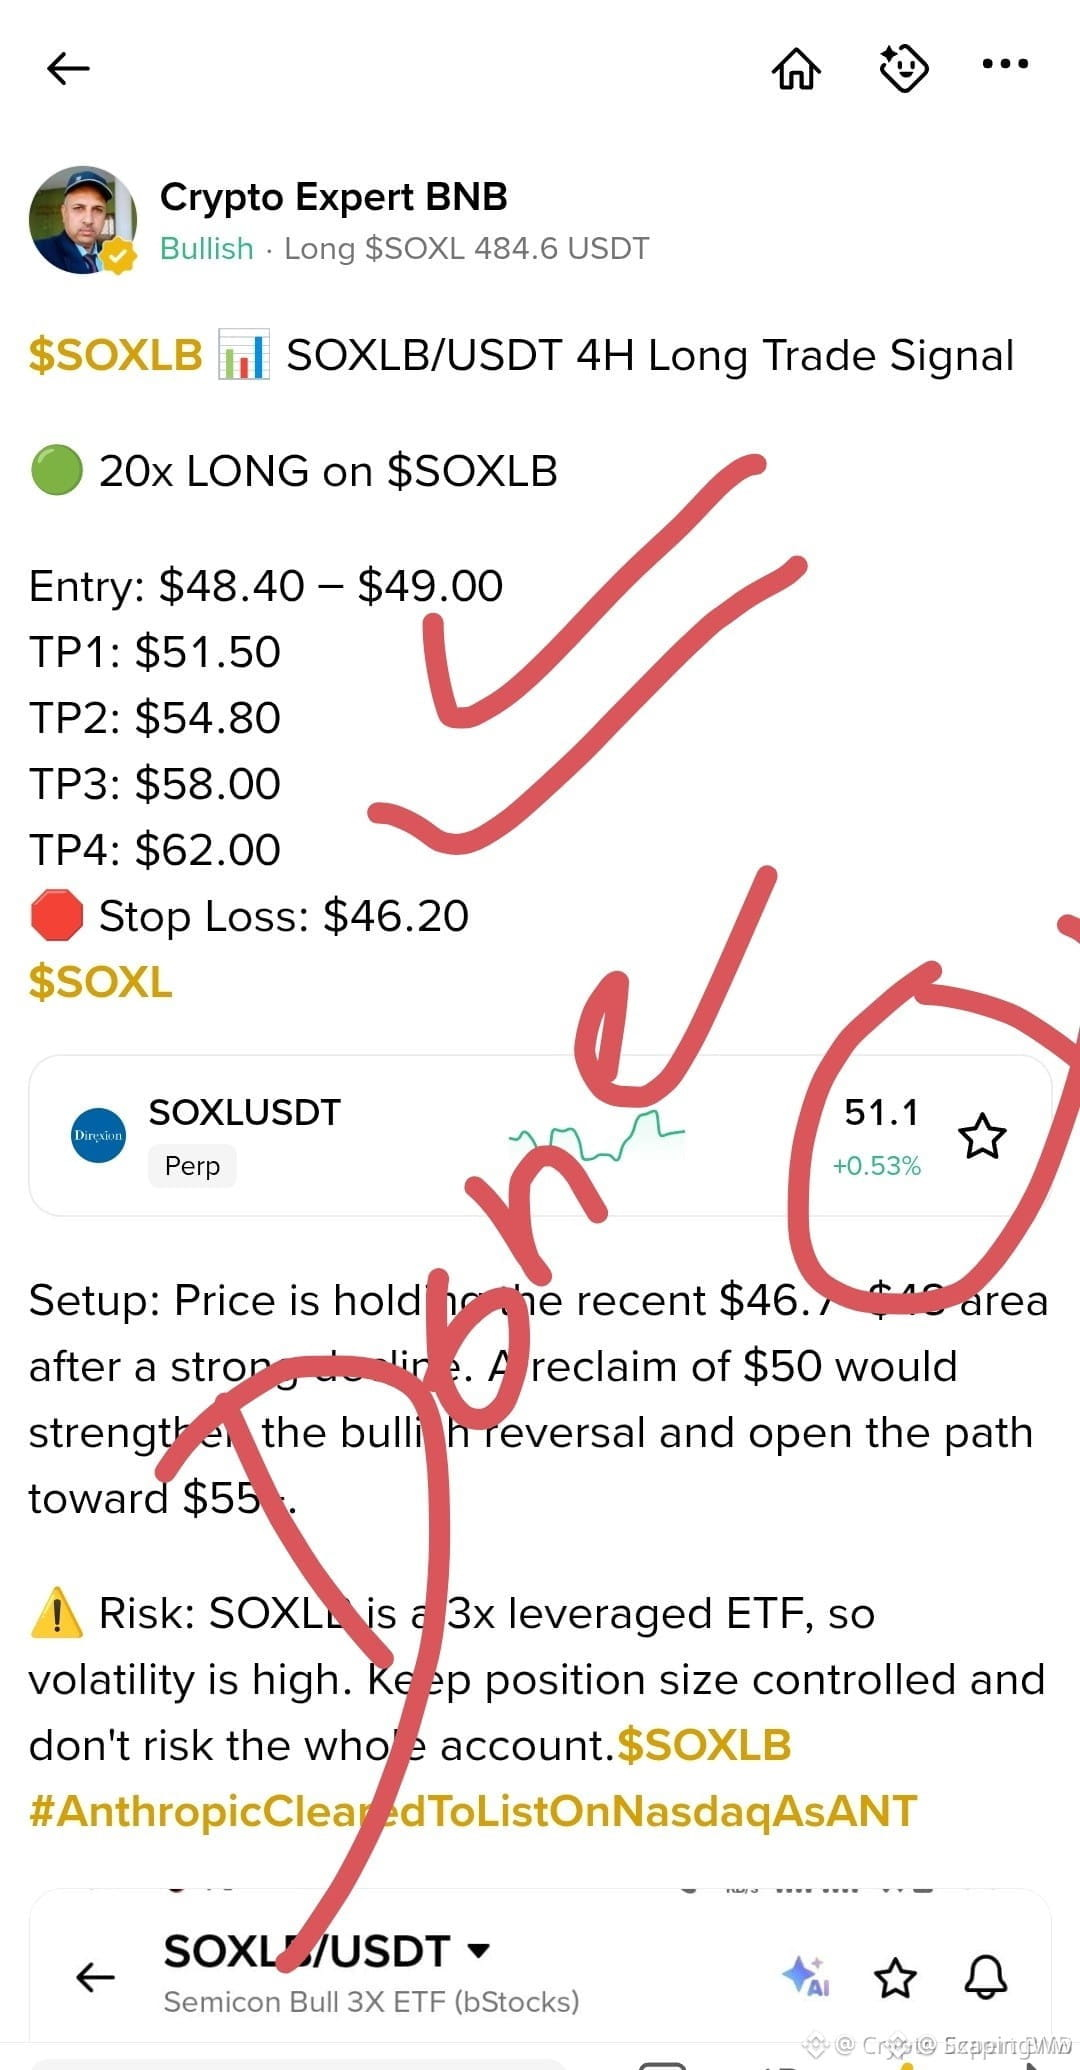
💥 $SOXLB SMASHES THE TARGET ZONE WITH PURE MOMENTUM VELOCITY! 🚀
When the execution plan aligns with pure market momentum, the results speak for themselves. Sellers tried to stall the advance at resistance, but heavy institutional volume blew right through the order book like paper. 📊
Securing profits on a clean swing like this is where discipline separates the pros from the crowd. We locked in the objective right as order flow flooded the bids and liquidity evaporated above. ⚡
Are you taking full profits off the table here or letting a runner ride higher? 👇
⚠️ Not financial advice. Always manage your risk. 🛡️
🏷️ #SOXLB #Momentum #CryptoTrading #Breakout #TargetHit
🔥 💎
💥 $SOXLB SMASHES THE TARGET ZONE WITH PURE MOMENTUM VELOCITY! 🚀
When the execution plan aligns with pure market momentum, the results speak for themselves. Sellers tried to stall the advance at resistance, but heavy institutional volume blew right through the order book like paper. 📊
Securing profits on a clean swing like this is where discipline separates the pros from the crowd. We locked in the objective right as order flow flooded the bids and liquidity evaporated above. ⚡
Are you taking full profits off the table here or letting a runner ride higher? 👇
⚠️ Not financial advice. Always manage your risk. 🛡️
🏷️ #SOXLB #Momentum #CryptoTrading #Breakout #TargetHit
🔥 💎
When the execution plan aligns with pure market momentum, the results speak for themselves. Sellers tried to stall the advance at resistance, but heavy institutional volume blew right through the order book like paper. 📊
Securing profits on a clean swing like this is where discipline separates the pros from the crowd. We locked in the objective right as order flow flooded the bids and liquidity evaporated above. ⚡
Are you taking full profits off the table here or letting a runner ride higher? 👇
⚠️ Not financial advice. Always manage your risk. 🛡️
🏷️ #SOXLB #Momentum #CryptoTrading #Breakout #TargetHit
🔥 💎
13
🚨 $SOXLB TESTING CRITICAL 52.39 RESISTANCE AFTER THE RECENT LIQUIDITY SWEEP! ⚡
Entry: 52.39 ⚡
Target: 58.64 🚀
Stop Loss: 46.15 ⚠️
The broader 4H structure still prints lower highs following the rejection from 69.71, but the latest impulsive candle indicates short-term momentum is shifting. 📊 Price is currently probing the 52.39 threshold, where a sustained acceptance above this zone opens the path toward 58.64. 💡 Meanwhile, failure to hold this pivot exposes the 46.15 liquidity shelf as downside support in this volatile leveraged vehicle. 🌊
💬 Are you anticipating an immediate breakout above resistance or positioning for a retest of lower support? 👇
⚠️ Not financial advice. Always manage your risk. 🛡️
🏷️ #SOXLB #CryptoStocks #Trading #MarketStructure
🔥 🎯
🚨 $SOXLB TESTING CRITICAL 52.39 RESISTANCE AFTER THE RECENT LIQUIDITY SWEEP! ⚡
Entry: 52.39 ⚡
Target: 58.64 🚀
Stop Loss: 46.15 ⚠️
The broader 4H structure still prints lower highs following the rejection from 69.71, but the latest impulsive candle indicates short-term momentum is shifting. 📊 Price is currently probing the 52.39 threshold, where a sustained acceptance above this zone opens the path toward 58.64. 💡 Meanwhile, failure to hold this pivot exposes the 46.15 liquidity shelf as downside support in this volatile leveraged vehicle. 🌊
💬 Are you anticipating an immediate breakout above resistance or positioning for a retest of lower support? 👇
⚠️ Not financial advice. Always manage your risk. 🛡️
🏷️ #SOXLB #CryptoStocks #Trading #MarketStructure
🔥 🎯
Entry: 52.39 ⚡
Target: 58.64 🚀
Stop Loss: 46.15 ⚠️
The broader 4H structure still prints lower highs following the rejection from 69.71, but the latest impulsive candle indicates short-term momentum is shifting. 📊 Price is currently probing the 52.39 threshold, where a sustained acceptance above this zone opens the path toward 58.64. 💡 Meanwhile, failure to hold this pivot exposes the 46.15 liquidity shelf as downside support in this volatile leveraged vehicle. 🌊
💬 Are you anticipating an immediate breakout above resistance or positioning for a retest of lower support? 👇
⚠️ Not financial advice. Always manage your risk. 🛡️
🏷️ #SOXLB #CryptoStocks #Trading #MarketStructure
🔥 🎯
8

⚡ $SOXLB TESTING CRITICAL RESISTANCE AS SHORT-TERM MOMENTUM ATTEMPTS A RECOVERY! 📈
Entry: 52.39 ⚡
Target: 58.64 🚀
Stop Loss: 46.15 ⚠️
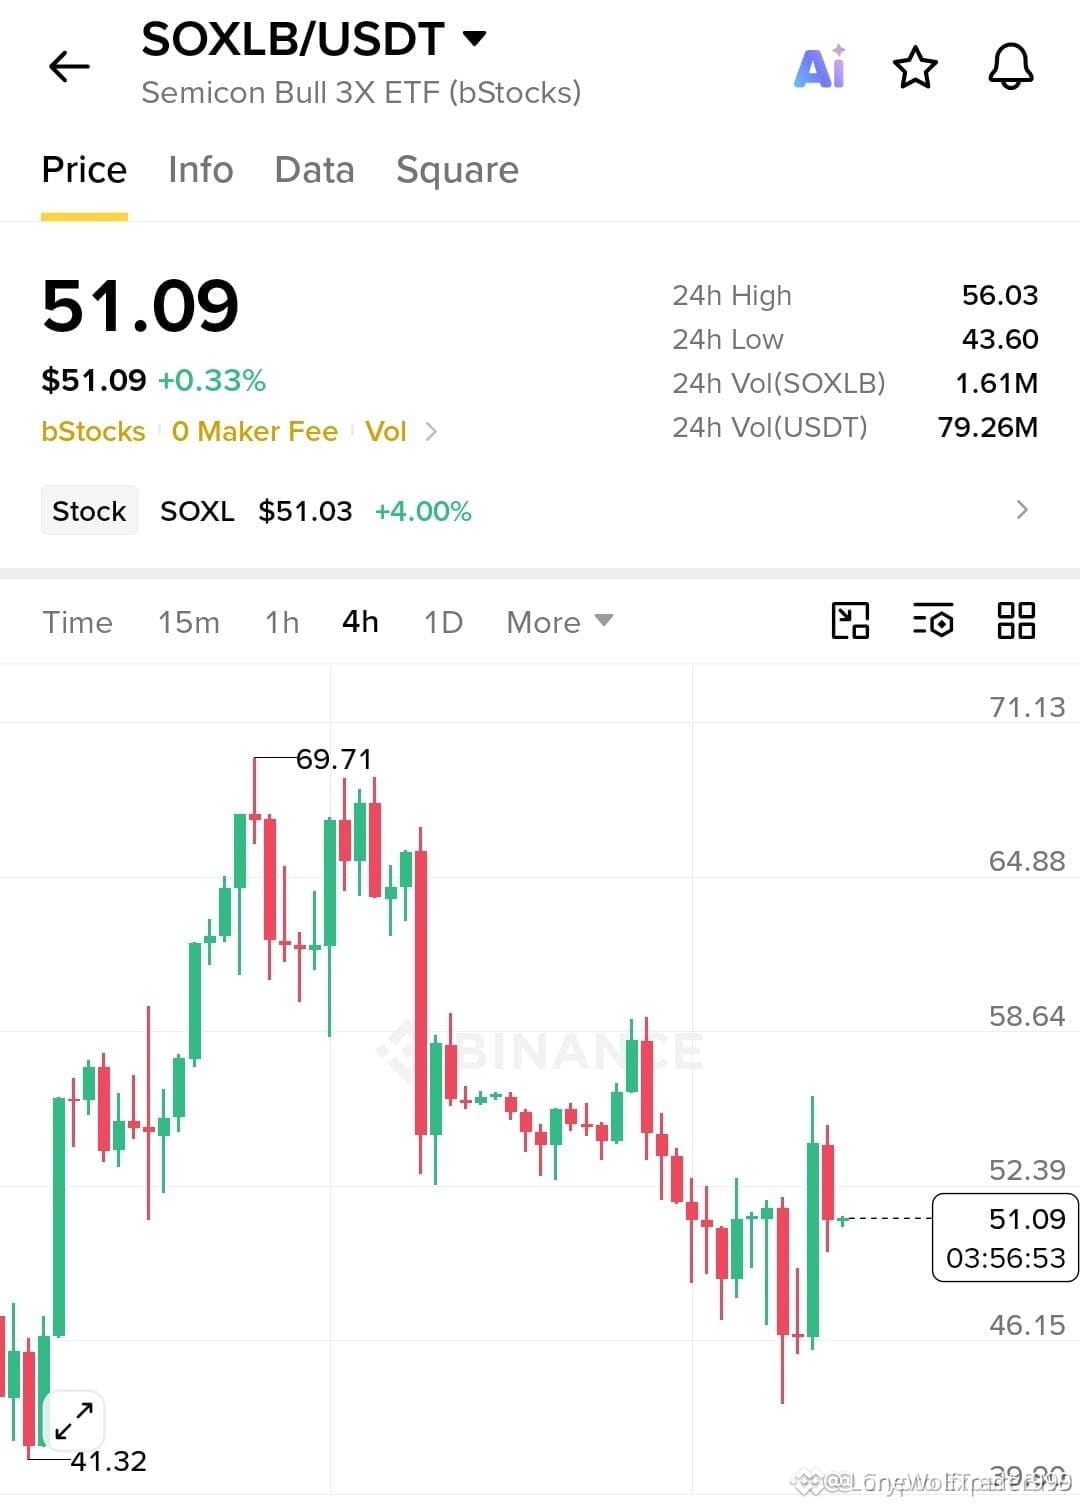
Price is clawing back from that steep plunge to the 41.32 swing low, carving out a tentative green candle on the lower timeframe structure. 📊
Bulls need a decisive confirmation above the 52.39 overhead wall to ignite a run toward 58.64, while a rejection keeps the broader pullback alive down near 46.15. 💡 Keep in mind this is a high-beta leveraged vehicle carrying sharp intraday swings. 🌊
💬 Are you front-running the breakout or waiting for a proven hold above resistance? 👇
⚠️ Not financial advice. Always manage your risk. 🛡️
🏷️ #SOXLB #CryptoStocks #Momentum #Breakout
🔥 💎
⚡ $SOXLB TESTING CRITICAL RESISTANCE AS SHORT-TERM MOMENTUM ATTEMPTS A RECOVERY! 📈
Entry: 52.39 ⚡
Target: 58.64 🚀
Stop Loss: 46.15 ⚠️
Price is clawing back from that steep plunge to the 41.32 swing low, carving out a tentative green candle on the lower timeframe structure. 📊
Bulls need a decisive confirmation above the 52.39 overhead wall to ignite a run toward 58.64, while a rejection keeps the broader pullback alive down near 46.15. 💡 Keep in mind this is a high-beta leveraged vehicle carrying sharp intraday swings. 🌊
💬 Are you front-running the breakout or waiting for a proven hold above resistance? 👇
⚠️ Not financial advice. Always manage your risk. 🛡️
🏷️ #SOXLB #CryptoStocks #Momentum #Breakout
🔥 💎
Entry: 52.39 ⚡
Target: 58.64 🚀
Stop Loss: 46.15 ⚠️
Price is clawing back from that steep plunge to the 41.32 swing low, carving out a tentative green candle on the lower timeframe structure. 📊
Bulls need a decisive confirmation above the 52.39 overhead wall to ignite a run toward 58.64, while a rejection keeps the broader pullback alive down near 46.15. 💡 Keep in mind this is a high-beta leveraged vehicle carrying sharp intraday swings. 🌊
💬 Are you front-running the breakout or waiting for a proven hold above resistance? 👇
⚠️ Not financial advice. Always manage your risk. 🛡️
🏷️ #SOXLB #CryptoStocks #Momentum #Breakout
🔥 💎
·
--
$SOXLB SOXLB is showing bullish movement: 1.56% (Crypto).
Volume: 83.63M | Last: $51.39
Key signals: high trader activity.
Bias Daily: BULLISH 🟢 | Weekly: BULLISH 🟢
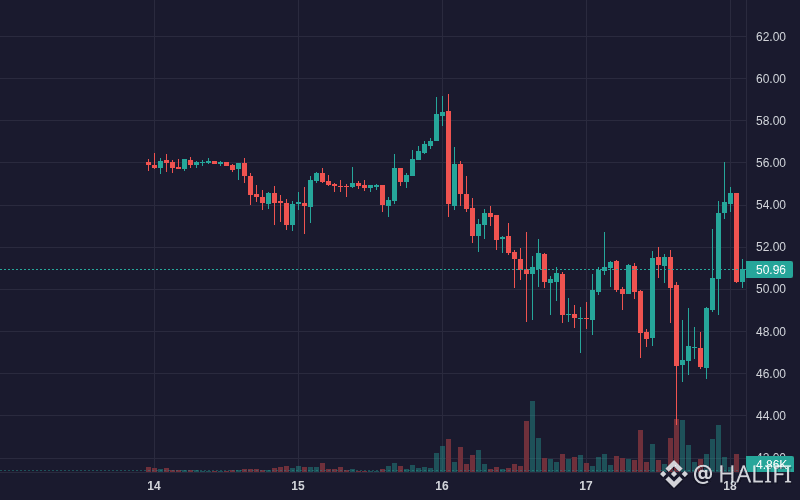
SOXLB gained 9.2% over 24h following a sharp technical rebound from $46.34 to $54.56.
**V-shaped technical rebound (High)**: After sliding to a low of $46.34, aggressive buying broke past the 25-EMA and 99-EMA → triggering momentum expansion above $54.50
- **MACD bullish crossover (High)**: MACD histogram crossed firmly positive to +0.81 with MACD line entering green territory (+0.43) → accelerating upward follow-through
- **Surge in spot buying (Medium)**: Positive net inflows exceeding $2.8M over recent sessions absorbed earlier selloffs → lifting price +17.7% from local lows
#SOXLB #TRUMP #BinanceSquare #altcoins #Crypto
$SOXLB SOXLB is showing bullish movement: 1.56% (Crypto).
Volume: 83.63M | Last: $51.39
Key signals: high trader activity.
Bias Daily: BULLISH 🟢 | Weekly: BULLISH 🟢
SOXLB gained 9.2% over 24h following a sharp technical rebound from $46.34 to $54.56.
**V-shaped technical rebound (High)**: After sliding to a low of $46.34, aggressive buying broke past the 25-EMA and 99-EMA → triggering momentum expansion above $54.50
- **MACD bullish crossover (High)**: MACD histogram crossed firmly positive to +0.81 with MACD line entering green territory (+0.43) → accelerating upward follow-through
- **Surge in spot buying (Medium)**: Positive net inflows exceeding $2.8M over recent sessions absorbed earlier selloffs → lifting price +17.7% from local lows
#SOXLB #TRUMP #BinanceSquare #altcoins #Crypto
Volume: 83.63M | Last: $51.39
Key signals: high trader activity.
Bias Daily: BULLISH 🟢 | Weekly: BULLISH 🟢
SOXLB gained 9.2% over 24h following a sharp technical rebound from $46.34 to $54.56.
**V-shaped technical rebound (High)**: After sliding to a low of $46.34, aggressive buying broke past the 25-EMA and 99-EMA → triggering momentum expansion above $54.50
- **MACD bullish crossover (High)**: MACD histogram crossed firmly positive to +0.81 with MACD line entering green territory (+0.43) → accelerating upward follow-through
- **Surge in spot buying (Medium)**: Positive net inflows exceeding $2.8M over recent sessions absorbed earlier selloffs → lifting price +17.7% from local lows
#SOXLB #TRUMP #BinanceSquare #altcoins #Crypto
7

·
--
Bullish
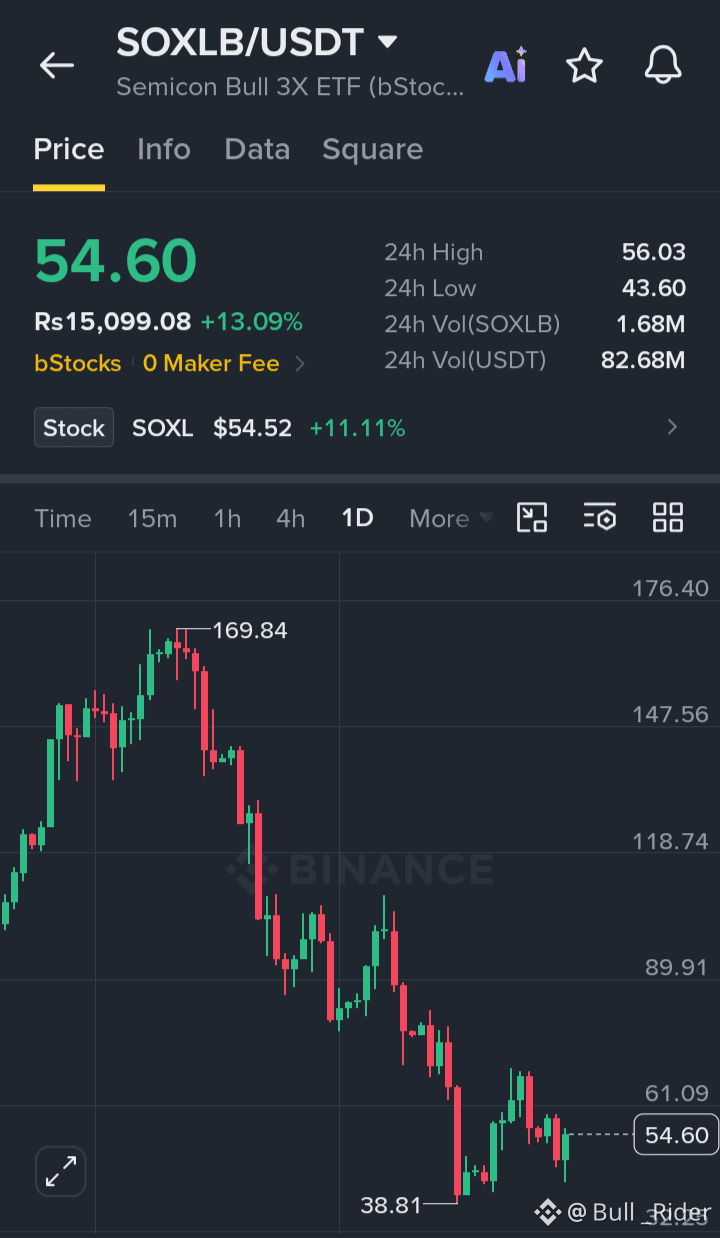
$SOXLB is showing strength from support, with buyers gradually taking control after rebounding from the recent low and momentum building for a potential continuation move.
Entry: 54.50–55.00
TP1: 61.09
TP2: 72.00
TP3: 89.91
SL: 50.00
Buy and Trade $SOLV
#SOXLB $SOL
{future}(SOLVUSDT)
{future}(SOLUSDT)
{spot}(SOXLBUSDT)
$SOXLB is showing strength from support, with buyers gradually taking control after rebounding from the recent low and momentum building for a potential continuation move.
Entry: 54.50–55.00
TP1: 61.09
TP2: 72.00
TP3: 89.91
SL: 50.00
Buy and Trade $SOLV
#SOXLB $SOL
Entry: 54.50–55.00
TP1: 61.09
TP2: 72.00
TP3: 89.91
SL: 50.00
Buy and Trade $SOLV
#SOXLB $SOL
1
26

·
--
$SOXLB looks ready to go higher from here 🚀
Trading volume is 1.7x higher than the 7 day average
Buying $SOXLB between 49.7759 and 51.8935
Invalid below 45.2936
Taking profit at 60.7346 66.9110 76.1756
Price is holding right near today's high of $52.8200
The RSI is sitting at 56 so it has plenty of room
Price is in the zone right now
Tap $SOXLB to buy
#SOXLB #TradingSignals
$SOXLB looks ready to go higher from here 🚀
Trading volume is 1.7x higher than the 7 day average
Buying $SOXLB between 49.7759 and 51.8935
Invalid below 45.2936
Taking profit at 60.7346 66.9110 76.1756
Price is holding right near today's high of $52.8200
The RSI is sitting at 56 so it has plenty of room
Price is in the zone right now
Tap $SOXLB to buy
#SOXLB #TradingSignals
Trading volume is 1.7x higher than the 7 day average
Buying $SOXLB between 49.7759 and 51.8935
Invalid below 45.2936
Taking profit at 60.7346 66.9110 76.1756
Price is holding right near today's high of $52.8200
The RSI is sitting at 56 so it has plenty of room
Price is in the zone right now
Tap $SOXLB to buy
#SOXLB #TradingSignals

·
--
🔥 $SOXLB Technical Update: Key Levels & Momentum Breakdown
📊 1. Market Snapshot
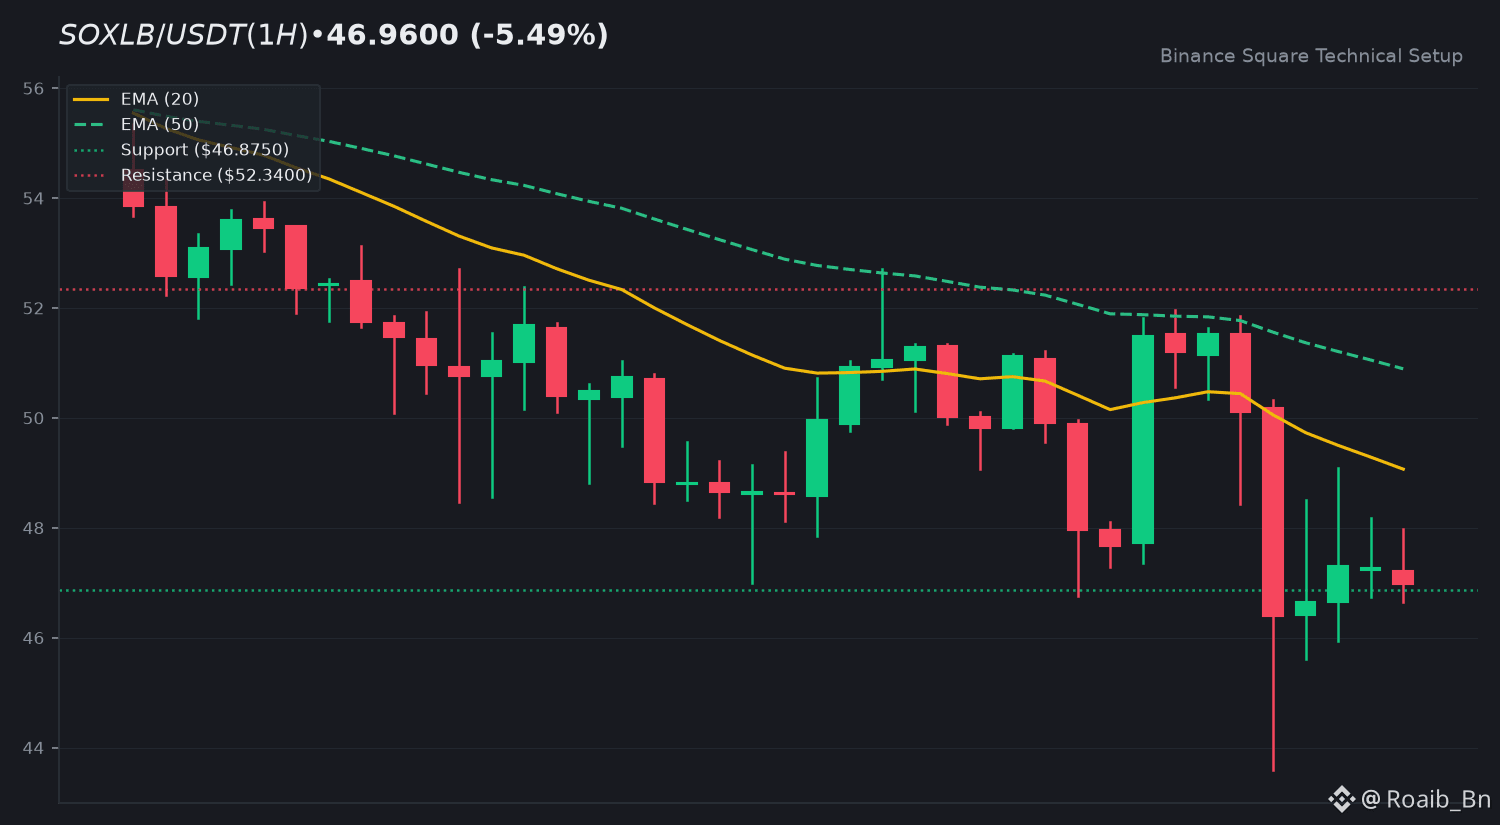
The $SOXLB token is currently trading at $46.9600, registering a 24-hour decline of -5.49 percent. Daily price action recorded a high of 52.7100 and a low of 43.6000, backed by a 24-hour quote volume of 72,403,481 USDT. Current volume status indicates low participation relative to the 20-period simple moving average.
📈 2. Technical Momentum & Indicator Bias
Price action for $SOXLB remains below both the EMA 20 at 49.0660 and the EMA 50 at 50.8924, sustaining a broader strong downtrend structure. The 14-period RSI sits at 38.99, pointing toward oversold territory without showing strong reversal momentum yet. Meanwhile, the MACD histogram prints at -0.2122 with the MACD line below the signal line, reflecting ongoing bearish momentum.
🎯 3. Key Technical Levels to Watch
• 🟢 Resistance Zone: First resistance stands near 52.3400, with a secondary ceiling at 55.9925.
• 🔴 Support Zone: Immediate support rests at $46.8750, followed by the 24-hour low floor at 43.6000.
• 🛡️ Pivot Confluence: The EMA 20 line at 49.0660 acts as the immediate dynamic pivot for trend evaluation.
💡 4. Technical Takeaway & Risk Management
Traders monitoring $SOXLB should observe how price behaves around the immediate support and the declining EMA lines. Low volume conditions suggest waiting for structural confirmation before anticipating trend shifts.
💬 5. Community Discussion
What is your technical outlook for $SOXLB this week? Are you tracking range limits or waiting for confirmation? Drop your thoughts below! 👇
⚠️ 6. Disclaimer
Educational technical analysis only. Not financial advice (NFA). Crypto markets involve risk. Always DYOR.
$SOXLB #SOXLB #BinanceSquare
🔥 $SOXLB Technical Update: Key Levels & Momentum Breakdown
📊 1. Market Snapshot
The $SOXLB token is currently trading at $46.9600, registering a 24-hour decline of -5.49 percent. Daily price action recorded a high of 52.7100 and a low of 43.6000, backed by a 24-hour quote volume of 72,403,481 USDT. Current volume status indicates low participation relative to the 20-period simple moving average.
📈 2. Technical Momentum & Indicator Bias
Price action for $SOXLB remains below both the EMA 20 at 49.0660 and the EMA 50 at 50.8924, sustaining a broader strong downtrend structure. The 14-period RSI sits at 38.99, pointing toward oversold territory without showing strong reversal momentum yet. Meanwhile, the MACD histogram prints at -0.2122 with the MACD line below the signal line, reflecting ongoing bearish momentum.
🎯 3. Key Technical Levels to Watch
• 🟢 Resistance Zone: First resistance stands near 52.3400, with a secondary ceiling at 55.9925.
• 🔴 Support Zone: Immediate support rests at $46.8750, followed by the 24-hour low floor at 43.6000.
• 🛡️ Pivot Confluence: The EMA 20 line at 49.0660 acts as the immediate dynamic pivot for trend evaluation.
💡 4. Technical Takeaway & Risk Management
Traders monitoring $SOXLB should observe how price behaves around the immediate support and the declining EMA lines. Low volume conditions suggest waiting for structural confirmation before anticipating trend shifts.
💬 5. Community Discussion
What is your technical outlook for $SOXLB this week? Are you tracking range limits or waiting for confirmation? Drop your thoughts below! 👇
⚠️ 6. Disclaimer
Educational technical analysis only. Not financial advice (NFA). Crypto markets involve risk. Always DYOR.
$SOXLB #SOXLB #BinanceSquare
📊 1. Market Snapshot
The $SOXLB token is currently trading at $46.9600, registering a 24-hour decline of -5.49 percent. Daily price action recorded a high of 52.7100 and a low of 43.6000, backed by a 24-hour quote volume of 72,403,481 USDT. Current volume status indicates low participation relative to the 20-period simple moving average.
📈 2. Technical Momentum & Indicator Bias
Price action for $SOXLB remains below both the EMA 20 at 49.0660 and the EMA 50 at 50.8924, sustaining a broader strong downtrend structure. The 14-period RSI sits at 38.99, pointing toward oversold territory without showing strong reversal momentum yet. Meanwhile, the MACD histogram prints at -0.2122 with the MACD line below the signal line, reflecting ongoing bearish momentum.
🎯 3. Key Technical Levels to Watch
• 🟢 Resistance Zone: First resistance stands near 52.3400, with a secondary ceiling at 55.9925.
• 🔴 Support Zone: Immediate support rests at $46.8750, followed by the 24-hour low floor at 43.6000.
• 🛡️ Pivot Confluence: The EMA 20 line at 49.0660 acts as the immediate dynamic pivot for trend evaluation.
💡 4. Technical Takeaway & Risk Management
Traders monitoring $SOXLB should observe how price behaves around the immediate support and the declining EMA lines. Low volume conditions suggest waiting for structural confirmation before anticipating trend shifts.
💬 5. Community Discussion
What is your technical outlook for $SOXLB this week? Are you tracking range limits or waiting for confirmation? Drop your thoughts below! 👇
⚠️ 6. Disclaimer
Educational technical analysis only. Not financial advice (NFA). Crypto markets involve risk. Always DYOR.
$SOXLB #SOXLB #BinanceSquare
21

·
--
Zoom in for a second: $SOXLB's last completed 1h candle moved +0.6% on 3.0x baseline volume.
The 20-hour baseline uses the prior 20 completed hourly candles.
One busy candle alone does not establish follow-through.
#SOXLB #AltcoinFlow #VolumeWatch
Zoom in for a second: $SOXLB 's last completed 1h candle moved +0.6% on 3.0x baseline volume.
The 20-hour baseline uses the prior 20 completed hourly candles.
One busy candle alone does not establish follow-through.
#SOXLB #AltcoinFlow #VolumeWatch
The 20-hour baseline uses the prior 20 completed hourly candles.
One busy candle alone does not establish follow-through.
#SOXLB #AltcoinFlow #VolumeWatch
65

·
--
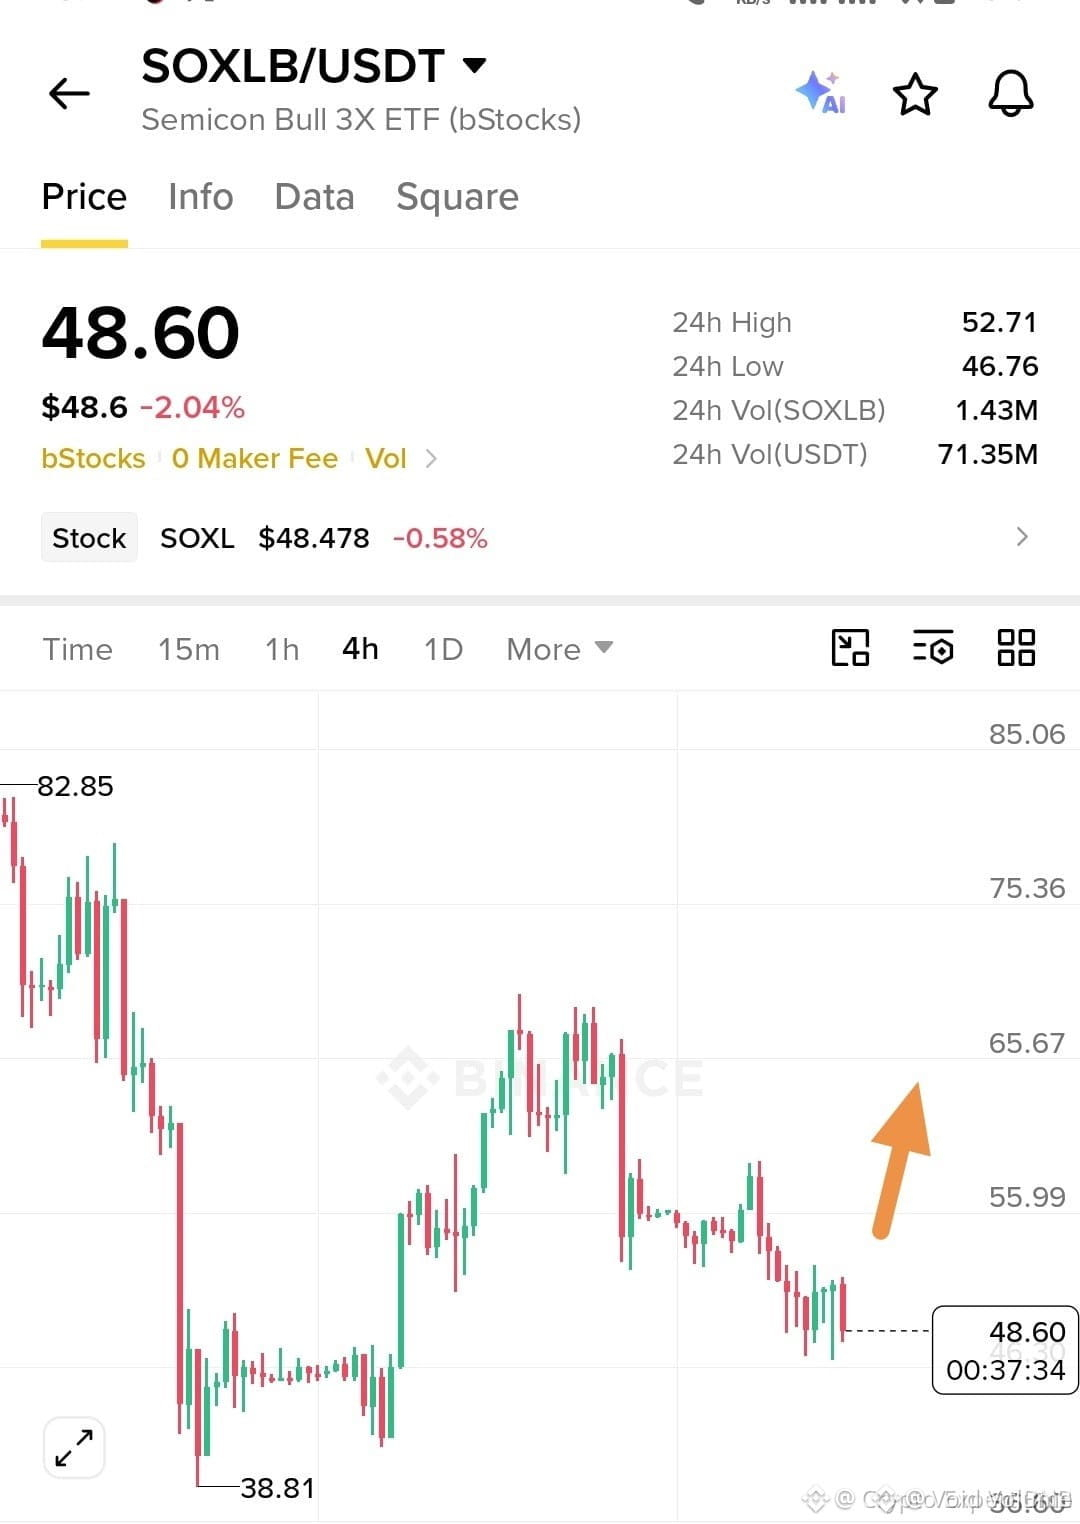
🦈 $SOXLB DEFENDING THE DEMAND ZONE WHILE SMART MONEY ABSORBS THE SUPPLY 📊
Entry: $48.40 ⚡
Target: $58.00 🚀
Stop Loss: $46.20 ⚠️
Price is carving out a clean structural base above the 46.70 to 48.00 liquidity pocket following a corrective impulse. 📊 Volume profiles show aggressive institutional absorption right at this historical demand inflection. 🌊
A confirmed reclaim of the psychological 50.00 threshold will trigger algorithmic buy programs and accelerate momentum toward our higher targets. ⚡ Given the high volatility profile, strict risk management is paramount. 🔍
💬 Are you positioning ahead of the 50.00 reclaim or waiting for a structural confirmation candle? 👇
⚠️ Not financial advice. Always manage your risk. 🛡️
🏷️ #SOXLB #LongSetup #MarketStructure #SmartMoney
🔥 💎
🦈 $SOXLB DEFENDING THE DEMAND ZONE WHILE SMART MONEY ABSORBS THE SUPPLY 📊
Entry: $48.40 ⚡
Target: $58.00 🚀
Stop Loss: $46.20 ⚠️
Price is carving out a clean structural base above the 46.70 to 48.00 liquidity pocket following a corrective impulse. 📊 Volume profiles show aggressive institutional absorption right at this historical demand inflection. 🌊
A confirmed reclaim of the psychological 50.00 threshold will trigger algorithmic buy programs and accelerate momentum toward our higher targets. ⚡ Given the high volatility profile, strict risk management is paramount. 🔍
💬 Are you positioning ahead of the 50.00 reclaim or waiting for a structural confirmation candle? 👇
⚠️ Not financial advice. Always manage your risk. 🛡️
🏷️ #SOXLB #LongSetup #MarketStructure #SmartMoney
🔥 💎
Entry: $48.40 ⚡
Target: $58.00 🚀
Stop Loss: $46.20 ⚠️
Price is carving out a clean structural base above the 46.70 to 48.00 liquidity pocket following a corrective impulse. 📊 Volume profiles show aggressive institutional absorption right at this historical demand inflection. 🌊
A confirmed reclaim of the psychological 50.00 threshold will trigger algorithmic buy programs and accelerate momentum toward our higher targets. ⚡ Given the high volatility profile, strict risk management is paramount. 🔍
💬 Are you positioning ahead of the 50.00 reclaim or waiting for a structural confirmation candle? 👇
⚠️ Not financial advice. Always manage your risk. 🛡️
🏷️ #SOXLB #LongSetup #MarketStructure #SmartMoney
🔥 💎
1
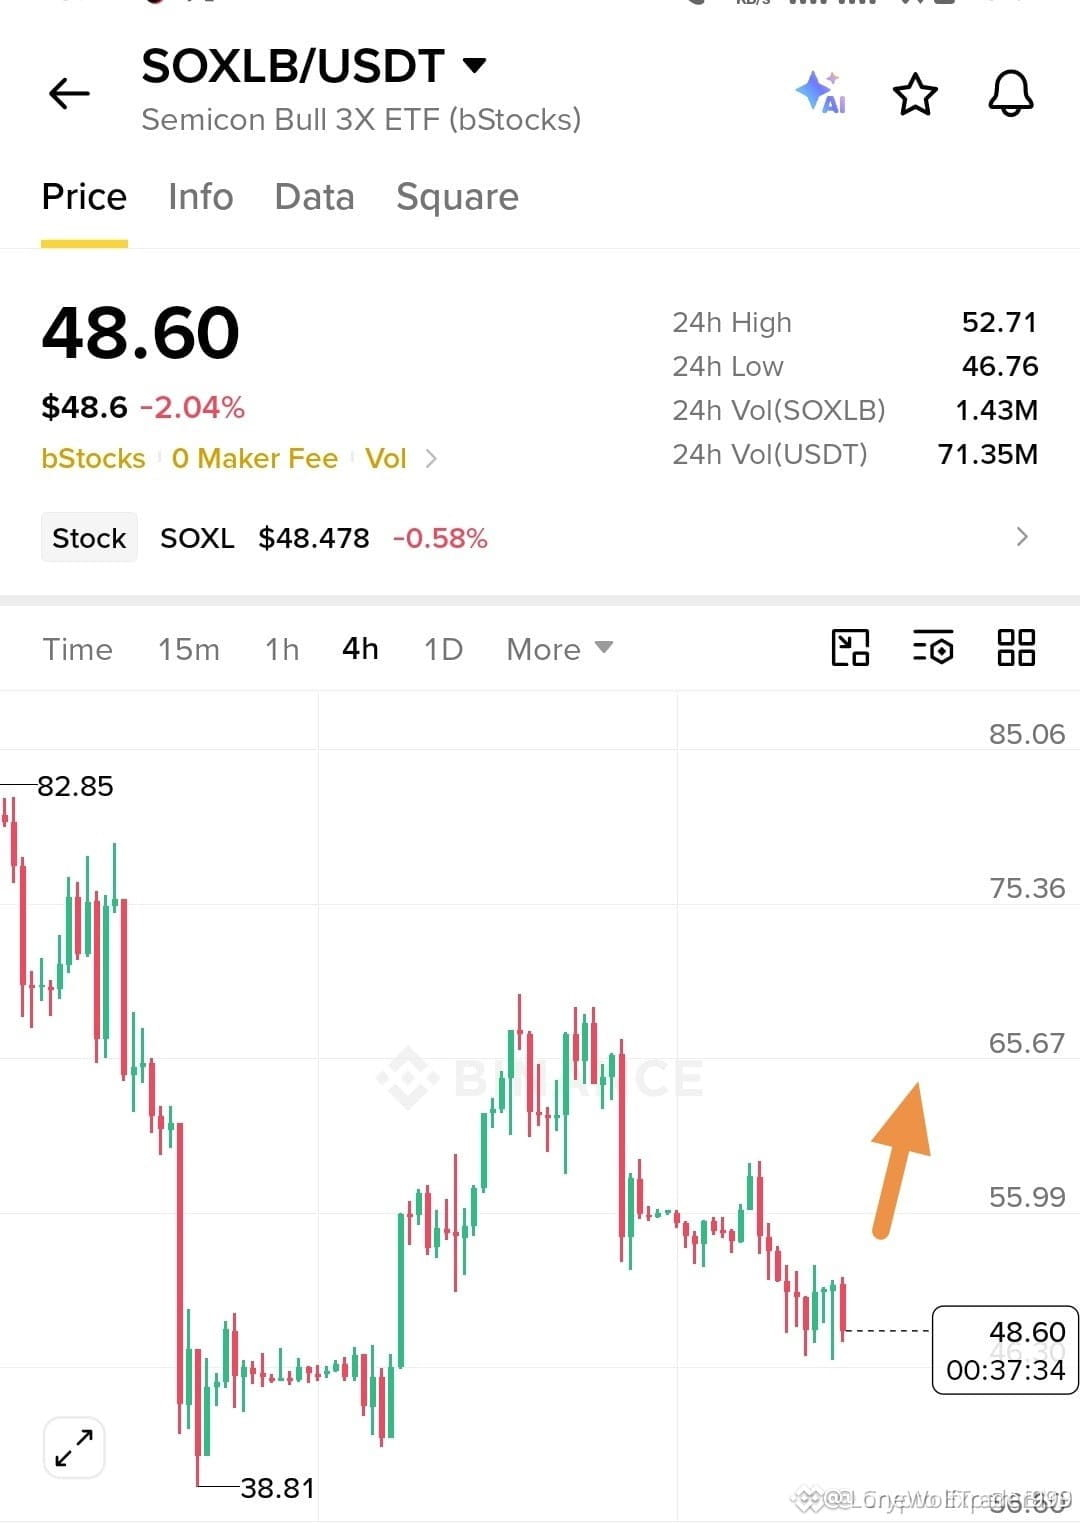
🚨 $SOXLB DEFENDING THE 48 ZONE WHILE THE BEARS RUN OUT OF STEAM! 💥
Entry: $48.40 – $49.00 ⚡
Target: $51.50 🚀
Stop Loss: $46.20 ⚠️
📌 Price is carving out a solid defensive base between forty-six and forty-eight after a sharp flush, showing that aggressive sellers are finally losing their grip. 📊 A clean reclaim of the fifty handle flips the immediate market structure and clears a frictionless path toward higher targets. ⚡
💡 Because this instrument carries elevated volatility, keeping your sizing tight and respecting the risk parameters is non-negotiable. 💬 Are you positioning for the bounce here or waiting for the fifty reclaim confirmation? 👇
⚠️ Not financial advice. Always manage your risk. 🛡️
🏷️ #SOXLB #LongSetup #Reclaim #Crypto
🔥 💎
🚨 $SOXLB DEFENDING THE 48 ZONE WHILE THE BEARS RUN OUT OF STEAM! 💥
Entry: $48.40 – $49.00 ⚡
Target: $51.50 🚀
Stop Loss: $46.20 ⚠️
📌 Price is carving out a solid defensive base between forty-six and forty-eight after a sharp flush, showing that aggressive sellers are finally losing their grip. 📊 A clean reclaim of the fifty handle flips the immediate market structure and clears a frictionless path toward higher targets. ⚡
💡 Because this instrument carries elevated volatility, keeping your sizing tight and respecting the risk parameters is non-negotiable. 💬 Are you positioning for the bounce here or waiting for the fifty reclaim confirmation? 👇
⚠️ Not financial advice. Always manage your risk. 🛡️
🏷️ #SOXLB #LongSetup #Reclaim #Crypto
🔥 💎
Entry: $48.40 – $49.00 ⚡
Target: $51.50 🚀
Stop Loss: $46.20 ⚠️
📌 Price is carving out a solid defensive base between forty-six and forty-eight after a sharp flush, showing that aggressive sellers are finally losing their grip. 📊 A clean reclaim of the fifty handle flips the immediate market structure and clears a frictionless path toward higher targets. ⚡
💡 Because this instrument carries elevated volatility, keeping your sizing tight and respecting the risk parameters is non-negotiable. 💬 Are you positioning for the bounce here or waiting for the fifty reclaim confirmation? 👇
⚠️ Not financial advice. Always manage your risk. 🛡️
🏷️ #SOXLB #LongSetup #Reclaim #Crypto
🔥 💎
5

·
--
$SOXLB is cooling after a sharp 7.9% hourly volatility spike.
The asset currently sits at $50.90 with $74.47M in 24h volume. Trading activity shows a high volume-to-average ratio of 1.56x, indicating active rebalancing.
Watch the $52.71 resistance for a potential breakout signal. Conversely, a sustained drop below the $46.76 recent low would invalidate the current recovery structure.
If SOXLB reclaims the $52.71 level, do you expect a momentum breakout, or will the $46.76 floor need to be retested for stabilization first? 📊
Tap $SOXLB for the live chart. #SOXLB #BinanceSquare
$SOXLB is cooling after a sharp 7.9% hourly volatility spike.
The asset currently sits at $50.90 with $74.47M in 24h volume. Trading activity shows a high volume-to-average ratio of 1.56x, indicating active rebalancing.
Watch the $52.71 resistance for a potential breakout signal. Conversely, a sustained drop below the $46.76 recent low would invalidate the current recovery structure.
If SOXLB reclaims the $52.71 level, do you expect a momentum breakout, or will the $46.76 floor need to be retested for stabilization first? 📊
Tap $SOXLB for the live chart. #SOXLB #BinanceSquare
The asset currently sits at $50.90 with $74.47M in 24h volume. Trading activity shows a high volume-to-average ratio of 1.56x, indicating active rebalancing.
Watch the $52.71 resistance for a potential breakout signal. Conversely, a sustained drop below the $46.76 recent low would invalidate the current recovery structure.
If SOXLB reclaims the $52.71 level, do you expect a momentum breakout, or will the $46.76 floor need to be retested for stabilization first? 📊
Tap $SOXLB for the live chart. #SOXLB #BinanceSquare
2

·
--
$SOXLB -8.41% | $SNXXB -10.41% | $XRP +0.92%
#SOXLB trades at $47.80, down 8.41% on $69.2 M volume.
#SNXXB sits at $2.84, slipping 10.41% with $5.9 M traded.
#XRP holds $0.9567, up 0.92% on a solid $100.7 M flow.
👀 The contrast between XRP’s modest gain and the sharper drops in SOXLB and SNXXB could signal sector‑specific pressure, but the high XRP volume suggests lingering interest.
#Write2Earn #Binance
$SOXLB -8.41% | $SNXXB -10.41% | $XRP +0.92%
#SOXLB trades at $47.80, down 8.41% on $69.2 M volume.
#SNXXB sits at $2.84, slipping 10.41% with $5.9 M traded.
#XRP holds $0.9567, up 0.92% on a solid $100.7 M flow.
👀 The contrast between XRP’s modest gain and the sharper drops in SOXLB and SNXXB could signal sector‑specific pressure, but the high XRP volume suggests lingering interest.
#Write2Earn #Binance
#SOXLB trades at $47.80, down 8.41% on $69.2 M volume.
#SNXXB sits at $2.84, slipping 10.41% with $5.9 M traded.
#XRP holds $0.9567, up 0.92% on a solid $100.7 M flow.
👀 The contrast between XRP’s modest gain and the sharper drops in SOXLB and SNXXB could signal sector‑specific pressure, but the high XRP volume suggests lingering interest.
#Write2Earn #Binance
4

·
--
Is $SOXLB volume signaling a genuine trend shift or mere noise?
With $62.79M in 24h volume and a 5.18% decline to $51.10, liquidity remains active. Hourly volume hit 1.16x the recent average, showing increased participant interest despite the price drop.
A reclaim of the $55.34 high could suggest renewed momentum. Conversely, failing to hold the $46.99 range low might invite further downside.
Does the current volume spike suggest a bottoming attempt, or are we simply seeing an increase in capitulation pressure as the price tests lower boundaries?
Tap $SOXLB for the live chart. #SOXLB #BinanceSquare
Is $SOXLB volume signaling a genuine trend shift or mere noise?
With $62.79M in 24h volume and a 5.18% decline to $51.10, liquidity remains active. Hourly volume hit 1.16x the recent average, showing increased participant interest despite the price drop.
A reclaim of the $55.34 high could suggest renewed momentum. Conversely, failing to hold the $46.99 range low might invite further downside.
Does the current volume spike suggest a bottoming attempt, or are we simply seeing an increase in capitulation pressure as the price tests lower boundaries?
Tap $SOXLB for the live chart. #SOXLB #BinanceSquare
With $62.79M in 24h volume and a 5.18% decline to $51.10, liquidity remains active. Hourly volume hit 1.16x the recent average, showing increased participant interest despite the price drop.
A reclaim of the $55.34 high could suggest renewed momentum. Conversely, failing to hold the $46.99 range low might invite further downside.
Does the current volume spike suggest a bottoming attempt, or are we simply seeing an increase in capitulation pressure as the price tests lower boundaries?
Tap $SOXLB for the live chart. #SOXLB #BinanceSquare
·
--
$SOXLB -7.64% | $RLUSD -0.01% | $SPCXB -1.30%
#SOXLB slid to $50.41, a 7.64% dip, while $62.9 M of trades changed hands, showing the strongest turnover in this set.
#RLUSD barely moved, holding at $1.00 with a marginal 0.01% slip and $56.2 M of volume, indicating steady interest near parity.
#SPCXB fell to $138.01, down 1.30% on $54.3 M of activity, keeping modest but consistent market participation.
The volume hierarchy—SOXLB leading, then RLUSD, then SPCXB—might signal where short‑term liquidity is concentrating.
#Write2Earn #Binance
$SOXLB -7.64% | $RLUSD -0.01% | $SPCXB -1.30%
#SOXLB slid to $50.41, a 7.64% dip, while $62.9 M of trades changed hands, showing the strongest turnover in this set.
#RLUSD barely moved, holding at $1.00 with a marginal 0.01% slip and $56.2 M of volume, indicating steady interest near parity.
#SPCXB fell to $138.01, down 1.30% on $54.3 M of activity, keeping modest but consistent market participation.
The volume hierarchy—SOXLB leading, then RLUSD, then SPCXB—might signal where short‑term liquidity is concentrating.
#Write2Earn #Binance
#SOXLB slid to $50.41, a 7.64% dip, while $62.9 M of trades changed hands, showing the strongest turnover in this set.
#RLUSD barely moved, holding at $1.00 with a marginal 0.01% slip and $56.2 M of volume, indicating steady interest near parity.
#SPCXB fell to $138.01, down 1.30% on $54.3 M of activity, keeping modest but consistent market participation.
The volume hierarchy—SOXLB leading, then RLUSD, then SPCXB—might signal where short‑term liquidity is concentrating.
#Write2Earn #Binance
1

·
--
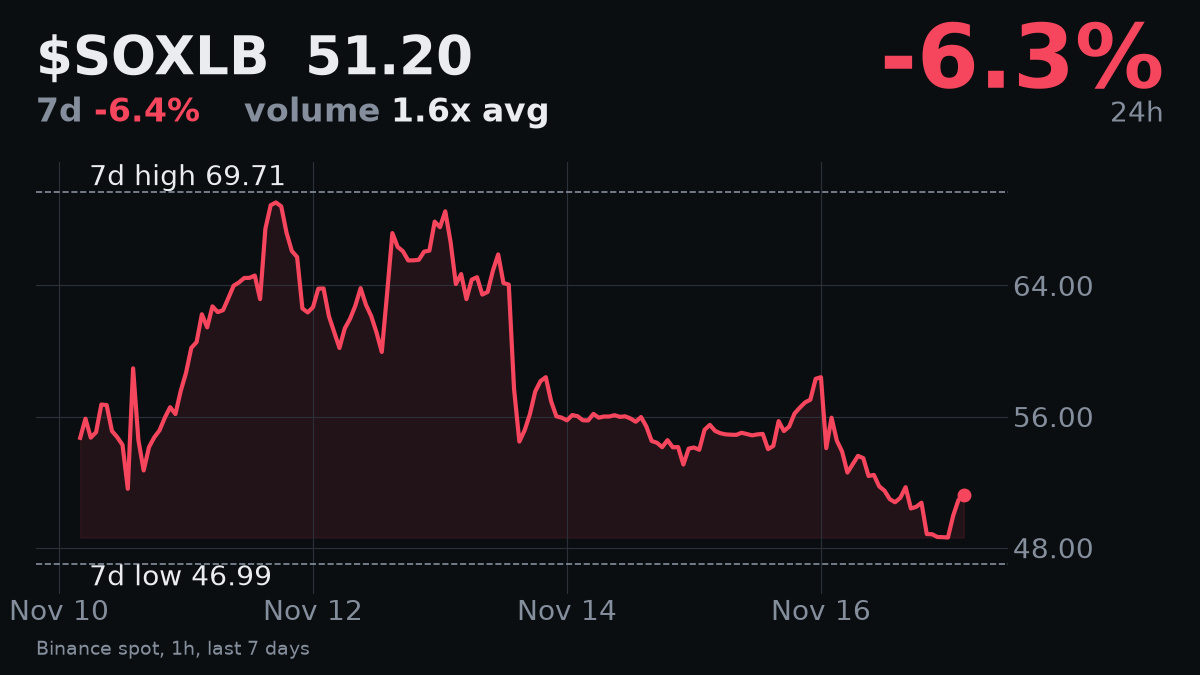
Trading volume for $SOXLB today is 1.58 times its 7-day average, showing strong activity. This comes as $SOXLB trades at $51.2, down 6.347% in the last 24 hours and 6.399% over the past seven days. It is currently 26.553% below its 7-day high of $69.71.
The market's Fear & Greed Index is at 12, indicating Extreme Fear. Bitcoin's 24-hour change is a smaller -0.22%. The RSI for $SOXLB is neutral at 48.7.
I am observing this decline with caution. The high volume suggests continued selling pressure, not just a shallow dip. I would become neutral if $SOXLB reclaims the $60 level and holds it with consistent volume. Until then, I see no clear opportunity for a long position.
I am waiting for volume to decrease on further price drops, or for a clear bounce with strong buying volume to indicate a shift.
#SOXLB #ExtremeFear
Trading volume for $SOXLB today is 1.58 times its 7-day average, showing strong activity. This comes as $SOXLB trades at $51.2, down 6.347% in the last 24 hours and 6.399% over the past seven days. It is currently 26.553% below its 7-day high of $69.71.
The market's Fear & Greed Index is at 12, indicating Extreme Fear. Bitcoin's 24-hour change is a smaller -0.22%. The RSI for $SOXLB is neutral at 48.7.
I am observing this decline with caution. The high volume suggests continued selling pressure, not just a shallow dip. I would become neutral if $SOXLB reclaims the $60 level and holds it with consistent volume. Until then, I see no clear opportunity for a long position.
I am waiting for volume to decrease on further price drops, or for a clear bounce with strong buying volume to indicate a shift.
#SOXLB #ExtremeFear
The market's Fear & Greed Index is at 12, indicating Extreme Fear. Bitcoin's 24-hour change is a smaller -0.22%. The RSI for $SOXLB is neutral at 48.7.
I am observing this decline with caution. The high volume suggests continued selling pressure, not just a shallow dip. I would become neutral if $SOXLB reclaims the $60 level and holds it with consistent volume. Until then, I see no clear opportunity for a long position.
I am waiting for volume to decrease on further price drops, or for a clear bounce with strong buying volume to indicate a shift.
#SOXLB #ExtremeFear
114

Today's Losers 📊
1. $ZIL: -10.39%
💰 $0.000914 | Vol: $3.98M
2. $KAVA: -8.42%
💰 $0.03 | Vol: $3.78M
3. $SNXXB: -7.46%
💰 $3.10 | Vol: $5.20M
4. KMNO: -7.20%
💰 $0.03 | Vol: $1.12M
5. OMNI: -6.51%
💰 $3.88 | Vol: $1.11M
6. KORUB: -6.44%
💰 $6.83 | Vol: $12.32M
7. $牛来: -6.44%
💰 $0.05 | Vol: $3.55M
8. BABAB: -5.73%
💰 $88.23 | Vol: $1.01M
9. SOXLB: -5.54%
💰 $51.98 | Vol: $64.16M
10. TQQQB: -5.46%
💰 $53.98 | Vol: $3.90M
🟢 Bullish
What do you think?
#OMNI #SOXLB #TQQQB #News #MarketUpdate
📱 Follow @PoorCryptoMan
Today's Losers 📊
1. $ZIL : -10.39%
💰 $0.000914 | Vol: $3.98M
2. $KAVA : -8.42%
💰 $0.03 | Vol: $3.78M
3. $SNXXB : -7.46%
💰 $3.10 | Vol: $5.20M
4. KMNO: -7.20%
💰 $0.03 | Vol: $1.12M
5. OMNI: -6.51%
💰 $3.88 | Vol: $1.11M
6. KORUB: -6.44%
💰 $6.83 | Vol: $12.32M
7. $牛来: -6.44%
💰 $0.05 | Vol: $3.55M
8. BABAB: -5.73%
💰 $88.23 | Vol: $1.01M
9. SOXLB: -5.54%
💰 $51.98 | Vol: $64.16M
10. TQQQB: -5.46%
💰 $53.98 | Vol: $3.90M
🟢 Bullish
What do you think?
#OMNI #SOXLB #TQQQB #News #MarketUpdate
📱 Follow @PoorCryptoMan
1. $ZIL : -10.39%
💰 $0.000914 | Vol: $3.98M
2. $KAVA : -8.42%
💰 $0.03 | Vol: $3.78M
3. $SNXXB : -7.46%
💰 $3.10 | Vol: $5.20M
4. KMNO: -7.20%
💰 $0.03 | Vol: $1.12M
5. OMNI: -6.51%
💰 $3.88 | Vol: $1.11M
6. KORUB: -6.44%
💰 $6.83 | Vol: $12.32M
7. $牛来: -6.44%
💰 $0.05 | Vol: $3.55M
8. BABAB: -5.73%
💰 $88.23 | Vol: $1.01M
9. SOXLB: -5.54%
💰 $51.98 | Vol: $64.16M
10. TQQQB: -5.46%
💰 $53.98 | Vol: $3.90M
🟢 Bullish
What do you think?
#OMNI #SOXLB #TQQQB #News #MarketUpdate
📱 Follow @PoorCryptoMan
1
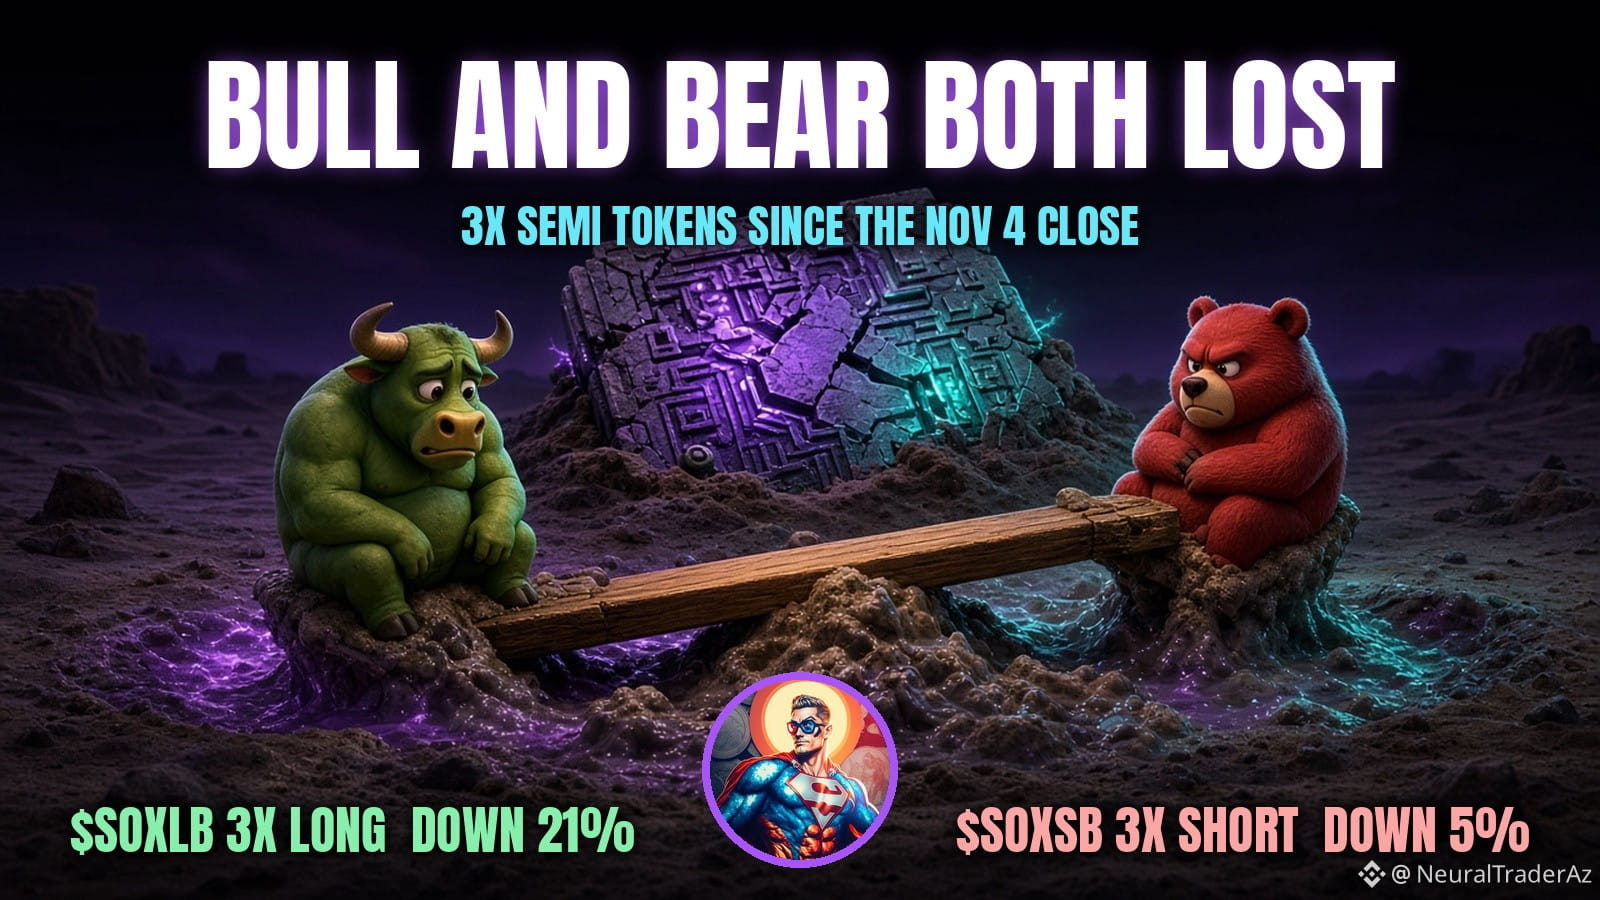
🚨 WHY BOTH LONG AND SHORT LEVERAGED TOKENS LIKE $SOXLB BLED DURING HIGH VOLATILITY 📉
📊 Structural decay in leveraged products like $SOXLB is a masterclass in mathematical drag. When underlying assets experience violent intraday whipsaws, the daily reset mechanism relentlessly bleeds capital from both directional camps. ⚡
We watched $SOXLB plunge from 65 to under 41 before violently ripping back to 70 within days, yet both long and short tokens finished net negative. These instruments are engineered exclusively for short-term momentum capture, never for parking capital through choppy range expansions.
💬 Have you factored daily volatility decay into your portfolio management when trading leveraged assets? 👇
⚠️ Not financial advice. Always manage your risk. 🛡️
🏷️ #SOXLB #TradingPsychology #RiskManagement #Crypto
🎯 🦈
🚨 WHY BOTH LONG AND SHORT LEVERAGED TOKENS LIKE $SOXLB BLED DURING HIGH VOLATILITY 📉
📊 Structural decay in leveraged products like $SOXLB is a masterclass in mathematical drag. When underlying assets experience violent intraday whipsaws, the daily reset mechanism relentlessly bleeds capital from both directional camps. ⚡
We watched $SOXLB plunge from 65 to under 41 before violently ripping back to 70 within days, yet both long and short tokens finished net negative. These instruments are engineered exclusively for short-term momentum capture, never for parking capital through choppy range expansions.
💬 Have you factored daily volatility decay into your portfolio management when trading leveraged assets? 👇
⚠️ Not financial advice. Always manage your risk. 🛡️
🏷️ #SOXLB #TradingPsychology #RiskManagement #Crypto
🎯 🦈
📊 Structural decay in leveraged products like $SOXLB is a masterclass in mathematical drag. When underlying assets experience violent intraday whipsaws, the daily reset mechanism relentlessly bleeds capital from both directional camps. ⚡
We watched $SOXLB plunge from 65 to under 41 before violently ripping back to 70 within days, yet both long and short tokens finished net negative. These instruments are engineered exclusively for short-term momentum capture, never for parking capital through choppy range expansions.
💬 Have you factored daily volatility decay into your portfolio management when trading leveraged assets? 👇
⚠️ Not financial advice. Always manage your risk. 🛡️
🏷️ #SOXLB #TradingPsychology #RiskManagement #Crypto
🎯 🦈
14
Log in to explore more content
Join global crypto users on Binance Square
⚡️ Get latest and useful information about crypto.
💬 Trusted by the world’s largest crypto exchange.
👍 Discover real insights from verified creators.
Email / Phone number
Trending Topics
1
#NvidiaBeatsEstimatesWith$130BQ4Outlook
2,354 views
49 Discussing
2
#AnthropicIPOPriceCouldExceed$80
5,964 views
54 Discussing
3
#CanNvidia’sDataCenterGrowthContinue?
12,992 views
229 Discussing
4
#DBSAndCirclePartnerToExpandAsianInstitutionsUSDCAccess
400 views
7 Discussing
5
#NvidiaBoardNotConsideringHuang’sReturnasCEO
169,812 views
1,249 Discussing
6
#KOSPIFalls2.59%ToLowestCloseSinceFebruary
46,778 views
517 Discussing
7
#AnthropicClearedToListOnNasdaqAsANT
41,004 views
408 Discussing
8
#WhatInvestmentSignalsDo13FFilingsReveal?
91,792 views
812 Discussing
9
#TetherCapitalMakesStrategicInvestmentInStables
23,695 views
224 Discussing
10
#EvernorthRecords$505MImpairmentOnPreListingXRP
2,752 views
30 Discussing