
Anas btt
7.9k Posts

Anas btt
Report
Block User
Open Trade
Frequent Trader
2.8 Years
347 Following
578 Followers
805 Liked
Posts
Portfolio
All
Quotes
PINNED
·
--
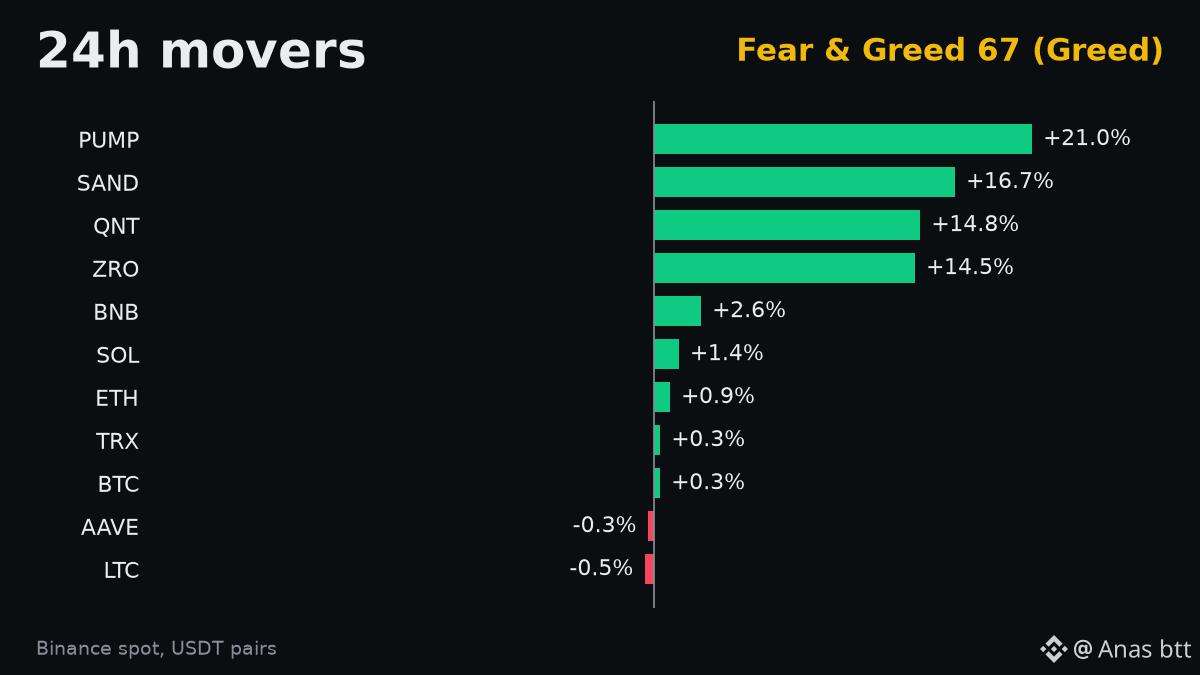
The worst coin on today's movers list is $LTC, and it is down only 0.5%.
That is the real story of the last 24 hours. The bottom of the board is barely red: LTC -0.5%, AAVE -0.3%, and the rest of the "losers" are actually small gains. BTC is up 0.3% at 84,758.
The action is at the top. $PUMP leads with +21.0% on about 37M USDT of volume. SAND (+16.7%) and QNT (+14.8%) follow with about 62-63M USDT each, so those two moves have more money behind them than the leader.
One thing does not fit: Fear & Greed is 67 (Greed), down from 72 yesterday. Almost nothing is falling, yet sentiment cooled a little. Prices are green, but the mood is less hot than a day ago.
What I am watching next: whether the gainers can hold while BTC stays flat. If the 67 keeps sliding while small coins keep running, the two are telling different stories, and one of them will be wrong.
#FearAndGreed #PumpFun
The worst coin on today's movers list is $LTC , and it is down only 0.5%.
That is the real story of the last 24 hours. The bottom of the board is barely red: LTC -0.5%, AAVE -0.3%, and the rest of the "losers" are actually small gains. BTC is up 0.3% at 84,758.
The action is at the top. $PUMP leads with +21.0% on about 37M USDT of volume. SAND (+16.7%) and QNT (+14.8%) follow with about 62-63M USDT each, so those two moves have more money behind them than the leader.
One thing does not fit: Fear & Greed is 67 (Greed), down from 72 yesterday. Almost nothing is falling, yet sentiment cooled a little. Prices are green, but the mood is less hot than a day ago.
What I am watching next: whether the gainers can hold while BTC stays flat. If the 67 keeps sliding while small coins keep running, the two are telling different stories, and one of them will be wrong.
#FearAndGreed #PumpFun
That is the real story of the last 24 hours. The bottom of the board is barely red: LTC -0.5%, AAVE -0.3%, and the rest of the "losers" are actually small gains. BTC is up 0.3% at 84,758.
The action is at the top. $PUMP leads with +21.0% on about 37M USDT of volume. SAND (+16.7%) and QNT (+14.8%) follow with about 62-63M USDT each, so those two moves have more money behind them than the leader.
One thing does not fit: Fear & Greed is 67 (Greed), down from 72 yesterday. Almost nothing is falling, yet sentiment cooled a little. Prices are green, but the mood is less hot than a day ago.
What I am watching next: whether the gainers can hold while BTC stays flat. If the 67 keeps sliding while small coins keep running, the two are telling different stories, and one of them will be wrong.
#FearAndGreed #PumpFun
1
996
PINNED
·
--
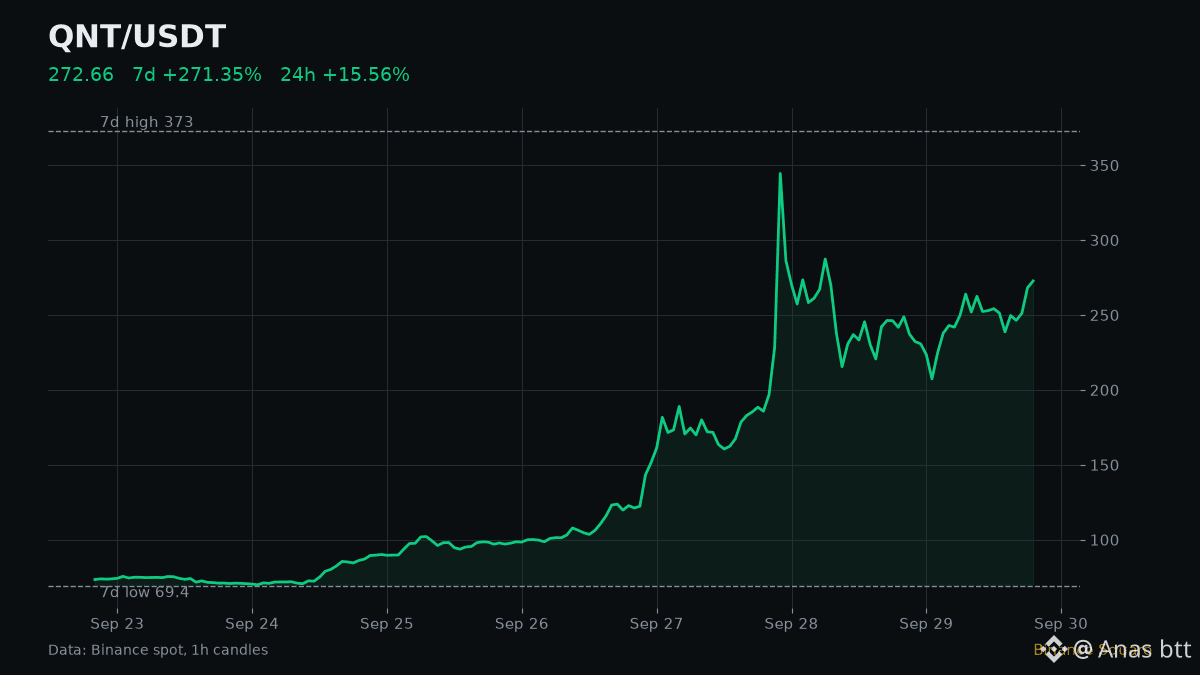
$QNT is up 271% in seven days. It ran from a 7-day low of 69.4 to a high of 373 and now trades at 272.66.
The detail I keep coming back to is volume. 24h turnover is about 153.9M USDT, 1.9 times the 7-day average. That average already includes the whole run, so buyers have not left yet.
It also added 15.6% in the last 24 hours while $BTC moved only 0.35%. This is its own story, not the market lifting everything.
Still, price sits 26.9% below the 373 high, and the chart shows that spike was short and sold off hard. Hourly RSI at 61 is warm, not extreme.
My view: I respect the strength, but I will not chase a coin that is up 271% in a week. No trade yet.
What would make me bullish: a hold above 373 with volume still near 2x its average.
What would make me cautious: a drop back under about 236, where price stood 24 hours ago. That erases today's gain and points to fading demand.
Fear & Greed at 73 says the crowd is already leaning in. Next I watch whether volume holds on the next test of the highs.
$QNT is up 271% in seven days. It ran from a 7-day low of 69.4 to a high of 373 and now trades at 272.66.
The detail I keep coming back to is volume. 24h turnover is about 153.9M USDT, 1.9 times the 7-day average. That average already includes the whole run, so buyers have not left yet.
It also added 15.6% in the last 24 hours while $BTC moved only 0.35%. This is its own story, not the market lifting everything.
Still, price sits 26.9% below the 373 high, and the chart shows that spike was short and sold off hard. Hourly RSI at 61 is warm, not extreme.
My view: I respect the strength, but I will not chase a coin that is up 271% in a week. No trade yet.
What would make me bullish: a hold above 373 with volume still near 2x its average.
What would make me cautious: a drop back under about 236, where price stood 24 hours ago. That erases today's gain and points to fading demand.
Fear & Greed at 73 says the crowd is already leaning in. Next I watch whether volume holds on the next test of the highs.
The detail I keep coming back to is volume. 24h turnover is about 153.9M USDT, 1.9 times the 7-day average. That average already includes the whole run, so buyers have not left yet.
It also added 15.6% in the last 24 hours while $BTC moved only 0.35%. This is its own story, not the market lifting everything.
Still, price sits 26.9% below the 373 high, and the chart shows that spike was short and sold off hard. Hourly RSI at 61 is warm, not extreme.
My view: I respect the strength, but I will not chase a coin that is up 271% in a week. No trade yet.
What would make me bullish: a hold above 373 with volume still near 2x its average.
What would make me cautious: a drop back under about 236, where price stood 24 hours ago. That erases today's gain and points to fading demand.
Fear & Greed at 73 says the crowd is already leaning in. Next I watch whether volume holds on the next test of the highs.
1
516
·
--
Article
Weekly Market Review: Steep Declines and Extreme FearThe past week saw significant declines across the crypto market, with major assets experiencing sharp corrections. $BTC fell 14.585% and $ETH dropped 19.162% over the last seven days. This downturn has pushed market sentiment into "Extreme Fear," with the Fear & Greed Index now at 10.
Bitcoin Review
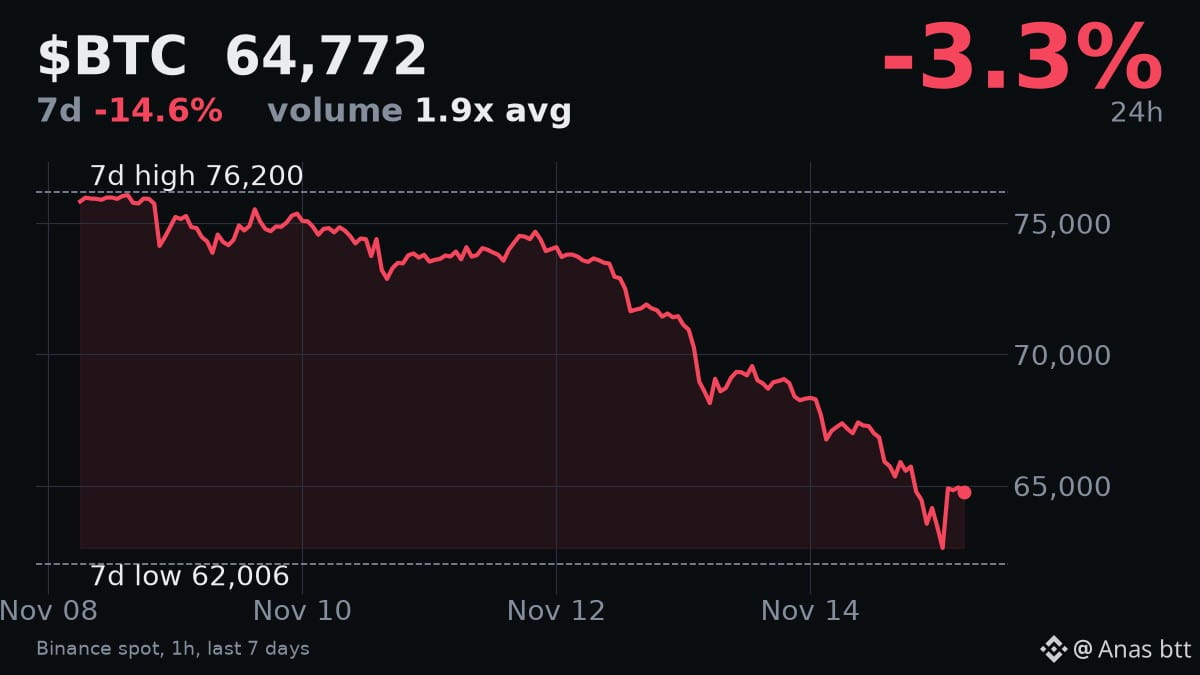
$BTC is currently trading at $64,771.53, down 3.297% in the last 24 hours. The weekly chart shows a notable decline of 14.585%. This move followed its 7-day high of $76,200.0, with the price now sitting almost 15% below that peak. The trading volume for $BTC in the last 24 hours was $2.48 billion USDT, which is 1.897 times its 7-day average volume. High volume on a downward move often confirms selling pressure.
My view on $BTC is bearish as long as it trades below the $70,000 level. The significant drop and sustained selling volume indicate that bears are in control. A clear break and sustained trading above $70,000 would be needed to reconsider a bullish stance. On the downside, the 7-day low of $62,006.0 is the immediate support to watch. A break below this level could lead to further declines.
Ethereum Review
$ETH is trading at $1,805.96, showing a 4.924% decrease over the past 24 hours. Over the last seven days, $ETH has seen a more pronounced decline of 19.162%. It touched a 7-day high of $2,246.0 and is now nearly 20% off that high. Volume for $ETH was $1.01 billion USDT in the last 24 hours, which is 1.729 times its 7-day average. Like $BTC, this elevated volume during a decline suggests conviction in the bearish move.
My view on $ETH is bearish, similar to $BTC. The sharp weekly drop and the current trading below $2,000 are clear bearish signals. For a shift in view, I would look for $ETH to reclaim and hold above the $2,000 mark with strong volume. The immediate support is the 7-day low of $1,711.08. Losing this level would confirm further downside potential.
Notable Movers
Among the top gainers, SOPH stood out with a 24-hour increase of 25.61%, reaching $0.00206 on a volume of $26.502 million USDT. This move comes amid a broad market downturn, suggesting specific positive sentiment or event for this asset.
On the losing side, KAVA experienced a significant drop, plummeting 56.237% in the last 24 hours to $0.02996. This was the steepest decline among the top assets, with $23.164 million USDT in trading volume. Other notable losers include ASTER, down 18.017%, and INJ, down 12.082%. Such large percentage drops indicate strong selling pressure or specific negative news for these assets.
Sentiment and Funding
The market sentiment, as measured by the Fear & Greed Index, has shifted firmly into "Extreme Fear." The index currently stands at 10, down from 13 yesterday. This rapid decrease reflects widespread apprehension among market participants following the recent price action. When the index is this low, it typically indicates that many traders are capitulating.
I note that the funding rates for $BTC and $ETH are currently not available in the provided data. However, the general sentiment indicates that any prior signs of crowded longs have likely been cleared out during this sharp correction.
What I am watching next week
For $BTC, I will be closely watching the $62,006.0 level. A sustained break below this point would signal further weakness and potentially target lower supports. On the upside, reclaiming $68,000 and holding it would be the first sign of a potential reversal, but a move above $70,000 is needed to shift my bearish view.
For $ETH, the key level to watch is the 7-day low of $1,711.08. A break below this would be a strong bearish continuation signal. To invalidate the current bearish view, $ETH would need to consolidate above $1,850 and then push towards $2,000 with strong buying volume. Until then, caution is warranted.
#WeeklyCrypto #MarketCorrection
Weekly Market Review: Steep Declines and Extreme Fear
The past week saw significant declines across the crypto market, with major assets experiencing sharp corrections. $BTC fell 14.585% and $ETH dropped 19.162% over the last seven days. This downturn has pushed market sentiment into "Extreme Fear," with the Fear & Greed Index now at 10.
Bitcoin Review
$BTC is currently trading at $64,771.53, down 3.297% in the last 24 hours. The weekly chart shows a notable decline of 14.585%. This move followed its 7-day high of $76,200.0, with the price now sitting almost 15% below that peak. The trading volume for $BTC in the last 24 hours was $2.48 billion USDT, which is 1.897 times its 7-day average volume. High volume on a downward move often confirms selling pressure.
My view on $BTC is bearish as long as it trades below the $70,000 level. The significant drop and sustained selling volume indicate that bears are in control. A clear break and sustained trading above $70,000 would be needed to reconsider a bullish stance. On the downside, the 7-day low of $62,006.0 is the immediate support to watch. A break below this level could lead to further declines.
Ethereum Review
$ETH is trading at $1,805.96, showing a 4.924% decrease over the past 24 hours. Over the last seven days, $ETH has seen a more pronounced decline of 19.162%. It touched a 7-day high of $2,246.0 and is now nearly 20% off that high. Volume for $ETH was $1.01 billion USDT in the last 24 hours, which is 1.729 times its 7-day average. Like $BTC , this elevated volume during a decline suggests conviction in the bearish move.
My view on $ETH is bearish, similar to $BTC . The sharp weekly drop and the current trading below $2,000 are clear bearish signals. For a shift in view, I would look for $ETH to reclaim and hold above the $2,000 mark with strong volume. The immediate support is the 7-day low of $1,711.08. Losing this level would confirm further downside potential.
Notable Movers
Among the top gainers, SOPH stood out with a 24-hour increase of 25.61%, reaching $0.00206 on a volume of $26.502 million USDT. This move comes amid a broad market downturn, suggesting specific positive sentiment or event for this asset.
On the losing side, KAVA experienced a significant drop, plummeting 56.237% in the last 24 hours to $0.02996. This was the steepest decline among the top assets, with $23.164 million USDT in trading volume. Other notable losers include ASTER, down 18.017%, and INJ, down 12.082%. Such large percentage drops indicate strong selling pressure or specific negative news for these assets.
Sentiment and Funding
The market sentiment, as measured by the Fear & Greed Index, has shifted firmly into "Extreme Fear." The index currently stands at 10, down from 13 yesterday. This rapid decrease reflects widespread apprehension among market participants following the recent price action. When the index is this low, it typically indicates that many traders are capitulating.
I note that the funding rates for $BTC and $ETH are currently not available in the provided data. However, the general sentiment indicates that any prior signs of crowded longs have likely been cleared out during this sharp correction.
What I am watching next week
For $BTC , I will be closely watching the $62,006.0 level. A sustained break below this point would signal further weakness and potentially target lower supports. On the upside, reclaiming $68,000 and holding it would be the first sign of a potential reversal, but a move above $70,000 is needed to shift my bearish view.
For $ETH , the key level to watch is the 7-day low of $1,711.08. A break below this would be a strong bearish continuation signal. To invalidate the current bearish view, $ETH would need to consolidate above $1,850 and then push towards $2,000 with strong buying volume. Until then, caution is warranted.
#WeeklyCrypto #MarketCorrection
Bitcoin Review
$BTC is currently trading at $64,771.53, down 3.297% in the last 24 hours. The weekly chart shows a notable decline of 14.585%. This move followed its 7-day high of $76,200.0, with the price now sitting almost 15% below that peak. The trading volume for $BTC in the last 24 hours was $2.48 billion USDT, which is 1.897 times its 7-day average volume. High volume on a downward move often confirms selling pressure.
My view on $BTC is bearish as long as it trades below the $70,000 level. The significant drop and sustained selling volume indicate that bears are in control. A clear break and sustained trading above $70,000 would be needed to reconsider a bullish stance. On the downside, the 7-day low of $62,006.0 is the immediate support to watch. A break below this level could lead to further declines.
Ethereum Review
$ETH is trading at $1,805.96, showing a 4.924% decrease over the past 24 hours. Over the last seven days, $ETH has seen a more pronounced decline of 19.162%. It touched a 7-day high of $2,246.0 and is now nearly 20% off that high. Volume for $ETH was $1.01 billion USDT in the last 24 hours, which is 1.729 times its 7-day average. Like $BTC , this elevated volume during a decline suggests conviction in the bearish move.
My view on $ETH is bearish, similar to $BTC . The sharp weekly drop and the current trading below $2,000 are clear bearish signals. For a shift in view, I would look for $ETH to reclaim and hold above the $2,000 mark with strong volume. The immediate support is the 7-day low of $1,711.08. Losing this level would confirm further downside potential.
Notable Movers
Among the top gainers, SOPH stood out with a 24-hour increase of 25.61%, reaching $0.00206 on a volume of $26.502 million USDT. This move comes amid a broad market downturn, suggesting specific positive sentiment or event for this asset.
On the losing side, KAVA experienced a significant drop, plummeting 56.237% in the last 24 hours to $0.02996. This was the steepest decline among the top assets, with $23.164 million USDT in trading volume. Other notable losers include ASTER, down 18.017%, and INJ, down 12.082%. Such large percentage drops indicate strong selling pressure or specific negative news for these assets.
Sentiment and Funding
The market sentiment, as measured by the Fear & Greed Index, has shifted firmly into "Extreme Fear." The index currently stands at 10, down from 13 yesterday. This rapid decrease reflects widespread apprehension among market participants following the recent price action. When the index is this low, it typically indicates that many traders are capitulating.
I note that the funding rates for $BTC and $ETH are currently not available in the provided data. However, the general sentiment indicates that any prior signs of crowded longs have likely been cleared out during this sharp correction.
What I am watching next week
For $BTC , I will be closely watching the $62,006.0 level. A sustained break below this point would signal further weakness and potentially target lower supports. On the upside, reclaiming $68,000 and holding it would be the first sign of a potential reversal, but a move above $70,000 is needed to shift my bearish view.
For $ETH , the key level to watch is the 7-day low of $1,711.08. A break below this would be a strong bearish continuation signal. To invalidate the current bearish view, $ETH would need to consolidate above $1,850 and then push towards $2,000 with strong buying volume. Until then, caution is warranted.
#WeeklyCrypto #MarketCorrection
17
·
--
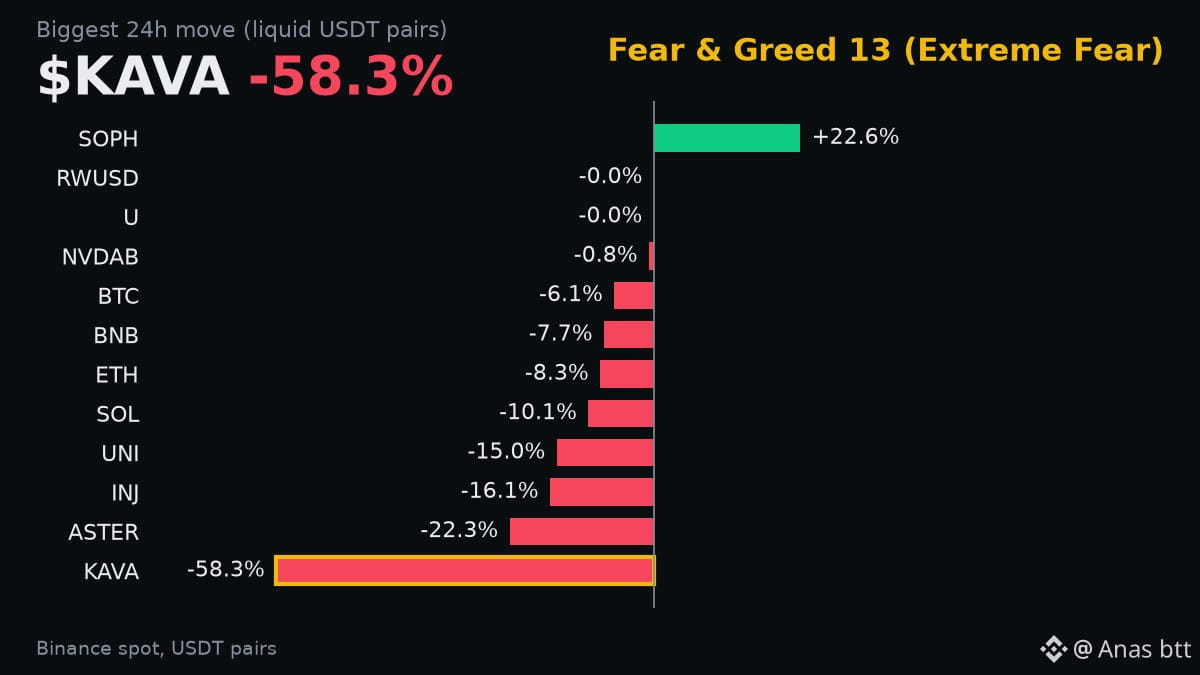
$KAVA has plummeted by 58.339% in the last 24 hours, trading at $0.02825. This extreme drop comes as the wider market faces significant pressure.
$BTC is down 6.125% to $64,122, and $ETH is down 8.309%. The Fear & Greed Index has also fallen further to 13, indicating "Extreme Fear." This confirms broad market weakness.
My view is bearish given the sharp declines across the board and the prevailing sentiment. A sustained rebound in the major cryptocurrencies, particularly $BTC holding above $65,000 with increasing volume, would shift this outlook.
I am watching for any signs of buying interest returning to the larger cap coins. Weak volume breakouts are unlikely to last.
#Kava #ExtremeFear
$KAVA has plummeted by 58.339% in the last 24 hours, trading at $0.02825. This extreme drop comes as the wider market faces significant pressure.
$BTC is down 6.125% to $64,122, and $ETH is down 8.309%. The Fear & Greed Index has also fallen further to 13, indicating "Extreme Fear." This confirms broad market weakness.
My view is bearish given the sharp declines across the board and the prevailing sentiment. A sustained rebound in the major cryptocurrencies, particularly $BTC holding above $65,000 with increasing volume, would shift this outlook.
I am watching for any signs of buying interest returning to the larger cap coins. Weak volume breakouts are unlikely to last.
#Kava #ExtremeFear
$BTC is down 6.125% to $64,122, and $ETH is down 8.309%. The Fear & Greed Index has also fallen further to 13, indicating "Extreme Fear." This confirms broad market weakness.
My view is bearish given the sharp declines across the board and the prevailing sentiment. A sustained rebound in the major cryptocurrencies, particularly $BTC holding above $65,000 with increasing volume, would shift this outlook.
I am watching for any signs of buying interest returning to the larger cap coins. Weak volume breakouts are unlikely to last.
#Kava #ExtremeFear
228
·
--
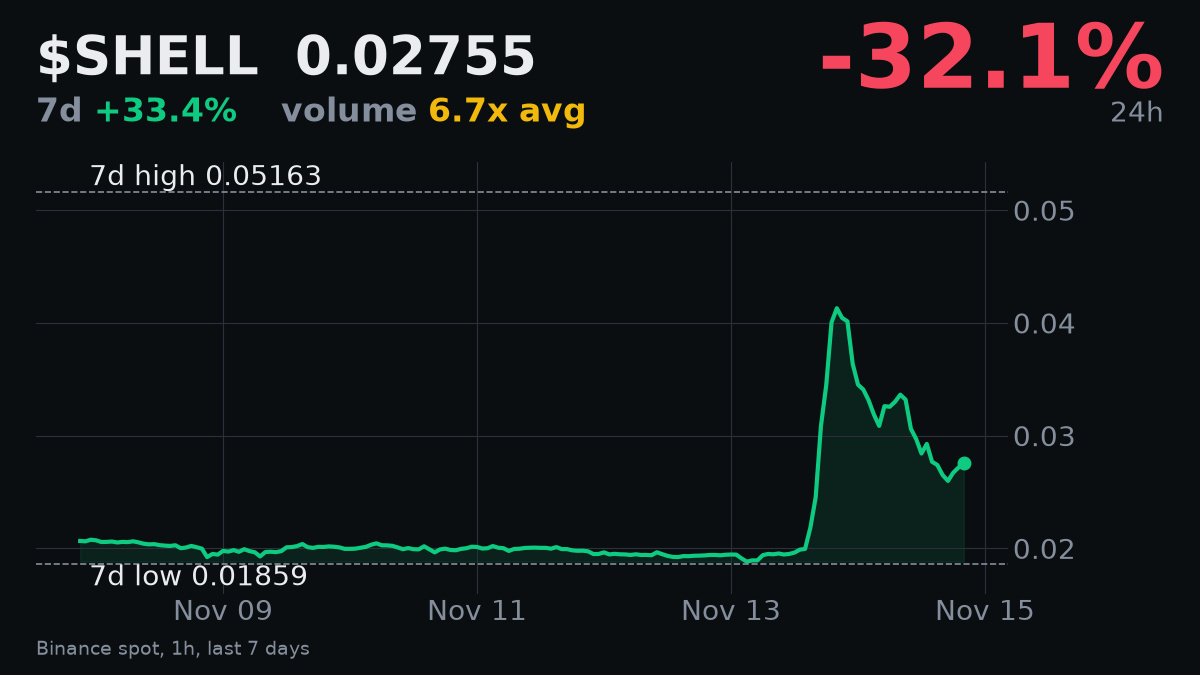
$SHELL has dropped significantly, down over 32% in the last 24 hours to $0.02755. This comes after it surged earlier in the week, now sitting 46.64% below its 7-day high of $0.05163. Despite the sharp decline, 24-hour trading volume is still very high, more than 6.7 times its 7-day average. The 14-hour RSI is neutral at 45.0.
My view is bearish given this rapid retracement from its high. The overall market sentiment is also in "Extreme Fear" with Bitcoin down 4.64% today. A clear move back above the previous 7-day high of $0.05163 would change this view. I am waiting to see if this high volume persists or if it diminishes, which could signal further downside pressure for $SHELL.
#SHELLToken #PriceAction
$SHELL has dropped significantly, down over 32% in the last 24 hours to $0.02755. This comes after it surged earlier in the week, now sitting 46.64% below its 7-day high of $0.05163. Despite the sharp decline, 24-hour trading volume is still very high, more than 6.7 times its 7-day average. The 14-hour RSI is neutral at 45.0.
My view is bearish given this rapid retracement from its high. The overall market sentiment is also in "Extreme Fear" with Bitcoin down 4.64% today. A clear move back above the previous 7-day high of $0.05163 would change this view. I am waiting to see if this high volume persists or if it diminishes, which could signal further downside pressure for $SHELL .
#SHELLToken #PriceAction
My view is bearish given this rapid retracement from its high. The overall market sentiment is also in "Extreme Fear" with Bitcoin down 4.64% today. A clear move back above the previous 7-day high of $0.05163 would change this view. I am waiting to see if this high volume persists or if it diminishes, which could signal further downside pressure for $SHELL .
#SHELLToken #PriceAction
1
134
·
--
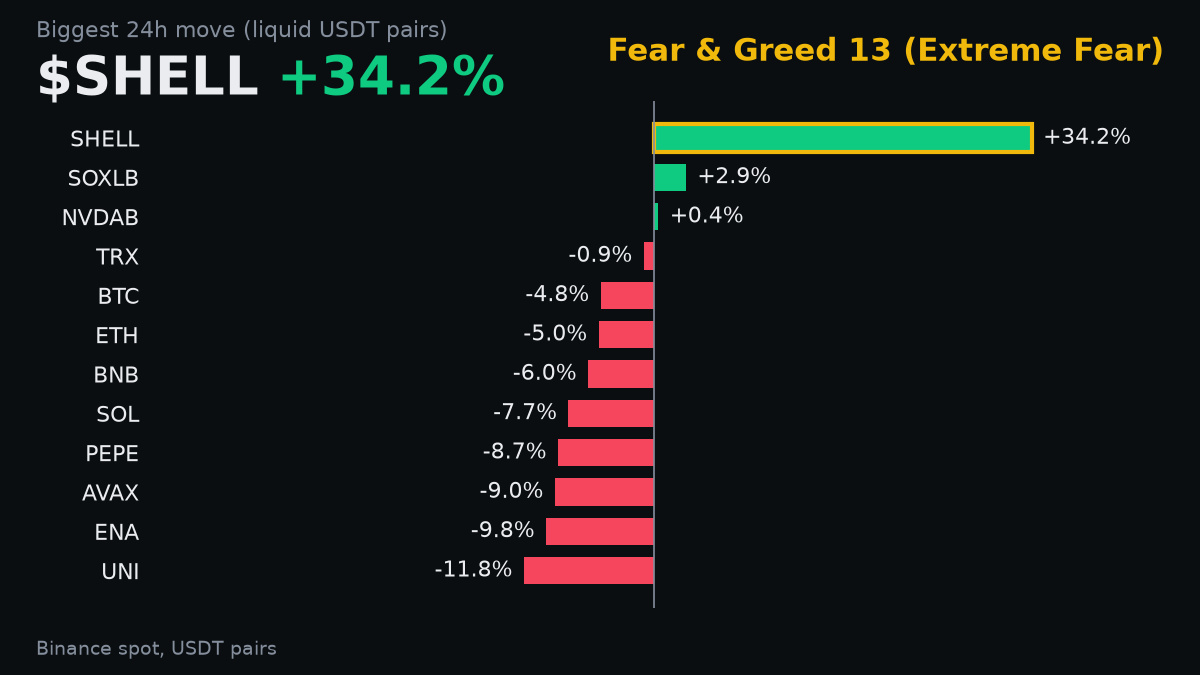
The crypto market's Fear & Greed Index has plunged to 13 today, down from 20 yesterday. This shows a rapid shift to "Extreme Fear" as market sentiment deteriorates.
This extreme fear aligns with a broad market pullback. $BTC is down 4.825% to $65,400. Other majors like $ETH fell 5.01% to $1,835.5 and $SOL dropped 7.74% to $73.55.
My view is bearish given the sustained selling pressure and the dramatic shift in sentiment. High volume sell-offs on declining sentiment often suggest further downside is possible. I would need to see a sustained move back above $68,000 for $BTC to consider a change in this outlook.
I am watching closely for any recovery to be backed by significant buying volume. I will also be watching for the Fear & Greed Index to move out of Extreme Fear.
The crypto market's Fear & Greed Index has plunged to 13 today, down from 20 yesterday. This shows a rapid shift to "Extreme Fear" as market sentiment deteriorates.
This extreme fear aligns with a broad market pullback. $BTC is down 4.825% to $65,400. Other majors like $ETH fell 5.01% to $1,835.5 and $SOL dropped 7.74% to $73.55.
My view is bearish given the sustained selling pressure and the dramatic shift in sentiment. High volume sell-offs on declining sentiment often suggest further downside is possible. I would need to see a sustained move back above $68,000 for $BTC to consider a change in this outlook.
I am watching closely for any recovery to be backed by significant buying volume. I will also be watching for the Fear & Greed Index to move out of Extreme Fear.
This extreme fear aligns with a broad market pullback. $BTC is down 4.825% to $65,400. Other majors like $ETH fell 5.01% to $1,835.5 and $SOL dropped 7.74% to $73.55.
My view is bearish given the sustained selling pressure and the dramatic shift in sentiment. High volume sell-offs on declining sentiment often suggest further downside is possible. I would need to see a sustained move back above $68,000 for $BTC to consider a change in this outlook.
I am watching closely for any recovery to be backed by significant buying volume. I will also be watching for the Fear & Greed Index to move out of Extreme Fear.
27
·
--
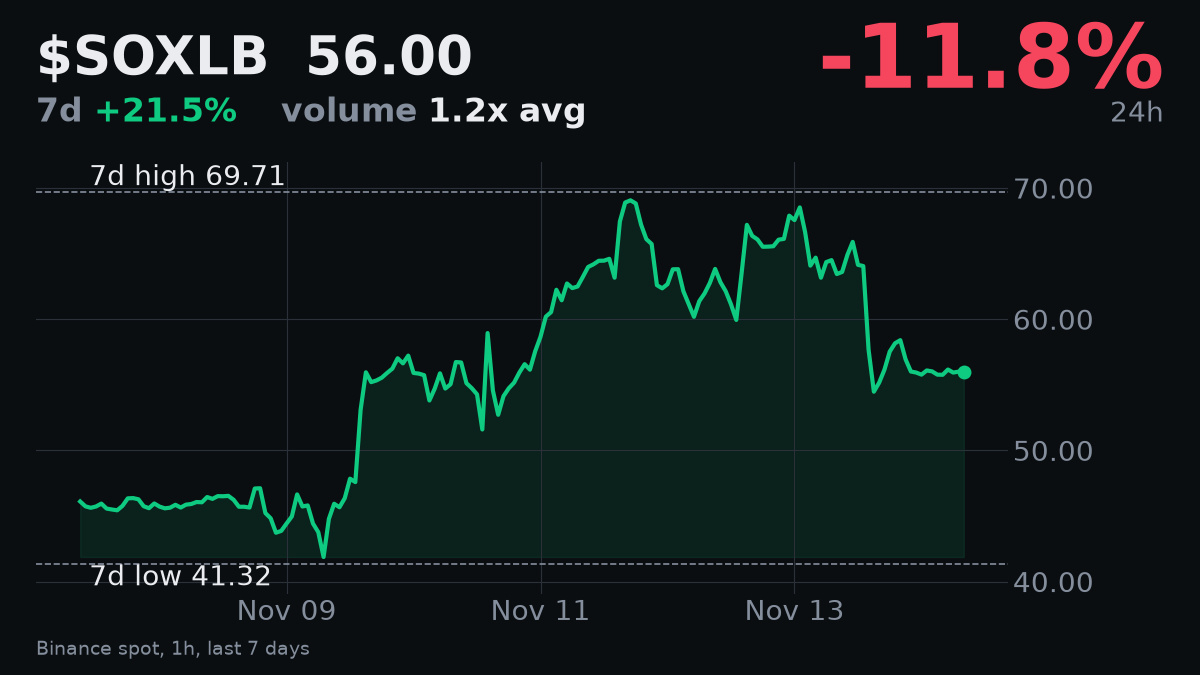
$SOXLB is down 11.839% today to $56.0, pulling back from its 7-day high of $69.71. Despite today's drop, it is still up 21.475% over the past week.
The price is now almost 20% below that weekly high. Trading volume for $SOXLB remains strong at $45 million in 24 hours, 1.233 times its 7-day average. The 14-hour RSI is 37.3.
My view is that this is a healthy pullback within an existing uptrend. The broader market is also in 'Extreme Fear' with the Fear & Greed Index at 13 today, down from 20 yesterday, and $BTC fell 2.47%.
If $SOXLB were to fall below its 7-day low of $41.32, that would change my view to bearish. A break above the $69.71 high would signal renewed strength.
I am watching for consistent volume to confirm if this consolidation phase holds, or if sellers take it lower.
#SOXLB #MarketPullback
$SOXLB is down 11.839% today to $56.0, pulling back from its 7-day high of $69.71. Despite today's drop, it is still up 21.475% over the past week.
The price is now almost 20% below that weekly high. Trading volume for $SOXLB remains strong at $45 million in 24 hours, 1.233 times its 7-day average. The 14-hour RSI is 37.3.
My view is that this is a healthy pullback within an existing uptrend. The broader market is also in 'Extreme Fear' with the Fear & Greed Index at 13 today, down from 20 yesterday, and $BTC fell 2.47%.
If $SOXLB were to fall below its 7-day low of $41.32, that would change my view to bearish. A break above the $69.71 high would signal renewed strength.
I am watching for consistent volume to confirm if this consolidation phase holds, or if sellers take it lower.
#SOXLB #MarketPullback
The price is now almost 20% below that weekly high. Trading volume for $SOXLB remains strong at $45 million in 24 hours, 1.233 times its 7-day average. The 14-hour RSI is 37.3.
My view is that this is a healthy pullback within an existing uptrend. The broader market is also in 'Extreme Fear' with the Fear & Greed Index at 13 today, down from 20 yesterday, and $BTC fell 2.47%.
If $SOXLB were to fall below its 7-day low of $41.32, that would change my view to bearish. A break above the $69.71 high would signal renewed strength.
I am watching for consistent volume to confirm if this consolidation phase holds, or if sellers take it lower.
#SOXLB #MarketPullback
163
·
--
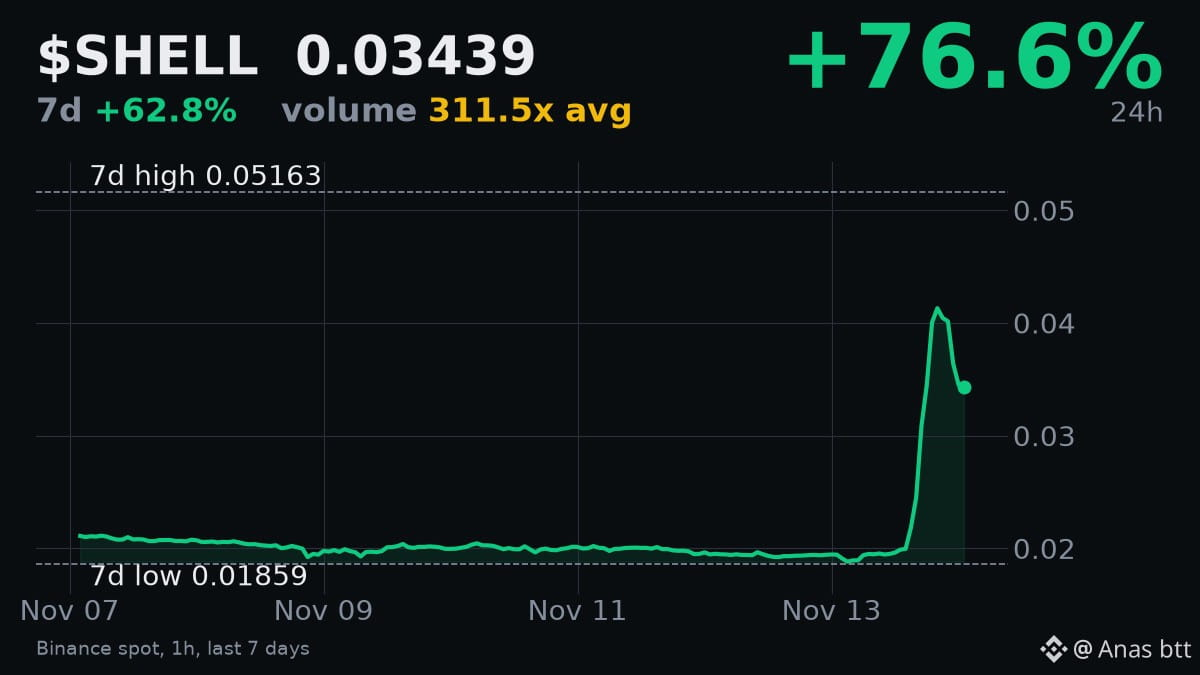
$SHELL is up a significant 76.631% in the last 24 hours, trading at $0.03439. This strong move stands out while $BTC dropped 3.66% and the market's Fear & Greed Index is at 'Extreme Fear' (13). Trading volume for $SHELL was 3.11 times its 7-day average, confirming the move.
Despite the daily gain, $SHELL is still 33.391% below its 7-day high of $0.05163. The 14-hour RSI is 67.3, which is approaching overbought levels. My view remains bullish as long as the price stays above $0.03. A sustained break below that level would change my view to neutral. I am watching for $SHELL to recover towards its 7-day high on continued strong volume to show lasting momentum.
#SHELL #Volume
$SHELL is up a significant 76.631% in the last 24 hours, trading at $0.03439. This strong move stands out while $BTC dropped 3.66% and the market's Fear & Greed Index is at 'Extreme Fear' (13). Trading volume for $SHELL was 3.11 times its 7-day average, confirming the move.
Despite the daily gain, $SHELL is still 33.391% below its 7-day high of $0.05163. The 14-hour RSI is 67.3, which is approaching overbought levels. My view remains bullish as long as the price stays above $0.03. A sustained break below that level would change my view to neutral. I am watching for $SHELL to recover towards its 7-day high on continued strong volume to show lasting momentum.
#SHELL #Volume
Despite the daily gain, $SHELL is still 33.391% below its 7-day high of $0.05163. The 14-hour RSI is 67.3, which is approaching overbought levels. My view remains bullish as long as the price stays above $0.03. A sustained break below that level would change my view to neutral. I am watching for $SHELL to recover towards its 7-day high on continued strong volume to show lasting momentum.
#SHELL #Volume
162
·
--
#BinancePick
🚀 Binance Pick is a fun way to test your prediction skills! 📊
Analyze the market, make smart predictions, and learn from every result. 🎯
💡 Think smart, stay patient, and manage your risks!
🔥 Are you ready for your next prediction?
#Binance #Crypto
#BinancePick
🚀 Binance Pick is a fun way to test your prediction skills! 📊
Analyze the market, make smart predictions, and learn from every result. 🎯
💡 Think smart, stay patient, and manage your risks!
🔥 Are you ready for your next prediction?
#Binance #Crypto
🚀 Binance Pick is a fun way to test your prediction skills! 📊
Analyze the market, make smart predictions, and learn from every result. 🎯
💡 Think smart, stay patient, and manage your risks!
🔥 Are you ready for your next prediction?
#Binance #Crypto
68
·
--
Binance Pick is a fun way to test your prediction skills!
Analyze the market, make smart predictions, and learn from every result.
Think smart, stay patient, and manage your risks!
#BinancePick
#Binance #Crypto
Binance Pick is a fun way to test your prediction skills!
Analyze the market, make smart predictions, and learn from every result.
Think smart, stay patient, and manage your risks!
#BinancePick
#Binance #Crypto
Analyze the market, make smart predictions, and learn from every result.
Think smart, stay patient, and manage your risks!
#BinancePick
#Binance #Crypto
75
·
--
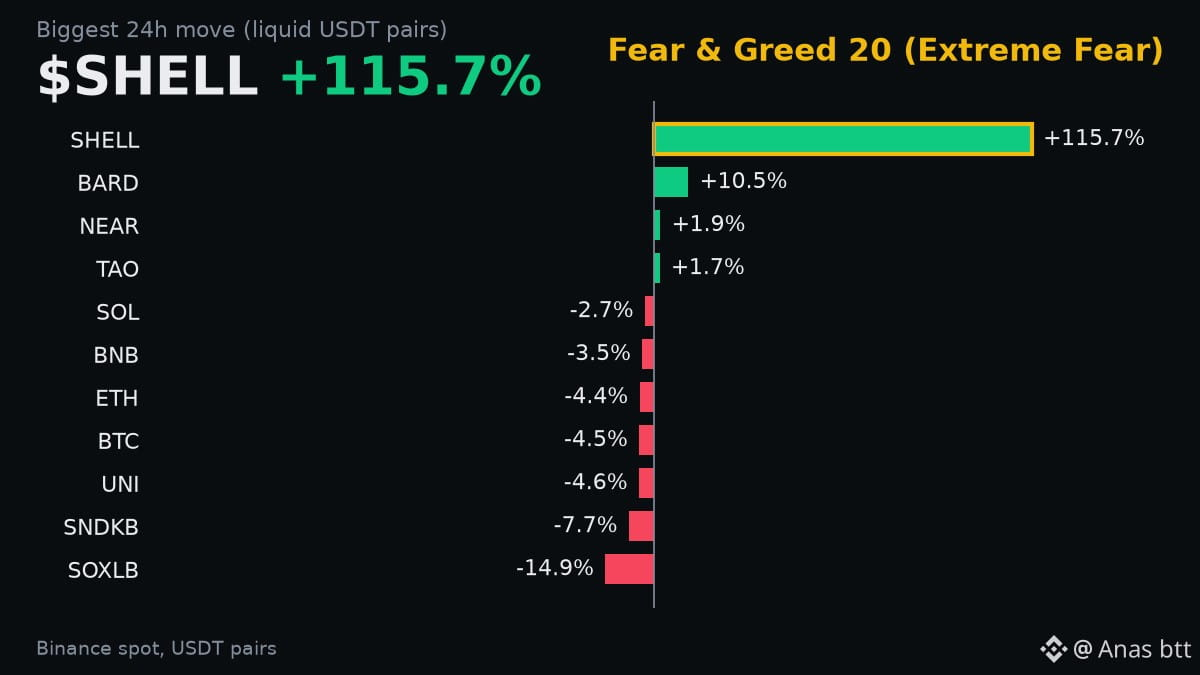
$BTC has dropped 4.5% to $68,385.17 in the last 24 hours, alongside the Fear & Greed Index falling to 20, indicating 'Extreme Fear'. This decline in price comes with significant trading volume at $1.99 billion. Such a broad market sentiment shift suggests caution is warranted. I am not seeing a clear trade here yet. A sustained bounce with confirming volume, pushing $BTC above $70,000, would change my bearish view. I will be watching for signs of demand absorbing this selling pressure.
#MarketSentiment
#PriceAction
$BTC has dropped 4.5% to $68,385.17 in the last 24 hours, alongside the Fear & Greed Index falling to 20, indicating 'Extreme Fear'. This decline in price comes with significant trading volume at $1.99 billion. Such a broad market sentiment shift suggests caution is warranted. I am not seeing a clear trade here yet. A sustained bounce with confirming volume, pushing $BTC above $70,000, would change my bearish view. I will be watching for signs of demand absorbing this selling pressure.
#MarketSentiment
#PriceAction
#MarketSentiment
#PriceAction
1
635
·
--
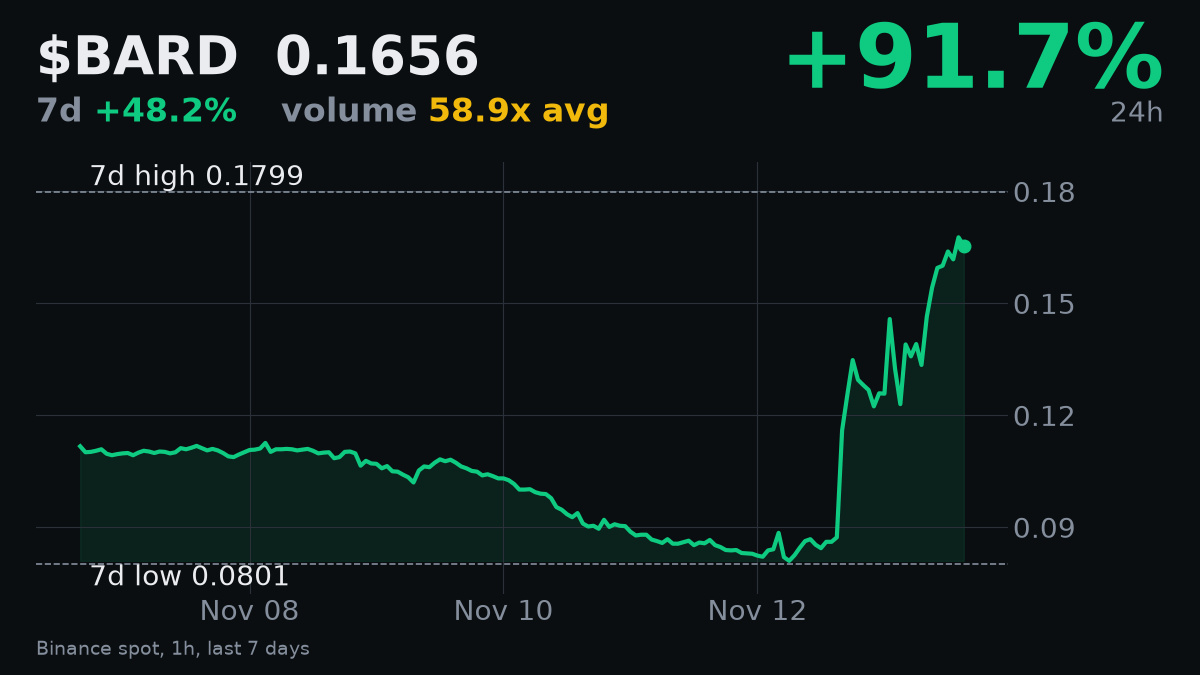
$BARD is up 91.667% in the last 24 hours to $0.1656, but this strong move is on very low volume, just 58.893% of its 7-day average. The 14-hour RSI is 70.6, indicating the asset is overbought. This price action contrasts with the broader market, where $BTC is down 3.83% and the Fear & Greed Index sits at 20, marking "Extreme Fear."
This low-volume pump is concerning. I am not bullish on $BARD until I see a decisive break above its 7-day high of $0.1799, confirmed by significantly higher trading volume. Without that, this rally appears unsustainable.
#BARD #PriceAction
$BARD is up 91.667% in the last 24 hours to $0.1656, but this strong move is on very low volume, just 58.893% of its 7-day average. The 14-hour RSI is 70.6, indicating the asset is overbought. This price action contrasts with the broader market, where $BTC is down 3.83% and the Fear & Greed Index sits at 20, marking "Extreme Fear."
This low-volume pump is concerning. I am not bullish on $BARD until I see a decisive break above its 7-day high of $0.1799, confirmed by significantly higher trading volume. Without that, this rally appears unsustainable.
#BARD #PriceAction
This low-volume pump is concerning. I am not bullish on $BARD until I see a decisive break above its 7-day high of $0.1799, confirmed by significantly higher trading volume. Without that, this rally appears unsustainable.
#BARD #PriceAction
198
·
--
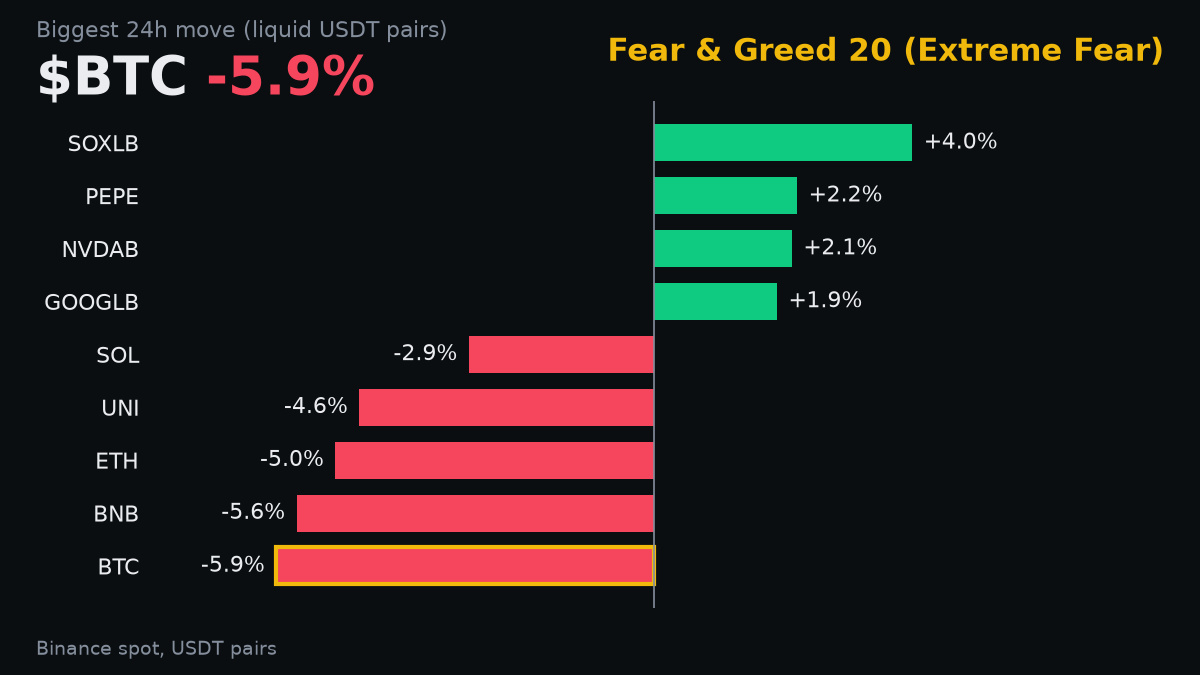
The market's Fear & Greed Index dropped significantly to 20 today, down from 28 yesterday, entering "Extreme Fear." This sentiment shift comes as $BTC fell 5.886% to $69,198, with high trading volume of $1.93 billion.
Other major coins like $ETH and $BNB also saw sharp declines. This widespread pullback and the shift to extreme fear suggest caution. Volume remains high on the downside.
I maintain a bearish view until we see a sustained bounce with strong buying volume. A return above $70,000 for $BTC with conviction would be a first step to change this outlook.
Watch for any signs of accumulation on major support levels, or a recovery in the Fear & Greed Index value.
#MarketSentiment #CryptoBear
The market's Fear & Greed Index dropped significantly to 20 today, down from 28 yesterday, entering "Extreme Fear." This sentiment shift comes as $BTC fell 5.886% to $69,198, with high trading volume of $1.93 billion.
Other major coins like $ETH and $BNB also saw sharp declines. This widespread pullback and the shift to extreme fear suggest caution. Volume remains high on the downside.
I maintain a bearish view until we see a sustained bounce with strong buying volume. A return above $70,000 for $BTC with conviction would be a first step to change this outlook.
Watch for any signs of accumulation on major support levels, or a recovery in the Fear & Greed Index value.
#MarketSentiment #CryptoBear
Other major coins like $ETH and $BNB also saw sharp declines. This widespread pullback and the shift to extreme fear suggest caution. Volume remains high on the downside.
I maintain a bearish view until we see a sustained bounce with strong buying volume. A return above $70,000 for $BTC with conviction would be a first step to change this outlook.
Watch for any signs of accumulation on major support levels, or a recovery in the Fear & Greed Index value.
#MarketSentiment #CryptoBear
45
·
--
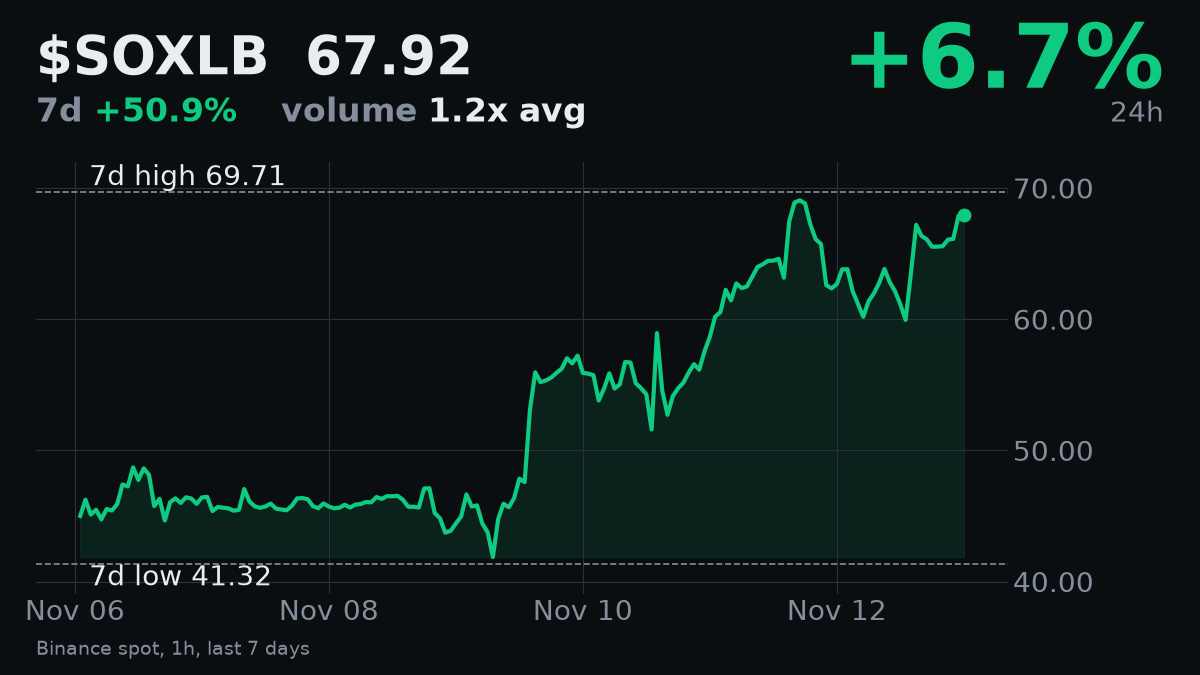
$SOXLB has surged over 50% in the last seven days, trading at $67.92. Today, it is up another 6.675% on volume 1.151 times its 7-day average. This confirms strong buying interest.
The price is only 2.568% below its 7-day high of $69.71. The 14-hour RSI is 64.0, suggesting there is still room for upward movement.
This strength is notable, considering $BTC is down almost 4% today and the broader market is in 'Extreme Fear.' My view is bullish on $SOXLB. If the price closes below $65.00, it would indicate a loss of momentum and change my view to neutral.
I will be watching if $SOXLB can break cleanly above its 7-day high of $69.71 on sustained volume.
#SOXLB #StrongMomentum
$SOXLB has surged over 50% in the last seven days, trading at $67.92. Today, it is up another 6.675% on volume 1.151 times its 7-day average. This confirms strong buying interest.
The price is only 2.568% below its 7-day high of $69.71. The 14-hour RSI is 64.0, suggesting there is still room for upward movement.
This strength is notable, considering $BTC is down almost 4% today and the broader market is in 'Extreme Fear.' My view is bullish on $SOXLB . If the price closes below $65.00, it would indicate a loss of momentum and change my view to neutral.
I will be watching if $SOXLB can break cleanly above its 7-day high of $69.71 on sustained volume.
#SOXLB #StrongMomentum
The price is only 2.568% below its 7-day high of $69.71. The 14-hour RSI is 64.0, suggesting there is still room for upward movement.
This strength is notable, considering $BTC is down almost 4% today and the broader market is in 'Extreme Fear.' My view is bullish on $SOXLB . If the price closes below $65.00, it would indicate a loss of momentum and change my view to neutral.
I will be watching if $SOXLB can break cleanly above its 7-day high of $69.71 on sustained volume.
#SOXLB #StrongMomentum
255
·
--
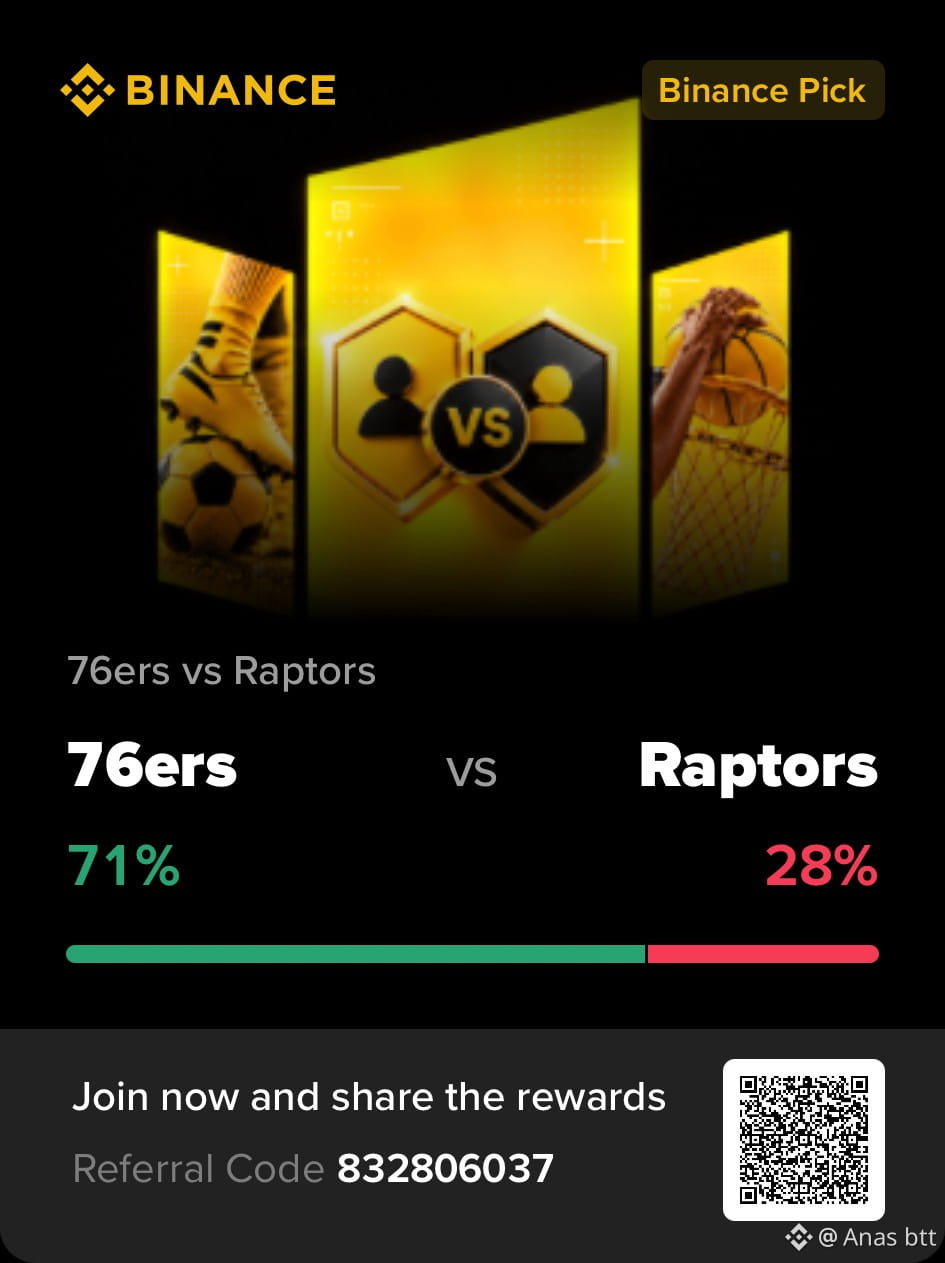
Binance Pick is a fun way to test your prediction skills!
Analyze the market, make smart predictions, and learn from every result.
Think smart, stay patient, and manage your risks!
Are you ready for your next prediction?
#BinancePick #Binance #Crypto
Binance Pick is a fun way to test your prediction skills!
Analyze the market, make smart predictions, and learn from every result.
Think smart, stay patient, and manage your risks!
Are you ready for your next prediction?
#BinancePick #Binance #Crypto
Analyze the market, make smart predictions, and learn from every result.
Think smart, stay patient, and manage your risks!
Are you ready for your next prediction?
#BinancePick #Binance #Crypto
77
·
--
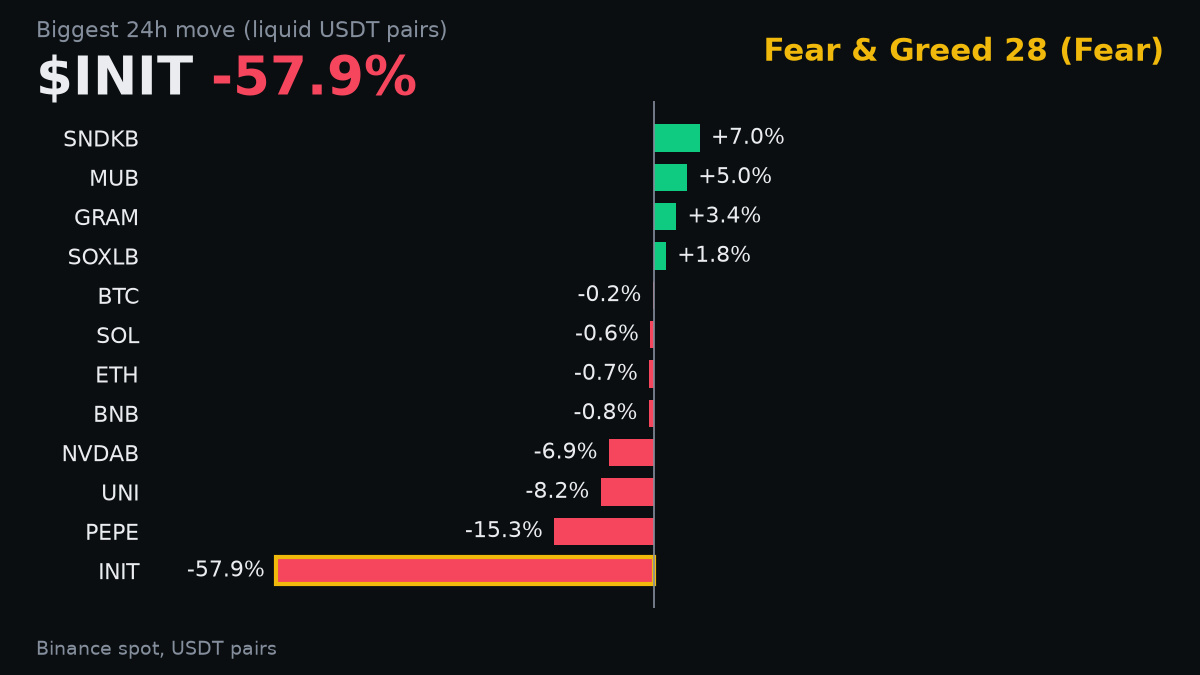
A major move today is $INIT's 57.896% drop, bringing its price to $0.114. This sharp decline was backed by $38.853 million in trading volume.
This significant price decline on substantial volume suggests strong selling pressure. The market is clearly bearish on $INIT right now.
My view would change if we see $INIT stabilize and reclaim higher levels, especially above $0.15, on sustained buying volume.
I am watching for signs of exhaustion in selling or a clear shift in volume towards accumulation.
#INIT #MarketMove
A major move today is $INIT 's 57.896% drop, bringing its price to $0.114. This sharp decline was backed by $38.853 million in trading volume.
This significant price decline on substantial volume suggests strong selling pressure. The market is clearly bearish on $INIT right now.
My view would change if we see $INIT stabilize and reclaim higher levels, especially above $0.15, on sustained buying volume.
I am watching for signs of exhaustion in selling or a clear shift in volume towards accumulation.
#INIT #MarketMove
This significant price decline on substantial volume suggests strong selling pressure. The market is clearly bearish on $INIT right now.
My view would change if we see $INIT stabilize and reclaim higher levels, especially above $0.15, on sustained buying volume.
I am watching for signs of exhaustion in selling or a clear shift in volume towards accumulation.
#INIT #MarketMove
397
·
--
#BinancePick
Binance Pick is a fun way to test your prediction skills!
Analyze the market, make smart predictions, and learn from every result.
Think smart, stay patient, and manage your risks!
Are you ready for your next prediction?
#Binance #Crypto
#BinancePick
Binance Pick is a fun way to test your prediction skills!
Analyze the market, make smart predictions, and learn from every result.
Think smart, stay patient, and manage your risks!
Are you ready for your next prediction?
#Binance #Crypto
Binance Pick is a fun way to test your prediction skills!
Analyze the market, make smart predictions, and learn from every result.
Think smart, stay patient, and manage your risks!
Are you ready for your next prediction?
#Binance #Crypto

63
·
--
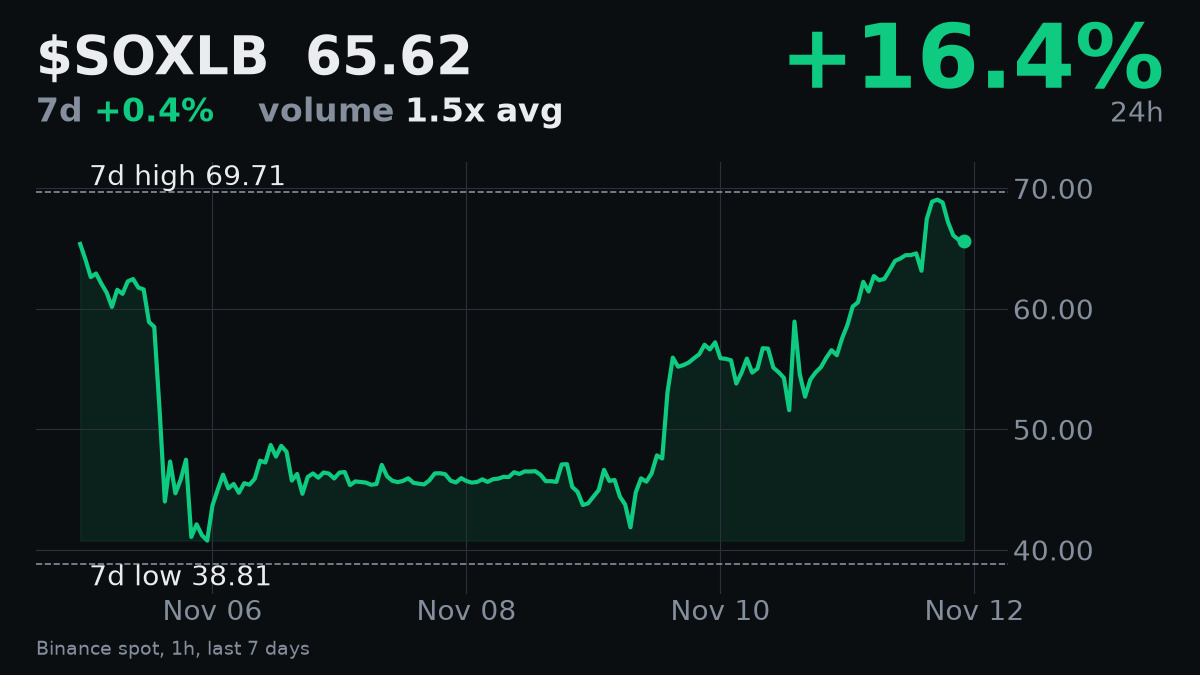
$SOXLB posted a strong 16.43% gain today, trading at $65.62. This move comes with elevated volume, 1.534 times its 7-day average. The 14-hour RSI is 59.2, suggesting potential for further upward momentum.
My view is cautiously bullish. While $SOXLB is still 5.867% below its 7-day high of $69.71, the 7-day change is now positive at 0.3671%. A sustained break above the $69.71 level would confirm a stronger upward trend. Failing to break this resistance, especially on decreasing volume, would change my view to neutral.
I am watching for continued conviction with volume as it approaches the weekly high.
#SOXLB #Semiconductors
$SOXLB posted a strong 16.43% gain today, trading at $65.62. This move comes with elevated volume, 1.534 times its 7-day average. The 14-hour RSI is 59.2, suggesting potential for further upward momentum.
My view is cautiously bullish. While $SOXLB is still 5.867% below its 7-day high of $69.71, the 7-day change is now positive at 0.3671%. A sustained break above the $69.71 level would confirm a stronger upward trend. Failing to break this resistance, especially on decreasing volume, would change my view to neutral.
I am watching for continued conviction with volume as it approaches the weekly high.
#SOXLB #Semiconductors
My view is cautiously bullish. While $SOXLB is still 5.867% below its 7-day high of $69.71, the 7-day change is now positive at 0.3671%. A sustained break above the $69.71 level would confirm a stronger upward trend. Failing to break this resistance, especially on decreasing volume, would change my view to neutral.
I am watching for continued conviction with volume as it approaches the weekly high.
#SOXLB #Semiconductors
200
·
--
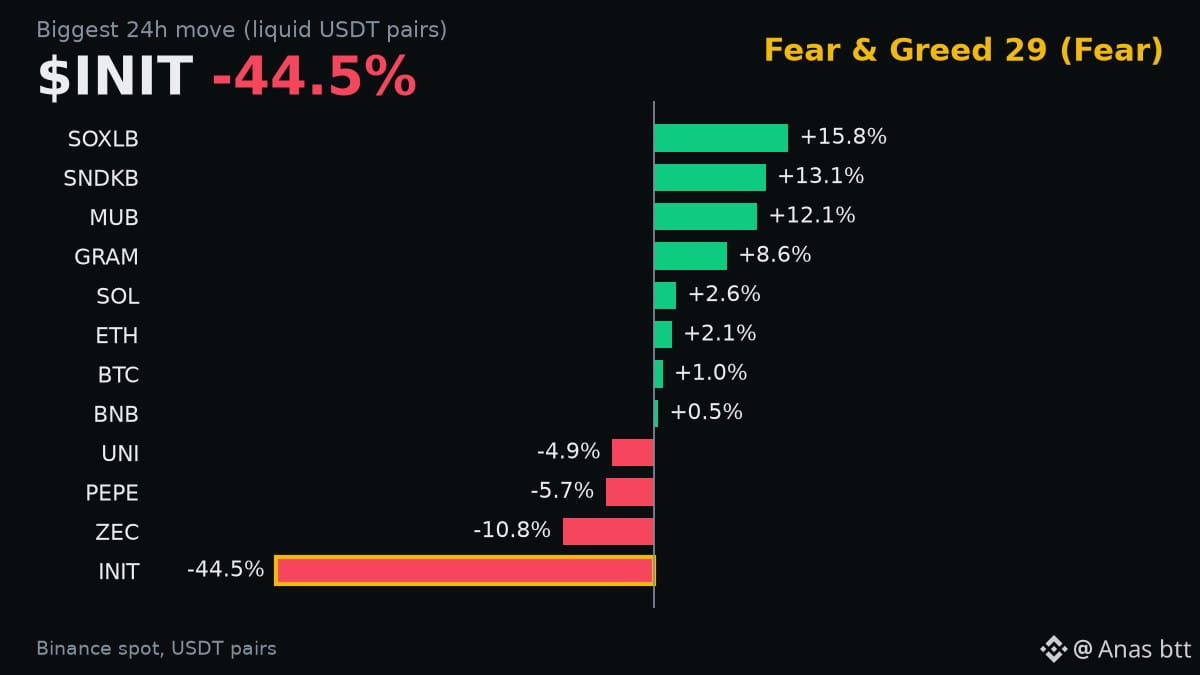
$INIT has fallen sharply, down 44.52% in the last 24 hours to $0.1526. This significant drop was accompanied by $44.24 million in trading volume.
This indicates strong selling pressure. My view is bearish. The sharp decline suggests a lack of buying interest at current levels.
For a bullish reversal, I would look for $INIT to reclaim the $0.20 level with sustained volume. Continued high volume on further declines would confirm this bearish outlook.
#INIT #MarketWatch
$INIT has fallen sharply, down 44.52% in the last 24 hours to $0.1526. This significant drop was accompanied by $44.24 million in trading volume.
This indicates strong selling pressure. My view is bearish. The sharp decline suggests a lack of buying interest at current levels.
For a bullish reversal, I would look for $INIT to reclaim the $0.20 level with sustained volume. Continued high volume on further declines would confirm this bearish outlook.
#INIT #MarketWatch
This indicates strong selling pressure. My view is bearish. The sharp decline suggests a lack of buying interest at current levels.
For a bullish reversal, I would look for $INIT to reclaim the $0.20 level with sustained volume. Continued high volume on further declines would confirm this bearish outlook.
#INIT #MarketWatch
533
·
--
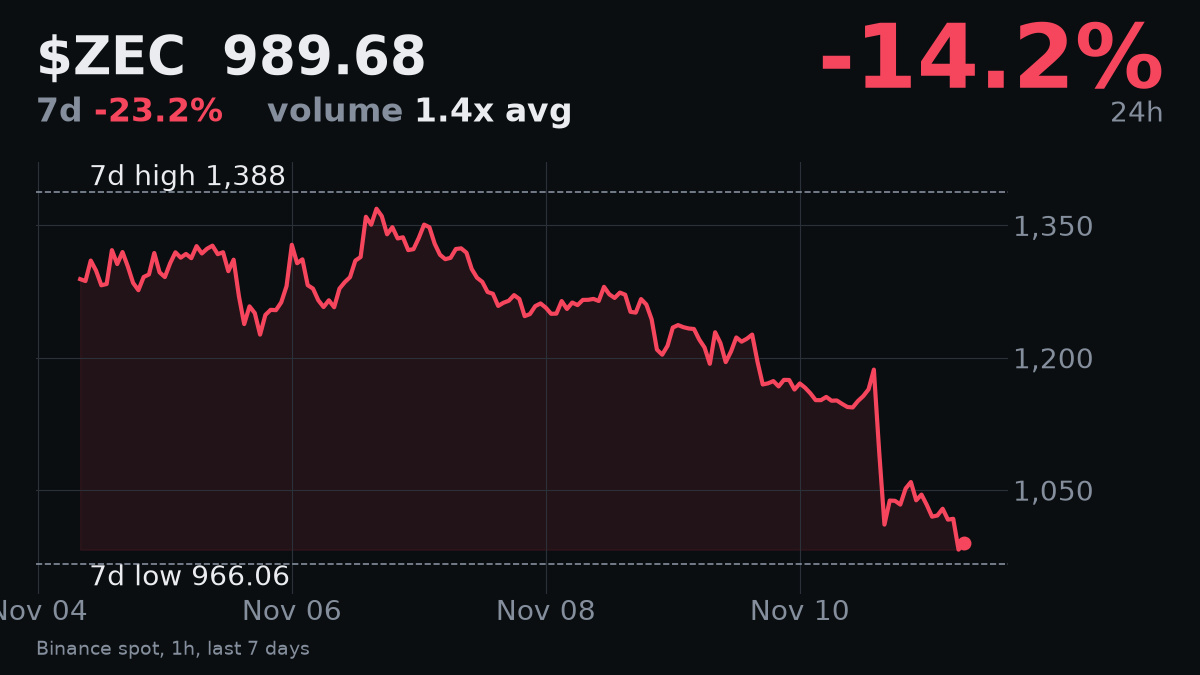
$ZEC has dropped significantly, down 14.238% in the past 24 hours to $989.68. The coin is now 28.697% below its 7-day high. This decline comes with heavy volume, 1.433 times its 7-day average, confirming the selling pressure.
The 14-hour RSI is at 29.0, which shows oversold conditions. However, oversold assets can stay oversold. I am waiting for a clear bullish reversal before considering a trade here. My view would change to neutral if $ZEC closes above its 7-day low of $966.06 on strong volume, indicating potential demand.
#Zcash #MarketUpdate
$ZEC has dropped significantly, down 14.238% in the past 24 hours to $989.68. The coin is now 28.697% below its 7-day high. This decline comes with heavy volume, 1.433 times its 7-day average, confirming the selling pressure.
The 14-hour RSI is at 29.0, which shows oversold conditions. However, oversold assets can stay oversold. I am waiting for a clear bullish reversal before considering a trade here. My view would change to neutral if $ZEC closes above its 7-day low of $966.06 on strong volume, indicating potential demand.
#Zcash #MarketUpdate
The 14-hour RSI is at 29.0, which shows oversold conditions. However, oversold assets can stay oversold. I am waiting for a clear bullish reversal before considering a trade here. My view would change to neutral if $ZEC closes above its 7-day low of $966.06 on strong volume, indicating potential demand.
#Zcash #MarketUpdate
888
Log in to explore more content
Join global crypto users on Binance Square
⚡️ Get latest and useful information about crypto.
💬 Trusted by the world’s largest crypto exchange.
👍 Discover real insights from verified creators.
Email / Phone number
Trending Topics
CryptoSelloffTriggersMultipleWhaleLiquidations
853 views
64 Discussing
Crypto Liquidations Top $2B in 24 Hours as 329,000 Traders Are Wiped Out
Binance News
·5 Likes
·1.8k views
USSpotXRPETFsSeeLargestWeeklyOutflowIn8Months
43,148 views
510 Discussing
WillFOMCMinutesReinforceRateHikeExpectations?
402 views
18 Discussing