
#tqqqb
tqqqb
5,274 views
186 Discussing
Hot
Latest

·
--
$TQQQB +3.91% | $GRAM +3.80% | $AVGOB +3.47%
#TQQQB is trading at $56.03, up +3.91% on $7.4 M of volume. The modest flow suggests the move is still early‑stage.
#GRAM sits at $1.09, climbing +3.80% with $15.0 M changing hands. That volume spike hints at growing interest beyond a simple price bounce.
#AVGOB reached $317.25, gaining +3.47% on $2.1 M of trades. Its lower turnover may make the rise more vulnerable to a quick correction.
Watch the divergence between the strong price gains and the relatively thin volume on AVGOB – a shift there could signal the next direction.
#Write2Earn #Binance
$TQQQB +3.91% | $GRAM +3.80% | $AVGOB +3.47%
#TQQQB is trading at $56.03, up +3.91% on $7.4 M of volume. The modest flow suggests the move is still early‑stage.
#GRAM sits at $1.09, climbing +3.80% with $15.0 M changing hands. That volume spike hints at growing interest beyond a simple price bounce.
#AVGOB reached $317.25, gaining +3.47% on $2.1 M of trades. Its lower turnover may make the rise more vulnerable to a quick correction.
Watch the divergence between the strong price gains and the relatively thin volume on AVGOB – a shift there could signal the next direction.
#Write2Earn #Binance
#TQQQB is trading at $56.03, up +3.91% on $7.4 M of volume. The modest flow suggests the move is still early‑stage.
#GRAM sits at $1.09, climbing +3.80% with $15.0 M changing hands. That volume spike hints at growing interest beyond a simple price bounce.
#AVGOB reached $317.25, gaining +3.47% on $2.1 M of trades. Its lower turnover may make the rise more vulnerable to a quick correction.
Watch the divergence between the strong price gains and the relatively thin volume on AVGOB – a shift there could signal the next direction.
#Write2Earn #Binance
1
·
--
$TQQQB +4.13% | $PYTH +4.01% | $MUUB +3.89%
#TQQQB nudged up to $55.91, gaining +4.13% on $7.4 M of volume.
#PYTH ticked higher to $0.0653, up +4.01% with $3.5 M traded; its decentralized oracle aims to feed real‑time market data to dApps.
#MUUB rose to $14.68, climbing +3.89% on $1.2 M of volume.
📌 The modest flow behind MUUB could limit how far the rally lasts, so watching any shift in buying pressure may be worthwhile.
#Write2Earn #Binance
$TQQQB +4.13% | $PYTH +4.01% | $MUUB +3.89%
#TQQQB nudged up to $55.91, gaining +4.13% on $7.4 M of volume.
#PYTH ticked higher to $0.0653, up +4.01% with $3.5 M traded; its decentralized oracle aims to feed real‑time market data to dApps.
#MUUB rose to $14.68, climbing +3.89% on $1.2 M of volume.
📌 The modest flow behind MUUB could limit how far the rally lasts, so watching any shift in buying pressure may be worthwhile.
#Write2Earn #Binance
#TQQQB nudged up to $55.91, gaining +4.13% on $7.4 M of volume.
#PYTH ticked higher to $0.0653, up +4.01% with $3.5 M traded; its decentralized oracle aims to feed real‑time market data to dApps.
#MUUB rose to $14.68, climbing +3.89% on $1.2 M of volume.
📌 The modest flow behind MUUB could limit how far the rally lasts, so watching any shift in buying pressure may be worthwhile.
#Write2Earn #Binance

·
--
$TQQQB +10.30% | $SNDKB +9.69% | $SKHYB +9.24%
#TQQQB is holding at $57.63, up +10.30% on $6.6 M of volume. The rally feels supported by a decent flow, though the base isn’t huge.
#SNDKB trades around $894.81, gaining +9.69% with a robust $51.1 M of volume. That liquidity could help sustain the move if buyers stay engaged.
#SKHYB sits at $134.91, up +9.24% on $10.2 M of volume. It’s the middle‑sized player here, and its price action mirrors the broader gainers.
👀 Watch whether the heavy volume in SNDKB spills over to the smaller caps, potentially nudging them higher.
#Write2Earn #Binance
$TQQQB +10.30% | $SNDKB +9.69% | $SKHYB +9.24%
#TQQQB is holding at $57.63, up +10.30% on $6.6 M of volume. The rally feels supported by a decent flow, though the base isn’t huge.
#SNDKB trades around $894.81, gaining +9.69% with a robust $51.1 M of volume. That liquidity could help sustain the move if buyers stay engaged.
#SKHYB sits at $134.91, up +9.24% on $10.2 M of volume. It’s the middle‑sized player here, and its price action mirrors the broader gainers.
👀 Watch whether the heavy volume in SNDKB spills over to the smaller caps, potentially nudging them higher.
#Write2Earn #Binance
#TQQQB is holding at $57.63, up +10.30% on $6.6 M of volume. The rally feels supported by a decent flow, though the base isn’t huge.
#SNDKB trades around $894.81, gaining +9.69% with a robust $51.1 M of volume. That liquidity could help sustain the move if buyers stay engaged.
#SKHYB sits at $134.91, up +9.24% on $10.2 M of volume. It’s the middle‑sized player here, and its price action mirrors the broader gainers.
👀 Watch whether the heavy volume in SNDKB spills over to the smaller caps, potentially nudging them higher.
#Write2Earn #Binance


$TQQQB: High Volume: Direction or Hold?
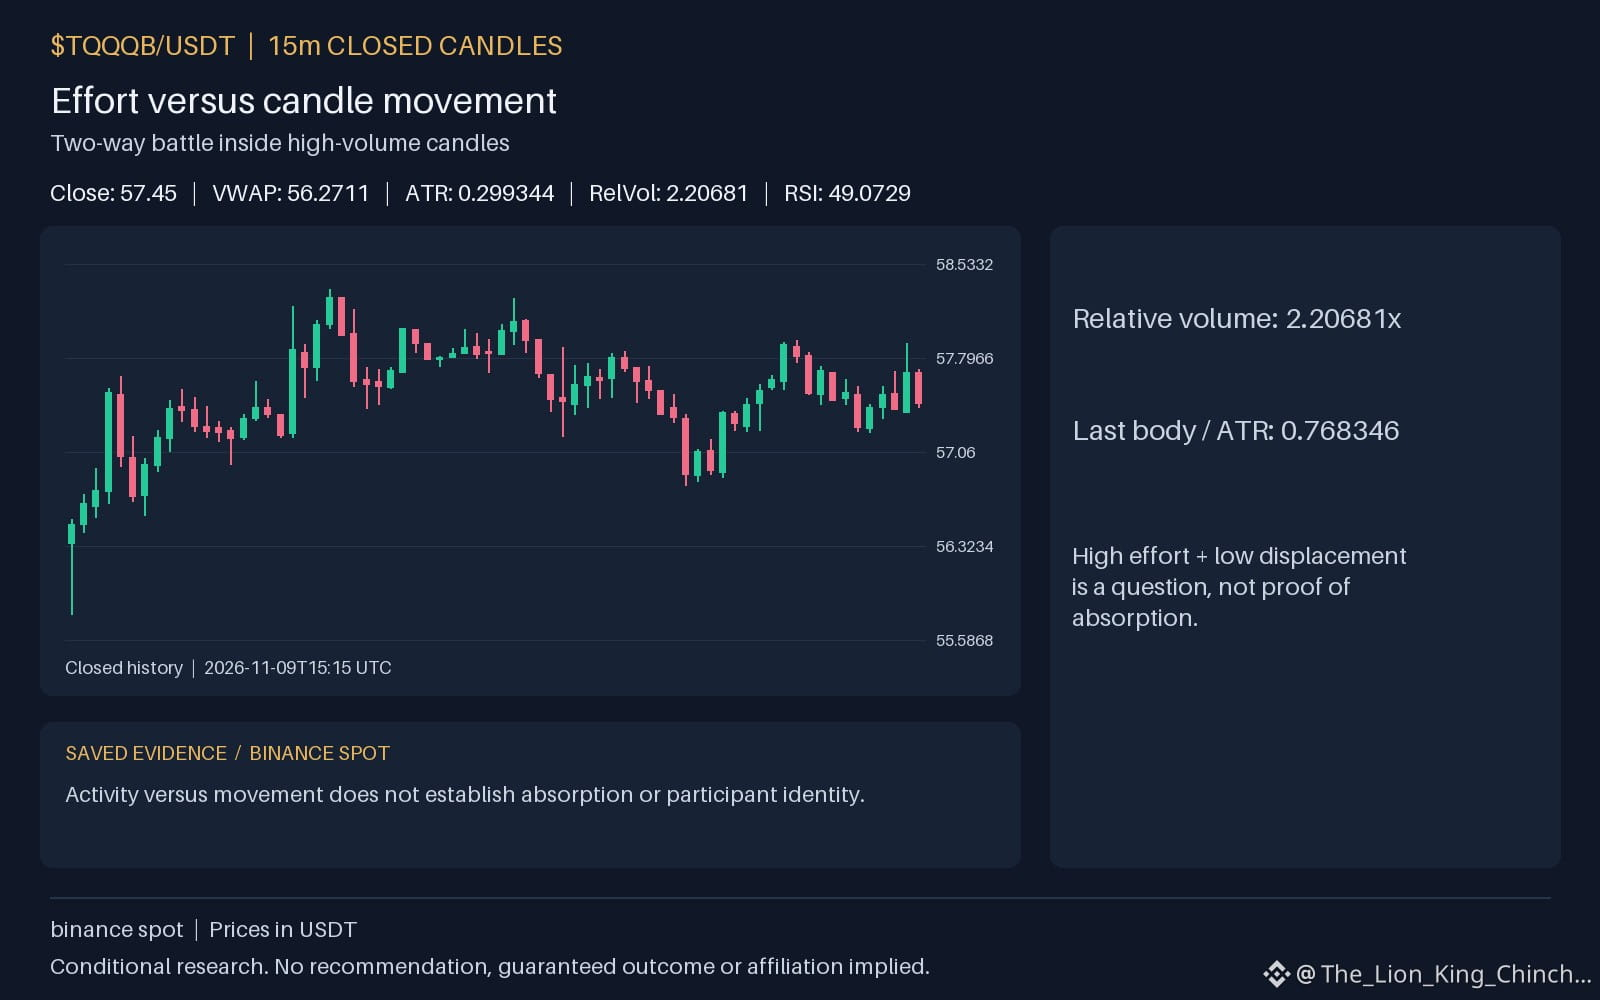
A high volume hour for $TQQQB shows activity above its baseline while price moves up. This could suggest sustained interest. Alternatively, it might simply reflect normal market variation. The RSI is 49.0729 and current price is 57.45, but these do not confirm intent. A hypothetical mechanism imagines two sides trading actively. One side pushes price higher. The other side tries to pull it down. The large candle represents the net result. It does not prove one side won decisively. A counterexample is a high volume candle where price barely changes. This shows heavy activity without clear direction. The analogy helps visualize conflict. It fails because we cannot see the orders behind the prints. Limits include lack of order flow data. No funding or open interest facts are available here. Reassess by checking if the move holds near 57.93 or fades back toward 56.8. If price stabilizes above 57.5022, the upward interpretation gains strength. If it breaks below 56.2711, the neutral reading becomes more likely. 🔍 This thought experiment distinguishes observation from inference. It avoids claiming causation from candle shape. The goal is to watch how the move persists rather than reacting to the size alone.
Probabilistic market research, not a recommendation or guaranteed return.
The comparison to keep in mind: $BTC has hourly direction down and volume above its baseline; $ACT has hourly direction up and volume above its baseline. This alone does not establish correlation.
Which matters more in this comparison: direction or how the move holds?
#TQQQB #BTC
$TQQQB : High Volume: Direction or Hold?
A high volume hour for $TQQQB shows activity above its baseline while price moves up. This could suggest sustained interest. Alternatively, it might simply reflect normal market variation. The RSI is 49.0729 and current price is 57.45, but these do not confirm intent. A hypothetical mechanism imagines two sides trading actively. One side pushes price higher. The other side tries to pull it down. The large candle represents the net result. It does not prove one side won decisively. A counterexample is a high volume candle where price barely changes. This shows heavy activity without clear direction. The analogy helps visualize conflict. It fails because we cannot see the orders behind the prints. Limits include lack of order flow data. No funding or open interest facts are available here. Reassess by checking if the move holds near 57.93 or fades back toward 56.8. If price stabilizes above 57.5022, the upward interpretation gains strength. If it breaks below 56.2711, the neutral reading becomes more likely. 🔍 This thought experiment distinguishes observation from inference. It avoids claiming causation from candle shape. The goal is to watch how the move persists rather than reacting to the size alone.
Probabilistic market research, not a recommendation or guaranteed return.
The comparison to keep in mind: $BTC has hourly direction down and volume above its baseline; $ACT has hourly direction up and volume above its baseline. This alone does not establish correlation.
Which matters more in this comparison: direction or how the move holds?
#TQQQB #BTC
A high volume hour for $TQQQB shows activity above its baseline while price moves up. This could suggest sustained interest. Alternatively, it might simply reflect normal market variation. The RSI is 49.0729 and current price is 57.45, but these do not confirm intent. A hypothetical mechanism imagines two sides trading actively. One side pushes price higher. The other side tries to pull it down. The large candle represents the net result. It does not prove one side won decisively. A counterexample is a high volume candle where price barely changes. This shows heavy activity without clear direction. The analogy helps visualize conflict. It fails because we cannot see the orders behind the prints. Limits include lack of order flow data. No funding or open interest facts are available here. Reassess by checking if the move holds near 57.93 or fades back toward 56.8. If price stabilizes above 57.5022, the upward interpretation gains strength. If it breaks below 56.2711, the neutral reading becomes more likely. 🔍 This thought experiment distinguishes observation from inference. It avoids claiming causation from candle shape. The goal is to watch how the move persists rather than reacting to the size alone.
Probabilistic market research, not a recommendation or guaranteed return.
The comparison to keep in mind: $BTC has hourly direction down and volume above its baseline; $ACT has hourly direction up and volume above its baseline. This alone does not establish correlation.
Which matters more in this comparison: direction or how the move holds?
#TQQQB #BTC
46

·
--
WHALE WALLETS ACCELERATE ACCUMULATION: INSTITUTIONAL FLOWS DOMINATE
Market Data:
🟢 TQQQB: 57.64 (+10.17%)
🟢 KITE: 0.1164 (+6.11%)
🟢 ATOM: 1.391 (+5.62%)
The robust uptick in TQQQB, KITE, and ATOM coincides directly with observed surges in institutional buying volume, signaling smart money accumulation driving a potential supply shock across these assets.
Are you tracking the significant institutional inflows here?
#TQQQB #KITE #ATOM #BinanceSquare #SmartMoney
WHALE WALLETS ACCELERATE ACCUMULATION: INSTITUTIONAL FLOWS DOMINATE
Market Data:
🟢 TQQQB: 57.64 (+10.17%)
🟢 KITE: 0.1164 (+6.11%)
🟢 ATOM: 1.391 (+5.62%)
The robust uptick in TQQQB, KITE, and ATOM coincides directly with observed surges in institutional buying volume, signaling smart money accumulation driving a potential supply shock across these assets.
Are you tracking the significant institutional inflows here?
#TQQQB #KITE #ATOM #BinanceSquare #SmartMoney
Market Data:
🟢 TQQQB: 57.64 (+10.17%)
🟢 KITE: 0.1164 (+6.11%)
🟢 ATOM: 1.391 (+5.62%)
The robust uptick in TQQQB, KITE, and ATOM coincides directly with observed surges in institutional buying volume, signaling smart money accumulation driving a potential supply shock across these assets.
Are you tracking the significant institutional inflows here?
#TQQQB #KITE #ATOM #BinanceSquare #SmartMoney
125

·
--
$TQQQB looks ready to go higher from here 🚀
It is up 7.1 percent today and holding near the high
RSI is 62 so buyers still have room to run
Volume is 1.3x normal showing strong interest today
Buy $TQQQB 56.5443 to 57.2139
SL 50.2304
Targets 67.3544 / 74.2040 / 84.4784
Tap $TQQQB to buy it here
#TQQQB #TradingSignals
$TQQQB looks ready to go higher from here 🚀
It is up 7.1 percent today and holding near the high
RSI is 62 so buyers still have room to run
Volume is 1.3x normal showing strong interest today
Buy $TQQQB 56.5443 to 57.2139
SL 50.2304
Targets 67.3544 / 74.2040 / 84.4784
Tap $TQQQB to buy it here
#TQQQB #TradingSignals
It is up 7.1 percent today and holding near the high
RSI is 62 so buyers still have room to run
Volume is 1.3x normal showing strong interest today
Buy $TQQQB 56.5443 to 57.2139
SL 50.2304
Targets 67.3544 / 74.2040 / 84.4784
Tap $TQQQB to buy it here
#TQQQB #TradingSignals
$TQQQB: The Data Gap
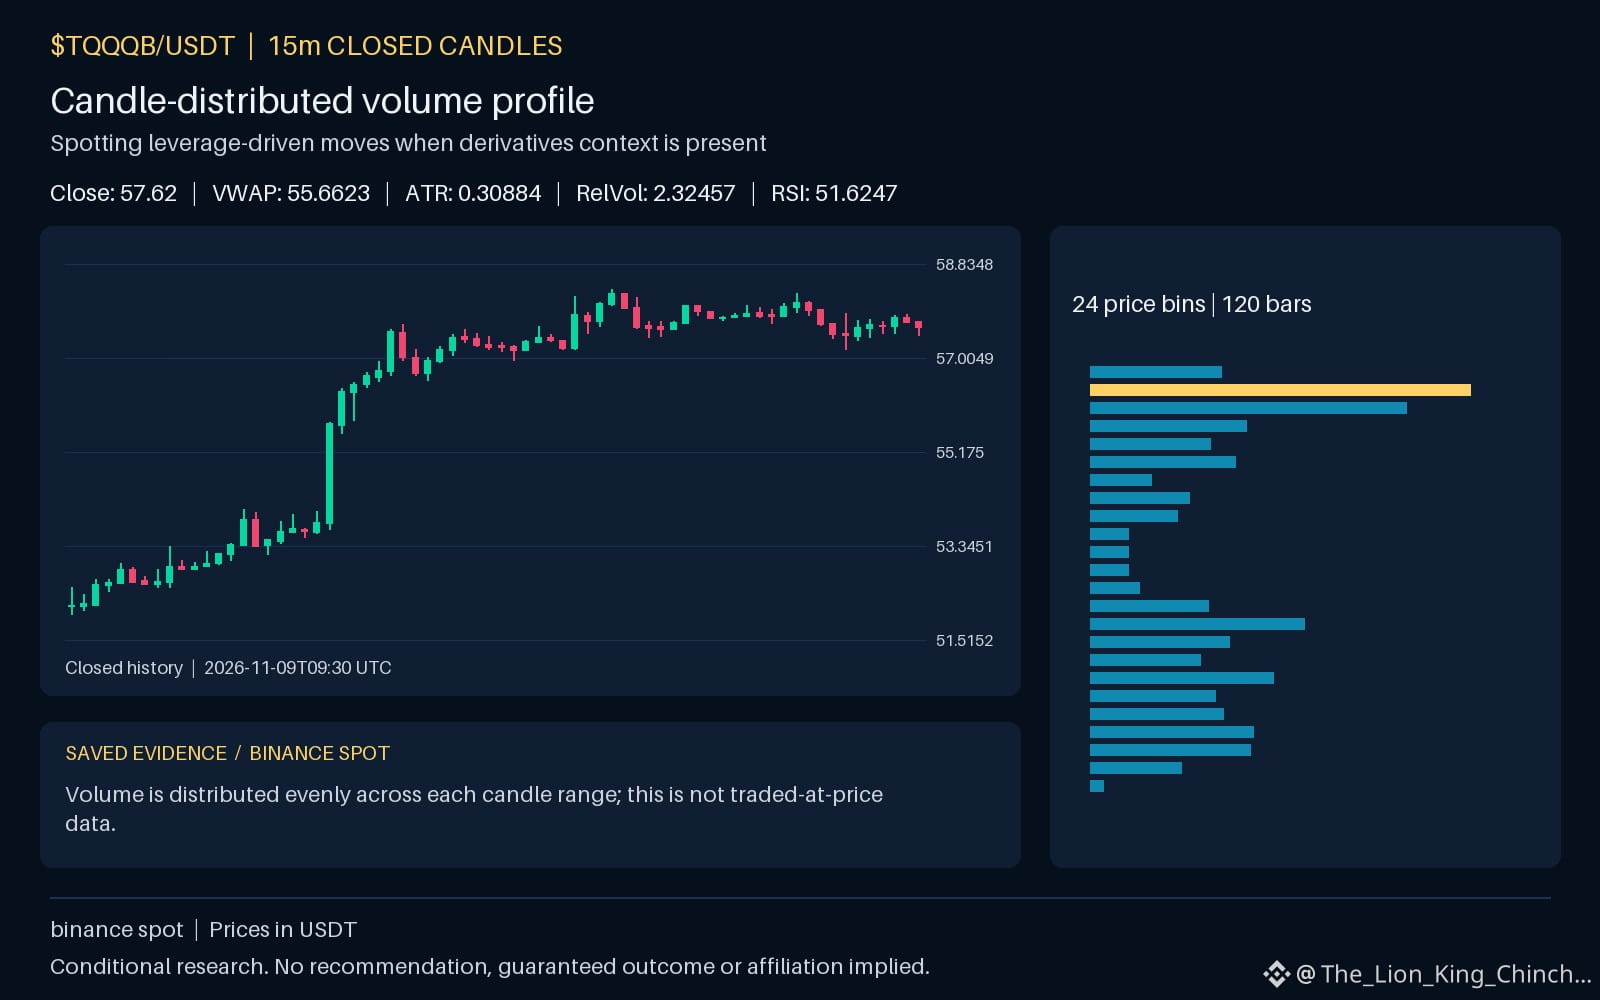
Watch $TQQQB. The hourly direction is down and volume is above baseline, but the recorded range sits inside previous limits. This creates a puzzle. A common question asks if the volume surge proves a surge in leverage activity. This is a hypothetical mechanism, not a fact about the current state of the asset. One clue is the high turnover. If the volume exceeded baseline without a matching shift in price away from the recorded range, a trader might guess that leveraged positions were being closed near entry points. This is a conditional explanation. The alternative reading is simpler. The volume could be from market makers rebalancing inventory or spot market participants taking profit within a tight spread. The first interpretation has a weak point. To confirm a leverage-driven move, specific derivative data is necessary. Without verified numbers for open interest or funding rates, the idea remains speculative. The unverified social claim is the weak link because it relies on hearsay. The second interpretation is also limited. It assumes the spread stays tight. If daily volatility expands, the spread widens and the volume signal becomes murkier. A good self-check is to look for a counterexample. Imagine a scenario where volume is high, but the price stays flat and the daily direction holds. If the move lacks a historical anchor, the volume might be noise. To reassess this interpretation, compare the verified quote volume to the vwap. If the price closes far from the vwap, the volume was directional. If it closes inside the range, the move is indeterminate. This distinction matters because it separates verified data from speculation. The primary limit is the absence of direct leverage metrics in this draft.
Probabilistic market research, not a recommendation or guaranteed return.
Why is it so important to separate verified spot volume from unverified social claims about 'liquidations and open interest'?
#TQQQB #MarketAnalysis #CryptoLearning
$TQQQB : The Data Gap
Watch $TQQQB . The hourly direction is down and volume is above baseline, but the recorded range sits inside previous limits. This creates a puzzle. A common question asks if the volume surge proves a surge in leverage activity. This is a hypothetical mechanism, not a fact about the current state of the asset. One clue is the high turnover. If the volume exceeded baseline without a matching shift in price away from the recorded range, a trader might guess that leveraged positions were being closed near entry points. This is a conditional explanation. The alternative reading is simpler. The volume could be from market makers rebalancing inventory or spot market participants taking profit within a tight spread. The first interpretation has a weak point. To confirm a leverage-driven move, specific derivative data is necessary. Without verified numbers for open interest or funding rates, the idea remains speculative. The unverified social claim is the weak link because it relies on hearsay. The second interpretation is also limited. It assumes the spread stays tight. If daily volatility expands, the spread widens and the volume signal becomes murkier. A good self-check is to look for a counterexample. Imagine a scenario where volume is high, but the price stays flat and the daily direction holds. If the move lacks a historical anchor, the volume might be noise. To reassess this interpretation, compare the verified quote volume to the vwap. If the price closes far from the vwap, the volume was directional. If it closes inside the range, the move is indeterminate. This distinction matters because it separates verified data from speculation. The primary limit is the absence of direct leverage metrics in this draft.
Probabilistic market research, not a recommendation or guaranteed return.
Why is it so important to separate verified spot volume from unverified social claims about 'liquidations and open interest'?
#TQQQB #MarketAnalysis #CryptoLearning
Watch $TQQQB . The hourly direction is down and volume is above baseline, but the recorded range sits inside previous limits. This creates a puzzle. A common question asks if the volume surge proves a surge in leverage activity. This is a hypothetical mechanism, not a fact about the current state of the asset. One clue is the high turnover. If the volume exceeded baseline without a matching shift in price away from the recorded range, a trader might guess that leveraged positions were being closed near entry points. This is a conditional explanation. The alternative reading is simpler. The volume could be from market makers rebalancing inventory or spot market participants taking profit within a tight spread. The first interpretation has a weak point. To confirm a leverage-driven move, specific derivative data is necessary. Without verified numbers for open interest or funding rates, the idea remains speculative. The unverified social claim is the weak link because it relies on hearsay. The second interpretation is also limited. It assumes the spread stays tight. If daily volatility expands, the spread widens and the volume signal becomes murkier. A good self-check is to look for a counterexample. Imagine a scenario where volume is high, but the price stays flat and the daily direction holds. If the move lacks a historical anchor, the volume might be noise. To reassess this interpretation, compare the verified quote volume to the vwap. If the price closes far from the vwap, the volume was directional. If it closes inside the range, the move is indeterminate. This distinction matters because it separates verified data from speculation. The primary limit is the absence of direct leverage metrics in this draft.
Probabilistic market research, not a recommendation or guaranteed return.
Why is it so important to separate verified spot volume from unverified social claims about 'liquidations and open interest'?
#TQQQB #MarketAnalysis #CryptoLearning
53
·
--
$TQQQB +10.16% | $AVGOB +9.46% | $BEAMX +9.29%
#TQQQB climbs to $57.58, up +10.16% on a solid $6.5 M of volume, suggesting fresh buying interest.
#AVGOB pushes higher to $319.88, gaining +9.46% with $1.8 M traded, a respectable lift for a mid‑cap.
#BEAMX spikes to $0.00436400, up +9.29% on $2.2 M of volume, showing notable activity in the low‑price tier. 📈
The disparity in volume between TQQQB and AVGOB may hint at differing liquidity support.
#Write2Earn #Binance
$TQQQB +10.16% | $AVGOB +9.46% | $BEAMX +9.29%
#TQQQB climbs to $57.58, up +10.16% on a solid $6.5 M of volume, suggesting fresh buying interest.
#AVGOB pushes higher to $319.88, gaining +9.46% with $1.8 M traded, a respectable lift for a mid‑cap.
#BEAMX spikes to $0.00436400, up +9.29% on $2.2 M of volume, showing notable activity in the low‑price tier. 📈
The disparity in volume between TQQQB and AVGOB may hint at differing liquidity support.
#Write2Earn #Binance
#TQQQB climbs to $57.58, up +10.16% on a solid $6.5 M of volume, suggesting fresh buying interest.
#AVGOB pushes higher to $319.88, gaining +9.46% with $1.8 M traded, a respectable lift for a mid‑cap.
#BEAMX spikes to $0.00436400, up +9.29% on $2.2 M of volume, showing notable activity in the low‑price tier. 📈
The disparity in volume between TQQQB and AVGOB may hint at differing liquidity support.
#Write2Earn #Binance
24

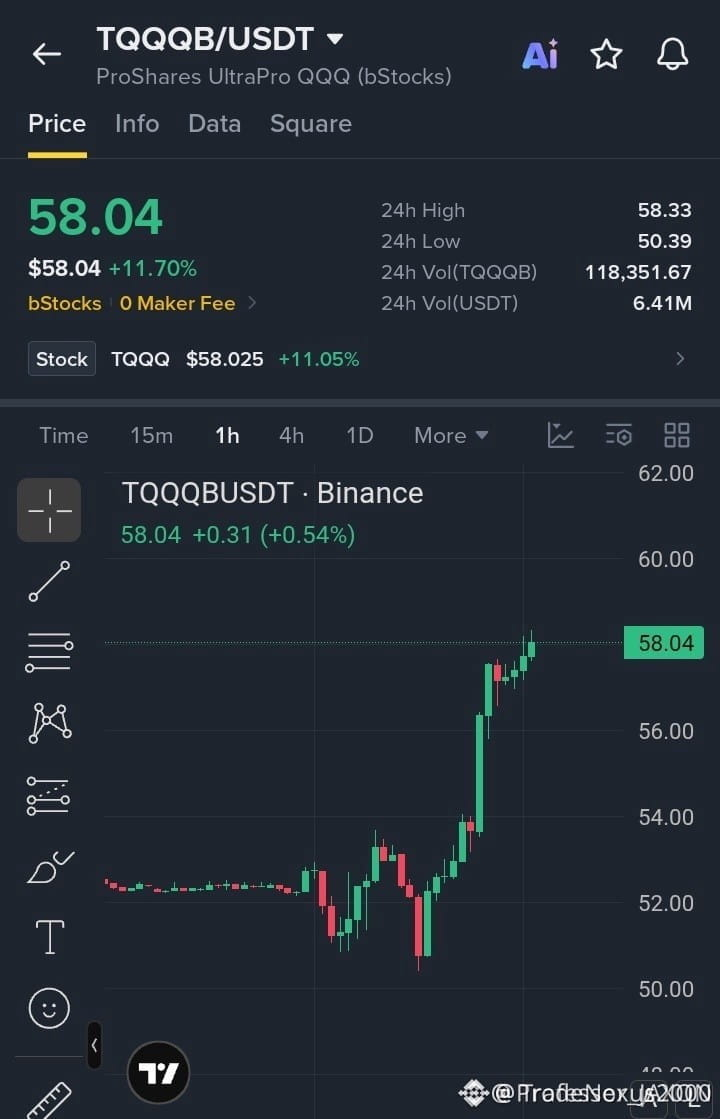
🚨 $TQQQB CLEARS MAJOR RESISTANCE WITH AGGRESSIVE INSTITUTIONAL MOMENTUM! 💥
Entry: 57.50 - 58.00 ⚡
Target: 59.00, 60.00, 61.00 🚀
Stop Loss: 56.70 ⚠️
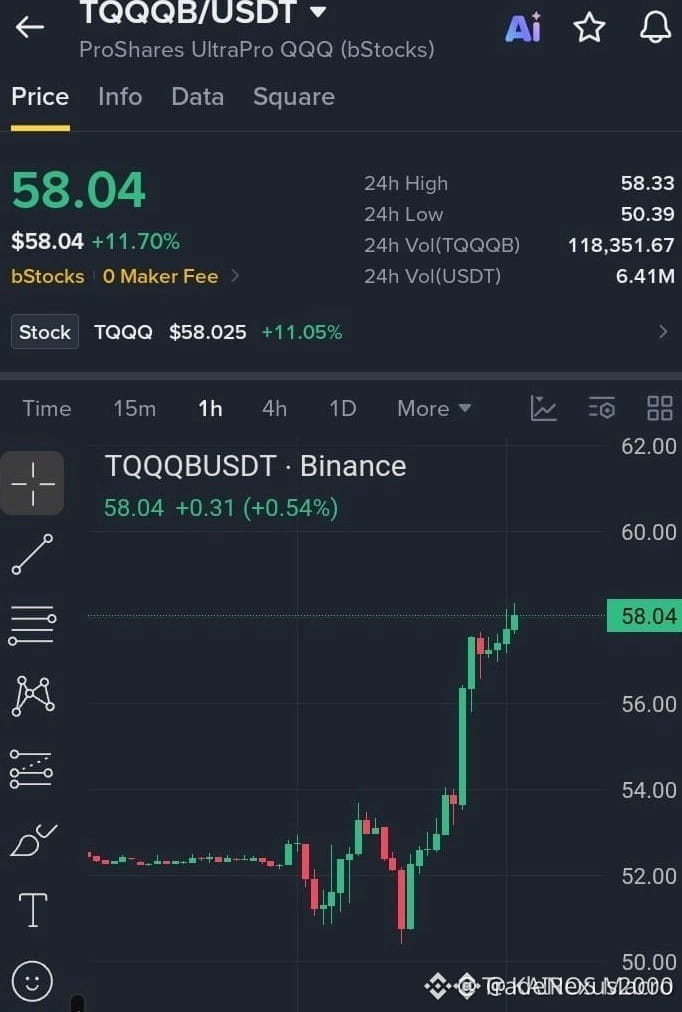
The 1H structure shows a decisive break above the 56.00 threshold as institutional order flow floods the tape, leaving aggressive buyers firmly in control. 📊 Price is currently consolidating right beneath prior highs, building internal liquidity for the next leg higher. ⚡
Maintaining composure above 58.33 opens a clean path toward our higher resistance targets without major supply walls in the way. 💡
Are you positioning your bids within this current markup phase or waiting for a deeper structural sweep? 👇
⚠️ Not financial advice. Always manage your risk. 🛡️
🏷️ #TQQQB #Breakout #MarketStructure #TradingSetup
🔥 💎
🚨 $TQQQB CLEARS MAJOR RESISTANCE WITH AGGRESSIVE INSTITUTIONAL MOMENTUM! 💥
Entry: 57.50 - 58.00 ⚡
Target: 59.00, 60.00, 61.00 🚀
Stop Loss: 56.70 ⚠️
The 1H structure shows a decisive break above the 56.00 threshold as institutional order flow floods the tape, leaving aggressive buyers firmly in control. 📊 Price is currently consolidating right beneath prior highs, building internal liquidity for the next leg higher. ⚡
Maintaining composure above 58.33 opens a clean path toward our higher resistance targets without major supply walls in the way. 💡
Are you positioning your bids within this current markup phase or waiting for a deeper structural sweep? 👇
⚠️ Not financial advice. Always manage your risk. 🛡️
🏷️ #TQQQB #Breakout #MarketStructure #TradingSetup
🔥 💎
Entry: 57.50 - 58.00 ⚡
Target: 59.00, 60.00, 61.00 🚀
Stop Loss: 56.70 ⚠️
The 1H structure shows a decisive break above the 56.00 threshold as institutional order flow floods the tape, leaving aggressive buyers firmly in control. 📊 Price is currently consolidating right beneath prior highs, building internal liquidity for the next leg higher. ⚡
Maintaining composure above 58.33 opens a clean path toward our higher resistance targets without major supply walls in the way. 💡
Are you positioning your bids within this current markup phase or waiting for a deeper structural sweep? 👇
⚠️ Not financial advice. Always manage your risk. 🛡️
🏷️ #TQQQB #Breakout #MarketStructure #TradingSetup
🔥 💎
3

🚨 $TQQQB SHATTERS THE 56.00 RESISTANCE AS BUYERS SEIZE TOTAL CONTROL! 💥
Entry: 57.50 - 58.00 ⚡
Target: 61.00 🚀
Stop Loss: 56.70 ⚠️
That clean break above 56.00 sent shockwaves through the order book, with aggressive buyers stepping in to absorb every lingering offer. 📊 The 1H chart shows price consolidating tightly right beneath the previous high, showcasing textbook bullish momentum. ⚡
As long as bulls defend the 58.33 pivot cleanly, the path of least resistance remains tilted firmly toward higher liquidity pockets. 💡 Are you locking in positions here or waiting for a deeper retest? 👇
⚠️ Not financial advice. Always manage your risk. 🛡️
🏷️ #TQQQB #Momentum #Breakout #Crypto #Trading
🔥 💎
🚨 $TQQQB SHATTERS THE 56.00 RESISTANCE AS BUYERS SEIZE TOTAL CONTROL! 💥
Entry: 57.50 - 58.00 ⚡
Target: 61.00 🚀
Stop Loss: 56.70 ⚠️
That clean break above 56.00 sent shockwaves through the order book, with aggressive buyers stepping in to absorb every lingering offer. 📊 The 1H chart shows price consolidating tightly right beneath the previous high, showcasing textbook bullish momentum. ⚡
As long as bulls defend the 58.33 pivot cleanly, the path of least resistance remains tilted firmly toward higher liquidity pockets. 💡 Are you locking in positions here or waiting for a deeper retest? 👇
⚠️ Not financial advice. Always manage your risk. 🛡️
🏷️ #TQQQB #Momentum #Breakout #Crypto #Trading
🔥 💎
Entry: 57.50 - 58.00 ⚡
Target: 61.00 🚀
Stop Loss: 56.70 ⚠️
That clean break above 56.00 sent shockwaves through the order book, with aggressive buyers stepping in to absorb every lingering offer. 📊 The 1H chart shows price consolidating tightly right beneath the previous high, showcasing textbook bullish momentum. ⚡
As long as bulls defend the 58.33 pivot cleanly, the path of least resistance remains tilted firmly toward higher liquidity pockets. 💡 Are you locking in positions here or waiting for a deeper retest? 👇
⚠️ Not financial advice. Always manage your risk. 🛡️
🏷️ #TQQQB #Momentum #Breakout #Crypto #Trading
🔥 💎
⚡ $TQQQB BREAKS INTO UNCHARTED TERRITORY AS INSTITUTIONAL MOMENTUM ACCELERATES 🚀
Entry: 57.20–57.80 ⚡
Target: 61.00 🚀
Stop Loss: 56.40 ⚠️
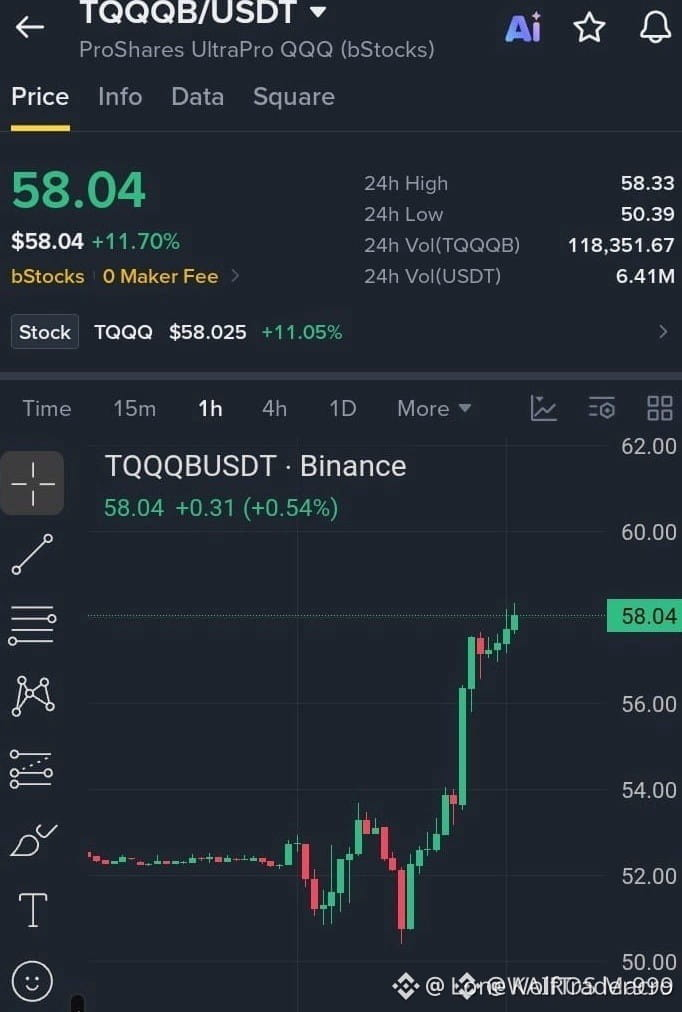
Price action is aggressively pressing through the 58.30 resistance pivot following a clean impulsive expansion from the lows. 📊 Order flow indicates sustained buy-side pressure with smart money defending the 57.20 baseline to fuel the next leg upward. ⚡
As long as structural support holds firm above 56.40, the path of least resistance points directly toward our higher liquidity targets up to 61.00. 📌 Are you positioning ahead of the breakout continuation or waiting for a deeper retest? 👇
⚠️ Not financial advice. Always manage your risk. 🛡️
🏷️ #TQQQB #LongSetup #Breakout #Crypto
🔥 💎
⚡ $TQQQB BREAKS INTO UNCHARTED TERRITORY AS INSTITUTIONAL MOMENTUM ACCELERATES 🚀
Entry: 57.20–57.80 ⚡
Target: 61.00 🚀
Stop Loss: 56.40 ⚠️
Price action is aggressively pressing through the 58.30 resistance pivot following a clean impulsive expansion from the lows. 📊 Order flow indicates sustained buy-side pressure with smart money defending the 57.20 baseline to fuel the next leg upward. ⚡
As long as structural support holds firm above 56.40, the path of least resistance points directly toward our higher liquidity targets up to 61.00. 📌 Are you positioning ahead of the breakout continuation or waiting for a deeper retest? 👇
⚠️ Not financial advice. Always manage your risk. 🛡️
🏷️ #TQQQB #LongSetup #Breakout #Crypto
🔥 💎
Entry: 57.20–57.80 ⚡
Target: 61.00 🚀
Stop Loss: 56.40 ⚠️
Price action is aggressively pressing through the 58.30 resistance pivot following a clean impulsive expansion from the lows. 📊 Order flow indicates sustained buy-side pressure with smart money defending the 57.20 baseline to fuel the next leg upward. ⚡
As long as structural support holds firm above 56.40, the path of least resistance points directly toward our higher liquidity targets up to 61.00. 📌 Are you positioning ahead of the breakout continuation or waiting for a deeper retest? 👇
⚠️ Not financial advice. Always manage your risk. 🛡️
🏷️ #TQQQB #LongSetup #Breakout #Crypto
🔥 💎
8

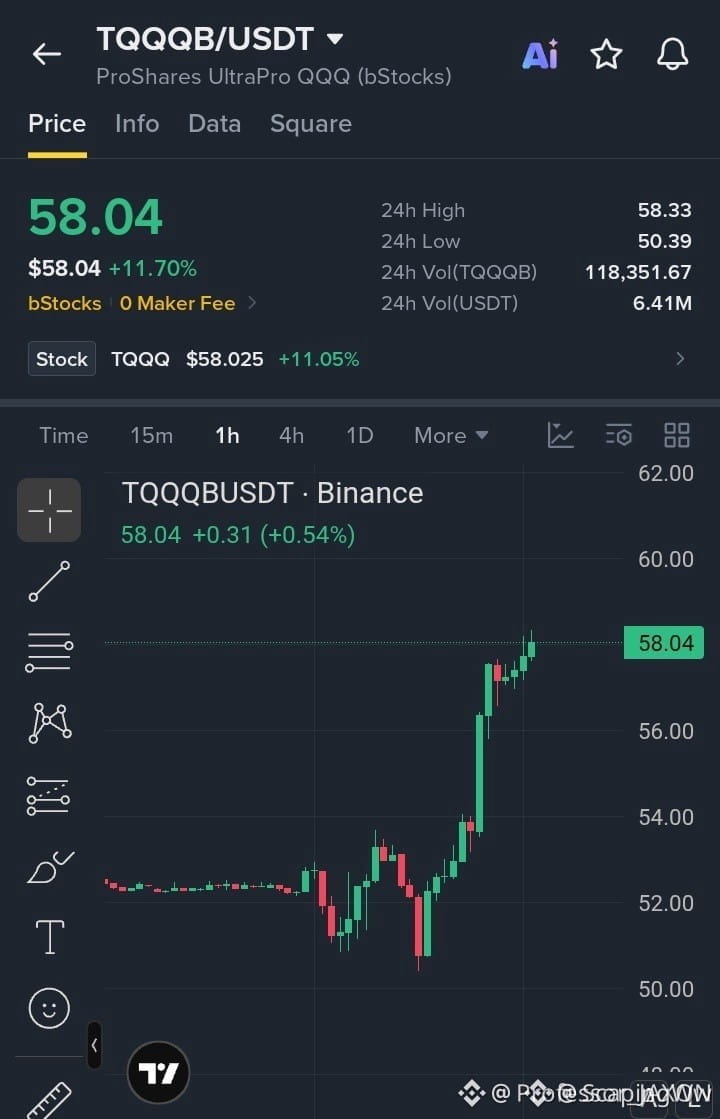
🚀 $TQQQB BULLS ARE TEARING THROUGH RESISTANCE WITH EXPLOSIVE MOMENTUM! 💥
Entry: 57.20–57.80 ⚡
Target: 59.00–61.00 🚀
Stop Loss: 56.40 ⚠️
Buyers are stepping in with serious intent right above the 57.20 floor, absorbing every single sell wall thrown their way. 📊 This sharp breakout is leaning hard on momentum as price coils tightly below the 58.30 resistance zone. ⚡
If this bid holds firm, the path toward higher liquidity targets opens wide up across the order book. 💡 Are you locking in entries here or waiting for a deeper retest? 👇
⚠️ Not financial advice. Always manage your risk. 🛡️
🏷️ #TQQQB #LongSetup #Breakout #Crypto
🔥 💎
🚀 $TQQQB BULLS ARE TEARING THROUGH RESISTANCE WITH EXPLOSIVE MOMENTUM! 💥
Entry: 57.20–57.80 ⚡
Target: 59.00–61.00 🚀
Stop Loss: 56.40 ⚠️
Buyers are stepping in with serious intent right above the 57.20 floor, absorbing every single sell wall thrown their way. 📊 This sharp breakout is leaning hard on momentum as price coils tightly below the 58.30 resistance zone. ⚡
If this bid holds firm, the path toward higher liquidity targets opens wide up across the order book. 💡 Are you locking in entries here or waiting for a deeper retest? 👇
⚠️ Not financial advice. Always manage your risk. 🛡️
🏷️ #TQQQB #LongSetup #Breakout #Crypto
🔥 💎
Entry: 57.20–57.80 ⚡
Target: 59.00–61.00 🚀
Stop Loss: 56.40 ⚠️
Buyers are stepping in with serious intent right above the 57.20 floor, absorbing every single sell wall thrown their way. 📊 This sharp breakout is leaning hard on momentum as price coils tightly below the 58.30 resistance zone. ⚡
If this bid holds firm, the path toward higher liquidity targets opens wide up across the order book. 💡 Are you locking in entries here or waiting for a deeper retest? 👇
⚠️ Not financial advice. Always manage your risk. 🛡️
🏷️ #TQQQB #LongSetup #Breakout #Crypto
🔥 💎
8

·
--
INSIDER WALLETS ARE SILENTLY STACKING POSITIONS AHEAD OF A MASSIVE BREAKOUT
🐋 WHALE ACTIVITY: $TQQQB
📊 24h Volume: $6.68M USDT
📈 Price: 57.68 (10.73%)
This sharp uptick in trading activity points to heavy smart money absorption, typically setting the stage for a prolonged macro expansion.
Are you following the institutional flow into this movement, or waiting for a retest? Drop your strategy below! 📊👇
#TQQQB #CryptoTrading #CryptoCommunity #Bullish
INSIDER WALLETS ARE SILENTLY STACKING POSITIONS AHEAD OF A MASSIVE BREAKOUT
🐋 WHALE ACTIVITY: $TQQQB
📊 24h Volume: $6.68M USDT
📈 Price: 57.68 (10.73%)
This sharp uptick in trading activity points to heavy smart money absorption, typically setting the stage for a prolonged macro expansion.
Are you following the institutional flow into this movement, or waiting for a retest? Drop your strategy below! 📊👇
#TQQQB #CryptoTrading #CryptoCommunity #Bullish
🐋 WHALE ACTIVITY: $TQQQB
📊 24h Volume: $6.68M USDT
📈 Price: 57.68 (10.73%)
This sharp uptick in trading activity points to heavy smart money absorption, typically setting the stage for a prolonged macro expansion.
Are you following the institutional flow into this movement, or waiting for a retest? Drop your strategy below! 📊👇
#TQQQB #CryptoTrading #CryptoCommunity #Bullish
97
🚨 $TQQQB BREAKS KEY RESISTANCE AS INSTITUTIONAL BUYERS MAINTAIN FIRM CONTROL ⚡
Entry: 57.50–58.00 ⚡
Target: 61.00 🚀
Stop Loss: 56.70 ⚠️
The 1H timeframe reveals aggressive accumulation following the structural clearance of the 56.00 liquidity barrier. 📊 Price is now compressing tightly near session highs, showing classic absorption behavior from smart money participants.
A sustained acceptance above 58.33 acts as our structural green light for an expansion toward the upper efficiency targets. 💡 Are you scaling into this breakout now or waiting for a shallow retest of the demand zone? 👇
⚠️ Not financial advice. Always manage your risk. 🛡️
🏷️ #TQQQB #LongSetup #SmartMoney #Breakout #Crypto
🔥 💎
🚨 $TQQQB BREAKS KEY RESISTANCE AS INSTITUTIONAL BUYERS MAINTAIN FIRM CONTROL ⚡
Entry: 57.50–58.00 ⚡
Target: 61.00 🚀
Stop Loss: 56.70 ⚠️
The 1H timeframe reveals aggressive accumulation following the structural clearance of the 56.00 liquidity barrier. 📊 Price is now compressing tightly near session highs, showing classic absorption behavior from smart money participants.
A sustained acceptance above 58.33 acts as our structural green light for an expansion toward the upper efficiency targets. 💡 Are you scaling into this breakout now or waiting for a shallow retest of the demand zone? 👇
⚠️ Not financial advice. Always manage your risk. 🛡️
🏷️ #TQQQB #LongSetup #SmartMoney #Breakout #Crypto
🔥 💎
Entry: 57.50–58.00 ⚡
Target: 61.00 🚀
Stop Loss: 56.70 ⚠️
The 1H timeframe reveals aggressive accumulation following the structural clearance of the 56.00 liquidity barrier. 📊 Price is now compressing tightly near session highs, showing classic absorption behavior from smart money participants.
A sustained acceptance above 58.33 acts as our structural green light for an expansion toward the upper efficiency targets. 💡 Are you scaling into this breakout now or waiting for a shallow retest of the demand zone? 👇
⚠️ Not financial advice. Always manage your risk. 🛡️
🏷️ #TQQQB #LongSetup #SmartMoney #Breakout #Crypto
🔥 💎
4

·
--
🚀 $TQQQB CRUSHING LOCAL RESISTANCE AS BULLS SEIZE ABSOLUTE CONTROL ⚡
Entry: 57.50–58.00 ⚡
Target: 61.00 🚀
Stop Loss: 56.70 ⚠️
Order flow on the one-hour chart is showing aggressive accumulation right above the reclaimed 56.00 zone. 📊 Sellers tried to step in during the session, but every dip got instantly absorbed by patient bids. 🌊
Price is tightening right below the immediate ceiling, which usually signals that expansion is loading up. ⚡ If bulls clear 58.33 with volume confirmation, the runway opens straight toward higher targets. 🎯
💬 Are you positioning ahead of the breakout or waiting for confirmation above resistance? 👇
⚠️ Not financial advice. Always manage your risk. 🛡️
🏷️ #TQQQB #Breakout #Momentum #Crypto
🔥 💎
🚀 $TQQQB CRUSHING LOCAL RESISTANCE AS BULLS SEIZE ABSOLUTE CONTROL ⚡
Entry: 57.50–58.00 ⚡
Target: 61.00 🚀
Stop Loss: 56.70 ⚠️
Order flow on the one-hour chart is showing aggressive accumulation right above the reclaimed 56.00 zone. 📊 Sellers tried to step in during the session, but every dip got instantly absorbed by patient bids. 🌊
Price is tightening right below the immediate ceiling, which usually signals that expansion is loading up. ⚡ If bulls clear 58.33 with volume confirmation, the runway opens straight toward higher targets. 🎯
💬 Are you positioning ahead of the breakout or waiting for confirmation above resistance? 👇
⚠️ Not financial advice. Always manage your risk. 🛡️
🏷️ #TQQQB #Breakout #Momentum #Crypto
🔥 💎
Entry: 57.50–58.00 ⚡
Target: 61.00 🚀
Stop Loss: 56.70 ⚠️
Order flow on the one-hour chart is showing aggressive accumulation right above the reclaimed 56.00 zone. 📊 Sellers tried to step in during the session, but every dip got instantly absorbed by patient bids. 🌊
Price is tightening right below the immediate ceiling, which usually signals that expansion is loading up. ⚡ If bulls clear 58.33 with volume confirmation, the runway opens straight toward higher targets. 🎯
💬 Are you positioning ahead of the breakout or waiting for confirmation above resistance? 👇
⚠️ Not financial advice. Always manage your risk. 🛡️
🏷️ #TQQQB #Breakout #Momentum #Crypto
🔥 💎
21
·
--
$TQQQB +9.37% | $NXPC +9.04% | $MRVLB +8.57%
#TQQQB nudges to $57.53, up +9.37% on $6.1 M of volume. The rally feels supported by solid buying pressure.
#NXPC climbs to $0.1605, gaining +9.04% with $6.5 M traded. Its momentum is notable given the modest price level.
#MRVLB advances to $154.99, up +8.57% on $1.5 M volume. The lower turnover suggests a more measured interest.
👀 Watch whether the stronger volume on the lower‑priced tickers sustains their pace compared with MRVLB’s lighter flow.
#Write2Earn #Binance
$TQQQB +9.37% | $NXPC +9.04% | $MRVLB +8.57%
#TQQQB nudges to $57.53, up +9.37% on $6.1 M of volume. The rally feels supported by solid buying pressure.
#NXPC climbs to $0.1605, gaining +9.04% with $6.5 M traded. Its momentum is notable given the modest price level.
#MRVLB advances to $154.99, up +8.57% on $1.5 M volume. The lower turnover suggests a more measured interest.
👀 Watch whether the stronger volume on the lower‑priced tickers sustains their pace compared with MRVLB’s lighter flow.
#Write2Earn #Binance
#TQQQB nudges to $57.53, up +9.37% on $6.1 M of volume. The rally feels supported by solid buying pressure.
#NXPC climbs to $0.1605, gaining +9.04% with $6.5 M traded. Its momentum is notable given the modest price level.
#MRVLB advances to $154.99, up +8.57% on $1.5 M volume. The lower turnover suggests a more measured interest.
👀 Watch whether the stronger volume on the lower‑priced tickers sustains their pace compared with MRVLB’s lighter flow.
#Write2Earn #Binance

·
--
Bullish
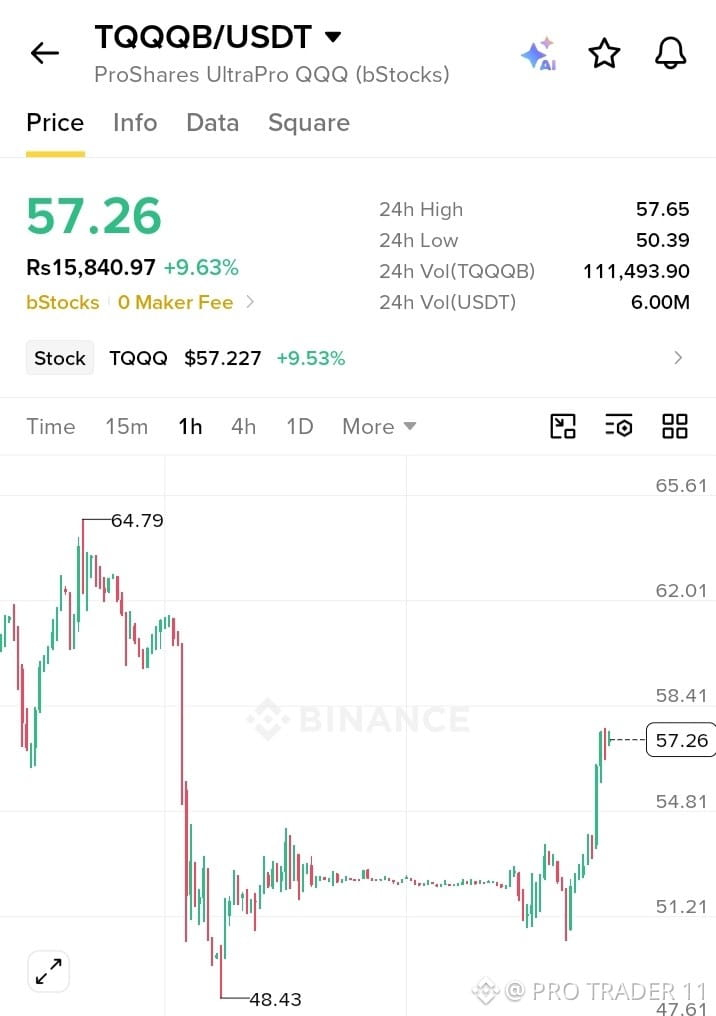
$TQQQB LONG
Entry: 57.26 - 54.81
SL: 50.39
TP1: 57.65
TP2: 58.41
TP3: 62.01
#TQQQB #TQQQBUSDT #Crypto #Binance #BinanceGainer
{spot}(TQQQBUSDT)
$TQQQB LONG
Entry: 57.26 - 54.81
SL: 50.39
TP1: 57.65
TP2: 58.41
TP3: 62.01
#TQQQB #TQQQBUSDT #Crypto #Binance #BinanceGainer
Entry: 57.26 - 54.81
SL: 50.39
TP1: 57.65
TP2: 58.41
TP3: 62.01
#TQQQB #TQQQBUSDT #Crypto #Binance #BinanceGainer
1
41

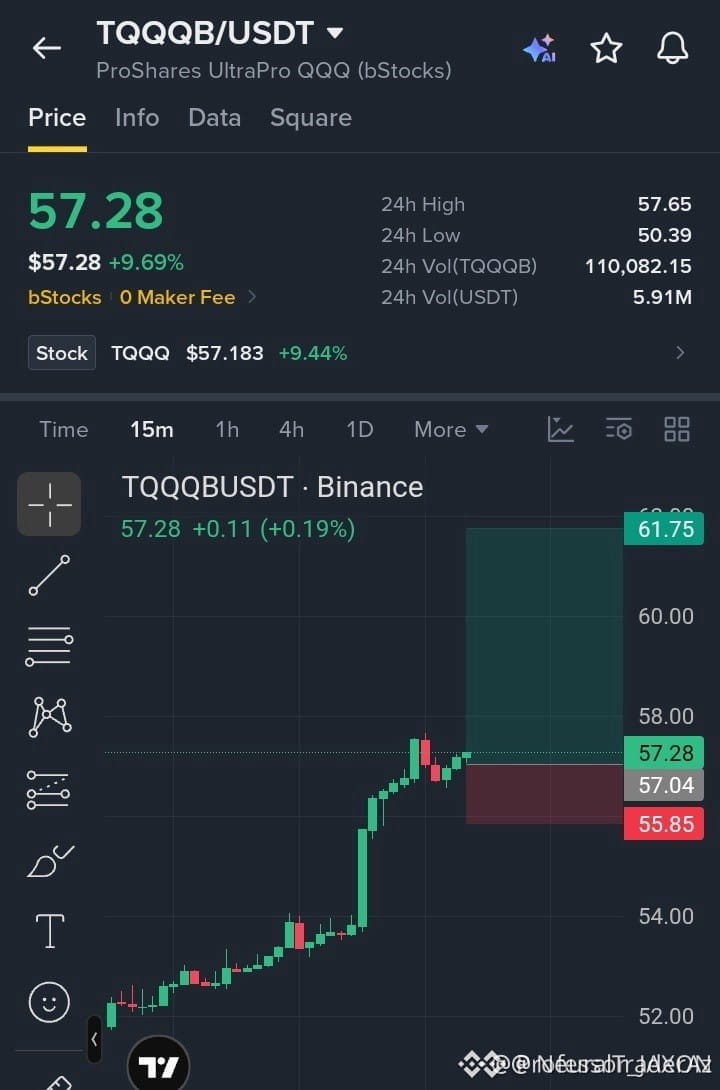
⚡ $TQQQB HOLDS FIRM ABOVE 57.00 AS INSTITUTIONAL ACCUMULATION FUELS THE NEXT LEG UP! 🚀
Entry: 56.90 - 57.30 ⚡
Target: 60.00 🚀
Stop Loss: 55.85 ⚠️
Price action is consolidating tightly near 57.28 following an aggressive breakout from the 54.00 region on the 15-minute timeframe. 📊 Order flow shows buyers actively defending the 57.00 psychological pivot, absorbing incoming sell pressure without breaking structure. ⚡
This sustained consolidation suggests smart money is re-accumulating inventory ahead of an expansion toward higher resistance levels. 💡 Are you scaling in here or waiting for a deeper liquidity test before riding the breakout? 👇
⚠️ Not financial advice. Always manage your risk. 🛡️
🏷️ #TQQQB #LongSetup #OrderBlock #Crypto #Breakout
🦈 📈
⚡ $TQQQB HOLDS FIRM ABOVE 57.00 AS INSTITUTIONAL ACCUMULATION FUELS THE NEXT LEG UP! 🚀
Entry: 56.90 - 57.30 ⚡
Target: 60.00 🚀
Stop Loss: 55.85 ⚠️
Price action is consolidating tightly near 57.28 following an aggressive breakout from the 54.00 region on the 15-minute timeframe. 📊 Order flow shows buyers actively defending the 57.00 psychological pivot, absorbing incoming sell pressure without breaking structure. ⚡
This sustained consolidation suggests smart money is re-accumulating inventory ahead of an expansion toward higher resistance levels. 💡 Are you scaling in here or waiting for a deeper liquidity test before riding the breakout? 👇
⚠️ Not financial advice. Always manage your risk. 🛡️
🏷️ #TQQQB #LongSetup #OrderBlock #Crypto #Breakout
🦈 📈
Entry: 56.90 - 57.30 ⚡
Target: 60.00 🚀
Stop Loss: 55.85 ⚠️
Price action is consolidating tightly near 57.28 following an aggressive breakout from the 54.00 region on the 15-minute timeframe. 📊 Order flow shows buyers actively defending the 57.00 psychological pivot, absorbing incoming sell pressure without breaking structure. ⚡
This sustained consolidation suggests smart money is re-accumulating inventory ahead of an expansion toward higher resistance levels. 💡 Are you scaling in here or waiting for a deeper liquidity test before riding the breakout? 👇
⚠️ Not financial advice. Always manage your risk. 🛡️
🏷️ #TQQQB #LongSetup #OrderBlock #Crypto #Breakout
🦈 📈
1
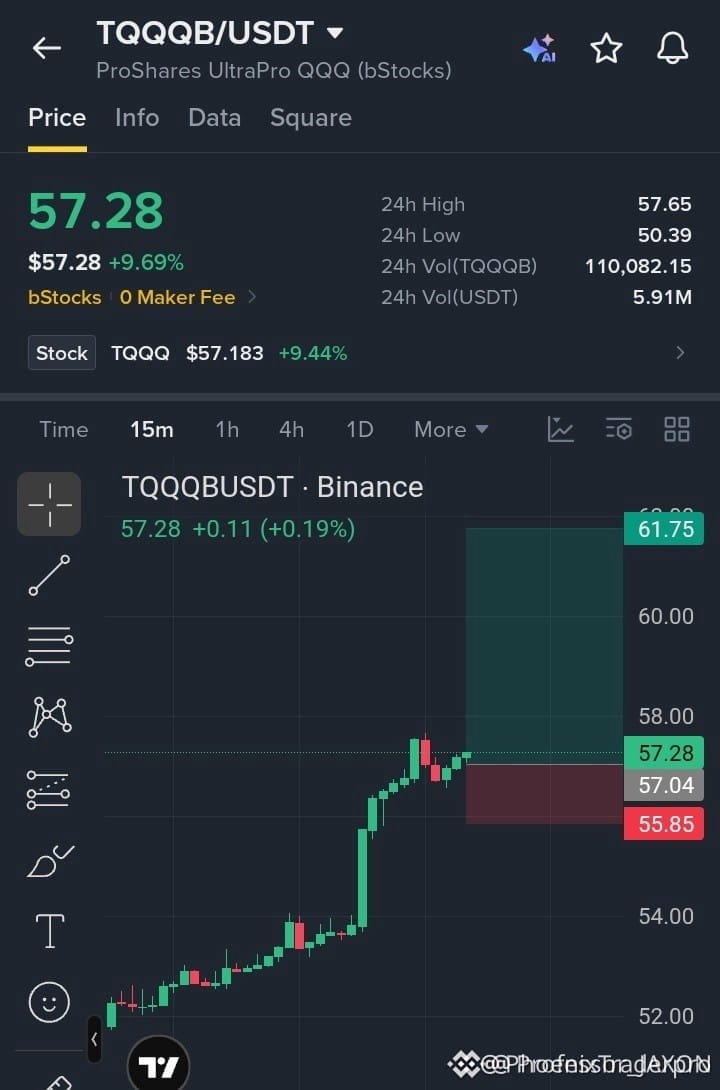
🚨 $TQQQB BREAKS OUT CLEANLY AS BUYERS DEFEND THE 57.00 LEVEL 💥
Entry: 56.90–57.30 ⚡
Target: 58.60 / 60.00 / 61.75 🚀
Stop Loss: 55.85 ⚠️
The aggressive impulse off the 54.00 floor carved a textbook impulsive expansion on the lower timeframe, leaving sellers gasping for air. ⚡
Price is currently tightening inside a shallow consolidation right above the 57.00 pivot, showing persistent bid pressure. 📊 As long as this demand pocket holds firm, momentum favors a continuation toward higher resistance boundaries. 💡
💬 Are you placing your bids here or waiting for a deeper retest? 👇
⚠️ Not financial advice. Always manage your risk. 🛡️
🏷️ #TQQQB #LongSetup #Momentum #Breakout #Crypto
🔥 💎
🚨 $TQQQB BREAKS OUT CLEANLY AS BUYERS DEFEND THE 57.00 LEVEL 💥
Entry: 56.90–57.30 ⚡
Target: 58.60 / 60.00 / 61.75 🚀
Stop Loss: 55.85 ⚠️
The aggressive impulse off the 54.00 floor carved a textbook impulsive expansion on the lower timeframe, leaving sellers gasping for air. ⚡
Price is currently tightening inside a shallow consolidation right above the 57.00 pivot, showing persistent bid pressure. 📊 As long as this demand pocket holds firm, momentum favors a continuation toward higher resistance boundaries. 💡
💬 Are you placing your bids here or waiting for a deeper retest? 👇
⚠️ Not financial advice. Always manage your risk. 🛡️
🏷️ #TQQQB #LongSetup #Momentum #Breakout #Crypto
🔥 💎
Entry: 56.90–57.30 ⚡
Target: 58.60 / 60.00 / 61.75 🚀
Stop Loss: 55.85 ⚠️
The aggressive impulse off the 54.00 floor carved a textbook impulsive expansion on the lower timeframe, leaving sellers gasping for air. ⚡
Price is currently tightening inside a shallow consolidation right above the 57.00 pivot, showing persistent bid pressure. 📊 As long as this demand pocket holds firm, momentum favors a continuation toward higher resistance boundaries. 💡
💬 Are you placing your bids here or waiting for a deeper retest? 👇
⚠️ Not financial advice. Always manage your risk. 🛡️
🏷️ #TQQQB #LongSetup #Momentum #Breakout #Crypto
🔥 💎
5
·
--
$TQQQB +8.22% | $USUAL +7.81% | $KORUB +7.44%
#TQQQB is trading at $56.60, climbing +8.22% with $5.3 M of volume. 📈 The move suggests fresh buying pressure after a quiet stretch.
#USUAL nudged up to $0.0108, gaining +7.81% on $1.1 M of volume. The modest flow hints at a tentative interest rather than a broad rally.
#KORUB rose to $7.51, up +7.44% backed by a solid $12.2 M of volume. The heavy turnover may give it an edge over the other two.
Watch how KORUB’s strong volume compares to the lighter flows of TQQQB and USUAL as the session progresses.
#Write2Earn #Binance
$TQQQB +8.22% | $USUAL +7.81% | $KORUB +7.44%
#TQQQB is trading at $56.60, climbing +8.22% with $5.3 M of volume. 📈 The move suggests fresh buying pressure after a quiet stretch.
#USUAL nudged up to $0.0108, gaining +7.81% on $1.1 M of volume. The modest flow hints at a tentative interest rather than a broad rally.
#KORUB rose to $7.51, up +7.44% backed by a solid $12.2 M of volume. The heavy turnover may give it an edge over the other two.
Watch how KORUB’s strong volume compares to the lighter flows of TQQQB and USUAL as the session progresses.
#Write2Earn #Binance
#TQQQB is trading at $56.60, climbing +8.22% with $5.3 M of volume. 📈 The move suggests fresh buying pressure after a quiet stretch.
#USUAL nudged up to $0.0108, gaining +7.81% on $1.1 M of volume. The modest flow hints at a tentative interest rather than a broad rally.
#KORUB rose to $7.51, up +7.44% backed by a solid $12.2 M of volume. The heavy turnover may give it an edge over the other two.
Watch how KORUB’s strong volume compares to the lighter flows of TQQQB and USUAL as the session progresses.
#Write2Earn #Binance
2
Log in to explore more content
Join global crypto users on Binance Square
⚡️ Get latest and useful information about crypto.
💬 Trusted by the world’s largest crypto exchange.
👍 Discover real insights from verified creators.
Email / Phone number
Trending Topics
1
#HotCPIDecemberHikePriced
188 views
71 Discussing
2
#AnthropicRejectsIPODelayValuationinQuestion
123,365 views
1,157 Discussing
3
#NvidiaInvestigatesAfterHuang’sAffairApology
364,530 views
2,638 Discussing
4
#CanNvidiaEarningsEaseMarketConcerns?
7,440 views
196 Discussing
5
#ADPWeeklyEstimateShowsUSPrivatePayrollsUp19750
24 views
20 Discussing
6
#US-IranTalksFuelStrongStockMarketRebound
49,197 views
427 Discussing
7
#BitcoinFiveWeeklyLosses
387,642 views
2,926 Discussing
8
#AIChipSlumpNasdaq
217,781 views
1,682 Discussing
9
#BitcoinSpotETFsPost$201MNetOutflowForThirdStraightDay
952 views
15 Discussing
10
#CryptoLiquidationsReach$1.16BIn24Hours
47,030 views
71 Discussing