
#flnc
flnc
41,542 views
544 Discussing
Hot
Latest

·
--
🩸 $FLNC dumped -19.8%. Sellers look exhausted
LONG · 1H
Entry: $5.122 - $5.154
TP1: $5.796
TP2: $5.951
TP3: $6.105
SL: $4.976
$FLNC dumped -19.8% in the last 24 hours. RSI is deeply oversold on the 1H, volume hit a climax at the extreme and a strong rejection wick formed at the lows. Entry is on the first 15M strength, targets are the 0.382, 0.5 and 0.618 retracements of the dump.
#FLNC #Futures · NFA
🩸 $FLNC dumped -19.8%. Sellers look exhausted
LONG · 1H
Entry: $5.122 - $5.154
TP1: $5.796
TP2: $5.951
TP3: $6.105
SL: $4.976
$FLNC dumped -19.8% in the last 24 hours. RSI is deeply oversold on the 1H, volume hit a climax at the extreme and a strong rejection wick formed at the lows. Entry is on the first 15M strength, targets are the 0.382, 0.5 and 0.618 retracements of the dump.
#FLNC #Futures · NFA
LONG · 1H
Entry: $5.122 - $5.154
TP1: $5.796
TP2: $5.951
TP3: $6.105
SL: $4.976
$FLNC dumped -19.8% in the last 24 hours. RSI is deeply oversold on the 1H, volume hit a climax at the extreme and a strong rejection wick formed at the lows. Entry is on the first 15M strength, targets are the 0.382, 0.5 and 0.618 retracements of the dump.
#FLNC #Futures · NFA
84

·
--
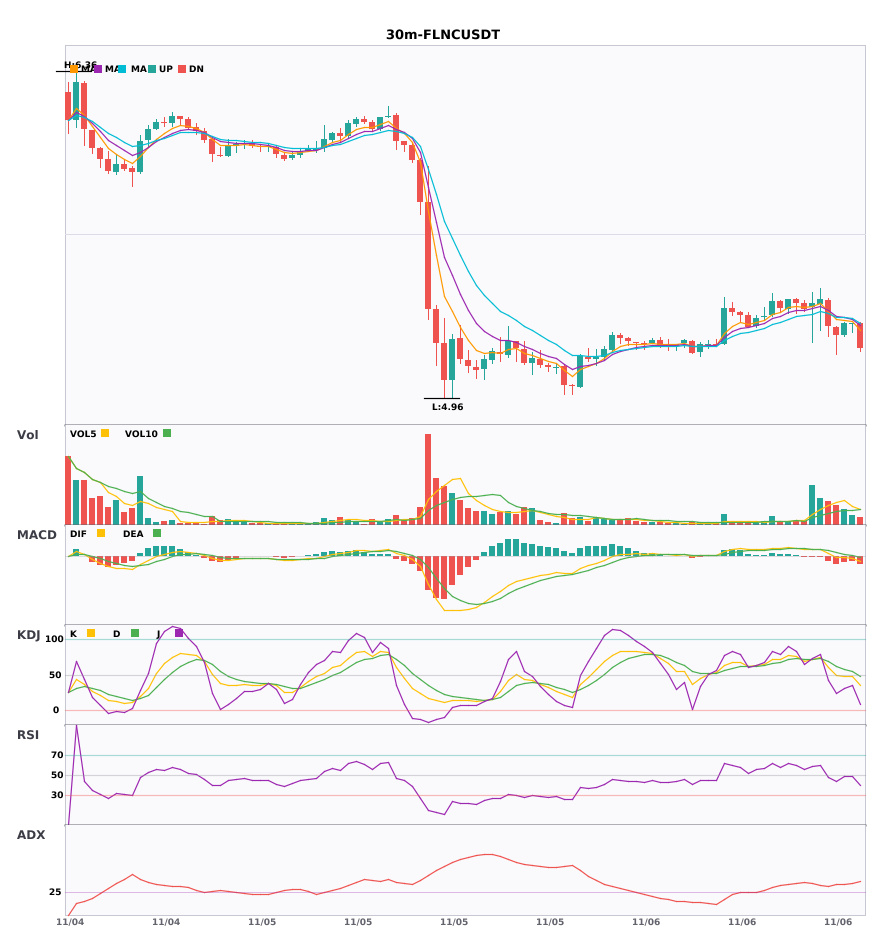
$FLNC 30-minute short + 4-hour short in the same direction; multi-timeframe confluence—trade with the trend 🔥
════════════════════
🟢 $FLNC 30-minute short signal
⚠️ Technical analysis: 4-hour bearish confluence confirmed | 30-minute entry: MACD bearish, trend weakening, momentum fading | EMA5 < EMA8 < EMA13 (bearish alignment) | Volume normal (1.5x)
════════════════════
🔔 Follow to get real-time market updates 🔔
#多周期共振 #FLNC
📌 When trading, check whether the candlestick pattern meets the criteria
$FLNC 30-minute short + 4-hour short in the same direction; multi-timeframe confluence—trade with the trend 🔥
════════════════════
🟢 $FLNC 30-minute short signal
⚠️ Technical analysis: 4-hour bearish confluence confirmed | 30-minute entry: MACD bearish, trend weakening, momentum fading | EMA5 < EMA8 < EMA13 (bearish alignment) | Volume normal (1.5x)
════════════════════
🔔 Follow to get real-time market updates 🔔
#多周期共振 #FLNC
📌 When trading, check whether the candlestick pattern meets the criteria
════════════════════
🟢 $FLNC 30-minute short signal
⚠️ Technical analysis: 4-hour bearish confluence confirmed | 30-minute entry: MACD bearish, trend weakening, momentum fading | EMA5 < EMA8 < EMA13 (bearish alignment) | Volume normal (1.5x)
════════════════════
🔔 Follow to get real-time market updates 🔔
#多周期共振 #FLNC
📌 When trading, check whether the candlestick pattern meets the criteria
7
·
--
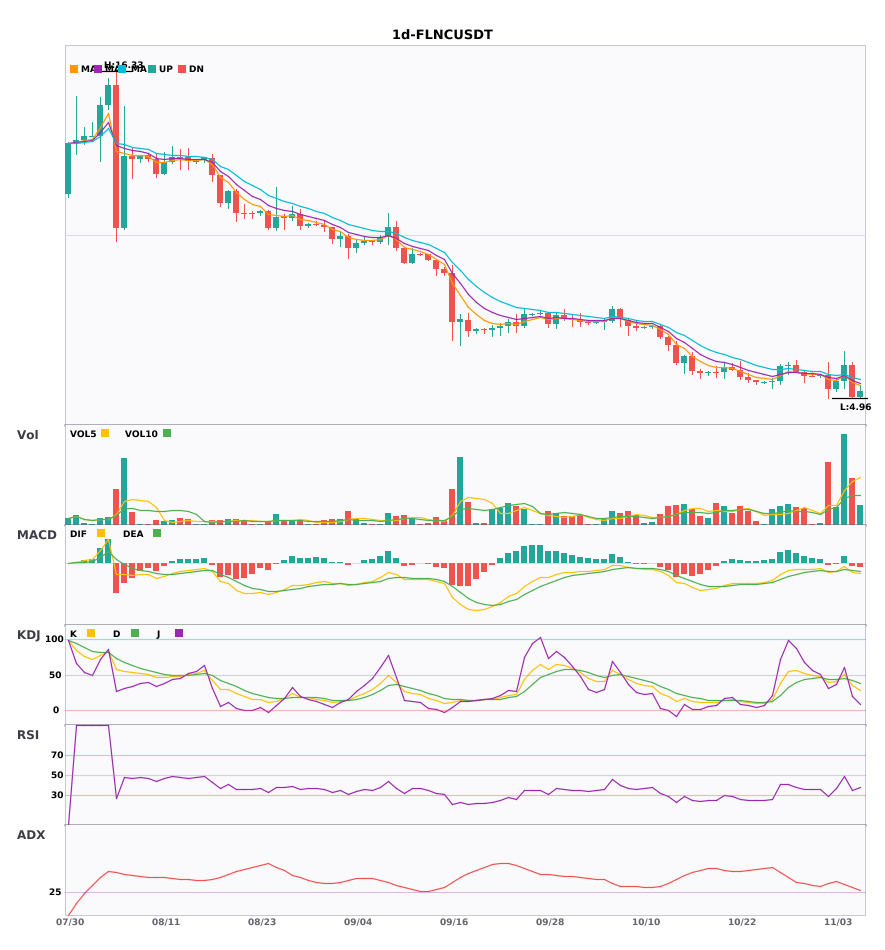
$FLNC daily multi-timeframe confluence, weekly bearish trend confirmed 🔥
════════════════════
🟢 $FLNC daily bearish signal
⚠️ Technical analysis: Weekly bearish confluence confirmed | Daily entry: MACD bearish crossover below zero, bearish momentum accelerating | EMA5 crosses below EMA8, short-term outlook turns bearish | KDJ bearish crossover, short-term outlook bearish (K: 34.9, D: 42.1) | Volume surge (3.5x)
════════════════════
🔔 Follow for firsthand updates on market movements 🔔
#多周期共振 #FLNC
📌 When trading, check whether the candlestick pattern meets the criteria
$FLNC daily multi-timeframe confluence, weekly bearish trend confirmed 🔥
════════════════════
🟢 $FLNC daily bearish signal
⚠️ Technical analysis: Weekly bearish confluence confirmed | Daily entry: MACD bearish crossover below zero, bearish momentum accelerating | EMA5 crosses below EMA8, short-term outlook turns bearish | KDJ bearish crossover, short-term outlook bearish (K: 34.9, D: 42.1) | Volume surge (3.5x)
════════════════════
🔔 Follow for firsthand updates on market movements 🔔
#多周期共振 #FLNC
📌 When trading, check whether the candlestick pattern meets the criteria
════════════════════
🟢 $FLNC daily bearish signal
⚠️ Technical analysis: Weekly bearish confluence confirmed | Daily entry: MACD bearish crossover below zero, bearish momentum accelerating | EMA5 crosses below EMA8, short-term outlook turns bearish | KDJ bearish crossover, short-term outlook bearish (K: 34.9, D: 42.1) | Volume surge (3.5x)
════════════════════
🔔 Follow for firsthand updates on market movements 🔔
#多周期共振 #FLNC
📌 When trading, check whether the candlestick pattern meets the criteria
4

·
--
$FLNCB at $6.05, +11.01% 📈
Green and steady. No panic, no spike and dump, just buyers
stepping in.
Trade 👇️
$FLNC
{future}(FLNCUSDT)
{spot}(FLNCBUSDT)
#flnc
$FLNCB at $6.05, +11.01% 📈
Green and steady. No panic, no spike and dump, just buyers
stepping in.
Trade 👇️
$FLNC
#flnc
Green and steady. No panic, no spike and dump, just buyers
stepping in.
Trade 👇️
$FLNC
#flnc
84
·
--
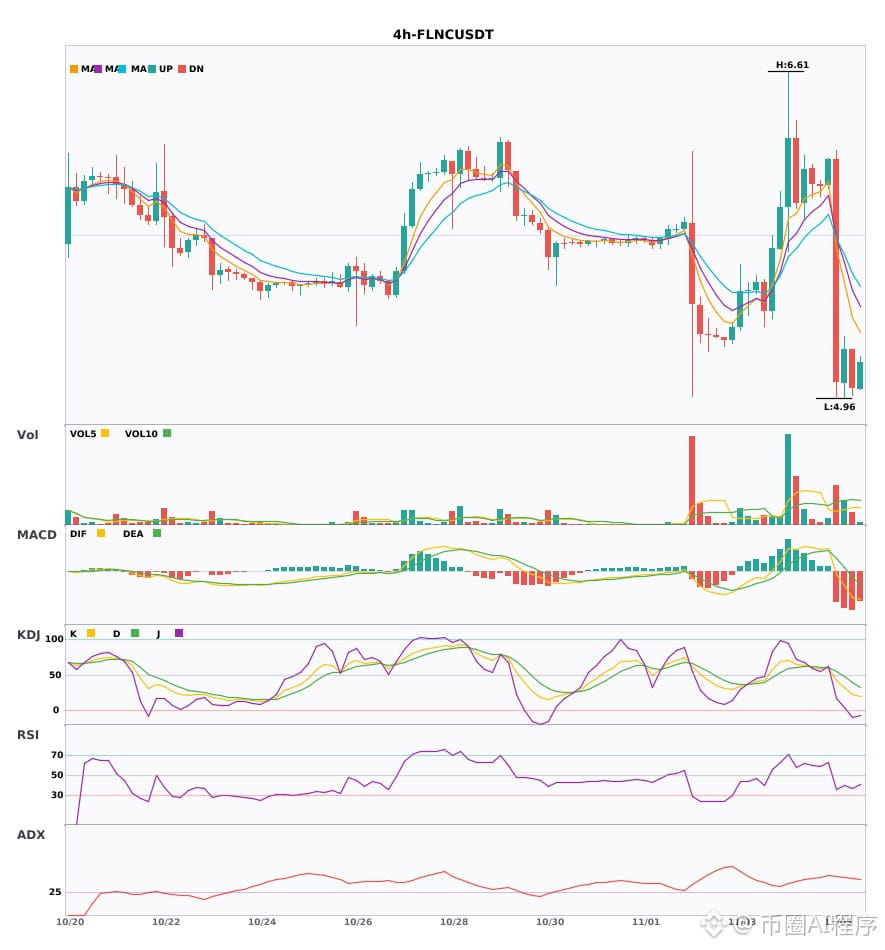
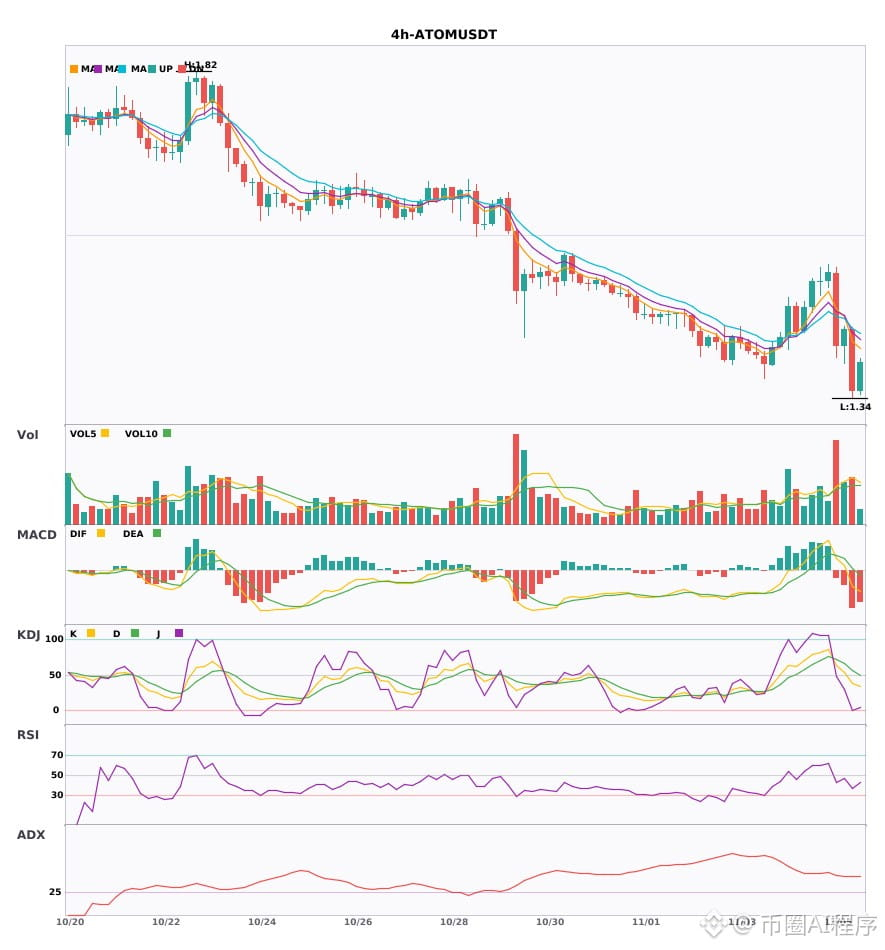
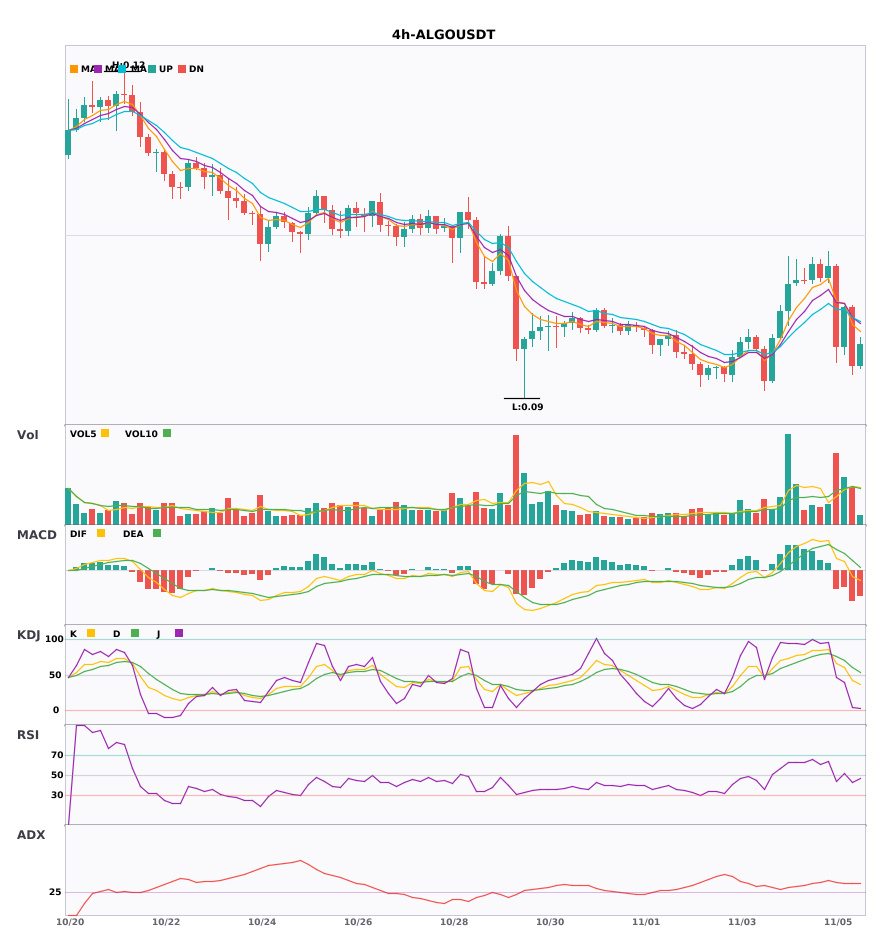
$FLNC / $ATOM / $ALGO 4-hour bearish + daily bearish in the same direction, multi-timeframe confluence turns bearish 🔥
════════════════════
🟢 $FLNC 4-hour bearish signal
⚠️Technical analysis: Daily bearish confluence confirmed | 4-hour entry: MACD is bearish, trend is weak, momentum is strengthening | EMA5 < EMA8 < EMA13, bearish alignment | KDJ is weak, bears have the advantage (K = 33.2, D = 47.5) | Increased volume (1.7x)
════════════════════
🟢 $ATOM 4-hour bearish signal
⚠️Technical analysis: Daily bearish confluence confirmed | 4-hour entry: MACD DIF fell below the zero line, trend turns bearish | EMA5 < EMA8 < EMA13, bearish alignment | Normal volume (1.2x)
════════════════════
🟢 $ALGO 4-hour bearish signal
⚠️Technical analysis: Daily bearish confluence confirmed | 4-hour entry: MACD DIF fell below the zero line, trend turns bearish | EMA5 < EMA8 < EMA13, bearish alignment | Normal volume (1.3x)
════════════════════
🔔 Follow for the latest market movements 🔔
#多周期共振 #FLNC #ATOM #ALGO
📌 When trading, pay attention to whether the candlestick pattern confirms the setup
$FLNC / $ATOM / $ALGO 4-hour bearish + daily bearish in the same direction, multi-timeframe confluence turns bearish 🔥
════════════════════
🟢 $FLNC 4-hour bearish signal
⚠️Technical analysis: Daily bearish confluence confirmed | 4-hour entry: MACD is bearish, trend is weak, momentum is strengthening | EMA5 < EMA8 < EMA13, bearish alignment | KDJ is weak, bears have the advantage (K = 33.2, D = 47.5) | Increased volume (1.7x)
════════════════════
🟢 $ATOM 4-hour bearish signal
⚠️Technical analysis: Daily bearish confluence confirmed | 4-hour entry: MACD DIF fell below the zero line, trend turns bearish | EMA5 < EMA8 < EMA13, bearish alignment | Normal volume (1.2x)
════════════════════
🟢 $ALGO 4-hour bearish signal
⚠️Technical analysis: Daily bearish confluence confirmed | 4-hour entry: MACD DIF fell below the zero line, trend turns bearish | EMA5 < EMA8 < EMA13, bearish alignment | Normal volume (1.3x)
════════════════════
🔔 Follow for the latest market movements 🔔
#多周期共振 #FLNC #ATOM #ALGO
📌 When trading, pay attention to whether the candlestick pattern confirms the setup
════════════════════
🟢 $FLNC 4-hour bearish signal
⚠️Technical analysis: Daily bearish confluence confirmed | 4-hour entry: MACD is bearish, trend is weak, momentum is strengthening | EMA5 < EMA8 < EMA13, bearish alignment | KDJ is weak, bears have the advantage (K = 33.2, D = 47.5) | Increased volume (1.7x)
════════════════════
🟢 $ATOM 4-hour bearish signal
⚠️Technical analysis: Daily bearish confluence confirmed | 4-hour entry: MACD DIF fell below the zero line, trend turns bearish | EMA5 < EMA8 < EMA13, bearish alignment | Normal volume (1.2x)
════════════════════
🟢 $ALGO 4-hour bearish signal
⚠️Technical analysis: Daily bearish confluence confirmed | 4-hour entry: MACD DIF fell below the zero line, trend turns bearish | EMA5 < EMA8 < EMA13, bearish alignment | Normal volume (1.3x)
════════════════════
🔔 Follow for the latest market movements 🔔
#多周期共振 #FLNC #ATOM #ALGO
📌 When trading, pay attention to whether the candlestick pattern confirms the setup
13

·
--
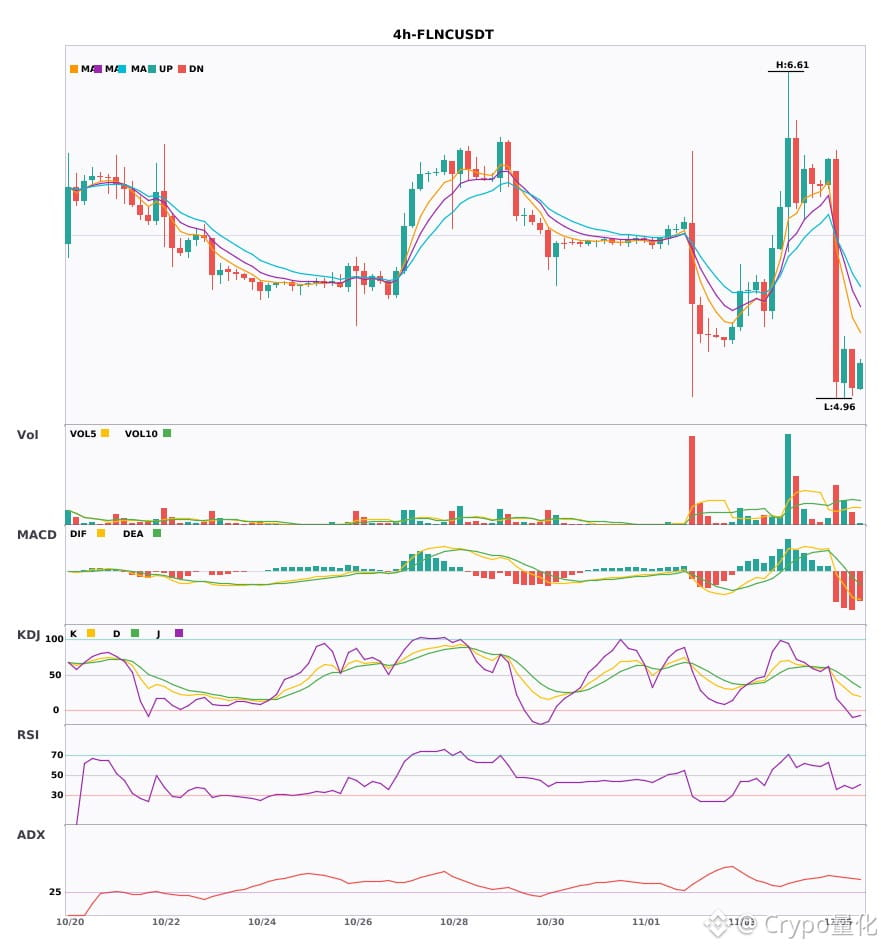
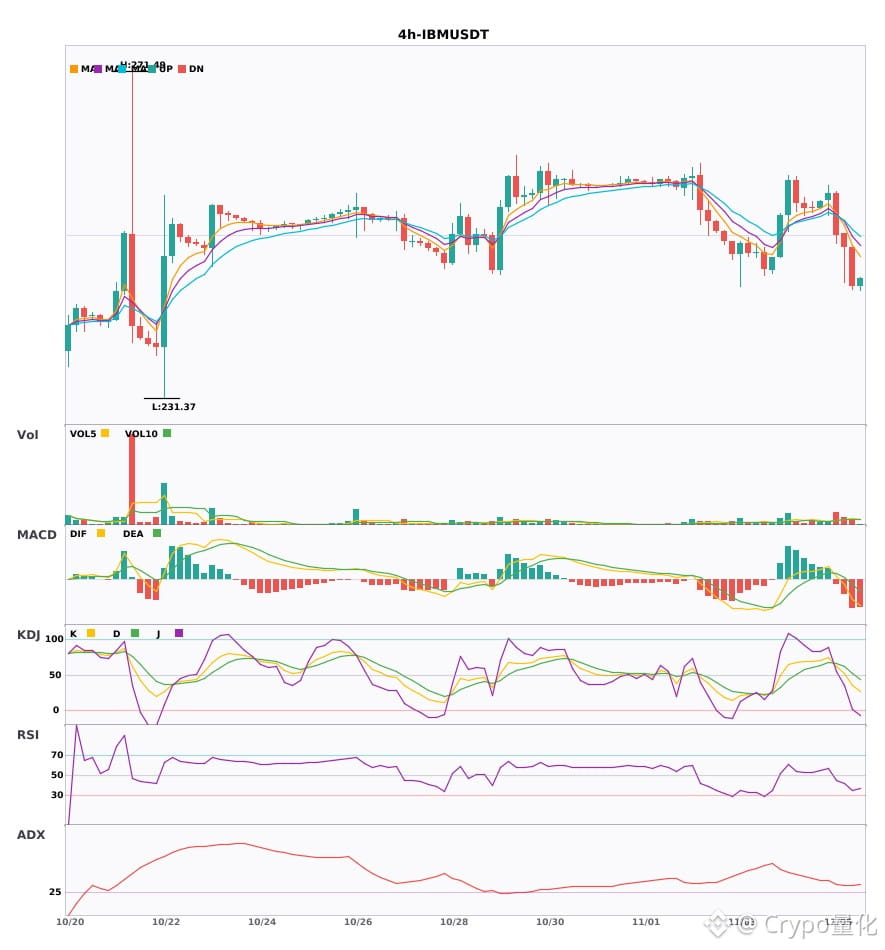
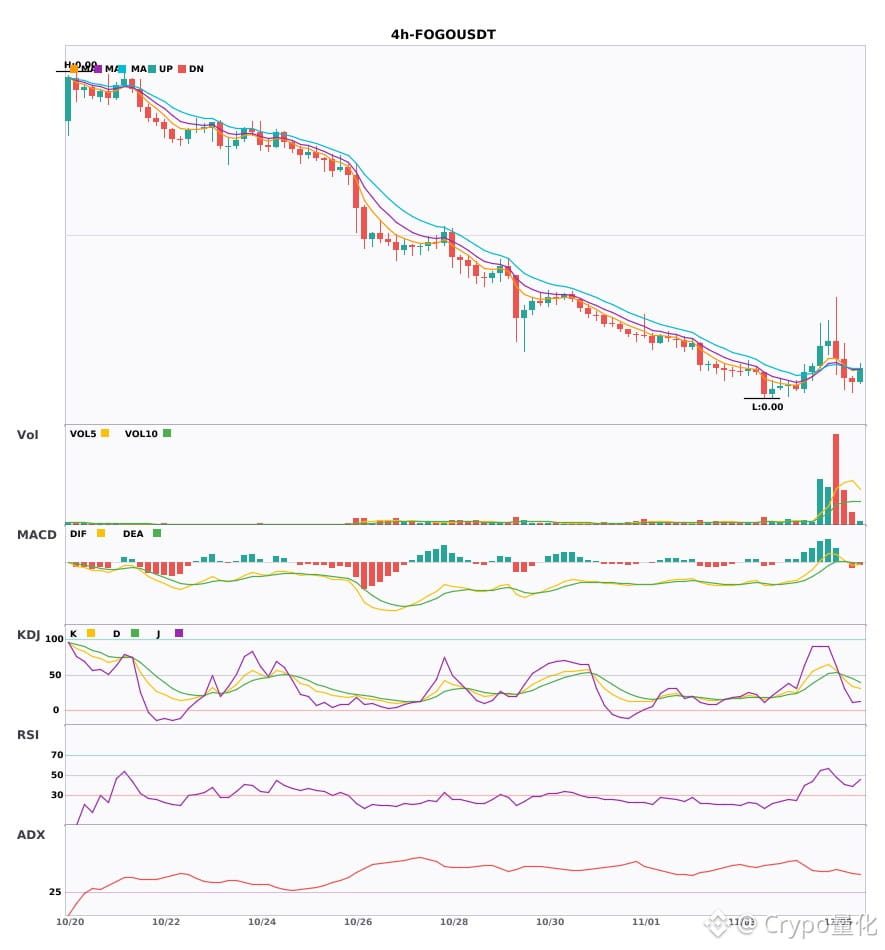
$FLNC / $IBM / $FOGO 4-hour resonance turns bearish; bearish signals appear simultaneously🔥
════════════════════
🟢 $FLNC 4-hour bearish signal
⚠️Technical analysis: ADX(44) indicates a clear trending market | MACD is bearish, the trend is weak, and momentum is strengthening | EMA5 < EMA8 < EMA13, bearish alignment | KDJ is weak, with bears in control (K: 33.2, D: 47.5) | Volume increased (1.7x)
════════════════════
🟢 $IBM 4-hour bearish signal
⚠️Technical analysis: ADX(35) indicates a clear trending market | MACD DIF fell below the zero line, signaling a bearish trend reversal | EMA5 crossed below EMA8, turning bearish in the short term | KDJ is strong, with bulls in control (K: 52.4, D: 61.3) | Volume surged (2.5x)
════════════════════
🟢 $FOGO 4-hour bearish signal
⚠️Technical analysis: ADX(46) indicates a very strong trend (beware of a potentially overheated pullback) | MACD bearish crossover below zero, bearish momentum accelerating | EMA5 crossed below EMA8, turning bearish in the short term | KDJ is weak, with bears in control (K: 33.8, D: 44.6) | Volume increased (1.5x)
════════════════════
🔔 Follow for first-hand market movement updates 🔔
#技术分析 #FLNC #IBM #FOGO
📌 When trading, watch for whether the candlestick patterns confirm the signal
$FLNC / $IBM / $FOGO 4-hour resonance turns bearish; bearish signals appear simultaneously🔥
════════════════════
🟢 $FLNC 4-hour bearish signal
⚠️Technical analysis: ADX(44) indicates a clear trending market | MACD is bearish, the trend is weak, and momentum is strengthening | EMA5 < EMA8 < EMA13, bearish alignment | KDJ is weak, with bears in control (K: 33.2, D: 47.5) | Volume increased (1.7x)
════════════════════
🟢 $IBM 4-hour bearish signal
⚠️Technical analysis: ADX(35) indicates a clear trending market | MACD DIF fell below the zero line, signaling a bearish trend reversal | EMA5 crossed below EMA8, turning bearish in the short term | KDJ is strong, with bulls in control (K: 52.4, D: 61.3) | Volume surged (2.5x)
════════════════════
🟢 $FOGO 4-hour bearish signal
⚠️Technical analysis: ADX(46) indicates a very strong trend (beware of a potentially overheated pullback) | MACD bearish crossover below zero, bearish momentum accelerating | EMA5 crossed below EMA8, turning bearish in the short term | KDJ is weak, with bears in control (K: 33.8, D: 44.6) | Volume increased (1.5x)
════════════════════
🔔 Follow for first-hand market movement updates 🔔
#技术分析 #FLNC #IBM #FOGO
📌 When trading, watch for whether the candlestick patterns confirm the signal
════════════════════
🟢 $FLNC 4-hour bearish signal
⚠️Technical analysis: ADX(44) indicates a clear trending market | MACD is bearish, the trend is weak, and momentum is strengthening | EMA5 < EMA8 < EMA13, bearish alignment | KDJ is weak, with bears in control (K: 33.2, D: 47.5) | Volume increased (1.7x)
════════════════════
🟢 $IBM 4-hour bearish signal
⚠️Technical analysis: ADX(35) indicates a clear trending market | MACD DIF fell below the zero line, signaling a bearish trend reversal | EMA5 crossed below EMA8, turning bearish in the short term | KDJ is strong, with bulls in control (K: 52.4, D: 61.3) | Volume surged (2.5x)
════════════════════
🟢 $FOGO 4-hour bearish signal
⚠️Technical analysis: ADX(46) indicates a very strong trend (beware of a potentially overheated pullback) | MACD bearish crossover below zero, bearish momentum accelerating | EMA5 crossed below EMA8, turning bearish in the short term | KDJ is weak, with bears in control (K: 33.8, D: 44.6) | Volume increased (1.5x)
════════════════════
🔔 Follow for first-hand market movement updates 🔔
#技术分析 #FLNC #IBM #FOGO
📌 When trading, watch for whether the candlestick patterns confirm the signal
45
·
--
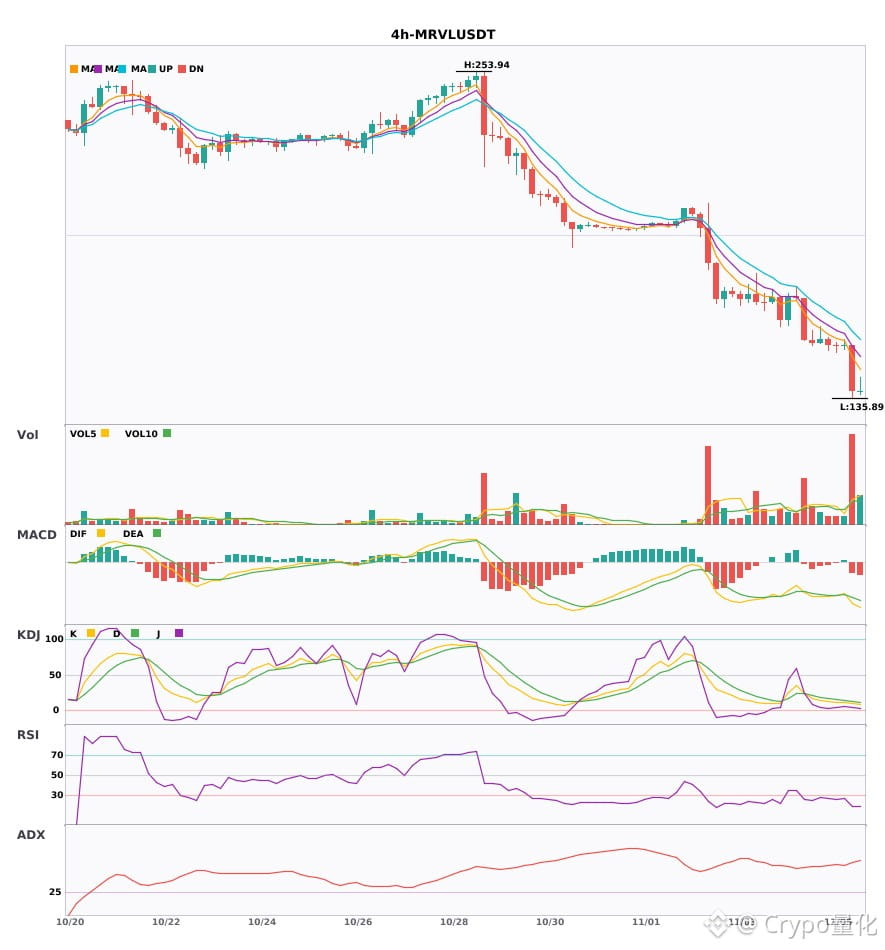
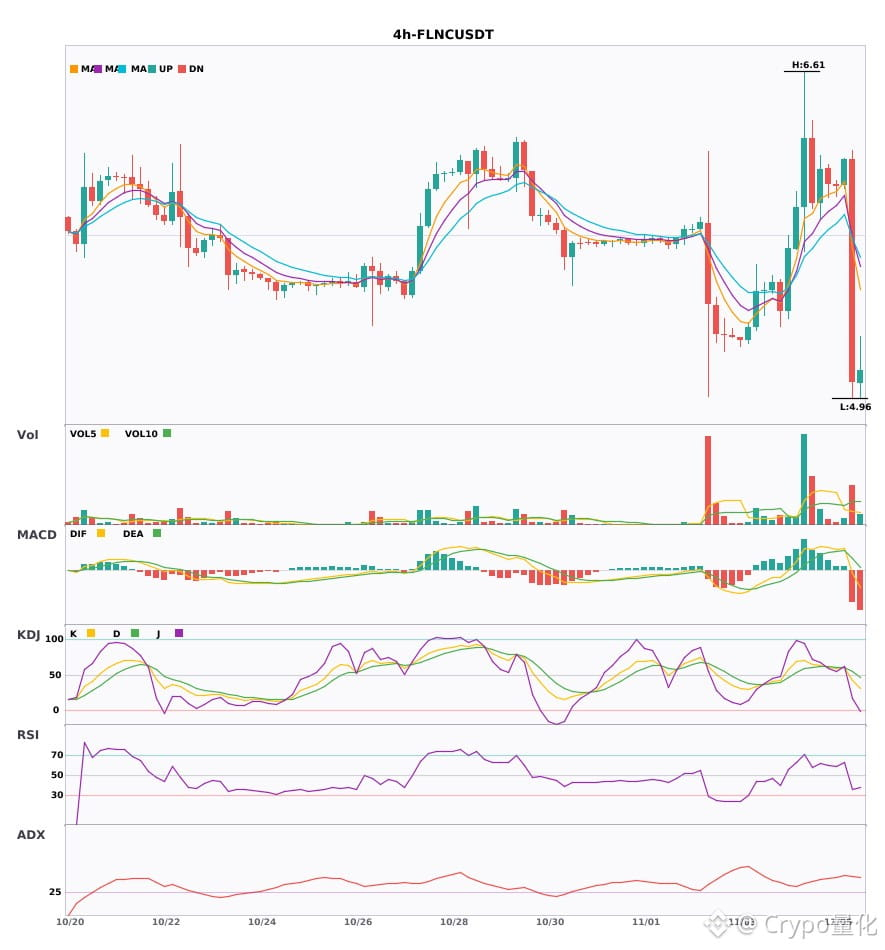
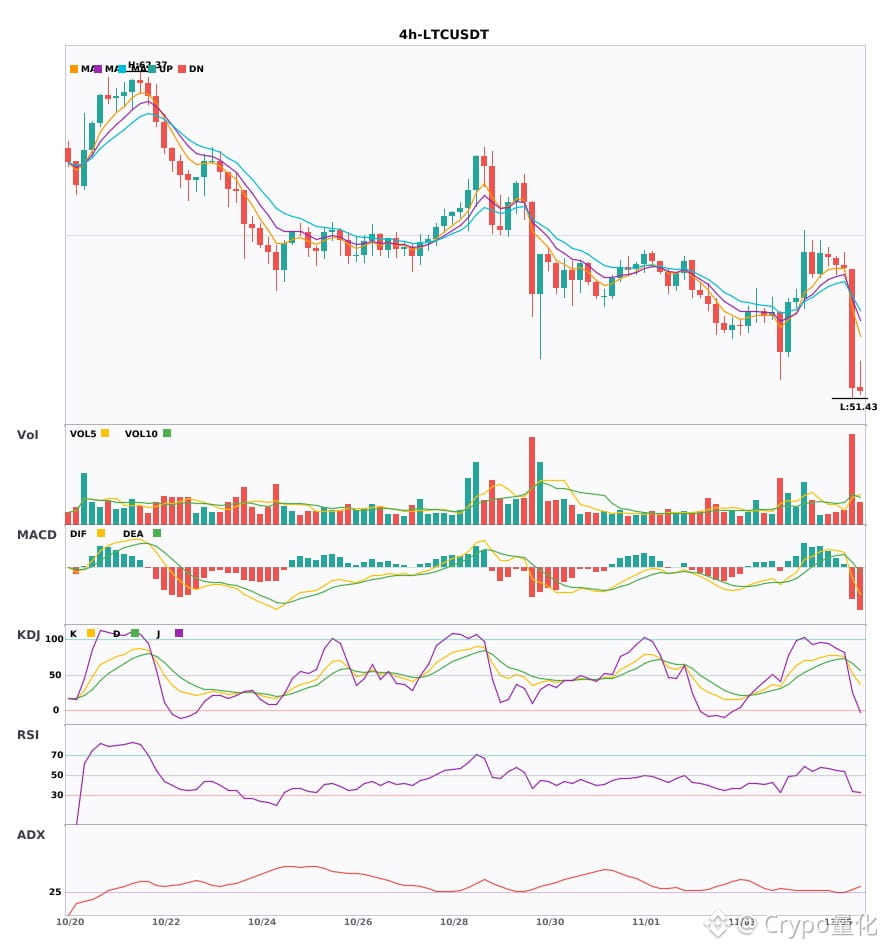
$MRVL / $FLNC / $LTC 4-hour technical indicators are weakening across the board; be mindful of risk🔥
════════════════════
🟢 $MRVL 4-hour bearish signal
⚠️Technical analysis: ADX(58): Very strong trend (beware of an overheated pullback) | MACD bearish cross below zero, bearish momentum accelerating | EMA5 < EMA8 < EMA13, bearish alignment | KDJ in oversold territory; watch for rebound opportunities (K=9.5, D=12.3) | Volume surge (3.9x)
════════════════════
🟢 $FLNC 4-hour bearish signal
⚠️Technical analysis: ADX(45): Clear trending market | MACD bearish cross below zero, bearish momentum accelerating | EMA5 crossed below EMA8, short-term outlook turning bearish | KDJ bearish cross, short-term outlook bearish (K=42.3, D=54.6) | Increased volume (1.7x)
════════════════════
🟢 $LTC 4-hour bearish signal
⚠️Technical analysis: ADX(31): Clear trending market | MACD bearish cross below zero, bearish momentum accelerating | EMA5 crossed below EMA8, short-term outlook turning bearish | KDJ bearish cross, short-term outlook bearish (K=52.8, D=66.3) | Volume surge (3.0x)
════════════════════
🔔 Follow for first-hand market movement alerts 🔔
#技术分析 #MRVL #FLNC #LTC
📌 When trading, check whether the candlestick pattern confirms the signal
$MRVL / $FLNC / $LTC 4-hour technical indicators are weakening across the board; be mindful of risk🔥
════════════════════
🟢 $MRVL 4-hour bearish signal
⚠️Technical analysis: ADX(58): Very strong trend (beware of an overheated pullback) | MACD bearish cross below zero, bearish momentum accelerating | EMA5 < EMA8 < EMA13, bearish alignment | KDJ in oversold territory; watch for rebound opportunities (K=9.5, D=12.3) | Volume surge (3.9x)
════════════════════
🟢 $FLNC 4-hour bearish signal
⚠️Technical analysis: ADX(45): Clear trending market | MACD bearish cross below zero, bearish momentum accelerating | EMA5 crossed below EMA8, short-term outlook turning bearish | KDJ bearish cross, short-term outlook bearish (K=42.3, D=54.6) | Increased volume (1.7x)
════════════════════
🟢 $LTC 4-hour bearish signal
⚠️Technical analysis: ADX(31): Clear trending market | MACD bearish cross below zero, bearish momentum accelerating | EMA5 crossed below EMA8, short-term outlook turning bearish | KDJ bearish cross, short-term outlook bearish (K=52.8, D=66.3) | Volume surge (3.0x)
════════════════════
🔔 Follow for first-hand market movement alerts 🔔
#技术分析 #MRVL #FLNC #LTC
📌 When trading, check whether the candlestick pattern confirms the signal
════════════════════
🟢 $MRVL 4-hour bearish signal
⚠️Technical analysis: ADX(58): Very strong trend (beware of an overheated pullback) | MACD bearish cross below zero, bearish momentum accelerating | EMA5 < EMA8 < EMA13, bearish alignment | KDJ in oversold territory; watch for rebound opportunities (K=9.5, D=12.3) | Volume surge (3.9x)
════════════════════
🟢 $FLNC 4-hour bearish signal
⚠️Technical analysis: ADX(45): Clear trending market | MACD bearish cross below zero, bearish momentum accelerating | EMA5 crossed below EMA8, short-term outlook turning bearish | KDJ bearish cross, short-term outlook bearish (K=42.3, D=54.6) | Increased volume (1.7x)
════════════════════
🟢 $LTC 4-hour bearish signal
⚠️Technical analysis: ADX(31): Clear trending market | MACD bearish cross below zero, bearish momentum accelerating | EMA5 crossed below EMA8, short-term outlook turning bearish | KDJ bearish cross, short-term outlook bearish (K=52.8, D=66.3) | Volume surge (3.0x)
════════════════════
🔔 Follow for first-hand market movement alerts 🔔
#技术分析 #MRVL #FLNC #LTC
📌 When trading, check whether the candlestick pattern confirms the signal
33

·
--
📊 Real-time monitoring of unusual Binance coin movements | Bullish anomalies · Bearish anomalies · Wick anomalies
🔍 Custom requests accepted; seeking partners
📈 FLNCUSDT steady upward trend alert
Trading pair: $FLNCUSDT (perpetual contract)
Current price: 6.31400000 USDT
90-minute increase: 8.53% 📈
Funding rate: 0.0000%
Detected at: 2026-11-04 22:30:17
Previous surge anomaly: 2026-11-02 21:37:32 (48.9 hours ago)
📊 Trading volume changes
1h volume / 24h average: 5.52x 📈
1h trading volume: 0.206 ten million USDT
24h trading volume: 0.897 ten million USDT
📊 Open interest changes
Change in contract open interest: 1.05x 📈
Current open interest: 0.157 ten million USDT
Open interest 1h ago: 0.150 ten million USDT
⚖️ Long/short ratio
Current long/short ratio / 1h ago: 1.0177x 📈
Whale long/short position ratio: 2.28 (2.24 1h ago)
⏱ First surge anomaly in two days
⏱ Second surge anomaly in three days
💡 1h trading volume has risen to 5.52x the average, and the whale long/short ratio of 2.28 is today's highest, indicating a clear concentration of bullish positions; the funding rate remains at 0, with no crowding cost yet
#FLNC #USDT #合约异动 #资金费率 #Binance Square
📊 Real-time monitoring of unusual Binance coin movements | Bullish anomalies · Bearish anomalies · Wick anomalies
🔍 Custom requests accepted; seeking partners
📈 FLNCUSDT steady upward trend alert
Trading pair: $FLNCUSDT (perpetual contract)
Current price: 6.31400000 USDT
90-minute increase: 8.53% 📈
Funding rate: 0.0000%
Detected at: 2026-11-04 22:30:17
Previous surge anomaly: 2026-11-02 21:37:32 (48.9 hours ago)
📊 Trading volume changes
1h volume / 24h average: 5.52x 📈
1h trading volume: 0.206 ten million USDT
24h trading volume: 0.897 ten million USDT
📊 Open interest changes
Change in contract open interest: 1.05x 📈
Current open interest: 0.157 ten million USDT
Open interest 1h ago: 0.150 ten million USDT
⚖️ Long/short ratio
Current long/short ratio / 1h ago: 1.0177x 📈
Whale long/short position ratio: 2.28 (2.24 1h ago)
⏱ First surge anomaly in two days
⏱ Second surge anomaly in three days
💡 1h trading volume has risen to 5.52x the average, and the whale long/short ratio of 2.28 is today's highest, indicating a clear concentration of bullish positions; the funding rate remains at 0, with no crowding cost yet
#FLNC #USDT #合约异动 #资金费率 #Binance Square
🔍 Custom requests accepted; seeking partners
📈 FLNCUSDT steady upward trend alert
Trading pair: $FLNCUSDT (perpetual contract)
Current price: 6.31400000 USDT
90-minute increase: 8.53% 📈
Funding rate: 0.0000%
Detected at: 2026-11-04 22:30:17
Previous surge anomaly: 2026-11-02 21:37:32 (48.9 hours ago)
📊 Trading volume changes
1h volume / 24h average: 5.52x 📈
1h trading volume: 0.206 ten million USDT
24h trading volume: 0.897 ten million USDT
📊 Open interest changes
Change in contract open interest: 1.05x 📈
Current open interest: 0.157 ten million USDT
Open interest 1h ago: 0.150 ten million USDT
⚖️ Long/short ratio
Current long/short ratio / 1h ago: 1.0177x 📈
Whale long/short position ratio: 2.28 (2.24 1h ago)
⏱ First surge anomaly in two days
⏱ Second surge anomaly in three days
💡 1h trading volume has risen to 5.52x the average, and the whale long/short ratio of 2.28 is today's highest, indicating a clear concentration of bullish positions; the funding rate remains at 0, with no crowding cost yet
#FLNC #USDT #合约异动 #资金费率 #Binance Square
29
·
--
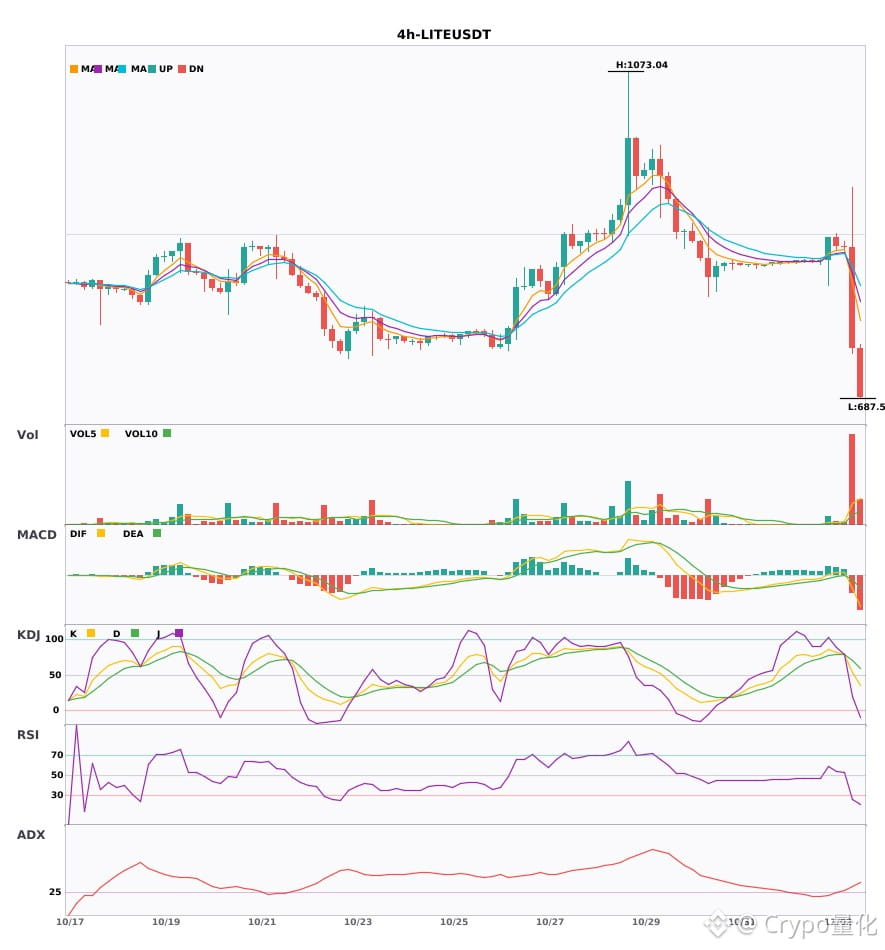
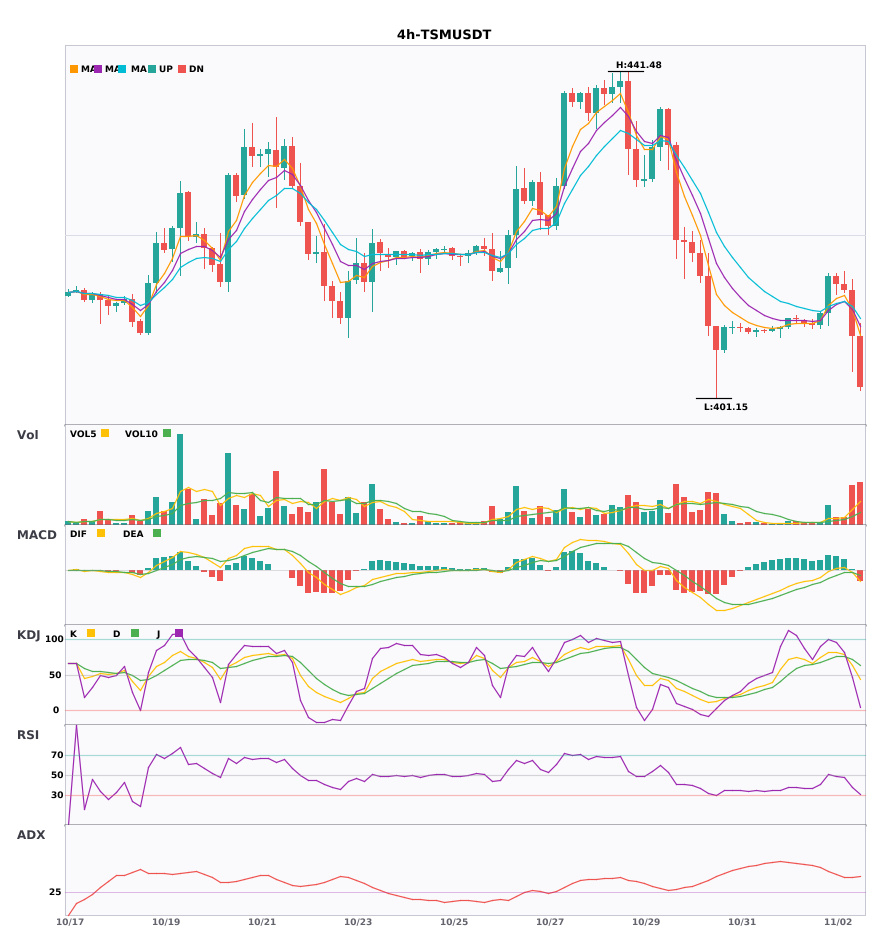
3 four-hour bearish alerts: $LITE / $FLNC / $TSM🔥
════════════════════
🟢 $LITE 4-hour bearish signal
⚠️Technical analysis: ADX(37) indicates a clear trend | MACD bearish crossover below zero, bearish momentum accelerating | EMA5 crossed below EMA8, turning bearish short-term | KDJ bearish crossover, bearish short-term (K: 53.5, D: 70.2) | Volume surge (8.5x)
════════════════════
🟢 $FLNC 4-hour bearish signal
⚠️Technical analysis: ADX(38) indicates a clear trend | MACD bearish crossover below zero, bearish momentum accelerating | EMA5 crossed below EMA8, turning bearish short-term | KDJ bearish crossover, bearish short-term (K: 62.4, D: 65.9) | Volume surge (9.2x)
════════════════════
🟢 $TSM 4-hour bearish signal
⚠️Technical analysis: ADX(44) indicates a clear trend | MACD DIF fell below zero, trend turning bearish | EMA5 crossed below EMA8, turning bearish short-term | KDJ bearish crossover, bearish short-term (K: 63.8, D: 72.3) | Volume surge (4.4x)
════════════════════
🔔 Follow for first-hand market alerts 🔔
#技术分析 #LITE #FLNC #TSM
📌 When trading, pay attention to whether the candlestick pattern confirms the signal
3 four-hour bearish alerts: $LITE / $FLNC / $TSM 🔥
════════════════════
🟢 $LITE 4-hour bearish signal
⚠️Technical analysis: ADX(37) indicates a clear trend | MACD bearish crossover below zero, bearish momentum accelerating | EMA5 crossed below EMA8, turning bearish short-term | KDJ bearish crossover, bearish short-term (K: 53.5, D: 70.2) | Volume surge (8.5x)
════════════════════
🟢 $FLNC 4-hour bearish signal
⚠️Technical analysis: ADX(38) indicates a clear trend | MACD bearish crossover below zero, bearish momentum accelerating | EMA5 crossed below EMA8, turning bearish short-term | KDJ bearish crossover, bearish short-term (K: 62.4, D: 65.9) | Volume surge (9.2x)
════════════════════
🟢 $TSM 4-hour bearish signal
⚠️Technical analysis: ADX(44) indicates a clear trend | MACD DIF fell below zero, trend turning bearish | EMA5 crossed below EMA8, turning bearish short-term | KDJ bearish crossover, bearish short-term (K: 63.8, D: 72.3) | Volume surge (4.4x)
════════════════════
🔔 Follow for first-hand market alerts 🔔
#技术分析 #LITE #FLNC #TSM
📌 When trading, pay attention to whether the candlestick pattern confirms the signal
════════════════════
🟢 $LITE 4-hour bearish signal
⚠️Technical analysis: ADX(37) indicates a clear trend | MACD bearish crossover below zero, bearish momentum accelerating | EMA5 crossed below EMA8, turning bearish short-term | KDJ bearish crossover, bearish short-term (K: 53.5, D: 70.2) | Volume surge (8.5x)
════════════════════
🟢 $FLNC 4-hour bearish signal
⚠️Technical analysis: ADX(38) indicates a clear trend | MACD bearish crossover below zero, bearish momentum accelerating | EMA5 crossed below EMA8, turning bearish short-term | KDJ bearish crossover, bearish short-term (K: 62.4, D: 65.9) | Volume surge (9.2x)
════════════════════
🟢 $TSM 4-hour bearish signal
⚠️Technical analysis: ADX(44) indicates a clear trend | MACD DIF fell below zero, trend turning bearish | EMA5 crossed below EMA8, turning bearish short-term | KDJ bearish crossover, bearish short-term (K: 63.8, D: 72.3) | Volume surge (4.4x)
════════════════════
🔔 Follow for first-hand market alerts 🔔
#技术分析 #LITE #FLNC #TSM
📌 When trading, pay attention to whether the candlestick pattern confirms the signal
11

·
--
FLNC just saw a sharp 5m drop of -11.21% 39 minutes ago. At the 2026-11-02 21:45 Beijing time close, it rebounded +5.67% over 5m. This is not a new alert, but an update on the recovery after the previous sharp drop.
Binance TradFi perpetual (traditional finance category). At 2026-11-02 21:45:01 Beijing time, the observed price was 5.899, 24h volume was 4.4493 million, price was above VWAP 5.4026, and MACD was 0.0148725.
Can the pullback hold above VWAP 5.4026? There is some disagreement; the key is whether funds are willing to keep signaling their intentions.
Note: This is a traditional finance category perpetual. Liquidity is lower and gap risk is higher outside trading hours. 24h trading volume is under $5 million, and the order book is relatively thin, so beware of slippage.
#FLNC #UnusualMovementAlert
FLNC just saw a sharp 5m drop of -11.21% 39 minutes ago. At the 2026-11-02 21:45 Beijing time close, it rebounded +5.67% over 5m. This is not a new alert, but an update on the recovery after the previous sharp drop.
Binance TradFi perpetual (traditional finance category). At 2026-11-02 21:45:01 Beijing time, the observed price was 5.899, 24h volume was 4.4493 million, price was above VWAP 5.4026, and MACD was 0.0148725.
Can the pullback hold above VWAP 5.4026? There is some disagreement; the key is whether funds are willing to keep signaling their intentions.
Note: This is a traditional finance category perpetual. Liquidity is lower and gap risk is higher outside trading hours. 24h trading volume is under $5 million, and the order book is relatively thin, so beware of slippage.
#FLNC #UnusualMovementAlert
Binance TradFi perpetual (traditional finance category). At 2026-11-02 21:45:01 Beijing time, the observed price was 5.899, 24h volume was 4.4493 million, price was above VWAP 5.4026, and MACD was 0.0148725.
Can the pullback hold above VWAP 5.4026? There is some disagreement; the key is whether funds are willing to keep signaling their intentions.
Note: This is a traditional finance category perpetual. Liquidity is lower and gap risk is higher outside trading hours. 24h trading volume is under $5 million, and the order book is relatively thin, so beware of slippage.
#FLNC #UnusualMovementAlert
3
·
--
FLNC Binance TradFi perpetual (traditional finance), down 11.21% over the 5 minutes ending at 21:05 Beijing time on 2026-11-02. At 21:05:01 Beijing time on 2026-11-02, the observed current price was 5.154, 24h trading volume was 1.5481 million, price was below VWAP 5.4662, and RSI was 6.8. First, focus on the key data. What matters more now is establishing the boundaries based on the current price, trading volume, and indicator levels.
The next key question is whether a rebound can reclaim VWAP 5.4662 and whether selling pressure is easing.
Note: This is a traditional-finance perpetual contract. Liquidity is lower and gap risk is higher outside trading hours. 24h trading volume is below $5 million, and the order book is thin, so watch out for slippage.
#FLNC #Unusual-Movement-Alert
FLNC Binance TradFi perpetual (traditional finance), down 11.21% over the 5 minutes ending at 21:05 Beijing time on 2026-11-02. At 21:05:01 Beijing time on 2026-11-02, the observed current price was 5.154, 24h trading volume was 1.5481 million, price was below VWAP 5.4662, and RSI was 6.8. First, focus on the key data. What matters more now is establishing the boundaries based on the current price, trading volume, and indicator levels.
The next key question is whether a rebound can reclaim VWAP 5.4662 and whether selling pressure is easing.
Note: This is a traditional-finance perpetual contract. Liquidity is lower and gap risk is higher outside trading hours. 24h trading volume is below $5 million, and the order book is thin, so watch out for slippage.
#FLNC #Unusual-Movement-Alert
The next key question is whether a rebound can reclaim VWAP 5.4662 and whether selling pressure is easing.
Note: This is a traditional-finance perpetual contract. Liquidity is lower and gap risk is higher outside trading hours. 24h trading volume is below $5 million, and the order book is thin, so watch out for slippage.
#FLNC #Unusual-Movement-Alert
17
·
--
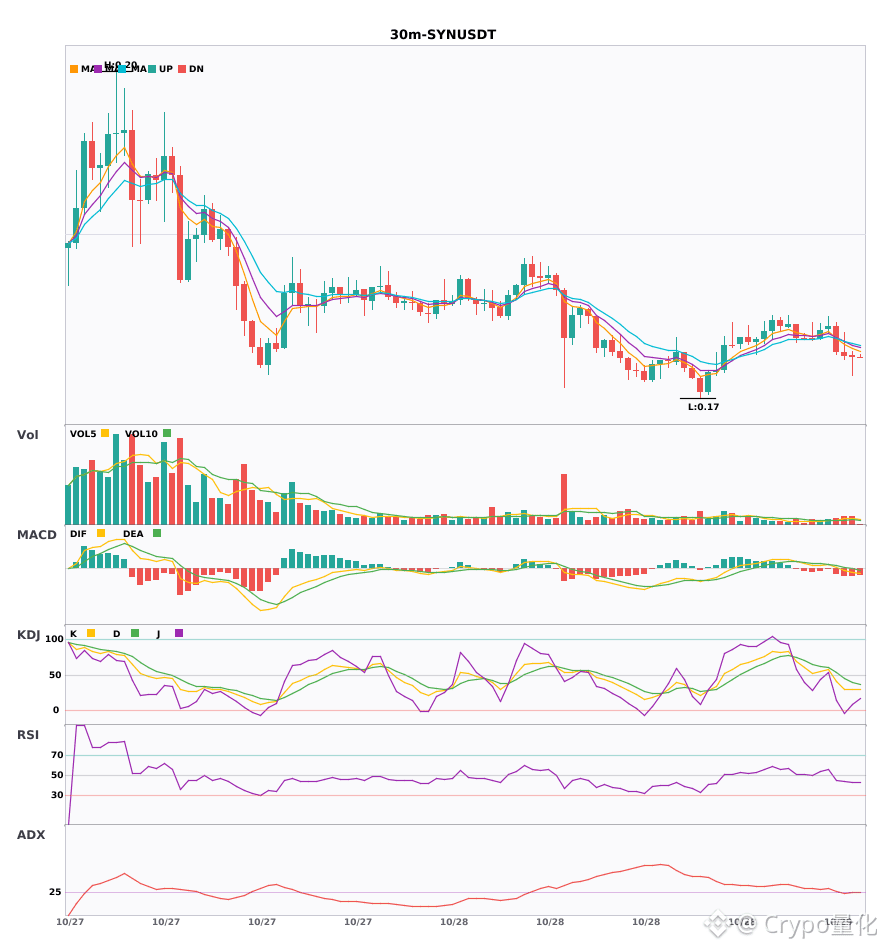
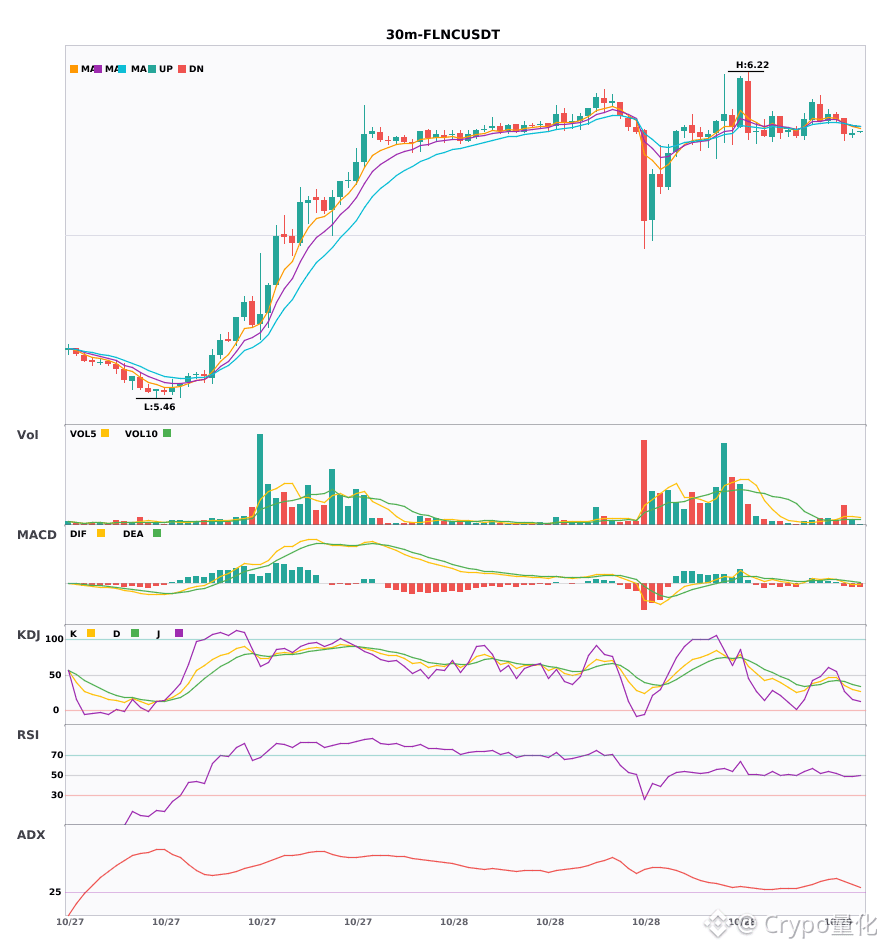
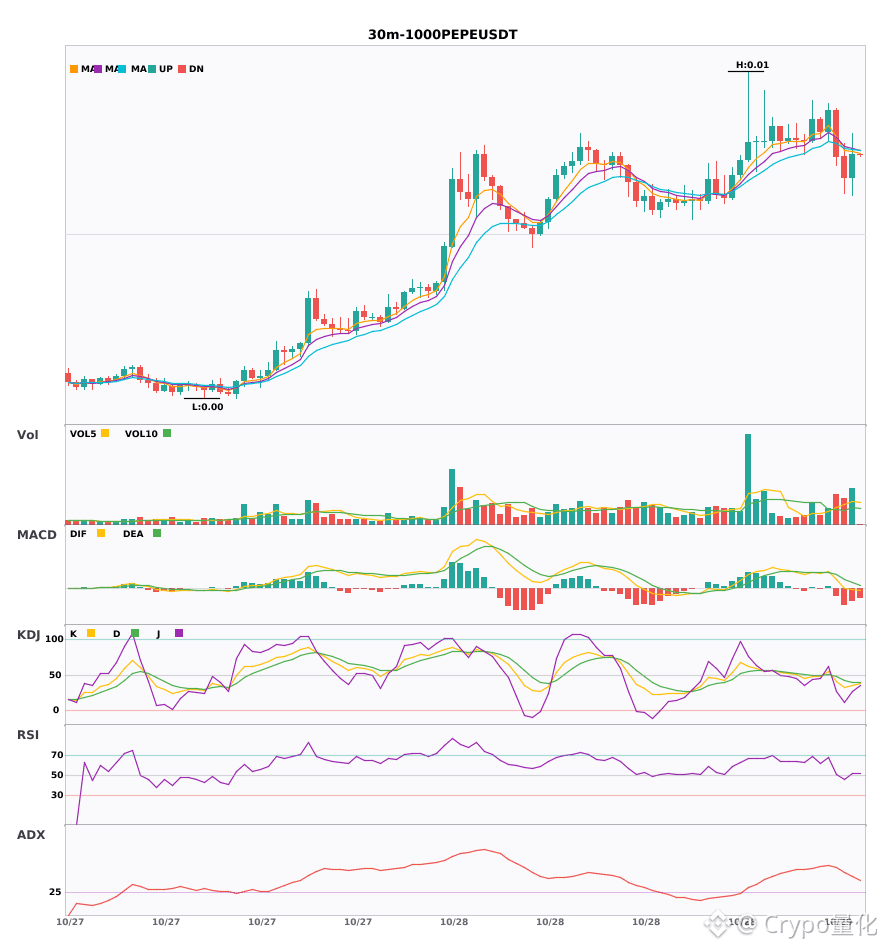
3 bearish alerts on the 30-minute timeframe: $SYN / $FLNC / $1000PEPE🔥
════════════════════
🟢 $SYN 30-minute bearish signal
⚠️Technical analysis: ADX(25): Trend is forming; potential entry | MACD DIF fell below zero, signaling a bearish trend | EMA5 < EMA8 < EMA13: bearish alignment | KDJ is weak, with bears in control (K: 29.0, D: 45.3) | Volume increased (1.8x)
════════════════════
🟢 $FLNC 30-minute bearish signal
⚠️Technical analysis: ADX(35): Clear trending market | MACD DIF fell below zero, signaling a bearish trend | EMA5 < EMA8 < EMA13: bearish alignment | KDJ is weak, with bears in control (K: 29.6, D: 36.8) | Volume surged (3.5x)
════════════════════
🟢 $1000PEPE 30-minute bearish signal
⚠️Technical analysis: ADX(46): Very strong trend (beware of an overheated pullback) | MACD DIF fell below zero, signaling a bearish trend | EMA5 crossed below EMA8, turning bearish in the short term | KDJ is weak, with bears in control (K: 32.2, D: 42.2) | Volume increased (1.9x)
════════════════════
🔔 Follow for the latest market movements 🔔
#技术分析 #SYN #FLNC #1000PEPE
📌 When trading, check whether the candlestick pattern confirms the signal
3 bearish alerts on the 30-minute timeframe: $SYN / $FLNC / $1000PEPE🔥
════════════════════
🟢 $SYN 30-minute bearish signal
⚠️Technical analysis: ADX(25): Trend is forming; potential entry | MACD DIF fell below zero, signaling a bearish trend | EMA5 < EMA8 < EMA13: bearish alignment | KDJ is weak, with bears in control (K: 29.0, D: 45.3) | Volume increased (1.8x)
════════════════════
🟢 $FLNC 30-minute bearish signal
⚠️Technical analysis: ADX(35): Clear trending market | MACD DIF fell below zero, signaling a bearish trend | EMA5 < EMA8 < EMA13: bearish alignment | KDJ is weak, with bears in control (K: 29.6, D: 36.8) | Volume surged (3.5x)
════════════════════
🟢 $1000PEPE 30-minute bearish signal
⚠️Technical analysis: ADX(46): Very strong trend (beware of an overheated pullback) | MACD DIF fell below zero, signaling a bearish trend | EMA5 crossed below EMA8, turning bearish in the short term | KDJ is weak, with bears in control (K: 32.2, D: 42.2) | Volume increased (1.9x)
════════════════════
🔔 Follow for the latest market movements 🔔
#技术分析 #SYN #FLNC #1000PEPE
📌 When trading, check whether the candlestick pattern confirms the signal
════════════════════
🟢 $SYN 30-minute bearish signal
⚠️Technical analysis: ADX(25): Trend is forming; potential entry | MACD DIF fell below zero, signaling a bearish trend | EMA5 < EMA8 < EMA13: bearish alignment | KDJ is weak, with bears in control (K: 29.0, D: 45.3) | Volume increased (1.8x)
════════════════════
🟢 $FLNC 30-minute bearish signal
⚠️Technical analysis: ADX(35): Clear trending market | MACD DIF fell below zero, signaling a bearish trend | EMA5 < EMA8 < EMA13: bearish alignment | KDJ is weak, with bears in control (K: 29.6, D: 36.8) | Volume surged (3.5x)
════════════════════
🟢 $1000PEPE 30-minute bearish signal
⚠️Technical analysis: ADX(46): Very strong trend (beware of an overheated pullback) | MACD DIF fell below zero, signaling a bearish trend | EMA5 crossed below EMA8, turning bearish in the short term | KDJ is weak, with bears in control (K: 32.2, D: 42.2) | Volume increased (1.9x)
════════════════════
🔔 Follow for the latest market movements 🔔
#技术分析 #SYN #FLNC #1000PEPE
📌 When trading, check whether the candlestick pattern confirms the signal
8

$FLNC Shows Strong Bullish Momentum! 🚀
FLNC is trading at $6.14, up 9.64% according to the screenshot. This strong daily gain highlights positive market momentum and growing trader interest. Bulls may attempt to push the price higher if buying pressure continues. However, a rejection near resistance could trigger a pullback. Traders should watch price action and volume before making decisions. Always manage risk carefully.
#FLNC #cryptotrading #BİNANCESQUARE
{spot}(FLNCBUSDT)
$FLNC Shows Strong Bullish Momentum! 🚀
FLNC is trading at $6.14, up 9.64% according to the screenshot. This strong daily gain highlights positive market momentum and growing trader interest. Bulls may attempt to push the price higher if buying pressure continues. However, a rejection near resistance could trigger a pullback. Traders should watch price action and volume before making decisions. Always manage risk carefully.
#FLNC #cryptotrading #BİNANCESQUARE
FLNC is trading at $6.14, up 9.64% according to the screenshot. This strong daily gain highlights positive market momentum and growing trader interest. Bulls may attempt to push the price higher if buying pressure continues. However, a rejection near resistance could trigger a pullback. Traders should watch price action and volume before making decisions. Always manage risk carefully.
#FLNC #cryptotrading #BİNANCESQUARE
534

$FLNC SHORT
A pullback from the area of interest opens the way for a short position with clear risk control through a protective order. A well-chosen entry point sets the right tone for reaching the planned targets.
🔹Entry zone: 5.65
💰Target 1: 5.57357068 (+1.35%)
💰Target 2: 5.47714136 (+3.06%)
💰Target 3: 5.33249739 (+5.62%)
❌Stop-loss: 5.81464398 (-2.91%)
⚠️ This is not financial advice. Trade at your own risk. DYOR.
#FLNC #SPCXB #WLD 📈
$FLNC
$FLNC SHORT
A pullback from the area of interest opens the way for a short position with clear risk control through a protective order. A well-chosen entry point sets the right tone for reaching the planned targets.
🔹Entry zone: 5.65
💰Target 1: 5.57357068 (+1.35%)
💰Target 2: 5.47714136 (+3.06%)
💰Target 3: 5.33249739 (+5.62%)
❌Stop-loss: 5.81464398 (-2.91%)
⚠️ This is not financial advice. Trade at your own risk. DYOR.
#FLNC #SPCXB #WLD 📈
$FLNC
A pullback from the area of interest opens the way for a short position with clear risk control through a protective order. A well-chosen entry point sets the right tone for reaching the planned targets.
🔹Entry zone: 5.65
💰Target 1: 5.57357068 (+1.35%)
💰Target 2: 5.47714136 (+3.06%)
💰Target 3: 5.33249739 (+5.62%)
❌Stop-loss: 5.81464398 (-2.91%)
⚠️ This is not financial advice. Trade at your own risk. DYOR.
#FLNC #SPCXB #WLD 📈
$FLNC
10
$FLNC SHORT
A potential move downward is being considered as a scenario. Further movement could open up the next take-profit targets.
🔹Entry zone: 5.69
💰Target 1: 5.62322403 (+1.17%)
💰Target 2: 5.54644807 (+2.52%)
💰Target 3: 5.43128412 (+4.55%)
⛔️Stop: 5.81516395 (-2.20%)
⚠️ This is not financial advice. Trade at your own risk. DYOR.
#FLNC #Web3 #FuturesSignals 📈
$FLNC
$FLNC SHORT
A potential move downward is being considered as a scenario. Further movement could open up the next take-profit targets.
🔹Entry zone: 5.69
💰Target 1: 5.62322403 (+1.17%)
💰Target 2: 5.54644807 (+2.52%)
💰Target 3: 5.43128412 (+4.55%)
⛔️Stop: 5.81516395 (-2.20%)
⚠️ This is not financial advice. Trade at your own risk. DYOR.
#FLNC #Web3 #FuturesSignals 📈
$FLNC
A potential move downward is being considered as a scenario. Further movement could open up the next take-profit targets.
🔹Entry zone: 5.69
💰Target 1: 5.62322403 (+1.17%)
💰Target 2: 5.54644807 (+2.52%)
💰Target 3: 5.43128412 (+4.55%)
⛔️Stop: 5.81516395 (-2.20%)
⚠️ This is not financial advice. Trade at your own risk. DYOR.
#FLNC #Web3 #FuturesSignals 📈
$FLNC
35
·
--
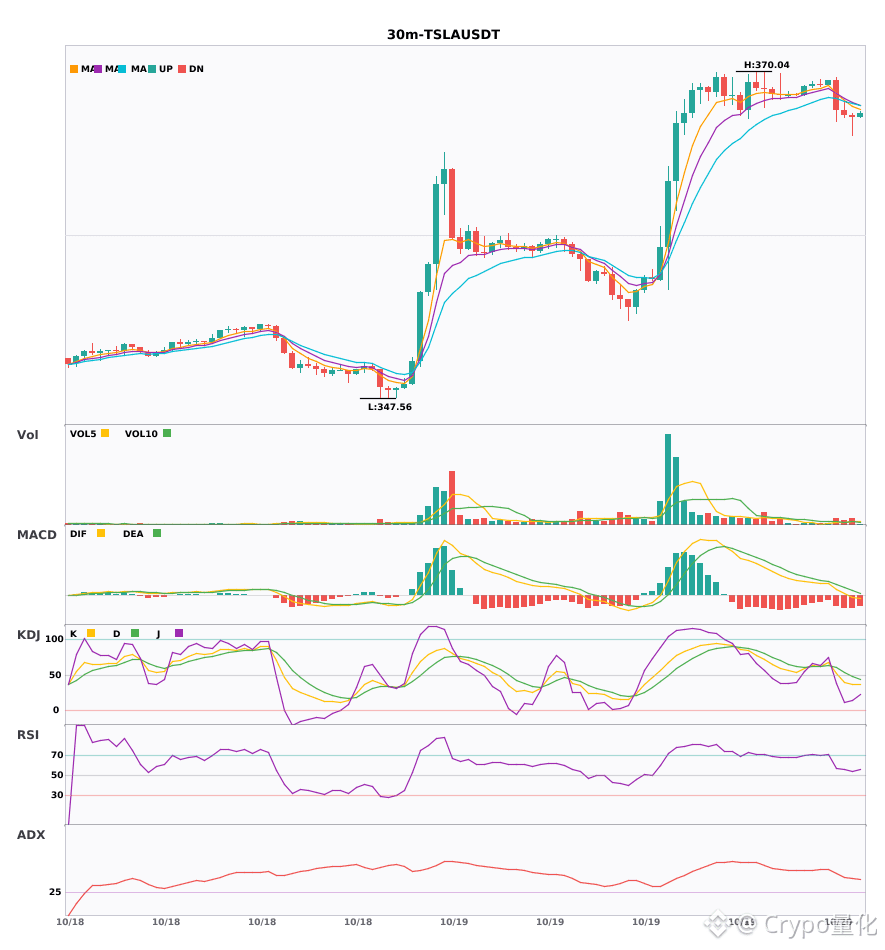
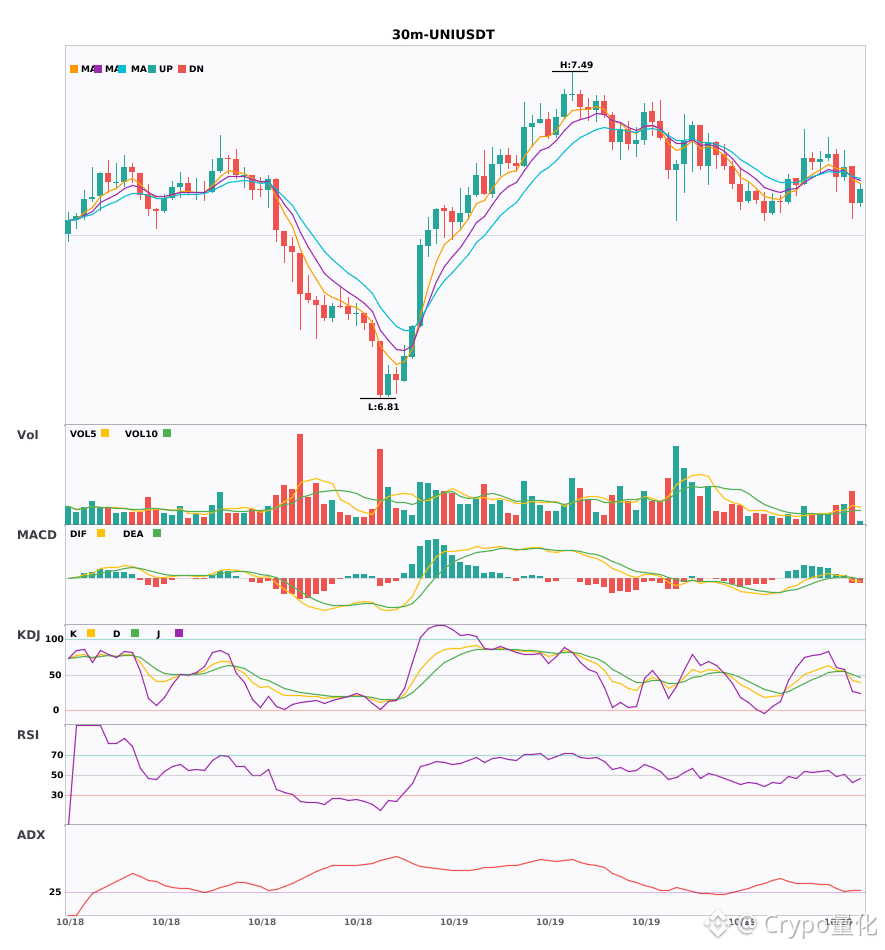
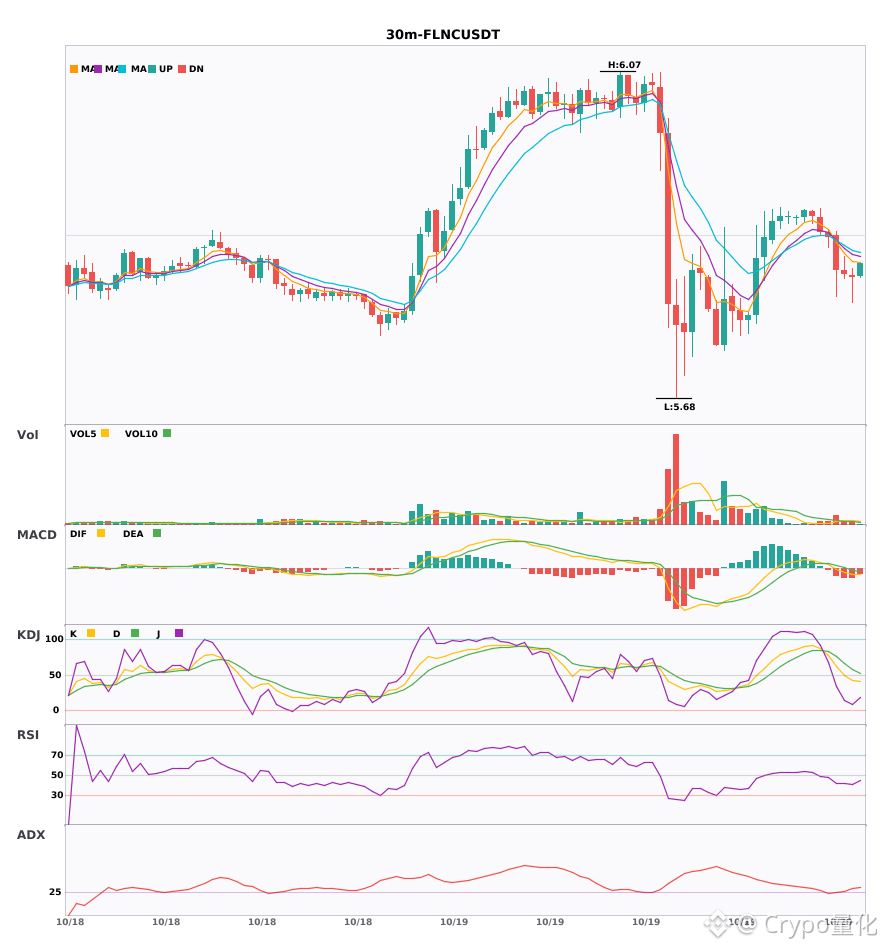
$TSLA / $UNI / $FLNC 30-minute signals converge to bearish, with bearish signals appearing at the same time 🔥
════════════════════
🟢 $TSLA 30-minute Bearish Signal
⚠️Technical Analysis: ADX(43): Clear trending market | MACD DIF falls below the zero line, indicating a bearish trend | Moving averages converge and momentum builds; a direction is about to be chosen | KDJ is trending weakly, with bears in control (K: 36.3, D: 47.4) | Trading volume increases (2.3x)
════════════════════
🟢 $UNI 30-minute Bearish Signal
⚠️Technical Analysis: ADX(29): A trend is forming; an opportunity to participate | MACD bearish crossover below zero; bearish momentum accelerates | EMA5 crosses below EMA8, turning bearish in the short term | KDJ bearish crossover; short-term outlook is bearish (K: 42.6, D: 50.8) | Trading volume increases (2.3x)
════════════════════
🟢 $FLNC 30-minute Bearish Signal
⚠️Technical Analysis: ADX(30): A trend is forming; an opportunity to participate | MACD is bearish; the trend is weak, with momentum strengthening | EMA5 < EMA8 < EMA13, in bearish alignment | Trading volume increases (1.9x)
════════════════════
🔔 Follow for real-time market moves 🔔
#技术分析 #TSLA #UNI #FLNC
📌 When trading, pay attention to whether the candlestick pattern confirms the signal
$TSLA / $UNI / $FLNC 30-minute signals converge to bearish, with bearish signals appearing at the same time 🔥
════════════════════
🟢 $TSLA 30-minute Bearish Signal
⚠️Technical Analysis: ADX(43): Clear trending market | MACD DIF falls below the zero line, indicating a bearish trend | Moving averages converge and momentum builds; a direction is about to be chosen | KDJ is trending weakly, with bears in control (K: 36.3, D: 47.4) | Trading volume increases (2.3x)
════════════════════
🟢 $UNI 30-minute Bearish Signal
⚠️Technical Analysis: ADX(29): A trend is forming; an opportunity to participate | MACD bearish crossover below zero; bearish momentum accelerates | EMA5 crosses below EMA8, turning bearish in the short term | KDJ bearish crossover; short-term outlook is bearish (K: 42.6, D: 50.8) | Trading volume increases (2.3x)
════════════════════
🟢 $FLNC 30-minute Bearish Signal
⚠️Technical Analysis: ADX(30): A trend is forming; an opportunity to participate | MACD is bearish; the trend is weak, with momentum strengthening | EMA5 < EMA8 < EMA13, in bearish alignment | Trading volume increases (1.9x)
════════════════════
🔔 Follow for real-time market moves 🔔
#技术分析 #TSLA #UNI #FLNC
📌 When trading, pay attention to whether the candlestick pattern confirms the signal
════════════════════
🟢 $TSLA 30-minute Bearish Signal
⚠️Technical Analysis: ADX(43): Clear trending market | MACD DIF falls below the zero line, indicating a bearish trend | Moving averages converge and momentum builds; a direction is about to be chosen | KDJ is trending weakly, with bears in control (K: 36.3, D: 47.4) | Trading volume increases (2.3x)
════════════════════
🟢 $UNI 30-minute Bearish Signal
⚠️Technical Analysis: ADX(29): A trend is forming; an opportunity to participate | MACD bearish crossover below zero; bearish momentum accelerates | EMA5 crosses below EMA8, turning bearish in the short term | KDJ bearish crossover; short-term outlook is bearish (K: 42.6, D: 50.8) | Trading volume increases (2.3x)
════════════════════
🟢 $FLNC 30-minute Bearish Signal
⚠️Technical Analysis: ADX(30): A trend is forming; an opportunity to participate | MACD is bearish; the trend is weak, with momentum strengthening | EMA5 < EMA8 < EMA13, in bearish alignment | Trading volume increases (1.9x)
════════════════════
🔔 Follow for real-time market moves 🔔
#技术分析 #TSLA #UNI #FLNC
📌 When trading, pay attention to whether the candlestick pattern confirms the signal
16
·
--
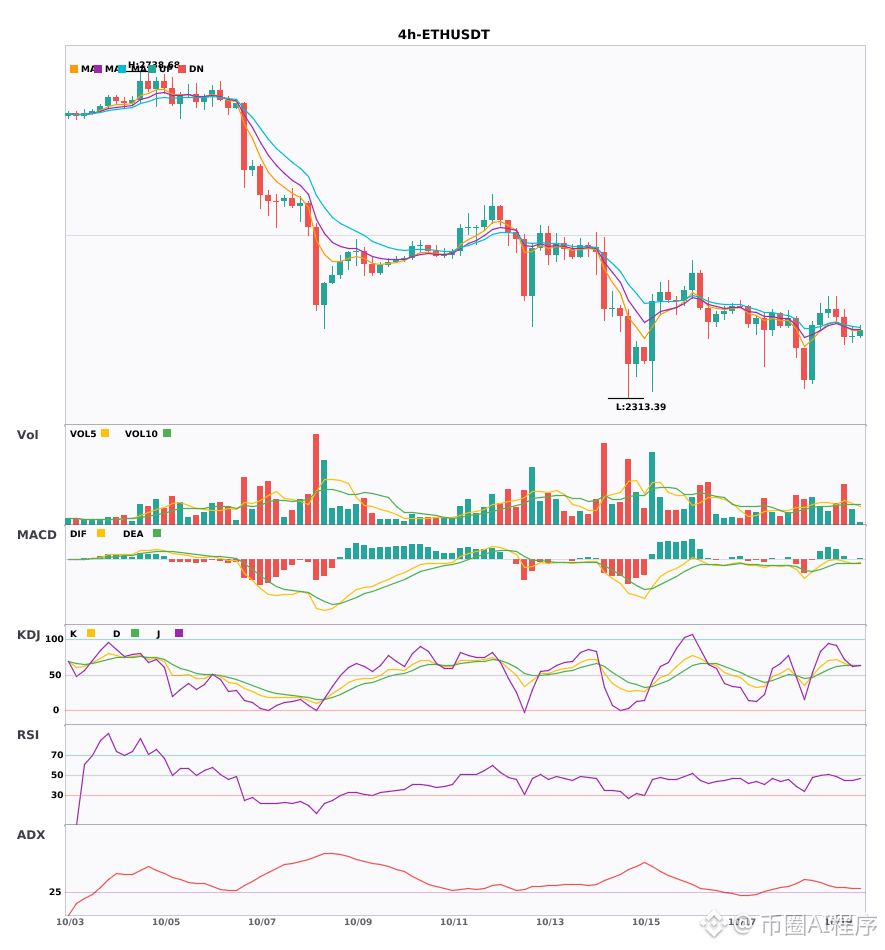
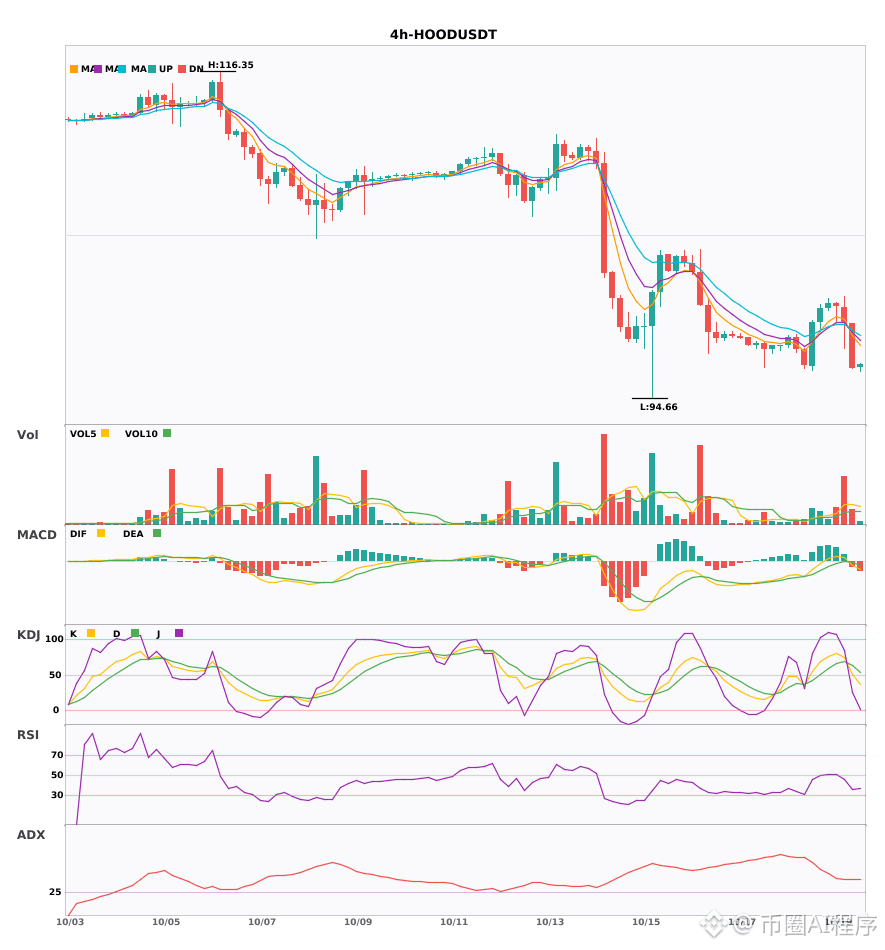
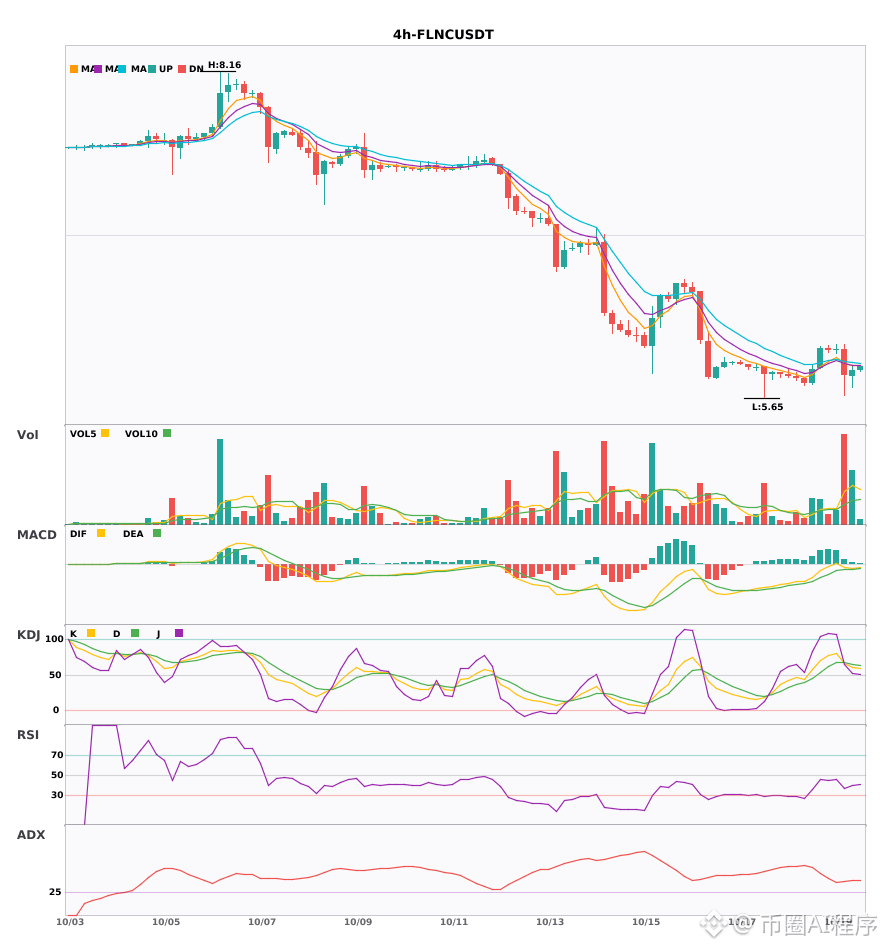
$ETH / $HOOD / $FLNC 4-hour bearish signals, daily bearish trend confirmed🔥
════════════════════
🟢 $ETH 4-hour bearish signal
⚠️Technical analysis: Daily bearish confluence confirmed | 4-hour entry: MACD bearish crossover below zero, bearish momentum accelerating | EMA5 < EMA8 < EMA13, bearish alignment | KDJ bearish crossover, short-term outlook bearish (K: 63.1, D: 63.6) | Volume increased (1.9x)
📢Market update: Wallet Maintenance for Ethereum Network (ETH) - 2026-10-15
════════════════════
🟢 $HOOD 4-hour bearish signal
⚠️Technical analysis: Daily bearish confluence confirmed | 4-hour entry: MACD bearish crossover below zero, bearish momentum accelerating | EMA5 crossed below EMA8, short-term outlook turning bearish | KDJ bearish crossover, short-term outlook bearish (K: 50.5, D: 62.9) | Volume surged (4.0x)
════════════════════
🟢 $FLNC 4-hour bearish signal
⚠️Technical analysis: Daily bearish confluence confirmed | 4-hour entry: EMA5 crossed below EMA8, short-term outlook turning bearish | KDJ showing strong momentum, bulls have the upper hand (K: 60.6, D: 65.1) | Volume surged (4.5x)
════════════════════
🔔 Follow for first-hand market updates 🔔
#多周期共振 #ETH #HOOD #FLNC
📌 When trading, pay attention to whether the candlestick pattern matches
$ETH / $HOOD / $FLNC 4-hour bearish signals, daily bearish trend confirmed🔥
════════════════════
🟢 $ETH 4-hour bearish signal
⚠️Technical analysis: Daily bearish confluence confirmed | 4-hour entry: MACD bearish crossover below zero, bearish momentum accelerating | EMA5 < EMA8 < EMA13, bearish alignment | KDJ bearish crossover, short-term outlook bearish (K: 63.1, D: 63.6) | Volume increased (1.9x)
📢Market update: Wallet Maintenance for Ethereum Network (ETH) - 2026-10-15
════════════════════
🟢 $HOOD 4-hour bearish signal
⚠️Technical analysis: Daily bearish confluence confirmed | 4-hour entry: MACD bearish crossover below zero, bearish momentum accelerating | EMA5 crossed below EMA8, short-term outlook turning bearish | KDJ bearish crossover, short-term outlook bearish (K: 50.5, D: 62.9) | Volume surged (4.0x)
════════════════════
🟢 $FLNC 4-hour bearish signal
⚠️Technical analysis: Daily bearish confluence confirmed | 4-hour entry: EMA5 crossed below EMA8, short-term outlook turning bearish | KDJ showing strong momentum, bulls have the upper hand (K: 60.6, D: 65.1) | Volume surged (4.5x)
════════════════════
🔔 Follow for first-hand market updates 🔔
#多周期共振 #ETH #HOOD #FLNC
📌 When trading, pay attention to whether the candlestick pattern matches
════════════════════
🟢 $ETH 4-hour bearish signal
⚠️Technical analysis: Daily bearish confluence confirmed | 4-hour entry: MACD bearish crossover below zero, bearish momentum accelerating | EMA5 < EMA8 < EMA13, bearish alignment | KDJ bearish crossover, short-term outlook bearish (K: 63.1, D: 63.6) | Volume increased (1.9x)
📢Market update: Wallet Maintenance for Ethereum Network (ETH) - 2026-10-15
════════════════════
🟢 $HOOD 4-hour bearish signal
⚠️Technical analysis: Daily bearish confluence confirmed | 4-hour entry: MACD bearish crossover below zero, bearish momentum accelerating | EMA5 crossed below EMA8, short-term outlook turning bearish | KDJ bearish crossover, short-term outlook bearish (K: 50.5, D: 62.9) | Volume surged (4.0x)
════════════════════
🟢 $FLNC 4-hour bearish signal
⚠️Technical analysis: Daily bearish confluence confirmed | 4-hour entry: EMA5 crossed below EMA8, short-term outlook turning bearish | KDJ showing strong momentum, bulls have the upper hand (K: 60.6, D: 65.1) | Volume surged (4.5x)
════════════════════
🔔 Follow for first-hand market updates 🔔
#多周期共振 #ETH #HOOD #FLNC
📌 When trading, pay attention to whether the candlestick pattern matches
6
·
--
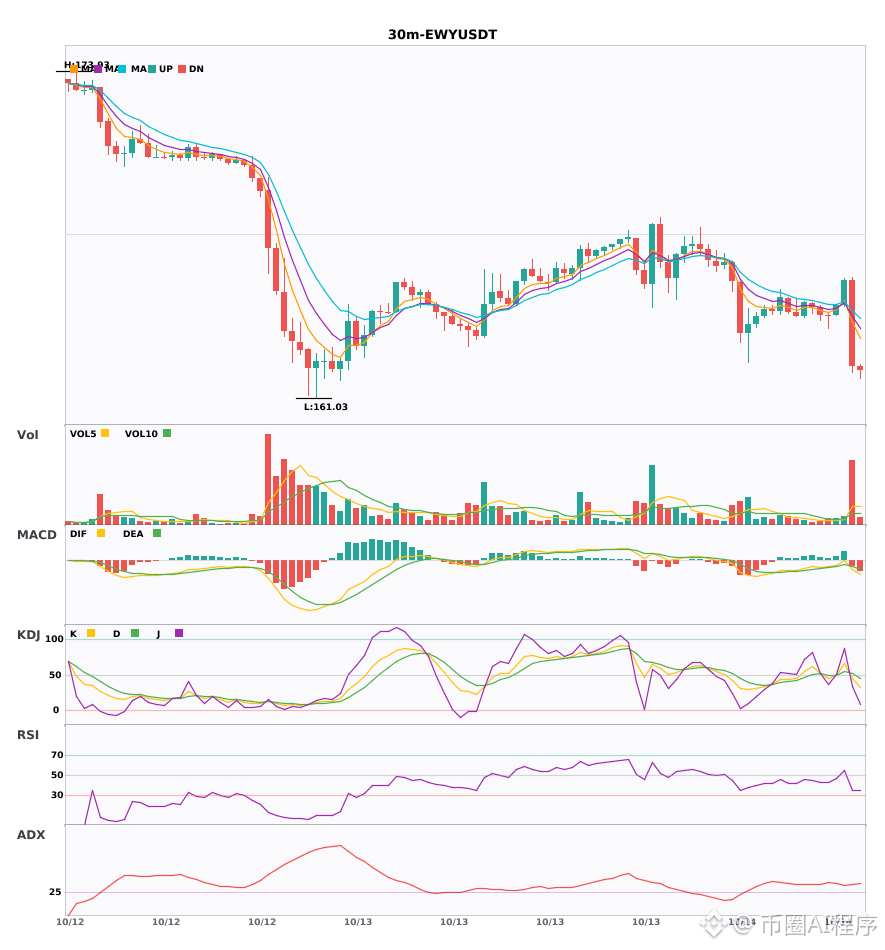
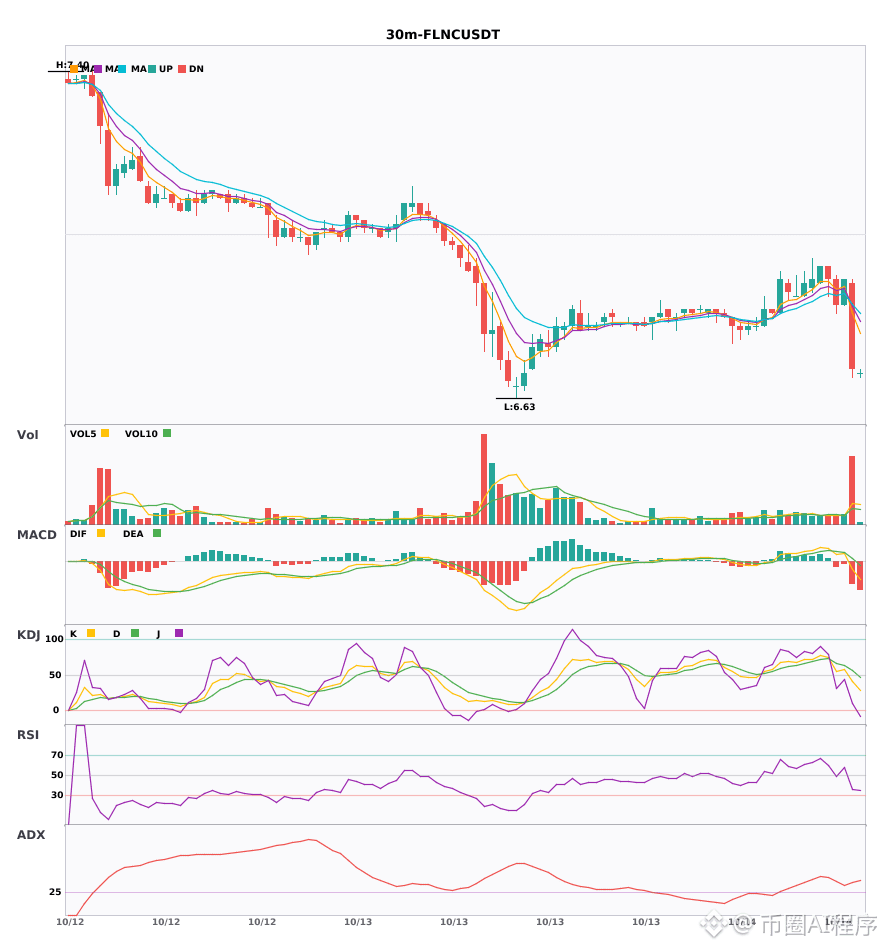
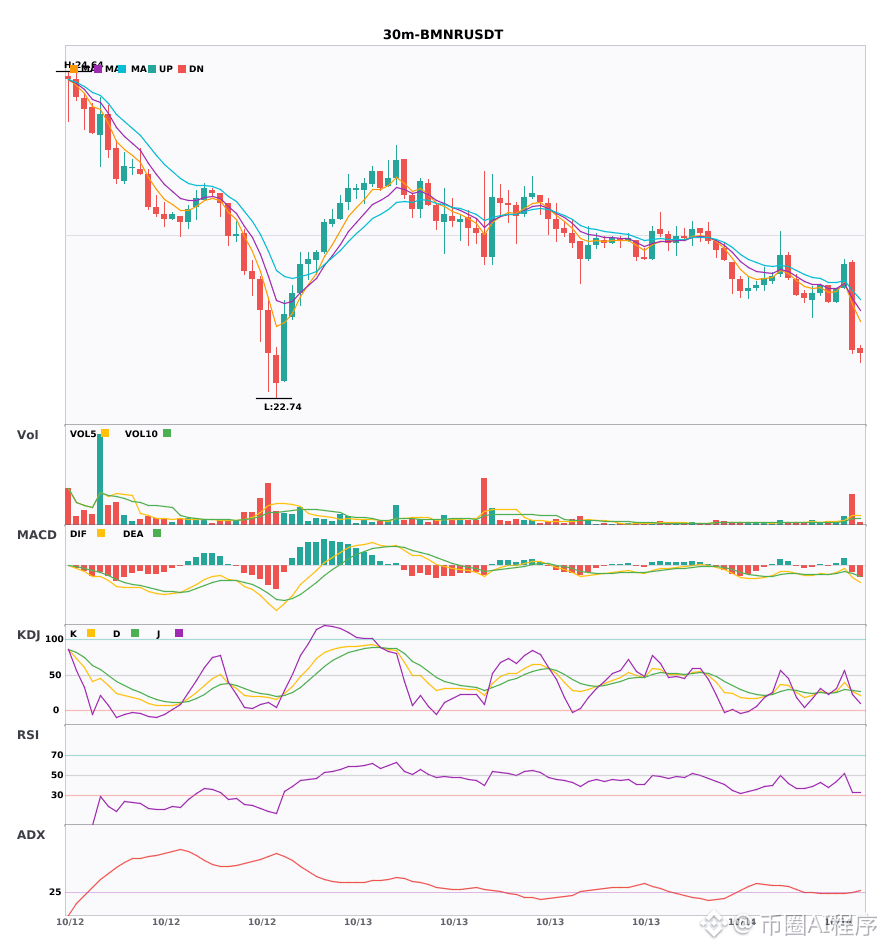
$EWY / $FLNC / $BMNR 30-minute bearish signals, 4-hour bearish trend confirmed 🔥
════════════════════
🟢 $EWY 30-minute bearish signal
⚠️ Technicals: 4-hour bearish confluence confirmed | 30-minute entry: MACD bearish crossover below zero, bearish momentum accelerating | EMA5 crossed below EMA8, short-term trend turned bearish | KDJ bearish crossover, short-term outlook bearish (K: 45.6, D: 51.8) | Volume surge (5.4x)
════════════════════
🟢 $FLNC 30-minute bearish signal
⚠️ Technicals: 4-hour bearish confluence confirmed | 30-minute entry: MACD DIF fell below the zero line, trend turned bearish | EMA5 crossed below EMA8, short-term trend turned bearish | Volume surge (4.3x)
════════════════════
🟢 $BMNR 30-minute bearish signal
⚠️ Technicals: 4-hour bearish confluence confirmed | 30-minute entry: MACD bearish crossover below zero, bearish momentum accelerating | EMA5 crossed below EMA8, short-term trend turned bearish | KDJ bearish crossover, short-term outlook bearish (K: 27.1, D: 29.0) | Volume surge (4.7x)
════════════════════
🔔 Follow us for the latest market movements 🔔
#多周期共振 #EWY #FLNC #BMNR
📌 When trading, pay attention to whether the candlestick pattern aligns
$EWY / $FLNC / $BMNR 30-minute bearish signals, 4-hour bearish trend confirmed 🔥
════════════════════
🟢 $EWY 30-minute bearish signal
⚠️ Technicals: 4-hour bearish confluence confirmed | 30-minute entry: MACD bearish crossover below zero, bearish momentum accelerating | EMA5 crossed below EMA8, short-term trend turned bearish | KDJ bearish crossover, short-term outlook bearish (K: 45.6, D: 51.8) | Volume surge (5.4x)
════════════════════
🟢 $FLNC 30-minute bearish signal
⚠️ Technicals: 4-hour bearish confluence confirmed | 30-minute entry: MACD DIF fell below the zero line, trend turned bearish | EMA5 crossed below EMA8, short-term trend turned bearish | Volume surge (4.3x)
════════════════════
🟢 $BMNR 30-minute bearish signal
⚠️ Technicals: 4-hour bearish confluence confirmed | 30-minute entry: MACD bearish crossover below zero, bearish momentum accelerating | EMA5 crossed below EMA8, short-term trend turned bearish | KDJ bearish crossover, short-term outlook bearish (K: 27.1, D: 29.0) | Volume surge (4.7x)
════════════════════
🔔 Follow us for the latest market movements 🔔
#多周期共振 #EWY #FLNC #BMNR
📌 When trading, pay attention to whether the candlestick pattern aligns
════════════════════
🟢 $EWY 30-minute bearish signal
⚠️ Technicals: 4-hour bearish confluence confirmed | 30-minute entry: MACD bearish crossover below zero, bearish momentum accelerating | EMA5 crossed below EMA8, short-term trend turned bearish | KDJ bearish crossover, short-term outlook bearish (K: 45.6, D: 51.8) | Volume surge (5.4x)
════════════════════
🟢 $FLNC 30-minute bearish signal
⚠️ Technicals: 4-hour bearish confluence confirmed | 30-minute entry: MACD DIF fell below the zero line, trend turned bearish | EMA5 crossed below EMA8, short-term trend turned bearish | Volume surge (4.3x)
════════════════════
🟢 $BMNR 30-minute bearish signal
⚠️ Technicals: 4-hour bearish confluence confirmed | 30-minute entry: MACD bearish crossover below zero, bearish momentum accelerating | EMA5 crossed below EMA8, short-term trend turned bearish | KDJ bearish crossover, short-term outlook bearish (K: 27.1, D: 29.0) | Volume surge (4.7x)
════════════════════
🔔 Follow us for the latest market movements 🔔
#多周期共振 #EWY #FLNC #BMNR
📌 When trading, pay attention to whether the candlestick pattern aligns
35
·
--
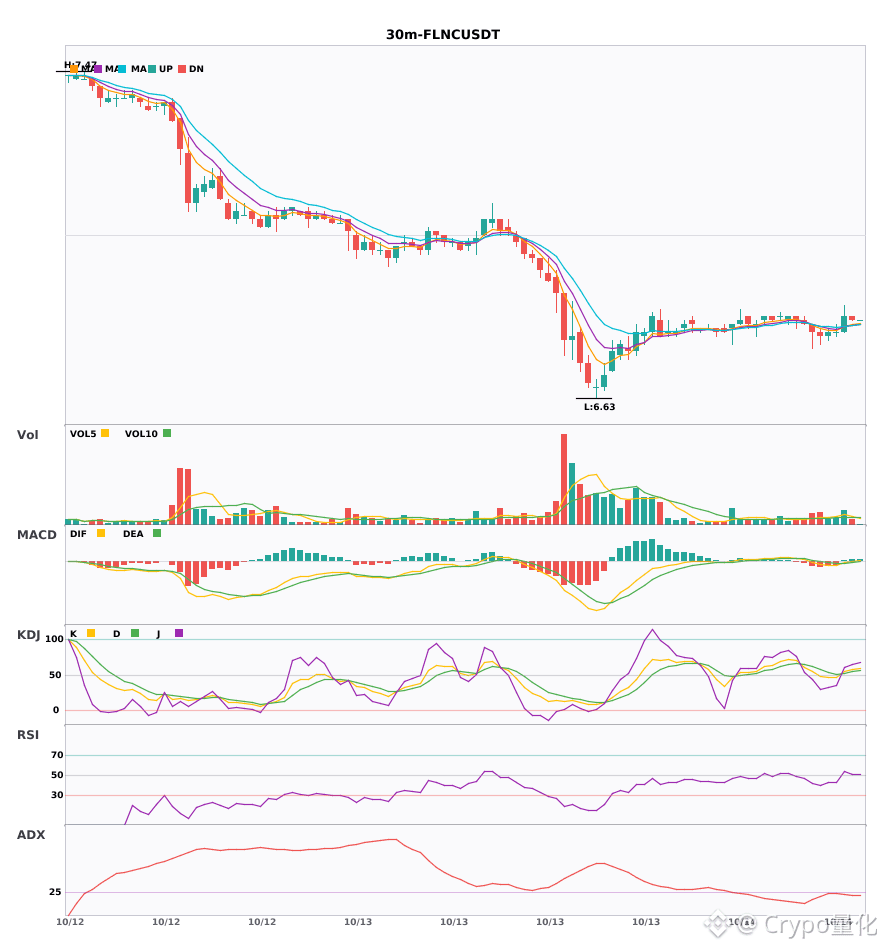
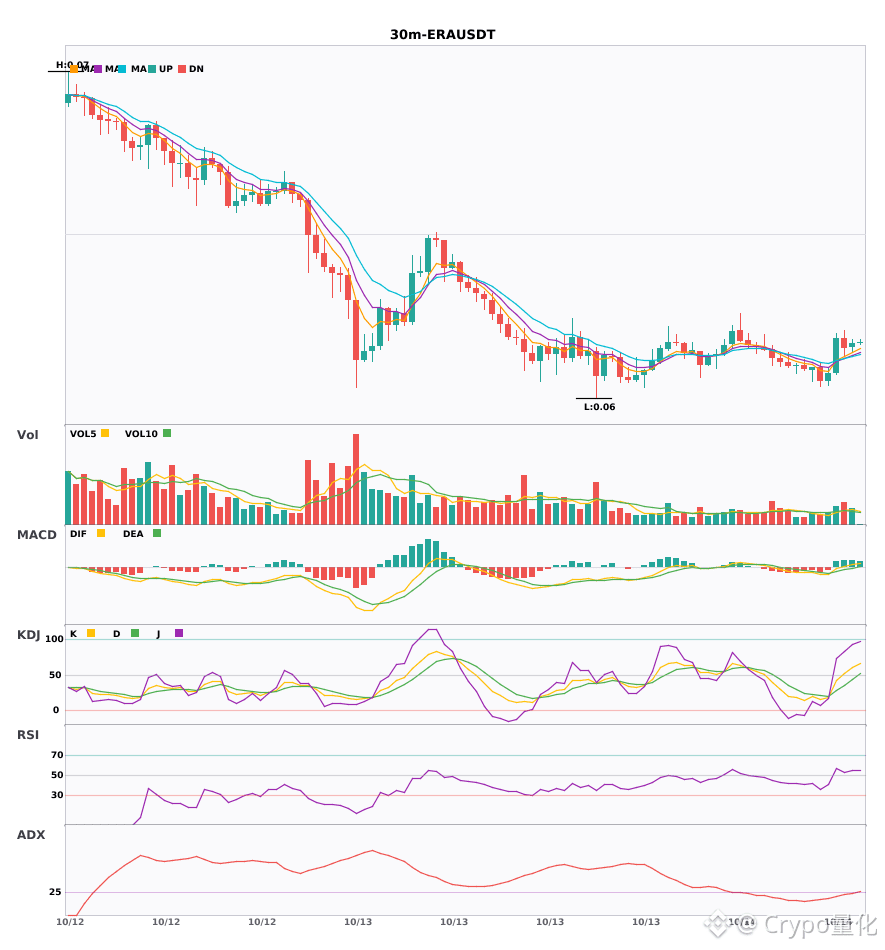
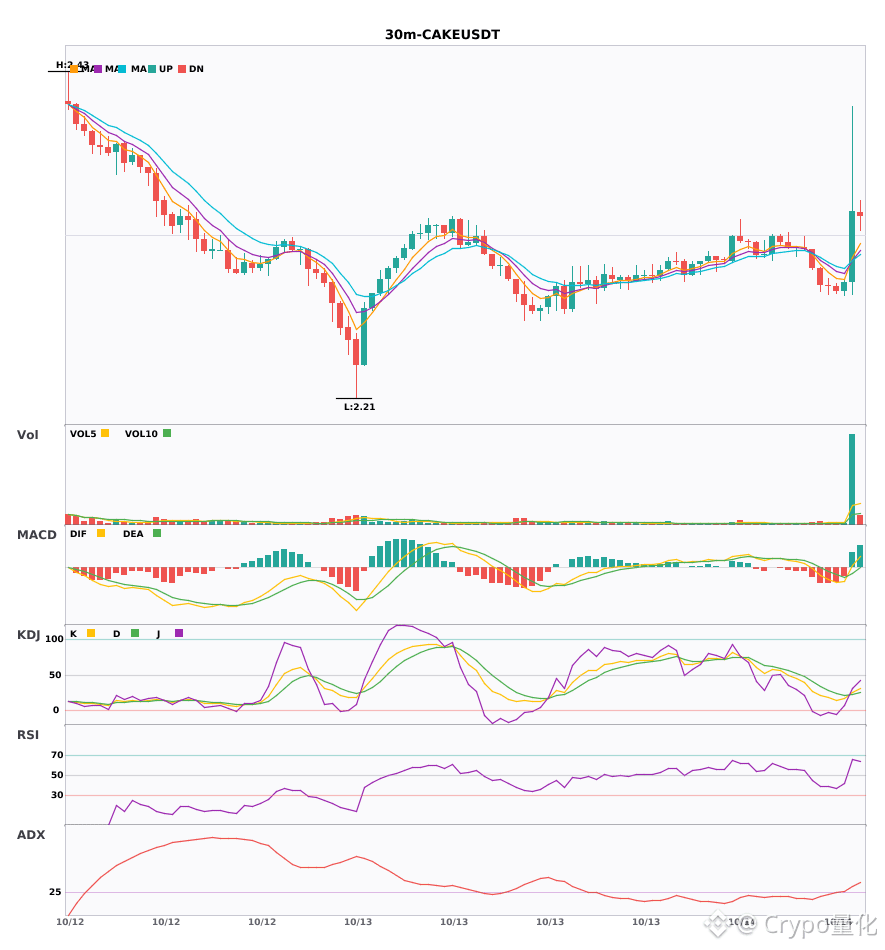
30 minutes: $FLNC $ERA $CAKE moving averages have just formed a bullish alignment—which one is stronger? 🔥
════════════════════
🔴 $FLNC 30-minute bullish signal
⚠️ Technicals: The ADX trend is just starting to pick up. MACD red bars are growing, with DIF above the zero line. Moving averages are in bullish alignment. K is above D but not overbought. Volume is up 1.9x—may be worth considering.
════════════════════
🔴 $ERA 30-minute bullish signal
⚠️ Technicals: The ADX trend is just getting started; may be worth considering. MACD has formed a golden cross and broken above the zero line, turning bullish. Moving averages have just formed a bullish alignment and are spreading upward. Volume is up 1.6x.
📢 Market update: Applied Materials has opened its $5 billion EPIC Center to accelerate chip R&D in the AI era. Its collaborative model could drive chip innovation and help partners gain an early edge in the AI market.
════════════════════
🔴 $CAKE 30-minute bullish signal
⚠️ Technicals: ADX is at 35, indicating a strong trend. MACD has formed a golden cross, with rising volume and growing red bars. Moving averages are in bullish alignment. K has crossed above D and is not overbought. Volume has surged 8.5x; the short-term outlook is bullish.
════════════════════
🔔 Follow for real-time market movements 🔔
#技术分析 #FLNC #ERA #CAKE
📌 When trading, pay attention to whether the candlestick pattern confirms the signal
30 minutes: $FLNC $ERA $CAKE moving averages have just formed a bullish alignment—which one is stronger? 🔥
════════════════════
🔴 $FLNC 30-minute bullish signal
⚠️ Technicals: The ADX trend is just starting to pick up. MACD red bars are growing, with DIF above the zero line. Moving averages are in bullish alignment. K is above D but not overbought. Volume is up 1.9x—may be worth considering.
════════════════════
🔴 $ERA 30-minute bullish signal
⚠️ Technicals: The ADX trend is just getting started; may be worth considering. MACD has formed a golden cross and broken above the zero line, turning bullish. Moving averages have just formed a bullish alignment and are spreading upward. Volume is up 1.6x.
📢 Market update: Applied Materials has opened its $5 billion EPIC Center to accelerate chip R&D in the AI era. Its collaborative model could drive chip innovation and help partners gain an early edge in the AI market.
════════════════════
🔴 $CAKE 30-minute bullish signal
⚠️ Technicals: ADX is at 35, indicating a strong trend. MACD has formed a golden cross, with rising volume and growing red bars. Moving averages are in bullish alignment. K has crossed above D and is not overbought. Volume has surged 8.5x; the short-term outlook is bullish.
════════════════════
🔔 Follow for real-time market movements 🔔
#技术分析 #FLNC #ERA #CAKE
📌 When trading, pay attention to whether the candlestick pattern confirms the signal
════════════════════
🔴 $FLNC 30-minute bullish signal
⚠️ Technicals: The ADX trend is just starting to pick up. MACD red bars are growing, with DIF above the zero line. Moving averages are in bullish alignment. K is above D but not overbought. Volume is up 1.9x—may be worth considering.
════════════════════
🔴 $ERA 30-minute bullish signal
⚠️ Technicals: The ADX trend is just getting started; may be worth considering. MACD has formed a golden cross and broken above the zero line, turning bullish. Moving averages have just formed a bullish alignment and are spreading upward. Volume is up 1.6x.
📢 Market update: Applied Materials has opened its $5 billion EPIC Center to accelerate chip R&D in the AI era. Its collaborative model could drive chip innovation and help partners gain an early edge in the AI market.
════════════════════
🔴 $CAKE 30-minute bullish signal
⚠️ Technicals: ADX is at 35, indicating a strong trend. MACD has formed a golden cross, with rising volume and growing red bars. Moving averages are in bullish alignment. K has crossed above D and is not overbought. Volume has surged 8.5x; the short-term outlook is bullish.
════════════════════
🔔 Follow for real-time market movements 🔔
#技术分析 #FLNC #ERA #CAKE
📌 When trading, pay attention to whether the candlestick pattern confirms the signal
30

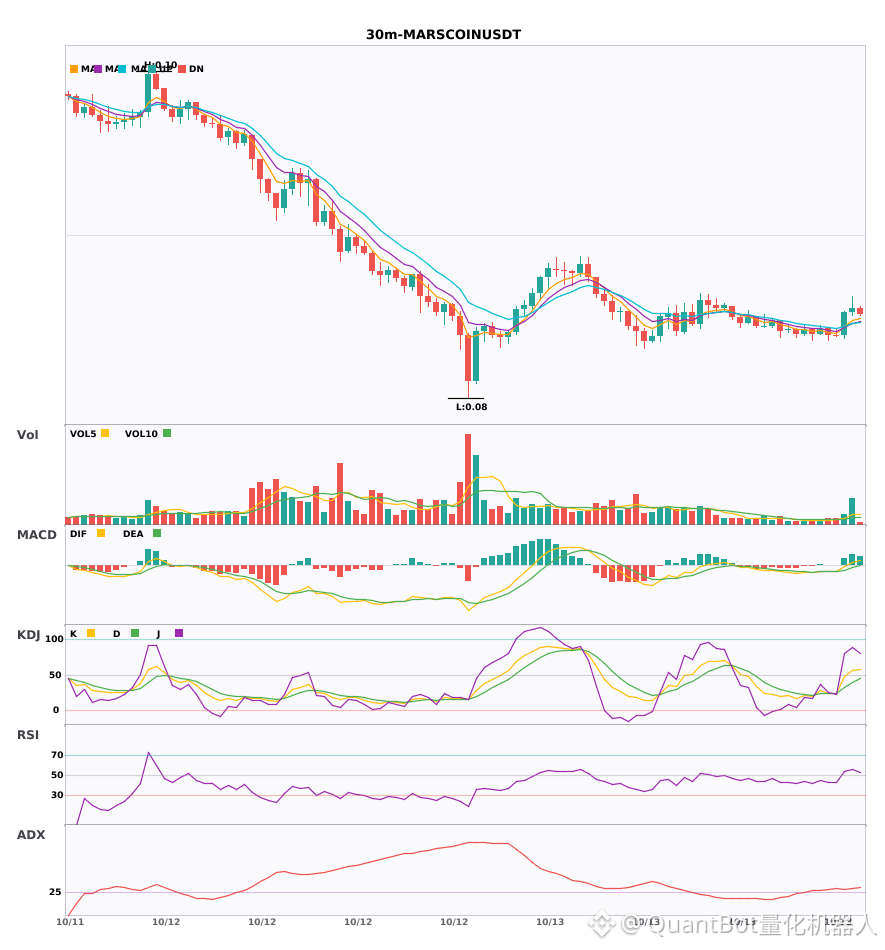
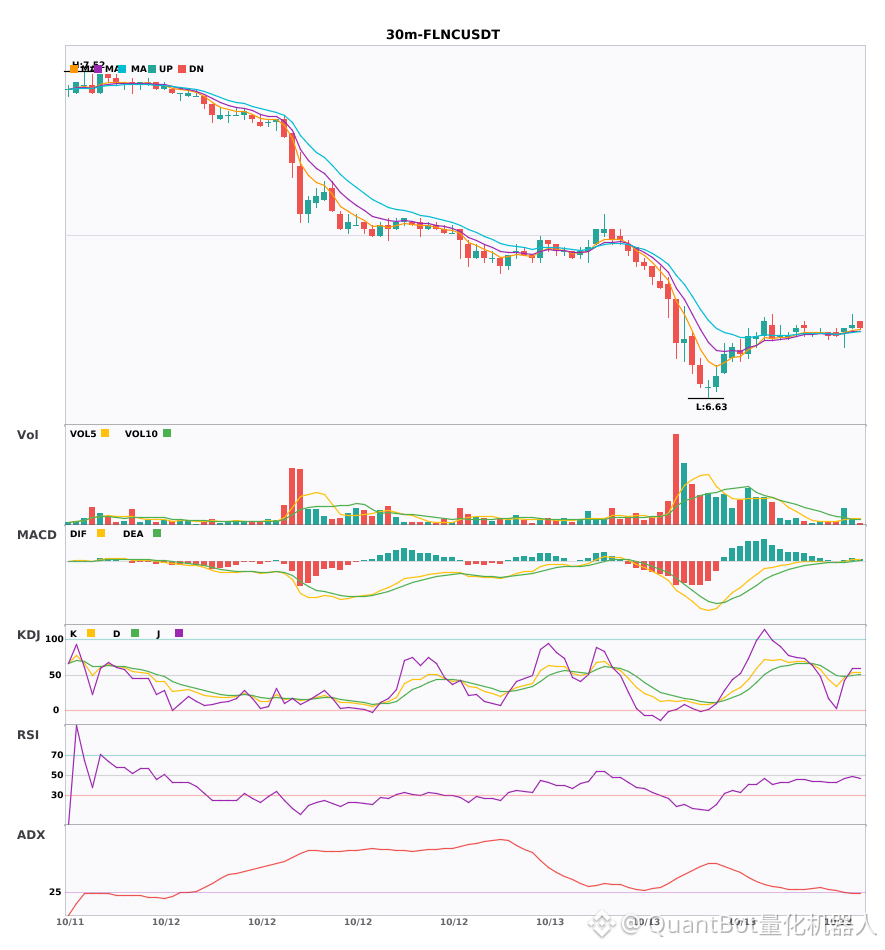
30-minute bullish signal confluence: $MARSCOIN/$Q/$FLNC
📈 $MARSCOIN | 30-minute bullish signal
━━━━━━━━━━━━━━━━━━
Technical analysis: ADX at 33 indicates a strong trend; MACD DIF crosses above zero, turning bullish; EMA5>EMA8>EMA13 in a bullish alignment; trading volume surges 3.4x.
Price change: 0.3800%
📈 $Q | 30-minute bullish signal
━━━━━━━━━━━━━━━━━━
Technical analysis: ADX(64) indicates extremely strong trend momentum; beware of an overbought pullback | MACD golden cross above zero, releasing bullish momentum | EMA5>EMA8>EMA13 in a bullish alignment | Trading volume expands 2.7x
Price change: 0.8600%
📈 $FLNC | 30-minute bullish signal
━━━━━━━━━━━━━━━━━━
Technical analysis: ADX(27) confirms the trend; entry may be considered; MACD is bullish, with strengthening momentum; EMA5>8>13 in a bullish alignment; KDJ golden cross (K53.1/D49.9), favoring bulls; trading volume expands 2.3x.
Price change: 0.1500%
━━━━━━━━━━━━━━━━━━
#技术分析 #MARSCOIN #Q #FLNC
📌 The above is for reference only and does not constitute investment advice
30-minute bullish signal confluence: $MARSCOIN /$Q /$FLNC
📈 $MARSCOIN | 30-minute bullish signal
━━━━━━━━━━━━━━━━━━
Technical analysis: ADX at 33 indicates a strong trend; MACD DIF crosses above zero, turning bullish; EMA5>EMA8>EMA13 in a bullish alignment; trading volume surges 3.4x.
Price change: 0.3800%
📈 $Q | 30-minute bullish signal
━━━━━━━━━━━━━━━━━━
Technical analysis: ADX(64) indicates extremely strong trend momentum; beware of an overbought pullback | MACD golden cross above zero, releasing bullish momentum | EMA5>EMA8>EMA13 in a bullish alignment | Trading volume expands 2.7x
Price change: 0.8600%
📈 $FLNC | 30-minute bullish signal
━━━━━━━━━━━━━━━━━━
Technical analysis: ADX(27) confirms the trend; entry may be considered; MACD is bullish, with strengthening momentum; EMA5>8>13 in a bullish alignment; KDJ golden cross (K53.1/D49.9), favoring bulls; trading volume expands 2.3x.
Price change: 0.1500%
━━━━━━━━━━━━━━━━━━
#技术分析 #MARSCOIN #Q #FLNC
📌 The above is for reference only and does not constitute investment advice
📈 $MARSCOIN | 30-minute bullish signal
━━━━━━━━━━━━━━━━━━
Technical analysis: ADX at 33 indicates a strong trend; MACD DIF crosses above zero, turning bullish; EMA5>EMA8>EMA13 in a bullish alignment; trading volume surges 3.4x.
Price change: 0.3800%
📈 $Q | 30-minute bullish signal
━━━━━━━━━━━━━━━━━━
Technical analysis: ADX(64) indicates extremely strong trend momentum; beware of an overbought pullback | MACD golden cross above zero, releasing bullish momentum | EMA5>EMA8>EMA13 in a bullish alignment | Trading volume expands 2.7x
Price change: 0.8600%
📈 $FLNC | 30-minute bullish signal
━━━━━━━━━━━━━━━━━━
Technical analysis: ADX(27) confirms the trend; entry may be considered; MACD is bullish, with strengthening momentum; EMA5>8>13 in a bullish alignment; KDJ golden cross (K53.1/D49.9), favoring bulls; trading volume expands 2.3x.
Price change: 0.1500%
━━━━━━━━━━━━━━━━━━
#技术分析 #MARSCOIN #Q #FLNC
📌 The above is for reference only and does not constitute investment advice
43
Log in to explore more content
Join global crypto users on Binance Square
⚡️ Get latest and useful information about crypto.
💬 Trusted by the world’s largest crypto exchange.
👍 Discover real insights from verified creators.
Email / Phone number
Trending Topics
1
#BinanceReopensWithdrawalsForHYPE&APT
67,329 views
871 Discussing
2
#SouthKoreaDraftLawTargets15To20%ShareholderCap
68,288 views
575 Discussing
3
#TradFiForBeginners
169,594 views
1,770 Discussing
4
#KeplrAdvisesSocialLoginUsersToTransferAssets
39,328 views
471 Discussing
5
#TetherPlans€28.8MForJuventusCapitalIncrease
25,806 views
363 Discussing
6
#JobsReportRaisesHikeOdds
826,570 views
4,386 Discussing
7
#CPITestsDecemberRateOutlook
329,629 views
1,853 Discussing
8
#US Data Center Rules May Constrain AI Expansion
123,926 views
258 Discussing
9
#ARKPlans14ThematicETFsCoveringAIAndTokenizedMarkets
8,755 views
88 Discussing
10
#WillAnthropicListOnTime
262,670 views
1,865 Discussing