
#ewy
ewy
107,840 views
1,325 Discussing
Hot
Latest

·
--
👀 $EWY is leaning on the breakdown line
SHORT · 15M
Entry: $138.04 - $138.45
TP1: $136.38
TP2: $135.39
TP3: $134.4
SL: $139.7
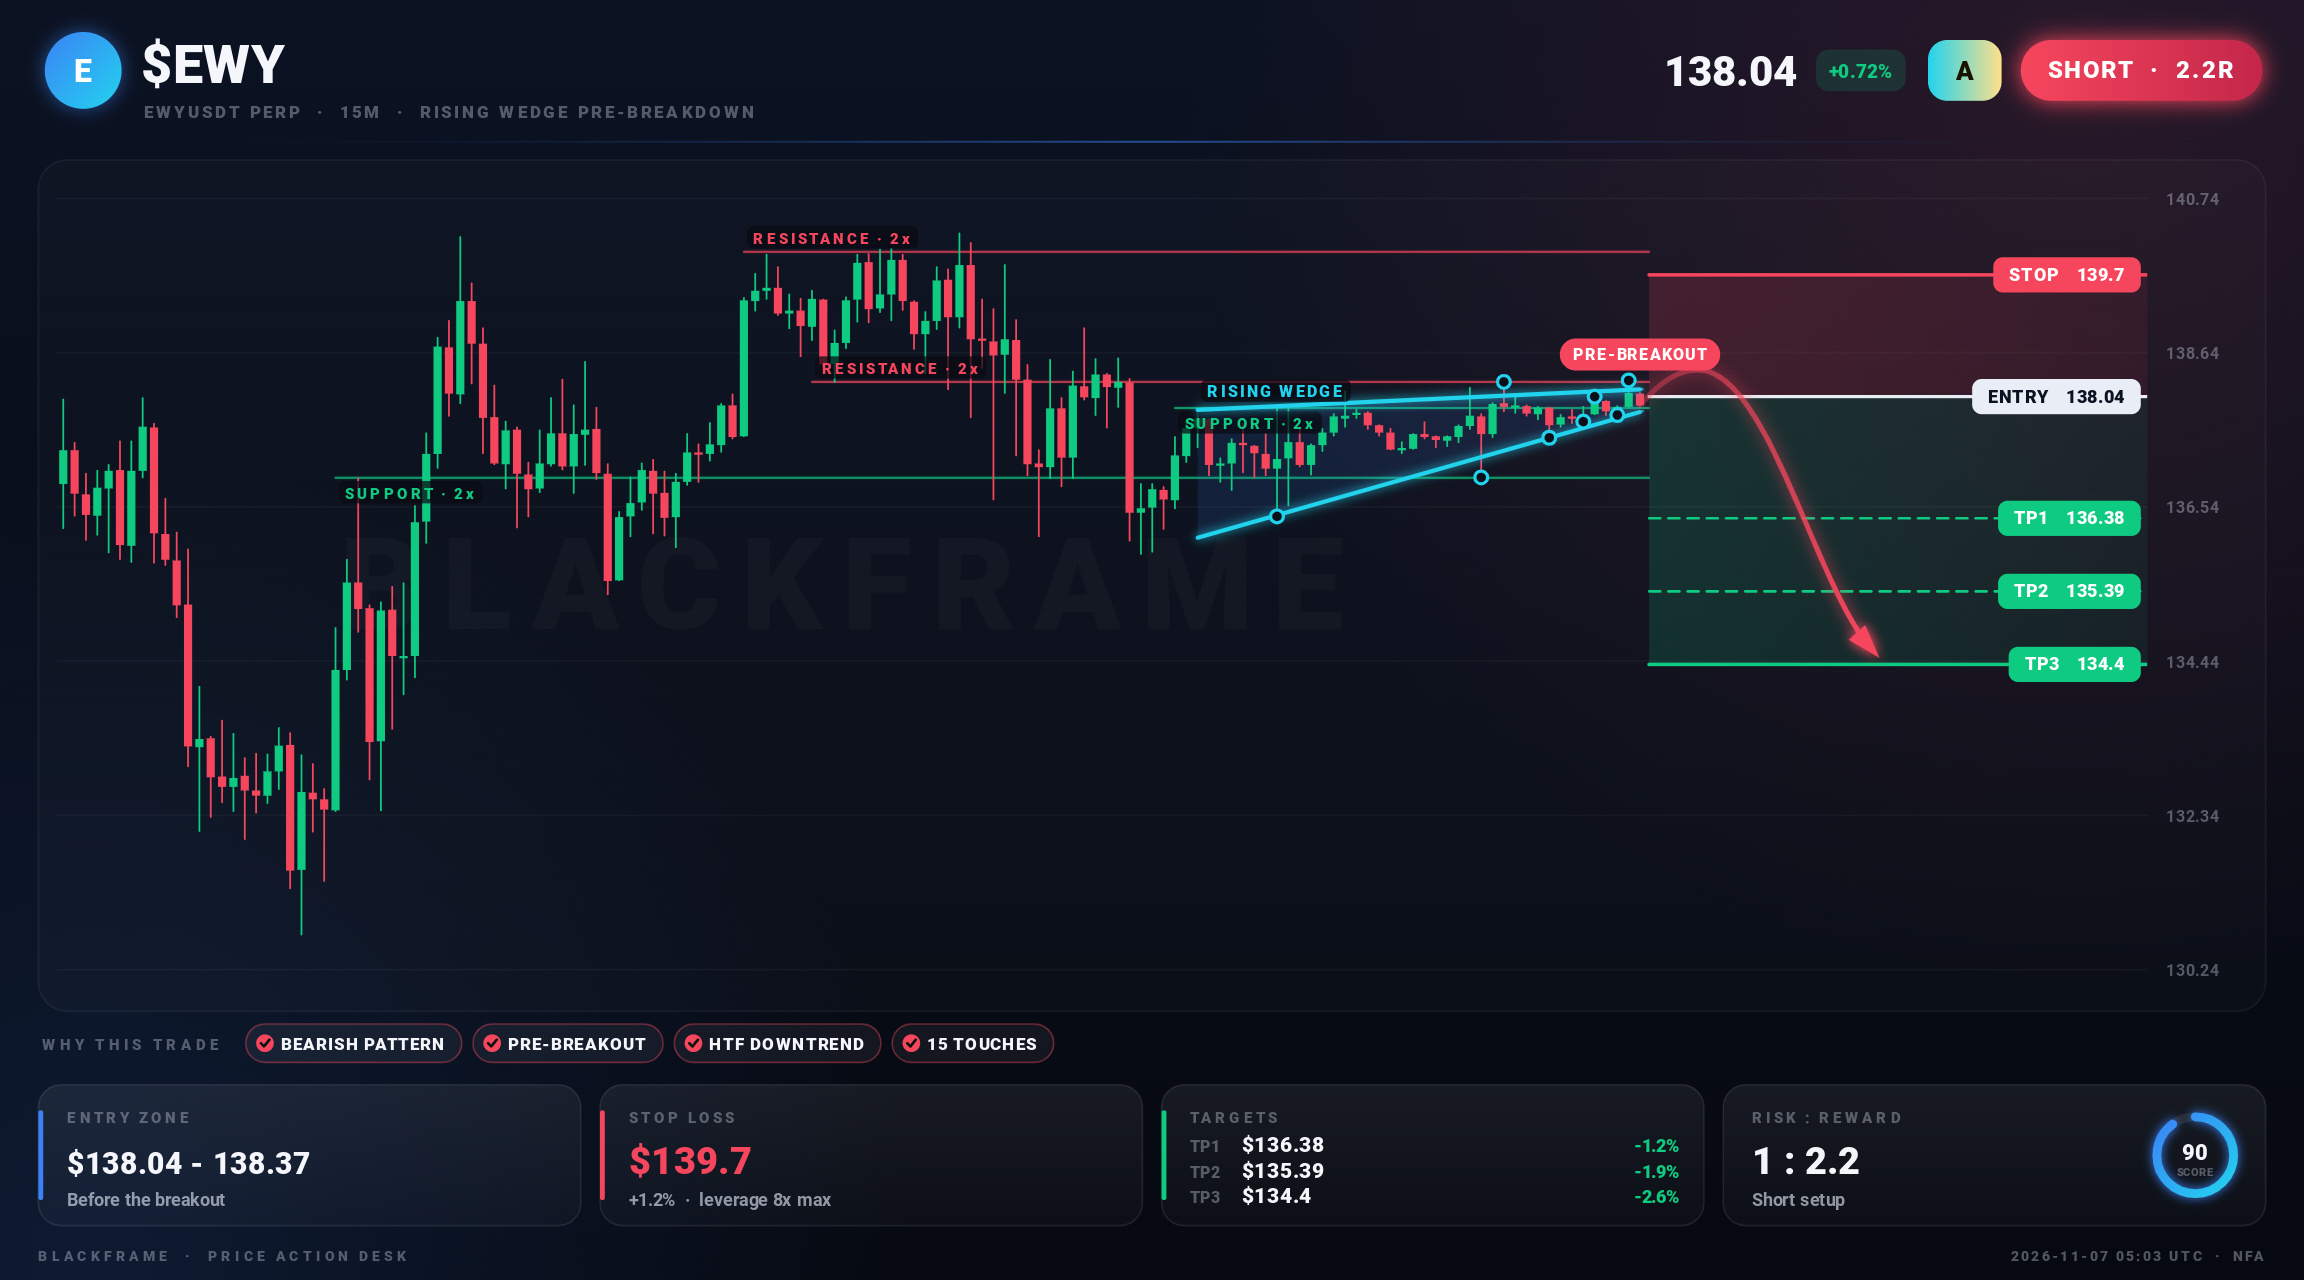
A rising wedge has formed on the 15M, tested 15 times on its lines. Price is pressing the lower line, so the entry is taken before the breakdown. The higher timeframe trend agrees, and the target is the measured move of the pattern.
#EWY #Crypto #CryptoTrading · NFA
👀 $EWY is leaning on the breakdown line
SHORT · 15M
Entry: $138.04 - $138.45
TP1: $136.38
TP2: $135.39
TP3: $134.4
SL: $139.7
A rising wedge has formed on the 15M, tested 15 times on its lines. Price is pressing the lower line, so the entry is taken before the breakdown. The higher timeframe trend agrees, and the target is the measured move of the pattern.
#EWY #Crypto #CryptoTrading · NFA
SHORT · 15M
Entry: $138.04 - $138.45
TP1: $136.38
TP2: $135.39
TP3: $134.4
SL: $139.7
A rising wedge has formed on the 15M, tested 15 times on its lines. Price is pressing the lower line, so the entry is taken before the breakdown. The higher timeframe trend agrees, and the target is the measured move of the pattern.
#EWY #Crypto #CryptoTrading · NFA
3

·
--
🚨 $EWY BUYERS FLATTENED AT RESISTANCE AS BEARS PREPARE TO SWEEP LIQUIDITY TOWARD 163! 🔻
Entry: 175.23 - 178.77 ⚡
Target: 173 / 168 / 163 🎯
Stop Loss: 191 ⚠️
📌 Bulls just slammed into a major supply wall with complete momentum failure as distribution begins to accelerate. 📊 Order flow reveals buyers lack the firepower to hold this level, making this heavy rejection a pristine short setup for a swift drop into lower liquidity pools.
💡 As long as overhead structure at 191 remains unbroken, downside momentum favors a clean roll through intermediate targets down to 163. 💬 Are you riding this rejection lower with the bears or standing on the sidelines? 👇
⚠️ Not financial advice. Always manage your risk. 🛡️
🏷️ #EWY #ShortSetup #Breakdown #CryptoTrading #MarketAnalysis
🐻 🩸
🚨 $EWY BUYERS FLATTENED AT RESISTANCE AS BEARS PREPARE TO SWEEP LIQUIDITY TOWARD 163! 🔻
Entry: 175.23 - 178.77 ⚡
Target: 173 / 168 / 163 🎯
Stop Loss: 191 ⚠️
📌 Bulls just slammed into a major supply wall with complete momentum failure as distribution begins to accelerate. 📊 Order flow reveals buyers lack the firepower to hold this level, making this heavy rejection a pristine short setup for a swift drop into lower liquidity pools.
💡 As long as overhead structure at 191 remains unbroken, downside momentum favors a clean roll through intermediate targets down to 163. 💬 Are you riding this rejection lower with the bears or standing on the sidelines? 👇
⚠️ Not financial advice. Always manage your risk. 🛡️
🏷️ #EWY #ShortSetup #Breakdown #CryptoTrading #MarketAnalysis
🐻 🩸
Entry: 175.23 - 178.77 ⚡
Target: 173 / 168 / 163 🎯
Stop Loss: 191 ⚠️
📌 Bulls just slammed into a major supply wall with complete momentum failure as distribution begins to accelerate. 📊 Order flow reveals buyers lack the firepower to hold this level, making this heavy rejection a pristine short setup for a swift drop into lower liquidity pools.
💡 As long as overhead structure at 191 remains unbroken, downside momentum favors a clean roll through intermediate targets down to 163. 💬 Are you riding this rejection lower with the bears or standing on the sidelines? 👇
⚠️ Not financial advice. Always manage your risk. 🛡️
🏷️ #EWY #ShortSetup #Breakdown #CryptoTrading #MarketAnalysis
🐻 🩸
8

💥 $EWY RECLAIMS KEY MOVING AVERAGES AS KOREAN CAPITAL INFLOWS TRIGGER BREAKOUT! 🚀
Entry: 178.75 ⚡
Target: 188.00 🚀
Stop Loss: 175.50 ⚠️
📌 Buyers have firmly reclaimed the MA25 and MA99 moving average stack, building a solid launchpad while MACD prints a healthy bullish momentum expansion. 📊 Capital flows out of South Korea are shifting aggressively back into bidding mode, absorbing overhead seller pressure with ease.
💡 A clean push past the critical 180 pivot zone clears the runway for a rapid momentum expansion toward our main target block. 🌊 Order flow heavily favors positioning early before the high-volume breakout sequence takes over. 🤔 Are you front-running the breakout here or waiting for the 180 flip confirmation? 👇
⚠️ Not financial advice. Always manage your risk. 🛡️
🏷️ #EWY #LongSetup #Breakout #Crypto #Trading
⚡ 💎
💥 $EWY RECLAIMS KEY MOVING AVERAGES AS KOREAN CAPITAL INFLOWS TRIGGER BREAKOUT! 🚀
Entry: 178.75 ⚡
Target: 188.00 🚀
Stop Loss: 175.50 ⚠️
📌 Buyers have firmly reclaimed the MA25 and MA99 moving average stack, building a solid launchpad while MACD prints a healthy bullish momentum expansion. 📊 Capital flows out of South Korea are shifting aggressively back into bidding mode, absorbing overhead seller pressure with ease.
💡 A clean push past the critical 180 pivot zone clears the runway for a rapid momentum expansion toward our main target block. 🌊 Order flow heavily favors positioning early before the high-volume breakout sequence takes over. 🤔 Are you front-running the breakout here or waiting for the 180 flip confirmation? 👇
⚠️ Not financial advice. Always manage your risk. 🛡️
🏷️ #EWY #LongSetup #Breakout #Crypto #Trading
⚡ 💎
Entry: 178.75 ⚡
Target: 188.00 🚀
Stop Loss: 175.50 ⚠️
📌 Buyers have firmly reclaimed the MA25 and MA99 moving average stack, building a solid launchpad while MACD prints a healthy bullish momentum expansion. 📊 Capital flows out of South Korea are shifting aggressively back into bidding mode, absorbing overhead seller pressure with ease.
💡 A clean push past the critical 180 pivot zone clears the runway for a rapid momentum expansion toward our main target block. 🌊 Order flow heavily favors positioning early before the high-volume breakout sequence takes over. 🤔 Are you front-running the breakout here or waiting for the 180 flip confirmation? 👇
⚠️ Not financial advice. Always manage your risk. 🛡️
🏷️ #EWY #LongSetup #Breakout #Crypto #Trading
⚡ 💎

·
--
$MU / $ACT / $EWY — Bullish bias on the 30-minute timeframe, with short-term confluence opportunities 🔥
════════════════════
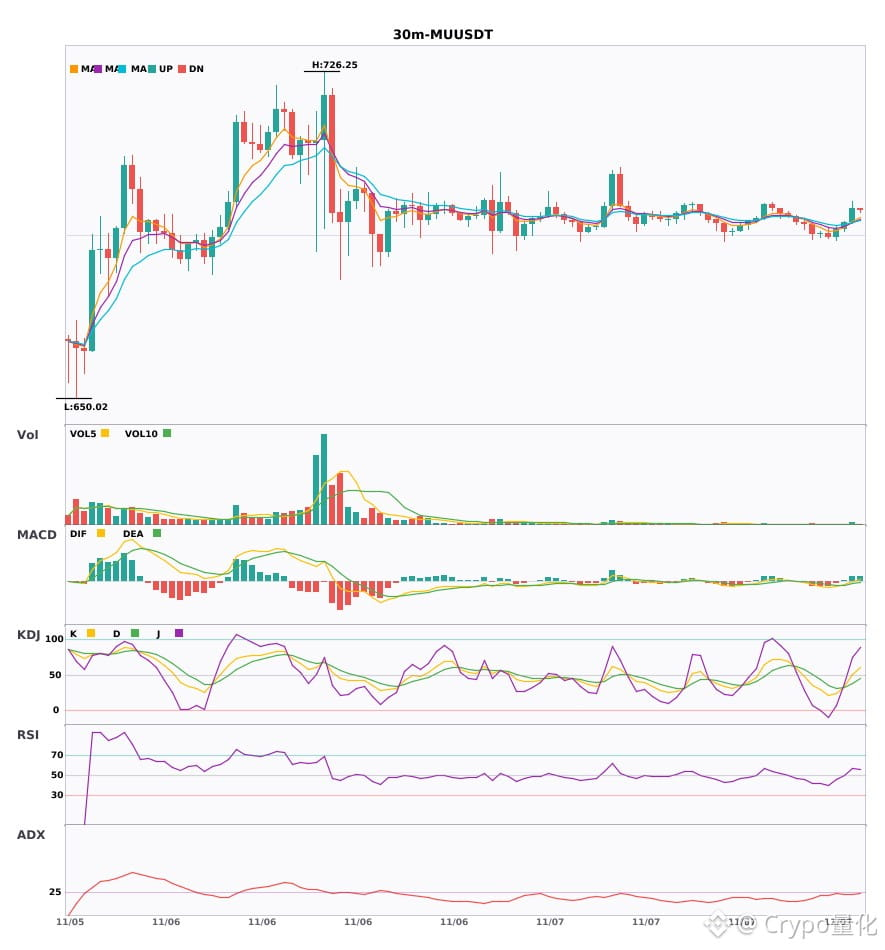
🔴 $MU 30-minute bullish signal
⚠️Technical analysis: ADX(26) Trend is forming; opportunity to participate | MACD DIF breaks above the zero line, trend turns bullish | EMA5 crosses above EMA8, short-term trend turns bullish | Volume surge (2.9x)
📢Market update: Binance Will Support Micron Technology (MU) Cash Dividend Distribution via bStocks
════════════════════
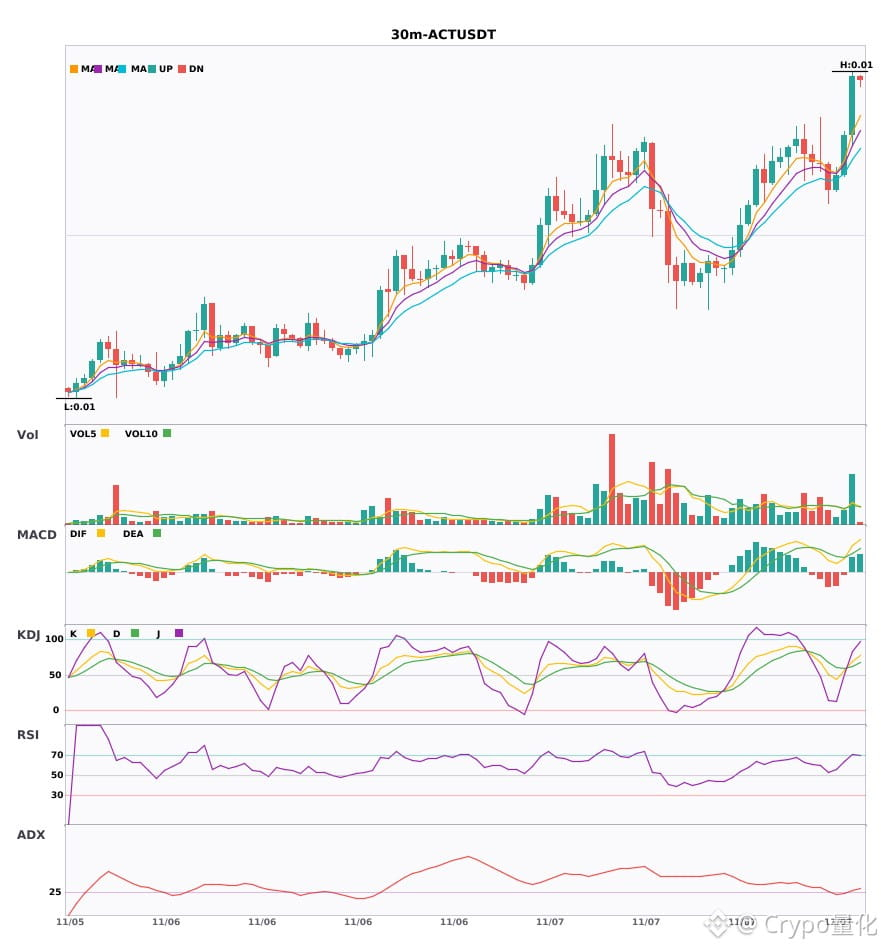
🔴 $ACT 30-minute bullish signal
⚠️Technical analysis: ADX(28) Trend is forming; opportunity to participate | MACD bullish crossover above zero, bullish momentum is building | EMA5 > EMA8 > EMA13, bullish alignment | KDJ bullish crossover, short-term outlook is bullish (K is 69.3, D is 62.3) | Volume surge (2.6x)
════════════════════
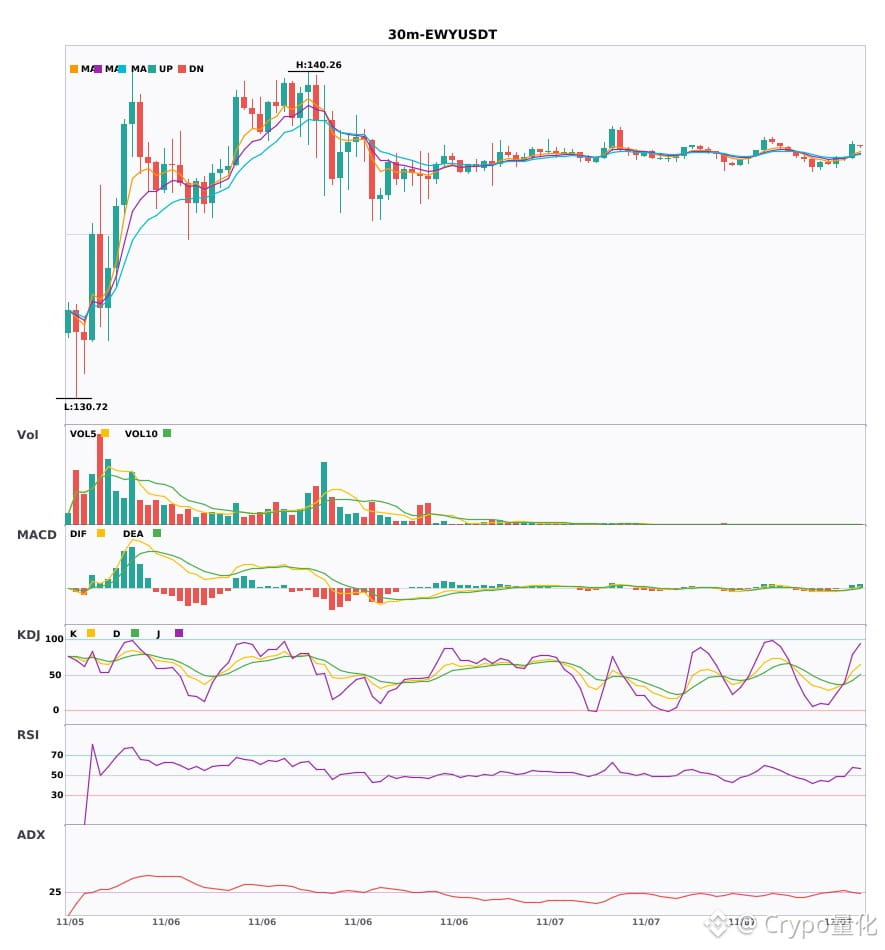
🔴 $EWY 30-minute bullish signal
⚠️Technical analysis: ADX(29) Trend is forming; opportunity to participate | MACD DIF breaks above the zero line, trend turns bullish | EMA5 crosses above EMA8, short-term trend turns bullish | Volume increases (1.8x)
════════════════════
🔔 Follow to get first-hand market alerts 🔔
#技术分析 #MU #ACT #EWY
📌 When trading, pay attention to whether the candlestick pattern confirms the signal
$MU / $ACT / $EWY — Bullish bias on the 30-minute timeframe, with short-term confluence opportunities 🔥
════════════════════
🔴 $MU 30-minute bullish signal
⚠️Technical analysis: ADX(26) Trend is forming; opportunity to participate | MACD DIF breaks above the zero line, trend turns bullish | EMA5 crosses above EMA8, short-term trend turns bullish | Volume surge (2.9x)
📢Market update: Binance Will Support Micron Technology (MU) Cash Dividend Distribution via bStocks
════════════════════
🔴 $ACT 30-minute bullish signal
⚠️Technical analysis: ADX(28) Trend is forming; opportunity to participate | MACD bullish crossover above zero, bullish momentum is building | EMA5 > EMA8 > EMA13, bullish alignment | KDJ bullish crossover, short-term outlook is bullish (K is 69.3, D is 62.3) | Volume surge (2.6x)
════════════════════
🔴 $EWY 30-minute bullish signal
⚠️Technical analysis: ADX(29) Trend is forming; opportunity to participate | MACD DIF breaks above the zero line, trend turns bullish | EMA5 crosses above EMA8, short-term trend turns bullish | Volume increases (1.8x)
════════════════════
🔔 Follow to get first-hand market alerts 🔔
#技术分析 #MU #ACT #EWY
📌 When trading, pay attention to whether the candlestick pattern confirms the signal
════════════════════
🔴 $MU 30-minute bullish signal
⚠️Technical analysis: ADX(26) Trend is forming; opportunity to participate | MACD DIF breaks above the zero line, trend turns bullish | EMA5 crosses above EMA8, short-term trend turns bullish | Volume surge (2.9x)
📢Market update: Binance Will Support Micron Technology (MU) Cash Dividend Distribution via bStocks
════════════════════
🔴 $ACT 30-minute bullish signal
⚠️Technical analysis: ADX(28) Trend is forming; opportunity to participate | MACD bullish crossover above zero, bullish momentum is building | EMA5 > EMA8 > EMA13, bullish alignment | KDJ bullish crossover, short-term outlook is bullish (K is 69.3, D is 62.3) | Volume surge (2.6x)
════════════════════
🔴 $EWY 30-minute bullish signal
⚠️Technical analysis: ADX(29) Trend is forming; opportunity to participate | MACD DIF breaks above the zero line, trend turns bullish | EMA5 crosses above EMA8, short-term trend turns bullish | Volume increases (1.8x)
════════════════════
🔔 Follow to get first-hand market alerts 🔔
#技术分析 #MU #ACT #EWY
📌 When trading, pay attention to whether the candlestick pattern confirms the signal
83

·
--
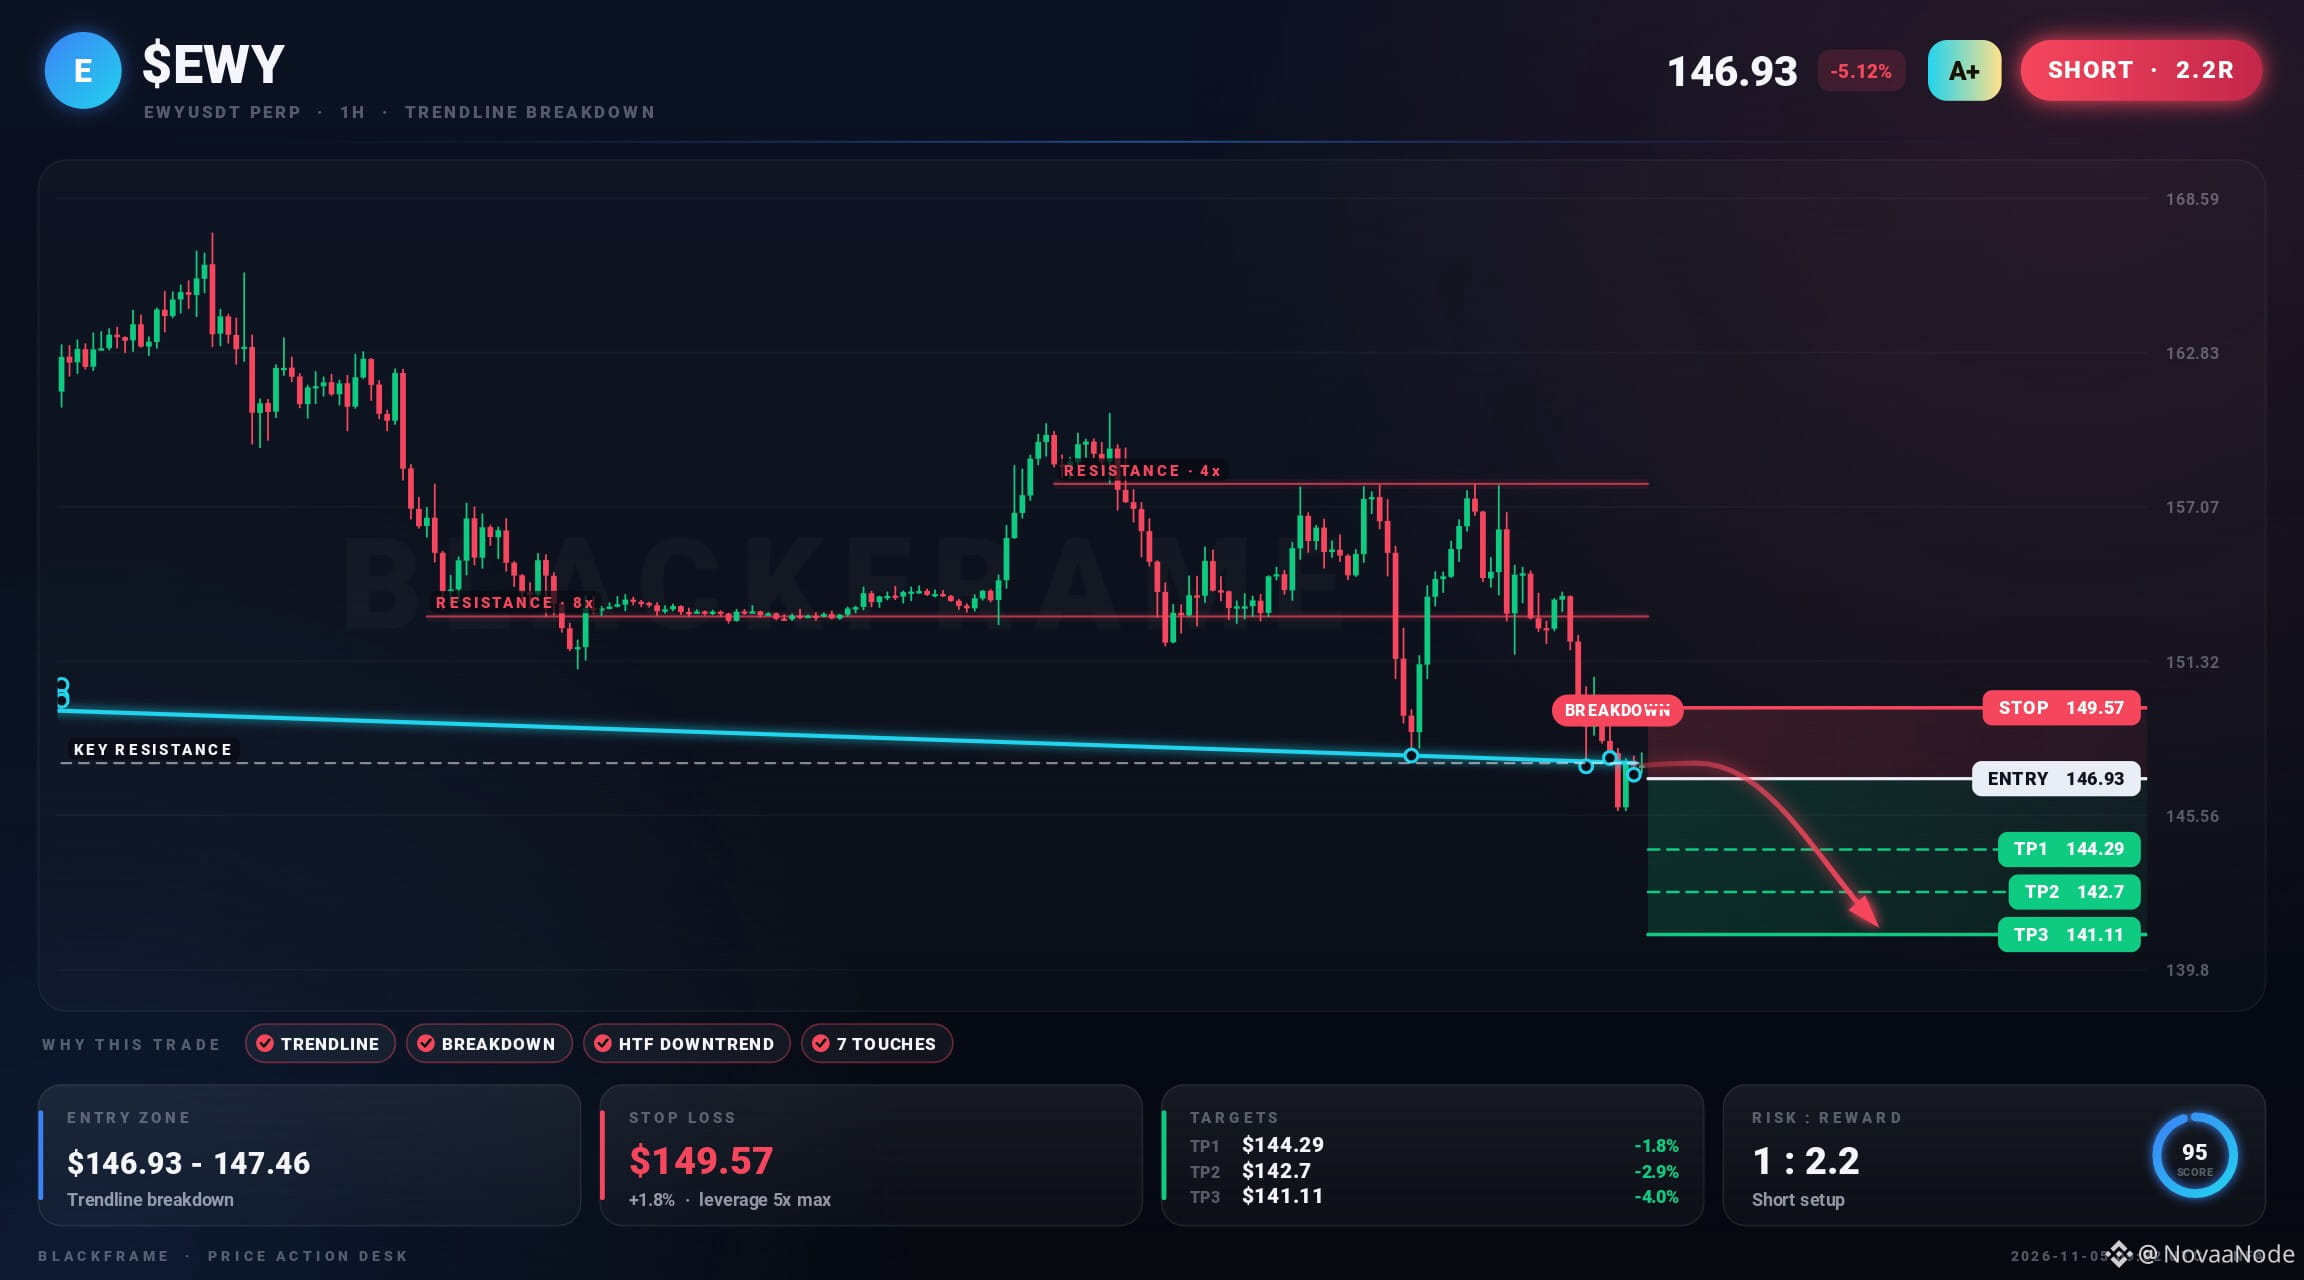
🩸 $EWY just lost the floor
SHORT · 1H
Entry: $140.97 - $142.18
TP1: $136.12
TP2: $133.21
TP3: $130.3
SL: $145.82
A descending channel has formed on the 1H, tested 10 times on its lines. Price broke down below the pattern and is holding. The higher timeframe trend agrees, and the target is the measured move of the pattern.
#EWY #Trading #Altcoins · NFA
🩸 $EWY just lost the floor
SHORT · 1H
Entry: $140.97 - $142.18
TP1: $136.12
TP2: $133.21
TP3: $130.3
SL: $145.82
A descending channel has formed on the 1H, tested 10 times on its lines. Price broke down below the pattern and is holding. The higher timeframe trend agrees, and the target is the measured move of the pattern.
#EWY #Trading #Altcoins · NFA
SHORT · 1H
Entry: $140.97 - $142.18
TP1: $136.12
TP2: $133.21
TP3: $130.3
SL: $145.82
A descending channel has formed on the 1H, tested 10 times on its lines. Price broke down below the pattern and is holding. The higher timeframe trend agrees, and the target is the measured move of the pattern.
#EWY #Trading #Altcoins · NFA
101

·
--
Market Journal $EWY@138.54
Key Levels (4h):
① Key resistance above: 153.55 (swept · +10.83% away)
② Bullish support zone: 130.6-137.54
③ Overhead resistance zone: 140.76-146.48, midpoint 143.62
④ Outflows are dominant; be more cautious about chasing the rally
⑤ Bullish bias, but wait and see; revisit the outlook if price pulls back to 130.6
Plan: Defense at 132.08, target 154.4
Recorded on November 6, 2026
Sharing ideas, not recommending stocks or calling trades. Trade at your own risk.
If you found this useful, please give it a like. More updates to come.
$EWY #EWY
Market Journal $EWY @138.54
Key Levels (4h):
① Key resistance above: 153.55 (swept · +10.83% away)
② Bullish support zone: 130.6-137.54
③ Overhead resistance zone: 140.76-146.48, midpoint 143.62
④ Outflows are dominant; be more cautious about chasing the rally
⑤ Bullish bias, but wait and see; revisit the outlook if price pulls back to 130.6
Plan: Defense at 132.08, target 154.4
Recorded on November 6, 2026
Sharing ideas, not recommending stocks or calling trades. Trade at your own risk.
If you found this useful, please give it a like. More updates to come.
$EWY #EWY
Key Levels (4h):
① Key resistance above: 153.55 (swept · +10.83% away)
② Bullish support zone: 130.6-137.54
③ Overhead resistance zone: 140.76-146.48, midpoint 143.62
④ Outflows are dominant; be more cautious about chasing the rally
⑤ Bullish bias, but wait and see; revisit the outlook if price pulls back to 130.6
Plan: Defense at 132.08, target 154.4
Recorded on November 6, 2026
Sharing ideas, not recommending stocks or calling trades. Trade at your own risk.
If you found this useful, please give it a like. More updates to come.
$EWY #EWY
1
·
--
$EWY@134.08: The direction is clear, but the entry point hasn't arrived yet.
My preferred entry: let's talk after a rebound to 153.55
Support is at 132.33; resistance is at 153.55.
Fund flows are weak: strong outflows.
Conclusion: Lean bearish and wait. Stay on the sidelines; don't chase shorts.
Key levels (4h):
· Key resistance above: 153.55 (swept · +14.52% away)
· Resistance zone above: 140.76-146.48, midpoint 143.62
· Bearish pressure zone: 154.4-157.69
· Nearby support: 132.33
Date: November 6, 2026, 08:49
Sharing my thoughts, not recommending stocks or calling trades. Trade at your own risk.
Discussion welcome. If I'm proven wrong, I'll adjust next time.
#交易信号 #BTC #EWY #看盘 $EWY
$EWY @134.08: The direction is clear, but the entry point hasn't arrived yet.
My preferred entry: let's talk after a rebound to 153.55
Support is at 132.33; resistance is at 153.55.
Fund flows are weak: strong outflows.
Conclusion: Lean bearish and wait. Stay on the sidelines; don't chase shorts.
Key levels (4h):
· Key resistance above: 153.55 (swept · +14.52% away)
· Resistance zone above: 140.76-146.48, midpoint 143.62
· Bearish pressure zone: 154.4-157.69
· Nearby support: 132.33
Date: November 6, 2026, 08:49
Sharing my thoughts, not recommending stocks or calling trades. Trade at your own risk.
Discussion welcome. If I'm proven wrong, I'll adjust next time.
#交易信号 #BTC #EWY #看盘 $EWY
My preferred entry: let's talk after a rebound to 153.55
Support is at 132.33; resistance is at 153.55.
Fund flows are weak: strong outflows.
Conclusion: Lean bearish and wait. Stay on the sidelines; don't chase shorts.
Key levels (4h):
· Key resistance above: 153.55 (swept · +14.52% away)
· Resistance zone above: 140.76-146.48, midpoint 143.62
· Bearish pressure zone: 154.4-157.69
· Nearby support: 132.33
Date: November 6, 2026, 08:49
Sharing my thoughts, not recommending stocks or calling trades. Trade at your own risk.
Discussion welcome. If I'm proven wrong, I'll adjust next time.
#交易信号 #BTC #EWY #看盘 $EWY

·
--
$EWY #EWY
Unusual Movement Alert: Short Alert | EWY
Not triggered on 15m, but strong bearish activity on 1h
Structure: GMMA bearish
Reasons: 1h trading value 2.5x / 4h trading value 7.8x / 1h candle body weak and closed lower / 1h broke below VWAP / 1h trading below EMA8/20 / GMMA bearish
Current price 136.80
Breakdown level 136.79
Invalidation level 148.48
Downside watch levels 123.12 / 109.44
Funding rate +0.0147% (longs pay, shorts receive)
The signal direction is clear. Once triggered, you can trade in that direction; the invalidation level is the stop-loss level.
$EWY #EWY
Unusual Movement Alert: Short Alert | EWY
Not triggered on 15m, but strong bearish activity on 1h
Structure: GMMA bearish
Reasons: 1h trading value 2.5x / 4h trading value 7.8x / 1h candle body weak and closed lower / 1h broke below VWAP / 1h trading below EMA8/20 / GMMA bearish
Current price 136.80
Breakdown level 136.79
Invalidation level 148.48
Downside watch levels 123.12 / 109.44
Funding rate +0.0147% (longs pay, shorts receive)
The signal direction is clear. Once triggered, you can trade in that direction; the invalidation level is the stop-loss level.
Unusual Movement Alert: Short Alert | EWY
Not triggered on 15m, but strong bearish activity on 1h
Structure: GMMA bearish
Reasons: 1h trading value 2.5x / 4h trading value 7.8x / 1h candle body weak and closed lower / 1h broke below VWAP / 1h trading below EMA8/20 / GMMA bearish
Current price 136.80
Breakdown level 136.79
Invalidation level 148.48
Downside watch levels 123.12 / 109.44
Funding rate +0.0147% (longs pay, shorts receive)
The signal direction is clear. Once triggered, you can trade in that direction; the invalidation level is the stop-loss level.
304

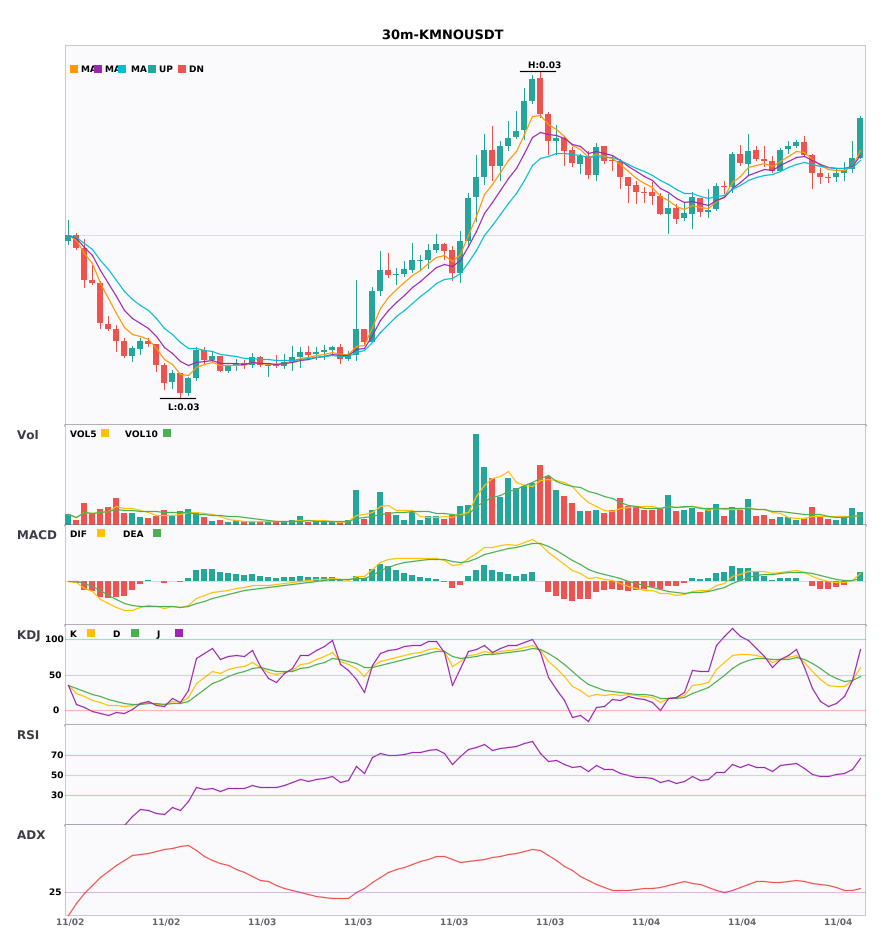
Three 30-minute bullish signals appeared simultaneously: $EWY / $CRV / $KMNO
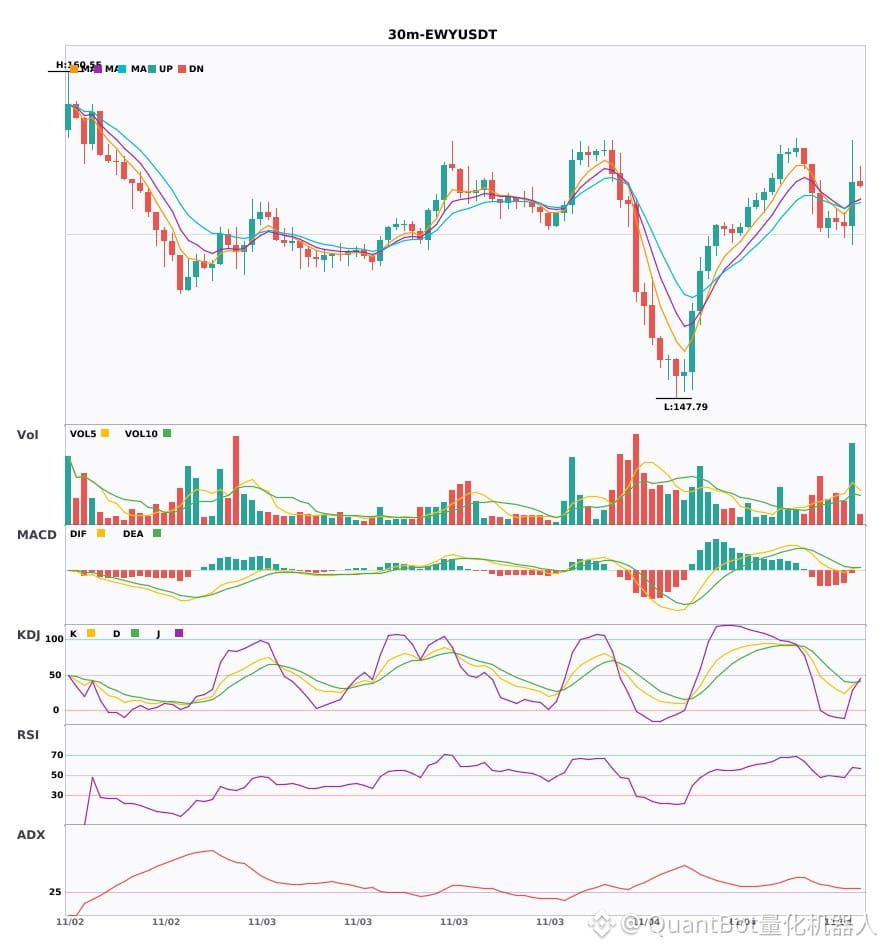
📈 $EWY | 30-minute bullish signal
━━━━━━━━━━━━━━━━━━
Technical analysis: ADX(33) indicates a clear trending market | MACD DIF breaks above the zero line, signaling a bullish trend reversal | Moving averages are converging as momentum builds; a direction is about to be chosen | KDJ is trading weakly, with bears in control (K: 35.7, D: 39.6) | Volume surge (2.6x)
Price change: 1.1200%
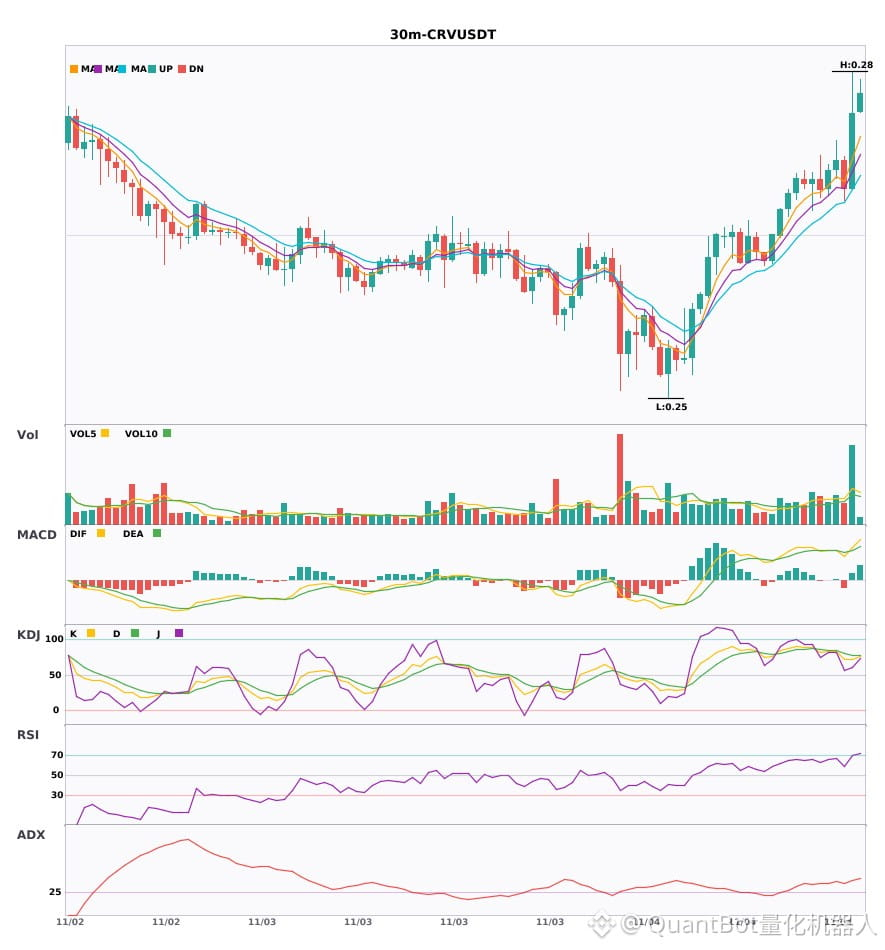
📈 $CRV | 30-minute bullish signal
━━━━━━━━━━━━━━━━━━
Technical analysis: ADX(41) indicates a clear trending market | MACD golden cross above zero, releasing bullish momentum | EMA5 > EMA8 > EMA13, bullish alignment | KDJ is trading strongly, with bulls in control (K: 71.6, D: 77.4) | Volume surge (2.6x)
Price change: 2.3100%
📈 $KMNO | 30-minute bullish signal
━━━━━━━━━━━━━━━━━━
Technical analysis: ADX(29) The trend is forming; entry may be considered | MACD DIF breaks above the zero line, signaling a bullish trend reversal | EMA5 crosses above EMA8, turning bullish in the short term | KDJ golden cross, short-term outlook bullish (K: 42.2, D: 41.8) | Volume increase (2.0x)
Price change: 0.6300%
━━━━━━━━━━━━━━━━━━
#技术分析 #EWY #CRV #KMNO
📌 The above content is for reference only and does not constitute investment advice
Three 30-minute bullish signals appeared simultaneously: $EWY / $CRV / $KMNO
📈 $EWY | 30-minute bullish signal
━━━━━━━━━━━━━━━━━━
Technical analysis: ADX(33) indicates a clear trending market | MACD DIF breaks above the zero line, signaling a bullish trend reversal | Moving averages are converging as momentum builds; a direction is about to be chosen | KDJ is trading weakly, with bears in control (K: 35.7, D: 39.6) | Volume surge (2.6x)
Price change: 1.1200%
📈 $CRV | 30-minute bullish signal
━━━━━━━━━━━━━━━━━━
Technical analysis: ADX(41) indicates a clear trending market | MACD golden cross above zero, releasing bullish momentum | EMA5 > EMA8 > EMA13, bullish alignment | KDJ is trading strongly, with bulls in control (K: 71.6, D: 77.4) | Volume surge (2.6x)
Price change: 2.3100%
📈 $KMNO | 30-minute bullish signal
━━━━━━━━━━━━━━━━━━
Technical analysis: ADX(29) The trend is forming; entry may be considered | MACD DIF breaks above the zero line, signaling a bullish trend reversal | EMA5 crosses above EMA8, turning bullish in the short term | KDJ golden cross, short-term outlook bullish (K: 42.2, D: 41.8) | Volume increase (2.0x)
Price change: 0.6300%
━━━━━━━━━━━━━━━━━━
#技术分析 #EWY #CRV #KMNO
📌 The above content is for reference only and does not constitute investment advice
📈 $EWY | 30-minute bullish signal
━━━━━━━━━━━━━━━━━━
Technical analysis: ADX(33) indicates a clear trending market | MACD DIF breaks above the zero line, signaling a bullish trend reversal | Moving averages are converging as momentum builds; a direction is about to be chosen | KDJ is trading weakly, with bears in control (K: 35.7, D: 39.6) | Volume surge (2.6x)
Price change: 1.1200%
📈 $CRV | 30-minute bullish signal
━━━━━━━━━━━━━━━━━━
Technical analysis: ADX(41) indicates a clear trending market | MACD golden cross above zero, releasing bullish momentum | EMA5 > EMA8 > EMA13, bullish alignment | KDJ is trading strongly, with bulls in control (K: 71.6, D: 77.4) | Volume surge (2.6x)
Price change: 2.3100%
📈 $KMNO | 30-minute bullish signal
━━━━━━━━━━━━━━━━━━
Technical analysis: ADX(29) The trend is forming; entry may be considered | MACD DIF breaks above the zero line, signaling a bullish trend reversal | EMA5 crosses above EMA8, turning bullish in the short term | KDJ golden cross, short-term outlook bullish (K: 42.2, D: 41.8) | Volume increase (2.0x)
Price change: 0.6300%
━━━━━━━━━━━━━━━━━━
#技术分析 #EWY #CRV #KMNO
📌 The above content is for reference only and does not constitute investment advice
7
·
--
$EWY / $CRV / $KMNO 30-minute bullish bias, short-term confluence opportunity 🔥
════════════════════
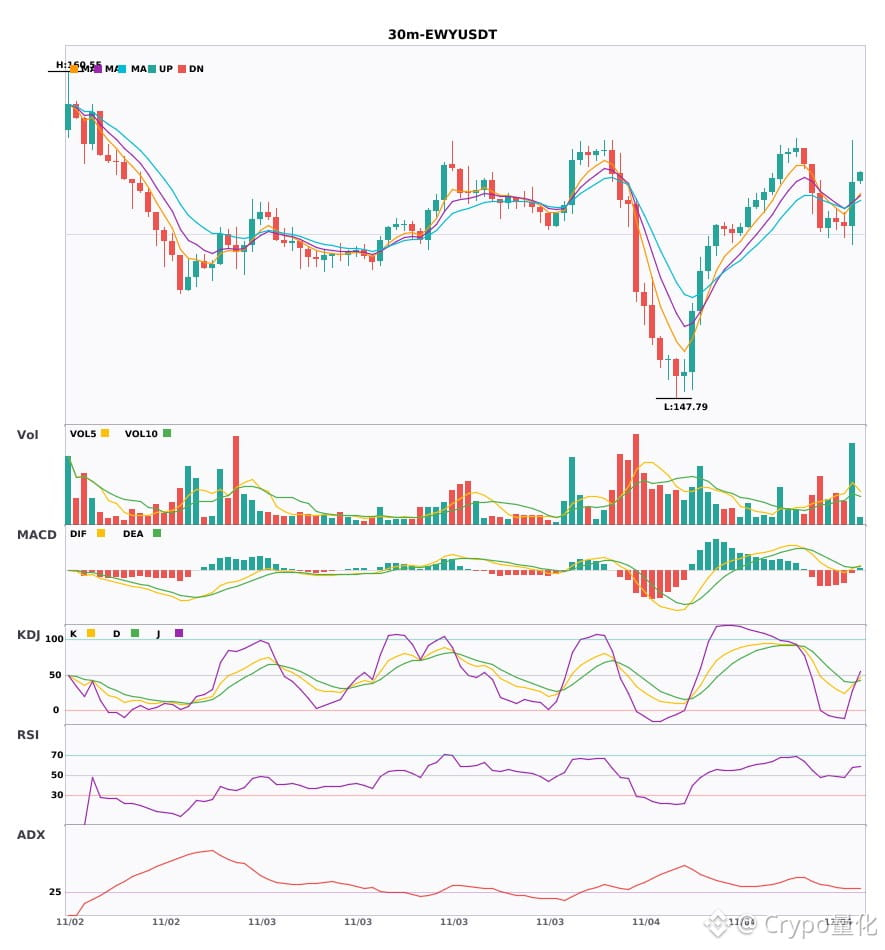
🔴 $EWY 30-minute bullish signal
⚠️Technical analysis: ADX(33) indicates a clear trend | MACD DIF breaks above zero, signaling a bullish trend shift | Moving averages converge and build momentum, with a direction expected soon | KDJ is weak, with bears in control (K: 35.7, D: 39.6) | Volume surges (2.6x)
════════════════════
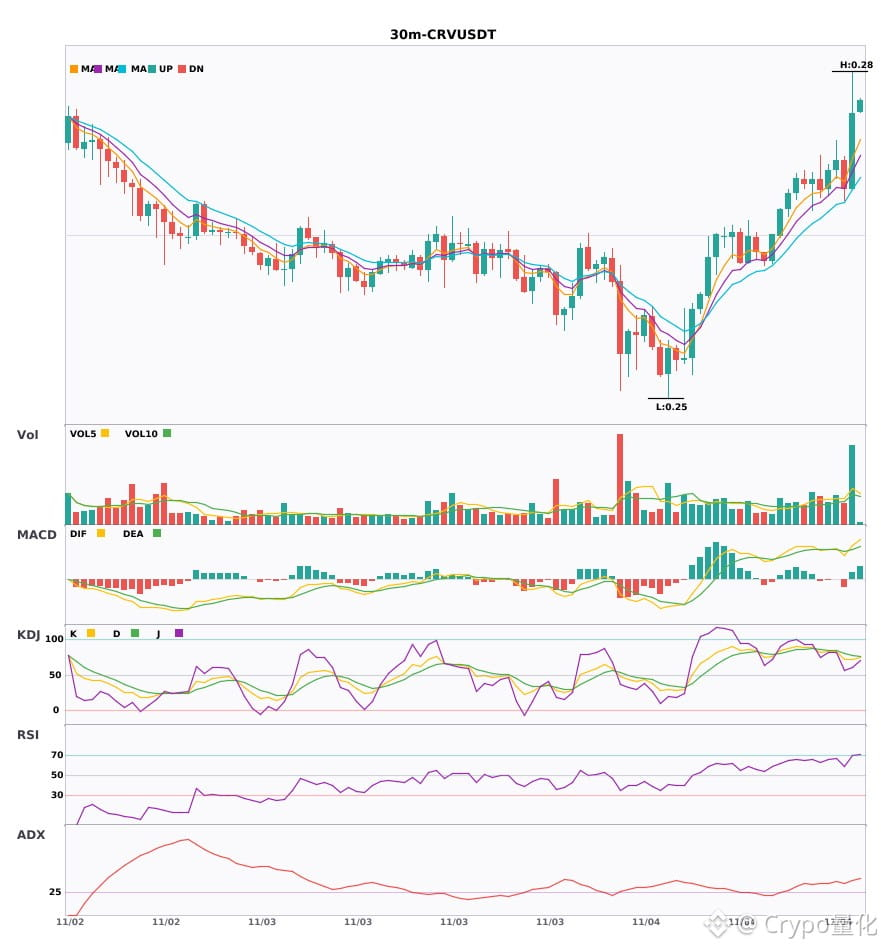
🔴 $CRV 30-minute bullish signal
⚠️Technical analysis: ADX(41) indicates a clear trend | MACD bullish crossover above zero, releasing bullish momentum | EMA5 > EMA8 > EMA13, bullish alignment | KDJ is strong, with bulls in control (K: 71.6, D: 77.4) | Volume surges (2.6x)
════════════════════
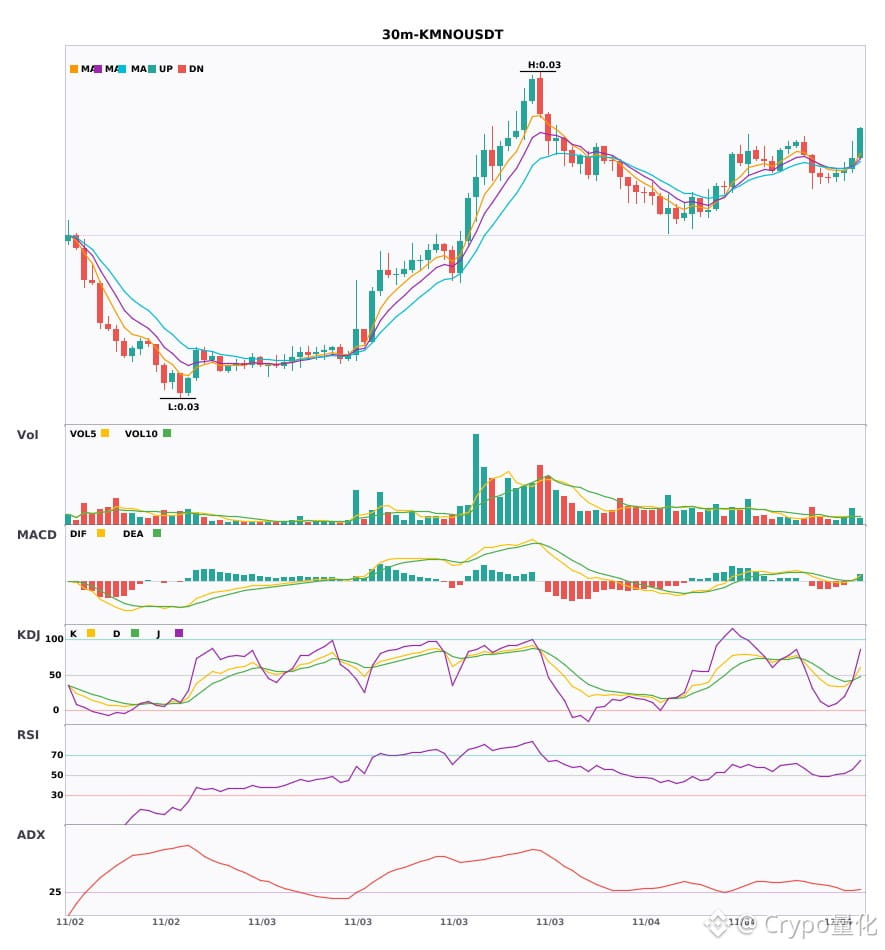
🔴 $KMNO 30-minute bullish signal
⚠️Technical analysis: ADX(29) indicates a trend is forming and may be traded | MACD DIF breaks above zero, signaling a bullish trend shift | EMA5 crosses above EMA8, turning bullish in the short term | KDJ bullish crossover, short-term outlook is bullish (K: 42.2, D: 41.8) | Volume increases (2.0x)
════════════════════
🔔 Follow us for the latest market moves 🔔
#技术分析 #EWY #CRV #KMNO
📌 When trading, watch for confirming candlestick patterns
$EWY / $CRV / $KMNO 30-minute bullish bias, short-term confluence opportunity 🔥
════════════════════
🔴 $EWY 30-minute bullish signal
⚠️Technical analysis: ADX(33) indicates a clear trend | MACD DIF breaks above zero, signaling a bullish trend shift | Moving averages converge and build momentum, with a direction expected soon | KDJ is weak, with bears in control (K: 35.7, D: 39.6) | Volume surges (2.6x)
════════════════════
🔴 $CRV 30-minute bullish signal
⚠️Technical analysis: ADX(41) indicates a clear trend | MACD bullish crossover above zero, releasing bullish momentum | EMA5 > EMA8 > EMA13, bullish alignment | KDJ is strong, with bulls in control (K: 71.6, D: 77.4) | Volume surges (2.6x)
════════════════════
🔴 $KMNO 30-minute bullish signal
⚠️Technical analysis: ADX(29) indicates a trend is forming and may be traded | MACD DIF breaks above zero, signaling a bullish trend shift | EMA5 crosses above EMA8, turning bullish in the short term | KDJ bullish crossover, short-term outlook is bullish (K: 42.2, D: 41.8) | Volume increases (2.0x)
════════════════════
🔔 Follow us for the latest market moves 🔔
#技术分析 #EWY #CRV #KMNO
📌 When trading, watch for confirming candlestick patterns
════════════════════
🔴 $EWY 30-minute bullish signal
⚠️Technical analysis: ADX(33) indicates a clear trend | MACD DIF breaks above zero, signaling a bullish trend shift | Moving averages converge and build momentum, with a direction expected soon | KDJ is weak, with bears in control (K: 35.7, D: 39.6) | Volume surges (2.6x)
════════════════════
🔴 $CRV 30-minute bullish signal
⚠️Technical analysis: ADX(41) indicates a clear trend | MACD bullish crossover above zero, releasing bullish momentum | EMA5 > EMA8 > EMA13, bullish alignment | KDJ is strong, with bulls in control (K: 71.6, D: 77.4) | Volume surges (2.6x)
════════════════════
🔴 $KMNO 30-minute bullish signal
⚠️Technical analysis: ADX(29) indicates a trend is forming and may be traded | MACD DIF breaks above zero, signaling a bullish trend shift | EMA5 crosses above EMA8, turning bullish in the short term | KDJ bullish crossover, short-term outlook is bullish (K: 42.2, D: 41.8) | Volume increases (2.0x)
════════════════════
🔔 Follow us for the latest market moves 🔔
#技术分析 #EWY #CRV #KMNO
📌 When trading, watch for confirming candlestick patterns
17
·
--
【November 04, 2026】
$EWY 149.18|Support vs. Resistance
Below: 146.53 — Only consider going long if it holds
Above: 152.79 — Only consider going short if it’s rejected
Current funds are trending toward outflows (strong outflows)
Right now, I’m leaning bearish and waiting. Reassess after a rebound to 152.89–153.7.
Key levels (4h):
· Key resistance above: 152.79 (swept · distance +2.42%)
· Key support below: 146.53 (not swept · distance -1.78%)
· Resistance zone above: 157.46–158.1, midpoint 157.78
· Bearish pressure zone: 154.4–157.69
Recorded on November 04, 2026
Sharing ideas only—not stock recommendations or trade signals. Trade at your own risk.
I’ll note it here for now and review once it plays out.
#资金流向 #EWY $EWY
【November 04, 2026】
$EWY 149.18|Support vs. Resistance
Below: 146.53 — Only consider going long if it holds
Above: 152.79 — Only consider going short if it’s rejected
Current funds are trending toward outflows (strong outflows)
Right now, I’m leaning bearish and waiting. Reassess after a rebound to 152.89–153.7.
Key levels (4h):
· Key resistance above: 152.79 (swept · distance +2.42%)
· Key support below: 146.53 (not swept · distance -1.78%)
· Resistance zone above: 157.46–158.1, midpoint 157.78
· Bearish pressure zone: 154.4–157.69
Recorded on November 04, 2026
Sharing ideas only—not stock recommendations or trade signals. Trade at your own risk.
I’ll note it here for now and review once it plays out.
#资金流向 #EWY $EWY
$EWY 149.18|Support vs. Resistance
Below: 146.53 — Only consider going long if it holds
Above: 152.79 — Only consider going short if it’s rejected
Current funds are trending toward outflows (strong outflows)
Right now, I’m leaning bearish and waiting. Reassess after a rebound to 152.89–153.7.
Key levels (4h):
· Key resistance above: 152.79 (swept · distance +2.42%)
· Key support below: 146.53 (not swept · distance -1.78%)
· Resistance zone above: 157.46–158.1, midpoint 157.78
· Bearish pressure zone: 154.4–157.69
Recorded on November 04, 2026
Sharing ideas only—not stock recommendations or trade signals. Trade at your own risk.
I’ll note it here for now and review once it plays out.
#资金流向 #EWY $EWY
2

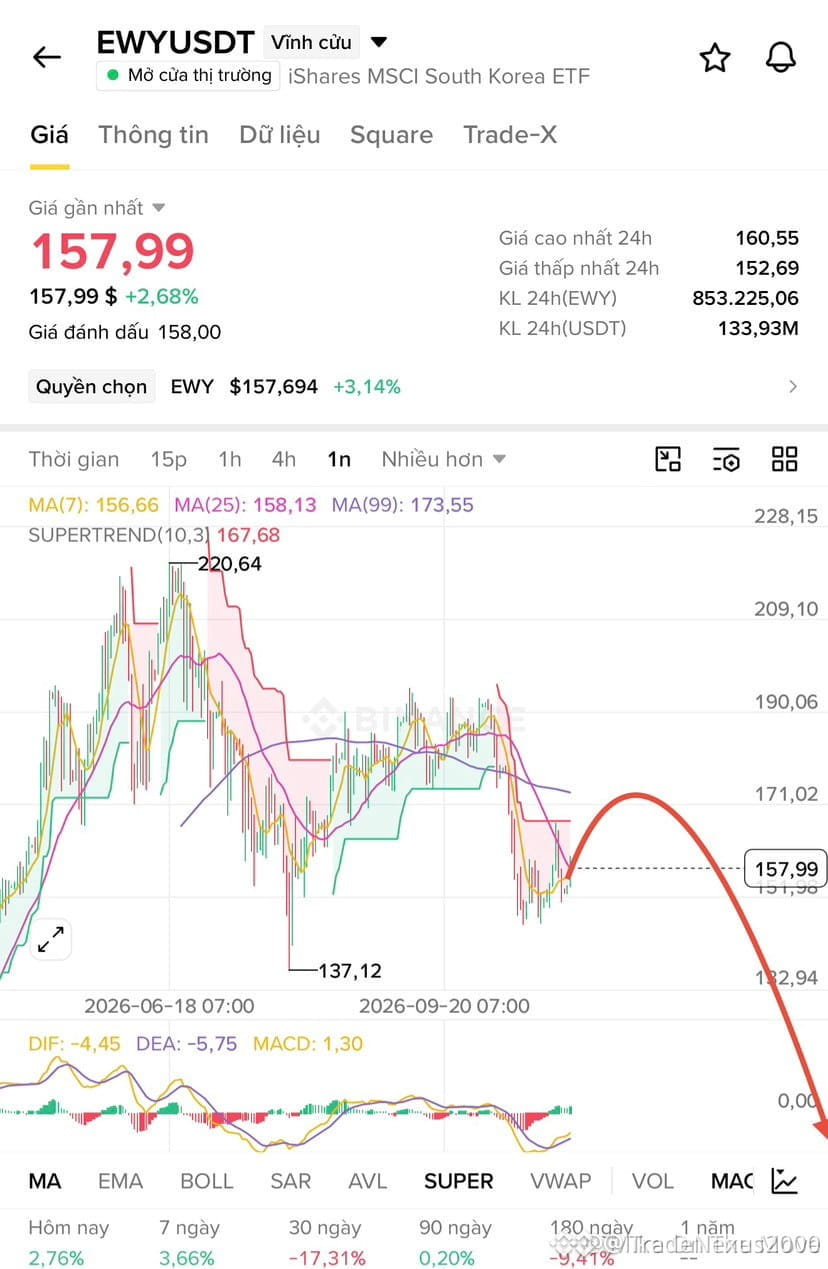
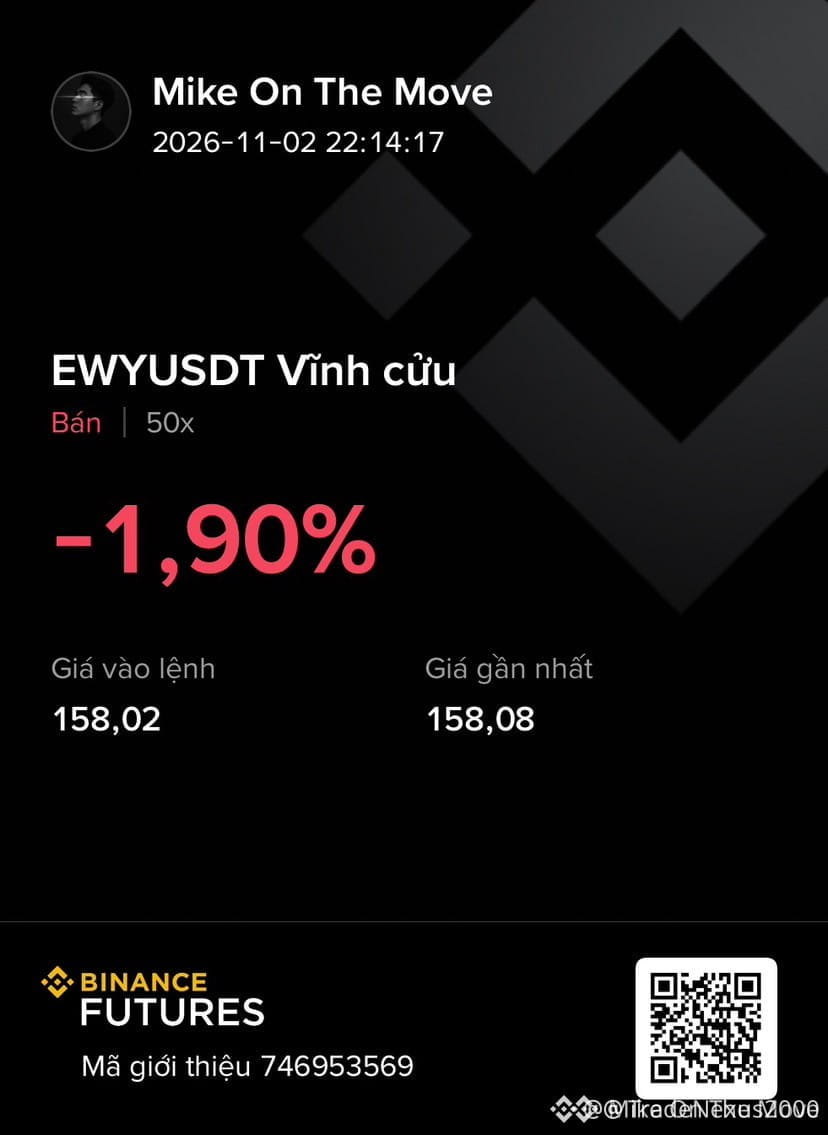
🔴 $EWY UNDER PRESSURE – PREPARE FOR THE NEXT BIG DROP! 🚨
Entry: 156.42‑159.58 ⚡
Target: 152.47 / 147.73 / 144.57 🚀
Stop Loss: 172.00 ⚠️
Smart money has been draining the demand zone around 159, leaving a clean order block that now acts as a bearish trap. 📊 The recent volume spike on the 4‑hour chart confirms a liquidity sweep, and the price is primed to cascade below the 156‑159 range. 🦈
With entry anchored between 156.42 and 159.58, the upside stop sits at 172, offering a tight risk envelope while the three‑tier target ladder (152.47‑147.73‑144.57) delivers a compelling R:R. ⚡ Are you ready to ride the downside wave or waiting for the next liquidity grab? 💬
⚠️ Not financial advice. Always manage your risk. 🛡️
🏷️ #EWY #ShortSetup #LiquiditySweep #Crypto
🔥 🦈
🔴 $EWY UNDER PRESSURE – PREPARE FOR THE NEXT BIG DROP! 🚨
Entry: 156.42‑159.58 ⚡
Target: 152.47 / 147.73 / 144.57 🚀
Stop Loss: 172.00 ⚠️
Smart money has been draining the demand zone around 159, leaving a clean order block that now acts as a bearish trap. 📊 The recent volume spike on the 4‑hour chart confirms a liquidity sweep, and the price is primed to cascade below the 156‑159 range. 🦈
With entry anchored between 156.42 and 159.58, the upside stop sits at 172, offering a tight risk envelope while the three‑tier target ladder (152.47‑147.73‑144.57) delivers a compelling R:R. ⚡ Are you ready to ride the downside wave or waiting for the next liquidity grab? 💬
⚠️ Not financial advice. Always manage your risk. 🛡️
🏷️ #EWY #ShortSetup #LiquiditySweep #Crypto
🔥 🦈
Entry: 156.42‑159.58 ⚡
Target: 152.47 / 147.73 / 144.57 🚀
Stop Loss: 172.00 ⚠️
Smart money has been draining the demand zone around 159, leaving a clean order block that now acts as a bearish trap. 📊 The recent volume spike on the 4‑hour chart confirms a liquidity sweep, and the price is primed to cascade below the 156‑159 range. 🦈
With entry anchored between 156.42 and 159.58, the upside stop sits at 172, offering a tight risk envelope while the three‑tier target ladder (152.47‑147.73‑144.57) delivers a compelling R:R. ⚡ Are you ready to ride the downside wave or waiting for the next liquidity grab? 💬
⚠️ Not financial advice. Always manage your risk. 🛡️
🏷️ #EWY #ShortSetup #LiquiditySweep #Crypto
🔥 🦈
1
19

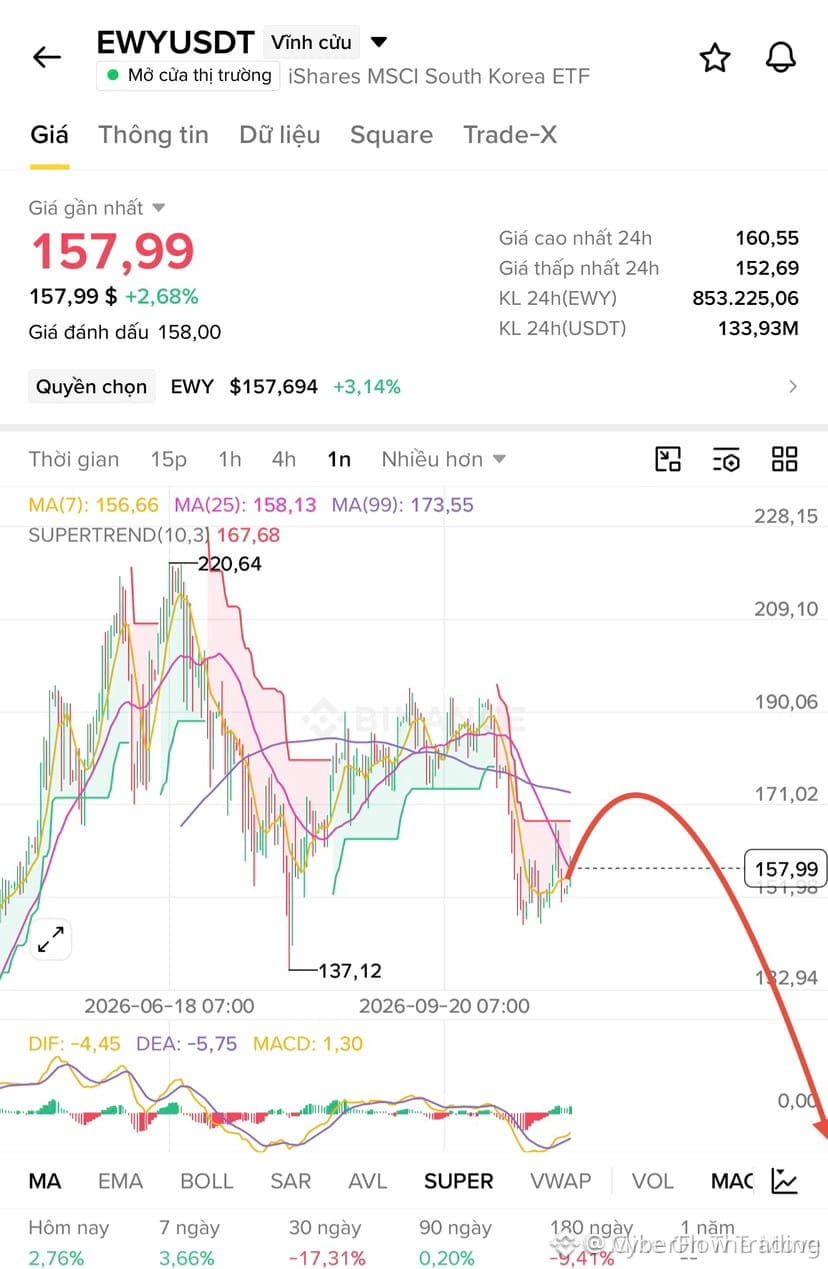
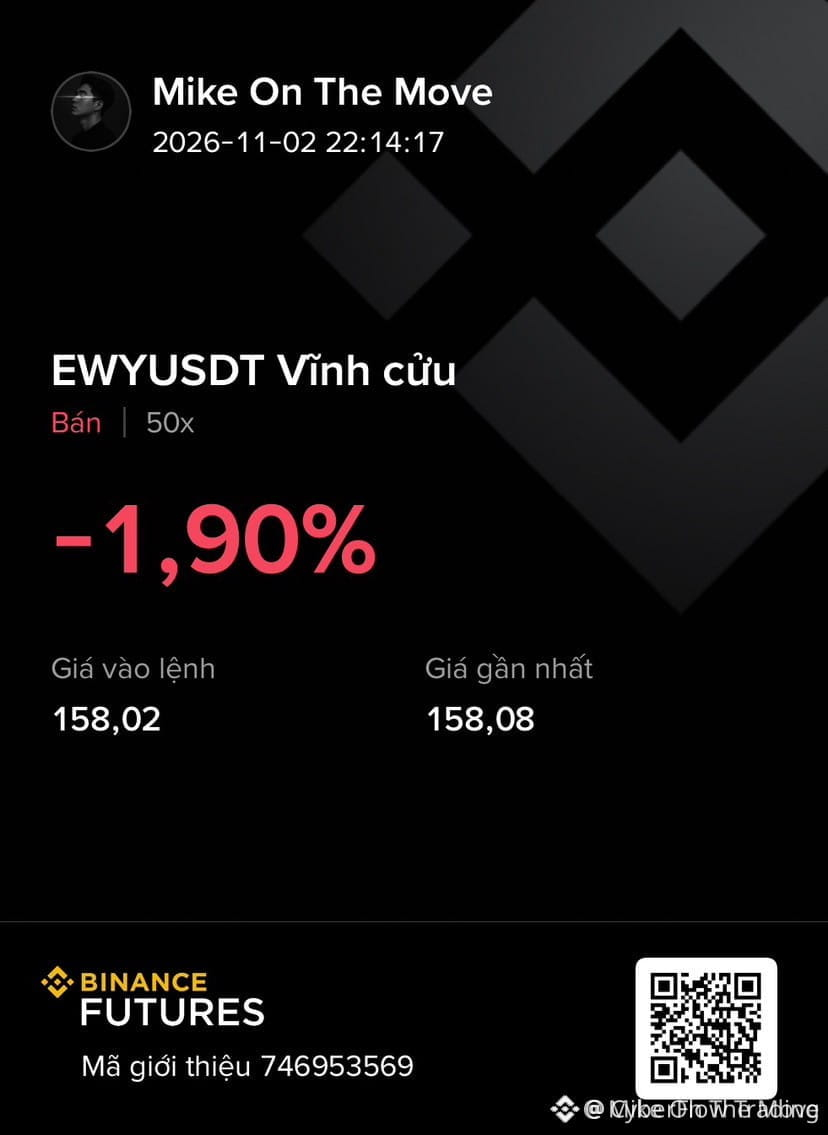
🔴 $EWY RACING TOWARD A MAJOR DROP – SHORT ALERT! 🚨
Entry: 156.42-159.58 ⚡
Target: 152.47 🚀
Target: 147.73 🚀
Target: 144.57 🚀
Stop Loss: 172.00 ⚠️
Smart money is flipping the order book, sweeping the 156‑159 zone and dumping $EWY into a deep liquidity pool. 📊 The 4H shows a tightening range and a bearish divergence on the RSI, signaling the next wave of sellers is primed.
Volume spikes are punching through the 160‑170 ceiling, while the bearish candle pattern on the daily chart paints a clear downtrend. 🦈 Expect the price to cascade toward the 152‑145 corridor, where previous demand blocks held firm. ⚡
💬 Are you loading your shorts now or waiting for the next liquidity grab? 👇
⚠️ Not financial advice. Always manage your risk. 🛡️
🏷️ #EWY #ShortSetup #Bearish #Crypto
🦈 🔥
🔴 $EWY RACING TOWARD A MAJOR DROP – SHORT ALERT! 🚨
Entry: 156.42-159.58 ⚡
Target: 152.47 🚀
Target: 147.73 🚀
Target: 144.57 🚀
Stop Loss: 172.00 ⚠️
Smart money is flipping the order book, sweeping the 156‑159 zone and dumping $EWY into a deep liquidity pool. 📊 The 4H shows a tightening range and a bearish divergence on the RSI, signaling the next wave of sellers is primed.
Volume spikes are punching through the 160‑170 ceiling, while the bearish candle pattern on the daily chart paints a clear downtrend. 🦈 Expect the price to cascade toward the 152‑145 corridor, where previous demand blocks held firm. ⚡
💬 Are you loading your shorts now or waiting for the next liquidity grab? 👇
⚠️ Not financial advice. Always manage your risk. 🛡️
🏷️ #EWY #ShortSetup #Bearish #Crypto
🦈 🔥
Entry: 156.42-159.58 ⚡
Target: 152.47 🚀
Target: 147.73 🚀
Target: 144.57 🚀
Stop Loss: 172.00 ⚠️
Smart money is flipping the order book, sweeping the 156‑159 zone and dumping $EWY into a deep liquidity pool. 📊 The 4H shows a tightening range and a bearish divergence on the RSI, signaling the next wave of sellers is primed.
Volume spikes are punching through the 160‑170 ceiling, while the bearish candle pattern on the daily chart paints a clear downtrend. 🦈 Expect the price to cascade toward the 152‑145 corridor, where previous demand blocks held firm. ⚡
💬 Are you loading your shorts now or waiting for the next liquidity grab? 👇
⚠️ Not financial advice. Always manage your risk. 🛡️
🏷️ #EWY #ShortSetup #Bearish #Crypto
🦈 🔥
1
17
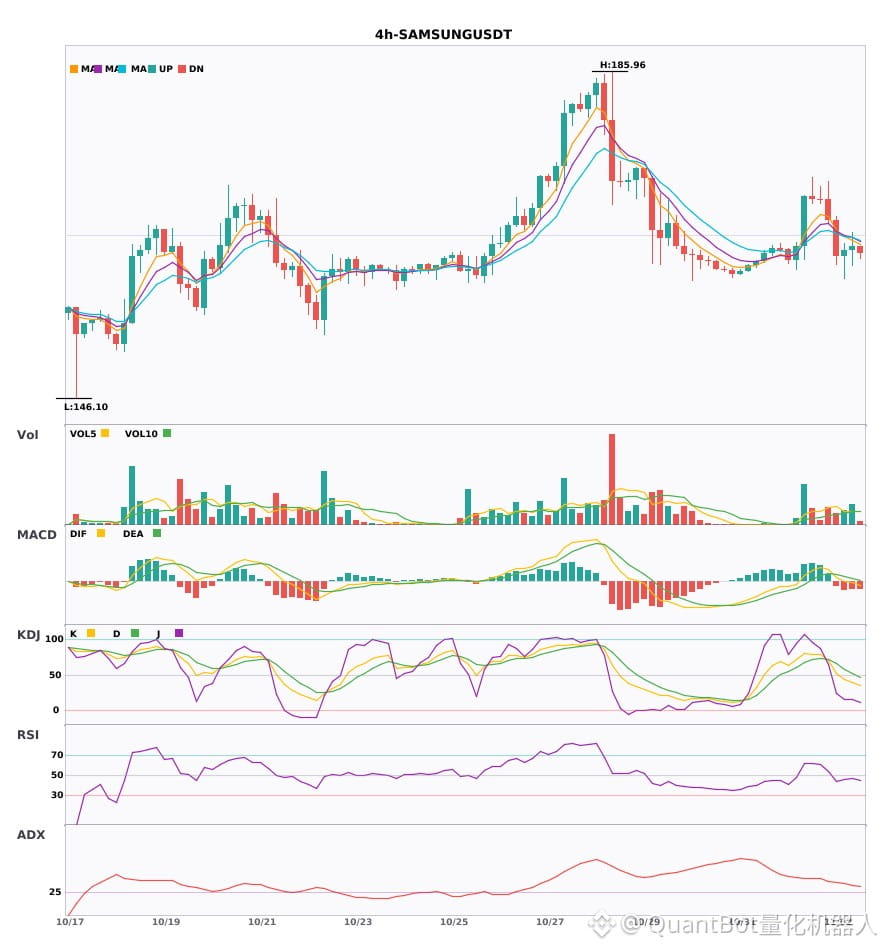
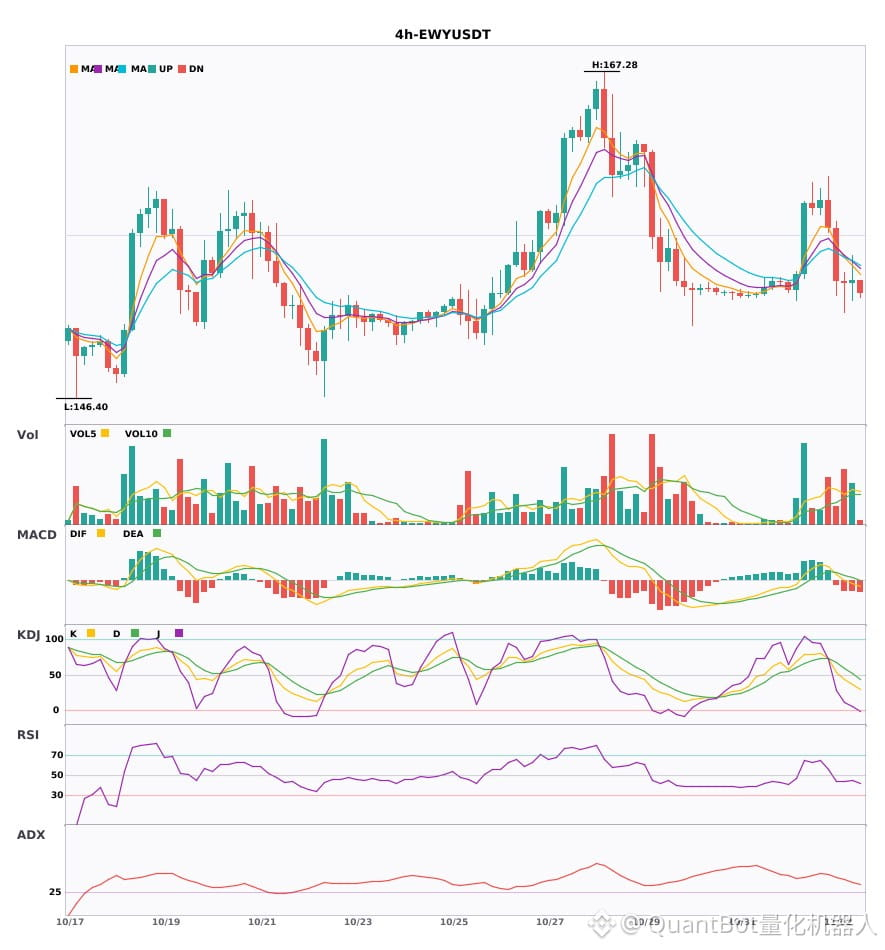
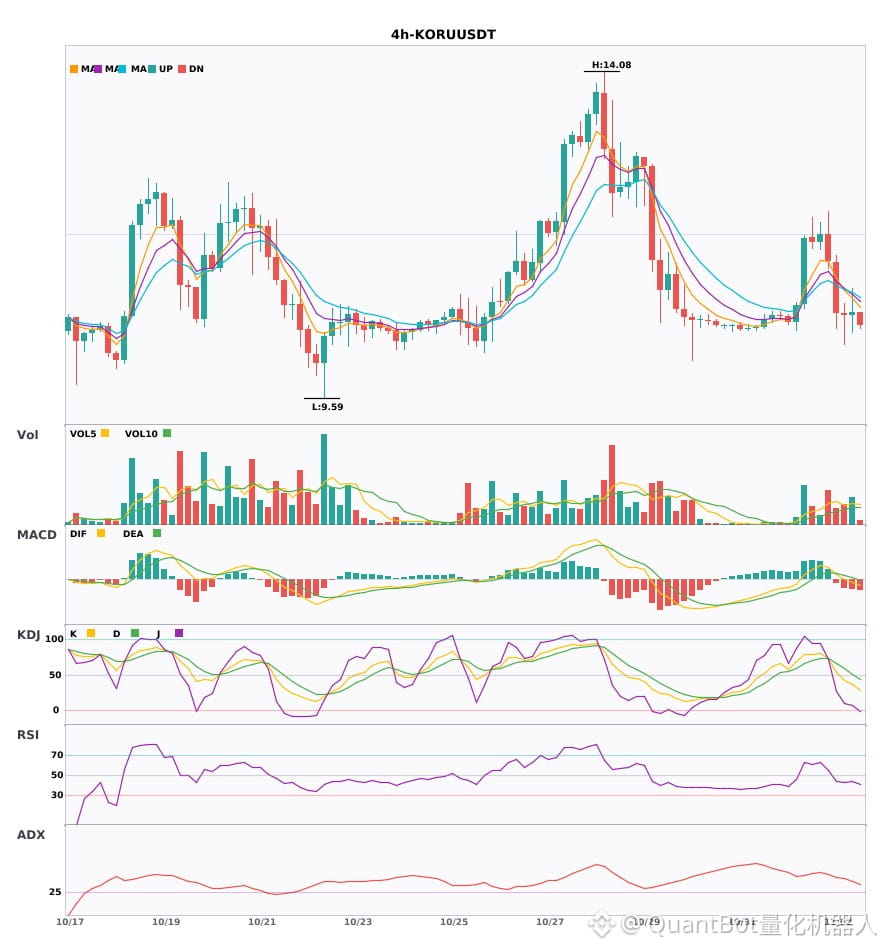
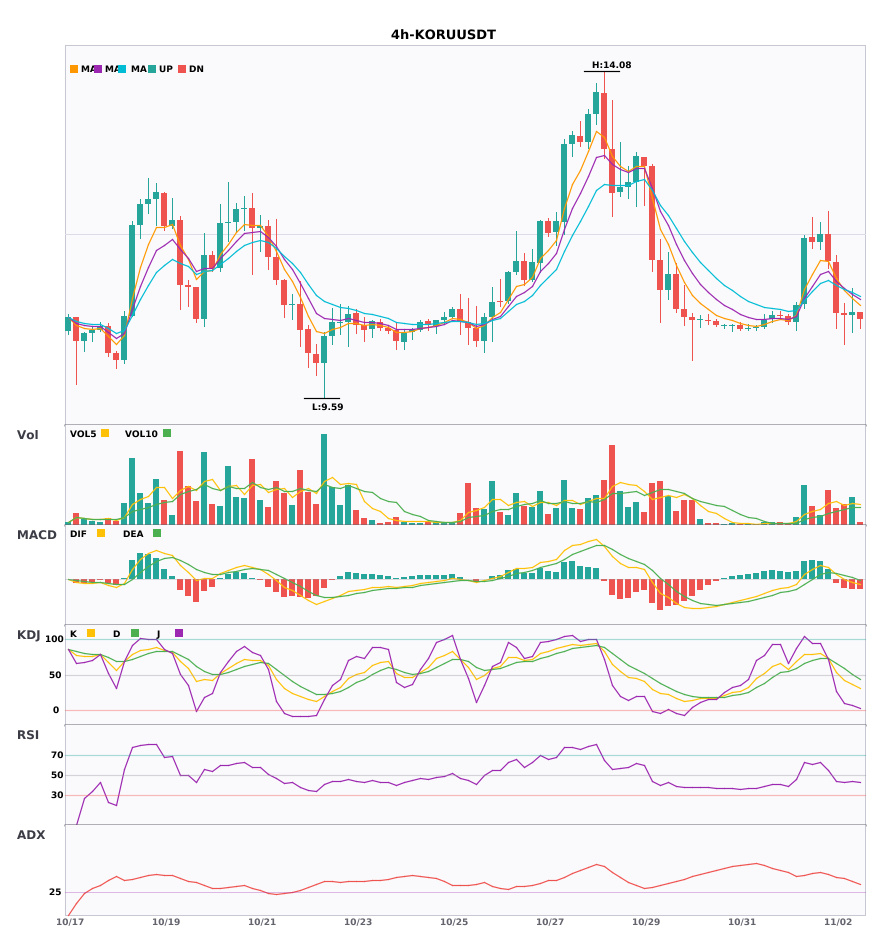
3 4-hour bearish alerts: $SAMSUNG / $EWY / $KORU
📉 $SAMSUNG | 4-hour bearish signal
━━━━━━━━━━━━━━━━━━
Technical analysis: ADX(33) Strong trending market | MACD DIF falls below the zero line, trend turns bearish | EMA5 < EMA8 < EMA13, bearish alignment | Increased volume (1.5x)
Price change: 0.2500%
📉 $EWY | 4-hour bearish signal
━━━━━━━━━━━━━━━━━━
Technical analysis: ADX(37) Strong trending market | MACD DIF falls below the zero line, trend turns bearish | EMA5 < EMA8 < EMA13, bearish alignment | Increased volume (2.0x)
Price change: 0.1000%
📉 $KORU | 4-hour bearish signal
━━━━━━━━━━━━━━━━━━
Technical analysis: ADX(38) Strong trending market | MACD DIF falls below the zero line, trend turns bearish | EMA5 < EMA8 < EMA13, bearish alignment | Increased volume (1.5x)
Price change: 0.3700%
━━━━━━━━━━━━━━━━━━
#技术分析 #SAMSUNG #EWY #KORU
📌 The above is for reference only and does not constitute investment advice
3 4-hour bearish alerts: $SAMSUNG / $EWY / $KORU
📉 $SAMSUNG | 4-hour bearish signal
━━━━━━━━━━━━━━━━━━
Technical analysis: ADX(33) Strong trending market | MACD DIF falls below the zero line, trend turns bearish | EMA5 < EMA8 < EMA13, bearish alignment | Increased volume (1.5x)
Price change: 0.2500%
📉 $EWY | 4-hour bearish signal
━━━━━━━━━━━━━━━━━━
Technical analysis: ADX(37) Strong trending market | MACD DIF falls below the zero line, trend turns bearish | EMA5 < EMA8 < EMA13, bearish alignment | Increased volume (2.0x)
Price change: 0.1000%
📉 $KORU | 4-hour bearish signal
━━━━━━━━━━━━━━━━━━
Technical analysis: ADX(38) Strong trending market | MACD DIF falls below the zero line, trend turns bearish | EMA5 < EMA8 < EMA13, bearish alignment | Increased volume (1.5x)
Price change: 0.3700%
━━━━━━━━━━━━━━━━━━
#技术分析 #SAMSUNG #EWY #KORU
📌 The above is for reference only and does not constitute investment advice
📉 $SAMSUNG | 4-hour bearish signal
━━━━━━━━━━━━━━━━━━
Technical analysis: ADX(33) Strong trending market | MACD DIF falls below the zero line, trend turns bearish | EMA5 < EMA8 < EMA13, bearish alignment | Increased volume (1.5x)
Price change: 0.2500%
📉 $EWY | 4-hour bearish signal
━━━━━━━━━━━━━━━━━━
Technical analysis: ADX(37) Strong trending market | MACD DIF falls below the zero line, trend turns bearish | EMA5 < EMA8 < EMA13, bearish alignment | Increased volume (2.0x)
Price change: 0.1000%
📉 $KORU | 4-hour bearish signal
━━━━━━━━━━━━━━━━━━
Technical analysis: ADX(38) Strong trending market | MACD DIF falls below the zero line, trend turns bearish | EMA5 < EMA8 < EMA13, bearish alignment | Increased volume (1.5x)
Price change: 0.3700%
━━━━━━━━━━━━━━━━━━
#技术分析 #SAMSUNG #EWY #KORU
📌 The above is for reference only and does not constitute investment advice
26
·
--
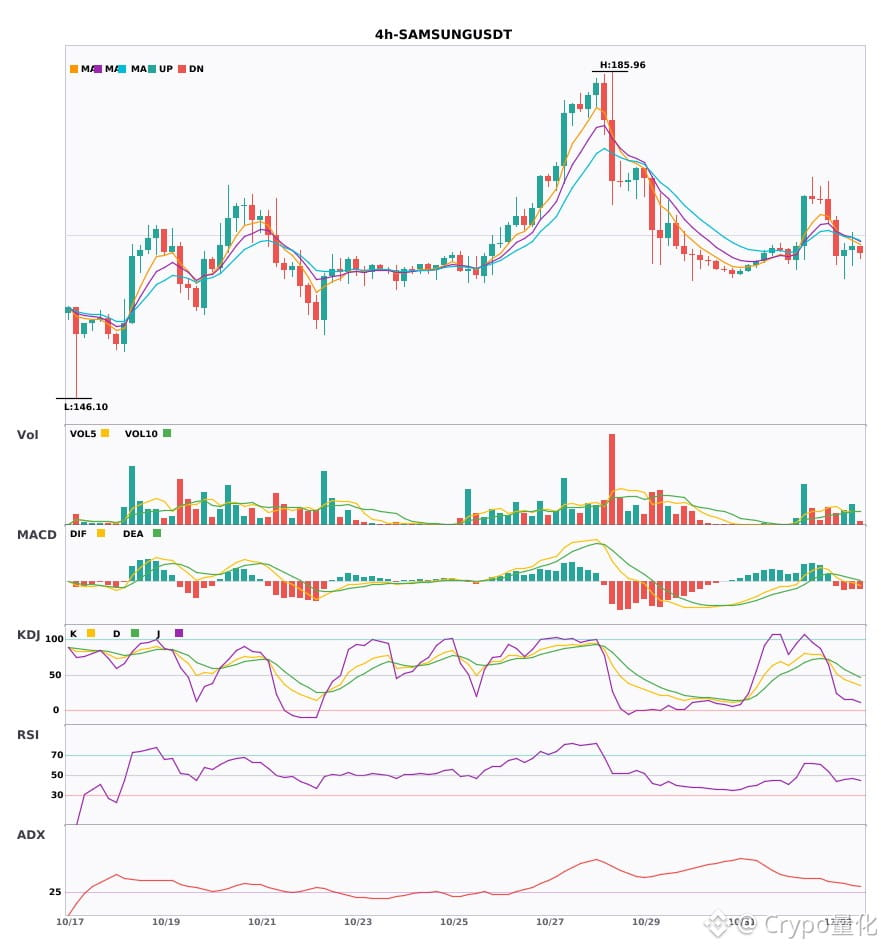
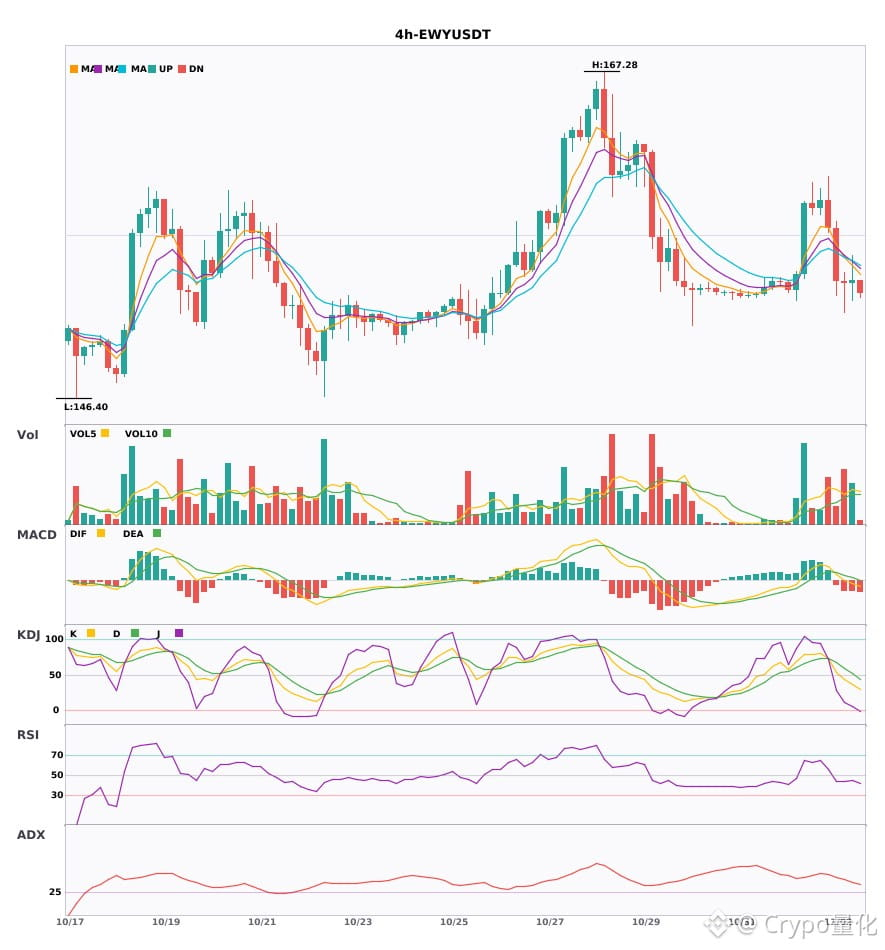
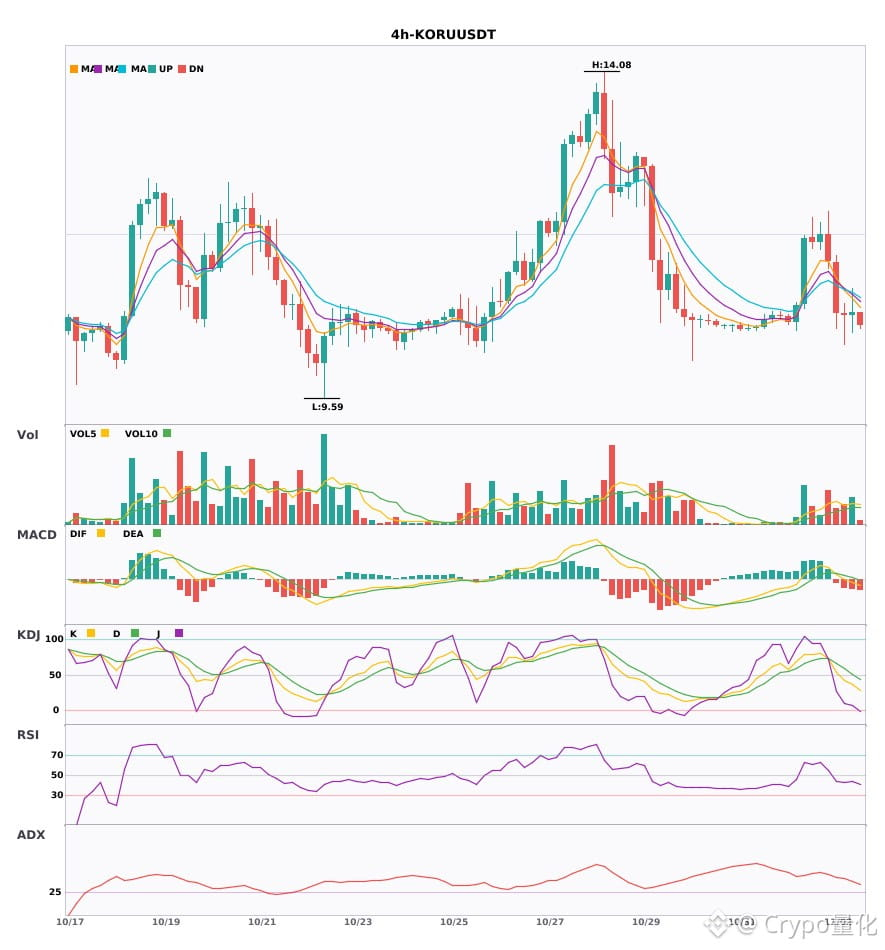
$SAMSUNG / $EWY / $KORU : Technical indicators are weakening across the board on the 4-hour timeframe. Watch out for risk 🔥
════════════════════
🟢 $SAMSUNG 4-hour bearish signal
⚠️ Technical analysis: ADX(33) indicates a clear trend | MACD DIF has fallen below zero, signaling a bearish trend | EMA5 < EMA8 < EMA13, bearish alignment | Trading volume increased (1.5x)
════════════════════
🟢 $EWY 4-hour bearish signal
⚠️ Technical analysis: ADX(37) indicates a clear trend | MACD DIF has fallen below zero, signaling a bearish trend | EMA5 < EMA8 < EMA13, bearish alignment | Trading volume increased (2.0x)
════════════════════
🟢 $KORU 4-hour bearish signal
⚠️ Technical analysis: ADX(38) indicates a clear trend | MACD DIF has fallen below zero, signaling a bearish trend | EMA5 < EMA8 < EMA13, bearish alignment | Trading volume increased (1.5x)
════════════════════
🔔 Follow us for the latest market movements 🔔
#技术分析 #SAMSUNG #EWY #KORU
📌 When trading, check whether the candlestick pattern confirms the setup.
$SAMSUNG / $EWY / $KORU : Technical indicators are weakening across the board on the 4-hour timeframe. Watch out for risk 🔥
════════════════════
🟢 $SAMSUNG 4-hour bearish signal
⚠️ Technical analysis: ADX(33) indicates a clear trend | MACD DIF has fallen below zero, signaling a bearish trend | EMA5 < EMA8 < EMA13, bearish alignment | Trading volume increased (1.5x)
════════════════════
🟢 $EWY 4-hour bearish signal
⚠️ Technical analysis: ADX(37) indicates a clear trend | MACD DIF has fallen below zero, signaling a bearish trend | EMA5 < EMA8 < EMA13, bearish alignment | Trading volume increased (2.0x)
════════════════════
🟢 $KORU 4-hour bearish signal
⚠️ Technical analysis: ADX(38) indicates a clear trend | MACD DIF has fallen below zero, signaling a bearish trend | EMA5 < EMA8 < EMA13, bearish alignment | Trading volume increased (1.5x)
════════════════════
🔔 Follow us for the latest market movements 🔔
#技术分析 #SAMSUNG #EWY #KORU
📌 When trading, check whether the candlestick pattern confirms the setup.
════════════════════
🟢 $SAMSUNG 4-hour bearish signal
⚠️ Technical analysis: ADX(33) indicates a clear trend | MACD DIF has fallen below zero, signaling a bearish trend | EMA5 < EMA8 < EMA13, bearish alignment | Trading volume increased (1.5x)
════════════════════
🟢 $EWY 4-hour bearish signal
⚠️ Technical analysis: ADX(37) indicates a clear trend | MACD DIF has fallen below zero, signaling a bearish trend | EMA5 < EMA8 < EMA13, bearish alignment | Trading volume increased (2.0x)
════════════════════
🟢 $KORU 4-hour bearish signal
⚠️ Technical analysis: ADX(38) indicates a clear trend | MACD DIF has fallen below zero, signaling a bearish trend | EMA5 < EMA8 < EMA13, bearish alignment | Trading volume increased (1.5x)
════════════════════
🔔 Follow us for the latest market movements 🔔
#技术分析 #SAMSUNG #EWY #KORU
📌 When trading, check whether the candlestick pattern confirms the setup.
22

·
--
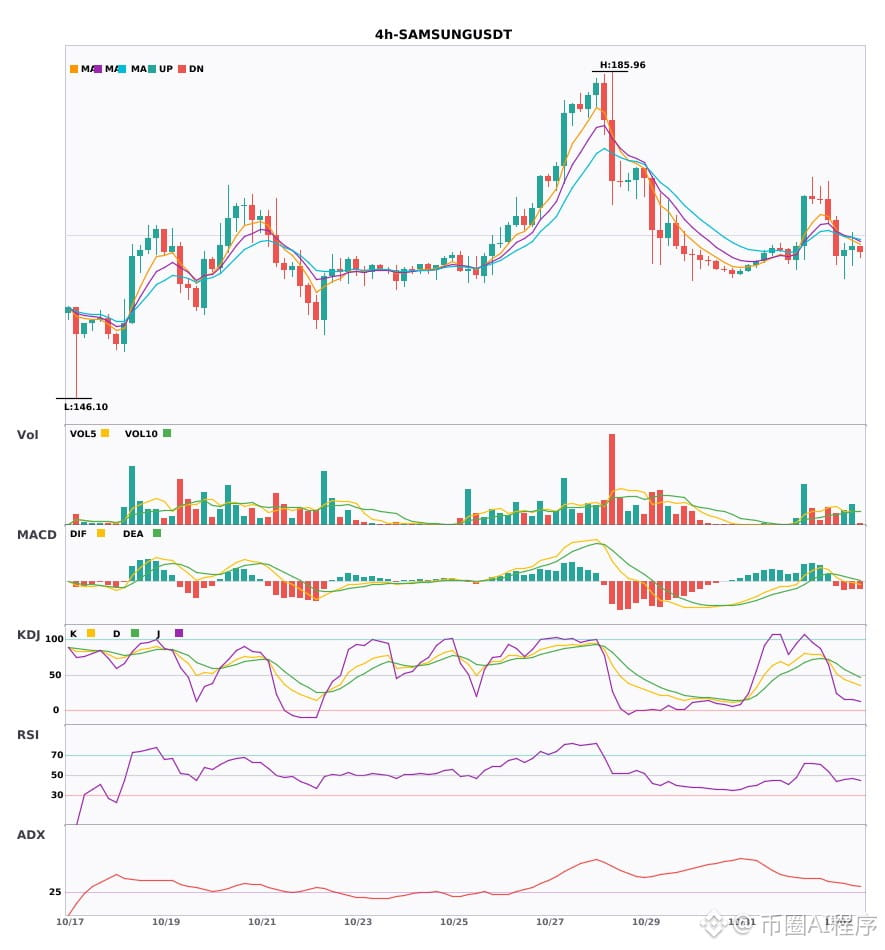
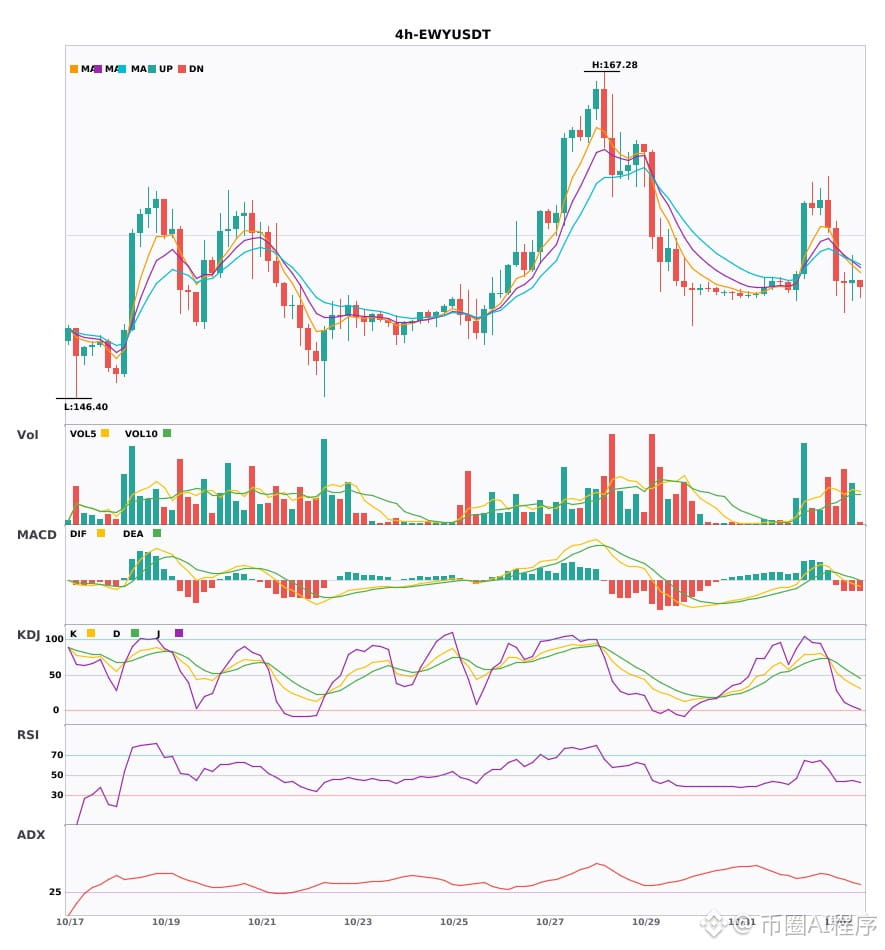
Multi-timeframe confluence: 3 coins with 4-hour bearish signals + confirmed daily bearish trend 🔥
════════════════════
🟢 $SAMSUNG 4-hour bearish signal
⚠️Technical: Daily bearish confluence confirmed | 4-hour entry: MACDDIF breaks below zero, trend turns bearish | EMA5 < EMA8 < EMA13 bearish alignment | Increased volume (1.5x)
════════════════════
🟢 $EWY 4-hour bearish signal
⚠️Technical: Daily bearish confluence confirmed | 4-hour entry: MACDDIF breaks below zero, trend turns bearish | EMA5 < EMA8 < EMA13 bearish alignment | Increased volume (2.0x)
════════════════════
🟢 $KORU 4-hour bearish signal
⚠️Technical: Daily bearish confluence confirmed | 4-hour entry: MACDDIF breaks below zero, trend turns bearish | EMA5 < EMA8 < EMA13 bearish alignment | Increased volume (1.5x)
════════════════════
🔔 Follow for real-time market updates 🔔
#多周期共振 #SAMSUNG #EWY #KORU
📌 When trading, pay attention to whether the candlestick pattern meets the criteria
Multi-timeframe confluence: 3 coins with 4-hour bearish signals + confirmed daily bearish trend 🔥
════════════════════
🟢 $SAMSUNG 4-hour bearish signal
⚠️Technical: Daily bearish confluence confirmed | 4-hour entry: MACDDIF breaks below zero, trend turns bearish | EMA5 < EMA8 < EMA13 bearish alignment | Increased volume (1.5x)
════════════════════
🟢 $EWY 4-hour bearish signal
⚠️Technical: Daily bearish confluence confirmed | 4-hour entry: MACDDIF breaks below zero, trend turns bearish | EMA5 < EMA8 < EMA13 bearish alignment | Increased volume (2.0x)
════════════════════
🟢 $KORU 4-hour bearish signal
⚠️Technical: Daily bearish confluence confirmed | 4-hour entry: MACDDIF breaks below zero, trend turns bearish | EMA5 < EMA8 < EMA13 bearish alignment | Increased volume (1.5x)
════════════════════
🔔 Follow for real-time market updates 🔔
#多周期共振 #SAMSUNG #EWY #KORU
📌 When trading, pay attention to whether the candlestick pattern meets the criteria
════════════════════
🟢 $SAMSUNG 4-hour bearish signal
⚠️Technical: Daily bearish confluence confirmed | 4-hour entry: MACDDIF breaks below zero, trend turns bearish | EMA5 < EMA8 < EMA13 bearish alignment | Increased volume (1.5x)
════════════════════
🟢 $EWY 4-hour bearish signal
⚠️Technical: Daily bearish confluence confirmed | 4-hour entry: MACDDIF breaks below zero, trend turns bearish | EMA5 < EMA8 < EMA13 bearish alignment | Increased volume (2.0x)
════════════════════
🟢 $KORU 4-hour bearish signal
⚠️Technical: Daily bearish confluence confirmed | 4-hour entry: MACDDIF breaks below zero, trend turns bearish | EMA5 < EMA8 < EMA13 bearish alignment | Increased volume (1.5x)
════════════════════
🔔 Follow for real-time market updates 🔔
#多周期共振 #SAMSUNG #EWY #KORU
📌 When trading, pay attention to whether the candlestick pattern meets the criteria
15
·
--
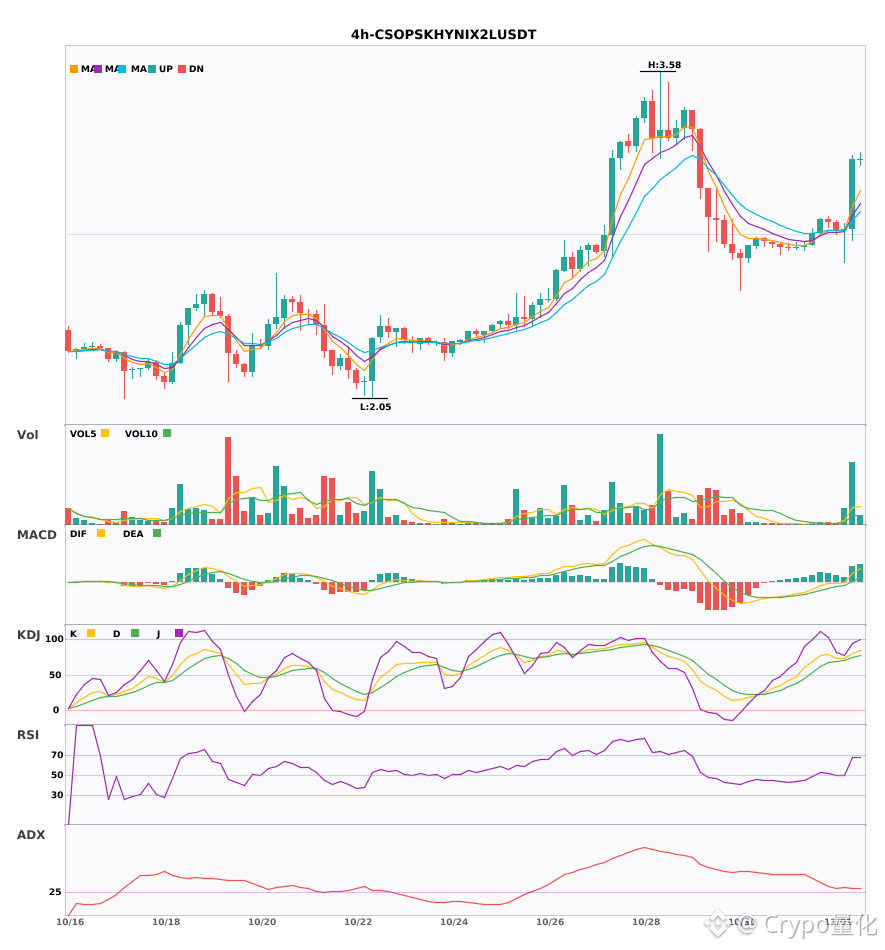
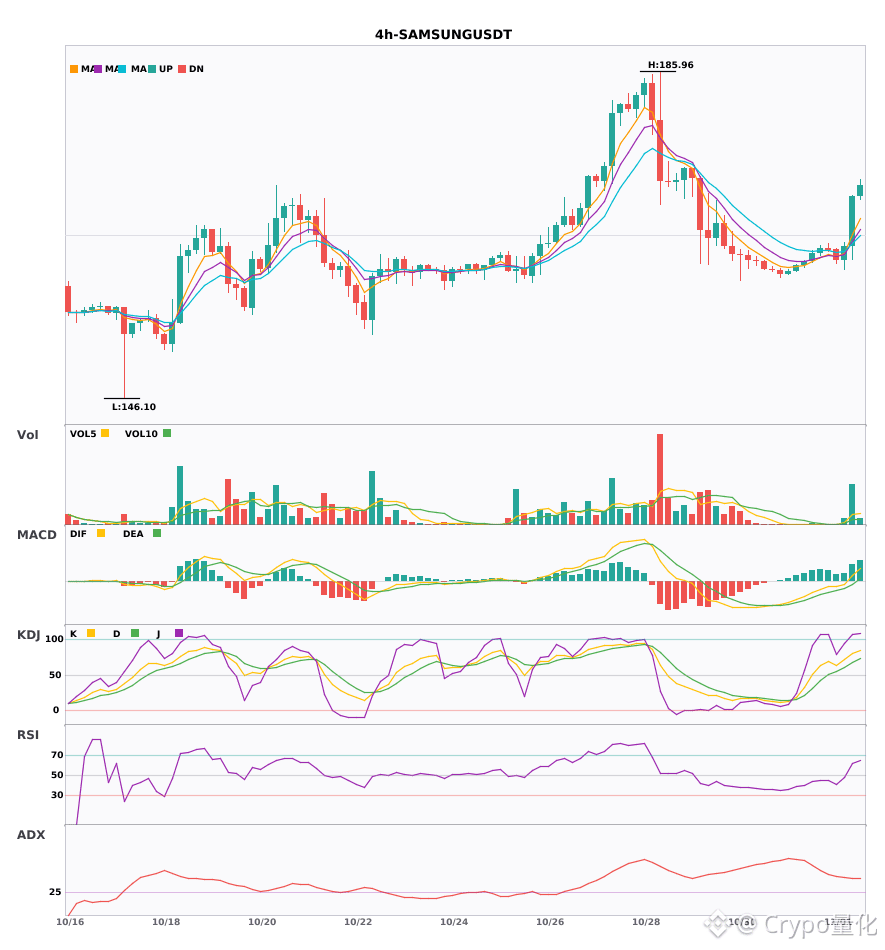
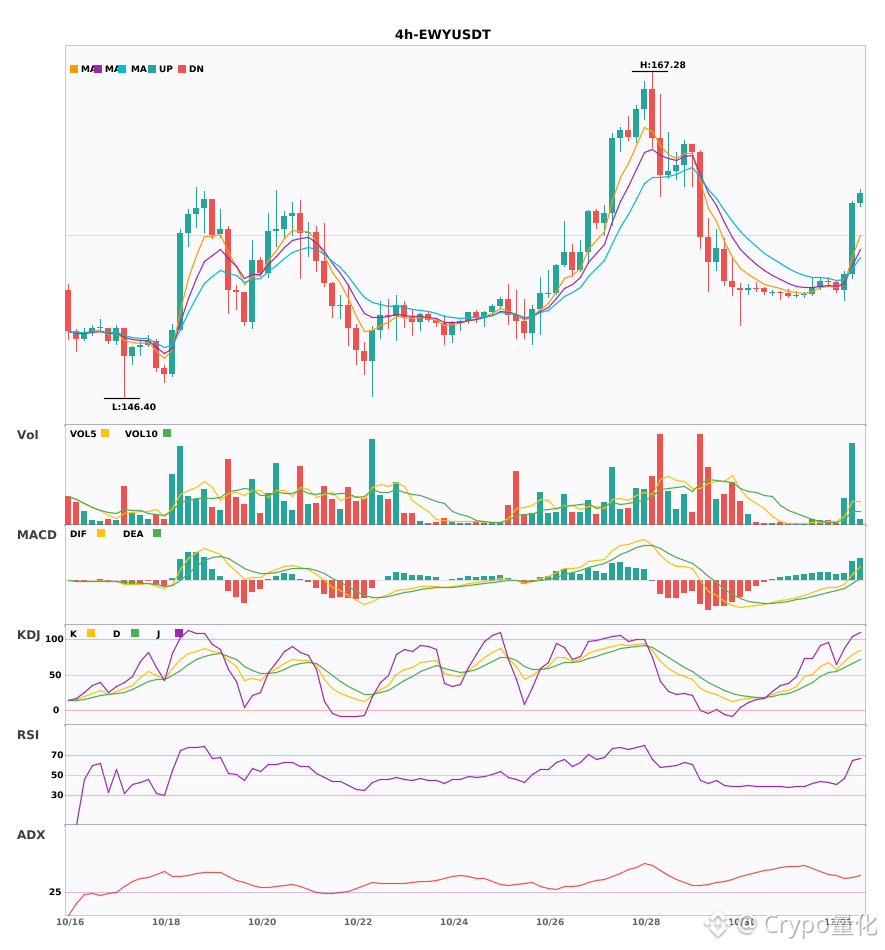
$CSOPSKHYNIX2L / $SAMSUNG / $EWY 4-hour resonance shifts bullish, with bullish signals appearing simultaneously🔥
════════════════════
🔴 $CSOPSKHYNIX2L 4-hour bullish signal
⚠️Technical analysis: ADX(31) indicates a clear trend | MACD DIF breaks above zero, signaling a bullish trend | EMA5 > EMA8 > EMA13, bullish alignment | KDJ is strong, with bulls in control (K: 80.6, D: 73.9) | Volume surge (6.9x)
════════════════════
🔴 $SAMSUNG 4-hour bullish signal
⚠️Technical analysis: ADX(39) indicates a clear trend | MACD DIF breaks above zero, signaling a bullish trend | EMA5 > EMA8 > EMA13, bullish alignment | KDJ is strong, with bulls in control (K: 80.4, D: 67.1) | Volume surge (7.7x)
════════════════════
🔴 $EWY 4-hour bullish signal
⚠️Technical analysis: ADX(42) indicates a clear trend | MACD DIF breaks above zero, signaling a bullish trend | EMA5 > EMA8 > EMA13, bullish alignment | KDJ is strong, with bulls in control (K: 78.5, D: 66.1) | Volume surge (6.2x)
════════════════════
🔔 Follow for first-hand market movement alerts 🔔
#技术分析 #CSOPSKHYNIX2L #SAMSUNG #EWY
📌 When trading, check whether the candlestick pattern matches
$CSOPSKHYNIX2L / $SAMSUNG / $EWY 4-hour resonance shifts bullish, with bullish signals appearing simultaneously🔥
════════════════════
🔴 $CSOPSKHYNIX2L 4-hour bullish signal
⚠️Technical analysis: ADX(31) indicates a clear trend | MACD DIF breaks above zero, signaling a bullish trend | EMA5 > EMA8 > EMA13, bullish alignment | KDJ is strong, with bulls in control (K: 80.6, D: 73.9) | Volume surge (6.9x)
════════════════════
🔴 $SAMSUNG 4-hour bullish signal
⚠️Technical analysis: ADX(39) indicates a clear trend | MACD DIF breaks above zero, signaling a bullish trend | EMA5 > EMA8 > EMA13, bullish alignment | KDJ is strong, with bulls in control (K: 80.4, D: 67.1) | Volume surge (7.7x)
════════════════════
🔴 $EWY 4-hour bullish signal
⚠️Technical analysis: ADX(42) indicates a clear trend | MACD DIF breaks above zero, signaling a bullish trend | EMA5 > EMA8 > EMA13, bullish alignment | KDJ is strong, with bulls in control (K: 78.5, D: 66.1) | Volume surge (6.2x)
════════════════════
🔔 Follow for first-hand market movement alerts 🔔
#技术分析 #CSOPSKHYNIX2L #SAMSUNG #EWY
📌 When trading, check whether the candlestick pattern matches
════════════════════
🔴 $CSOPSKHYNIX2L 4-hour bullish signal
⚠️Technical analysis: ADX(31) indicates a clear trend | MACD DIF breaks above zero, signaling a bullish trend | EMA5 > EMA8 > EMA13, bullish alignment | KDJ is strong, with bulls in control (K: 80.6, D: 73.9) | Volume surge (6.9x)
════════════════════
🔴 $SAMSUNG 4-hour bullish signal
⚠️Technical analysis: ADX(39) indicates a clear trend | MACD DIF breaks above zero, signaling a bullish trend | EMA5 > EMA8 > EMA13, bullish alignment | KDJ is strong, with bulls in control (K: 80.4, D: 67.1) | Volume surge (7.7x)
════════════════════
🔴 $EWY 4-hour bullish signal
⚠️Technical analysis: ADX(42) indicates a clear trend | MACD DIF breaks above zero, signaling a bullish trend | EMA5 > EMA8 > EMA13, bullish alignment | KDJ is strong, with bulls in control (K: 78.5, D: 66.1) | Volume surge (6.2x)
════════════════════
🔔 Follow for first-hand market movement alerts 🔔
#技术分析 #CSOPSKHYNIX2L #SAMSUNG #EWY
📌 When trading, check whether the candlestick pattern matches
8
·
--
$EWY Watch resistance first: 159.52.
Current price: 159.42; support below at 159.22.
Inflows are dominant, so be more cautious about chasing shorts.
Bullish bias, wait and see: revisit 159.22 before deciding.
Key levels (4h):
· Key resistance above: 159.52 (swept · distance +0.06%)
· Key support below: 159.22 (swept · distance -0.13%)
· Demand zone below: 154.25-158.54, midpoint 156.39
· Bullish support band: 153.01-153.67
· Supply zone above: 157.8-159.85, midpoint 158.82
· Bearish resistance band: 160.99-162.64
Recorded on November 2, 2026
For reference only; this is not investment advice. You are responsible for your own gains and losses.
Let's leave it here for now and review once it plays out.
$EWY #EWY #看盘 #ETH
$EWY Watch resistance first: 159.52.
Current price: 159.42; support below at 159.22.
Inflows are dominant, so be more cautious about chasing shorts.
Bullish bias, wait and see: revisit 159.22 before deciding.
Key levels (4h):
· Key resistance above: 159.52 (swept · distance +0.06%)
· Key support below: 159.22 (swept · distance -0.13%)
· Demand zone below: 154.25-158.54, midpoint 156.39
· Bullish support band: 153.01-153.67
· Supply zone above: 157.8-159.85, midpoint 158.82
· Bearish resistance band: 160.99-162.64
Recorded on November 2, 2026
For reference only; this is not investment advice. You are responsible for your own gains and losses.
Let's leave it here for now and review once it plays out.
$EWY #EWY #看盘 #ETH
Current price: 159.42; support below at 159.22.
Inflows are dominant, so be more cautious about chasing shorts.
Bullish bias, wait and see: revisit 159.22 before deciding.
Key levels (4h):
· Key resistance above: 159.52 (swept · distance +0.06%)
· Key support below: 159.22 (swept · distance -0.13%)
· Demand zone below: 154.25-158.54, midpoint 156.39
· Bullish support band: 153.01-153.67
· Supply zone above: 157.8-159.85, midpoint 158.82
· Bearish resistance band: 160.99-162.64
Recorded on November 2, 2026
For reference only; this is not investment advice. You are responsible for your own gains and losses.
Let's leave it here for now and review once it plays out.
$EWY #EWY #看盘 #ETH
3
Log in to explore more content
Join global crypto users on Binance Square
⚡️ Get latest and useful information about crypto.
💬 Trusted by the world’s largest crypto exchange.
👍 Discover real insights from verified creators.
Email / Phone number
Trending Topics
1
#BitcoinFiveWeeklyLosses
41 views
50 Discussing
2
#AIChipSlumpNasdaq
21 views
37 Discussing
3
#BinanceReopensWithdrawalsForHYPE&APT
133,917 views
1,101 Discussing
4
#SouthKoreaDraftLawTargets15To20%ShareholderCap
132,756 views
733 Discussing
5
#TradFiForBeginners
211,241 views
1,964 Discussing
6
#KeplrAdvisesSocialLoginUsersToTransferAssets
63,295 views
560 Discussing
7
#TetherPlans€28.8MForJuventusCapitalIncrease
48,880 views
425 Discussing
8
#JobsReportRaisesHikeOdds
940,648 views
4,513 Discussing
9
#CPITestsDecemberRateOutlook
408,311 views
1,940 Discussing
10
#US Data Center Rules May Constrain AI Expansion
144,003 views
260 Discussing