
#tsm
tsm
54,027 views
537 Discussing
Hot
Latest

·
--
$TSM #TSM
Unusual Activity Alert: Short-Selling Alert | TSM
TSM on the 15m chart shows a 1h bearish anomaly to watch; 1h volume is starting to pick up.
Key signals: 1h trading volume 4.2x / 4h trading volume 5.0x / 1h candle has a weak body and closes lower / breaks below the 1h 20-period low / breaks below the 1h 55-period low / 1h price falls below VWAP
1h trading volume: 4.2x
24h trading volume: 46.5M USDT
Funding rate: +0.0420% (longs pay, shorts receive)
Score: 12/12
Key short-term level: Breakdown level 352.99
Invalidation level: 377.44
Levels to watch below: 317.69 / 282.39
Technical tracking. Manage risk carefully.
$TSM #TSM
Unusual Activity Alert: Short-Selling Alert | TSM
TSM on the 15m chart shows a 1h bearish anomaly to watch; 1h volume is starting to pick up.
Key signals: 1h trading volume 4.2x / 4h trading volume 5.0x / 1h candle has a weak body and closes lower / breaks below the 1h 20-period low / breaks below the 1h 55-period low / 1h price falls below VWAP
1h trading volume: 4.2x
24h trading volume: 46.5M USDT
Funding rate: +0.0420% (longs pay, shorts receive)
Score: 12/12
Key short-term level: Breakdown level 352.99
Invalidation level: 377.44
Levels to watch below: 317.69 / 282.39
Technical tracking. Manage risk carefully.
Unusual Activity Alert: Short-Selling Alert | TSM
TSM on the 15m chart shows a 1h bearish anomaly to watch; 1h volume is starting to pick up.
Key signals: 1h trading volume 4.2x / 4h trading volume 5.0x / 1h candle has a weak body and closes lower / breaks below the 1h 20-period low / breaks below the 1h 55-period low / 1h price falls below VWAP
1h trading volume: 4.2x
24h trading volume: 46.5M USDT
Funding rate: +0.0420% (longs pay, shorts receive)
Score: 12/12
Key short-term level: Breakdown level 352.99
Invalidation level: 377.44
Levels to watch below: 317.69 / 282.39
Technical tracking. Manage risk carefully.
450

·
--
$TSM 🔴 (SELL)
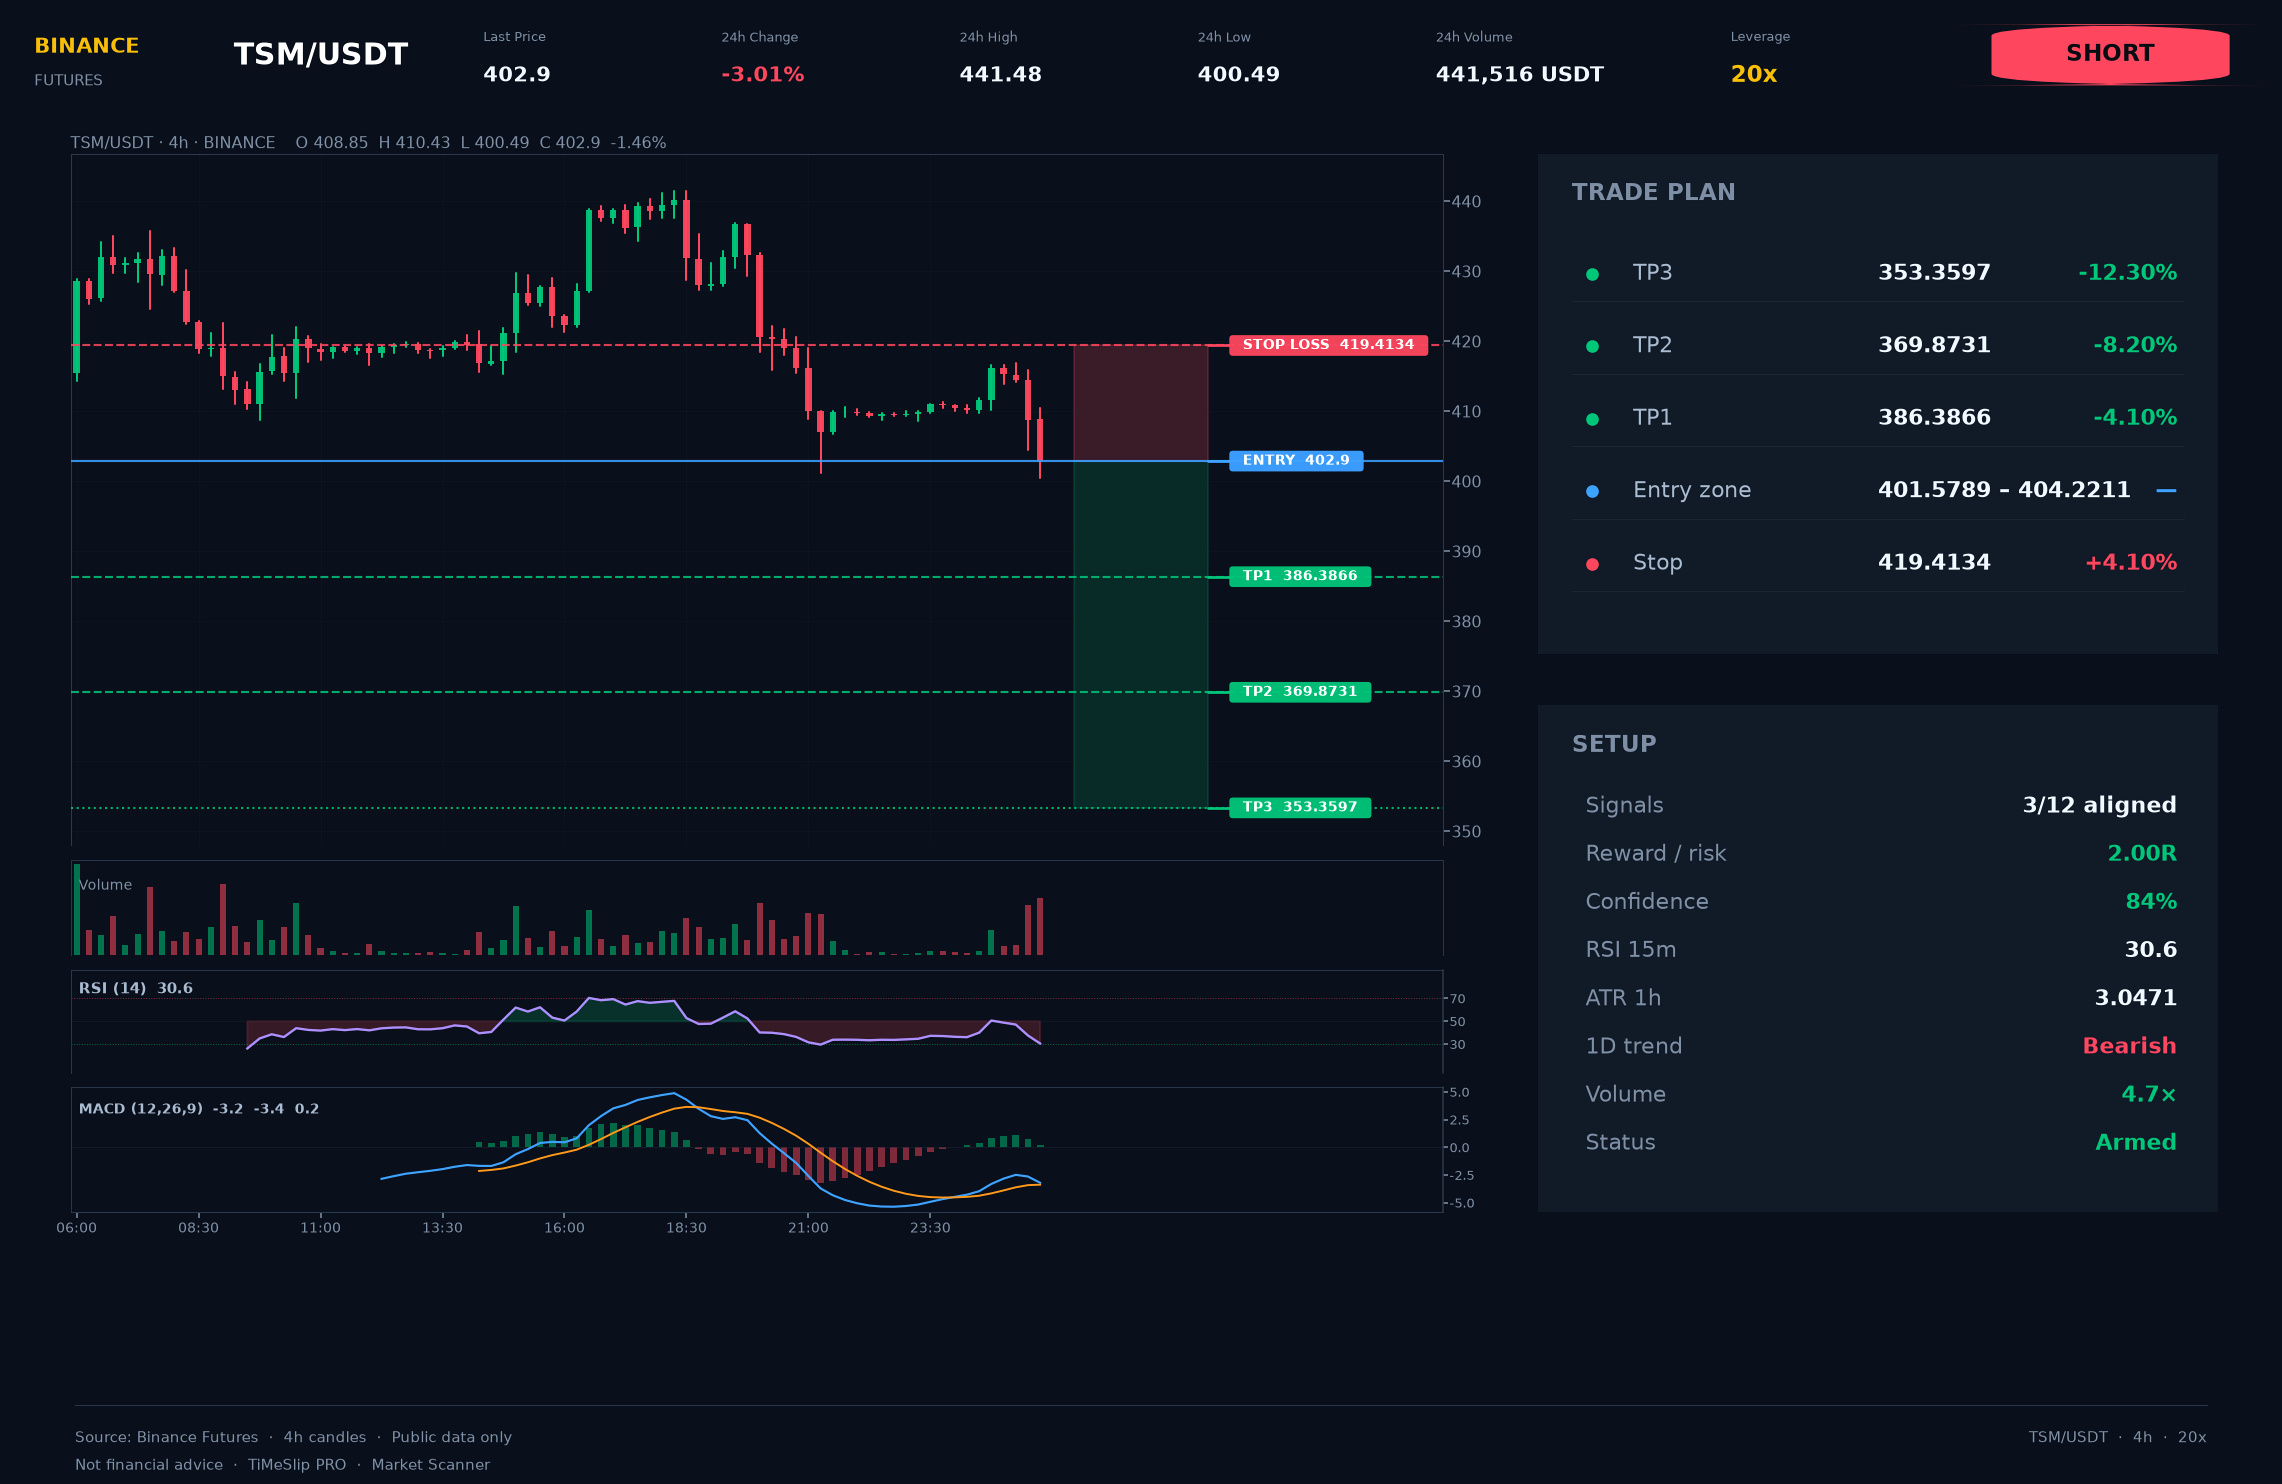
ENTRY: 402.900
STOP: 419.413
• TP1: 386.387
• TP2: 369.873
• TP3: 353.360
💡 Tip: after reaching TP1, move the stop to break-even.
Base scenario for TSM: it declines while the breakout level acts as resistance. If it recovers, the plan is invalidated.
Technical setup rating — 84/100. This is a calculation of structure/risk, not a guarantee of profit. ⚡ Moderate risk (4.10%): stay disciplined.
Clean break below 410.328, with the former support rebounding as resistance. Risk: 4.10%. TFs: 8h, 12h, 1d. ATR(14): 3.0471.
🔥 Notable volume spike (4.7× above average).
🚀 Join the trading community — more actionable ideas ahead!
All information is for analytical purposes only. You decide and assume the risk of your trades.
#TSM #TSMNews $TSM 👈 Tap to trade
$TSM 🔴 (SELL)
ENTRY: 402.900
STOP: 419.413
• TP1: 386.387
• TP2: 369.873
• TP3: 353.360
💡 Tip: after reaching TP1, move the stop to break-even.
Base scenario for TSM: it declines while the breakout level acts as resistance. If it recovers, the plan is invalidated.
Technical setup rating — 84/100. This is a calculation of structure/risk, not a guarantee of profit. ⚡ Moderate risk (4.10%): stay disciplined.
Clean break below 410.328, with the former support rebounding as resistance. Risk: 4.10%. TFs: 8h, 12h, 1d. ATR(14): 3.0471.
🔥 Notable volume spike (4.7× above average).
🚀 Join the trading community — more actionable ideas ahead!
All information is for analytical purposes only. You decide and assume the risk of your trades.
#TSM #TSMNews $TSM 👈 Tap to trade
ENTRY: 402.900
STOP: 419.413
• TP1: 386.387
• TP2: 369.873
• TP3: 353.360
💡 Tip: after reaching TP1, move the stop to break-even.
Base scenario for TSM: it declines while the breakout level acts as resistance. If it recovers, the plan is invalidated.
Technical setup rating — 84/100. This is a calculation of structure/risk, not a guarantee of profit. ⚡ Moderate risk (4.10%): stay disciplined.
Clean break below 410.328, with the former support rebounding as resistance. Risk: 4.10%. TFs: 8h, 12h, 1d. ATR(14): 3.0471.
🔥 Notable volume spike (4.7× above average).
🚀 Join the trading community — more actionable ideas ahead!
All information is for analytical purposes only. You decide and assume the risk of your trades.
#TSM #TSMNews $TSM 👈 Tap to trade
8

·
--
3 four-hour bearish alerts: $LITE / $FLNC / $TSM🔥
════════════════════
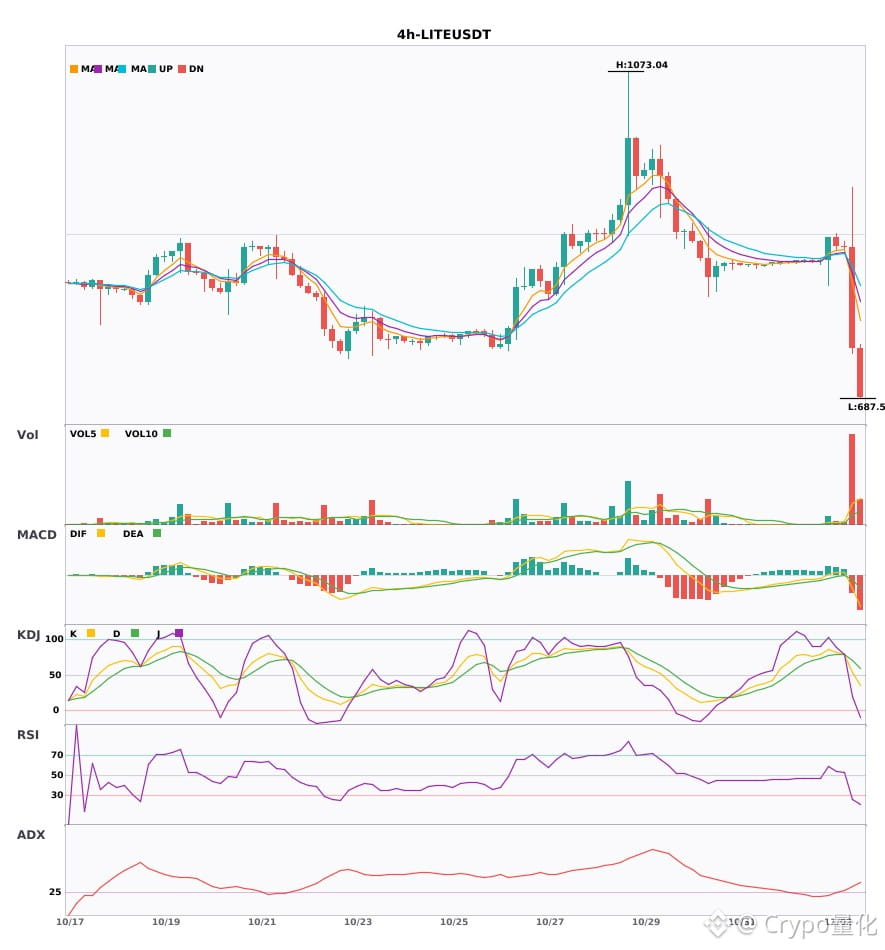
🟢 $LITE 4-hour bearish signal
⚠️Technical analysis: ADX(37) indicates a clear trend | MACD bearish crossover below zero, bearish momentum accelerating | EMA5 crossed below EMA8, turning bearish short-term | KDJ bearish crossover, bearish short-term (K: 53.5, D: 70.2) | Volume surge (8.5x)
════════════════════
🟢 $FLNC 4-hour bearish signal
⚠️Technical analysis: ADX(38) indicates a clear trend | MACD bearish crossover below zero, bearish momentum accelerating | EMA5 crossed below EMA8, turning bearish short-term | KDJ bearish crossover, bearish short-term (K: 62.4, D: 65.9) | Volume surge (9.2x)
════════════════════
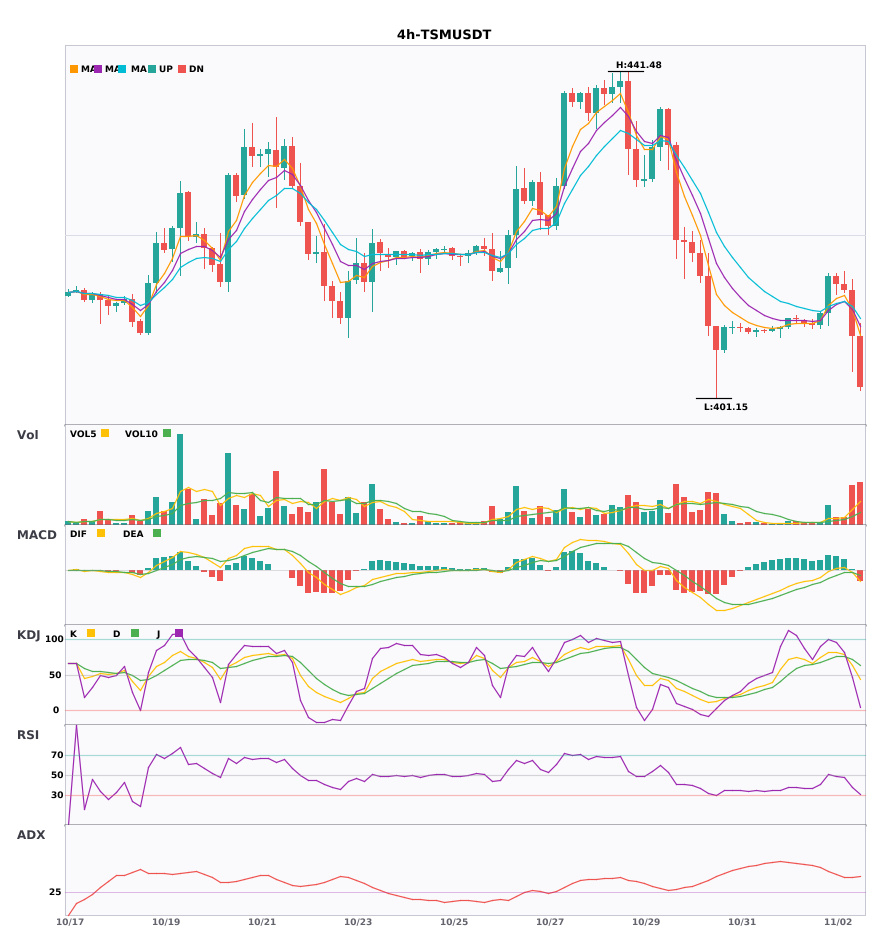
🟢 $TSM 4-hour bearish signal
⚠️Technical analysis: ADX(44) indicates a clear trend | MACD DIF fell below zero, trend turning bearish | EMA5 crossed below EMA8, turning bearish short-term | KDJ bearish crossover, bearish short-term (K: 63.8, D: 72.3) | Volume surge (4.4x)
════════════════════
🔔 Follow for first-hand market alerts 🔔
#技术分析 #LITE #FLNC #TSM
📌 When trading, pay attention to whether the candlestick pattern confirms the signal
3 four-hour bearish alerts: $LITE / $FLNC / $TSM 🔥
════════════════════
🟢 $LITE 4-hour bearish signal
⚠️Technical analysis: ADX(37) indicates a clear trend | MACD bearish crossover below zero, bearish momentum accelerating | EMA5 crossed below EMA8, turning bearish short-term | KDJ bearish crossover, bearish short-term (K: 53.5, D: 70.2) | Volume surge (8.5x)
════════════════════
🟢 $FLNC 4-hour bearish signal
⚠️Technical analysis: ADX(38) indicates a clear trend | MACD bearish crossover below zero, bearish momentum accelerating | EMA5 crossed below EMA8, turning bearish short-term | KDJ bearish crossover, bearish short-term (K: 62.4, D: 65.9) | Volume surge (9.2x)
════════════════════
🟢 $TSM 4-hour bearish signal
⚠️Technical analysis: ADX(44) indicates a clear trend | MACD DIF fell below zero, trend turning bearish | EMA5 crossed below EMA8, turning bearish short-term | KDJ bearish crossover, bearish short-term (K: 63.8, D: 72.3) | Volume surge (4.4x)
════════════════════
🔔 Follow for first-hand market alerts 🔔
#技术分析 #LITE #FLNC #TSM
📌 When trading, pay attention to whether the candlestick pattern confirms the signal
════════════════════
🟢 $LITE 4-hour bearish signal
⚠️Technical analysis: ADX(37) indicates a clear trend | MACD bearish crossover below zero, bearish momentum accelerating | EMA5 crossed below EMA8, turning bearish short-term | KDJ bearish crossover, bearish short-term (K: 53.5, D: 70.2) | Volume surge (8.5x)
════════════════════
🟢 $FLNC 4-hour bearish signal
⚠️Technical analysis: ADX(38) indicates a clear trend | MACD bearish crossover below zero, bearish momentum accelerating | EMA5 crossed below EMA8, turning bearish short-term | KDJ bearish crossover, bearish short-term (K: 62.4, D: 65.9) | Volume surge (9.2x)
════════════════════
🟢 $TSM 4-hour bearish signal
⚠️Technical analysis: ADX(44) indicates a clear trend | MACD DIF fell below zero, trend turning bearish | EMA5 crossed below EMA8, turning bearish short-term | KDJ bearish crossover, bearish short-term (K: 63.8, D: 72.3) | Volume surge (4.4x)
════════════════════
🔔 Follow for first-hand market alerts 🔔
#技术分析 #LITE #FLNC #TSM
📌 When trading, pay attention to whether the candlestick pattern confirms the signal
10

·
--
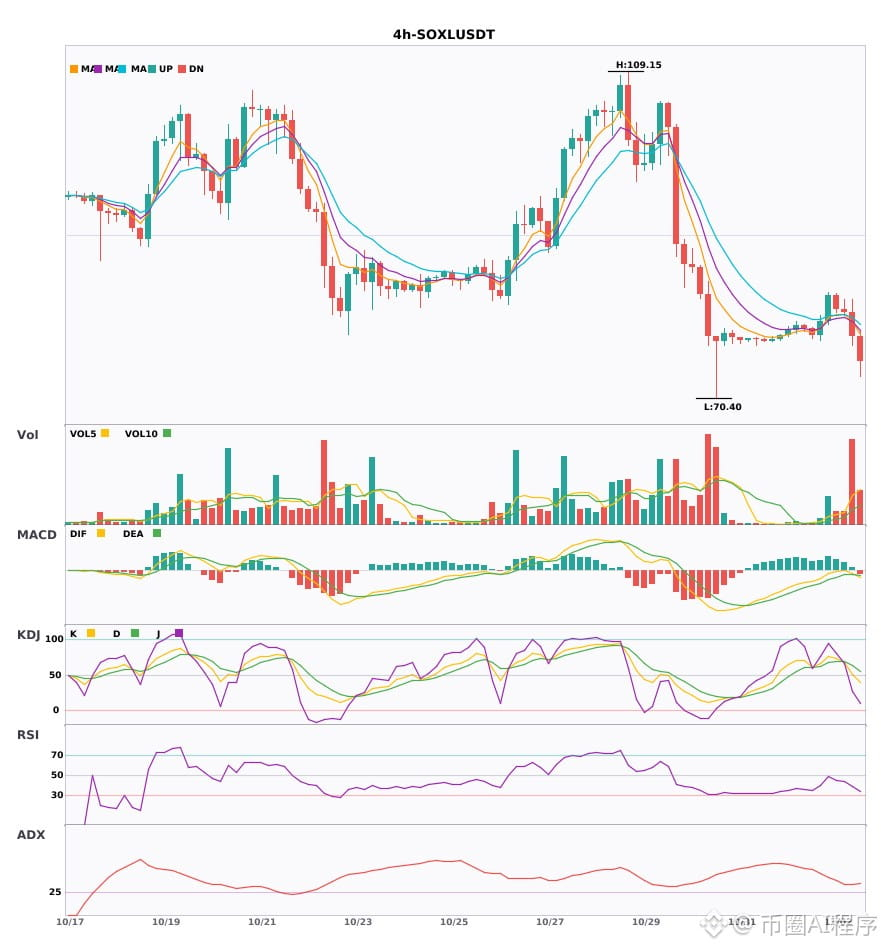
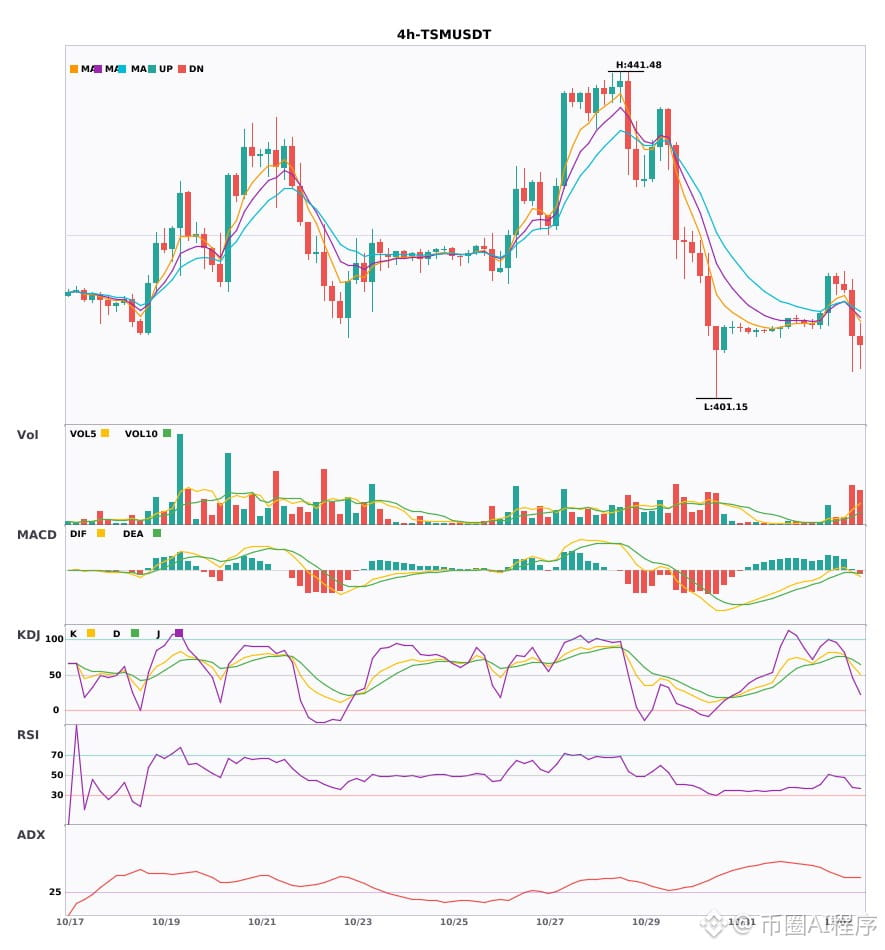
$FET / $SOXL / $TSM 4-hour bearish + daily bearish in the same direction; multi-timeframe resonance confirms a bearish turn 🔥
════════════════════
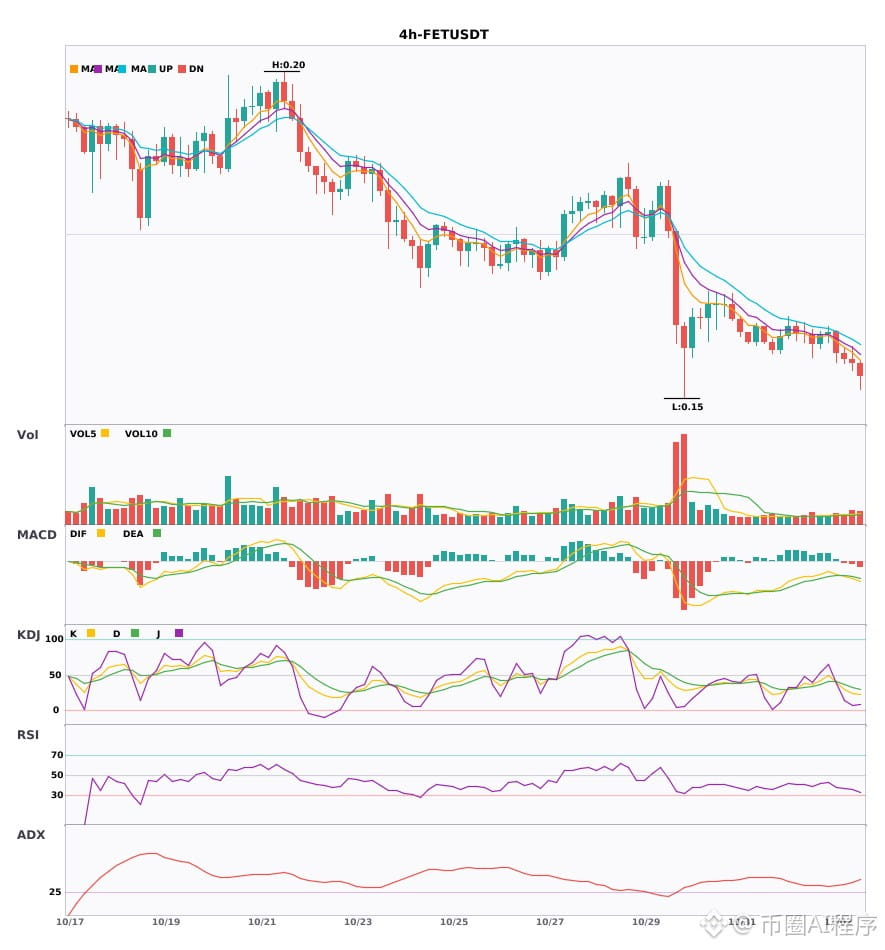
🟢 $FET 4-hour bearish signal
⚠️ Technicals: Daily bearish resonance confirmed | 4-hour entry: MACD bearish crossover below zero, bearish momentum accelerating | EMA5 < EMA8 < EMA13, bearish alignment | KDJ weak, bears in control (K=29.3, D=36.8) | Volume normal (1.2x)
════════════════════
🟢 $SOXL 4-hour bearish signal
⚠️ Technicals: Daily bearish resonance confirmed | 4-hour entry: EMA5 crossed below EMA8, short-term outlook turns bearish | KDJ strong, bulls in control (K=50.9, D=62.7) | Volume surge (5.4x)
════════════════════
🟢 $TSM 4-hour bearish signal
⚠️ Technicals: Daily bearish resonance confirmed | 4-hour entry: MACD DIF fell below the zero line, trend turns bearish | EMA5 crossed below EMA8, short-term outlook turns bearish | KDJ bearish crossover, short-term outlook bearish (K=63.8, D=72.3) | Volume surge (4.4x)
════════════════════
🔔 Follow for first-hand market alerts 🔔
#多周期共振 #FET #SOXL #TSM
📌 When trading, pay attention to whether the candlestick patterns align
$FET / $SOXL / $TSM 4-hour bearish + daily bearish in the same direction; multi-timeframe resonance confirms a bearish turn 🔥
════════════════════
🟢 $FET 4-hour bearish signal
⚠️ Technicals: Daily bearish resonance confirmed | 4-hour entry: MACD bearish crossover below zero, bearish momentum accelerating | EMA5 < EMA8 < EMA13, bearish alignment | KDJ weak, bears in control (K=29.3, D=36.8) | Volume normal (1.2x)
════════════════════
🟢 $SOXL 4-hour bearish signal
⚠️ Technicals: Daily bearish resonance confirmed | 4-hour entry: EMA5 crossed below EMA8, short-term outlook turns bearish | KDJ strong, bulls in control (K=50.9, D=62.7) | Volume surge (5.4x)
════════════════════
🟢 $TSM 4-hour bearish signal
⚠️ Technicals: Daily bearish resonance confirmed | 4-hour entry: MACD DIF fell below the zero line, trend turns bearish | EMA5 crossed below EMA8, short-term outlook turns bearish | KDJ bearish crossover, short-term outlook bearish (K=63.8, D=72.3) | Volume surge (4.4x)
════════════════════
🔔 Follow for first-hand market alerts 🔔
#多周期共振 #FET #SOXL #TSM
📌 When trading, pay attention to whether the candlestick patterns align
════════════════════
🟢 $FET 4-hour bearish signal
⚠️ Technicals: Daily bearish resonance confirmed | 4-hour entry: MACD bearish crossover below zero, bearish momentum accelerating | EMA5 < EMA8 < EMA13, bearish alignment | KDJ weak, bears in control (K=29.3, D=36.8) | Volume normal (1.2x)
════════════════════
🟢 $SOXL 4-hour bearish signal
⚠️ Technicals: Daily bearish resonance confirmed | 4-hour entry: EMA5 crossed below EMA8, short-term outlook turns bearish | KDJ strong, bulls in control (K=50.9, D=62.7) | Volume surge (5.4x)
════════════════════
🟢 $TSM 4-hour bearish signal
⚠️ Technicals: Daily bearish resonance confirmed | 4-hour entry: MACD DIF fell below the zero line, trend turns bearish | EMA5 crossed below EMA8, short-term outlook turns bearish | KDJ bearish crossover, short-term outlook bearish (K=63.8, D=72.3) | Volume surge (4.4x)
════════════════════
🔔 Follow for first-hand market alerts 🔔
#多周期共振 #FET #SOXL #TSM
📌 When trading, pay attention to whether the candlestick patterns align
73
·
--
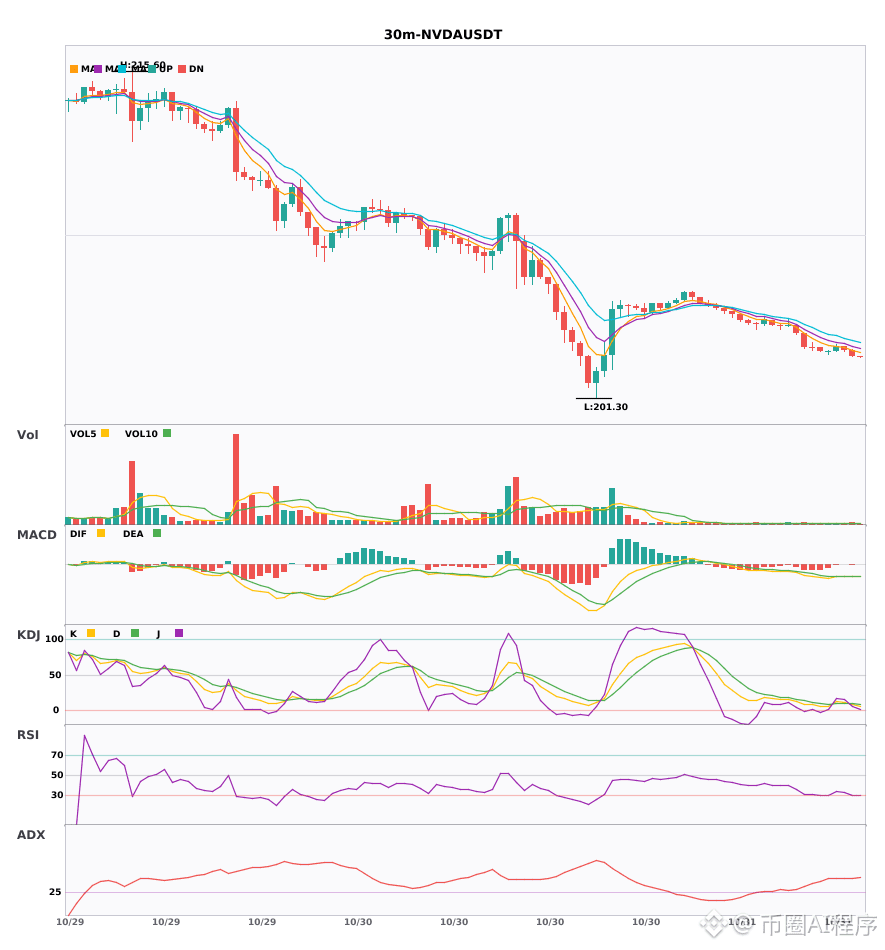
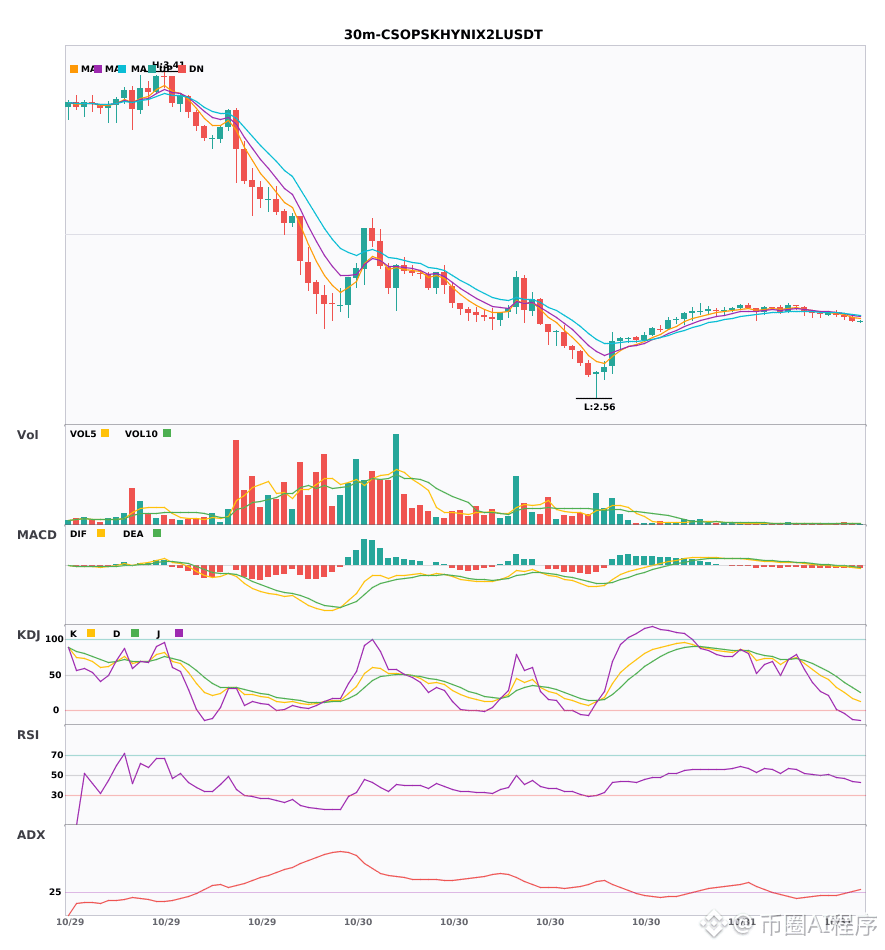
$NVDA / $CSOPSKHYNIX2L / $TSM 30-minute short signals, confirmed by the 4-hour bearish trend 🔥
════════════════════
🟢 $NVDA 30-minute Short Signal
⚠️Technical Analysis: 4-hour bearish confluence confirmed | 30-minute entry: MACD bearish crossover below zero, bearish momentum accelerating | EMA5 < EMA8 < EMA13, bearish alignment | KDJ bearish crossover, short-term outlook bearish (K: 8.5, D: 10.0) | Volume increased (1.6x)
════════════════════
🟢 $CSOPSKHYNIX2L 30-minute Short Signal
⚠️Technical Analysis: 4-hour bearish confluence confirmed | 30-minute entry: MACD bearish, trend weak, momentum strengthening | EMA5 < EMA8 < EMA13, bearish alignment | KDJ moving weakly, bears in control (K: 25.5, D: 40.1) | Volume increased (1.7x)
════════════════════
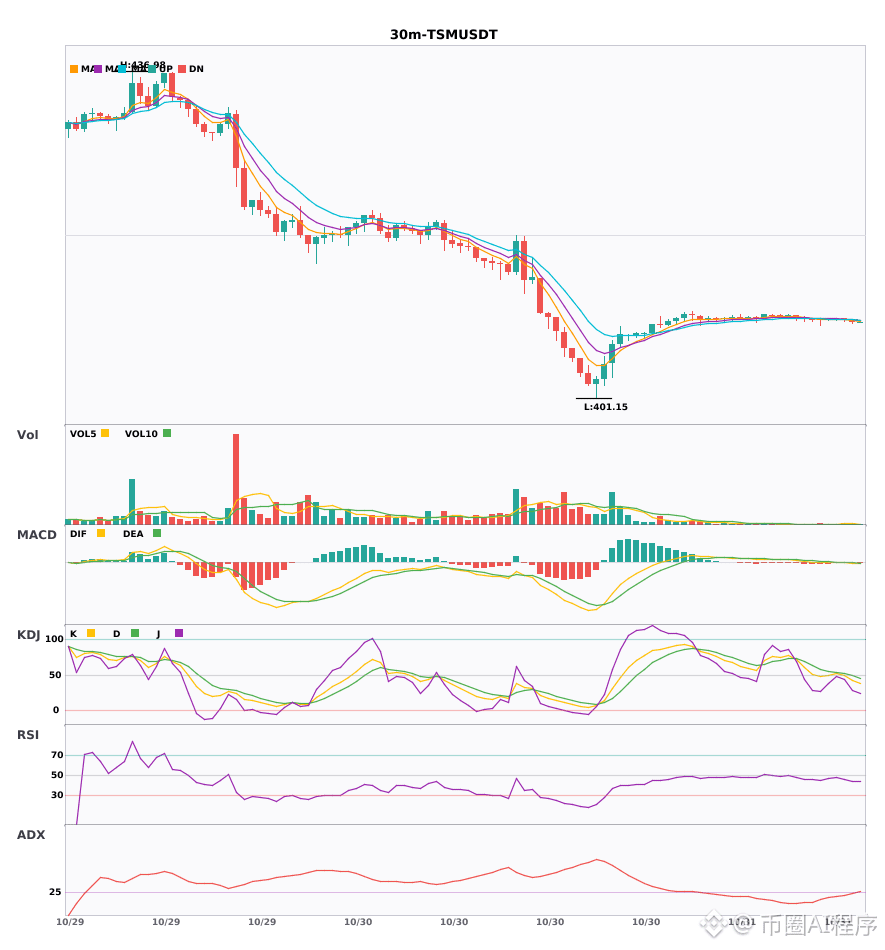
🟢 $TSM 30-minute Short Signal
⚠️Technical Analysis: 4-hour bearish confluence confirmed | 30-minute entry: MACD bearish, trend weak, momentum weakening | EMA5 < EMA8 < EMA13, bearish alignment | Volume increased (2.3x)
════════════════════
🔔 Follow for first-hand market alerts 🔔
#多周期共振 #NVDA #CSOPSKHYNIX2L #TSM
📌 When trading, pay attention to whether the candlestick pattern confirms the signal
$NVDA / $CSOPSKHYNIX2L / $TSM 30-minute short signals, confirmed by the 4-hour bearish trend 🔥
════════════════════
🟢 $NVDA 30-minute Short Signal
⚠️Technical Analysis: 4-hour bearish confluence confirmed | 30-minute entry: MACD bearish crossover below zero, bearish momentum accelerating | EMA5 < EMA8 < EMA13, bearish alignment | KDJ bearish crossover, short-term outlook bearish (K: 8.5, D: 10.0) | Volume increased (1.6x)
════════════════════
🟢 $CSOPSKHYNIX2L 30-minute Short Signal
⚠️Technical Analysis: 4-hour bearish confluence confirmed | 30-minute entry: MACD bearish, trend weak, momentum strengthening | EMA5 < EMA8 < EMA13, bearish alignment | KDJ moving weakly, bears in control (K: 25.5, D: 40.1) | Volume increased (1.7x)
════════════════════
🟢 $TSM 30-minute Short Signal
⚠️Technical Analysis: 4-hour bearish confluence confirmed | 30-minute entry: MACD bearish, trend weak, momentum weakening | EMA5 < EMA8 < EMA13, bearish alignment | Volume increased (2.3x)
════════════════════
🔔 Follow for first-hand market alerts 🔔
#多周期共振 #NVDA #CSOPSKHYNIX2L #TSM
📌 When trading, pay attention to whether the candlestick pattern confirms the signal
════════════════════
🟢 $NVDA 30-minute Short Signal
⚠️Technical Analysis: 4-hour bearish confluence confirmed | 30-minute entry: MACD bearish crossover below zero, bearish momentum accelerating | EMA5 < EMA8 < EMA13, bearish alignment | KDJ bearish crossover, short-term outlook bearish (K: 8.5, D: 10.0) | Volume increased (1.6x)
════════════════════
🟢 $CSOPSKHYNIX2L 30-minute Short Signal
⚠️Technical Analysis: 4-hour bearish confluence confirmed | 30-minute entry: MACD bearish, trend weak, momentum strengthening | EMA5 < EMA8 < EMA13, bearish alignment | KDJ moving weakly, bears in control (K: 25.5, D: 40.1) | Volume increased (1.7x)
════════════════════
🟢 $TSM 30-minute Short Signal
⚠️Technical Analysis: 4-hour bearish confluence confirmed | 30-minute entry: MACD bearish, trend weak, momentum weakening | EMA5 < EMA8 < EMA13, bearish alignment | Volume increased (2.3x)
════════════════════
🔔 Follow for first-hand market alerts 🔔
#多周期共振 #NVDA #CSOPSKHYNIX2L #TSM
📌 When trading, pay attention to whether the candlestick pattern confirms the signal
14
·
--
$RSR / $ALLO / $TSM 30-minute short + 4-hour short aligned; multi-timeframe convergence signals a bearish turn 🔥
════════════════════
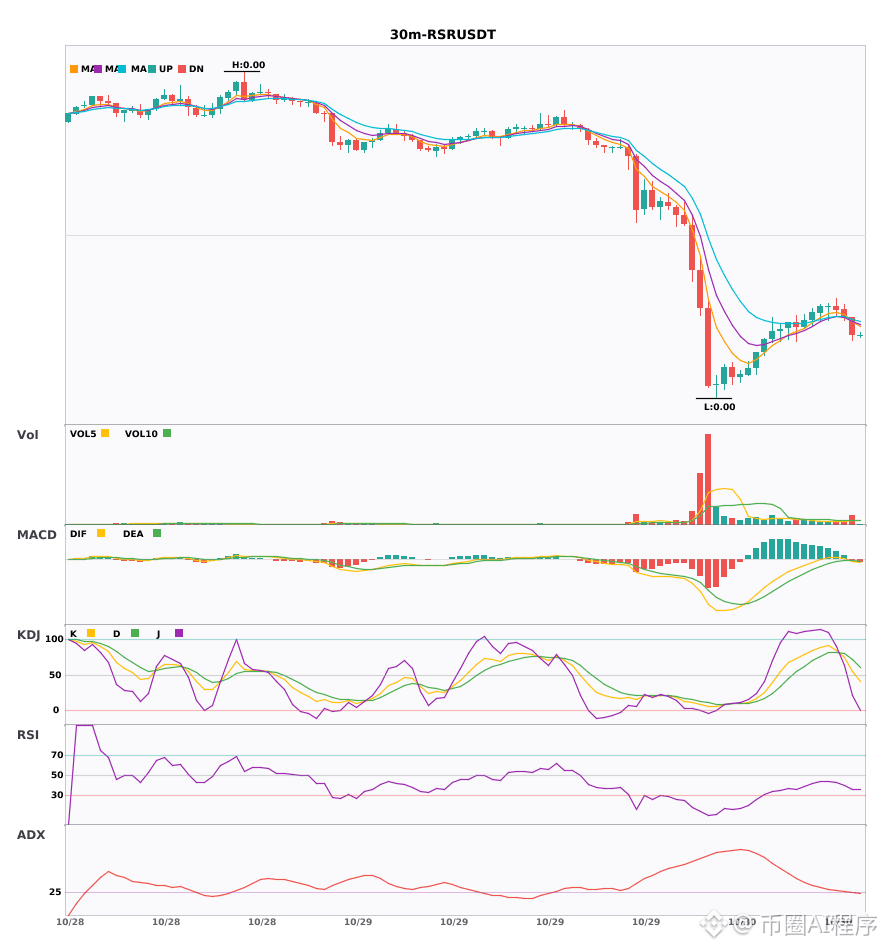
🟢 $RSR 30-minute short signal
⚠️Technical analysis: 4-hour bearish convergence confirmed | 30-minute entry: MACD dead cross below zero, bearish momentum accelerating | EMA5 crosses below EMA8, turning bearish in the short term | KDJ trending strongly, bulls have the advantage (K: 54.3, D: 71.1) | Volume increased (2.0x)
════════════════════
🟢 $ALLO 30-minute short signal
⚠️Technical analysis: 4-hour bearish convergence confirmed | 30-minute entry: MACD dead cross below zero, bearish momentum accelerating | EMA5 < EMA8 < EMA13, bearish alignment | KDJ trending weakly, bears have the advantage (K: 28.5, D: 31.7) | Volume increased (2.2x)
════════════════════
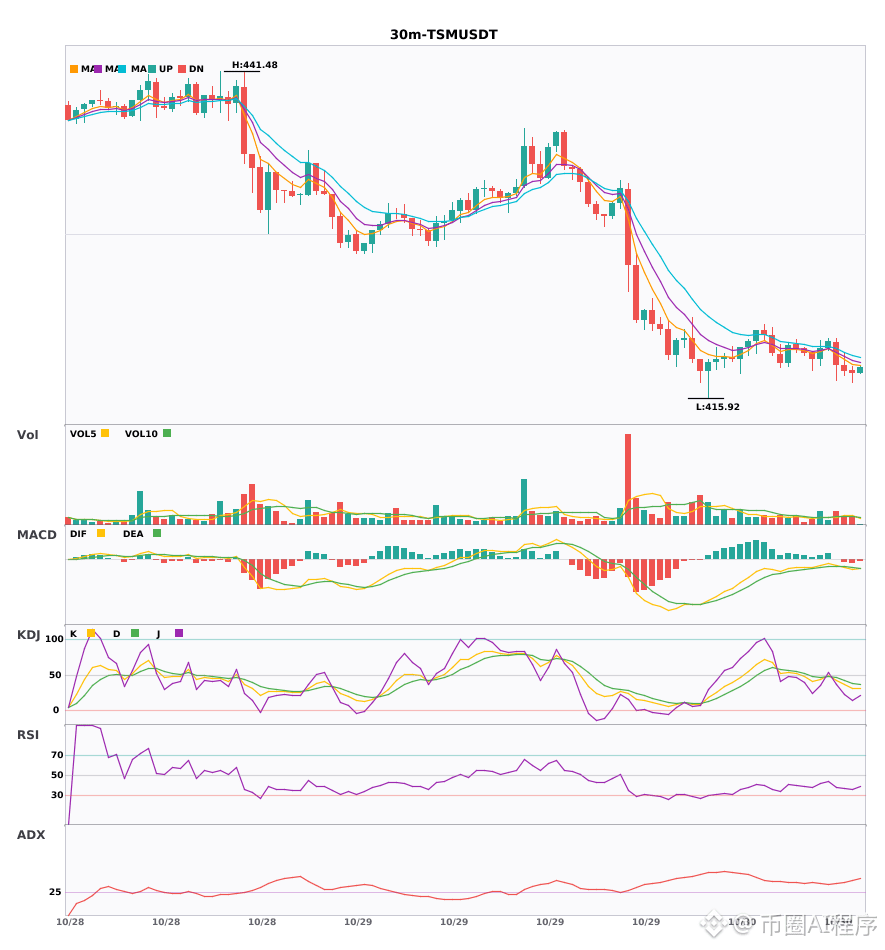
🟢 $TSM 30-minute short signal
⚠️Technical analysis: 4-hour bearish convergence confirmed | 30-minute entry: MACD dead cross below zero, bearish momentum accelerating | EMA5 < EMA8 < EMA13, bearish alignment | KDJ trending weakly, bears have the advantage (K: 36.1, D: 42.7) | Volume increased (1.7x)
════════════════════
🔔 Follow for first-hand updates on market movements 🔔
#多周期共振 #RSR #ALLO #TSM
📌 When trading, check whether the candlestick pattern matches
$RSR / $ALLO / $TSM 30-minute short + 4-hour short aligned; multi-timeframe convergence signals a bearish turn 🔥
════════════════════
🟢 $RSR 30-minute short signal
⚠️Technical analysis: 4-hour bearish convergence confirmed | 30-minute entry: MACD dead cross below zero, bearish momentum accelerating | EMA5 crosses below EMA8, turning bearish in the short term | KDJ trending strongly, bulls have the advantage (K: 54.3, D: 71.1) | Volume increased (2.0x)
════════════════════
🟢 $ALLO 30-minute short signal
⚠️Technical analysis: 4-hour bearish convergence confirmed | 30-minute entry: MACD dead cross below zero, bearish momentum accelerating | EMA5 < EMA8 < EMA13, bearish alignment | KDJ trending weakly, bears have the advantage (K: 28.5, D: 31.7) | Volume increased (2.2x)
════════════════════
🟢 $TSM 30-minute short signal
⚠️Technical analysis: 4-hour bearish convergence confirmed | 30-minute entry: MACD dead cross below zero, bearish momentum accelerating | EMA5 < EMA8 < EMA13, bearish alignment | KDJ trending weakly, bears have the advantage (K: 36.1, D: 42.7) | Volume increased (1.7x)
════════════════════
🔔 Follow for first-hand updates on market movements 🔔
#多周期共振 #RSR #ALLO #TSM
📌 When trading, check whether the candlestick pattern matches
════════════════════
🟢 $RSR 30-minute short signal
⚠️Technical analysis: 4-hour bearish convergence confirmed | 30-minute entry: MACD dead cross below zero, bearish momentum accelerating | EMA5 crosses below EMA8, turning bearish in the short term | KDJ trending strongly, bulls have the advantage (K: 54.3, D: 71.1) | Volume increased (2.0x)
════════════════════
🟢 $ALLO 30-minute short signal
⚠️Technical analysis: 4-hour bearish convergence confirmed | 30-minute entry: MACD dead cross below zero, bearish momentum accelerating | EMA5 < EMA8 < EMA13, bearish alignment | KDJ trending weakly, bears have the advantage (K: 28.5, D: 31.7) | Volume increased (2.2x)
════════════════════
🟢 $TSM 30-minute short signal
⚠️Technical analysis: 4-hour bearish convergence confirmed | 30-minute entry: MACD dead cross below zero, bearish momentum accelerating | EMA5 < EMA8 < EMA13, bearish alignment | KDJ trending weakly, bears have the advantage (K: 36.1, D: 42.7) | Volume increased (1.7x)
════════════════════
🔔 Follow for first-hand updates on market movements 🔔
#多周期共振 #RSR #ALLO #TSM
📌 When trading, check whether the candlestick pattern matches
22
·
--
$RSR / $ALLO / $TSM 30-minute timeframe bearish, short-term under pressure 🔥
════════════════════
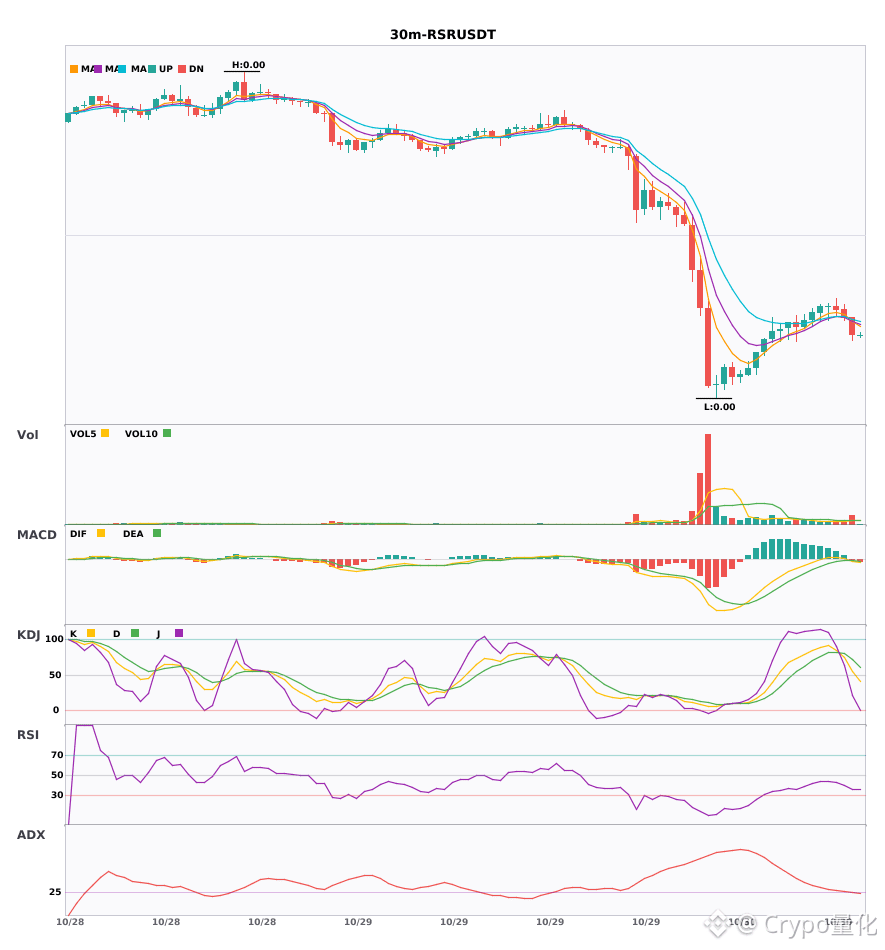
🟢 $RSR 30-minute bearish signal
⚠️ Technical analysis: ADX(27) Trend is forming; opportunity to participate | MACD bearish crossover below zero, bearish momentum accelerating | EMA5 crosses below EMA8, short-term trend turns bearish | KDJ moving strongly, bulls have the advantage (K is 54.3, D is 71.1) | Volume increased (2.0x)
════════════════════
🟢 $ALLO 30-minute bearish signal
⚠️ Technical analysis: ADX(41) Clear trending market | MACD bearish crossover below zero, bearish momentum accelerating | EMA5 below EMA8 below EMA13, bearish alignment | KDJ moving weakly, bears have the advantage (K is 28.5, D is 31.7) | Volume increased (2.2x)
════════════════════
🟢 $TSM 30-minute bearish signal
⚠️ Technical analysis: ADX(36) Clear trending market | MACD bearish crossover below zero, bearish momentum accelerating | EMA5 below EMA8 below EMA13, bearish alignment | KDJ moving weakly, bears have the advantage (K is 36.1, D is 42.7) | Volume increased (1.7x)
════════════════════
🔔 Follow for first-hand market alerts 🔔
#技术分析 #RSR #ALLO #TSM
📌 When trading, pay attention to whether the candlestick pattern confirms
$RSR / $ALLO / $TSM 30-minute timeframe bearish, short-term under pressure 🔥
════════════════════
🟢 $RSR 30-minute bearish signal
⚠️ Technical analysis: ADX(27) Trend is forming; opportunity to participate | MACD bearish crossover below zero, bearish momentum accelerating | EMA5 crosses below EMA8, short-term trend turns bearish | KDJ moving strongly, bulls have the advantage (K is 54.3, D is 71.1) | Volume increased (2.0x)
════════════════════
🟢 $ALLO 30-minute bearish signal
⚠️ Technical analysis: ADX(41) Clear trending market | MACD bearish crossover below zero, bearish momentum accelerating | EMA5 below EMA8 below EMA13, bearish alignment | KDJ moving weakly, bears have the advantage (K is 28.5, D is 31.7) | Volume increased (2.2x)
════════════════════
🟢 $TSM 30-minute bearish signal
⚠️ Technical analysis: ADX(36) Clear trending market | MACD bearish crossover below zero, bearish momentum accelerating | EMA5 below EMA8 below EMA13, bearish alignment | KDJ moving weakly, bears have the advantage (K is 36.1, D is 42.7) | Volume increased (1.7x)
════════════════════
🔔 Follow for first-hand market alerts 🔔
#技术分析 #RSR #ALLO #TSM
📌 When trading, pay attention to whether the candlestick pattern confirms
════════════════════
🟢 $RSR 30-minute bearish signal
⚠️ Technical analysis: ADX(27) Trend is forming; opportunity to participate | MACD bearish crossover below zero, bearish momentum accelerating | EMA5 crosses below EMA8, short-term trend turns bearish | KDJ moving strongly, bulls have the advantage (K is 54.3, D is 71.1) | Volume increased (2.0x)
════════════════════
🟢 $ALLO 30-minute bearish signal
⚠️ Technical analysis: ADX(41) Clear trending market | MACD bearish crossover below zero, bearish momentum accelerating | EMA5 below EMA8 below EMA13, bearish alignment | KDJ moving weakly, bears have the advantage (K is 28.5, D is 31.7) | Volume increased (2.2x)
════════════════════
🟢 $TSM 30-minute bearish signal
⚠️ Technical analysis: ADX(36) Clear trending market | MACD bearish crossover below zero, bearish momentum accelerating | EMA5 below EMA8 below EMA13, bearish alignment | KDJ moving weakly, bears have the advantage (K is 36.1, D is 42.7) | Volume increased (1.7x)
════════════════════
🔔 Follow for first-hand market alerts 🔔
#技术分析 #RSR #ALLO #TSM
📌 When trading, pay attention to whether the candlestick pattern confirms
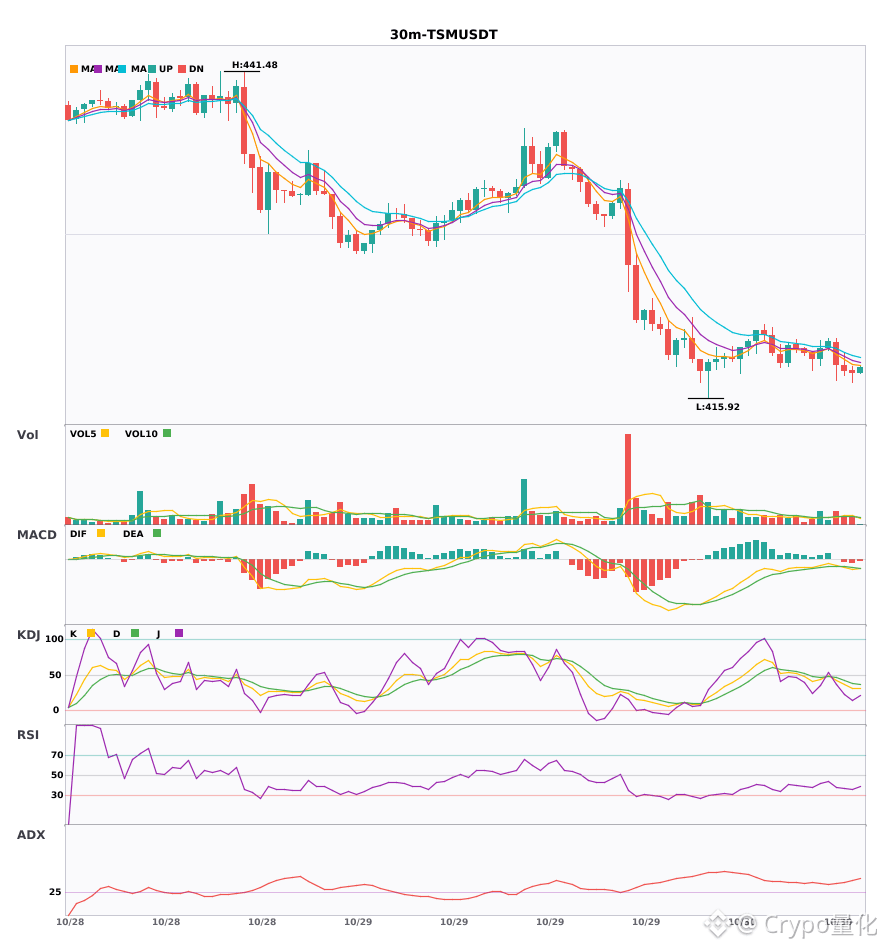
11
·
--
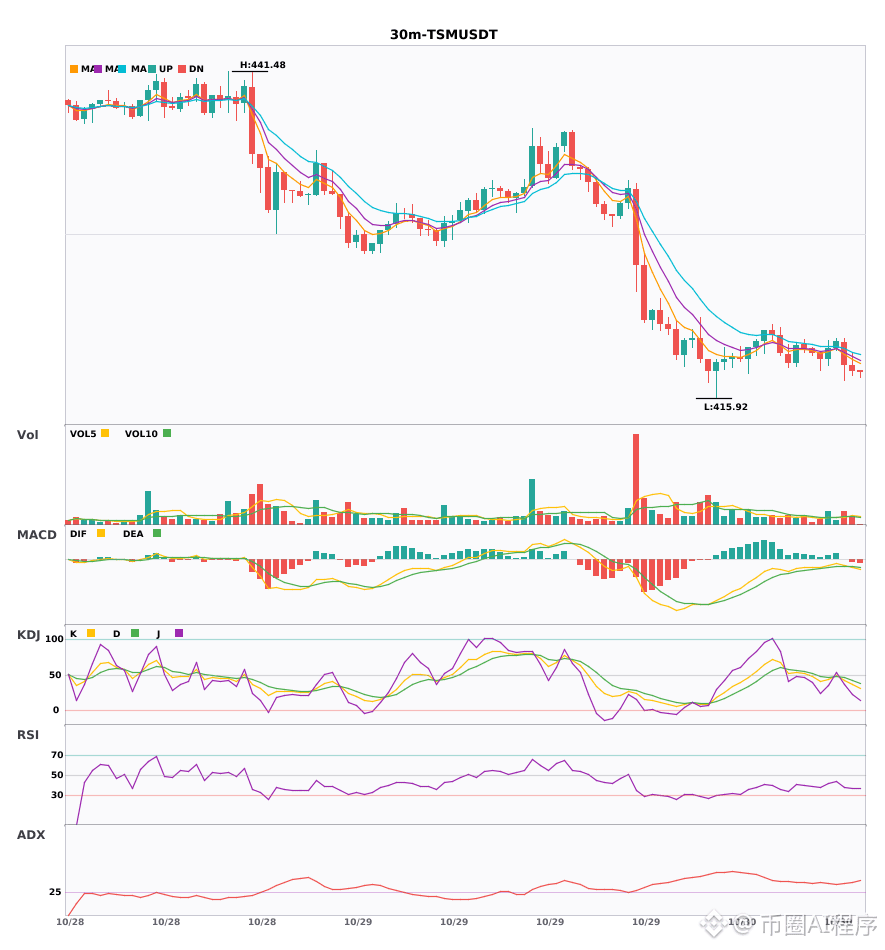
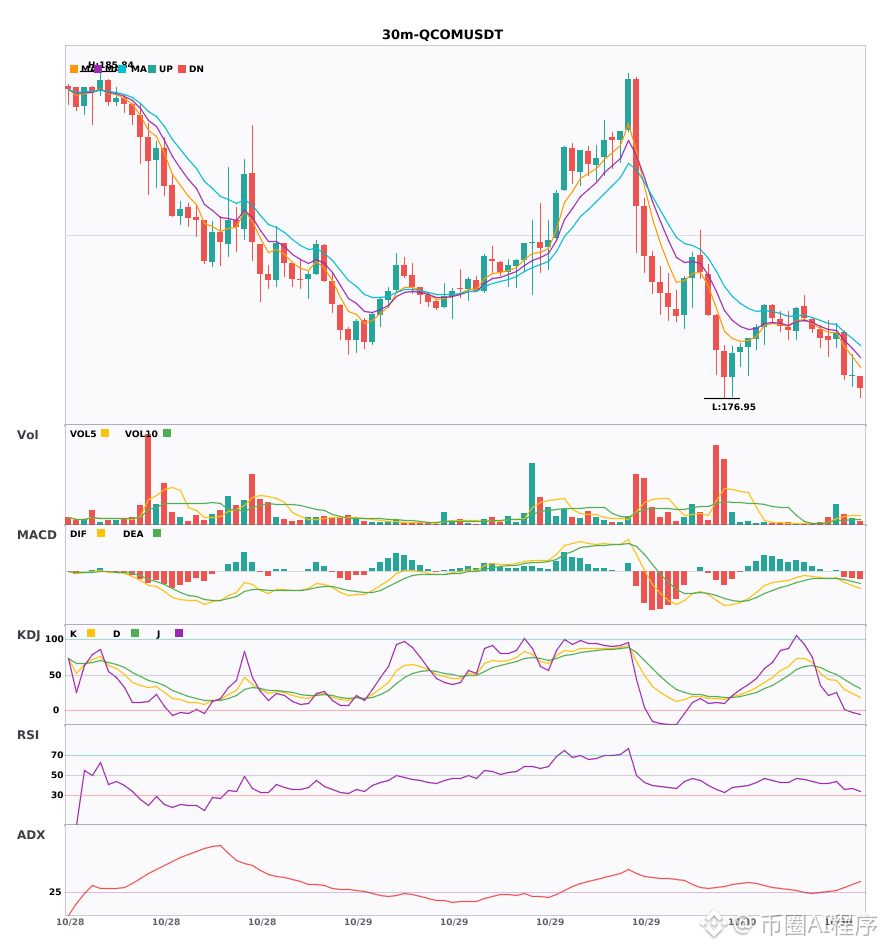
Multi-timeframe confluence: 30-minute bearish signals on 3 coins + 4-hour bearish trend confirmation 🔥
════════════════════
🟢 $Q 30-minute bearish signal
⚠️Technical analysis: 4-hour bearish confluence confirmed | 30-minute entry: MACD bearish, trend weak, momentum strengthening | EMA5 < EMA8 < EMA13 bearish alignment | Normal volume (1.2x)
════════════════════
🟢 $TSM 30-minute bearish signal
⚠️Technical analysis: 4-hour bearish confluence confirmed | 30-minute entry: MACD bearish crossover below zero, bearish momentum accelerating | EMA5 < EMA8 < EMA13 bearish alignment | KDJ showing weakness, bears in control (K: 36.1, D: 42.7) | Increased trading volume (1.7x)
════════════════════
🟢 $QCOM 30-minute bearish signal
⚠️Technical analysis: 4-hour bearish confluence confirmed | 30-minute entry: MACD bearish crossover below zero, bearish momentum accelerating | EMA5 < EMA8 < EMA13 bearish alignment | KDJ showing weakness, bears in control (K: 29.5, D: 43.3) | Volume surge (4.8x)
════════════════════
🔔 Follow for first-hand market alerts 🔔
#多周期共振 #Q #TSM #QCOM
📌 When trading, check whether the candlestick patterns match
Multi-timeframe confluence: 30-minute bearish signals on 3 coins + 4-hour bearish trend confirmation 🔥
════════════════════
🟢 $Q 30-minute bearish signal
⚠️Technical analysis: 4-hour bearish confluence confirmed | 30-minute entry: MACD bearish, trend weak, momentum strengthening | EMA5 < EMA8 < EMA13 bearish alignment | Normal volume (1.2x)
════════════════════
🟢 $TSM 30-minute bearish signal
⚠️Technical analysis: 4-hour bearish confluence confirmed | 30-minute entry: MACD bearish crossover below zero, bearish momentum accelerating | EMA5 < EMA8 < EMA13 bearish alignment | KDJ showing weakness, bears in control (K: 36.1, D: 42.7) | Increased trading volume (1.7x)
════════════════════
🟢 $QCOM 30-minute bearish signal
⚠️Technical analysis: 4-hour bearish confluence confirmed | 30-minute entry: MACD bearish crossover below zero, bearish momentum accelerating | EMA5 < EMA8 < EMA13 bearish alignment | KDJ showing weakness, bears in control (K: 29.5, D: 43.3) | Volume surge (4.8x)
════════════════════
🔔 Follow for first-hand market alerts 🔔
#多周期共振 #Q #TSM #QCOM
📌 When trading, check whether the candlestick patterns match
════════════════════
🟢 $Q 30-minute bearish signal
⚠️Technical analysis: 4-hour bearish confluence confirmed | 30-minute entry: MACD bearish, trend weak, momentum strengthening | EMA5 < EMA8 < EMA13 bearish alignment | Normal volume (1.2x)
════════════════════
🟢 $TSM 30-minute bearish signal
⚠️Technical analysis: 4-hour bearish confluence confirmed | 30-minute entry: MACD bearish crossover below zero, bearish momentum accelerating | EMA5 < EMA8 < EMA13 bearish alignment | KDJ showing weakness, bears in control (K: 36.1, D: 42.7) | Increased trading volume (1.7x)
════════════════════
🟢 $QCOM 30-minute bearish signal
⚠️Technical analysis: 4-hour bearish confluence confirmed | 30-minute entry: MACD bearish crossover below zero, bearish momentum accelerating | EMA5 < EMA8 < EMA13 bearish alignment | KDJ showing weakness, bears in control (K: 29.5, D: 43.3) | Volume surge (4.8x)
════════════════════
🔔 Follow for first-hand market alerts 🔔
#多周期共振 #Q #TSM #QCOM
📌 When trading, check whether the candlestick patterns match
8

·
--
🚀 $TSM LONG 🚀
Entry: 423.82 – 426.38
SL: 421.45
TP1: 428.23
TP2: 430.31
TP3: 432.91
📈 Technical Outlook:
$TSM is showing strong bullish momentum after confirming strength near a key technical zone. The setup is supported by EMA trend is bullish, price is breaking above recent resistance, RSI supports bullish momentum. As long as price holds above the entry area, buyers may continue pushing toward the listed targets.
#TSM #Crypto #BinanceSquare #Trading
🚀 $TSM LONG 🚀
Entry: 423.82 – 426.38
SL: 421.45
TP1: 428.23
TP2: 430.31
TP3: 432.91
📈 Technical Outlook:
$TSM is showing strong bullish momentum after confirming strength near a key technical zone. The setup is supported by EMA trend is bullish, price is breaking above recent resistance, RSI supports bullish momentum. As long as price holds above the entry area, buyers may continue pushing toward the listed targets.
#TSM #Crypto #BinanceSquare #Trading
Entry: 423.82 – 426.38
SL: 421.45
TP1: 428.23
TP2: 430.31
TP3: 432.91
📈 Technical Outlook:
$TSM is showing strong bullish momentum after confirming strength near a key technical zone. The setup is supported by EMA trend is bullish, price is breaking above recent resistance, RSI supports bullish momentum. As long as price holds above the entry area, buyers may continue pushing toward the listed targets.
#TSM #Crypto #BinanceSquare #Trading

4

·
--
🦈 $TSM RECLAIMS CHIP PLAYGROUND 🚀
Foreign investors have flipped the script on Korean chips, and the ripple is hitting the broader semiconductor arena. $TSM is sitting on a massive order block where smart money is quietly stacking, while short sellers sit at a 5‑to‑1 ratio—prime bait for a liquidity sweep. 📊
If a catalyst nudges AI capex back into gear, those crowded shorts could scramble for cover, igniting a classic squeeze. ⚡💡
💬 Are you positioning for the upside or waiting for the squeeze to ignite? 👇
⚠️ Not financial advice. Always manage your risk. 🛡️
🏷️ #TSM #Semiconductor #ShortSqueeze #TechTurnaround #Crypto
🚀 ⚡
🦈 $TSM RECLAIMS CHIP PLAYGROUND 🚀
Foreign investors have flipped the script on Korean chips, and the ripple is hitting the broader semiconductor arena. $TSM is sitting on a massive order block where smart money is quietly stacking, while short sellers sit at a 5‑to‑1 ratio—prime bait for a liquidity sweep. 📊
If a catalyst nudges AI capex back into gear, those crowded shorts could scramble for cover, igniting a classic squeeze. ⚡💡
💬 Are you positioning for the upside or waiting for the squeeze to ignite? 👇
⚠️ Not financial advice. Always manage your risk. 🛡️
🏷️ #TSM #Semiconductor #ShortSqueeze #TechTurnaround #Crypto
🚀 ⚡
Foreign investors have flipped the script on Korean chips, and the ripple is hitting the broader semiconductor arena. $TSM is sitting on a massive order block where smart money is quietly stacking, while short sellers sit at a 5‑to‑1 ratio—prime bait for a liquidity sweep. 📊
If a catalyst nudges AI capex back into gear, those crowded shorts could scramble for cover, igniting a classic squeeze. ⚡💡
💬 Are you positioning for the upside or waiting for the squeeze to ignite? 👇
⚠️ Not financial advice. Always manage your risk. 🛡️
🏷️ #TSM #Semiconductor #ShortSqueeze #TechTurnaround #Crypto
🚀 ⚡
15

·
--
🚨 $TSM REVERSE THE SHORT‑SQUEEZE RALLY 🦈
📊 Institutional short exposure sits at a 5:1 ratio, yet foreign investors have flipped to net buying on Samsung and SK Hynix, hinting at a liquidity vacuum. ⚡ The surge in semiconductor ETFs and record inflows into AI‑linked chips suggest smart money is positioning for a catalyst‑driven upside. 📌 If the crowded shorts scramble to cover, we could see a rapid price acceleration that mirrors July’s momentum reversal.
💬 Do you see this as the opening wave for a broader tech rebound? 👇
⚠️ Not financial advice. Always manage your risk. 🛡️
🏷️ #TSM #Semiconductor #ShortSqueeze #TechFlow #Crypto
🦈 🔥
🚨 $TSM REVERSE THE SHORT‑SQUEEZE RALLY 🦈
📊 Institutional short exposure sits at a 5:1 ratio, yet foreign investors have flipped to net buying on Samsung and SK Hynix, hinting at a liquidity vacuum. ⚡ The surge in semiconductor ETFs and record inflows into AI‑linked chips suggest smart money is positioning for a catalyst‑driven upside. 📌 If the crowded shorts scramble to cover, we could see a rapid price acceleration that mirrors July’s momentum reversal.
💬 Do you see this as the opening wave for a broader tech rebound? 👇
⚠️ Not financial advice. Always manage your risk. 🛡️
🏷️ #TSM #Semiconductor #ShortSqueeze #TechFlow #Crypto
🦈 🔥
📊 Institutional short exposure sits at a 5:1 ratio, yet foreign investors have flipped to net buying on Samsung and SK Hynix, hinting at a liquidity vacuum. ⚡ The surge in semiconductor ETFs and record inflows into AI‑linked chips suggest smart money is positioning for a catalyst‑driven upside. 📌 If the crowded shorts scramble to cover, we could see a rapid price acceleration that mirrors July’s momentum reversal.
💬 Do you see this as the opening wave for a broader tech rebound? 👇
⚠️ Not financial advice. Always manage your risk. 🛡️
🏷️ #TSM #Semiconductor #ShortSqueeze #TechFlow #Crypto
🦈 🔥
3

#股票财报季
#TSM
Business assessment: Growth in demand for TSMC’s advanced process technologies and high-performance computing has already translated into substantial revenue, profit, and operating cash flow, providing a solid basis for its operational advantages. However, 2nm volume production and overseas capacity expansion are increasing capital investment and cost pressures. Long-term profitability still depends on the returns generated by new capacity.
Investment assessment: The current valuation already reflects strong expectations for AI demand and advanced process growth. The available evidence is insufficient to conclude that TSMC is significantly undervalued. Its future investment value depends on whether high capital expenditures can continue to drive profit growth and free cash flow per share.
{stock_us}(TSM.US)
#股票财报季
#TSM
Business assessment: Growth in demand for TSMC’s advanced process technologies and high-performance computing has already translated into substantial revenue, profit, and operating cash flow, providing a solid basis for its operational advantages. However, 2nm volume production and overseas capacity expansion are increasing capital investment and cost pressures. Long-term profitability still depends on the returns generated by new capacity.
Investment assessment: The current valuation already reflects strong expectations for AI demand and advanced process growth. The available evidence is insufficient to conclude that TSMC is significantly undervalued. Its future investment value depends on whether high capital expenditures can continue to drive profit growth and free cash flow per share.
#TSM
Business assessment: Growth in demand for TSMC’s advanced process technologies and high-performance computing has already translated into substantial revenue, profit, and operating cash flow, providing a solid basis for its operational advantages. However, 2nm volume production and overseas capacity expansion are increasing capital investment and cost pressures. Long-term profitability still depends on the returns generated by new capacity.
Investment assessment: The current valuation already reflects strong expectations for AI demand and advanced process growth. The available evidence is insufficient to conclude that TSMC is significantly undervalued. Its future investment value depends on whether high capital expenditures can continue to drive profit growth and free cash flow per share.
TSMUS+4.44%
1
170

·
--
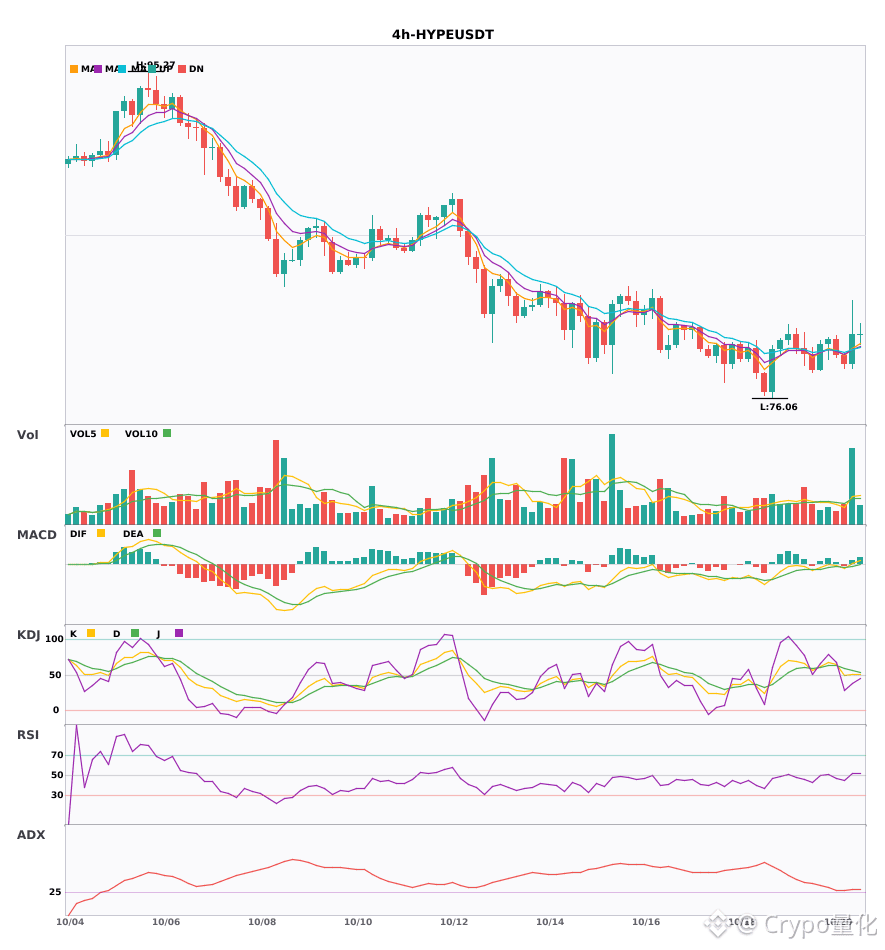
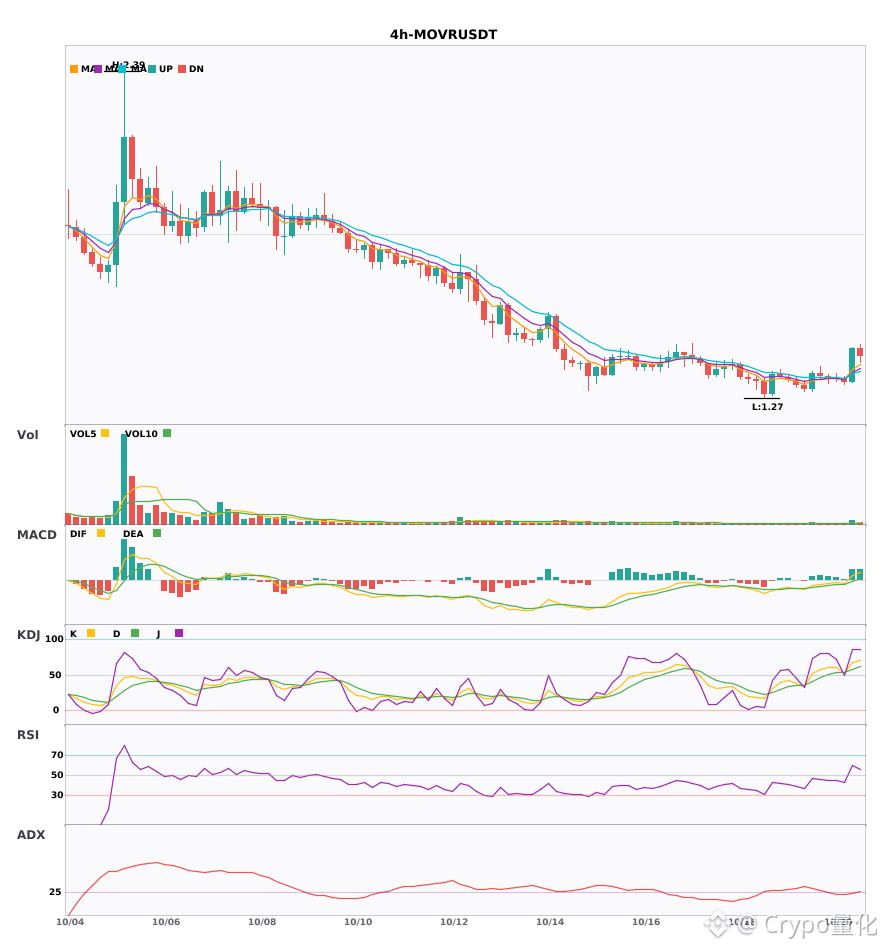
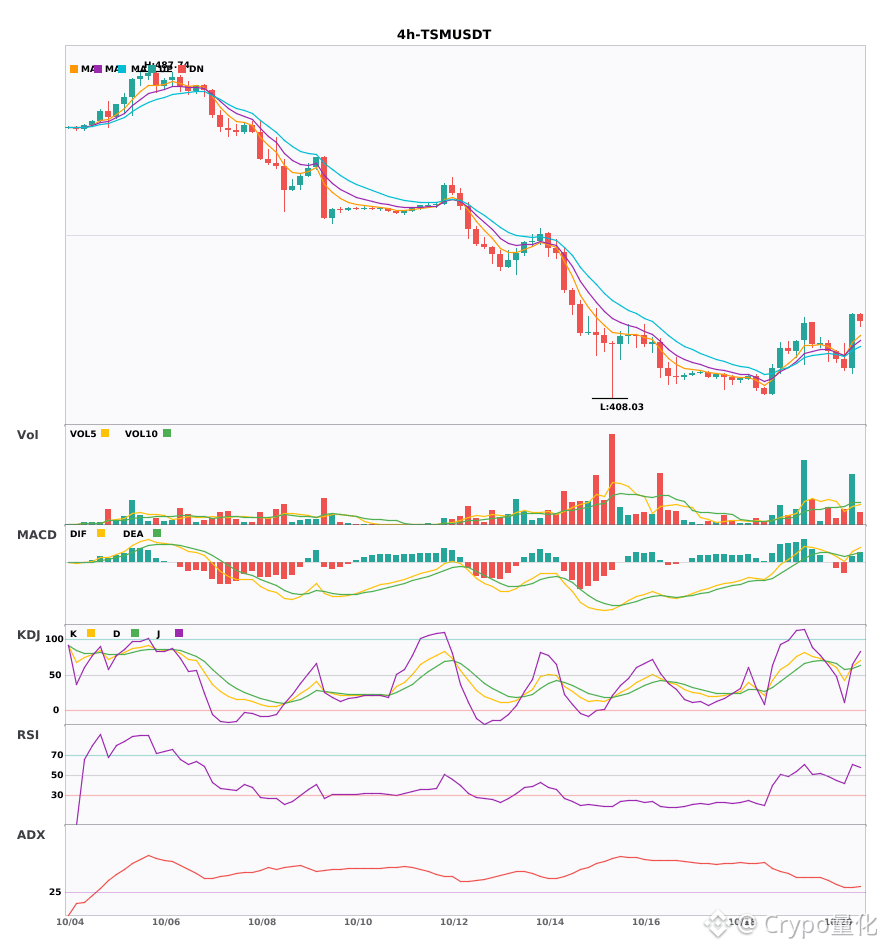
Three 4-hour bullish signals appeared simultaneously: $HYPE / $MOVR / $TSM🔥
════════════════════
🔴 $HYPE 4-hour bullish signal
⚠️Technical analysis: ADX (26): Trend is forming; opportunity to participate | MACD golden cross above zero, releasing bullish momentum | EMA5 crossed above EMA8, short-term trend turns bullish | KDJ showing strength, bulls in control (K: 50.0, D: 55.8) | Volume surge (2.9x)
════════════════════
🔴 $MOVR 4-hour bullish signal
⚠️Technical analysis: ADX (25): Trend is forming; opportunity to participate | MACD DIF breaks above zero, trend turns bullish | EMA5 crossed above EMA8, short-term trend turns bullish | KDJ golden cross, short-term outlook bullish (K: 67.5, D: 58.1) | Volume surge (2.9x)
════════════════════
🔴 $TSM 4-hour bullish signal
⚠️Technical analysis: ADX (32): Clear trending market | MACD golden cross above zero, releasing bullish momentum | EMA5 crossed above EMA8, short-term trend turns bullish | KDJ golden cross, short-term outlook bullish (K: 61.3, D: 59.3) | Increased volume (2.2x)
════════════════════
🔔 Follow for real-time market updates 🔔
#技术分析 #HYPE #MOVR #TSM
📌 When trading, pay attention to whether the candlestick pattern confirms the signal
Three 4-hour bullish signals appeared simultaneously: $HYPE / $MOVR / $TSM 🔥
════════════════════
🔴 $HYPE 4-hour bullish signal
⚠️Technical analysis: ADX (26): Trend is forming; opportunity to participate | MACD golden cross above zero, releasing bullish momentum | EMA5 crossed above EMA8, short-term trend turns bullish | KDJ showing strength, bulls in control (K: 50.0, D: 55.8) | Volume surge (2.9x)
════════════════════
🔴 $MOVR 4-hour bullish signal
⚠️Technical analysis: ADX (25): Trend is forming; opportunity to participate | MACD DIF breaks above zero, trend turns bullish | EMA5 crossed above EMA8, short-term trend turns bullish | KDJ golden cross, short-term outlook bullish (K: 67.5, D: 58.1) | Volume surge (2.9x)
════════════════════
🔴 $TSM 4-hour bullish signal
⚠️Technical analysis: ADX (32): Clear trending market | MACD golden cross above zero, releasing bullish momentum | EMA5 crossed above EMA8, short-term trend turns bullish | KDJ golden cross, short-term outlook bullish (K: 61.3, D: 59.3) | Increased volume (2.2x)
════════════════════
🔔 Follow for real-time market updates 🔔
#技术分析 #HYPE #MOVR #TSM
📌 When trading, pay attention to whether the candlestick pattern confirms the signal
════════════════════
🔴 $HYPE 4-hour bullish signal
⚠️Technical analysis: ADX (26): Trend is forming; opportunity to participate | MACD golden cross above zero, releasing bullish momentum | EMA5 crossed above EMA8, short-term trend turns bullish | KDJ showing strength, bulls in control (K: 50.0, D: 55.8) | Volume surge (2.9x)
════════════════════
🔴 $MOVR 4-hour bullish signal
⚠️Technical analysis: ADX (25): Trend is forming; opportunity to participate | MACD DIF breaks above zero, trend turns bullish | EMA5 crossed above EMA8, short-term trend turns bullish | KDJ golden cross, short-term outlook bullish (K: 67.5, D: 58.1) | Volume surge (2.9x)
════════════════════
🔴 $TSM 4-hour bullish signal
⚠️Technical analysis: ADX (32): Clear trending market | MACD golden cross above zero, releasing bullish momentum | EMA5 crossed above EMA8, short-term trend turns bullish | KDJ golden cross, short-term outlook bullish (K: 61.3, D: 59.3) | Increased volume (2.2x)
════════════════════
🔔 Follow for real-time market updates 🔔
#技术分析 #HYPE #MOVR #TSM
📌 When trading, pay attention to whether the candlestick pattern confirms the signal
15
·
--
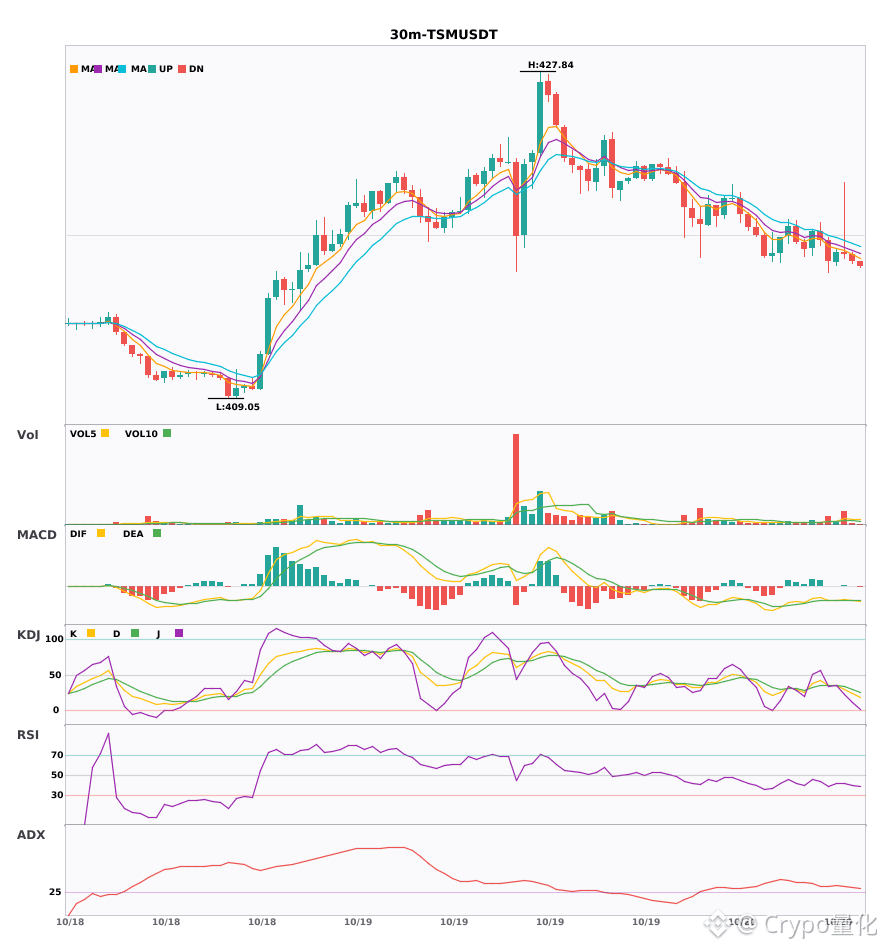
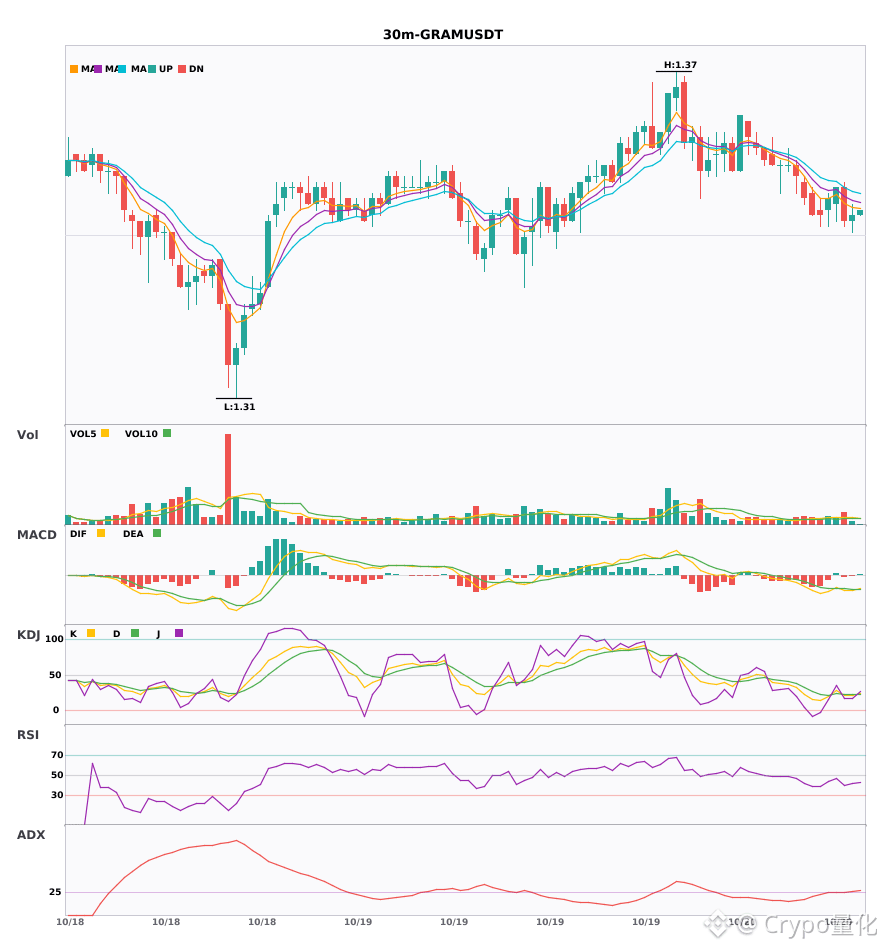
$TSM / $GRAM : Bearish on the 30-minute timeframe, with short-term resistance 🔥
════════════════════
🟢 $TSM 30-minute bearish signal
⚠️ Technical analysis: ADX (31): clear trending market | MACD bearish crossover below zero, bearish momentum accelerating | EMA5 < EMA8 < EMA13: bearish alignment | KDJ weak, bears in control (K: 23.8, D: 30.2) | Volume surge (3.1x)
════════════════════
🟢 $GRAM 30-minute bearish signal
⚠️ Technical analysis: ADX (29): trend is forming, potential entry | MACD bearish crossover below zero, bearish momentum accelerating | EMA5 < EMA8 < EMA13: bearish alignment | KDJ bearish crossover, short-term outlook is bearish (K: 21.0, D: 22.9) | Increased volume (1.9x)
════════════════════
🔔 Follow for breaking market updates 🔔
#技术分析 #TSM #GRAM
📌 When trading, watch whether the candlestick patterns confirm the setup
$TSM / $GRAM : Bearish on the 30-minute timeframe, with short-term resistance 🔥
════════════════════
🟢 $TSM 30-minute bearish signal
⚠️ Technical analysis: ADX (31): clear trending market | MACD bearish crossover below zero, bearish momentum accelerating | EMA5 < EMA8 < EMA13: bearish alignment | KDJ weak, bears in control (K: 23.8, D: 30.2) | Volume surge (3.1x)
════════════════════
🟢 $GRAM 30-minute bearish signal
⚠️ Technical analysis: ADX (29): trend is forming, potential entry | MACD bearish crossover below zero, bearish momentum accelerating | EMA5 < EMA8 < EMA13: bearish alignment | KDJ bearish crossover, short-term outlook is bearish (K: 21.0, D: 22.9) | Increased volume (1.9x)
════════════════════
🔔 Follow for breaking market updates 🔔
#技术分析 #TSM #GRAM
📌 When trading, watch whether the candlestick patterns confirm the setup
════════════════════
🟢 $TSM 30-minute bearish signal
⚠️ Technical analysis: ADX (31): clear trending market | MACD bearish crossover below zero, bearish momentum accelerating | EMA5 < EMA8 < EMA13: bearish alignment | KDJ weak, bears in control (K: 23.8, D: 30.2) | Volume surge (3.1x)
════════════════════
🟢 $GRAM 30-minute bearish signal
⚠️ Technical analysis: ADX (29): trend is forming, potential entry | MACD bearish crossover below zero, bearish momentum accelerating | EMA5 < EMA8 < EMA13: bearish alignment | KDJ bearish crossover, short-term outlook is bearish (K: 21.0, D: 22.9) | Increased volume (1.9x)
════════════════════
🔔 Follow for breaking market updates 🔔
#技术分析 #TSM #GRAM
📌 When trading, watch whether the candlestick patterns confirm the setup
29
·
--
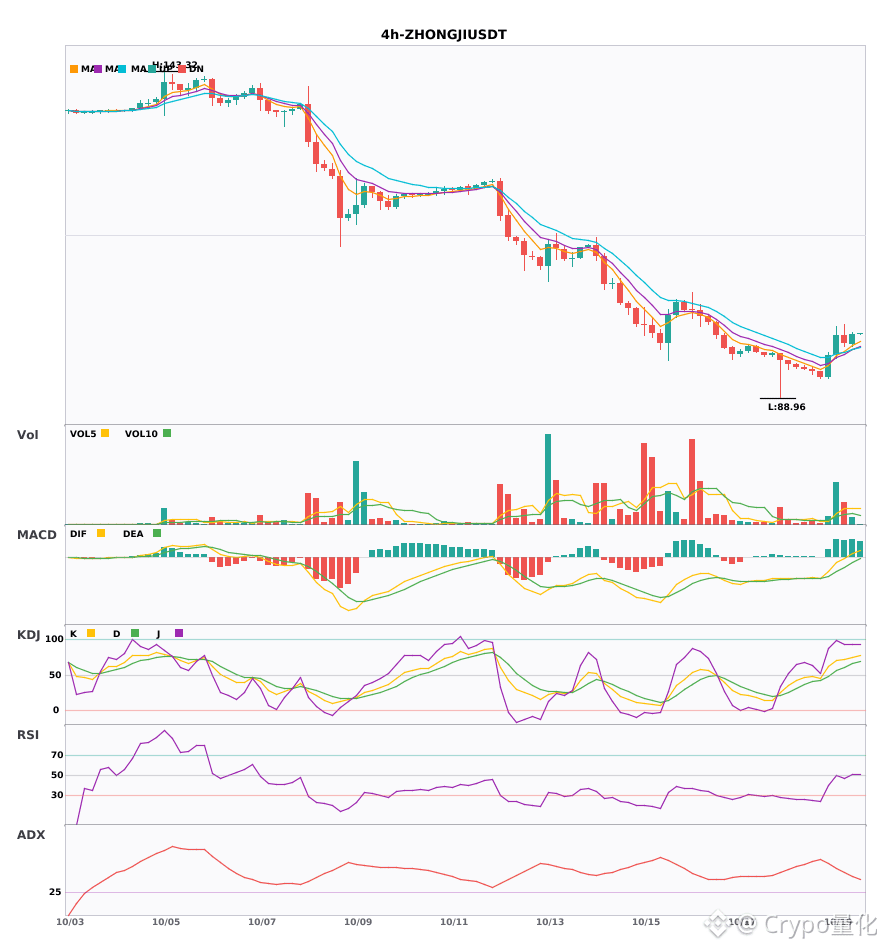
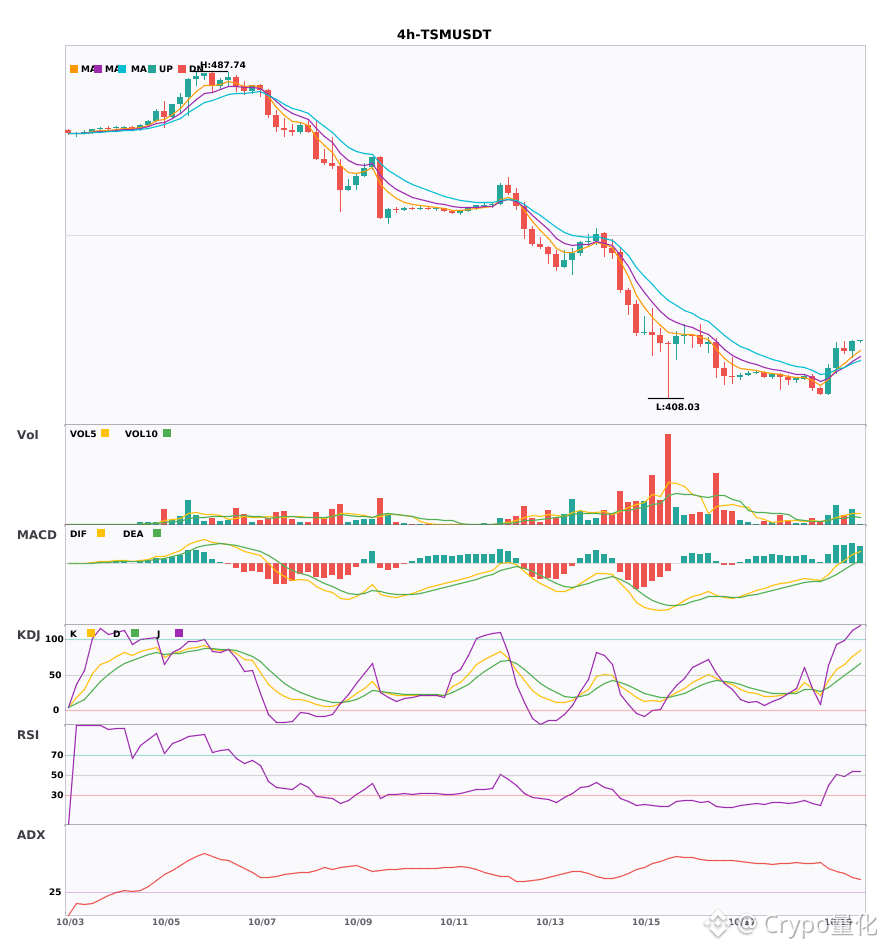
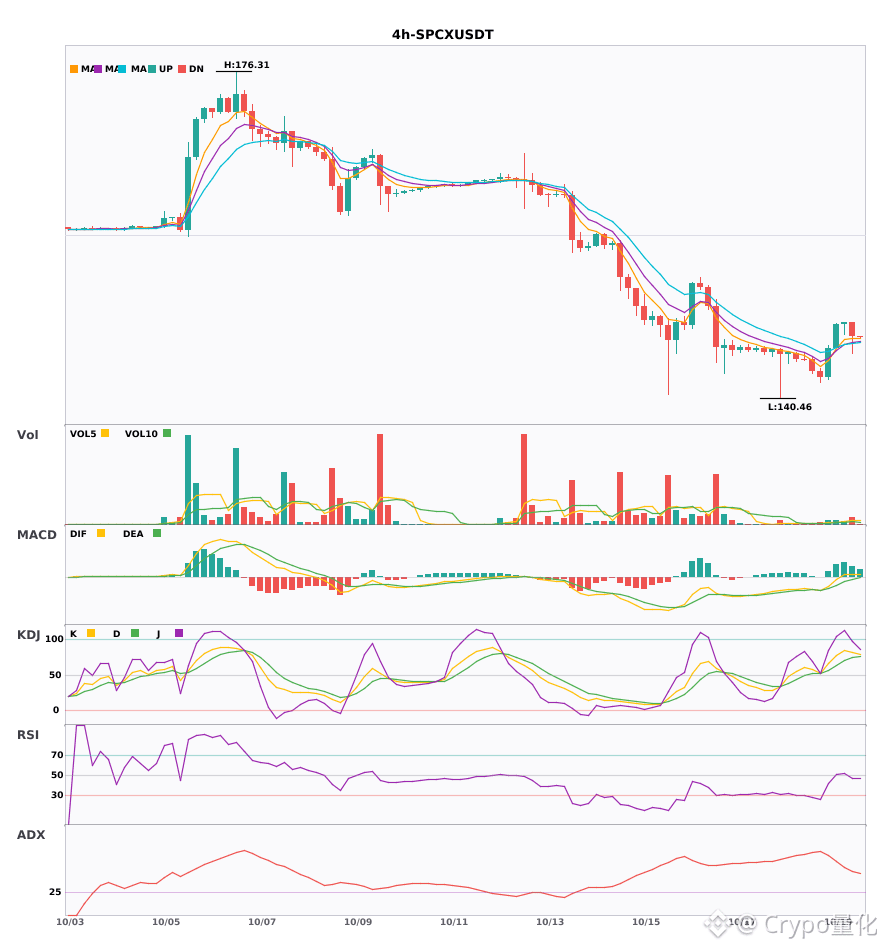
$ZHONGJI / $TSM / $SPCX 4-hour resonance turns bullish, with multiple bullish signals appearing simultaneously🔥
════════════════════
🔴 $ZHONGJI 4-hour bullish signal
⚠️Technical analysis: ADX(45) indicates a clear trending market | MACD DIF breaks above the zero line, signaling a bullish trend | EMA5 > EMA8 > EMA13, bullish alignment | KDJ is strong, with bulls in control (K: 74.8, D: 65.5) | Volume increases (2.1x)
════════════════════
🔴 $TSM 4-hour bullish signal
⚠️Technical analysis: ADX(42) indicates a clear trending market | MACD is bullish, the trend is strong, and momentum is increasing | EMA5 > EMA8 > EMA13, bullish alignment | KDJ is strong, with bulls in control (K: 76.3, D: 58.1) | Volume increases (2.0x)
════════════════════
🔴 $SPCX 4-hour bullish signal
⚠️Technical analysis: ADX(46) indicates a very strong trend (watch for an overheated pullback) | MACD is bullish, the trend is strong, but momentum is weakening | EMA5 > EMA8 > EMA13, bullish alignment | KDJ is strong, with bulls in control (K: 81.5, D: 74.1) | Volume increases (2.3x)
════════════════════
🔔 Follow for the latest market alerts 🔔
#技术分析 #ZHONGJI #TSM #SPCX
📌 When trading, watch for confirming candlestick patterns
$ZHONGJI / $TSM / $SPCX 4-hour resonance turns bullish, with multiple bullish signals appearing simultaneously🔥
════════════════════
🔴 $ZHONGJI 4-hour bullish signal
⚠️Technical analysis: ADX(45) indicates a clear trending market | MACD DIF breaks above the zero line, signaling a bullish trend | EMA5 > EMA8 > EMA13, bullish alignment | KDJ is strong, with bulls in control (K: 74.8, D: 65.5) | Volume increases (2.1x)
════════════════════
🔴 $TSM 4-hour bullish signal
⚠️Technical analysis: ADX(42) indicates a clear trending market | MACD is bullish, the trend is strong, and momentum is increasing | EMA5 > EMA8 > EMA13, bullish alignment | KDJ is strong, with bulls in control (K: 76.3, D: 58.1) | Volume increases (2.0x)
════════════════════
🔴 $SPCX 4-hour bullish signal
⚠️Technical analysis: ADX(46) indicates a very strong trend (watch for an overheated pullback) | MACD is bullish, the trend is strong, but momentum is weakening | EMA5 > EMA8 > EMA13, bullish alignment | KDJ is strong, with bulls in control (K: 81.5, D: 74.1) | Volume increases (2.3x)
════════════════════
🔔 Follow for the latest market alerts 🔔
#技术分析 #ZHONGJI #TSM #SPCX
📌 When trading, watch for confirming candlestick patterns
════════════════════
🔴 $ZHONGJI 4-hour bullish signal
⚠️Technical analysis: ADX(45) indicates a clear trending market | MACD DIF breaks above the zero line, signaling a bullish trend | EMA5 > EMA8 > EMA13, bullish alignment | KDJ is strong, with bulls in control (K: 74.8, D: 65.5) | Volume increases (2.1x)
════════════════════
🔴 $TSM 4-hour bullish signal
⚠️Technical analysis: ADX(42) indicates a clear trending market | MACD is bullish, the trend is strong, and momentum is increasing | EMA5 > EMA8 > EMA13, bullish alignment | KDJ is strong, with bulls in control (K: 76.3, D: 58.1) | Volume increases (2.0x)
════════════════════
🔴 $SPCX 4-hour bullish signal
⚠️Technical analysis: ADX(46) indicates a very strong trend (watch for an overheated pullback) | MACD is bullish, the trend is strong, but momentum is weakening | EMA5 > EMA8 > EMA13, bullish alignment | KDJ is strong, with bulls in control (K: 81.5, D: 74.1) | Volume increases (2.3x)
════════════════════
🔔 Follow for the latest market alerts 🔔
#技术分析 #ZHONGJI #TSM #SPCX
📌 When trading, watch for confirming candlestick patterns
12
·
--
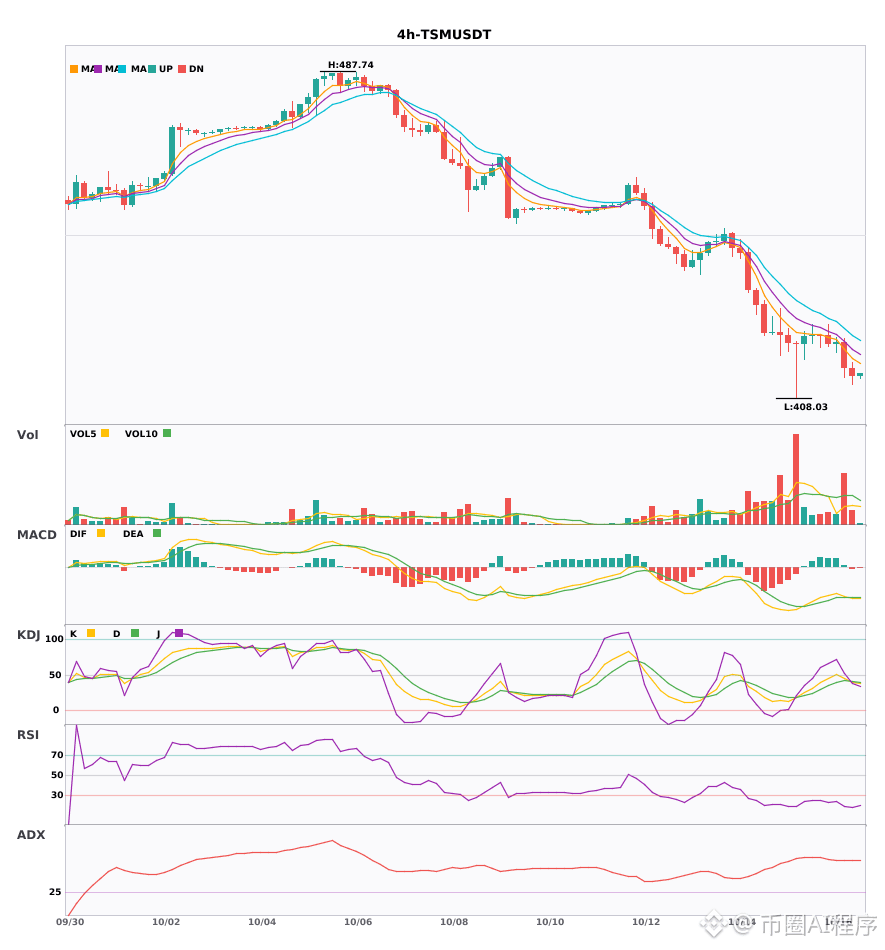
$TSM / $MUU / $SOXL 4-hour bearish + daily bearish alignment; multi-timeframe confluence signals a bearish turn 🔥
════════════════════
🟢 $TSM 4-hour bearish signal
⚠️ Technicals: Daily bearish confluence confirmed | 4-hour entry: MACD bearish crossover below zero, bearish momentum accelerating | EMA5 < EMA8 < EMA13, bearish alignment | KDJ bearish crossover, short-term outlook bearish (K: 40.1, D: 41.2) | Volume increased (1.7x)
════════════════════
🟢 $MUU 4-hour bearish signal
⚠️ Technicals: Daily bearish confluence confirmed | 4-hour entry: MACD bearish crossover below zero, bearish momentum accelerating | EMA5 < EMA8 < EMA13, bearish alignment | KDJ bearish crossover, short-term outlook bearish (K: 48.3, D: 54.7) | Volume increased (2.4x)
════════════════════
🟢 $SOXL 4-hour bearish signal
⚠️ Technicals: Daily bearish confluence confirmed | 4-hour entry: MACD bearish crossover below zero, bearish momentum accelerating | EMA5 < EMA8 < EMA13, bearish alignment | KDJ bearish crossover, short-term outlook bearish (K: 32.3, D: 39.3) | Volume increased (1.8x)
════════════════════
🔔 Follow for the latest market updates 🔔
#多周期共振 #TSM #MUU #SOXL
📌 When trading, pay attention to whether the candlestick patterns align
$TSM / $MUU / $SOXL 4-hour bearish + daily bearish alignment; multi-timeframe confluence signals a bearish turn 🔥
════════════════════
🟢 $TSM 4-hour bearish signal
⚠️ Technicals: Daily bearish confluence confirmed | 4-hour entry: MACD bearish crossover below zero, bearish momentum accelerating | EMA5 < EMA8 < EMA13, bearish alignment | KDJ bearish crossover, short-term outlook bearish (K: 40.1, D: 41.2) | Volume increased (1.7x)
════════════════════
🟢 $MUU 4-hour bearish signal
⚠️ Technicals: Daily bearish confluence confirmed | 4-hour entry: MACD bearish crossover below zero, bearish momentum accelerating | EMA5 < EMA8 < EMA13, bearish alignment | KDJ bearish crossover, short-term outlook bearish (K: 48.3, D: 54.7) | Volume increased (2.4x)
════════════════════
🟢 $SOXL 4-hour bearish signal
⚠️ Technicals: Daily bearish confluence confirmed | 4-hour entry: MACD bearish crossover below zero, bearish momentum accelerating | EMA5 < EMA8 < EMA13, bearish alignment | KDJ bearish crossover, short-term outlook bearish (K: 32.3, D: 39.3) | Volume increased (1.8x)
════════════════════
🔔 Follow for the latest market updates 🔔
#多周期共振 #TSM #MUU #SOXL
📌 When trading, pay attention to whether the candlestick patterns align
════════════════════
🟢 $TSM 4-hour bearish signal
⚠️ Technicals: Daily bearish confluence confirmed | 4-hour entry: MACD bearish crossover below zero, bearish momentum accelerating | EMA5 < EMA8 < EMA13, bearish alignment | KDJ bearish crossover, short-term outlook bearish (K: 40.1, D: 41.2) | Volume increased (1.7x)
════════════════════
🟢 $MUU 4-hour bearish signal
⚠️ Technicals: Daily bearish confluence confirmed | 4-hour entry: MACD bearish crossover below zero, bearish momentum accelerating | EMA5 < EMA8 < EMA13, bearish alignment | KDJ bearish crossover, short-term outlook bearish (K: 48.3, D: 54.7) | Volume increased (2.4x)
════════════════════
🟢 $SOXL 4-hour bearish signal
⚠️ Technicals: Daily bearish confluence confirmed | 4-hour entry: MACD bearish crossover below zero, bearish momentum accelerating | EMA5 < EMA8 < EMA13, bearish alignment | KDJ bearish crossover, short-term outlook bearish (K: 32.3, D: 39.3) | Volume increased (1.8x)
════════════════════
🔔 Follow for the latest market updates 🔔
#多周期共振 #TSM #MUU #SOXL
📌 When trading, pay attention to whether the candlestick patterns align
91

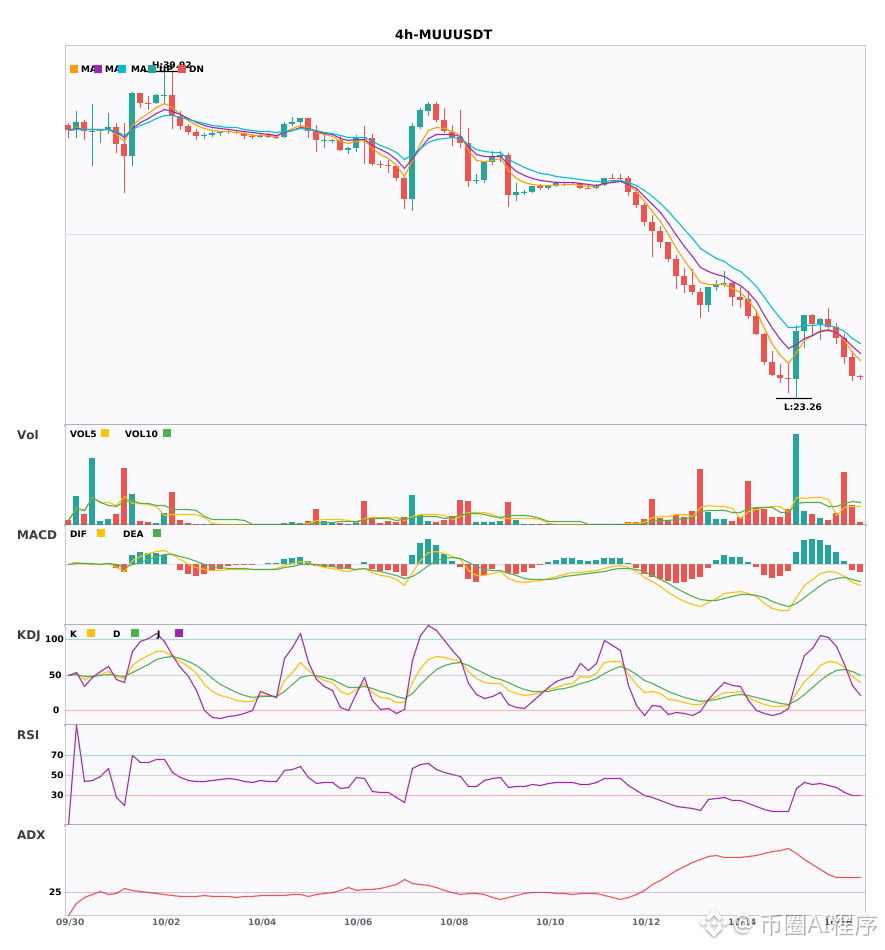
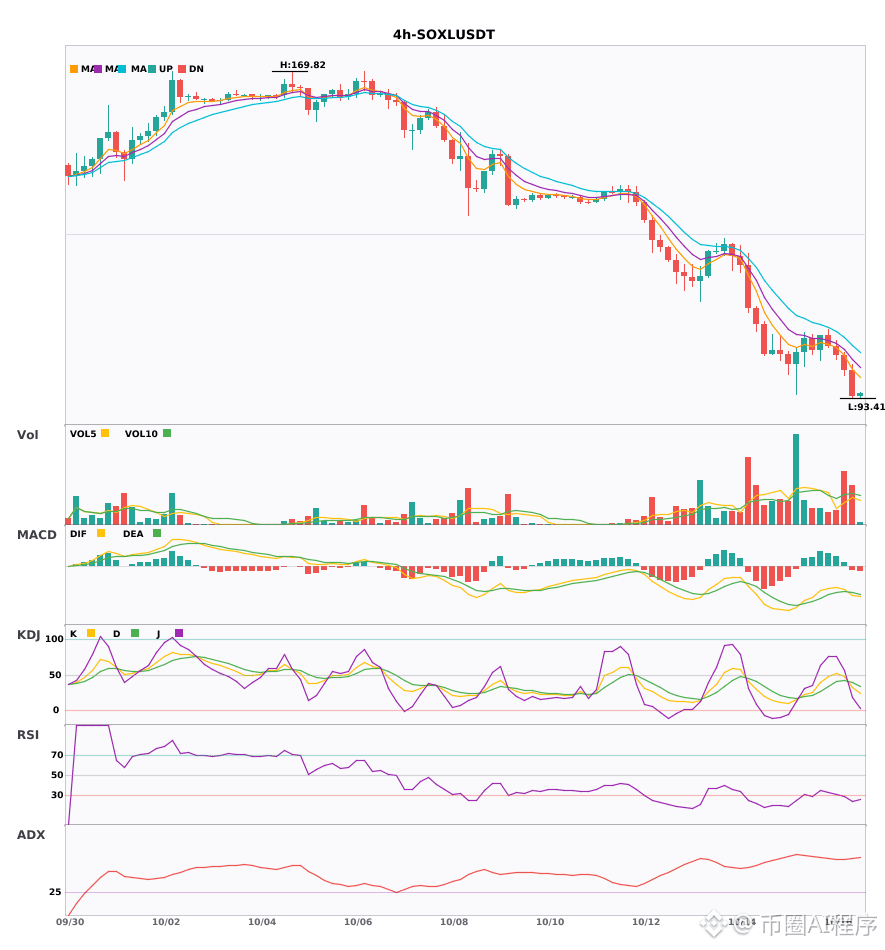
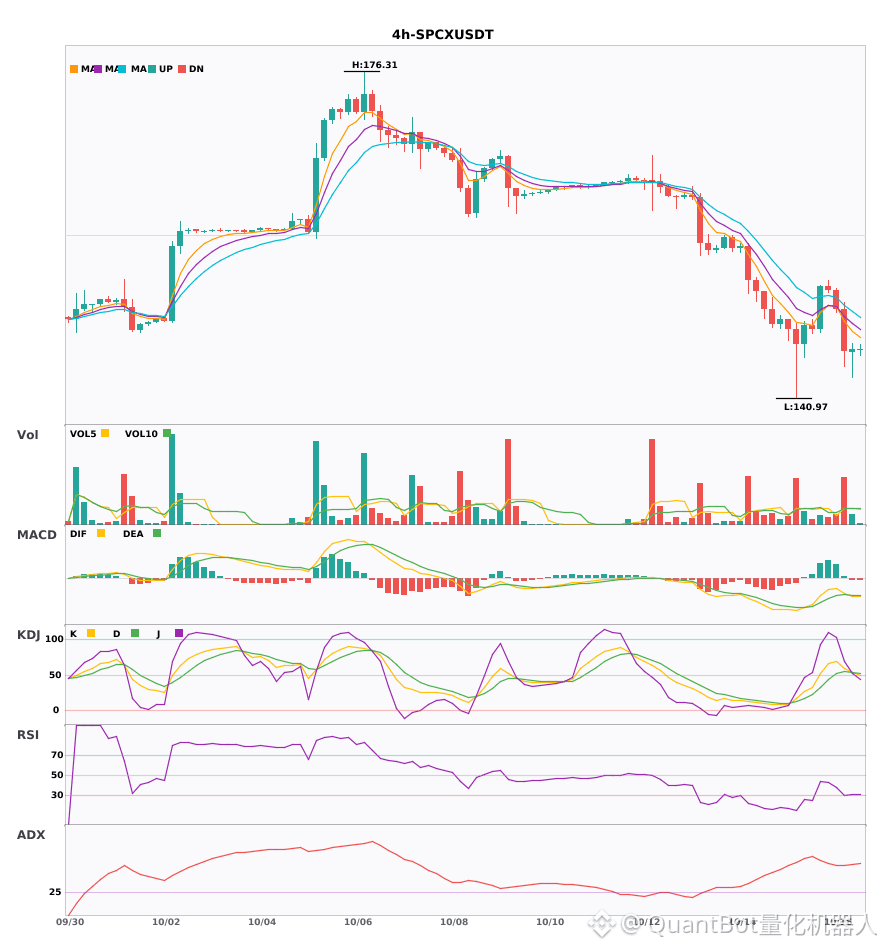
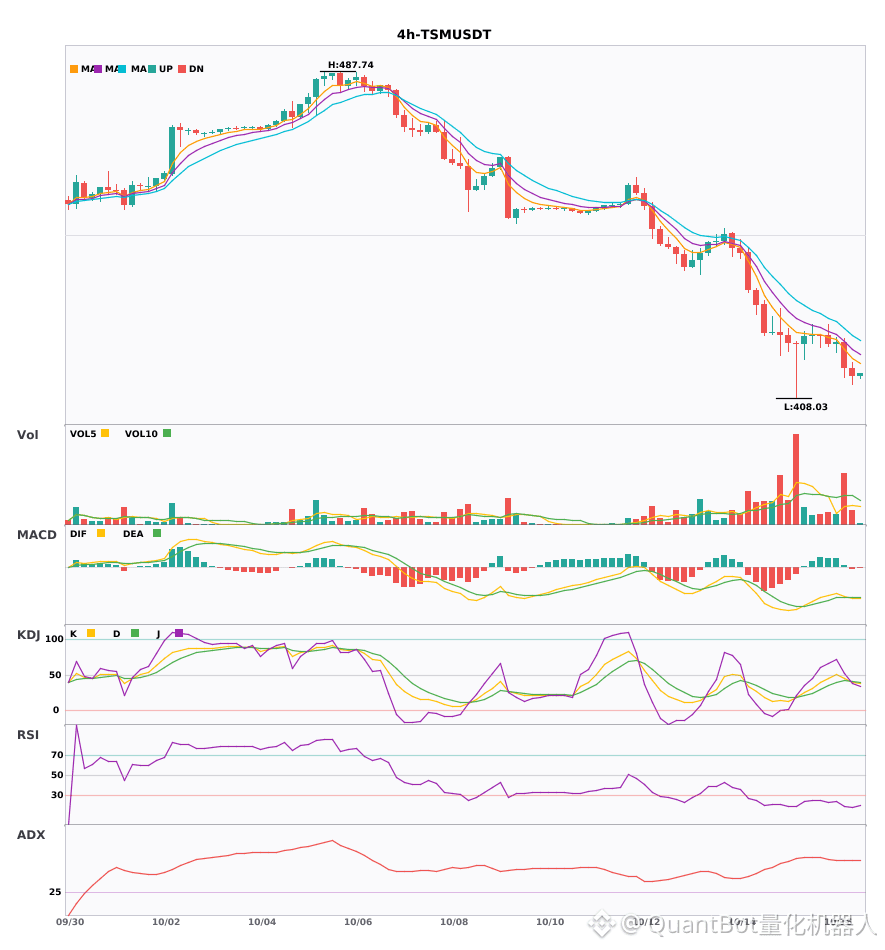
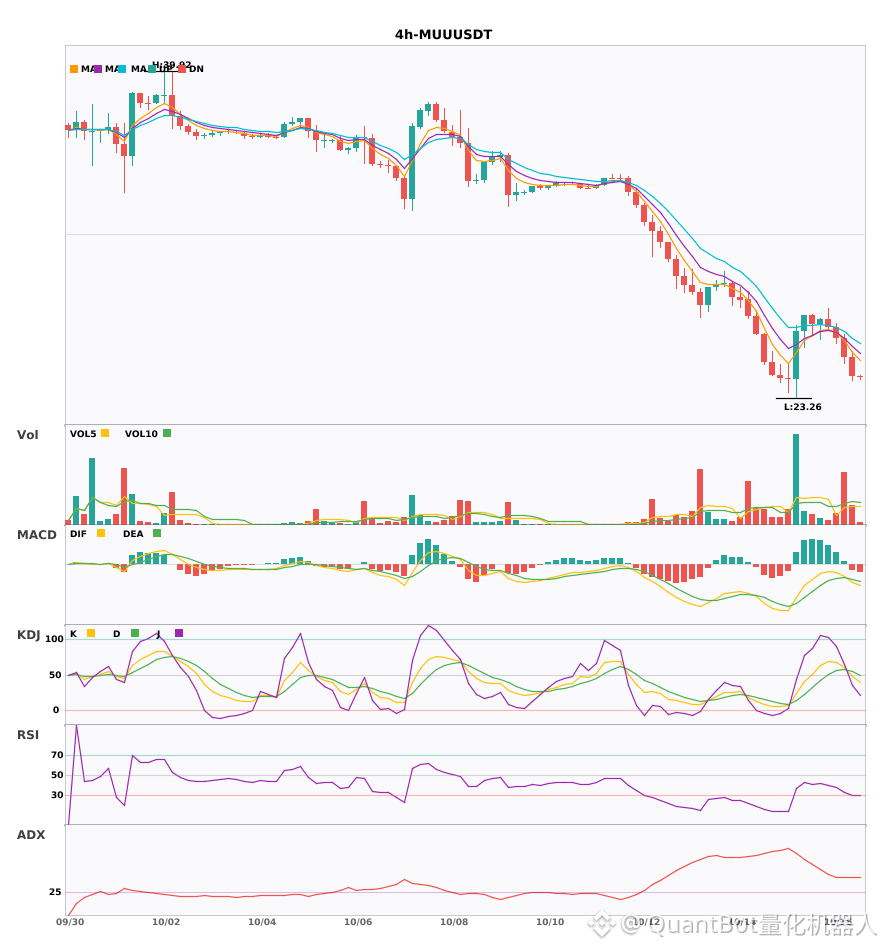
$SPCX / $TSM / $MUU 4-hour technical indicators are weakening in unison; beware of risk
📉 $SPCX | 4-hour bearish signal
━━━━━━━━━━━━━━━━━━
Technical analysis: ADX (57) indicates a very strong trend (beware of an overheated pullback) | MACD bearish cross below zero; bearish momentum accelerating | EMA5 < EMA8 < EMA13, bearish alignment | KDJ bearish cross, short-term outlook bearish (K: 53.3, D: 54.0) | Volume surge (2.9x)
Price change: 0.2000%
📉 $TSM | 4-hour bearish signal
━━━━━━━━━━━━━━━━━━
Technical analysis: ADX (61) indicates a very strong trend (beware of an overheated pullback) | MACD bearish cross below zero; bearish momentum accelerating | EMA5 < EMA8 < EMA13, bearish alignment | KDJ bearish cross, short-term outlook bearish (K: 40.1, D: 41.2) | Volume increase (1.7x)
Price change: -0.4300%
📉 $MUU | 4-hour bearish signal
━━━━━━━━━━━━━━━━━━
Technical analysis: ADX (38) indicates a clear trend | MACD bearish cross below zero; bearish momentum accelerating | EMA5 < EMA8 < EMA13, bearish alignment | KDJ bearish cross, short-term outlook bearish (K: 48.3, D: 54.7) | Volume increase (2.4x)
Price change: -3.7900%
━━━━━━━━━━━━━━━━━━
#技术分析 #SPCX #TSM #MUU
📌 The above content is for reference only and does not constitute investment advice
$SPCX / $TSM / $MUU 4-hour technical indicators are weakening in unison; beware of risk
📉 $SPCX | 4-hour bearish signal
━━━━━━━━━━━━━━━━━━
Technical analysis: ADX (57) indicates a very strong trend (beware of an overheated pullback) | MACD bearish cross below zero; bearish momentum accelerating | EMA5 < EMA8 < EMA13, bearish alignment | KDJ bearish cross, short-term outlook bearish (K: 53.3, D: 54.0) | Volume surge (2.9x)
Price change: 0.2000%
📉 $TSM | 4-hour bearish signal
━━━━━━━━━━━━━━━━━━
Technical analysis: ADX (61) indicates a very strong trend (beware of an overheated pullback) | MACD bearish cross below zero; bearish momentum accelerating | EMA5 < EMA8 < EMA13, bearish alignment | KDJ bearish cross, short-term outlook bearish (K: 40.1, D: 41.2) | Volume increase (1.7x)
Price change: -0.4300%
📉 $MUU | 4-hour bearish signal
━━━━━━━━━━━━━━━━━━
Technical analysis: ADX (38) indicates a clear trend | MACD bearish cross below zero; bearish momentum accelerating | EMA5 < EMA8 < EMA13, bearish alignment | KDJ bearish cross, short-term outlook bearish (K: 48.3, D: 54.7) | Volume increase (2.4x)
Price change: -3.7900%
━━━━━━━━━━━━━━━━━━
#技术分析 #SPCX #TSM #MUU
📌 The above content is for reference only and does not constitute investment advice
📉 $SPCX | 4-hour bearish signal
━━━━━━━━━━━━━━━━━━
Technical analysis: ADX (57) indicates a very strong trend (beware of an overheated pullback) | MACD bearish cross below zero; bearish momentum accelerating | EMA5 < EMA8 < EMA13, bearish alignment | KDJ bearish cross, short-term outlook bearish (K: 53.3, D: 54.0) | Volume surge (2.9x)
Price change: 0.2000%
📉 $TSM | 4-hour bearish signal
━━━━━━━━━━━━━━━━━━
Technical analysis: ADX (61) indicates a very strong trend (beware of an overheated pullback) | MACD bearish cross below zero; bearish momentum accelerating | EMA5 < EMA8 < EMA13, bearish alignment | KDJ bearish cross, short-term outlook bearish (K: 40.1, D: 41.2) | Volume increase (1.7x)
Price change: -0.4300%
📉 $MUU | 4-hour bearish signal
━━━━━━━━━━━━━━━━━━
Technical analysis: ADX (38) indicates a clear trend | MACD bearish cross below zero; bearish momentum accelerating | EMA5 < EMA8 < EMA13, bearish alignment | KDJ bearish cross, short-term outlook bearish (K: 48.3, D: 54.7) | Volume increase (2.4x)
Price change: -3.7900%
━━━━━━━━━━━━━━━━━━
#技术分析 #SPCX #TSM #MUU
📌 The above content is for reference only and does not constitute investment advice
24
·
--
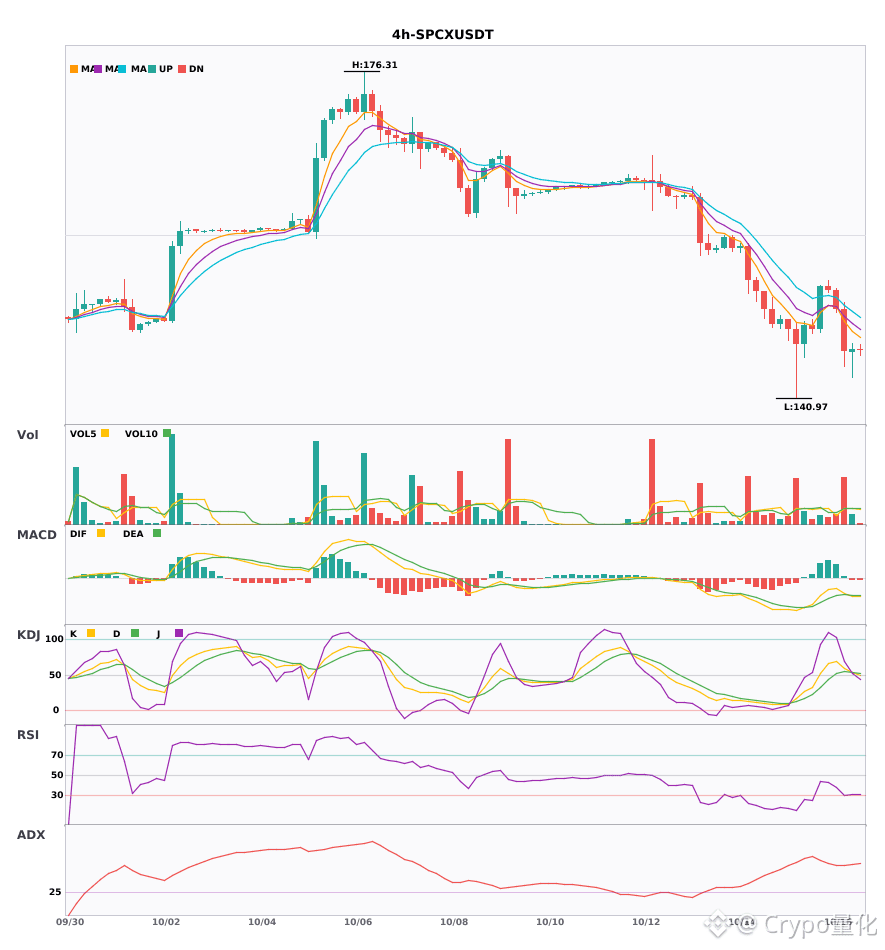
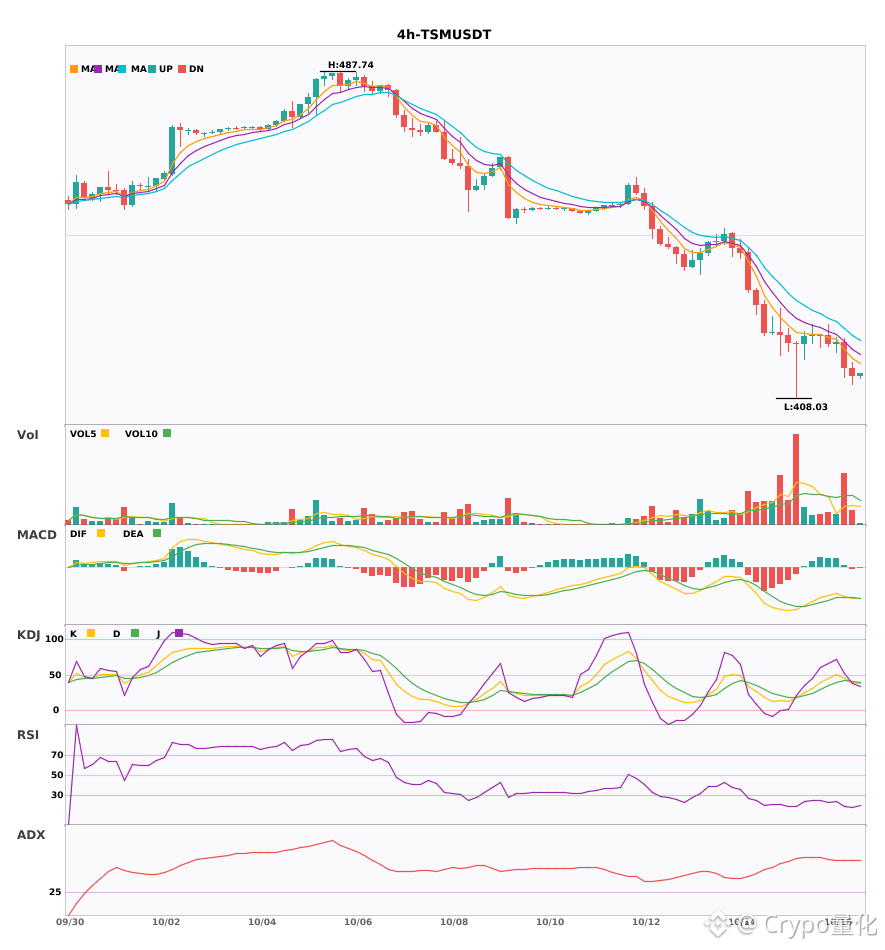
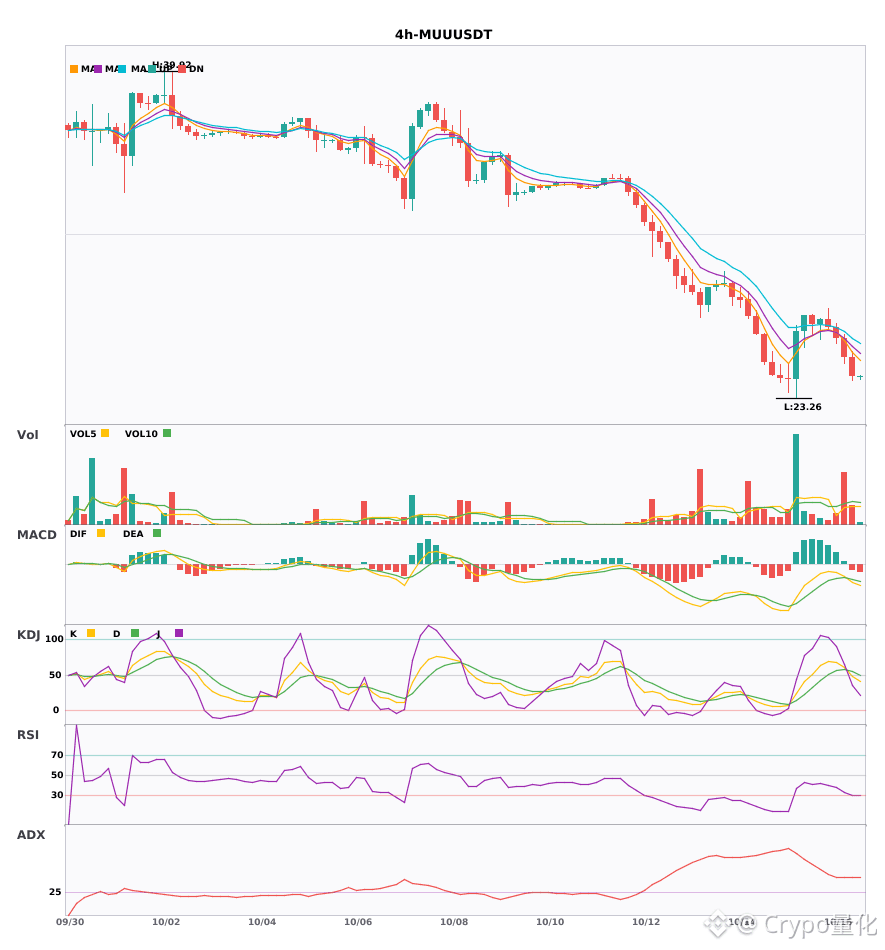
$SPCX / $TSM / $MUU 4-hour bearish confluence signal—bearish signals appearing simultaneously 🔥
════════════════════
🟢 $SPCX 4-hour bearish signal
⚠️Technical analysis: ADX (57) indicates a very strong trend (watch for an overheated pullback) | MACD bearish crossover below zero, bearish momentum accelerating | EMA5 < EMA8 < EMA13, bearish alignment | KDJ bearish crossover, short-term outlook bearish (K: 53.3, D: 54.0) | Volume surge (2.9x)
════════════════════
🟢 $TSM 4-hour bearish signal
⚠️Technical analysis: ADX (61) indicates a very strong trend (watch for an overheated pullback) | MACD bearish crossover below zero, bearish momentum accelerating | EMA5 < EMA8 < EMA13, bearish alignment | KDJ bearish crossover, short-term outlook bearish (K: 40.1, D: 41.2) | Volume increase (1.7x)
════════════════════
🟢 $MUU 4-hour bearish signal
⚠️Technical analysis: ADX (38) indicates a clear trending market | MACD bearish crossover below zero, bearish momentum accelerating | EMA5 < EMA8 < EMA13, bearish alignment | KDJ bearish crossover, short-term outlook bearish (K: 48.3, D: 54.7) | Volume increase (2.4x)
════════════════════
🔔 Follow for first-hand market updates 🔔
#技术分析 #SPCX #TSM #MUU
📌 When trading, pay attention to whether the candlestick pattern confirms the signal
$SPCX / $TSM / $MUU 4-hour bearish confluence signal—bearish signals appearing simultaneously 🔥
════════════════════
🟢 $SPCX 4-hour bearish signal
⚠️Technical analysis: ADX (57) indicates a very strong trend (watch for an overheated pullback) | MACD bearish crossover below zero, bearish momentum accelerating | EMA5 < EMA8 < EMA13, bearish alignment | KDJ bearish crossover, short-term outlook bearish (K: 53.3, D: 54.0) | Volume surge (2.9x)
════════════════════
🟢 $TSM 4-hour bearish signal
⚠️Technical analysis: ADX (61) indicates a very strong trend (watch for an overheated pullback) | MACD bearish crossover below zero, bearish momentum accelerating | EMA5 < EMA8 < EMA13, bearish alignment | KDJ bearish crossover, short-term outlook bearish (K: 40.1, D: 41.2) | Volume increase (1.7x)
════════════════════
🟢 $MUU 4-hour bearish signal
⚠️Technical analysis: ADX (38) indicates a clear trending market | MACD bearish crossover below zero, bearish momentum accelerating | EMA5 < EMA8 < EMA13, bearish alignment | KDJ bearish crossover, short-term outlook bearish (K: 48.3, D: 54.7) | Volume increase (2.4x)
════════════════════
🔔 Follow for first-hand market updates 🔔
#技术分析 #SPCX #TSM #MUU
📌 When trading, pay attention to whether the candlestick pattern confirms the signal
════════════════════
🟢 $SPCX 4-hour bearish signal
⚠️Technical analysis: ADX (57) indicates a very strong trend (watch for an overheated pullback) | MACD bearish crossover below zero, bearish momentum accelerating | EMA5 < EMA8 < EMA13, bearish alignment | KDJ bearish crossover, short-term outlook bearish (K: 53.3, D: 54.0) | Volume surge (2.9x)
════════════════════
🟢 $TSM 4-hour bearish signal
⚠️Technical analysis: ADX (61) indicates a very strong trend (watch for an overheated pullback) | MACD bearish crossover below zero, bearish momentum accelerating | EMA5 < EMA8 < EMA13, bearish alignment | KDJ bearish crossover, short-term outlook bearish (K: 40.1, D: 41.2) | Volume increase (1.7x)
════════════════════
🟢 $MUU 4-hour bearish signal
⚠️Technical analysis: ADX (38) indicates a clear trending market | MACD bearish crossover below zero, bearish momentum accelerating | EMA5 < EMA8 < EMA13, bearish alignment | KDJ bearish crossover, short-term outlook bearish (K: 48.3, D: 54.7) | Volume increase (2.4x)
════════════════════
🔔 Follow for first-hand market updates 🔔
#技术分析 #SPCX #TSM #MUU
📌 When trading, pay attention to whether the candlestick pattern confirms the signal
12
Log in to explore more content
Join global crypto users on Binance Square
⚡️ Get latest and useful information about crypto.
💬 Trusted by the world’s largest crypto exchange.
👍 Discover real insights from verified creators.
Email / Phone number
Trending Topics
1
#BinanceReopensWithdrawalsForMoreAssets
1M views
5,449 Discussing
2
#AnthropicIPOValuationDoubts
7,098 views
225 Discussing
3
#USStocksSlipandCryptoMarketUnderBroadPressure
92,671 views
641 Discussing
4
#USStocksSufferSteepestRoutSince2020
13,154 views
118 Discussing
5
#StrategySTRCResumesIssuanceAfterOver170Days
48,540 views
651 Discussing
6
#Nasdaq100Tumbles6%
23,951 views
162 Discussing
7
#GreekParliamentPasses10%CryptoCapitalGainsTaxBill
1,943 views
78 Discussing
8
#KospiSlideTriggersCircuitBreaker
4,134 views
58 Discussing
9
#ADPUSPrivateEmployersAdd86000JobsInOctober
65,045 views
724 Discussing
10
#KazakhstanReportedlyInvests$100MInCryptoFunds
4,567 views
67 Discussing