
#aapl
aapl
180,724 views
1,749 Discussing
Hot
Latest

🚨 $AAPL TIM COOK ENDS $2.4B CEO ERA AS EXECUTIVE EQUITY SHIFTS TO NEW LEADERSHIP! ⚖️
Tim Cook oversaw $2.397 billion in total compensation during his Apple tenure, with stock incentives making up 93% of institutional payout. 📊 This high-equity structure directly aligned board leadership with long-term valuation expansion, despite 2022 shareholder friction around performance weighting.
As Cook transitions to Executive Chairman and John Ternus takes over with $55M in equity awards, the structural blueprint remains firmly locked on performance incentives. 👁️ Institutional governance continues prioritizing equity over cash to maintain executive skin in the game. 💬 Does this seamless leadership transition strengthen your long-term outlook on tech equities? 👇
⚠️ Not financial advice. Always manage your risk. 🛡️
🏷️ #AAPL #TechEquity #Governance #MarketInsight #Equity
⚖️ 💎
🚨 $AAPL TIM COOK ENDS $2.4B CEO ERA AS EXECUTIVE EQUITY SHIFTS TO NEW LEADERSHIP! ⚖️
Tim Cook oversaw $2.397 billion in total compensation during his Apple tenure, with stock incentives making up 93% of institutional payout. 📊 This high-equity structure directly aligned board leadership with long-term valuation expansion, despite 2022 shareholder friction around performance weighting.
As Cook transitions to Executive Chairman and John Ternus takes over with $55M in equity awards, the structural blueprint remains firmly locked on performance incentives. 👁️ Institutional governance continues prioritizing equity over cash to maintain executive skin in the game. 💬 Does this seamless leadership transition strengthen your long-term outlook on tech equities? 👇
⚠️ Not financial advice. Always manage your risk. 🛡️
🏷️ #AAPL #TechEquity #Governance #MarketInsight #Equity
⚖️ 💎
Tim Cook oversaw $2.397 billion in total compensation during his Apple tenure, with stock incentives making up 93% of institutional payout. 📊 This high-equity structure directly aligned board leadership with long-term valuation expansion, despite 2022 shareholder friction around performance weighting.
As Cook transitions to Executive Chairman and John Ternus takes over with $55M in equity awards, the structural blueprint remains firmly locked on performance incentives. 👁️ Institutional governance continues prioritizing equity over cash to maintain executive skin in the game. 💬 Does this seamless leadership transition strengthen your long-term outlook on tech equities? 👇
⚠️ Not financial advice. Always manage your risk. 🛡️
🏷️ #AAPL #TechEquity #Governance #MarketInsight #Equity
⚖️ 💎
31

⚡ $AAPL IN TALKS WITH $NVDA TO RE-ENTER SERVER MARKET FOR AI INFERENCE! 🦈
Reports indicate $AAPL is evaluating a return to custom server hardware targeted specifically at AI inference by 2029, engaging $NVDA for core networking infrastructure. 🔍 This move highlights how top-tier tech giants are building proprietary order flow architecture to capture long-term compute dominance.
By anchoring down institutional compute capacity early, $AAPL aims to mitigate supply bottlenecks while leveraging $NVDA 's high-speed interconnects. 📊 Smart money views this deep infrastructural integration as a massive structural shift in how AI compute value will be distributed across macro cycles.
💬 Does this long-term AI infrastructure move position $AAPL to absorb serious institutional capital away from pure-play AI hardware options? 👇
⚠️ Not financial advice. Always manage your risk. 🛡️
🏷️ #AAPL #NVDA #AI #Tech #Institutional
🎯 🦈
⚡ $AAPL IN TALKS WITH $NVDA TO RE-ENTER SERVER MARKET FOR AI INFERENCE! 🦈
Reports indicate $AAPL is evaluating a return to custom server hardware targeted specifically at AI inference by 2029, engaging $NVDA for core networking infrastructure. 🔍 This move highlights how top-tier tech giants are building proprietary order flow architecture to capture long-term compute dominance.
By anchoring down institutional compute capacity early, $AAPL aims to mitigate supply bottlenecks while leveraging $NVDA 's high-speed interconnects. 📊 Smart money views this deep infrastructural integration as a massive structural shift in how AI compute value will be distributed across macro cycles.
💬 Does this long-term AI infrastructure move position $AAPL to absorb serious institutional capital away from pure-play AI hardware options? 👇
⚠️ Not financial advice. Always manage your risk. 🛡️
🏷️ #AAPL #NVDA #AI #Tech #Institutional
🎯 🦈
Reports indicate $AAPL is evaluating a return to custom server hardware targeted specifically at AI inference by 2029, engaging $NVDA for core networking infrastructure. 🔍 This move highlights how top-tier tech giants are building proprietary order flow architecture to capture long-term compute dominance.
By anchoring down institutional compute capacity early, $AAPL aims to mitigate supply bottlenecks while leveraging $NVDA 's high-speed interconnects. 📊 Smart money views this deep infrastructural integration as a massive structural shift in how AI compute value will be distributed across macro cycles.
💬 Does this long-term AI infrastructure move position $AAPL to absorb serious institutional capital away from pure-play AI hardware options? 👇
⚠️ Not financial advice. Always manage your risk. 🛡️
🏷️ #AAPL #NVDA #AI #Tech #Institutional
🎯 🦈
61

·
--
Bullish
FOMC gave the market another reason to stay volatile, but I’m more interested in what price does after the initial reaction.
$AAPLB is on my watchlist today.
The Fed delivered a 25bp hike to 3.75%–4.00%, so I’m watching tech/AI names closely. Higher rates can put pressure on growth valuations, but the real signal for me is whether buyers can hold key levels after the first move.
Apple also has its own catalyst. Reports say Apple is exploring enterprise AI inference servers built around 2 or 4 M8 Ultra chips, with NVIDIA’s NVLink Fusion reportedly part of the discussion.
I’m not chasing the headline. Reclaim, hold, then look for confirmation.
Also sharing the depth comparison here because liquidity matters a lot during macro events. The snapshot shows Binance with the deepest displayed liquidity for AAPL and NVDA among the exchanges compared, which is useful when volatility suddenly picks up.
For my $AAPLB setup:
334.6–335.4 → key reclaim zone
338.8–340.5 → upside area I’m watching
330–328 → demand if the reclaim fails
FOMC + Apple AI news gives the catalyst.
Now I just want the chart to confirm the trade. $AAPL
{spot}(AAPLBUSDT)
{future}(AAPLUSDT)
#AAPL #Apple #TrendingTopic
FOMC gave the market another reason to stay volatile, but I’m more interested in what price does after the initial reaction.
$AAPLB is on my watchlist today.
The Fed delivered a 25bp hike to 3.75%–4.00%, so I’m watching tech/AI names closely. Higher rates can put pressure on growth valuations, but the real signal for me is whether buyers can hold key levels after the first move.
Apple also has its own catalyst. Reports say Apple is exploring enterprise AI inference servers built around 2 or 4 M8 Ultra chips, with NVIDIA’s NVLink Fusion reportedly part of the discussion.
I’m not chasing the headline. Reclaim, hold, then look for confirmation.
Also sharing the depth comparison here because liquidity matters a lot during macro events. The snapshot shows Binance with the deepest displayed liquidity for AAPL and NVDA among the exchanges compared, which is useful when volatility suddenly picks up.
For my $AAPLB setup:
334.6–335.4 → key reclaim zone
338.8–340.5 → upside area I’m watching
330–328 → demand if the reclaim fails
FOMC + Apple AI news gives the catalyst.
Now I just want the chart to confirm the trade. $AAPL
#AAPL #Apple #TrendingTopic
$AAPLB is on my watchlist today.
The Fed delivered a 25bp hike to 3.75%–4.00%, so I’m watching tech/AI names closely. Higher rates can put pressure on growth valuations, but the real signal for me is whether buyers can hold key levels after the first move.
Apple also has its own catalyst. Reports say Apple is exploring enterprise AI inference servers built around 2 or 4 M8 Ultra chips, with NVIDIA’s NVLink Fusion reportedly part of the discussion.
I’m not chasing the headline. Reclaim, hold, then look for confirmation.
Also sharing the depth comparison here because liquidity matters a lot during macro events. The snapshot shows Binance with the deepest displayed liquidity for AAPL and NVDA among the exchanges compared, which is useful when volatility suddenly picks up.
For my $AAPLB setup:
334.6–335.4 → key reclaim zone
338.8–340.5 → upside area I’m watching
330–328 → demand if the reclaim fails
FOMC + Apple AI news gives the catalyst.
Now I just want the chart to confirm the trade. $AAPL
#AAPL #Apple #TrendingTopic
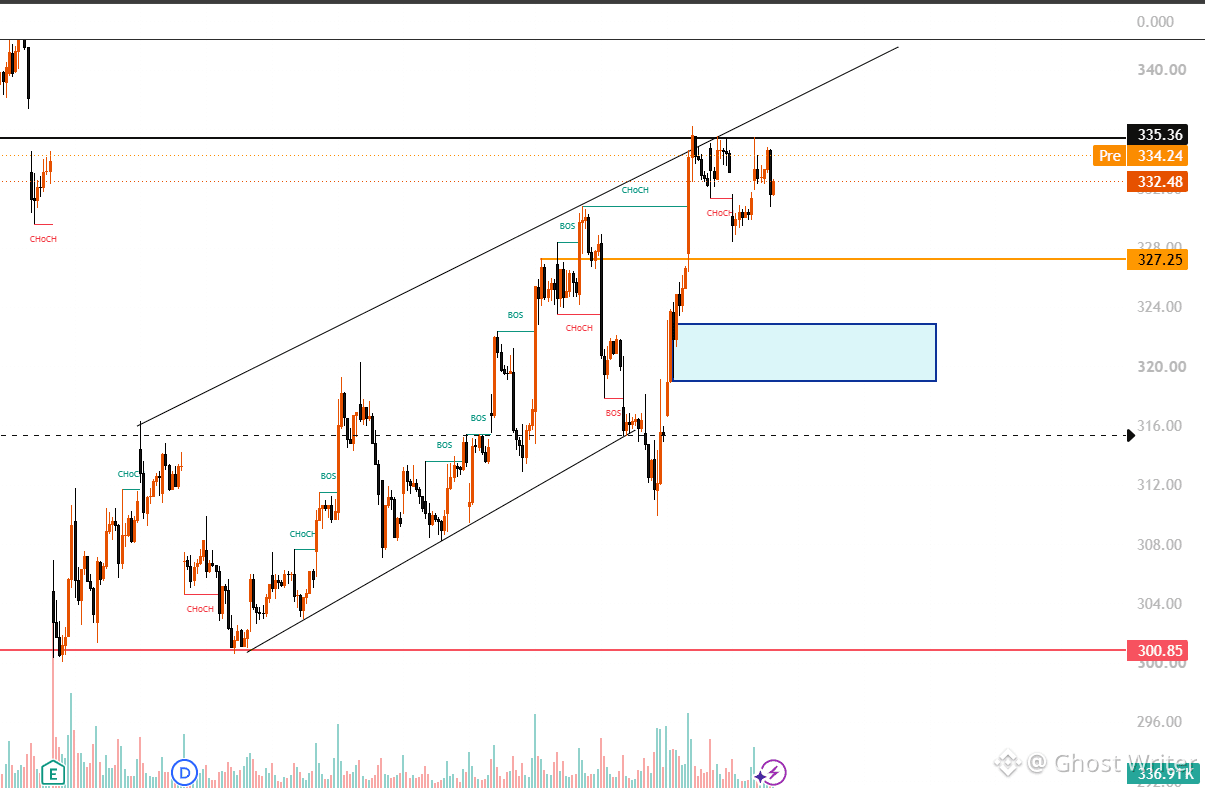
SignalX 💣:
Ghê vại
1
1
600

·
--
Bullish
hay everyone how are you
hope All is good
today is launching day of iphone 18pro max so everyone who have AAPLE stocks may bi get get profit but in October 29th must bi a great day for AAPLE stocks holder because on this day ordersale organiz. so get ready for profit 🤩#AAPL
hay everyone how are you
hope All is good
today is launching day of iphone 18pro max so everyone who have AAPLE stocks may bi get get profit but in October 29th must bi a great day for AAPLE stocks holder because on this day ordersale organiz. so get ready for profit 🤩#AAPL
hope All is good
today is launching day of iphone 18pro max so everyone who have AAPLE stocks may bi get get profit but in October 29th must bi a great day for AAPLE stocks holder because on this day ordersale organiz. so get ready for profit 🤩#AAPL
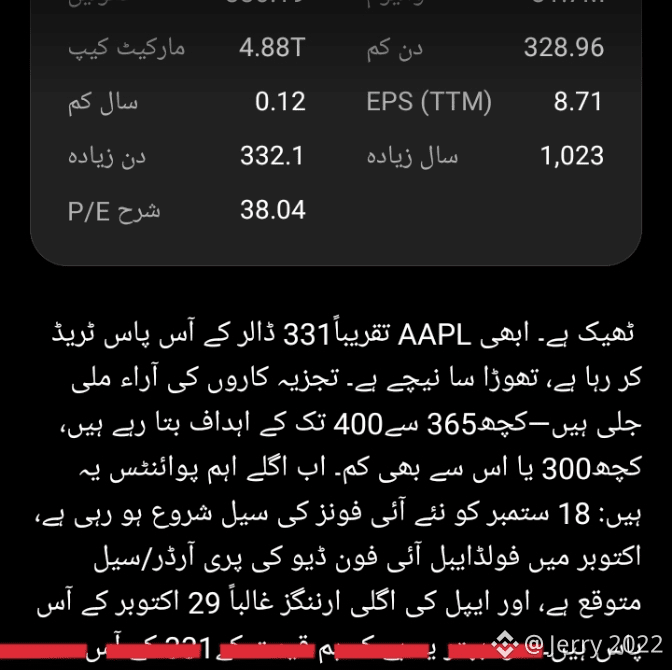
68

⚡ $AAPL IN TALKS WITH $NVDA TO DOMINATE AI INFERENCE SERVERS BY 2029! 🦈
Tech titans are positioning their chess pieces for the long game. $AAPL is eyeing a massive return to the server market, holding strategic talks with $NVDA to harness their networking firepower for dedicated AI inference infrastructure. 📊
While a 2029 rollout seems distant to retail traders, smart money understands that institutional capital builds order flow years ahead of execution. 💡 This strategic alignment signals an unprecedented expansion of the AI compute narrative that will ripple across connected markets. 🌊
💬 Do you think this long-term partnership consolidates total AI hardware dominance between these two giants? 👇
⚠️ Not financial advice. Always manage your risk. 🛡️
🏷️ #AAPL #NVDA #AI #ArtificialIntelligence #Tech
🔥 💎
⚡ $AAPL IN TALKS WITH $NVDA TO DOMINATE AI INFERENCE SERVERS BY 2029! 🦈
Tech titans are positioning their chess pieces for the long game. $AAPL is eyeing a massive return to the server market, holding strategic talks with $NVDA to harness their networking firepower for dedicated AI inference infrastructure. 📊
While a 2029 rollout seems distant to retail traders, smart money understands that institutional capital builds order flow years ahead of execution. 💡 This strategic alignment signals an unprecedented expansion of the AI compute narrative that will ripple across connected markets. 🌊
💬 Do you think this long-term partnership consolidates total AI hardware dominance between these two giants? 👇
⚠️ Not financial advice. Always manage your risk. 🛡️
🏷️ #AAPL #NVDA #AI #ArtificialIntelligence #Tech
🔥 💎
Tech titans are positioning their chess pieces for the long game. $AAPL is eyeing a massive return to the server market, holding strategic talks with $NVDA to harness their networking firepower for dedicated AI inference infrastructure. 📊
While a 2029 rollout seems distant to retail traders, smart money understands that institutional capital builds order flow years ahead of execution. 💡 This strategic alignment signals an unprecedented expansion of the AI compute narrative that will ripple across connected markets. 🌊
💬 Do you think this long-term partnership consolidates total AI hardware dominance between these two giants? 👇
⚠️ Not financial advice. Always manage your risk. 🛡️
🏷️ #AAPL #NVDA #AI #ArtificialIntelligence #Tech
🔥 💎
96

·
--
The landscape for $AAPL has shifted, and the current order flow is flashing a high-probability opportunity for those playing the downside. I am locked into this setup as price hits the target zone.
⚡ $AAPL — SHORT SETUP
📍 Entry: 339.1 – 341.13
🎯 TP1: 335.05
🎯 TP2: 332.35
🎯 TP3: 328.29
🛑 Stop Loss: 343.15
Trade here 👇
📌 Trade management rules: see pinned post.
Do you see this pushing lower today, or is a bounce imminent? Drop your thoughts below and follow for more trade setups.
#WriteToEarn #AAPL #CryptoTrading #BinanceSquare #Crypto
The landscape for $AAPL has shifted, and the current order flow is flashing a high-probability opportunity for those playing the downside. I am locked into this setup as price hits the target zone.
⚡ $AAPL — SHORT SETUP
📍 Entry: 339.1 – 341.13
🎯 TP1: 335.05
🎯 TP2: 332.35
🎯 TP3: 328.29
🛑 Stop Loss: 343.15
Trade here 👇
📌 Trade management rules: see pinned post.
Do you see this pushing lower today, or is a bounce imminent? Drop your thoughts below and follow for more trade setups.
#WriteToEarn #AAPL #CryptoTrading #BinanceSquare #Crypto
⚡ $AAPL — SHORT SETUP
📍 Entry: 339.1 – 341.13
🎯 TP1: 335.05
🎯 TP2: 332.35
🎯 TP3: 328.29
🛑 Stop Loss: 343.15
Trade here 👇
📌 Trade management rules: see pinned post.
Do you see this pushing lower today, or is a bounce imminent? Drop your thoughts below and follow for more trade setups.
#WriteToEarn #AAPL #CryptoTrading #BinanceSquare #Crypto
1
29

·
--
🚨 APPLE TARGETS 25 PERCENT FOLDABLE DOMINANCE AS $AAPL RESTRUCTURES PREMIUM TECH MARKET! 🦈
Apple is executing a classic institutional market capture strategy with the $1,999 iPhone Duo launch. 📊 By targeting a 25% share of the global foldable market by year-end, smart capital is positioning around high-margin hardware upgrades despite broader macro compression. ⚡
The structural differentiation lies in supply chain dominance and 2nm architecture integration, setting a firm valuation baseline for premium tech. 💡 While retail questions the heavy price tag, institutional order flow reflects high-conviction demand for flagship ecosystem expansion. 🌊
💬 Does Apple capture institutional market share seamlessly, or will initial supply constraints trigger a liquidity retest? 👇
⚠️ Not financial advice. Always manage your risk. 🛡️
🏷️ #AAPL #TechMacro #MarketStructure #Institutional #Liquidity
🎯 🦈
🚨 APPLE TARGETS 25 PERCENT FOLDABLE DOMINANCE AS $AAPL RESTRUCTURES PREMIUM TECH MARKET! 🦈
Apple is executing a classic institutional market capture strategy with the $1,999 iPhone Duo launch. 📊 By targeting a 25% share of the global foldable market by year-end, smart capital is positioning around high-margin hardware upgrades despite broader macro compression. ⚡
The structural differentiation lies in supply chain dominance and 2nm architecture integration, setting a firm valuation baseline for premium tech. 💡 While retail questions the heavy price tag, institutional order flow reflects high-conviction demand for flagship ecosystem expansion. 🌊
💬 Does Apple capture institutional market share seamlessly, or will initial supply constraints trigger a liquidity retest? 👇
⚠️ Not financial advice. Always manage your risk. 🛡️
🏷️ #AAPL #TechMacro #MarketStructure #Institutional #Liquidity
🎯 🦈
Apple is executing a classic institutional market capture strategy with the $1,999 iPhone Duo launch. 📊 By targeting a 25% share of the global foldable market by year-end, smart capital is positioning around high-margin hardware upgrades despite broader macro compression. ⚡
The structural differentiation lies in supply chain dominance and 2nm architecture integration, setting a firm valuation baseline for premium tech. 💡 While retail questions the heavy price tag, institutional order flow reflects high-conviction demand for flagship ecosystem expansion. 🌊
💬 Does Apple capture institutional market share seamlessly, or will initial supply constraints trigger a liquidity retest? 👇
⚠️ Not financial advice. Always manage your risk. 🛡️
🏷️ #AAPL #TechMacro #MarketStructure #Institutional #Liquidity
🎯 🦈
57

⚡ APPLE ENTERS THE FOLDABLE ARENA AS $AAPL BATTLES FOR 25 PERCENT MARKET SHARE! 🦈
Apple is officially stepping onto rival turf with the $1,999 iPhone Duo, packing a 2nm A20 Pro chip and IP68 rating to capture a quarter of the foldable market by year-end. 📊 While competitors retain the edge on weight and multitasking, Apple is betting heavy on premium build quality and raw processing power to sweep high-end demand. 🌊
With up to 6 million units projected to ship in Q4, this hardware showdown signals a massive liquidity shift in consumer tech spending ahead of the holiday cycle. 💡 The ultimate test sits in real-world execution as buyers weigh top-tier specs against steep pricing. 💬 Do you think Apple's premium entry reclaims dominant market share or will high price points cap its upside? 👇
⚠️ Not financial advice. Always manage your risk. 🛡️
🏷️ #AAPL #Tech #Innovation #MarketTrends #Apple
🔥 💎
⚡ APPLE ENTERS THE FOLDABLE ARENA AS $AAPL BATTLES FOR 25 PERCENT MARKET SHARE! 🦈
Apple is officially stepping onto rival turf with the $1,999 iPhone Duo, packing a 2nm A20 Pro chip and IP68 rating to capture a quarter of the foldable market by year-end. 📊 While competitors retain the edge on weight and multitasking, Apple is betting heavy on premium build quality and raw processing power to sweep high-end demand. 🌊
With up to 6 million units projected to ship in Q4, this hardware showdown signals a massive liquidity shift in consumer tech spending ahead of the holiday cycle. 💡 The ultimate test sits in real-world execution as buyers weigh top-tier specs against steep pricing. 💬 Do you think Apple's premium entry reclaims dominant market share or will high price points cap its upside? 👇
⚠️ Not financial advice. Always manage your risk. 🛡️
🏷️ #AAPL #Tech #Innovation #MarketTrends #Apple
🔥 💎
Apple is officially stepping onto rival turf with the $1,999 iPhone Duo, packing a 2nm A20 Pro chip and IP68 rating to capture a quarter of the foldable market by year-end. 📊 While competitors retain the edge on weight and multitasking, Apple is betting heavy on premium build quality and raw processing power to sweep high-end demand. 🌊
With up to 6 million units projected to ship in Q4, this hardware showdown signals a massive liquidity shift in consumer tech spending ahead of the holiday cycle. 💡 The ultimate test sits in real-world execution as buyers weigh top-tier specs against steep pricing. 💬 Do you think Apple's premium entry reclaims dominant market share or will high price points cap its upside? 👇
⚠️ Not financial advice. Always manage your risk. 🛡️
🏷️ #AAPL #Tech #Innovation #MarketTrends #Apple
🔥 💎
90

·
--
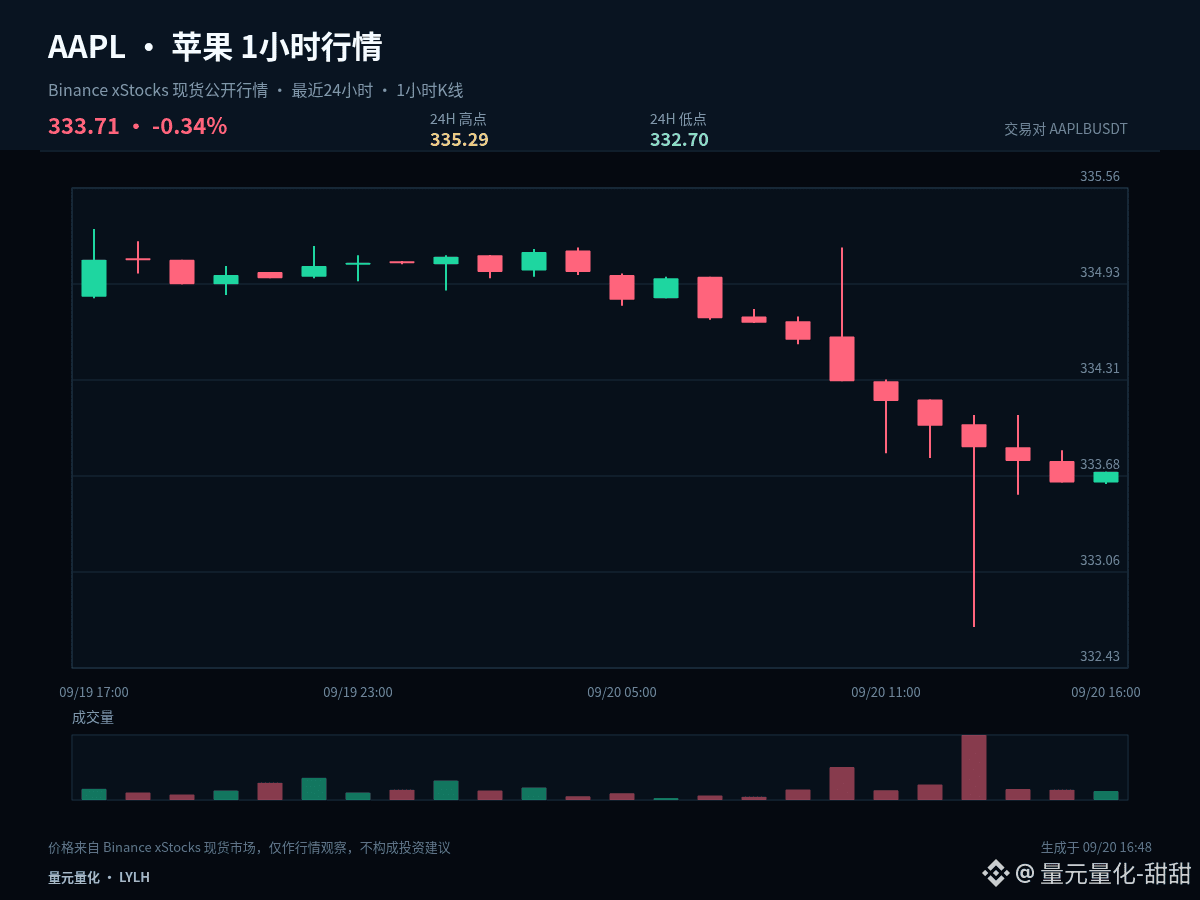
$AAPLB #AAPL Do a structural review. Current price 333.71, 1-hour +0.02%, 24-hour -0.34%, and the recent 24-hour range amplitude is about 0.8%.
Currently, 1-hour is +0.02% and 24-hour is -0.34%; across the two periods, there hasn’t been sufficiently clear directional alignment. In a range-bound market, the margin of error for chasing rallies and cutting losses is low. It’s more suitable to use the upper-band confirmation for direction and the lower-band confirmation for takeovers/defense, with the midline serving only as a line separating strength and weakness.
Key levels from the review: 333.995 determines short-term initiative; 335.29 is used to confirm upside room; 332.7 is used to observe downside defense. Going forward, there’s no need to guess every step—just check whether the original judgment still holds when price passes through these levels.
If the market matches expectations, manage profits in segments and continue raising protection; if it doesn’t, acknowledge the change in conditions in a timely manner. Professional trading isn’t about always being right—it’s about staying consistent in execution even after information updates.
Position management should distinguish between swing/medium-term and short-term. For existing swing positions, first check whether the structure has broken; don’t let repeated single 1-hour candles affect you. For short-term positions, execute around support, resistance, and closing confirmation. If you’re in cash, there’s no need to chase price in the middle of the range; waiting for a clearer location usually has an advantage.
The real disagreement in this move is whether it will continue or revert to the range. Will you wait for a breakout confirmation, or wait for a support pullback? Tell me the price you’re most focused on.
#HKCompletesFirstHKDStablecoinUseCase
$AAPLB #AAPL Do a structural review. Current price 333.71, 1-hour +0.02%, 24-hour -0.34%, and the recent 24-hour range amplitude is about 0.8%.
Currently, 1-hour is +0.02% and 24-hour is -0.34%; across the two periods, there hasn’t been sufficiently clear directional alignment. In a range-bound market, the margin of error for chasing rallies and cutting losses is low. It’s more suitable to use the upper-band confirmation for direction and the lower-band confirmation for takeovers/defense, with the midline serving only as a line separating strength and weakness.
Key levels from the review: 333.995 determines short-term initiative; 335.29 is used to confirm upside room; 332.7 is used to observe downside defense. Going forward, there’s no need to guess every step—just check whether the original judgment still holds when price passes through these levels.
If the market matches expectations, manage profits in segments and continue raising protection; if it doesn’t, acknowledge the change in conditions in a timely manner. Professional trading isn’t about always being right—it’s about staying consistent in execution even after information updates.
Position management should distinguish between swing/medium-term and short-term. For existing swing positions, first check whether the structure has broken; don’t let repeated single 1-hour candles affect you. For short-term positions, execute around support, resistance, and closing confirmation. If you’re in cash, there’s no need to chase price in the middle of the range; waiting for a clearer location usually has an advantage.
The real disagreement in this move is whether it will continue or revert to the range. Will you wait for a breakout confirmation, or wait for a support pullback? Tell me the price you’re most focused on.
#HKCompletesFirstHKDStablecoinUseCase
Currently, 1-hour is +0.02% and 24-hour is -0.34%; across the two periods, there hasn’t been sufficiently clear directional alignment. In a range-bound market, the margin of error for chasing rallies and cutting losses is low. It’s more suitable to use the upper-band confirmation for direction and the lower-band confirmation for takeovers/defense, with the midline serving only as a line separating strength and weakness.
Key levels from the review: 333.995 determines short-term initiative; 335.29 is used to confirm upside room; 332.7 is used to observe downside defense. Going forward, there’s no need to guess every step—just check whether the original judgment still holds when price passes through these levels.
If the market matches expectations, manage profits in segments and continue raising protection; if it doesn’t, acknowledge the change in conditions in a timely manner. Professional trading isn’t about always being right—it’s about staying consistent in execution even after information updates.
Position management should distinguish between swing/medium-term and short-term. For existing swing positions, first check whether the structure has broken; don’t let repeated single 1-hour candles affect you. For short-term positions, execute around support, resistance, and closing confirmation. If you’re in cash, there’s no need to chase price in the middle of the range; waiting for a clearer location usually has an advantage.
The real disagreement in this move is whether it will continue or revert to the range. Will you wait for a breakout confirmation, or wait for a support pullback? Tell me the price you’re most focused on.
#HKCompletesFirstHKDStablecoinUseCase
25

·
--
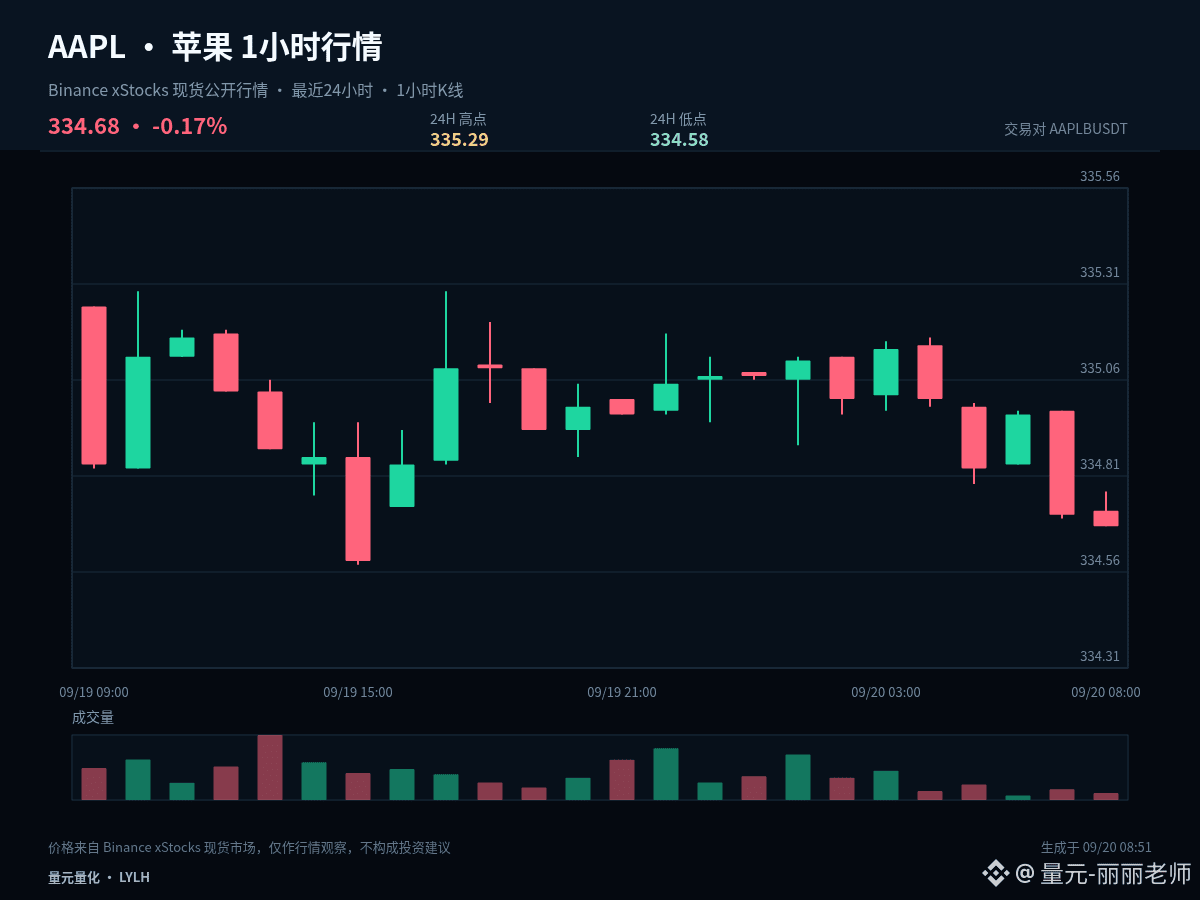
$AAPLB #AAPL Can this market continue? It doesn’t depend on how much it has risen before; it depends on whether the trend can complete the “push, consolidate, and then reconfirm” sequence. Current 1-hour change: -0.01%; 24-hour change: -0.11%.
The current price is close to the lower bound of the past 24 hours’ fluctuation. It’s -0.01% over 1 hour and -0.11% over 24 hours. The core of low-zone analysis is not trying to catch the bottom early; it’s observing whether the price can quickly reclaim after breaking below. If it can reclaim, that indicates selling pressure has been absorbed. If it continues to stay below the lower bound, it means weakness has not ended.
The first condition for a continuation structure is that 334.935 is not effectively broken below. The second condition is that the price can retest and hold above 335.29 again. If, after pushing, it stays in the range long-term below the midline, it suggests that active buying has weakened. If it further breaks 334.58, the original continuation assumption must be canceled.
For execution, set clear conditions: after breaking above 335.29, you need confirmation—not chasing just because of a momentary spike. After dipping to 334.58, watch whether it can quickly reclaim—not place bids just because it’s dropping. If the middle zone doesn’t offer sufficient reward-to-risk, waiting is also part of the strategy.
Position management should distinguish between swing trades and day trades. For existing swing positions, first assess whether the structure is broken; don’t be repeatedly influenced by single 1-hour candlesticks. For short-term positions, execute around support, resistance, and end-of-candle confirmation. If you’re currently in cash, you don’t need to chase the price in the middle of the range—waiting for clearer levels often has the advantage.
The focus for short-term positioning isn’t to predict every candlestick. It’s to ensure that entries, partial reductions, and exits all have a basis. Do less without confirmation. If key levels fail, redo the plan. Control single-trade risk first, then discuss the subsequent upside or downside potential.
#BTCBreaks80K
$AAPLB #AAPL Can this market continue? It doesn’t depend on how much it has risen before; it depends on whether the trend can complete the “push, consolidate, and then reconfirm” sequence. Current 1-hour change: -0.01%; 24-hour change: -0.11%.
The current price is close to the lower bound of the past 24 hours’ fluctuation. It’s -0.01% over 1 hour and -0.11% over 24 hours. The core of low-zone analysis is not trying to catch the bottom early; it’s observing whether the price can quickly reclaim after breaking below. If it can reclaim, that indicates selling pressure has been absorbed. If it continues to stay below the lower bound, it means weakness has not ended.
The first condition for a continuation structure is that 334.935 is not effectively broken below. The second condition is that the price can retest and hold above 335.29 again. If, after pushing, it stays in the range long-term below the midline, it suggests that active buying has weakened. If it further breaks 334.58, the original continuation assumption must be canceled.
For execution, set clear conditions: after breaking above 335.29, you need confirmation—not chasing just because of a momentary spike. After dipping to 334.58, watch whether it can quickly reclaim—not place bids just because it’s dropping. If the middle zone doesn’t offer sufficient reward-to-risk, waiting is also part of the strategy.
Position management should distinguish between swing trades and day trades. For existing swing positions, first assess whether the structure is broken; don’t be repeatedly influenced by single 1-hour candlesticks. For short-term positions, execute around support, resistance, and end-of-candle confirmation. If you’re currently in cash, you don’t need to chase the price in the middle of the range—waiting for clearer levels often has the advantage.
The focus for short-term positioning isn’t to predict every candlestick. It’s to ensure that entries, partial reductions, and exits all have a basis. Do less without confirmation. If key levels fail, redo the plan. Control single-trade risk first, then discuss the subsequent upside or downside potential.
#BTCBreaks80K
The current price is close to the lower bound of the past 24 hours’ fluctuation. It’s -0.01% over 1 hour and -0.11% over 24 hours. The core of low-zone analysis is not trying to catch the bottom early; it’s observing whether the price can quickly reclaim after breaking below. If it can reclaim, that indicates selling pressure has been absorbed. If it continues to stay below the lower bound, it means weakness has not ended.
The first condition for a continuation structure is that 334.935 is not effectively broken below. The second condition is that the price can retest and hold above 335.29 again. If, after pushing, it stays in the range long-term below the midline, it suggests that active buying has weakened. If it further breaks 334.58, the original continuation assumption must be canceled.
For execution, set clear conditions: after breaking above 335.29, you need confirmation—not chasing just because of a momentary spike. After dipping to 334.58, watch whether it can quickly reclaim—not place bids just because it’s dropping. If the middle zone doesn’t offer sufficient reward-to-risk, waiting is also part of the strategy.
Position management should distinguish between swing trades and day trades. For existing swing positions, first assess whether the structure is broken; don’t be repeatedly influenced by single 1-hour candlesticks. For short-term positions, execute around support, resistance, and end-of-candle confirmation. If you’re currently in cash, you don’t need to chase the price in the middle of the range—waiting for clearer levels often has the advantage.
The focus for short-term positioning isn’t to predict every candlestick. It’s to ensure that entries, partial reductions, and exits all have a basis. Do less without confirmation. If key levels fail, redo the plan. Control single-trade risk first, then discuss the subsequent upside or downside potential.
#BTCBreaks80K
43
🚨 $AAPL IPHONE 18 PRO DEMAND FALTERS AS INSTITUTIONS SLASH PRODUCTION TARGETS 📉
Target: 369 🚀
Smart money analysts are recalibrating expectations for $AAPL as initial iPhone 18 Pro order flow points toward institutional distribution rather than aggressive accumulation. 📊 GF Securities downgraded production targets down to 72 million units following sluggish presale lead times across global markets, particularly in China.
🔍 Extended delivery windows have narrowed significantly compared to previous cycles, signaling an inefficiency fill in retail demand. With consumer capital potentially shifting toward upcoming foldable hardware releases, supply chain metrics suggest institutional liquidity is holding back until structural clarity emerges. 💬 Are you trimming exposure on this structural weakness or waiting for demand reclaims? 👇
⚠️ Not financial advice. Always manage your risk. 🛡️
🏷️ #AAPL #Apple #Tech #MarketAnalysis #Stocks
🎯 🦈
🚨 $AAPL IPHONE 18 PRO DEMAND FALTERS AS INSTITUTIONS SLASH PRODUCTION TARGETS 📉
Target: 369 🚀
Smart money analysts are recalibrating expectations for $AAPL as initial iPhone 18 Pro order flow points toward institutional distribution rather than aggressive accumulation. 📊 GF Securities downgraded production targets down to 72 million units following sluggish presale lead times across global markets, particularly in China.
🔍 Extended delivery windows have narrowed significantly compared to previous cycles, signaling an inefficiency fill in retail demand. With consumer capital potentially shifting toward upcoming foldable hardware releases, supply chain metrics suggest institutional liquidity is holding back until structural clarity emerges. 💬 Are you trimming exposure on this structural weakness or waiting for demand reclaims? 👇
⚠️ Not financial advice. Always manage your risk. 🛡️
🏷️ #AAPL #Apple #Tech #MarketAnalysis #Stocks
🎯 🦈
Target: 369 🚀
Smart money analysts are recalibrating expectations for $AAPL as initial iPhone 18 Pro order flow points toward institutional distribution rather than aggressive accumulation. 📊 GF Securities downgraded production targets down to 72 million units following sluggish presale lead times across global markets, particularly in China.
🔍 Extended delivery windows have narrowed significantly compared to previous cycles, signaling an inefficiency fill in retail demand. With consumer capital potentially shifting toward upcoming foldable hardware releases, supply chain metrics suggest institutional liquidity is holding back until structural clarity emerges. 💬 Are you trimming exposure on this structural weakness or waiting for demand reclaims? 👇
⚠️ Not financial advice. Always manage your risk. 🛡️
🏷️ #AAPL #Apple #Tech #MarketAnalysis #Stocks
🎯 🦈
48

🚨 SOFT IPHONE 18 DEMAND TRIMS $AAPL PRODUCTION TO 72M UNITS AS BUYERS HESITATE! 📉
Jeff Pu from GF Securities just cut $AAPL iPhone 18 Pro production estimates down to 72M units after pre-order lead times came in unexpectedly lukewarm. 📊 Hardware upgrades feel incremental, and steep pricing on high-storage tiers is clearly capping consumer appetite.
Meanwhile, JP Morgan notes shorter global delivery windows, suggesting buyers in key markets are holding out for the high-end foldable Duo launching next month. 💡 With supply chain bottlenecks hitting both traditional models and hinges, tech momentum is facing an early-cycle reality check. 🔍
💬 Is this soft pre-order data an early top for tech valuation, or just capital waiting on the sidelines for the foldable pivot? 👇
⚠️ Not financial advice. Always manage your risk. 🛡️
🏷️ #AAPL #TechStocks #MarketAnalysis #Macro
🔥 💎
🚨 SOFT IPHONE 18 DEMAND TRIMS $AAPL PRODUCTION TO 72M UNITS AS BUYERS HESITATE! 📉
Jeff Pu from GF Securities just cut $AAPL iPhone 18 Pro production estimates down to 72M units after pre-order lead times came in unexpectedly lukewarm. 📊 Hardware upgrades feel incremental, and steep pricing on high-storage tiers is clearly capping consumer appetite.
Meanwhile, JP Morgan notes shorter global delivery windows, suggesting buyers in key markets are holding out for the high-end foldable Duo launching next month. 💡 With supply chain bottlenecks hitting both traditional models and hinges, tech momentum is facing an early-cycle reality check. 🔍
💬 Is this soft pre-order data an early top for tech valuation, or just capital waiting on the sidelines for the foldable pivot? 👇
⚠️ Not financial advice. Always manage your risk. 🛡️
🏷️ #AAPL #TechStocks #MarketAnalysis #Macro
🔥 💎
Jeff Pu from GF Securities just cut $AAPL iPhone 18 Pro production estimates down to 72M units after pre-order lead times came in unexpectedly lukewarm. 📊 Hardware upgrades feel incremental, and steep pricing on high-storage tiers is clearly capping consumer appetite.
Meanwhile, JP Morgan notes shorter global delivery windows, suggesting buyers in key markets are holding out for the high-end foldable Duo launching next month. 💡 With supply chain bottlenecks hitting both traditional models and hinges, tech momentum is facing an early-cycle reality check. 🔍
💬 Is this soft pre-order data an early top for tech valuation, or just capital waiting on the sidelines for the foldable pivot? 👇
⚠️ Not financial advice. Always manage your risk. 🛡️
🏷️ #AAPL #TechStocks #MarketAnalysis #Macro
🔥 💎
64
·
--
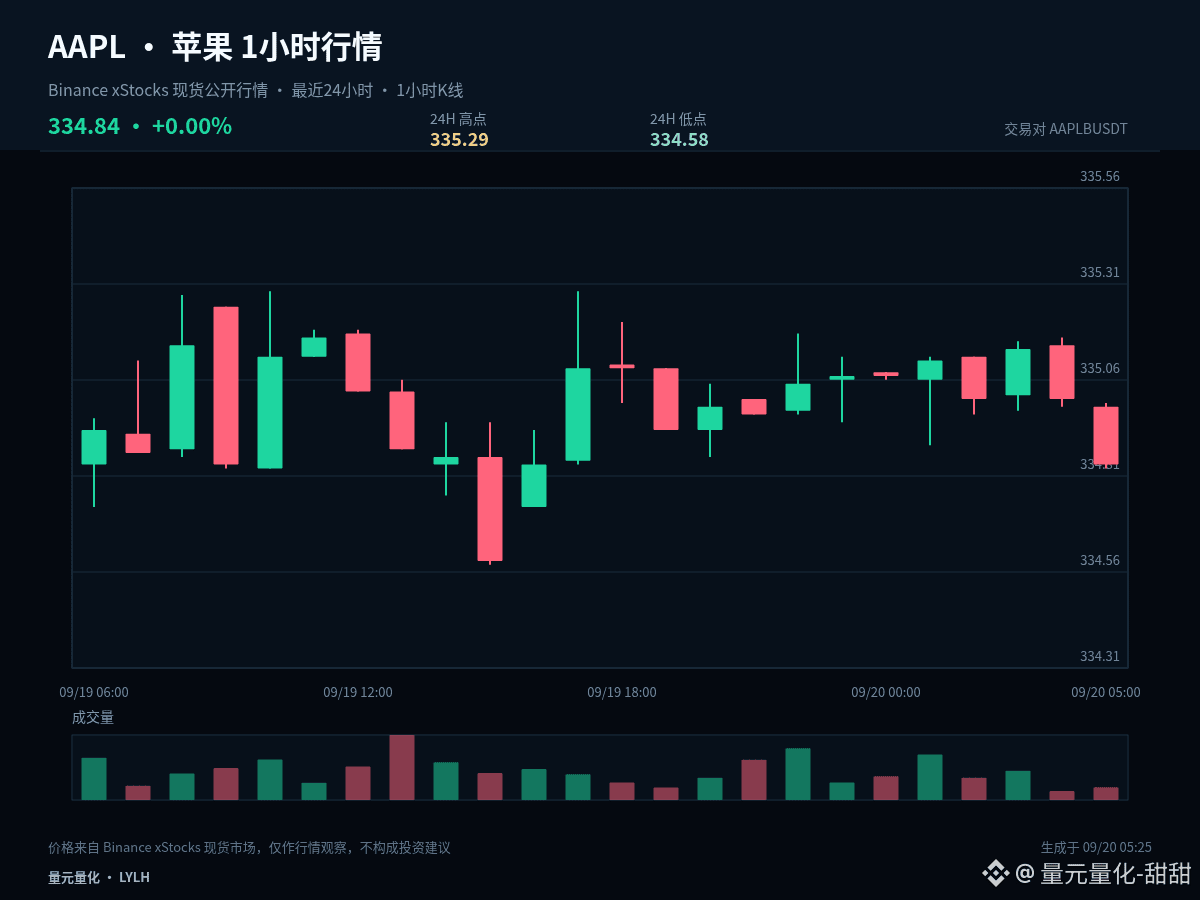
$AAPLB #AAPL Current price 334.84, 1 hour -0.05%, 24 hours -0.12%. Rather than commit to being long or short first, it’s better to list the possible paths and the corresponding actions.
Currently, over the past 1 hour (-0.05%) and 24 hours (-0.12%), the two cycles have not formed a sufficiently clear, same-direction alignment. In range-bound markets, the tolerance for chasing and killing (buying into strength or selling into weakness) is low. It’s more suitable to confirm the direction using the upper boundary first, then confirm the support on the lower boundary; the midline should only serve as a strong/weak dividing line.
The first path is upward: the price needs to break above 335.29 and form a stable closing above it. Only then can a pullback that does not break be considered a valid confirmation. The second path is downward: once 334.58 is lost and the subsequent retest fails to reclaim it (cannot close back), it indicates insufficient support. In that case, prioritize defense rather than rushing to add positions.
If the price continues to stay between 335.29 and 334.58, 334.935 should be used only as a reference for short-term initiative. The middle of the range has no clear advantage—don’t force an entry just to feel involved; wait for the market to reveal the direction.
Position management should distinguish between swing (mid-term) and short-term trades. For existing swing positions, first check whether the structure is broken; don’t let repeated single 1-hour candlesticks repeatedly sway you. For short-term positions, execute around support, resistance, and closing confirmations. If you’re currently in cash (no position), there’s no need to chase the price in the middle of the range—waiting for clearer levels usually offers an edge.
A trading plan must include invalidation conditions. If your judgment is correct, you can realize it in stages. If your judgment is wrong, you must also allow yourself to exit—you can’t hide the fact that the original logic has changed by adding more. The market will update, and your view should adjust alongside the price evidence.
#BuffettStepsDownAsBerkshireChairman
$AAPLB #AAPL Current price 334.84, 1 hour -0.05%, 24 hours -0.12%. Rather than commit to being long or short first, it’s better to list the possible paths and the corresponding actions.
Currently, over the past 1 hour (-0.05%) and 24 hours (-0.12%), the two cycles have not formed a sufficiently clear, same-direction alignment. In range-bound markets, the tolerance for chasing and killing (buying into strength or selling into weakness) is low. It’s more suitable to confirm the direction using the upper boundary first, then confirm the support on the lower boundary; the midline should only serve as a strong/weak dividing line.
The first path is upward: the price needs to break above 335.29 and form a stable closing above it. Only then can a pullback that does not break be considered a valid confirmation. The second path is downward: once 334.58 is lost and the subsequent retest fails to reclaim it (cannot close back), it indicates insufficient support. In that case, prioritize defense rather than rushing to add positions.
If the price continues to stay between 335.29 and 334.58, 334.935 should be used only as a reference for short-term initiative. The middle of the range has no clear advantage—don’t force an entry just to feel involved; wait for the market to reveal the direction.
Position management should distinguish between swing (mid-term) and short-term trades. For existing swing positions, first check whether the structure is broken; don’t let repeated single 1-hour candlesticks repeatedly sway you. For short-term positions, execute around support, resistance, and closing confirmations. If you’re currently in cash (no position), there’s no need to chase the price in the middle of the range—waiting for clearer levels usually offers an edge.
A trading plan must include invalidation conditions. If your judgment is correct, you can realize it in stages. If your judgment is wrong, you must also allow yourself to exit—you can’t hide the fact that the original logic has changed by adding more. The market will update, and your view should adjust alongside the price evidence.
#BuffettStepsDownAsBerkshireChairman
Currently, over the past 1 hour (-0.05%) and 24 hours (-0.12%), the two cycles have not formed a sufficiently clear, same-direction alignment. In range-bound markets, the tolerance for chasing and killing (buying into strength or selling into weakness) is low. It’s more suitable to confirm the direction using the upper boundary first, then confirm the support on the lower boundary; the midline should only serve as a strong/weak dividing line.
The first path is upward: the price needs to break above 335.29 and form a stable closing above it. Only then can a pullback that does not break be considered a valid confirmation. The second path is downward: once 334.58 is lost and the subsequent retest fails to reclaim it (cannot close back), it indicates insufficient support. In that case, prioritize defense rather than rushing to add positions.
If the price continues to stay between 335.29 and 334.58, 334.935 should be used only as a reference for short-term initiative. The middle of the range has no clear advantage—don’t force an entry just to feel involved; wait for the market to reveal the direction.
Position management should distinguish between swing (mid-term) and short-term trades. For existing swing positions, first check whether the structure is broken; don’t let repeated single 1-hour candlesticks repeatedly sway you. For short-term positions, execute around support, resistance, and closing confirmations. If you’re currently in cash (no position), there’s no need to chase the price in the middle of the range—waiting for clearer levels usually offers an edge.
A trading plan must include invalidation conditions. If your judgment is correct, you can realize it in stages. If your judgment is wrong, you must also allow yourself to exit—you can’t hide the fact that the original logic has changed by adding more. The market will update, and your view should adjust alongside the price evidence.
#BuffettStepsDownAsBerkshireChairman
6
·
--
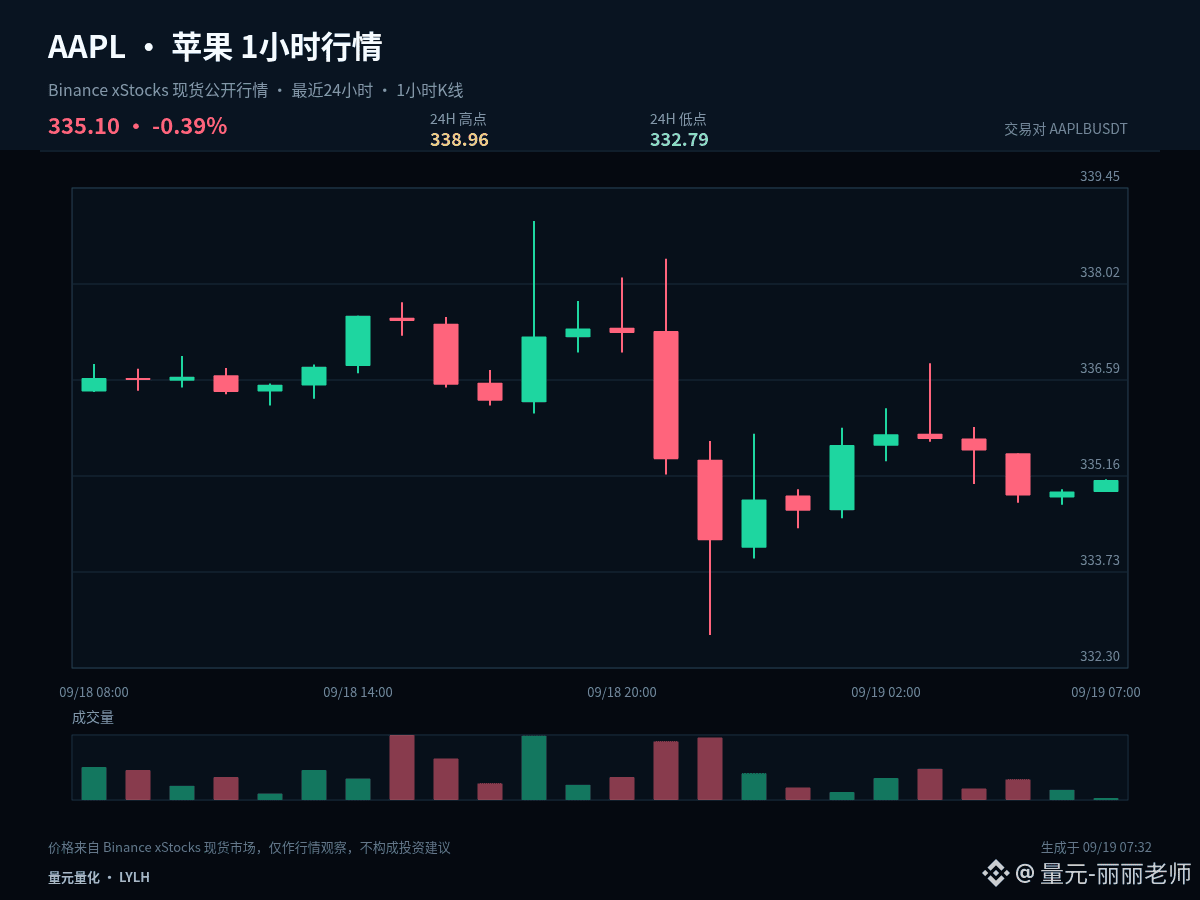
$AAPLB #AAPL From a layout perspective, the focus isn’t on chasing the fluctuations that have already happened, but on determining in advance the position you are willing to wait for. Current price: 335.1; 1 hour +0.05%, 24 hours -0.46%.
Currently, 1 hour is +0.05% and 24 hours is -0.46%, and the two cycles have not formed sufficiently clear directional coordination. In a range-bound market, the tolerance for chasing and selling is lower; it’s more suitable to use the upper band to confirm direction and the lower band to confirm follow-through, with the midline only serving as a strength/weakness divider.
The first observation zone is 335.875, used to judge whether a normal pullback has ended. The second observation zone is 332.79, used to judge whether a deeper retracement can form follow-through. On the upside, watch 338.96; after a breakout, a pullback confirmation is needed to avoid mistaking a brief piercing move for an already-open trend.
Existing positions can be handled in segments according to key levels to avoid making all decisions at once. For those in cash, wait for breakout confirmation or pullback stabilization. For U.S. stock-related assets, also be mindful of volatility caused by trading session transitions. Your plan should be based on price conditions rather than letting emotions replace execution.
The significance of scaling in isn’t to keep averaging down endlessly; it’s to control the pace while the structure remains valid. Once key support fails, you should stop the original layout plan and wait for a new price range to form.
For short-term positioning, the key isn’t to predict every candlestick, but to ensure that entries, trimming, and exits have a basis. If there’s no confirmation, do less. If key levels fail, redo the plan—control single-trade risk first, then discuss potential upside.
#BTCBreaks80K
$AAPLB #AAPL From a layout perspective, the focus isn’t on chasing the fluctuations that have already happened, but on determining in advance the position you are willing to wait for. Current price: 335.1; 1 hour +0.05%, 24 hours -0.46%.
Currently, 1 hour is +0.05% and 24 hours is -0.46%, and the two cycles have not formed sufficiently clear directional coordination. In a range-bound market, the tolerance for chasing and selling is lower; it’s more suitable to use the upper band to confirm direction and the lower band to confirm follow-through, with the midline only serving as a strength/weakness divider.
The first observation zone is 335.875, used to judge whether a normal pullback has ended. The second observation zone is 332.79, used to judge whether a deeper retracement can form follow-through. On the upside, watch 338.96; after a breakout, a pullback confirmation is needed to avoid mistaking a brief piercing move for an already-open trend.
Existing positions can be handled in segments according to key levels to avoid making all decisions at once. For those in cash, wait for breakout confirmation or pullback stabilization. For U.S. stock-related assets, also be mindful of volatility caused by trading session transitions. Your plan should be based on price conditions rather than letting emotions replace execution.
The significance of scaling in isn’t to keep averaging down endlessly; it’s to control the pace while the structure remains valid. Once key support fails, you should stop the original layout plan and wait for a new price range to form.
For short-term positioning, the key isn’t to predict every candlestick, but to ensure that entries, trimming, and exits have a basis. If there’s no confirmation, do less. If key levels fail, redo the plan—control single-trade risk first, then discuss potential upside.
#BTCBreaks80K
Currently, 1 hour is +0.05% and 24 hours is -0.46%, and the two cycles have not formed sufficiently clear directional coordination. In a range-bound market, the tolerance for chasing and selling is lower; it’s more suitable to use the upper band to confirm direction and the lower band to confirm follow-through, with the midline only serving as a strength/weakness divider.
The first observation zone is 335.875, used to judge whether a normal pullback has ended. The second observation zone is 332.79, used to judge whether a deeper retracement can form follow-through. On the upside, watch 338.96; after a breakout, a pullback confirmation is needed to avoid mistaking a brief piercing move for an already-open trend.
Existing positions can be handled in segments according to key levels to avoid making all decisions at once. For those in cash, wait for breakout confirmation or pullback stabilization. For U.S. stock-related assets, also be mindful of volatility caused by trading session transitions. Your plan should be based on price conditions rather than letting emotions replace execution.
The significance of scaling in isn’t to keep averaging down endlessly; it’s to control the pace while the structure remains valid. Once key support fails, you should stop the original layout plan and wait for a new price range to form.
For short-term positioning, the key isn’t to predict every candlestick, but to ensure that entries, trimming, and exits have a basis. If there’s no confirmation, do less. If key levels fail, redo the plan—control single-trade risk first, then discuss potential upside.
#BTCBreaks80K
15
·
--
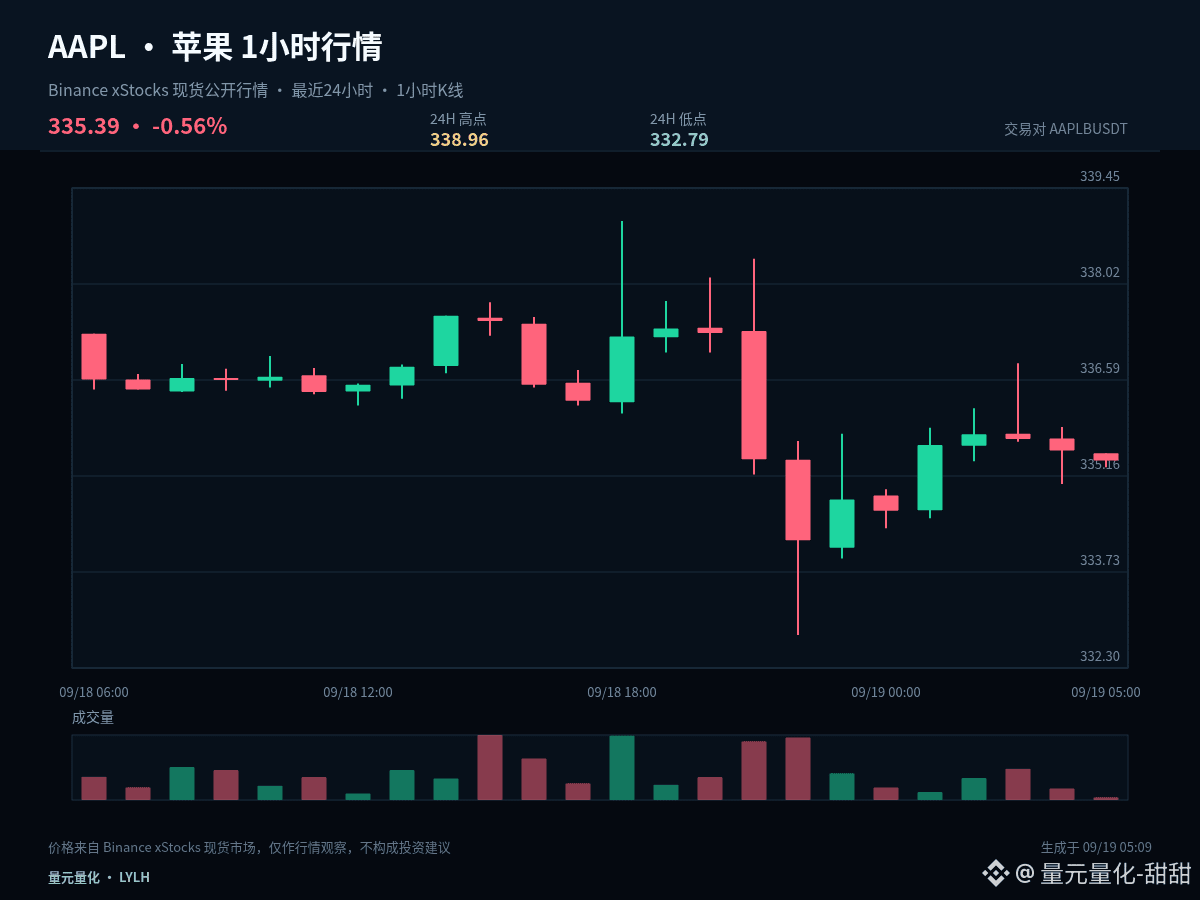
$AAPLB #AAPL At present, it is more suitable to first confirm a rebound rather than define a reversal in advance. Current price: 335.39. 1 hour: -0.04%, 24 hours: -0.50%. Whether the two time cycles realign in the same direction is the key focus going forward.
Currently, 1 hour: -0.04%, 24 hours: -0.50%—the two cycles have not formed a sufficiently clear same-direction alignment. In a range-bound market, the tolerance for chasing or killing positions is low. It is more appropriate to use confirmation at the upper boundary for direction, confirmation at the lower boundary for holding/support, and treat the midline only as a line dividing strength and weakness.
If the rebound can reclaim 335.875 and then further hold above 338.96, it would indicate that buy-side momentum is starting to change from the prior weakness. If price surges to the midline and then falls back again—especially if it drops back toward 332.79—this would look more like a failed attempt at repair, and you should not continue to rely on a strengthening expectation.
Confirming a failed rebound also requires evidence. You cannot simply chase a short just because of one high-and-failure move. A more reasonable sequence is to observe whether resistance levels are rejected, whether lows move down again, and then decide the action based on whether subsequent pullbacks recover key levels.
Existing positions can be handled in stages based on key levels, avoiding making all conclusions at once. Traders with no position should wait for breakout confirmation or for a pullback to stabilize. For US stock-related instruments, also be mindful of volatility caused by trading session transitions; your plan should be based on price conditions, not replace execution with emotions.
Risk control should still come before the conclusion: only execute when conditions arise; if the price invalidates the level, reassess promptly. The greater the volatility, the more restrained you should be with each position. The above is a scenario analysis based on current 1-hour and 24-hour data, and does not constitute any promise of returns.
#BuffettBecomesBerkshireChairmanEmeritus
$AAPLB #AAPL At present, it is more suitable to first confirm a rebound rather than define a reversal in advance. Current price: 335.39. 1 hour: -0.04%, 24 hours: -0.50%. Whether the two time cycles realign in the same direction is the key focus going forward.
Currently, 1 hour: -0.04%, 24 hours: -0.50%—the two cycles have not formed a sufficiently clear same-direction alignment. In a range-bound market, the tolerance for chasing or killing positions is low. It is more appropriate to use confirmation at the upper boundary for direction, confirmation at the lower boundary for holding/support, and treat the midline only as a line dividing strength and weakness.
If the rebound can reclaim 335.875 and then further hold above 338.96, it would indicate that buy-side momentum is starting to change from the prior weakness. If price surges to the midline and then falls back again—especially if it drops back toward 332.79—this would look more like a failed attempt at repair, and you should not continue to rely on a strengthening expectation.
Confirming a failed rebound also requires evidence. You cannot simply chase a short just because of one high-and-failure move. A more reasonable sequence is to observe whether resistance levels are rejected, whether lows move down again, and then decide the action based on whether subsequent pullbacks recover key levels.
Existing positions can be handled in stages based on key levels, avoiding making all conclusions at once. Traders with no position should wait for breakout confirmation or for a pullback to stabilize. For US stock-related instruments, also be mindful of volatility caused by trading session transitions; your plan should be based on price conditions, not replace execution with emotions.
Risk control should still come before the conclusion: only execute when conditions arise; if the price invalidates the level, reassess promptly. The greater the volatility, the more restrained you should be with each position. The above is a scenario analysis based on current 1-hour and 24-hour data, and does not constitute any promise of returns.
#BuffettBecomesBerkshireChairmanEmeritus
Currently, 1 hour: -0.04%, 24 hours: -0.50%—the two cycles have not formed a sufficiently clear same-direction alignment. In a range-bound market, the tolerance for chasing or killing positions is low. It is more appropriate to use confirmation at the upper boundary for direction, confirmation at the lower boundary for holding/support, and treat the midline only as a line dividing strength and weakness.
If the rebound can reclaim 335.875 and then further hold above 338.96, it would indicate that buy-side momentum is starting to change from the prior weakness. If price surges to the midline and then falls back again—especially if it drops back toward 332.79—this would look more like a failed attempt at repair, and you should not continue to rely on a strengthening expectation.
Confirming a failed rebound also requires evidence. You cannot simply chase a short just because of one high-and-failure move. A more reasonable sequence is to observe whether resistance levels are rejected, whether lows move down again, and then decide the action based on whether subsequent pullbacks recover key levels.
Existing positions can be handled in stages based on key levels, avoiding making all conclusions at once. Traders with no position should wait for breakout confirmation or for a pullback to stabilize. For US stock-related instruments, also be mindful of volatility caused by trading session transitions; your plan should be based on price conditions, not replace execution with emotions.
Risk control should still come before the conclusion: only execute when conditions arise; if the price invalidates the level, reassess promptly. The greater the volatility, the more restrained you should be with each position. The above is a scenario analysis based on current 1-hour and 24-hour data, and does not constitute any promise of returns.
#BuffettBecomesBerkshireChairmanEmeritus
9
·
--
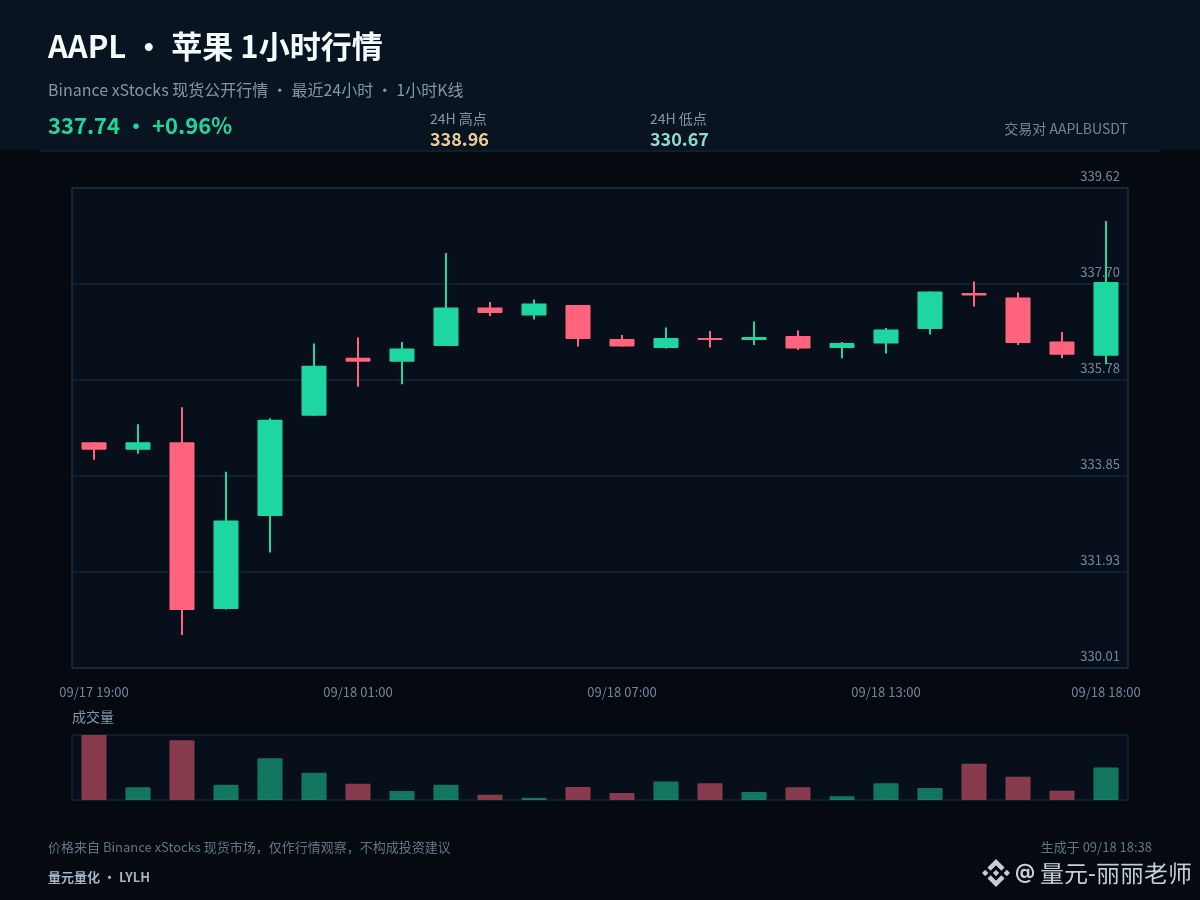
$AAPLB #AAPL This time, let's break down the situation from a position perspective. In the same chart, the key points differ depending on whether you already have a position or are on the sidelines. Current price: 337.74, 1 hour: +0.43%, 24 hours: +0.94%.
The current price is close to the upper bound of the last 24-hour range: 1 hour +0.43%, 24 hours +0.94%. The most important thing at the highs is to confirm how the market accepts a breakout: if the price can stay above the upper bound, it indicates the market recognizes a higher range. If it only briefly pierces through and then quickly pulls back, you need to guard against a false breakout.
For those already holding positions, first observe whether there is repeated resistance near 338.96, and use 334.815 as the protective structure. For those with no position, don't chase near the resistance area; instead, wait for confirmation after a pullback to the midline, or for a second confirmation after breaking through resistance.
Execution should be based on clear conditions. After a breakout above 338.96, you need confirmation—not just seeing a momentary surge and chasing. After a dip to 330.67, check whether it can quickly rebound—not just catching the falling price. When the middle area doesn't offer sufficient odds, waiting itself is part of the strategy.
Position management must distinguish between swing trades and short-term trades. For existing medium/long-term positions, first assess whether the structure is broken; don't let repeated fluctuations in a single 1-hour candlestick repeatedly affect you. For short-term positions, execute around support, resistance, and closing-time confirmation. If you're on the sidelines, you don't need to chase prices in the middle of the range—waiting for a clearer location usually has the advantage.
Risk control comes before any conclusion: only execute when conditions are met, and reassess promptly if the price invalidates the setup. The higher the volatility, the more restrained you must be with each position. The above is a scenario analysis based on current 1-hour and 24-hour data, and does not constitute a promise of returns.
#StellarActivatesProtocol28At211TPS
$AAPLB #AAPL This time, let's break down the situation from a position perspective. In the same chart, the key points differ depending on whether you already have a position or are on the sidelines. Current price: 337.74, 1 hour: +0.43%, 24 hours: +0.94%.
The current price is close to the upper bound of the last 24-hour range: 1 hour +0.43%, 24 hours +0.94%. The most important thing at the highs is to confirm how the market accepts a breakout: if the price can stay above the upper bound, it indicates the market recognizes a higher range. If it only briefly pierces through and then quickly pulls back, you need to guard against a false breakout.
For those already holding positions, first observe whether there is repeated resistance near 338.96, and use 334.815 as the protective structure. For those with no position, don't chase near the resistance area; instead, wait for confirmation after a pullback to the midline, or for a second confirmation after breaking through resistance.
Execution should be based on clear conditions. After a breakout above 338.96, you need confirmation—not just seeing a momentary surge and chasing. After a dip to 330.67, check whether it can quickly rebound—not just catching the falling price. When the middle area doesn't offer sufficient odds, waiting itself is part of the strategy.
Position management must distinguish between swing trades and short-term trades. For existing medium/long-term positions, first assess whether the structure is broken; don't let repeated fluctuations in a single 1-hour candlestick repeatedly affect you. For short-term positions, execute around support, resistance, and closing-time confirmation. If you're on the sidelines, you don't need to chase prices in the middle of the range—waiting for a clearer location usually has the advantage.
Risk control comes before any conclusion: only execute when conditions are met, and reassess promptly if the price invalidates the setup. The higher the volatility, the more restrained you must be with each position. The above is a scenario analysis based on current 1-hour and 24-hour data, and does not constitute a promise of returns.
#StellarActivatesProtocol28At211TPS
The current price is close to the upper bound of the last 24-hour range: 1 hour +0.43%, 24 hours +0.94%. The most important thing at the highs is to confirm how the market accepts a breakout: if the price can stay above the upper bound, it indicates the market recognizes a higher range. If it only briefly pierces through and then quickly pulls back, you need to guard against a false breakout.
For those already holding positions, first observe whether there is repeated resistance near 338.96, and use 334.815 as the protective structure. For those with no position, don't chase near the resistance area; instead, wait for confirmation after a pullback to the midline, or for a second confirmation after breaking through resistance.
Execution should be based on clear conditions. After a breakout above 338.96, you need confirmation—not just seeing a momentary surge and chasing. After a dip to 330.67, check whether it can quickly rebound—not just catching the falling price. When the middle area doesn't offer sufficient odds, waiting itself is part of the strategy.
Position management must distinguish between swing trades and short-term trades. For existing medium/long-term positions, first assess whether the structure is broken; don't let repeated fluctuations in a single 1-hour candlestick repeatedly affect you. For short-term positions, execute around support, resistance, and closing-time confirmation. If you're on the sidelines, you don't need to chase prices in the middle of the range—waiting for a clearer location usually has the advantage.
Risk control comes before any conclusion: only execute when conditions are met, and reassess promptly if the price invalidates the setup. The higher the volatility, the more restrained you must be with each position. The above is a scenario analysis based on current 1-hour and 24-hour data, and does not constitute a promise of returns.
#StellarActivatesProtocol28At211TPS
1
·
--
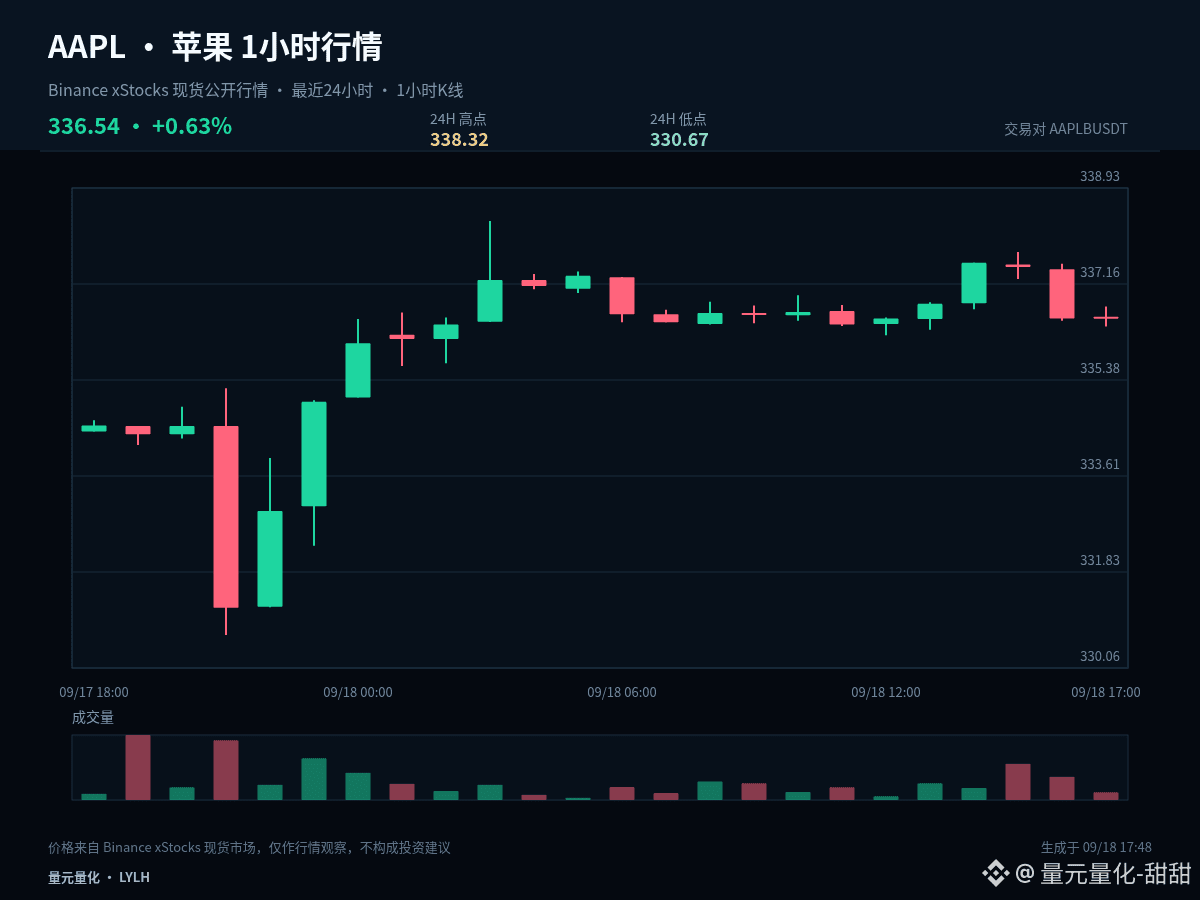
$AAPLB #AAPL Order book notes: current price 336.54, +0.01% in 1 hour, +0.62% in 24 hours, and an amplitude of about 2.3% over the last 24 hours. First write down the data and my judgment at this moment; later I’ll verify it against the price action.
$AAPLB #AAPL has not yet formed a clear one-way trend; the 1-hour and 24-hour rhythms are still in tension. At this stage, focus on the boundaries of the range rather than the color of each individual candlestick.
I will take 334.495 as the short-term bullish/bearish dividing line. If it holds, that indicates pullbacks remain within a controllable range, and the next opportunity would be to test 338.32 again. After an effective breakdown, don’t rush in—wait for a new stable structure to form around 330.67.
My scenario is not a single bet on one direction. A breakout above 338.32 and the ability to hold it means the upside room is reopened. If it breaks below 330.67 and cannot retest it, that means the structure is further weakening. If price trades between the two, continue watching how closes behave on both sides of 334.495.
When I do a post-trade review, I’ll check three things: how the price reacts when it first approaches a key level; whether the 1-hour close completes confirmation; and whether adjustments are made as planned after an assessment is invalidated. Compared with merely recording outcomes, these three checks are better at revealing execution problems.
A trading plan must include invalidation conditions. Even if the judgment is correct, it should be realized in stages; if the judgment is wrong, you must also allow yourself to exit. Don’t use adding position size to cover up the fact that the original logic has changed. The market will update, and my views should adjust according to price evidence.
#InjectiveLaunchesINJOnSolana
$AAPLB #AAPL Order book notes: current price 336.54, +0.01% in 1 hour, +0.62% in 24 hours, and an amplitude of about 2.3% over the last 24 hours. First write down the data and my judgment at this moment; later I’ll verify it against the price action.
$AAPLB #AAPL has not yet formed a clear one-way trend; the 1-hour and 24-hour rhythms are still in tension. At this stage, focus on the boundaries of the range rather than the color of each individual candlestick.
I will take 334.495 as the short-term bullish/bearish dividing line. If it holds, that indicates pullbacks remain within a controllable range, and the next opportunity would be to test 338.32 again. After an effective breakdown, don’t rush in—wait for a new stable structure to form around 330.67.
My scenario is not a single bet on one direction. A breakout above 338.32 and the ability to hold it means the upside room is reopened. If it breaks below 330.67 and cannot retest it, that means the structure is further weakening. If price trades between the two, continue watching how closes behave on both sides of 334.495.
When I do a post-trade review, I’ll check three things: how the price reacts when it first approaches a key level; whether the 1-hour close completes confirmation; and whether adjustments are made as planned after an assessment is invalidated. Compared with merely recording outcomes, these three checks are better at revealing execution problems.
A trading plan must include invalidation conditions. Even if the judgment is correct, it should be realized in stages; if the judgment is wrong, you must also allow yourself to exit. Don’t use adding position size to cover up the fact that the original logic has changed. The market will update, and my views should adjust according to price evidence.
#InjectiveLaunchesINJOnSolana
$AAPLB #AAPL has not yet formed a clear one-way trend; the 1-hour and 24-hour rhythms are still in tension. At this stage, focus on the boundaries of the range rather than the color of each individual candlestick.
I will take 334.495 as the short-term bullish/bearish dividing line. If it holds, that indicates pullbacks remain within a controllable range, and the next opportunity would be to test 338.32 again. After an effective breakdown, don’t rush in—wait for a new stable structure to form around 330.67.
My scenario is not a single bet on one direction. A breakout above 338.32 and the ability to hold it means the upside room is reopened. If it breaks below 330.67 and cannot retest it, that means the structure is further weakening. If price trades between the two, continue watching how closes behave on both sides of 334.495.
When I do a post-trade review, I’ll check three things: how the price reacts when it first approaches a key level; whether the 1-hour close completes confirmation; and whether adjustments are made as planned after an assessment is invalidated. Compared with merely recording outcomes, these three checks are better at revealing execution problems.
A trading plan must include invalidation conditions. Even if the judgment is correct, it should be realized in stages; if the judgment is wrong, you must also allow yourself to exit. Don’t use adding position size to cover up the fact that the original logic has changed. The market will update, and my views should adjust according to price evidence.
#InjectiveLaunchesINJOnSolana
7
·
--
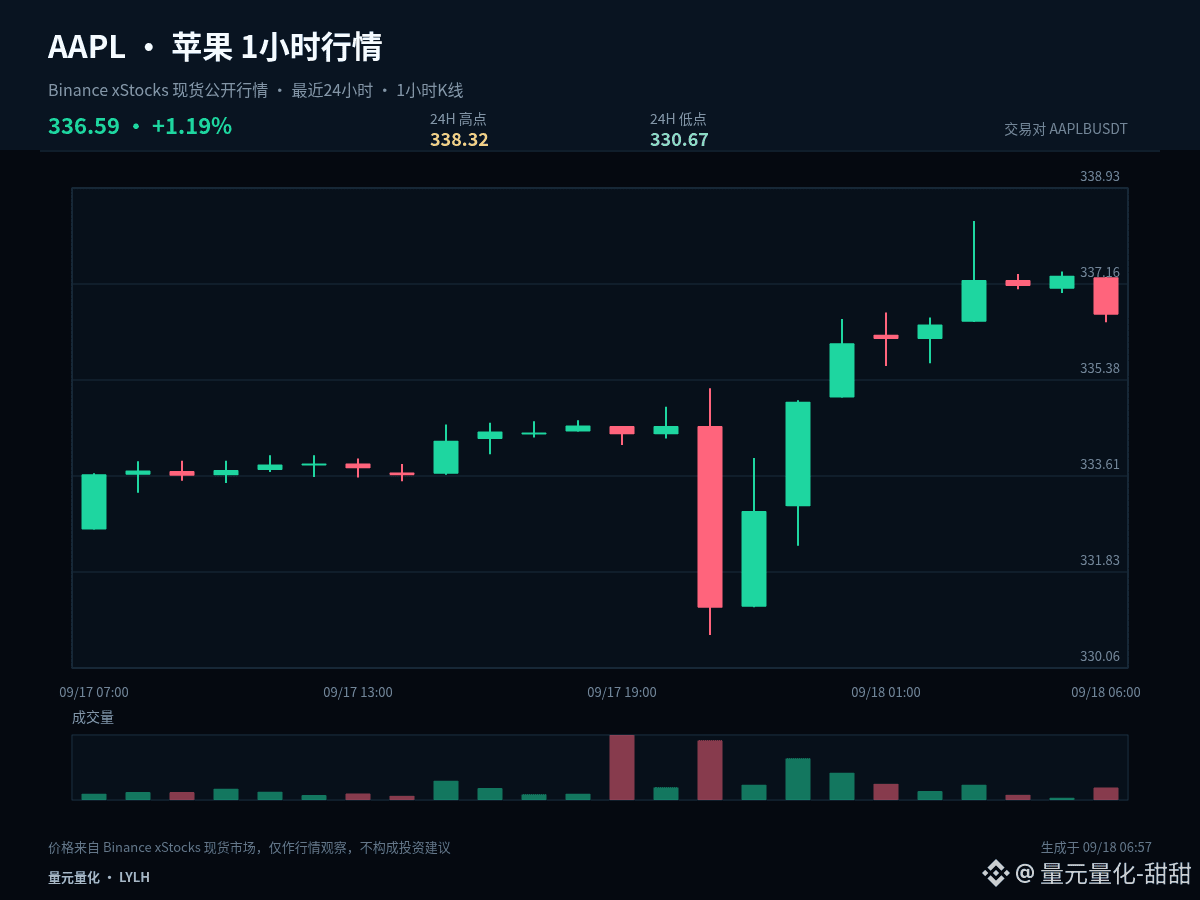
$AAPLB #AAPL Market snapshot record: Current price 336.59, 1 hour -0.21%, 24 hours +1.18%, with an approximate 24-hour range amplitude of 2.3%. First write down the data and my judgment at this moment, and later verify it against the price action.
$AAPLB #AAPL has not yet formed a clear one-way trend; the 1-hour and 24-hour rhythms are still in tug-of-war. At this stage, focus should be on the boundaries of the range rather than the color of every single candlestick.
For key levels: 334.495 is the central axis that must be reclaimed for a weak repair to hold. If price cannot move back above here, any rebound should be treated as a technical correction. There is still a possibility that the downside near 330.67 will be tested again; only after the central axis is reclaimed do we have the qualification to further observe 338.32.
The next path can be handled in three ways: if price effectively holds above 338.32, wait for a pullback that does not break and then reassess for continuation; if it breaks down below 330.67, prioritize risk control and wait for new support; if it continues to trade around 334.495, treat it as a rotation within the range and do not chase a direction repeatedly in the middle.
During review, I will check three things: how price reacts when it approaches a key level the first time, whether the 1-hour close completes the confirmation, and whether—after the judgment is invalidated—I adjust according to the plan. Compared with only recording outcomes, these three items are better at revealing execution problems.
Risk control still comes before the conclusion: execute only when conditions are met; if the price invalidates the setup, reassess promptly. The greater the volatility, the more restrained the position size should be for each trade. The above is a scenario projection based on the current 1-hour and 24-hour data, and does not constitute a promise of returns.
#ParadigmDisclosesZECHolding
$AAPLB #AAPL Market snapshot record: Current price 336.59, 1 hour -0.21%, 24 hours +1.18%, with an approximate 24-hour range amplitude of 2.3%. First write down the data and my judgment at this moment, and later verify it against the price action.
$AAPLB #AAPL has not yet formed a clear one-way trend; the 1-hour and 24-hour rhythms are still in tug-of-war. At this stage, focus should be on the boundaries of the range rather than the color of every single candlestick.
For key levels: 334.495 is the central axis that must be reclaimed for a weak repair to hold. If price cannot move back above here, any rebound should be treated as a technical correction. There is still a possibility that the downside near 330.67 will be tested again; only after the central axis is reclaimed do we have the qualification to further observe 338.32.
The next path can be handled in three ways: if price effectively holds above 338.32, wait for a pullback that does not break and then reassess for continuation; if it breaks down below 330.67, prioritize risk control and wait for new support; if it continues to trade around 334.495, treat it as a rotation within the range and do not chase a direction repeatedly in the middle.
During review, I will check three things: how price reacts when it approaches a key level the first time, whether the 1-hour close completes the confirmation, and whether—after the judgment is invalidated—I adjust according to the plan. Compared with only recording outcomes, these three items are better at revealing execution problems.
Risk control still comes before the conclusion: execute only when conditions are met; if the price invalidates the setup, reassess promptly. The greater the volatility, the more restrained the position size should be for each trade. The above is a scenario projection based on the current 1-hour and 24-hour data, and does not constitute a promise of returns.
#ParadigmDisclosesZECHolding
$AAPLB #AAPL has not yet formed a clear one-way trend; the 1-hour and 24-hour rhythms are still in tug-of-war. At this stage, focus should be on the boundaries of the range rather than the color of every single candlestick.
For key levels: 334.495 is the central axis that must be reclaimed for a weak repair to hold. If price cannot move back above here, any rebound should be treated as a technical correction. There is still a possibility that the downside near 330.67 will be tested again; only after the central axis is reclaimed do we have the qualification to further observe 338.32.
The next path can be handled in three ways: if price effectively holds above 338.32, wait for a pullback that does not break and then reassess for continuation; if it breaks down below 330.67, prioritize risk control and wait for new support; if it continues to trade around 334.495, treat it as a rotation within the range and do not chase a direction repeatedly in the middle.
During review, I will check three things: how price reacts when it approaches a key level the first time, whether the 1-hour close completes the confirmation, and whether—after the judgment is invalidated—I adjust according to the plan. Compared with only recording outcomes, these three items are better at revealing execution problems.
Risk control still comes before the conclusion: execute only when conditions are met; if the price invalidates the setup, reassess promptly. The greater the volatility, the more restrained the position size should be for each trade. The above is a scenario projection based on the current 1-hour and 24-hour data, and does not constitute a promise of returns.
#ParadigmDisclosesZECHolding
7

🚨 $AAPL DEFIES MACRO HEADWINDS AS BUYERS DEMAND HIGHER VALUATIONS ABOVE $332! 📈
Entry: 332.55 ⚡
📌 Capital is flowing straight into $AAPL while the wider market hesitates under rising yields and macro uncertainty. Bids are stepping up aggressively at $332.55, proving institutional appetite remains intact despite broader volatility.
💡 The narrative centers around their long-term AI execution, with smart money front-running future monetization potential before earnings reflect it. 📊 As tech leadership consolidates into high-conviction mega-caps, relative strength here is becoming impossible to ignore.
💬 Will $AAPL continue to anchor the entire tech sector rally, or do we see sellers step in before the next macro catalyst? 👇
⚠️ Not financial advice. Always manage your risk. 🛡️
🏷️ #AAPL #Tech #Breakout #MarketInsight #Stocks
🔥 ⚡
🚨 $AAPL DEFIES MACRO HEADWINDS AS BUYERS DEMAND HIGHER VALUATIONS ABOVE $332! 📈
Entry: 332.55 ⚡
📌 Capital is flowing straight into $AAPL while the wider market hesitates under rising yields and macro uncertainty. Bids are stepping up aggressively at $332.55, proving institutional appetite remains intact despite broader volatility.
💡 The narrative centers around their long-term AI execution, with smart money front-running future monetization potential before earnings reflect it. 📊 As tech leadership consolidates into high-conviction mega-caps, relative strength here is becoming impossible to ignore.
💬 Will $AAPL continue to anchor the entire tech sector rally, or do we see sellers step in before the next macro catalyst? 👇
⚠️ Not financial advice. Always manage your risk. 🛡️
🏷️ #AAPL #Tech #Breakout #MarketInsight #Stocks
🔥 ⚡
Entry: 332.55 ⚡
📌 Capital is flowing straight into $AAPL while the wider market hesitates under rising yields and macro uncertainty. Bids are stepping up aggressively at $332.55, proving institutional appetite remains intact despite broader volatility.
💡 The narrative centers around their long-term AI execution, with smart money front-running future monetization potential before earnings reflect it. 📊 As tech leadership consolidates into high-conviction mega-caps, relative strength here is becoming impossible to ignore.
💬 Will $AAPL continue to anchor the entire tech sector rally, or do we see sellers step in before the next macro catalyst? 👇
⚠️ Not financial advice. Always manage your risk. 🛡️
🏷️ #AAPL #Tech #Breakout #MarketInsight #Stocks
🔥 ⚡
34

·
--
$AAPL #AAPL
Move Alert: Long Alert | AAPL
15m not triggered, but 1h shows strong bullish activity
Structure: GMMA bullish
Reason: 1h turnover 3.6x / 4h turnover 4.0x / Break above 1h 20-high / Break above 1h 55-high / 1h above VWAP / 1h above EMA8/20
Current price 337.36
Breakout level 337.36
Defensive level 329.90
Upside to watch 371.10 / 404.83
Funding fee +0.0000% (longs and shorts even)
For order-flow observation only, not investment advice.
$AAPL #AAPL
Move Alert: Long Alert | AAPL
15m not triggered, but 1h shows strong bullish activity
Structure: GMMA bullish
Reason: 1h turnover 3.6x / 4h turnover 4.0x / Break above 1h 20-high / Break above 1h 55-high / 1h above VWAP / 1h above EMA8/20
Current price 337.36
Breakout level 337.36
Defensive level 329.90
Upside to watch 371.10 / 404.83
Funding fee +0.0000% (longs and shorts even)
For order-flow observation only, not investment advice.
Move Alert: Long Alert | AAPL
15m not triggered, but 1h shows strong bullish activity
Structure: GMMA bullish
Reason: 1h turnover 3.6x / 4h turnover 4.0x / Break above 1h 20-high / Break above 1h 55-high / 1h above VWAP / 1h above EMA8/20
Current price 337.36
Breakout level 337.36
Defensive level 329.90
Upside to watch 371.10 / 404.83
Funding fee +0.0000% (longs and shorts even)
For order-flow observation only, not investment advice.
1
334
Log in to explore more content
Join global crypto users on Binance Square
⚡️ Get latest and useful information about crypto.
💬 Trusted by the world’s largest crypto exchange.
👍 Discover real insights from verified creators.
Email / Phone number
Trending Topics
1
#SaylorHintsStrategyBitcoinBuy
2.2M views
11,105 Discussing
2
#BOJRaisesRatesTo31YearHigh
164,500 views
2,520 Discussing
3
#BuffettStepsDownAsBerkshireChairman
80,036 views
1,292 Discussing
4
#XRPExchangeReservesHitSevenYearLow
86,336 views
1,162 Discussing
5
#HKCompletesFirstHKDStablecoinUseCase
119,859 views
1,556 Discussing
6
#VietnamPlansFirstCryptoLicensesIn2026
74,501 views
1,085 Discussing
7
#BTCBreaks80K
453,593 views
5,267 Discussing
8
#BitcoinMarketCapTopsTesla
107,285 views
1,272 Discussing
9
#SOLJumpsAbout10%
108,299 views
1,161 Discussing
10
#EthereumReclaims$2600
9,378 views
130 Discussing