
#usspotethetfspost23straightdaysofnetoutflows
usspotethetfspost23straightdaysofnetoutflows
43,393 views
423 Discussing
Hot
Latest


#usspotethetfspost23straightdaysofnetoutflows
🚨 ETHEREUM ETF $ETH WARNING: 23 STRAIGHT DAYS OF OUTFLOWS! 🩸
When institutional money starts walking away, the market doesn't always react immediately. Sometimes, the biggest warning appears before the price tells the story.
US Spot Ethereum ETFs have recorded 23 consecutive trading days of net outflows, marking their longest outflow streak since launching in July 2024, according to data attributed to Glassnode.
The shift is particularly interesting because investors who were accumulating ETH exposure during August and September have now turned into net sellers.
But what does this really mean?
ETF flows provide an important window into traditional financial market demand. Persistent withdrawals suggest institutional buying appetite is weakening, potentially reducing an important source of buying pressure for Ethereum.
However, ETF outflows do not automatically mean ETH must crash. Investors can move capital between investment products, while demand across exchanges, DeFi, and other markets may behave differently.
My Take: The real concern isn't one day of selling. It's the consistency. Twenty-three consecutive sessions suggest this is more than a temporary pause in institutional enthusiasm.
Ethereum needs renewed demand, not just temporary price recoveries. The next ETF flow reversal could become an important signal to watch.
Do you think institutional investors are losing confidence in ETH, or is this simply a temporary capital rotation?
Disclaimer: For educational purposes only. Not financial advice.
#EthereumETF #Ethereum #GrowWithSAC $LSK $COW
#USSpotETHETFsPost23StraightDaysOfNetOutflows
#usspotethetfspost23straightdaysofnetoutflows
🚨 ETHEREUM ETF $ETH WARNING: 23 STRAIGHT DAYS OF OUTFLOWS! 🩸
When institutional money starts walking away, the market doesn't always react immediately. Sometimes, the biggest warning appears before the price tells the story.
US Spot Ethereum ETFs have recorded 23 consecutive trading days of net outflows, marking their longest outflow streak since launching in July 2024, according to data attributed to Glassnode.
The shift is particularly interesting because investors who were accumulating ETH exposure during August and September have now turned into net sellers.
But what does this really mean?
ETF flows provide an important window into traditional financial market demand. Persistent withdrawals suggest institutional buying appetite is weakening, potentially reducing an important source of buying pressure for Ethereum.
However, ETF outflows do not automatically mean ETH must crash. Investors can move capital between investment products, while demand across exchanges, DeFi, and other markets may behave differently.
My Take: The real concern isn't one day of selling. It's the consistency. Twenty-three consecutive sessions suggest this is more than a temporary pause in institutional enthusiasm.
Ethereum needs renewed demand, not just temporary price recoveries. The next ETF flow reversal could become an important signal to watch.
Do you think institutional investors are losing confidence in ETH, or is this simply a temporary capital rotation?
Disclaimer: For educational purposes only. Not financial advice.
#EthereumETF #Ethereum #GrowWithSAC $LSK $COW
#USSpotETHETFsPost23StraightDaysOfNetOutflows
🚨 ETHEREUM ETF $ETH WARNING: 23 STRAIGHT DAYS OF OUTFLOWS! 🩸
When institutional money starts walking away, the market doesn't always react immediately. Sometimes, the biggest warning appears before the price tells the story.
US Spot Ethereum ETFs have recorded 23 consecutive trading days of net outflows, marking their longest outflow streak since launching in July 2024, according to data attributed to Glassnode.
The shift is particularly interesting because investors who were accumulating ETH exposure during August and September have now turned into net sellers.
But what does this really mean?
ETF flows provide an important window into traditional financial market demand. Persistent withdrawals suggest institutional buying appetite is weakening, potentially reducing an important source of buying pressure for Ethereum.
However, ETF outflows do not automatically mean ETH must crash. Investors can move capital between investment products, while demand across exchanges, DeFi, and other markets may behave differently.
My Take: The real concern isn't one day of selling. It's the consistency. Twenty-three consecutive sessions suggest this is more than a temporary pause in institutional enthusiasm.
Ethereum needs renewed demand, not just temporary price recoveries. The next ETF flow reversal could become an important signal to watch.
Do you think institutional investors are losing confidence in ETH, or is this simply a temporary capital rotation?
Disclaimer: For educational purposes only. Not financial advice.
#EthereumETF #Ethereum #GrowWithSAC $LSK $COW
#USSpotETHETFsPost23StraightDaysOfNetOutflows

2
5.5k

#usspotethetfspost23straightdaysofnetoutflows
🚨 23 DAYS OF ETHEREUM ETF OUTFLOWS! IS INSTITUTIONAL CONFIDENCE FADING? $ETH 🩸
Money rarely leaves without leaving a message.
And Ethereum's latest ETF story deserves attention.
According to Glassnode, US Spot Ethereum ETFs recorded 23 consecutive trading days of net outflows through October 30, their longest reported streak since launching in July 2024.
October withdrawals exceeded $1 billion, making it the worst monthly outflow period of 2026. On October 30 alone, approximately $155.7 million left these investment products.
BlackRock's ETHA accounted for $76.6 million of that single-day withdrawal, highlighting how significant large institutional allocations can be in shaping aggregate flows.
Yet there is another interesting development: Ethereum staking activity has continued reaching record levels. Traditional ETF investors and on-chain participants appear to be showing different levels of conviction.
MY TAKE: The biggest concern isn't simply money leaving ETFs. It's the persistence of that selling pressure while institutional buying momentum cools.
However, ETF outflows alone cannot determine Ethereum's direction. Broader market demand, staking participation, liquidity and investor positioning also matter. Flow datasets can differ in their reported streak counts.
Ethereum doesn't just need price strength. It needs renewed conviction.
Is this institutional hesitation a temporary pause, or the beginning of a deeper shift in ETH demand?
Disclaimer: For educational purposes only. Not financial advice.
#Ethereum #CryptoETFs #GrowWithSAC $GSB $COTI
#USSpotETHETFsPost23StraightDaysOfNetOutflows
#usspotethetfspost23straightdaysofnetoutflows
🚨 23 DAYS OF ETHEREUM ETF OUTFLOWS! IS INSTITUTIONAL CONFIDENCE FADING? $ETH 🩸
Money rarely leaves without leaving a message.
And Ethereum's latest ETF story deserves attention.
According to Glassnode, US Spot Ethereum ETFs recorded 23 consecutive trading days of net outflows through October 30, their longest reported streak since launching in July 2024.
October withdrawals exceeded $1 billion, making it the worst monthly outflow period of 2026. On October 30 alone, approximately $155.7 million left these investment products.
BlackRock's ETHA accounted for $76.6 million of that single-day withdrawal, highlighting how significant large institutional allocations can be in shaping aggregate flows.
Yet there is another interesting development: Ethereum staking activity has continued reaching record levels. Traditional ETF investors and on-chain participants appear to be showing different levels of conviction.
MY TAKE: The biggest concern isn't simply money leaving ETFs. It's the persistence of that selling pressure while institutional buying momentum cools.
However, ETF outflows alone cannot determine Ethereum's direction. Broader market demand, staking participation, liquidity and investor positioning also matter. Flow datasets can differ in their reported streak counts.
Ethereum doesn't just need price strength. It needs renewed conviction.
Is this institutional hesitation a temporary pause, or the beginning of a deeper shift in ETH demand?
Disclaimer: For educational purposes only. Not financial advice.
#Ethereum #CryptoETFs #GrowWithSAC $GSB $COTI
#USSpotETHETFsPost23StraightDaysOfNetOutflows
🚨 23 DAYS OF ETHEREUM ETF OUTFLOWS! IS INSTITUTIONAL CONFIDENCE FADING? $ETH 🩸
Money rarely leaves without leaving a message.
And Ethereum's latest ETF story deserves attention.
According to Glassnode, US Spot Ethereum ETFs recorded 23 consecutive trading days of net outflows through October 30, their longest reported streak since launching in July 2024.
October withdrawals exceeded $1 billion, making it the worst monthly outflow period of 2026. On October 30 alone, approximately $155.7 million left these investment products.
BlackRock's ETHA accounted for $76.6 million of that single-day withdrawal, highlighting how significant large institutional allocations can be in shaping aggregate flows.
Yet there is another interesting development: Ethereum staking activity has continued reaching record levels. Traditional ETF investors and on-chain participants appear to be showing different levels of conviction.
MY TAKE: The biggest concern isn't simply money leaving ETFs. It's the persistence of that selling pressure while institutional buying momentum cools.
However, ETF outflows alone cannot determine Ethereum's direction. Broader market demand, staking participation, liquidity and investor positioning also matter. Flow datasets can differ in their reported streak counts.
Ethereum doesn't just need price strength. It needs renewed conviction.
Is this institutional hesitation a temporary pause, or the beginning of a deeper shift in ETH demand?
Disclaimer: For educational purposes only. Not financial advice.
#Ethereum #CryptoETFs #GrowWithSAC $GSB $COTI
#USSpotETHETFsPost23StraightDaysOfNetOutflows

2
2k

#usspotethetfspost23straightdaysofnetoutflows
🚨 THE ETF EQUATION: 23 Days in the Red 🚨
Let's break down this historic institutional exodus using pure math 🧮👇
(TradFi De-risking) + ($1B+ Monthly Withdrawals) = 23 Consecutive Days of Outflows 📉
The Asset Input:
(The Catalyst) = U.S. spot Ethereum ETFs just recorded 23 straight days of net outflows through Oct 30. Over $1 billion exited the funds in October alone.
The Key Deliverable:
(The Divergence) ➔ We are witnessing a massive split in behavior. While traditional finance pulled capital out of ETFs for nearly a full month without a single day of net buying, native on-chain Ethereum staking simultaneously climbed to record highs.
The Breakdown:
Wall Street and Web3 are reading the exact same asset differently. TradFi is dumping, while crypto natives are aggressively locking up supply.
Are we witnessing the ultimate Wall Street shakeout before a massive on-chain supply shock, or is TradFi seeing a fundamental flaw in Ethereum that crypto natives are completely ignoring? Drop your macro thesis below! 🐂🐻👇💬
$ETH
{future}(ETHUSDT)
#ETH #ETHETFS #Ethereum
#usspotethetfspost23straightdaysofnetoutflows
🚨 THE ETF EQUATION: 23 Days in the Red 🚨
Let's break down this historic institutional exodus using pure math 🧮👇
(TradFi De-risking) + ($1B+ Monthly Withdrawals) = 23 Consecutive Days of Outflows 📉
The Asset Input:
(The Catalyst) = U.S. spot Ethereum ETFs just recorded 23 straight days of net outflows through Oct 30. Over $1 billion exited the funds in October alone.
The Key Deliverable:
(The Divergence) ➔ We are witnessing a massive split in behavior. While traditional finance pulled capital out of ETFs for nearly a full month without a single day of net buying, native on-chain Ethereum staking simultaneously climbed to record highs.
The Breakdown:
Wall Street and Web3 are reading the exact same asset differently. TradFi is dumping, while crypto natives are aggressively locking up supply.
Are we witnessing the ultimate Wall Street shakeout before a massive on-chain supply shock, or is TradFi seeing a fundamental flaw in Ethereum that crypto natives are completely ignoring? Drop your macro thesis below! 🐂🐻👇💬
$ETH
#ETH #ETHETFS #Ethereum
🚨 THE ETF EQUATION: 23 Days in the Red 🚨
Let's break down this historic institutional exodus using pure math 🧮👇
(TradFi De-risking) + ($1B+ Monthly Withdrawals) = 23 Consecutive Days of Outflows 📉
The Asset Input:
(The Catalyst) = U.S. spot Ethereum ETFs just recorded 23 straight days of net outflows through Oct 30. Over $1 billion exited the funds in October alone.
The Key Deliverable:
(The Divergence) ➔ We are witnessing a massive split in behavior. While traditional finance pulled capital out of ETFs for nearly a full month without a single day of net buying, native on-chain Ethereum staking simultaneously climbed to record highs.
The Breakdown:
Wall Street and Web3 are reading the exact same asset differently. TradFi is dumping, while crypto natives are aggressively locking up supply.
Are we witnessing the ultimate Wall Street shakeout before a massive on-chain supply shock, or is TradFi seeing a fundamental flaw in Ethereum that crypto natives are completely ignoring? Drop your macro thesis below! 🐂🐻👇💬
$ETH
#ETH #ETHETFS #Ethereum

DopamineGLOBAL:
yeah 23 days is rough, whats your read on a bottom?
4
2
728

#USSpotETHETFsPost23StraightDaysOfNetOutflows
🚨 ETHEREUM ETF INVESTORS ARE EXITING!
U.S. Spot Ethereum ETFs have recorded 23 CONSECUTIVE DAYS OF NET OUTFLOWS — the longest withdrawal streak since their launch! 📉
🔥 Key Highlights:
- October outflows exceed $1 BILLION.
- October 30 alone: $155.85M withdrawn.
- BlackRock and Grayscale funds led major outflows.
- Institutional demand for $ETH appears to be weakening.
⚠️ What This Means:
Sustained ETF withdrawals signal declining institutional appetite and could add pressure to Ethereum's market momentum.
👀 Can $ETH reverse this trend, or is there more downside ahead?
Bullish or Bearish on Ethereum? Comment below!
#Ethereum #CryptoNews #ETF #Binance
#USSpotETHETFsPost23StraightDaysOfNetOutflows
🚨 ETHEREUM ETF INVESTORS ARE EXITING!
U.S. Spot Ethereum ETFs have recorded 23 CONSECUTIVE DAYS OF NET OUTFLOWS — the longest withdrawal streak since their launch! 📉
🔥 Key Highlights:
- October outflows exceed $1 BILLION.
- October 30 alone: $155.85M withdrawn.
- BlackRock and Grayscale funds led major outflows.
- Institutional demand for $ETH appears to be weakening.
⚠️ What This Means:
Sustained ETF withdrawals signal declining institutional appetite and could add pressure to Ethereum's market momentum.
👀 Can $ETH reverse this trend, or is there more downside ahead?
Bullish or Bearish on Ethereum? Comment below!
#Ethereum #CryptoNews #ETF #Binance
🚨 ETHEREUM ETF INVESTORS ARE EXITING!
U.S. Spot Ethereum ETFs have recorded 23 CONSECUTIVE DAYS OF NET OUTFLOWS — the longest withdrawal streak since their launch! 📉
🔥 Key Highlights:
- October outflows exceed $1 BILLION.
- October 30 alone: $155.85M withdrawn.
- BlackRock and Grayscale funds led major outflows.
- Institutional demand for $ETH appears to be weakening.
⚠️ What This Means:
Sustained ETF withdrawals signal declining institutional appetite and could add pressure to Ethereum's market momentum.
👀 Can $ETH reverse this trend, or is there more downside ahead?
Bullish or Bearish on Ethereum? Comment below!
#Ethereum #CryptoNews #ETF #Binance

1
48

·
--
US Spot Ethereum ETFs Post 23 Straight Days of Net Outflows
I keep wondering what it takes for institutional investors to change their minds about an asset. Ethereum's latest ETF data gives us a reason to think about that question.
According to Glassnode data cited in recent reports, US spot Ethereum ETFs have recorded net outflows for 23 consecutive trading days through October 30, 2026. This is reportedly the longest withdrawal streak since these funds launched in July 2024.
The timing is interesting. Traditional investors were actively accumulating ETH through ETFs during August and September. October brought a different picture, with more than $1 billion reportedly leaving these products during the month.
On October 30 alone, the funds saw approximately $155.85 million in net outflows. BlackRock's ETHA accounted for around $76.64 million of that amount.
That does not automatically mean Ethereum is finished or that every institutional investor is bearish. ETF flows reflect activity in a particular investment channel, not the entire market.
Still, 23 consecutive sessions are difficult to ignore. These funds were designed to make ETH exposure easier for traditional investors, and their recent withdrawals suggest that demand through this route has weakened.
For me, the bigger question is whether this is a temporary pause after heavy buying or a more lasting change in investor sentiment.
Ethereum's next move may depend on whether buyers return—or whether the outflow streak continues.
$LIT $AVA $FLOKI
#USSpotETHETFsPost23StraightDaysOfNetOutflows
{future}(LITUSDT)
{spot}(FLOKIUSDT)
{future}(AVAUSDT)
US Spot Ethereum ETFs Post 23 Straight Days of Net Outflows
I keep wondering what it takes for institutional investors to change their minds about an asset. Ethereum's latest ETF data gives us a reason to think about that question.
According to Glassnode data cited in recent reports, US spot Ethereum ETFs have recorded net outflows for 23 consecutive trading days through October 30, 2026. This is reportedly the longest withdrawal streak since these funds launched in July 2024.
The timing is interesting. Traditional investors were actively accumulating ETH through ETFs during August and September. October brought a different picture, with more than $1 billion reportedly leaving these products during the month.
On October 30 alone, the funds saw approximately $155.85 million in net outflows. BlackRock's ETHA accounted for around $76.64 million of that amount.
That does not automatically mean Ethereum is finished or that every institutional investor is bearish. ETF flows reflect activity in a particular investment channel, not the entire market.
Still, 23 consecutive sessions are difficult to ignore. These funds were designed to make ETH exposure easier for traditional investors, and their recent withdrawals suggest that demand through this route has weakened.
For me, the bigger question is whether this is a temporary pause after heavy buying or a more lasting change in investor sentiment.
Ethereum's next move may depend on whether buyers return—or whether the outflow streak continues.
$LIT $AVA $FLOKI
#USSpotETHETFsPost23StraightDaysOfNetOutflows
I keep wondering what it takes for institutional investors to change their minds about an asset. Ethereum's latest ETF data gives us a reason to think about that question.
According to Glassnode data cited in recent reports, US spot Ethereum ETFs have recorded net outflows for 23 consecutive trading days through October 30, 2026. This is reportedly the longest withdrawal streak since these funds launched in July 2024.
The timing is interesting. Traditional investors were actively accumulating ETH through ETFs during August and September. October brought a different picture, with more than $1 billion reportedly leaving these products during the month.
On October 30 alone, the funds saw approximately $155.85 million in net outflows. BlackRock's ETHA accounted for around $76.64 million of that amount.
That does not automatically mean Ethereum is finished or that every institutional investor is bearish. ETF flows reflect activity in a particular investment channel, not the entire market.
Still, 23 consecutive sessions are difficult to ignore. These funds were designed to make ETH exposure easier for traditional investors, and their recent withdrawals suggest that demand through this route has weakened.
For me, the bigger question is whether this is a temporary pause after heavy buying or a more lasting change in investor sentiment.
Ethereum's next move may depend on whether buyers return—or whether the outflow streak continues.
$LIT $AVA $FLOKI
#USSpotETHETFsPost23StraightDaysOfNetOutflows

197

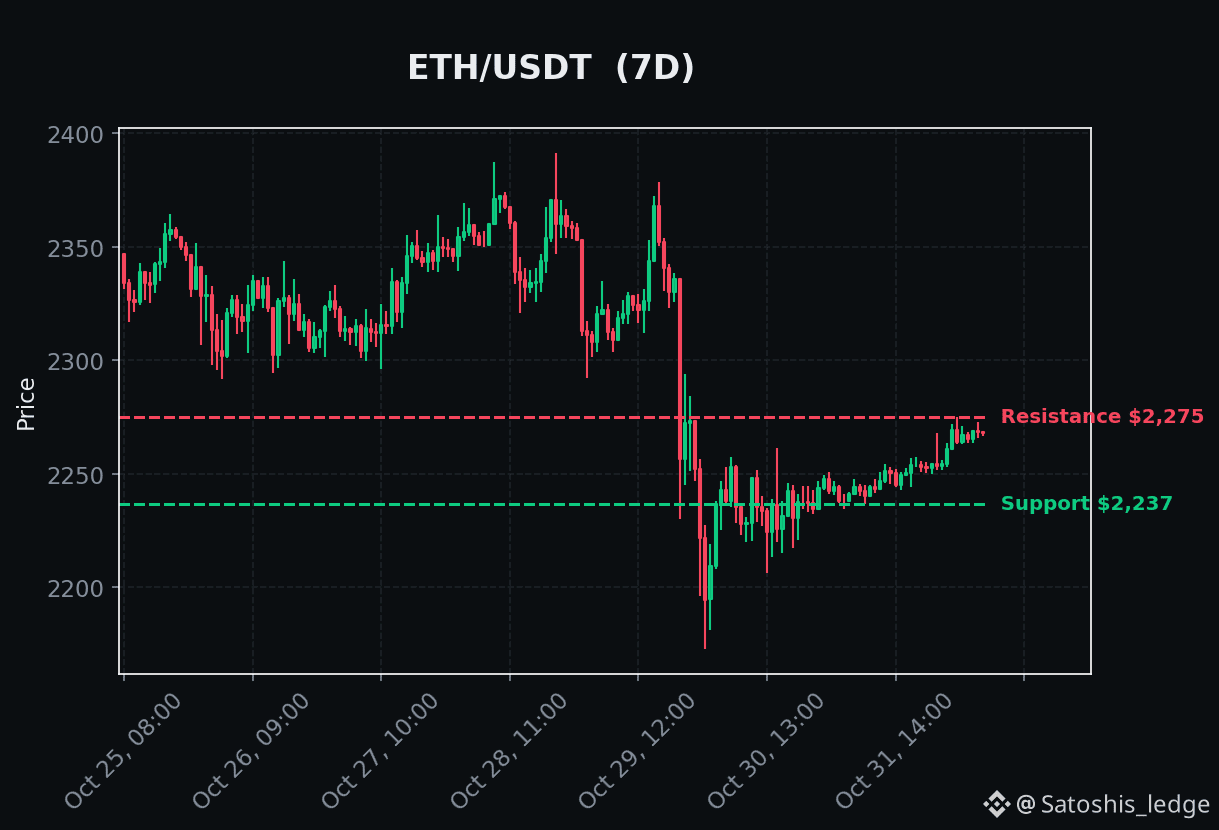
⚔️ Spot Ether ETFs have posted 23 straight days of net outflows, per Square's trending topic, yet $ETH is green today.
$ETH is $2,268 (+1.1%), inside a $2,237 to $2,275 range. ETF sellers and spot holders can't both be right for long.
My call: the ETF flow wins unless spot demand shows up soon. Who's right, the ETFs or the holders? 👇
#USSpotETHETFsPost23StraightDaysOfNetOutflows #BinanceSquare #WriteToEarn
⚔️ Spot Ether ETFs have posted 23 straight days of net outflows, per Square's trending topic, yet $ETH is green today.
$ETH is $2,268 (+1.1%), inside a $2,237 to $2,275 range. ETF sellers and spot holders can't both be right for long.
My call: the ETF flow wins unless spot demand shows up soon. Who's right, the ETFs or the holders? 👇
#USSpotETHETFsPost23StraightDaysOfNetOutflows #BinanceSquare #WriteToEarn
$ETH is $2,268 (+1.1%), inside a $2,237 to $2,275 range. ETF sellers and spot holders can't both be right for long.
My call: the ETF flow wins unless spot demand shows up soon. Who's right, the ETFs or the holders? 👇
#USSpotETHETFsPost23StraightDaysOfNetOutflows #BinanceSquare #WriteToEarn
majspace:
That split is the interesting part. If ETF selling keeps up, spot buyers will need to show up soon to hold that range.
3
1
129

·
--
Bullish
#usspotethetfspost23straightdaysofnetoutflows 🚨 ETH ETF HOLDERS KEEP SELLING FOR 23 DAYS — BUT ETHEREUM IS HOLDING UP
Something interesting is happening in the Ethereum market.
According to Glassnode, US spot Ethereum ETFs have recorded 23 consecutive trading days of net outflows, marking the longest outflow streak since their launch.
More than $1 billion reportedly left these funds during October.
But here's where things get interesting:
🔍 Two Different Market Trends
• ETF investors continue reducing their ETH exposure.
• Ethereum staking has reached approximately 43.8 million ETH, representing around 35.9% of total supply.
• ETH's price has remained relatively resilient despite sustained ETF selling pressure.
📊 Market Analysis & Structural Assessment
We're seeing two different types of investor behavior.
Traditional investors using ETF products appear to be reducing exposure amid macroeconomic uncertainty.
Meanwhile, on-chain participants continue locking ETH into staking to earn rewards.
This creates an interesting supply dynamic. However, staking does not automatically offset ETF outflows because both represent different market activities.
The key question is whether on-chain demand can remain strong enough to absorb continued selling pressure.
💭 My Take
I am watching two important signals:
A meaningful ETF inflow day that could indicate institutional demand is returning.
Whether Bitcoin ETFs also begin experiencing sustained outflows.
For Ethereum, the $2,200 area is an important technical level to monitor. A sustained hold could support the current structure, while a decisive breakdown may increase downside pressure.
The big question: Will the ETF outflow streak end before ETH retests $2,200, or will the support level break first?
$ETH | $BTC | $BNB
#Ethereum #ETH #EthereumETF #Glassnode #Bitcoin #CryptoMarket #CryptoAnalysis
#usspotethetfspost23straightdaysofnetoutflows 🚨 ETH ETF HOLDERS KEEP SELLING FOR 23 DAYS — BUT ETHEREUM IS HOLDING UP
Something interesting is happening in the Ethereum market.
According to Glassnode, US spot Ethereum ETFs have recorded 23 consecutive trading days of net outflows, marking the longest outflow streak since their launch.
More than $1 billion reportedly left these funds during October.
But here's where things get interesting:
🔍 Two Different Market Trends
• ETF investors continue reducing their ETH exposure.
• Ethereum staking has reached approximately 43.8 million ETH, representing around 35.9% of total supply.
• ETH's price has remained relatively resilient despite sustained ETF selling pressure.
📊 Market Analysis & Structural Assessment
We're seeing two different types of investor behavior.
Traditional investors using ETF products appear to be reducing exposure amid macroeconomic uncertainty.
Meanwhile, on-chain participants continue locking ETH into staking to earn rewards.
This creates an interesting supply dynamic. However, staking does not automatically offset ETF outflows because both represent different market activities.
The key question is whether on-chain demand can remain strong enough to absorb continued selling pressure.
💭 My Take
I am watching two important signals:
A meaningful ETF inflow day that could indicate institutional demand is returning.
Whether Bitcoin ETFs also begin experiencing sustained outflows.
For Ethereum, the $2,200 area is an important technical level to monitor. A sustained hold could support the current structure, while a decisive breakdown may increase downside pressure.
The big question: Will the ETF outflow streak end before ETH retests $2,200, or will the support level break first?
$ETH | $BTC | $BNB
#Ethereum #ETH #EthereumETF #Glassnode #Bitcoin #CryptoMarket #CryptoAnalysis
Something interesting is happening in the Ethereum market.
According to Glassnode, US spot Ethereum ETFs have recorded 23 consecutive trading days of net outflows, marking the longest outflow streak since their launch.
More than $1 billion reportedly left these funds during October.
But here's where things get interesting:
🔍 Two Different Market Trends
• ETF investors continue reducing their ETH exposure.
• Ethereum staking has reached approximately 43.8 million ETH, representing around 35.9% of total supply.
• ETH's price has remained relatively resilient despite sustained ETF selling pressure.
📊 Market Analysis & Structural Assessment
We're seeing two different types of investor behavior.
Traditional investors using ETF products appear to be reducing exposure amid macroeconomic uncertainty.
Meanwhile, on-chain participants continue locking ETH into staking to earn rewards.
This creates an interesting supply dynamic. However, staking does not automatically offset ETF outflows because both represent different market activities.
The key question is whether on-chain demand can remain strong enough to absorb continued selling pressure.
💭 My Take
I am watching two important signals:
A meaningful ETF inflow day that could indicate institutional demand is returning.
Whether Bitcoin ETFs also begin experiencing sustained outflows.
For Ethereum, the $2,200 area is an important technical level to monitor. A sustained hold could support the current structure, while a decisive breakdown may increase downside pressure.
The big question: Will the ETF outflow streak end before ETH retests $2,200, or will the support level break first?
$ETH | $BTC | $BNB
#Ethereum #ETH #EthereumETF #Glassnode #Bitcoin #CryptoMarket #CryptoAnalysis

667

·
--
#USSpotETHETFsPost23StraightDaysOfNetOutflows
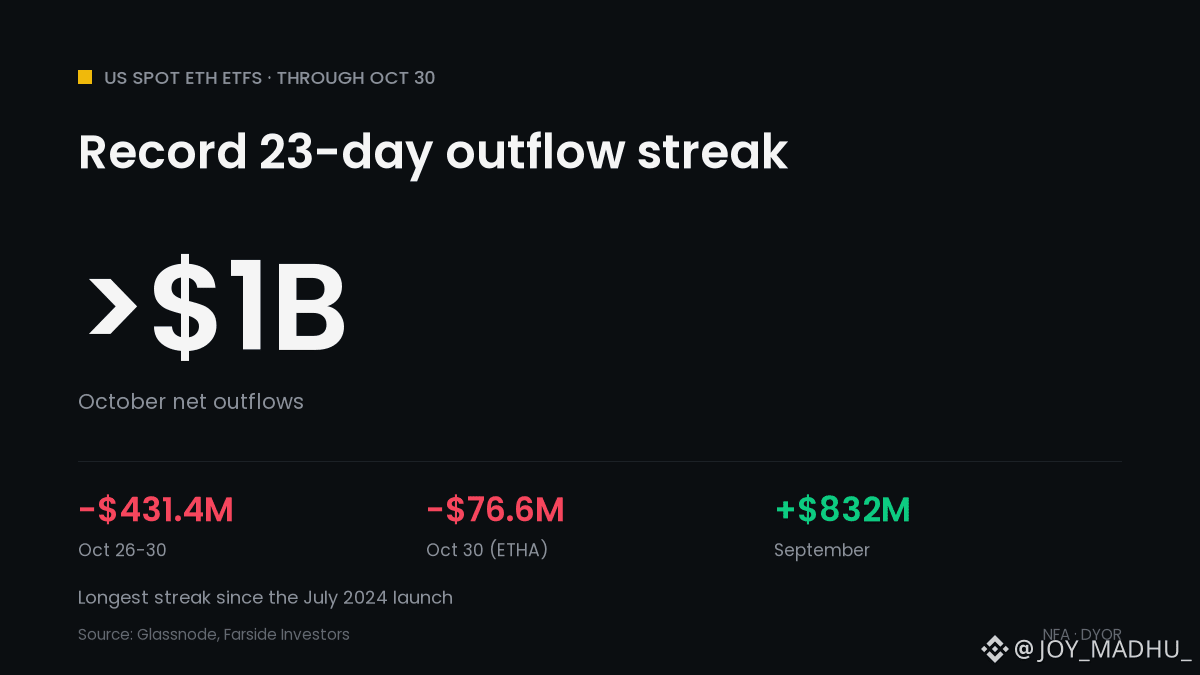
📉 Ether ETFs Hit a Record 23-Day Outflow Streak
📅 US spot ETH ETFs posted net outflows for 23 straight trading days through Oct 30, the longest since the July 2024 launch (Glassnode)
💸 October net outflows topped $1B, the biggest monthly drain of 2026
📊 Oct 26-30 alone: $431.4M out (Farside); Oct 30 was the worst day at about $155.8M
🏦 BlackRock's ETHA led with $76.6M out on Oct 30
🔄 A sharp turn from September, when the funds took in about $832M
📈 Net inflows since launch still total about $12.29B
What it means for crypto: ETF buyers are stepping back while on-chain staking keeps hitting records. Glassnode says a return of ETF inflows would be the signal that institutional demand is back.
Which side is right on ETH right now, the ETF sellers or the stakers? 👇
$ETH
#CryptoNews #Ethereum #ETF #USSpotETHETFsPost23StraightDaysOfNetOutflows
#USSpotETHETFsPost23StraightDaysOfNetOutflows
📉 Ether ETFs Hit a Record 23-Day Outflow Streak
📅 US spot ETH ETFs posted net outflows for 23 straight trading days through Oct 30, the longest since the July 2024 launch (Glassnode)
💸 October net outflows topped $1B, the biggest monthly drain of 2026
📊 Oct 26-30 alone: $431.4M out (Farside); Oct 30 was the worst day at about $155.8M
🏦 BlackRock's ETHA led with $76.6M out on Oct 30
🔄 A sharp turn from September, when the funds took in about $832M
📈 Net inflows since launch still total about $12.29B
What it means for crypto: ETF buyers are stepping back while on-chain staking keeps hitting records. Glassnode says a return of ETF inflows would be the signal that institutional demand is back.
Which side is right on ETH right now, the ETF sellers or the stakers? 👇
$ETH
#CryptoNews #Ethereum #ETF #USSpotETHETFsPost23StraightDaysOfNetOutflows
📉 Ether ETFs Hit a Record 23-Day Outflow Streak
📅 US spot ETH ETFs posted net outflows for 23 straight trading days through Oct 30, the longest since the July 2024 launch (Glassnode)
💸 October net outflows topped $1B, the biggest monthly drain of 2026
📊 Oct 26-30 alone: $431.4M out (Farside); Oct 30 was the worst day at about $155.8M
🏦 BlackRock's ETHA led with $76.6M out on Oct 30
🔄 A sharp turn from September, when the funds took in about $832M
📈 Net inflows since launch still total about $12.29B
What it means for crypto: ETF buyers are stepping back while on-chain staking keeps hitting records. Glassnode says a return of ETF inflows would be the signal that institutional demand is back.
Which side is right on ETH right now, the ETF sellers or the stakers? 👇
$ETH
#CryptoNews #Ethereum #ETF #USSpotETHETFsPost23StraightDaysOfNetOutflows
46

·
--
eth etf holders have been selling for a month straight and price barely cared
#USSpotETHETFsPost23StraightDaysOfNetOutflows
us spot $ETH etfs just logged 23 trading days of net outflows in a row, the longest run since launch per glassnode. same window, onchain staking kept hitting records
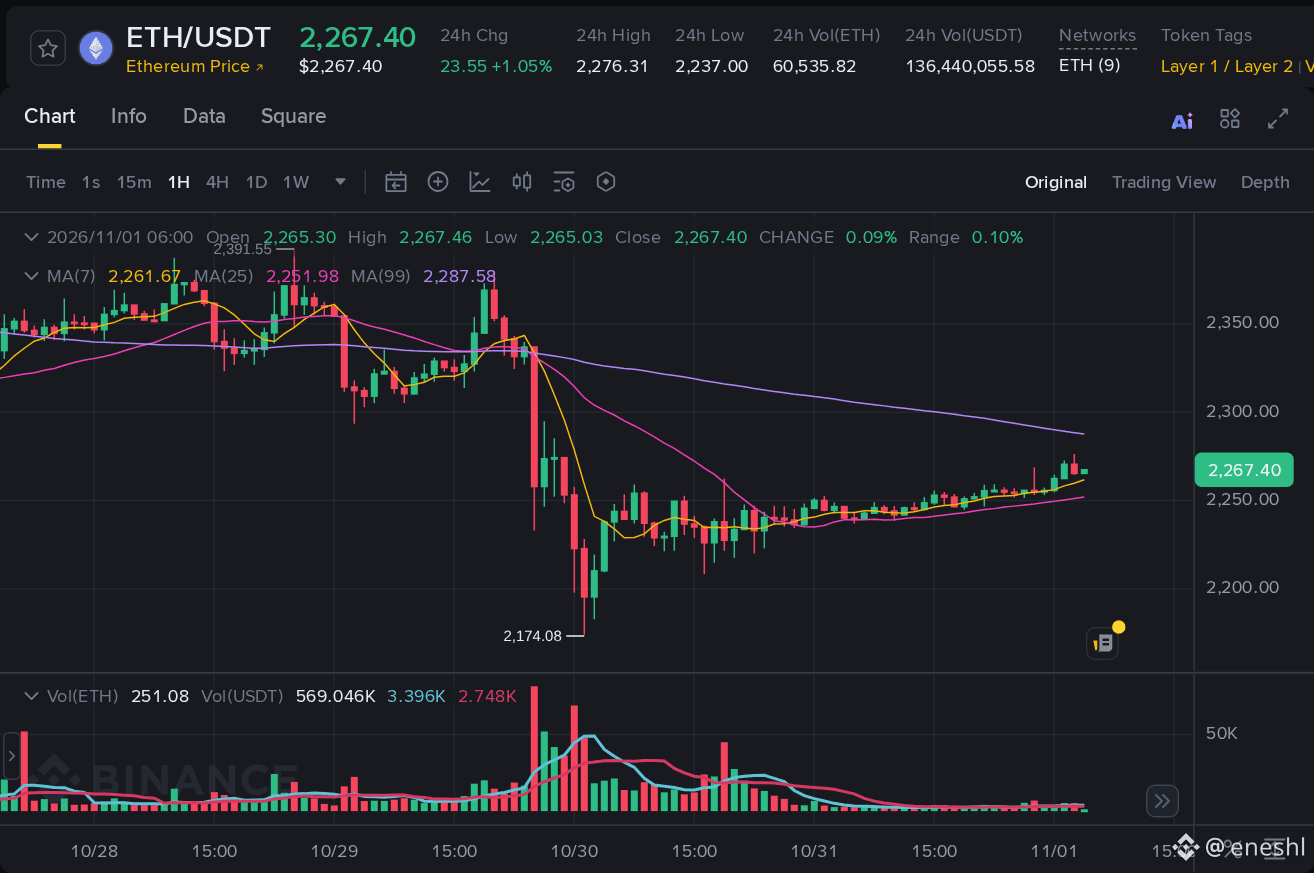
my take, two crowds are reading the same coin differently. the wrapper crowd trims when macro gets shaky, the onchain crowd locks up and earns yield. supply into staking quietly offsets some of that etf selling, so no flush yet. what changes it is one real inflow day breaking the streak, or $BTC etfs rolling over too. im watching 2,200, it got wicked through once this week and bought straight back
streak snaps before 2,200 gets tested, or floor goes first ?
eth etf holders have been selling for a month straight and price barely cared
#USSpotETHETFsPost23StraightDaysOfNetOutflows
us spot $ETH etfs just logged 23 trading days of net outflows in a row, the longest run since launch per glassnode. same window, onchain staking kept hitting records
my take, two crowds are reading the same coin differently. the wrapper crowd trims when macro gets shaky, the onchain crowd locks up and earns yield. supply into staking quietly offsets some of that etf selling, so no flush yet. what changes it is one real inflow day breaking the streak, or $BTC etfs rolling over too. im watching 2,200, it got wicked through once this week and bought straight back
streak snaps before 2,200 gets tested, or floor goes first ?
#USSpotETHETFsPost23StraightDaysOfNetOutflows
us spot $ETH etfs just logged 23 trading days of net outflows in a row, the longest run since launch per glassnode. same window, onchain staking kept hitting records
my take, two crowds are reading the same coin differently. the wrapper crowd trims when macro gets shaky, the onchain crowd locks up and earns yield. supply into staking quietly offsets some of that etf selling, so no flush yet. what changes it is one real inflow day breaking the streak, or $BTC etfs rolling over too. im watching 2,200, it got wicked through once this week and bought straight back
streak snaps before 2,200 gets tested, or floor goes first ?
1
397

#usspotethetfspost23straightdaysofnetoutflows
🚨 ETHEREUM ETF $ETH ALERT: 23 CONSECUTIVE DAYS OF OUTFLOWS! 🩸
When institutional investors start pulling back, the market doesn’t always react immediately. Sometimes the biggest warning appears before the price tells the story.
U.S. spot Ethereum ETFs have recorded 23 consecutive trading days of net outflows, their longest outflow streak since launching in July 2024, according to data attributed to Glassnode.
This shift is particularly interesting because investors who were accumulating ETH exposure in August and September are now net sellers.
But what does this really mean?
ETF flows offer an important glimpse into demand in traditional financial markets. Persistent withdrawals suggest that institutional investors’ appetite for buying is weakening, which could reduce an important source of buying pressure for Ethereum.
However, ETF outflows don’t automatically mean that ETH is bound to crash. Investors may move their capital between different investment products, while demand on exchanges, in DeFi, and in other markets may evolve differently.
My view: The real cause for concern isn’t a single day of selling, but its consistency. Twenty-three consecutive sessions suggest this is more than a temporary pause in institutional investors’ enthusiasm.
Ethereum needs a renewed surge in demand, not just temporary price recoveries. The next reversal in ETF flows could be an important signal to watch.
Do you think institutional investors are losing confidence in ETH, or is this simply a temporary rotation of capital?
$LYN
{future}(LYNUSDT)
$ESPORTS
{future}(ESPORTSUSDT)
$IDOL
{future}(IDOLUSDT)
#usspotethetfspost23straightdaysofnetoutflows
🚨 ETHEREUM ETF $ETH ALERT: 23 CONSECUTIVE DAYS OF OUTFLOWS! 🩸
When institutional investors start pulling back, the market doesn’t always react immediately. Sometimes the biggest warning appears before the price tells the story.
U.S. spot Ethereum ETFs have recorded 23 consecutive trading days of net outflows, their longest outflow streak since launching in July 2024, according to data attributed to Glassnode.
This shift is particularly interesting because investors who were accumulating ETH exposure in August and September are now net sellers.
But what does this really mean?
ETF flows offer an important glimpse into demand in traditional financial markets. Persistent withdrawals suggest that institutional investors’ appetite for buying is weakening, which could reduce an important source of buying pressure for Ethereum.
However, ETF outflows don’t automatically mean that ETH is bound to crash. Investors may move their capital between different investment products, while demand on exchanges, in DeFi, and in other markets may evolve differently.
My view: The real cause for concern isn’t a single day of selling, but its consistency. Twenty-three consecutive sessions suggest this is more than a temporary pause in institutional investors’ enthusiasm.
Ethereum needs a renewed surge in demand, not just temporary price recoveries. The next reversal in ETF flows could be an important signal to watch.
Do you think institutional investors are losing confidence in ETH, or is this simply a temporary rotation of capital?
$LYN
$ESPORTS
$IDOL
🚨 ETHEREUM ETF $ETH ALERT: 23 CONSECUTIVE DAYS OF OUTFLOWS! 🩸
When institutional investors start pulling back, the market doesn’t always react immediately. Sometimes the biggest warning appears before the price tells the story.
U.S. spot Ethereum ETFs have recorded 23 consecutive trading days of net outflows, their longest outflow streak since launching in July 2024, according to data attributed to Glassnode.
This shift is particularly interesting because investors who were accumulating ETH exposure in August and September are now net sellers.
But what does this really mean?
ETF flows offer an important glimpse into demand in traditional financial markets. Persistent withdrawals suggest that institutional investors’ appetite for buying is weakening, which could reduce an important source of buying pressure for Ethereum.
However, ETF outflows don’t automatically mean that ETH is bound to crash. Investors may move their capital between different investment products, while demand on exchanges, in DeFi, and in other markets may evolve differently.
My view: The real cause for concern isn’t a single day of selling, but its consistency. Twenty-three consecutive sessions suggest this is more than a temporary pause in institutional investors’ enthusiasm.
Ethereum needs a renewed surge in demand, not just temporary price recoveries. The next reversal in ETF flows could be an important signal to watch.
Do you think institutional investors are losing confidence in ETH, or is this simply a temporary rotation of capital?
$LYN
$ESPORTS
$IDOL

1
3.9k

·
--
#usspotethetfspost23straightdaysofnetoutflows
Things aren't going too well for US Spot Ethereum ETFs! 📉💸
🚨 What Happened?
🇺🇸 US Spot Ethereum ETFs have recorded continuous net outflows for 23 straight days! 🗓️❌
🔴 Investors keep withdrawing money from the funds, while new inflows are almost nonexistent. 📉💰
📊 Why Hasn't It Worked & What's Going On?
🐻 Bear Market Pressure: General market uncertainty and declining risk appetite have created selling pressure on Ethereum. 📉🧱
⚖️ Bitcoin vs. Ethereum: Investors may be moving their funds out of Ethereum ETFs and into Bitcoin ETFs, seen as a safer haven, or into cash. 🪙🔄💵
🐋 Institutional Hesitation: Institutional investors (Wall Street) have yet to show the expected interest in Ethereum ETFs. 🏛️💤
🔮 What Does the Future Hold?
🛑 End of the Red Streak: Market experts are eagerly waiting to see when this negative streak will end and green days 🟢 will return. ⌛📈
🧘♂️ A Test of Patience: For Ethereum investors, this period has become a true test of patience. 🧘♀️⚡
We're keeping an eye on when the tide will turn for Ethereum ETFs! 🌊🔄
$ETH $IDOL $HOT
{future}(HOTUSDT)
{future}(IDOLUSDT)
{future}(ETHUSDT)
#usspotethetfspost23straightdaysofnetoutflows
Things aren't going too well for US Spot Ethereum ETFs! 📉💸
🚨 What Happened?
🇺🇸 US Spot Ethereum ETFs have recorded continuous net outflows for 23 straight days! 🗓️❌
🔴 Investors keep withdrawing money from the funds, while new inflows are almost nonexistent. 📉💰
📊 Why Hasn't It Worked & What's Going On?
🐻 Bear Market Pressure: General market uncertainty and declining risk appetite have created selling pressure on Ethereum. 📉🧱
⚖️ Bitcoin vs. Ethereum: Investors may be moving their funds out of Ethereum ETFs and into Bitcoin ETFs, seen as a safer haven, or into cash. 🪙🔄💵
🐋 Institutional Hesitation: Institutional investors (Wall Street) have yet to show the expected interest in Ethereum ETFs. 🏛️💤
🔮 What Does the Future Hold?
🛑 End of the Red Streak: Market experts are eagerly waiting to see when this negative streak will end and green days 🟢 will return. ⌛📈
🧘♂️ A Test of Patience: For Ethereum investors, this period has become a true test of patience. 🧘♀️⚡
We're keeping an eye on when the tide will turn for Ethereum ETFs! 🌊🔄
$ETH $IDOL $HOT
Things aren't going too well for US Spot Ethereum ETFs! 📉💸
🚨 What Happened?
🇺🇸 US Spot Ethereum ETFs have recorded continuous net outflows for 23 straight days! 🗓️❌
🔴 Investors keep withdrawing money from the funds, while new inflows are almost nonexistent. 📉💰
📊 Why Hasn't It Worked & What's Going On?
🐻 Bear Market Pressure: General market uncertainty and declining risk appetite have created selling pressure on Ethereum. 📉🧱
⚖️ Bitcoin vs. Ethereum: Investors may be moving their funds out of Ethereum ETFs and into Bitcoin ETFs, seen as a safer haven, or into cash. 🪙🔄💵
🐋 Institutional Hesitation: Institutional investors (Wall Street) have yet to show the expected interest in Ethereum ETFs. 🏛️💤
🔮 What Does the Future Hold?
🛑 End of the Red Streak: Market experts are eagerly waiting to see when this negative streak will end and green days 🟢 will return. ⌛📈
🧘♂️ A Test of Patience: For Ethereum investors, this period has become a true test of patience. 🧘♀️⚡
We're keeping an eye on when the tide will turn for Ethereum ETFs! 🌊🔄
$ETH $IDOL $HOT

1.7k

·
--
#USSpotETHETFsPost23StraightDaysOfNetOutflows Record outflows are making headlines, but the real story is in a single fund.
📌 In October, U.S. spot ETH ETFs saw net outflows of -$1.61 billion (SoSoValue). That’s the largest monthly outflow since their July 2024 launch; the previous record was -$1.42B in November 2025.
📌 About $1.42 billion of that amount flowed out of BlackRock ETHA alone (around 88%). In the same month, Fidelity FETH closed positive at +$36.1M, as did Morgan Stanley MSSE at +$3.7M. So the picture isn’t “institutions are fleeing ETH,” but rather “investors in one product rotated elsewhere.”
📉 The headline says “23 consecutive days of outflows” (Glassnode). Daily SoSoValue/Farside data, however, shows 3 positive days across October’s 22 sessions (October 13, 21, and 23). There may be a difference in definitions, so it’s more useful to look at the issuer breakdown than the duration cited in the headline.
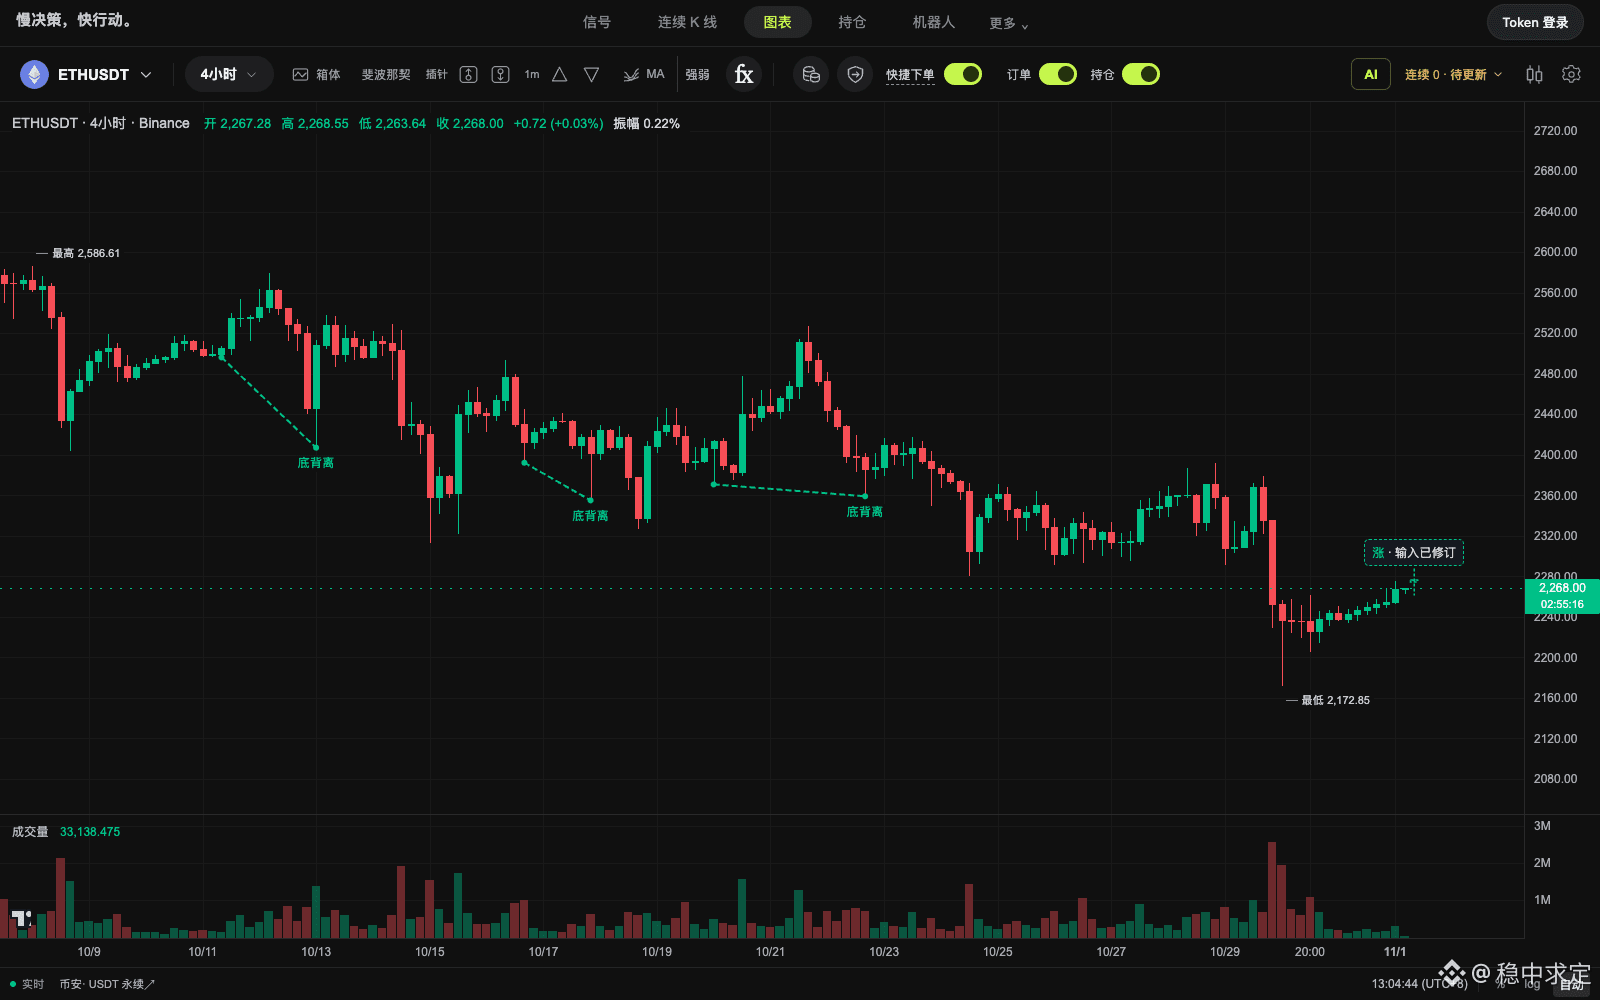
📈 Price: ETH $2,293 (+0.95%, Binance 02.11.2026 09:25 UTC). The 4H RSI is hot at 71.6; price has reached the upper Bollinger band ($2,301) and is holding above the SMA20 ($2,259). Momentum is there, but the market looks tired in the short term.
🐋 Flow evidence: Despite October’s $1.61B outflow, ETH stayed in the $2,200–2,500 range. Cumulative net inflows are still +$12.29B, with net assets at $13.22B. The market absorbed the selling; there’s no panic, just distribution.
🎯 Plan: 4H close above $2,301 -> targets at $2,317 / $2,350. Below $2,259 -> $2,217 is the defense line. With the RSI hot, it’s more solid to be a buyer on pullbacks than to chase. Direction: neutral-positive, with confirmation if flows turn green.
📌 Do you think these outflows signal an “institutional flight,” or a rotation out of a single fund? Let’s discuss in the comments.
#Ethereum #ETH $ETH #ETF
Not financial advice.
#USSpotETHETFsPost23StraightDaysOfNetOutflows Record outflows are making headlines, but the real story is in a single fund.
📌 In October, U.S. spot ETH ETFs saw net outflows of -$1.61 billion (SoSoValue). That’s the largest monthly outflow since their July 2024 launch; the previous record was -$1.42B in November 2025.
📌 About $1.42 billion of that amount flowed out of BlackRock ETHA alone (around 88%). In the same month, Fidelity FETH closed positive at +$36.1M, as did Morgan Stanley MSSE at +$3.7M. So the picture isn’t “institutions are fleeing ETH,” but rather “investors in one product rotated elsewhere.”
📉 The headline says “23 consecutive days of outflows” (Glassnode). Daily SoSoValue/Farside data, however, shows 3 positive days across October’s 22 sessions (October 13, 21, and 23). There may be a difference in definitions, so it’s more useful to look at the issuer breakdown than the duration cited in the headline.
📈 Price: ETH $2,293 (+0.95%, Binance 02.11.2026 09:25 UTC). The 4H RSI is hot at 71.6; price has reached the upper Bollinger band ($2,301) and is holding above the SMA20 ($2,259). Momentum is there, but the market looks tired in the short term.
🐋 Flow evidence: Despite October’s $1.61B outflow, ETH stayed in the $2,200–2,500 range. Cumulative net inflows are still +$12.29B, with net assets at $13.22B. The market absorbed the selling; there’s no panic, just distribution.
🎯 Plan: 4H close above $2,301 -> targets at $2,317 / $2,350. Below $2,259 -> $2,217 is the defense line. With the RSI hot, it’s more solid to be a buyer on pullbacks than to chase. Direction: neutral-positive, with confirmation if flows turn green.
📌 Do you think these outflows signal an “institutional flight,” or a rotation out of a single fund? Let’s discuss in the comments.
#Ethereum #ETH $ETH #ETF
Not financial advice.
📌 In October, U.S. spot ETH ETFs saw net outflows of -$1.61 billion (SoSoValue). That’s the largest monthly outflow since their July 2024 launch; the previous record was -$1.42B in November 2025.
📌 About $1.42 billion of that amount flowed out of BlackRock ETHA alone (around 88%). In the same month, Fidelity FETH closed positive at +$36.1M, as did Morgan Stanley MSSE at +$3.7M. So the picture isn’t “institutions are fleeing ETH,” but rather “investors in one product rotated elsewhere.”
📉 The headline says “23 consecutive days of outflows” (Glassnode). Daily SoSoValue/Farside data, however, shows 3 positive days across October’s 22 sessions (October 13, 21, and 23). There may be a difference in definitions, so it’s more useful to look at the issuer breakdown than the duration cited in the headline.
📈 Price: ETH $2,293 (+0.95%, Binance 02.11.2026 09:25 UTC). The 4H RSI is hot at 71.6; price has reached the upper Bollinger band ($2,301) and is holding above the SMA20 ($2,259). Momentum is there, but the market looks tired in the short term.
🐋 Flow evidence: Despite October’s $1.61B outflow, ETH stayed in the $2,200–2,500 range. Cumulative net inflows are still +$12.29B, with net assets at $13.22B. The market absorbed the selling; there’s no panic, just distribution.
🎯 Plan: 4H close above $2,301 -> targets at $2,317 / $2,350. Below $2,259 -> $2,217 is the defense line. With the RSI hot, it’s more solid to be a buyer on pullbacks than to chase. Direction: neutral-positive, with confirmation if flows turn green.
📌 Do you think these outflows signal an “institutional flight,” or a rotation out of a single fund? Let’s discuss in the comments.
#Ethereum #ETH $ETH #ETF
Not financial advice.

70

·
--
Verified
#usspotethetfspost23straightdaysofnetoutflows
U.S. spot ETH ETFs have just set an unprecedented record: 23 consecutive days of net outflows!
After eagerly piling in to buy in August and September, traditional “whales” have suddenly turned around and now seem to be losing interest in the market, significantly slowing capital inflows. Watching your Ether portfolio continuously lose value feels like being completely ignored by an ex, friends!
What should traders do?
Right now, betting on either a rise or a fall could easily cost you your shirt. You might as well sit back and watch what the big funds do next. Don’t panic or sell at a loss just because the net outflows worry you. This is a good time to invest gradually and accumulate quality assets at a discount, then patiently wait for traditional capital to return!
⚠️ This is not financial advice.
Click below to trade and support me: $ETH
{future}(ETHUSDT)
$ESPORTS
{future}(ESPORTSUSDT)
$AIN
{future}(AINUSDT)
#usspotethetfspost23straightdaysofnetoutflows
U.S. spot ETH ETFs have just set an unprecedented record: 23 consecutive days of net outflows!
After eagerly piling in to buy in August and September, traditional “whales” have suddenly turned around and now seem to be losing interest in the market, significantly slowing capital inflows. Watching your Ether portfolio continuously lose value feels like being completely ignored by an ex, friends!
What should traders do?
Right now, betting on either a rise or a fall could easily cost you your shirt. You might as well sit back and watch what the big funds do next. Don’t panic or sell at a loss just because the net outflows worry you. This is a good time to invest gradually and accumulate quality assets at a discount, then patiently wait for traditional capital to return!
⚠️ This is not financial advice.
Click below to trade and support me: $ETH
$ESPORTS
$AIN
U.S. spot ETH ETFs have just set an unprecedented record: 23 consecutive days of net outflows!
After eagerly piling in to buy in August and September, traditional “whales” have suddenly turned around and now seem to be losing interest in the market, significantly slowing capital inflows. Watching your Ether portfolio continuously lose value feels like being completely ignored by an ex, friends!
What should traders do?
Right now, betting on either a rise or a fall could easily cost you your shirt. You might as well sit back and watch what the big funds do next. Don’t panic or sell at a loss just because the net outflows worry you. This is a good time to invest gradually and accumulate quality assets at a discount, then patiently wait for traditional capital to return!
⚠️ This is not financial advice.
Click below to trade and support me: $ETH
$ESPORTS
$AIN

4k

#USSpotETHETFsPost23StraightDaysOfNetOutflows
Twenty-three consecutive days of outflows. U.S. Spot Ethereum ETFs are facing a true hemorrhage of capital.
The inflows have simply disappeared. The market is sending a clear message, and investors are pulling their money out nonstop.
The mood is risk-averse. Capital seems to be moving into Bitcoin ETFs, which are seen as a safe haven, or simply flowing out into traditional cash. The hard truth is that Wall Street has yet to buy into the Ethereum thesis as many had expected.
The question is: how long will this last?
The market is waiting for this streak to be broken. For those investing in Ethereum, patience is being tested to the limit. Keep an eye out, because a reversal in these flows will be the major signal of a recovery.
$ESPORTS $IDOL $ETH
{spot}(ETHUSDT)
{future}(ESPORTSUSDT)
{future}(IDOLUSDT)
#USSpotETHETFsPost23StraightDaysOfNetOutflows
Twenty-three consecutive days of outflows. U.S. Spot Ethereum ETFs are facing a true hemorrhage of capital.
The inflows have simply disappeared. The market is sending a clear message, and investors are pulling their money out nonstop.
The mood is risk-averse. Capital seems to be moving into Bitcoin ETFs, which are seen as a safe haven, or simply flowing out into traditional cash. The hard truth is that Wall Street has yet to buy into the Ethereum thesis as many had expected.
The question is: how long will this last?
The market is waiting for this streak to be broken. For those investing in Ethereum, patience is being tested to the limit. Keep an eye out, because a reversal in these flows will be the major signal of a recovery.
$ESPORTS $IDOL $ETH
Twenty-three consecutive days of outflows. U.S. Spot Ethereum ETFs are facing a true hemorrhage of capital.
The inflows have simply disappeared. The market is sending a clear message, and investors are pulling their money out nonstop.
The mood is risk-averse. Capital seems to be moving into Bitcoin ETFs, which are seen as a safe haven, or simply flowing out into traditional cash. The hard truth is that Wall Street has yet to buy into the Ethereum thesis as many had expected.
The question is: how long will this last?
The market is waiting for this streak to be broken. For those investing in Ethereum, patience is being tested to the limit. Keep an eye out, because a reversal in these flows will be the major signal of a recovery.
$ESPORTS $IDOL $ETH

1
106
#usspotethetfspost23straightdaysofnetoutflows
The warning is coming before the price tells the story. U.S. spot Ethereum ETFs have recorded 23 consecutive days of outflows.
We’re talking about the largest streak of outflows since the product launched in July 2024. The striking detail is that those who were buying in August and September have switched sides and are now selling.
Institutional appetite is cooling, taking away an important source of buying pressure for ETH. That doesn’t mean the asset is about to collapse, as the money may simply be rotating into other products or into DeFi.
But the consistency is alarming. Twenty-three days is more than just a temporary pause. The market needs a recovery in genuine demand, not just price spikes. A reversal in this flow is the next major signal to watch.
In your view, have large investors lost confidence in Ethereum, or is this just a rotation of capital?
$LYN
$ESPORTS
$IDOL
{future}(LYNUSDT)
{future}(ESPORTSUSDT)
{future}(IDOLUSDT)
#usspotethetfspost23straightdaysofnetoutflows
The warning is coming before the price tells the story. U.S. spot Ethereum ETFs have recorded 23 consecutive days of outflows.
We’re talking about the largest streak of outflows since the product launched in July 2024. The striking detail is that those who were buying in August and September have switched sides and are now selling.
Institutional appetite is cooling, taking away an important source of buying pressure for ETH. That doesn’t mean the asset is about to collapse, as the money may simply be rotating into other products or into DeFi.
But the consistency is alarming. Twenty-three days is more than just a temporary pause. The market needs a recovery in genuine demand, not just price spikes. A reversal in this flow is the next major signal to watch.
In your view, have large investors lost confidence in Ethereum, or is this just a rotation of capital?
$LYN
$ESPORTS
$IDOL
The warning is coming before the price tells the story. U.S. spot Ethereum ETFs have recorded 23 consecutive days of outflows.
We’re talking about the largest streak of outflows since the product launched in July 2024. The striking detail is that those who were buying in August and September have switched sides and are now selling.
Institutional appetite is cooling, taking away an important source of buying pressure for ETH. That doesn’t mean the asset is about to collapse, as the money may simply be rotating into other products or into DeFi.
But the consistency is alarming. Twenty-three days is more than just a temporary pause. The market needs a recovery in genuine demand, not just price spikes. A reversal in this flow is the next major signal to watch.
In your view, have large investors lost confidence in Ethereum, or is this just a rotation of capital?
$LYN
$ESPORTS
$IDOL

1
339

·
--
Verified
🔍 23 straight days of outflows from ETH ETFs? The data says otherwise
Binance Square trends are discussing 23 consecutive days of outflows from US spot ETH ETFs. But Farside’s October table shows three days of net inflows: October 13 (+$24.8 million), the 21st (+$14.9 million), and the 23rd (+$4.4 million).
That said, October’s overall balance was indeed negative: around $1.61 billion in outflows, of which approximately $1.42 billion came from BlackRock’s ETHA fund. ETF flows don’t show exactly who sold ETH or why.
#USSpotETHETFsPost23StraightDaysOfNetOutflows #ETH
🔍 23 straight days of outflows from ETH ETFs? The data says otherwise
Binance Square trends are discussing 23 consecutive days of outflows from US spot ETH ETFs. But Farside’s October table shows three days of net inflows: October 13 (+$24.8 million), the 21st (+$14.9 million), and the 23rd (+$4.4 million).
That said, October’s overall balance was indeed negative: around $1.61 billion in outflows, of which approximately $1.42 billion came from BlackRock’s ETHA fund. ETF flows don’t show exactly who sold ETH or why.
#USSpotETHETFsPost23StraightDaysOfNetOutflows #ETH
Binance Square trends are discussing 23 consecutive days of outflows from US spot ETH ETFs. But Farside’s October table shows three days of net inflows: October 13 (+$24.8 million), the 21st (+$14.9 million), and the 23rd (+$4.4 million).
That said, October’s overall balance was indeed negative: around $1.61 billion in outflows, of which approximately $1.42 billion came from BlackRock’s ETHA fund. ETF flows don’t show exactly who sold ETH or why.
#USSpotETHETFsPost23StraightDaysOfNetOutflows #ETH
21

·
--
Bearish
Verified
#usspotethetfspost23straightdaysofnetoutflows
U.S. spot ETH ETFs have just set an unprecedented record: 23 consecutive days of net outflows!
After eagerly accumulating assets in August and September, traditional “whales” have suddenly turned around and lost interest, leaving inflows noticeably weaker. Watching Ether wallets keep losing steam feels just like an ex turning their back and ignoring you, folks!
What should traders do?
At this point, both longs and shorts could easily get wrecked, so it’s better to sit tight and watch what the big funds do next. Don’t panic-sell with the crowd just because there are net outflows. This is a good time to gradually build positions in quality assets at discounted prices, and patiently wait for traditional money to return!
⚠️ This is not financial advice.
Sign up for a new account to support me: [https://www.binance.com/register?ref=VINHTOCDO](https://www.binance.com/register?ref=VINHTOCDO) (Code: VINHTOCDO)
Click below to trade and support me: $ETH
{spot}(ETHUSDT)
$BNB
{spot}(BNBUSDT)
$SOL
{spot}(SOLUSDT)
#EthereumETF #CryptoOutflows #EthereumNews #TradingStrategy #VINHTOCDO
#usspotethetfspost23straightdaysofnetoutflows
U.S. spot ETH ETFs have just set an unprecedented record: 23 consecutive days of net outflows!
After eagerly accumulating assets in August and September, traditional “whales” have suddenly turned around and lost interest, leaving inflows noticeably weaker. Watching Ether wallets keep losing steam feels just like an ex turning their back and ignoring you, folks!
What should traders do?
At this point, both longs and shorts could easily get wrecked, so it’s better to sit tight and watch what the big funds do next. Don’t panic-sell with the crowd just because there are net outflows. This is a good time to gradually build positions in quality assets at discounted prices, and patiently wait for traditional money to return!
⚠️ This is not financial advice.
Sign up for a new account to support me: https://www.binance.com/register?ref=VINHTOCDO (Code: VINHTOCDO)
Click below to trade and support me: $ETH
$BNB
$SOL
#EthereumETF #CryptoOutflows #EthereumNews #TradingStrategy #VINHTOCDO
U.S. spot ETH ETFs have just set an unprecedented record: 23 consecutive days of net outflows!
After eagerly accumulating assets in August and September, traditional “whales” have suddenly turned around and lost interest, leaving inflows noticeably weaker. Watching Ether wallets keep losing steam feels just like an ex turning their back and ignoring you, folks!
What should traders do?
At this point, both longs and shorts could easily get wrecked, so it’s better to sit tight and watch what the big funds do next. Don’t panic-sell with the crowd just because there are net outflows. This is a good time to gradually build positions in quality assets at discounted prices, and patiently wait for traditional money to return!
⚠️ This is not financial advice.
Sign up for a new account to support me: https://www.binance.com/register?ref=VINHTOCDO (Code: VINHTOCDO)
Click below to trade and support me: $ETH
$BNB
$SOL
#EthereumETF #CryptoOutflows #EthereumNews #TradingStrategy #VINHTOCDO

2
722

·
--
Article
ETH trending topic claims “23 consecutive days of outflows,” but public data shows 5: check the methodology before judging institutional demandThe bottom line: “23 consecutive trading days of net outflows” from U.S. spot ETH ETFs is a hot topic on Binance Square today, but the claim needs to be qualified by the data methodology. Glassnode’s data counts through October 30 as the longest outflow streak since the products launched; Farside’s public table, however, shows net inflows of about $4.4 million on October 23, followed by five consecutive trading days of net outflows from October 26 to 30. The two datasets shouldn’t be conflated into one definitive figure. What really matters is that demand for ETH through traditional financial channels is indeed weak, but different datasets are being used to describe this period of pressure.
ETH trending topic claims “23 consecutive days of outflows,” but public data shows 5: check the methodology before judging institutional demand
The bottom line: “23 consecutive trading days of net outflows” from U.S. spot ETH ETFs is a hot topic on Binance Square today, but the claim needs to be qualified by the data methodology. Glassnode’s data counts through October 30 as the longest outflow streak since the products launched; Farside’s public table, however, shows net inflows of about $4.4 million on October 23, followed by five consecutive trading days of net outflows from October 26 to 30. The two datasets shouldn’t be conflated into one definitive figure. What really matters is that demand for ETH through traditional financial channels is indeed weak, but different datasets are being used to describe this period of pressure.
49

# IS $76K THE BITCOIN BOTTOM? $BTC COULD BE PREPARING FOR A $90K COMEBACK! I’m still watching the *I’m still watching the $76,000 zone as a potential bottom for $BTC.
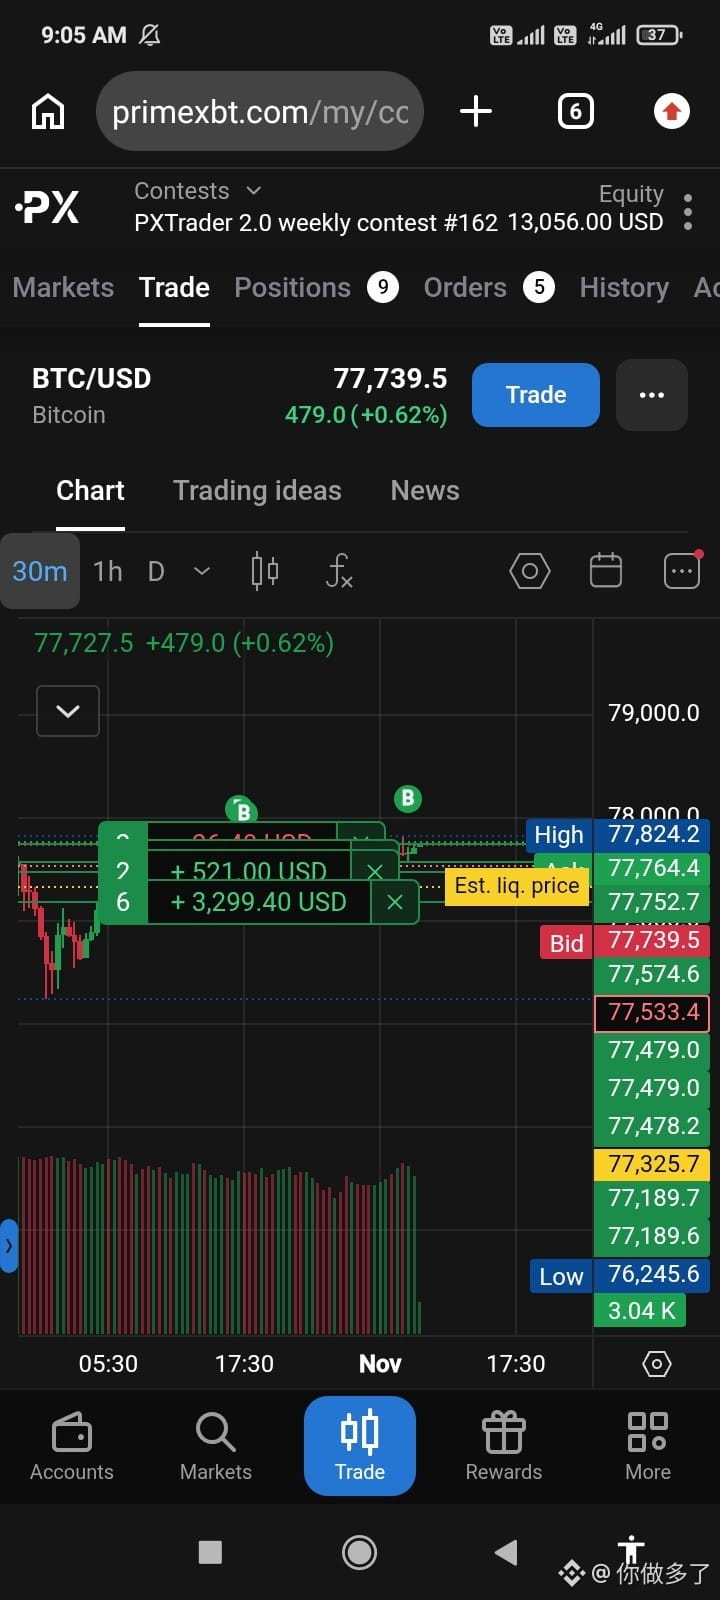
After touching approximately $76,325, Bitcoin has bounced back and is trading near $77,800. Buyers are trying to stabilize the market, but the real test is whether they can turn this recovery into a sustained bullish reversal.
And honestly... I’m watching Monday closely. 👀 Could the new week bring fresh buying pressure?
📊 THE LEVELS THAT MATTER
🟢 Support Zone: $76,000–$76,325
🔹 Near Resistance: Around $78,000
🔹 First Major Hurdle: $80,000
🚀 Breakout Confirmation: Above $82,000
🎯 Bullish Target: $90,000+
A sustained move above $80K could improve market sentiment. If buyers then reclaim $82K with strong volume, the path toward $90K becomes an interesting bullish scenario.
⚠️ WHAT COULD INVALIDATE THE BULLISH VIEW?
If $BTC loses the $76K support zone on a convincing daily close, the recovery thesis becomes weaker. The next downside areas to watch are around $74,800–$73,000.
There is also another factor traders should not ignore: US spot Ethereum ETFs have recorded 23 consecutive trading days of net outflows, highlighting continued weakness in institutional demand for ETH exposure. That broader market pressure could affect crypto sentiment too.
🧠 MY STRATEGY
I’m leaning cautiously bullish, but I don't want to chase a sudden green candle.
My focus:
Accumulate gradually rather than entering all at once.Watch how BTC reacts around $78K–$80K.Look for strong volume before treating $82K as a confirmed breakout.Keep risk management in place if $76K fails.
Imagine the market keeps waiting for $70K, while Bitcoin surprises everyone with a recovery toward $90K! 🔥
What’s your opinion, buddies? Is $76K the real bottom, or are we going to see another dip before the next major rally? 👇
#USSpotETHETFsPost23StraightDaysOfNetOutflows
#BinanceSAFUFundTransferCompleted7499BTC
{spot}(BTCUSDT)
# IS $76K THE BITCOIN BOTTOM? $BTC COULD BE PREPARING FOR A $90K COMEBACK! I’m still watching the *
I’m still watching the $76,000 zone as a potential bottom for $BTC.
After touching approximately $76,325, Bitcoin has bounced back and is trading near $77,800. Buyers are trying to stabilize the market, but the real test is whether they can turn this recovery into a sustained bullish reversal.
And honestly... I’m watching Monday closely. 👀 Could the new week bring fresh buying pressure?
📊 THE LEVELS THAT MATTER
🟢 Support Zone: $76,000–$76,325
🔹 Near Resistance: Around $78,000
🔹 First Major Hurdle: $80,000
🚀 Breakout Confirmation: Above $82,000
🎯 Bullish Target: $90,000+
A sustained move above $80K could improve market sentiment. If buyers then reclaim $82K with strong volume, the path toward $90K becomes an interesting bullish scenario.
⚠️ WHAT COULD INVALIDATE THE BULLISH VIEW?
If $BTC loses the $76K support zone on a convincing daily close, the recovery thesis becomes weaker. The next downside areas to watch are around $74,800–$73,000.
There is also another factor traders should not ignore: US spot Ethereum ETFs have recorded 23 consecutive trading days of net outflows, highlighting continued weakness in institutional demand for ETH exposure. That broader market pressure could affect crypto sentiment too.
🧠 MY STRATEGY
I’m leaning cautiously bullish, but I don't want to chase a sudden green candle.
My focus:
Accumulate gradually rather than entering all at once.Watch how BTC reacts around $78K–$80K.Look for strong volume before treating $82K as a confirmed breakout.Keep risk management in place if $76K fails.
Imagine the market keeps waiting for $70K, while Bitcoin surprises everyone with a recovery toward $90K! 🔥
What’s your opinion, buddies? Is $76K the real bottom, or are we going to see another dip before the next major rally? 👇
#USSpotETHETFsPost23StraightDaysOfNetOutflows
#BinanceSAFUFundTransferCompleted7499BTC
After touching approximately $76,325, Bitcoin has bounced back and is trading near $77,800. Buyers are trying to stabilize the market, but the real test is whether they can turn this recovery into a sustained bullish reversal.
And honestly... I’m watching Monday closely. 👀 Could the new week bring fresh buying pressure?
📊 THE LEVELS THAT MATTER
🟢 Support Zone: $76,000–$76,325
🔹 Near Resistance: Around $78,000
🔹 First Major Hurdle: $80,000
🚀 Breakout Confirmation: Above $82,000
🎯 Bullish Target: $90,000+
A sustained move above $80K could improve market sentiment. If buyers then reclaim $82K with strong volume, the path toward $90K becomes an interesting bullish scenario.
⚠️ WHAT COULD INVALIDATE THE BULLISH VIEW?
If $BTC loses the $76K support zone on a convincing daily close, the recovery thesis becomes weaker. The next downside areas to watch are around $74,800–$73,000.
There is also another factor traders should not ignore: US spot Ethereum ETFs have recorded 23 consecutive trading days of net outflows, highlighting continued weakness in institutional demand for ETH exposure. That broader market pressure could affect crypto sentiment too.
🧠 MY STRATEGY
I’m leaning cautiously bullish, but I don't want to chase a sudden green candle.
My focus:
Accumulate gradually rather than entering all at once.Watch how BTC reacts around $78K–$80K.Look for strong volume before treating $82K as a confirmed breakout.Keep risk management in place if $76K fails.
Imagine the market keeps waiting for $70K, while Bitcoin surprises everyone with a recovery toward $90K! 🔥
What’s your opinion, buddies? Is $76K the real bottom, or are we going to see another dip before the next major rally? 👇
#USSpotETHETFsPost23StraightDaysOfNetOutflows
#BinanceSAFUFundTransferCompleted7499BTC
31

Log in to explore more content
Join global crypto users on Binance Square
⚡️ Get latest and useful information about crypto.
💬 Trusted by the world’s largest crypto exchange.
👍 Discover real insights from verified creators.
Email / Phone number
Trending Topics
1
#BinanceRestores28FiatWithdrawals
18,022 views
375 Discussing
2
#BinanceProcesses$4.65BWithdrawals
69,127 views
299 Discussing
3
#ETHFalls16.1%InOctober
4,390 views
126 Discussing
4
#BitcoinETFsSee$643MOutflowLargestSinceJune
0 views
0 Discussing
5
#SouthKoreaPlans11%TaxOnUSStockPerpetualFutures
0 views
1 Discussing
6
#BitcoinClosesAbove50WeekMAFor7thStraightWeek
6,606 views
143 Discussing
7
#HongKongEnablesRoundTheClockTokenizedSettlement
173 views
11 Discussing
8
#IndiaRBIAndFIUReviewOverseasCryptoCards
876 views
33 Discussing
9
#BitcoinSpotETFsPost$203MWeeklyOutflow
6,802 views
47 Discussing
10
#SouthKoreanLawmakerProposesReviewOfAllListedDigitalAssets
2,285 views
51 Discussing