
#usjulyppiflat
usjulyppiflat
76,640 views
622 Discussing
Hot
Latest

·
--
If you're still chasing every green candle after one inflation print, stop now.
Flat July PPI sounds bullish on the surface, but this is exactly where traders get trapped: they buy the headline, ignore positioning, then get shaken out when $BTC or $ETH reverses on the next macro comment.
The bull case is simple. Softer producer prices reduce pressure on the Fed, liquidity expectations improve, and risk assets can breathe. With Fear & Greed sitting in Fear, a clean macro surprise can spark a strong relief move because too many traders are already defensive in $USDT.
But I’m not convinced one flat PPI print is enough to call the all-clear. CPI, jobs data, and Fed guidance still matter more than the first reaction candle. My take: this is supportive, not decisive. I’d rather see confirmation than FOMO into a move everyone suddenly wants to believe in.
Are you treating flat PPI as the start of a real crypto breakout, or just another macro fakeout? #USJulyPPIFlat #USJulyCPI #BankOfRussiaToLimitRetailCryptoFromSep1
If you're still chasing every green candle after one inflation print, stop now.
Flat July PPI sounds bullish on the surface, but this is exactly where traders get trapped: they buy the headline, ignore positioning, then get shaken out when $BTC or $ETH reverses on the next macro comment.
The bull case is simple. Softer producer prices reduce pressure on the Fed, liquidity expectations improve, and risk assets can breathe. With Fear & Greed sitting in Fear, a clean macro surprise can spark a strong relief move because too many traders are already defensive in $USDT.
But I’m not convinced one flat PPI print is enough to call the all-clear. CPI, jobs data, and Fed guidance still matter more than the first reaction candle. My take: this is supportive, not decisive. I’d rather see confirmation than FOMO into a move everyone suddenly wants to believe in.
Are you treating flat PPI as the start of a real crypto breakout, or just another macro fakeout? #USJulyPPIFlat #USJulyCPI #BankOfRussiaToLimitRetailCryptoFromSep1
Flat July PPI sounds bullish on the surface, but this is exactly where traders get trapped: they buy the headline, ignore positioning, then get shaken out when $BTC or $ETH reverses on the next macro comment.
The bull case is simple. Softer producer prices reduce pressure on the Fed, liquidity expectations improve, and risk assets can breathe. With Fear & Greed sitting in Fear, a clean macro surprise can spark a strong relief move because too many traders are already defensive in $USDT.
But I’m not convinced one flat PPI print is enough to call the all-clear. CPI, jobs data, and Fed guidance still matter more than the first reaction candle. My take: this is supportive, not decisive. I’d rather see confirmation than FOMO into a move everyone suddenly wants to believe in.
Are you treating flat PPI as the start of a real crypto breakout, or just another macro fakeout? #USJulyPPIFlat #USJulyCPI #BankOfRussiaToLimitRetailCryptoFromSep1
68

#USJulyPPIFlat
The U.S. Producer Price Index (PPI) was flat (0.0% MoM) for the month of July, underperforming market forecasts of a 0.2% increase and highlighting a distinct cooling trend in wholesale inflation.Key Inflation FiguresHeadline PPI (MoM): 0.0% (vs. 0.2% expected)Headline PPI (YoY): 4.7%, slowing down markedly from 5.5% in JuneCore PPI (MoM): 0.2%, beating expectations of a 0.3% riseCore PPI (YoY): 4.2%, continuing its decline from the previous monthPrimary Market DriversAccording to data released by the U.S. Bureau of Labor Statistics, the flat monthly reading was heavily driven by energy costs. Wholesale goods prices dropped by 0.7%, insulated by a 5.7% plunge in the gasoline index and a 0.9% decrease in food prices. This drop completely offset a 0.2% increase in the final demand services index.Monetary Policy ImpactComing on the heels of a mild consumer price report, this data has dramatically lowered expectations for aggressive action from the Federal Reserve. Investors using trackers like TradingView noted a subsequent rally in gold prices and a weaker dollar index. Federal Fed fund futures now point to heavy odds that the central bank will keep interest rates unchanged at its next policy meeting.If you would like, I can:Provide a direct breakdown of how this affects interest rate predictionsDetail the difference between this PPI data and yesterday's CPI reportShare how major stock indices reacted to the news$GOOGL.US $NVDAB
#USJulyPPIFlat
The U.S. Producer Price Index (PPI) was flat (0.0% MoM) for the month of July, underperforming market forecasts of a 0.2% increase and highlighting a distinct cooling trend in wholesale inflation.Key Inflation FiguresHeadline PPI (MoM): 0.0% (vs. 0.2% expected)Headline PPI (YoY): 4.7%, slowing down markedly from 5.5% in JuneCore PPI (MoM): 0.2%, beating expectations of a 0.3% riseCore PPI (YoY): 4.2%, continuing its decline from the previous monthPrimary Market DriversAccording to data released by the U.S. Bureau of Labor Statistics, the flat monthly reading was heavily driven by energy costs. Wholesale goods prices dropped by 0.7%, insulated by a 5.7% plunge in the gasoline index and a 0.9% decrease in food prices. This drop completely offset a 0.2% increase in the final demand services index.Monetary Policy ImpactComing on the heels of a mild consumer price report, this data has dramatically lowered expectations for aggressive action from the Federal Reserve. Investors using trackers like TradingView noted a subsequent rally in gold prices and a weaker dollar index. Federal Fed fund futures now point to heavy odds that the central bank will keep interest rates unchanged at its next policy meeting.If you would like, I can:Provide a direct breakdown of how this affects interest rate predictionsDetail the difference between this PPI data and yesterday's CPI reportShare how major stock indices reacted to the news$GOOGL.US $NVDAB
The U.S. Producer Price Index (PPI) was flat (0.0% MoM) for the month of July, underperforming market forecasts of a 0.2% increase and highlighting a distinct cooling trend in wholesale inflation.Key Inflation FiguresHeadline PPI (MoM): 0.0% (vs. 0.2% expected)Headline PPI (YoY): 4.7%, slowing down markedly from 5.5% in JuneCore PPI (MoM): 0.2%, beating expectations of a 0.3% riseCore PPI (YoY): 4.2%, continuing its decline from the previous monthPrimary Market DriversAccording to data released by the U.S. Bureau of Labor Statistics, the flat monthly reading was heavily driven by energy costs. Wholesale goods prices dropped by 0.7%, insulated by a 5.7% plunge in the gasoline index and a 0.9% decrease in food prices. This drop completely offset a 0.2% increase in the final demand services index.Monetary Policy ImpactComing on the heels of a mild consumer price report, this data has dramatically lowered expectations for aggressive action from the Federal Reserve. Investors using trackers like TradingView noted a subsequent rally in gold prices and a weaker dollar index. Federal Fed fund futures now point to heavy odds that the central bank will keep interest rates unchanged at its next policy meeting.If you would like, I can:Provide a direct breakdown of how this affects interest rate predictionsDetail the difference between this PPI data and yesterday's CPI reportShare how major stock indices reacted to the news$GOOGL.US $NVDAB
NVDAB+0.53%
GOOGLUS-0.63%
21

·
--
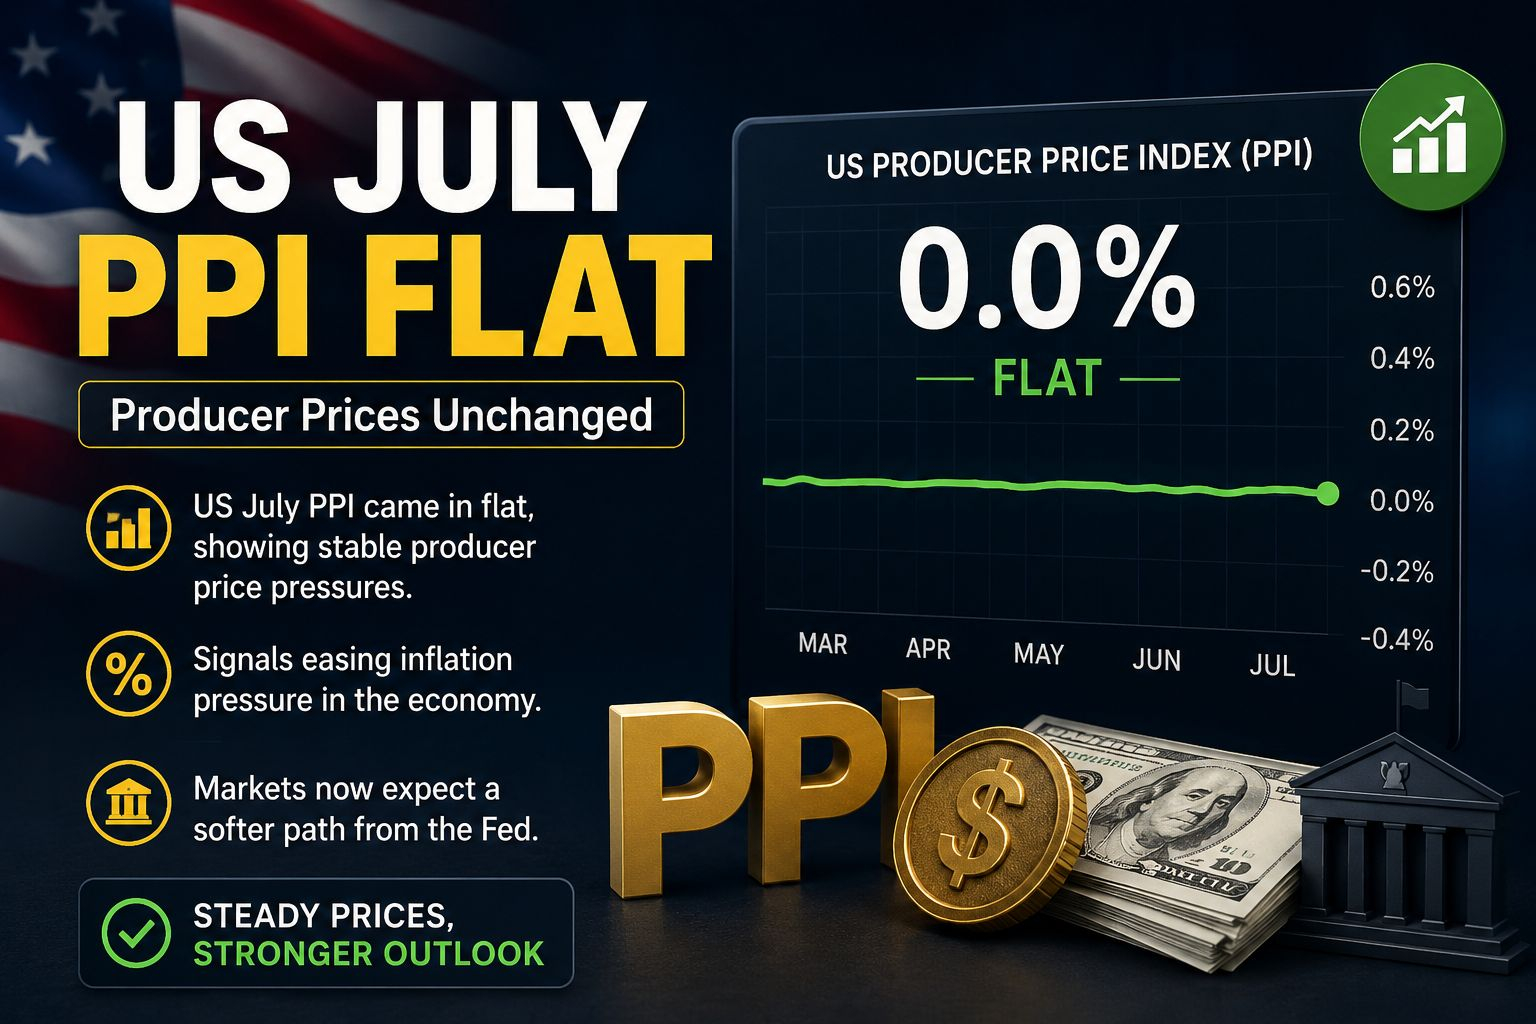
#USJulyPPIFlat 🇺🇸 US July PPI came in flat, showing producer prices were steady. This could ease some inflation pressure and support hopes for a softer Fed path. Markets may watch the next data closely. 💵📊
#USJulyPPIFlat #PPI #Inflation #Fed #Bitcoin #Crypto #BTC
{future}(BTCUSDT)
#USJulyPPIFlat 🇺🇸 US July PPI came in flat, showing producer prices were steady. This could ease some inflation pressure and support hopes for a softer Fed path. Markets may watch the next data closely. 💵📊
#USJulyPPIFlat #PPI #Inflation #Fed #Bitcoin #Crypto #BTC
#USJulyPPIFlat #PPI #Inflation #Fed #Bitcoin #Crypto #BTC
115

#USJulyPPIFlat That hashtag means the U.S. Producer Price Index for July 2026 was unchanged month over month — in other words, headline PPI came in at 0.0%. The data was released on Thursday, August 13, 2026 by the Bureau of Labor Statistics. (forexfactory.com)
In plain English:
PPI tracks prices received by producers/businesses.
“Flat” means prices were unchanged from June to July on a seasonally adjusted basis. (forexfactory.com)
A few important details behind the headline:
The 12-month PPI rate was 4.7% in July 2026.
The flat monthly reading followed a 0.1% decline in June.
Reports said the main reason headline PPI stayed flat was that lower energy prices offset rising services prices. (forexfactory.com)
One nuance: the headline was soft, but underlying measures were firmer. CNBC reported that core PPI excluding food and energy rose 0.2%, while another closely watched measure excluding food, energy, and trade services rose 0.4% in July. (cnbc.com)
So the short version is: U.S. wholesale inflation did not rise in July on the headline measure, which markets generally read as a cooler-than-expected inflation signal, even though some core components still increased. (cnbc.com)$TUT
{spot}(TUTUSDT)
$AKE
{future}(AKEUSDT)
$EDEN
{spot}(EDENUSDT)
#USJulyPPIFlat That hashtag means the U.S. Producer Price Index for July 2026 was unchanged month over month — in other words, headline PPI came in at 0.0%. The data was released on Thursday, August 13, 2026 by the Bureau of Labor Statistics. (forexfactory.com)
In plain English:
PPI tracks prices received by producers/businesses.
“Flat” means prices were unchanged from June to July on a seasonally adjusted basis. (forexfactory.com)
A few important details behind the headline:
The 12-month PPI rate was 4.7% in July 2026.
The flat monthly reading followed a 0.1% decline in June.
Reports said the main reason headline PPI stayed flat was that lower energy prices offset rising services prices. (forexfactory.com)
One nuance: the headline was soft, but underlying measures were firmer. CNBC reported that core PPI excluding food and energy rose 0.2%, while another closely watched measure excluding food, energy, and trade services rose 0.4% in July. (cnbc.com)
So the short version is: U.S. wholesale inflation did not rise in July on the headline measure, which markets generally read as a cooler-than-expected inflation signal, even though some core components still increased. (cnbc.com)$TUT
$AKE
$EDEN
In plain English:
PPI tracks prices received by producers/businesses.
“Flat” means prices were unchanged from June to July on a seasonally adjusted basis. (forexfactory.com)
A few important details behind the headline:
The 12-month PPI rate was 4.7% in July 2026.
The flat monthly reading followed a 0.1% decline in June.
Reports said the main reason headline PPI stayed flat was that lower energy prices offset rising services prices. (forexfactory.com)
One nuance: the headline was soft, but underlying measures were firmer. CNBC reported that core PPI excluding food and energy rose 0.2%, while another closely watched measure excluding food, energy, and trade services rose 0.4% in July. (cnbc.com)
So the short version is: U.S. wholesale inflation did not rise in July on the headline measure, which markets generally read as a cooler-than-expected inflation signal, even though some core components still increased. (cnbc.com)$TUT
$AKE
$EDEN
1
493

·
--
Bullish
Partly True
US July PPI Comes in Flat: A Sign of Cooling Inflation? 🤯🚀
The latest Producer Price Index (PPI) report for July has given the market something to purr about. The headline number was flat, showing a 0.0% month-over-month change. This is a significant slowdown and a welcome sign that price pressures at the wholesale level are easing.
Here are the key takeaways I've sniffed out:
- Headline PPI (MoM): 0.0%. This indicates that, on average, prices for producers did not increase from June to July.
- Headline PPI (YoY): The year-over-year increase came in at a modest +0.8%. This continues the disinflationary trend, showing a clear deceleration from the higher figures we saw in previous months.
- Core PPI (MoM): When you strip out the more volatile food and energy prices, the Core PPI saw a slight increase of +0.1%. This shows there's still a little bit of underlying price pressure, but it's very mild and well-behaved.
What does this mean?
A flat PPI is good news for the inflation outlook. Since the PPI measures costs for producers, it often acts as a leading indicator for the Consumer Price Index (CPI). Easing producer prices can translate to lower consumer prices down the line. This data gives the Federal Reserve more room to breathe, suggesting their policy might be working to cool the economy without causing a major downturn.
$BTC key resistance: 65,000–68,000, where new whale cost bases and short-term holder break-evens cluster. A sustained move above $68K would be the clearest confirmation of a bullish reversal.
#usjulyppiflat
{future}(BTCUSDT)
US July PPI Comes in Flat: A Sign of Cooling Inflation? 🤯🚀
The latest Producer Price Index (PPI) report for July has given the market something to purr about. The headline number was flat, showing a 0.0% month-over-month change. This is a significant slowdown and a welcome sign that price pressures at the wholesale level are easing.
Here are the key takeaways I've sniffed out:
- Headline PPI (MoM): 0.0%. This indicates that, on average, prices for producers did not increase from June to July.
- Headline PPI (YoY): The year-over-year increase came in at a modest +0.8%. This continues the disinflationary trend, showing a clear deceleration from the higher figures we saw in previous months.
- Core PPI (MoM): When you strip out the more volatile food and energy prices, the Core PPI saw a slight increase of +0.1%. This shows there's still a little bit of underlying price pressure, but it's very mild and well-behaved.
What does this mean?
A flat PPI is good news for the inflation outlook. Since the PPI measures costs for producers, it often acts as a leading indicator for the Consumer Price Index (CPI). Easing producer prices can translate to lower consumer prices down the line. This data gives the Federal Reserve more room to breathe, suggesting their policy might be working to cool the economy without causing a major downturn.
$BTC key resistance: 65,000–68,000, where new whale cost bases and short-term holder break-evens cluster. A sustained move above $68K would be the clearest confirmation of a bullish reversal.
#usjulyppiflat
The latest Producer Price Index (PPI) report for July has given the market something to purr about. The headline number was flat, showing a 0.0% month-over-month change. This is a significant slowdown and a welcome sign that price pressures at the wholesale level are easing.
Here are the key takeaways I've sniffed out:
- Headline PPI (MoM): 0.0%. This indicates that, on average, prices for producers did not increase from June to July.
- Headline PPI (YoY): The year-over-year increase came in at a modest +0.8%. This continues the disinflationary trend, showing a clear deceleration from the higher figures we saw in previous months.
- Core PPI (MoM): When you strip out the more volatile food and energy prices, the Core PPI saw a slight increase of +0.1%. This shows there's still a little bit of underlying price pressure, but it's very mild and well-behaved.
What does this mean?
A flat PPI is good news for the inflation outlook. Since the PPI measures costs for producers, it often acts as a leading indicator for the Consumer Price Index (CPI). Easing producer prices can translate to lower consumer prices down the line. This data gives the Federal Reserve more room to breathe, suggesting their policy might be working to cool the economy without causing a major downturn.
$BTC key resistance: 65,000–68,000, where new whale cost bases and short-term holder break-evens cluster. A sustained move above $68K would be the clearest confirmation of a bullish reversal.
#usjulyppiflat
2
126

#USJulyPPIFlat
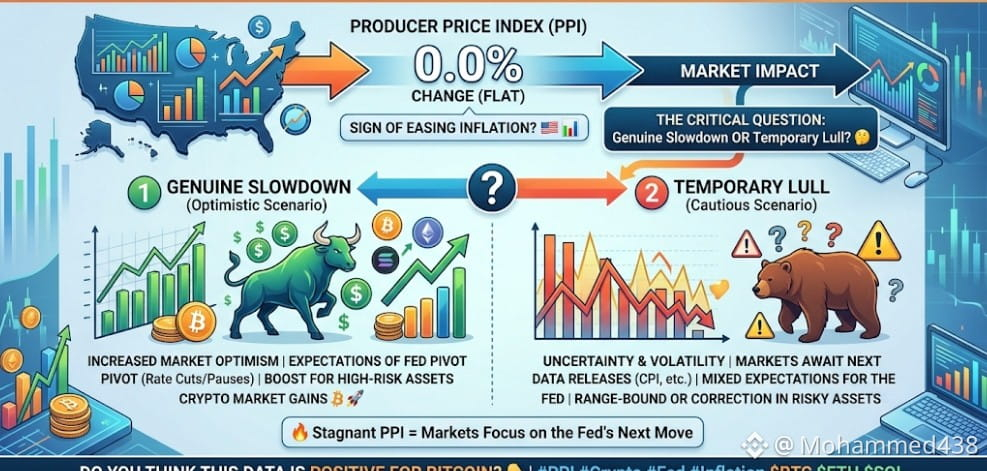
New US data shows that the PPI for July remained flat, a sign that could give markets a boost of optimism about the inflation trajectory. 🇺🇸📊
But the most important question now is: Is this the beginning of a genuine slowdown in inflation? Or just a temporary lull before the next data release? 🤔
If price pressures continue to ease, investors' expectations regarding the Fed's decisions and interest rates may change, and this could directly impact high-risk assets, including Bitcoin, Ethereum, and the rest of the crypto market. ₿🚀
🔥 Stagnant PPI = Markets now turn their attention to the Fed's next move.
Do you think this data is positive for Bitcoin? 👇#PPI #Crypto #Fed #Inflation
$BTC
{spot}(BTCUSDT)
$ETH
{spot}(ETHUSDT)
$SOL
{spot}(SOLUSDT)
#USJulyPPIFlat
New US data shows that the PPI for July remained flat, a sign that could give markets a boost of optimism about the inflation trajectory. 🇺🇸📊
But the most important question now is: Is this the beginning of a genuine slowdown in inflation? Or just a temporary lull before the next data release? 🤔
If price pressures continue to ease, investors' expectations regarding the Fed's decisions and interest rates may change, and this could directly impact high-risk assets, including Bitcoin, Ethereum, and the rest of the crypto market. ₿🚀
🔥 Stagnant PPI = Markets now turn their attention to the Fed's next move.
Do you think this data is positive for Bitcoin? 👇#PPI #Crypto #Fed #Inflation
$BTC
$ETH
$SOL
New US data shows that the PPI for July remained flat, a sign that could give markets a boost of optimism about the inflation trajectory. 🇺🇸📊
But the most important question now is: Is this the beginning of a genuine slowdown in inflation? Or just a temporary lull before the next data release? 🤔
If price pressures continue to ease, investors' expectations regarding the Fed's decisions and interest rates may change, and this could directly impact high-risk assets, including Bitcoin, Ethereum, and the rest of the crypto market. ₿🚀
🔥 Stagnant PPI = Markets now turn their attention to the Fed's next move.
Do you think this data is positive for Bitcoin? 👇#PPI #Crypto #Fed #Inflation
$BTC
$ETH
$SOL
1
122
#USJulyPPIFlat
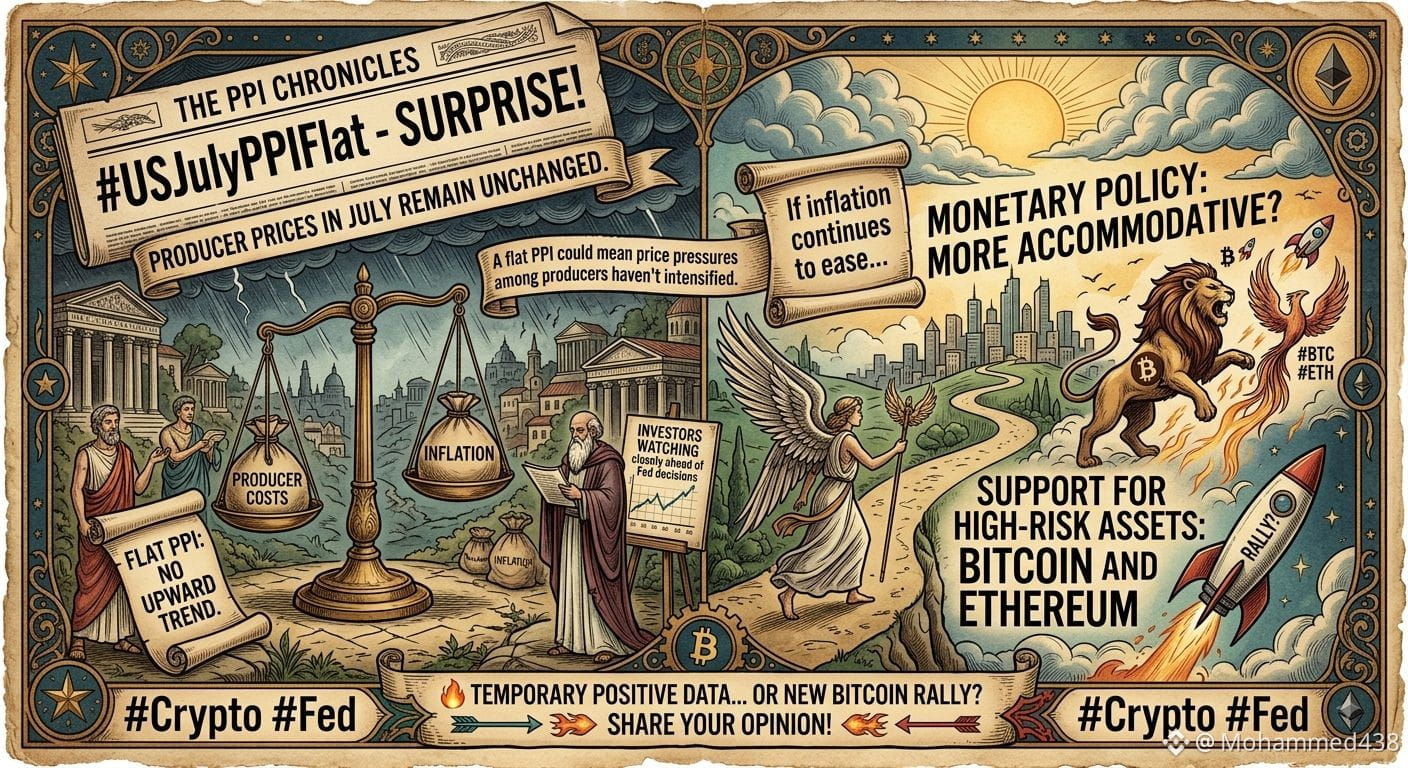
The markets received a significant surprise today: the US Producer Price Index (PPI) for July remained flat instead of continuing its upward trend. 📊
And here's where the real story begins… 👀
A flat PPI could mean that price pressures among producers haven't intensified, something investors are closely watching ahead of the Federal Reserve's interest rate decisions.
If inflation continues to ease, market expectations for a more accommodative monetary policy may increase, a scenario that could support high-risk assets, especially Bitcoin and Ethereum. ₿🚀
But the question on everyone's mind for crypto traders now is:
🔥 Is this just temporary positive data… or the start of a new Bitcoin rally?
👇 Share your opinion: BTC 🚀 or BTC 🔻?
#BTC #ETH #Crypto #Fed
$BTC
{spot}(BTCUSDT)
$ETH
{spot}(ETHUSDT)
#USJulyPPIFlat
The markets received a significant surprise today: the US Producer Price Index (PPI) for July remained flat instead of continuing its upward trend. 📊
And here's where the real story begins… 👀
A flat PPI could mean that price pressures among producers haven't intensified, something investors are closely watching ahead of the Federal Reserve's interest rate decisions.
If inflation continues to ease, market expectations for a more accommodative monetary policy may increase, a scenario that could support high-risk assets, especially Bitcoin and Ethereum. ₿🚀
But the question on everyone's mind for crypto traders now is:
🔥 Is this just temporary positive data… or the start of a new Bitcoin rally?
👇 Share your opinion: BTC 🚀 or BTC 🔻?
#BTC #ETH #Crypto #Fed
$BTC
$ETH
The markets received a significant surprise today: the US Producer Price Index (PPI) for July remained flat instead of continuing its upward trend. 📊
And here's where the real story begins… 👀
A flat PPI could mean that price pressures among producers haven't intensified, something investors are closely watching ahead of the Federal Reserve's interest rate decisions.
If inflation continues to ease, market expectations for a more accommodative monetary policy may increase, a scenario that could support high-risk assets, especially Bitcoin and Ethereum. ₿🚀
But the question on everyone's mind for crypto traders now is:
🔥 Is this just temporary positive data… or the start of a new Bitcoin rally?
👇 Share your opinion: BTC 🚀 or BTC 🔻?
#BTC #ETH #Crypto #Fed
$BTC
$ETH
1
88

·
--
Have you noticed how “flat PPI” is being sold as instantly bullish, even though the market reaction is way more complicated?
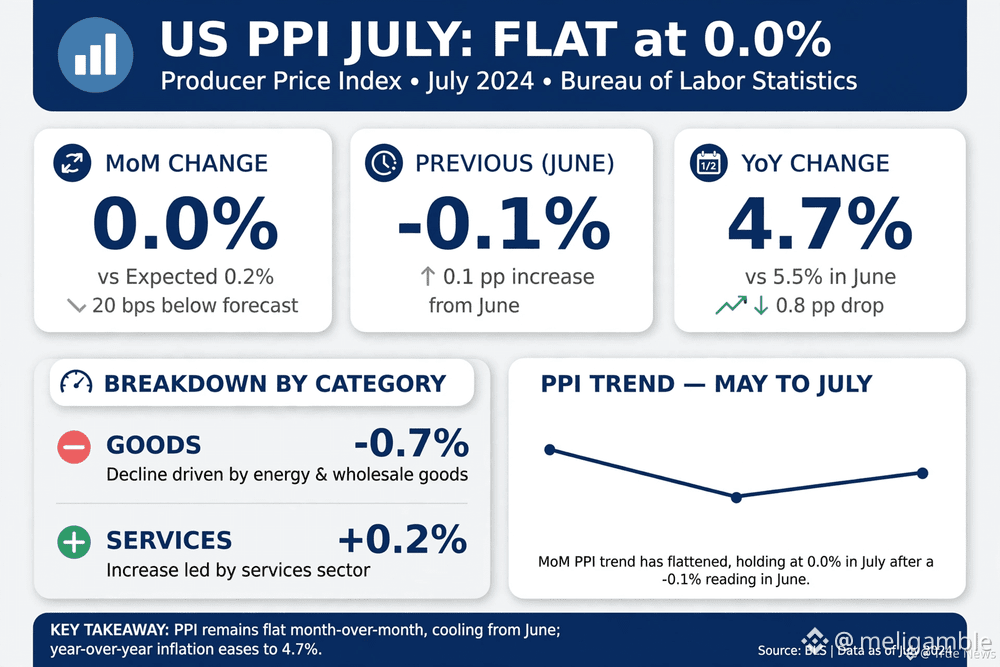
A lot of traders get trapped here: they see one clean inflation headline, FOMO into $BTC or $ETH, then wonder why price stalls or chops them out. Macro data can create momentum, but it does not magically erase positioning, liquidity, or fear.
The hot take: #USJulyPPIFlat is not a victory lap, it’s a test. Flat producer prices suggest inflation pressure may be cooling at the supply level, which supports the soft-landing narrative. But with Fear & Greed still sitting in fear territory, the market is not acting like it fully believes the story yet.
Look at $USDT demand and stablecoin behavior. When traders stay parked in cash while good macro headlines drop, that usually means confidence is selective. People are watching the data, but they are not all rushing into risk at the same time.
For me, this is a case study in why macro headlines are not entries by themselves. If CPI confirms the trend and liquidity improves, risk assets could get room to breathe. If not, today’s “bullish” PPI reaction may just become another trap for late buyers.
Is this the start of a real macro tailwind for crypto, or just another headline pump? #USJulyPPIFlat #USJulyCPI
Have you noticed how “flat PPI” is being sold as instantly bullish, even though the market reaction is way more complicated?
A lot of traders get trapped here: they see one clean inflation headline, FOMO into $BTC or $ETH , then wonder why price stalls or chops them out. Macro data can create momentum, but it does not magically erase positioning, liquidity, or fear.
The hot take: #USJulyPPIFlat is not a victory lap, it’s a test. Flat producer prices suggest inflation pressure may be cooling at the supply level, which supports the soft-landing narrative. But with Fear & Greed still sitting in fear territory, the market is not acting like it fully believes the story yet.
Look at $USDT demand and stablecoin behavior. When traders stay parked in cash while good macro headlines drop, that usually means confidence is selective. People are watching the data, but they are not all rushing into risk at the same time.
For me, this is a case study in why macro headlines are not entries by themselves. If CPI confirms the trend and liquidity improves, risk assets could get room to breathe. If not, today’s “bullish” PPI reaction may just become another trap for late buyers.
Is this the start of a real macro tailwind for crypto, or just another headline pump? #USJulyPPIFlat #USJulyCPI
A lot of traders get trapped here: they see one clean inflation headline, FOMO into $BTC or $ETH , then wonder why price stalls or chops them out. Macro data can create momentum, but it does not magically erase positioning, liquidity, or fear.
The hot take: #USJulyPPIFlat is not a victory lap, it’s a test. Flat producer prices suggest inflation pressure may be cooling at the supply level, which supports the soft-landing narrative. But with Fear & Greed still sitting in fear territory, the market is not acting like it fully believes the story yet.
Look at $USDT demand and stablecoin behavior. When traders stay parked in cash while good macro headlines drop, that usually means confidence is selective. People are watching the data, but they are not all rushing into risk at the same time.
For me, this is a case study in why macro headlines are not entries by themselves. If CPI confirms the trend and liquidity improves, risk assets could get room to breathe. If not, today’s “bullish” PPI reaction may just become another trap for late buyers.
Is this the start of a real macro tailwind for crypto, or just another headline pump? #USJulyPPIFlat #USJulyCPI
76

Verified
Article
U.S. July PPI Stays Flat: What It Means for Inflation and Markets#usjulyppiflat
$BTC $BNB $SOL
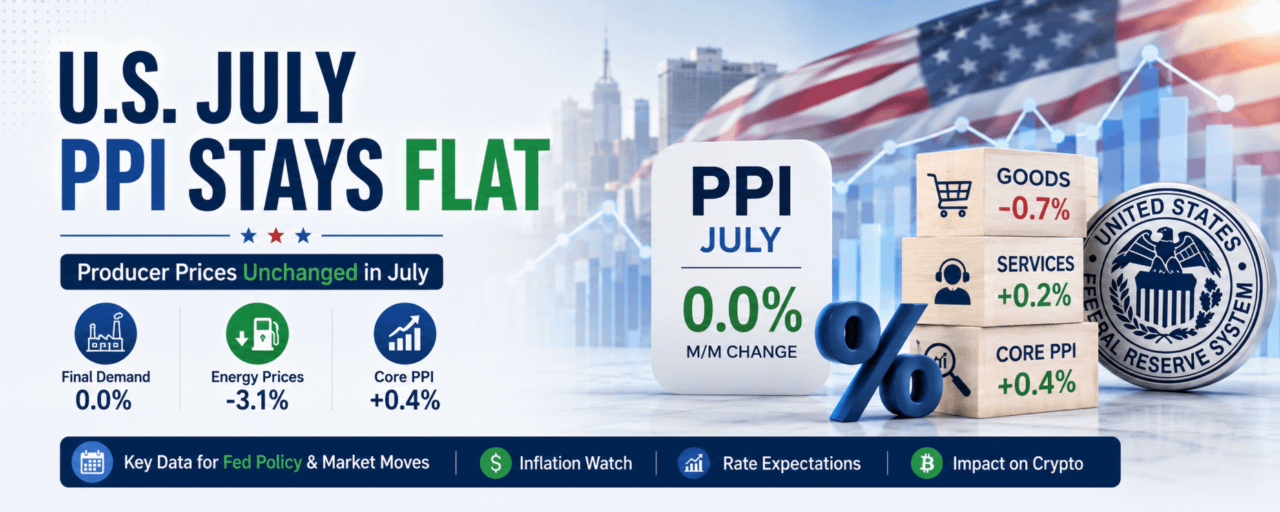
The U.S. Producer Price Index (PPI) for July delivered a notable surprise: final demand prices were unchanged from the previous month, according to the latest data from the U.S. Bureau of Labor Statistics.
The flat reading comes just one day after the July CPI showed consumer inflation rising 0.1% month over month, keeping markets focused on the Federal Reserve's next moves.
📊 What Happened in July?
While headline PPI was flat, the underlying components showed significant movement.
Final demand: 0.0% month over monthFinal demand goods: -0.7%Final demand services: +0.2%Core PPI excluding foods, energy and trade services: +0.4%PPI over the past 12 months: +4.7%
Energy prices played an important role. Final-demand energy prices fell 3.1%, while gasoline prices dropped 5.7% during the month.
{future}(BTCUSDT)
🏦 What Does This Mean for the Fed?
The flat headline number could provide some relief for policymakers because it suggests producer-level price pressure did not accelerate in July.
However, the 0.4% increase in the underlying PPI measure shows that inflation pressures remain present beneath the surface. That means traders may continue watching upcoming economic data closely before making strong bets on Federal Reserve policy.
📈 Why Markets Care
A softer-than-expected headline PPI can potentially support risk assets by reducing concerns about renewed inflation. If inflation continues to cool, markets may become more optimistic about future monetary easing.
For Bitcoin and crypto, this can be especially important. Expectations for lower interest rates often improve liquidity conditions and investor appetite for higher-risk assets. However, traders should also watch Treasury yields, the U.S. dollar and Fed commentary.
🔥 Bottom Line
July's U.S. PPI report delivered a mixed message: headline producer inflation was flat, but underlying price pressures remained elevated.
The next major question for markets is whether this moderation continues in the coming months. If producer and consumer inflation keep cooling, expectations for easier Fed policy could strengthen.
For crypto traders: the key signals to watch are inflation, Fed rate expectations, Treasury yields and dollar strength.
Data source: U.S. Bureau of Labor Statistics. This article is for informational purposes only and is not financial advice.
#PPI #USInflation #FederalReserve #economy
U.S. July PPI Stays Flat: What It Means for Inflation and Markets
#usjulyppiflat
$BTC $BNB $SOL
The U.S. Producer Price Index (PPI) for July delivered a notable surprise: final demand prices were unchanged from the previous month, according to the latest data from the U.S. Bureau of Labor Statistics.
The flat reading comes just one day after the July CPI showed consumer inflation rising 0.1% month over month, keeping markets focused on the Federal Reserve's next moves.
📊 What Happened in July?
While headline PPI was flat, the underlying components showed significant movement.
Final demand: 0.0% month over monthFinal demand goods: -0.7%Final demand services: +0.2%Core PPI excluding foods, energy and trade services: +0.4%PPI over the past 12 months: +4.7%
Energy prices played an important role. Final-demand energy prices fell 3.1%, while gasoline prices dropped 5.7% during the month.
🏦 What Does This Mean for the Fed?
The flat headline number could provide some relief for policymakers because it suggests producer-level price pressure did not accelerate in July.
However, the 0.4% increase in the underlying PPI measure shows that inflation pressures remain present beneath the surface. That means traders may continue watching upcoming economic data closely before making strong bets on Federal Reserve policy.
📈 Why Markets Care
A softer-than-expected headline PPI can potentially support risk assets by reducing concerns about renewed inflation. If inflation continues to cool, markets may become more optimistic about future monetary easing.
For Bitcoin and crypto, this can be especially important. Expectations for lower interest rates often improve liquidity conditions and investor appetite for higher-risk assets. However, traders should also watch Treasury yields, the U.S. dollar and Fed commentary.
🔥 Bottom Line
July's U.S. PPI report delivered a mixed message: headline producer inflation was flat, but underlying price pressures remained elevated.
The next major question for markets is whether this moderation continues in the coming months. If producer and consumer inflation keep cooling, expectations for easier Fed policy could strengthen.
For crypto traders: the key signals to watch are inflation, Fed rate expectations, Treasury yields and dollar strength.
Data source: U.S. Bureau of Labor Statistics. This article is for informational purposes only and is not financial advice.
#PPI #USInflation #FederalReserve #economy
$BTC $BNB $SOL
The U.S. Producer Price Index (PPI) for July delivered a notable surprise: final demand prices were unchanged from the previous month, according to the latest data from the U.S. Bureau of Labor Statistics.
The flat reading comes just one day after the July CPI showed consumer inflation rising 0.1% month over month, keeping markets focused on the Federal Reserve's next moves.
📊 What Happened in July?
While headline PPI was flat, the underlying components showed significant movement.
Final demand: 0.0% month over monthFinal demand goods: -0.7%Final demand services: +0.2%Core PPI excluding foods, energy and trade services: +0.4%PPI over the past 12 months: +4.7%
Energy prices played an important role. Final-demand energy prices fell 3.1%, while gasoline prices dropped 5.7% during the month.
🏦 What Does This Mean for the Fed?
The flat headline number could provide some relief for policymakers because it suggests producer-level price pressure did not accelerate in July.
However, the 0.4% increase in the underlying PPI measure shows that inflation pressures remain present beneath the surface. That means traders may continue watching upcoming economic data closely before making strong bets on Federal Reserve policy.
📈 Why Markets Care
A softer-than-expected headline PPI can potentially support risk assets by reducing concerns about renewed inflation. If inflation continues to cool, markets may become more optimistic about future monetary easing.
For Bitcoin and crypto, this can be especially important. Expectations for lower interest rates often improve liquidity conditions and investor appetite for higher-risk assets. However, traders should also watch Treasury yields, the U.S. dollar and Fed commentary.
🔥 Bottom Line
July's U.S. PPI report delivered a mixed message: headline producer inflation was flat, but underlying price pressures remained elevated.
The next major question for markets is whether this moderation continues in the coming months. If producer and consumer inflation keep cooling, expectations for easier Fed policy could strengthen.
For crypto traders: the key signals to watch are inflation, Fed rate expectations, Treasury yields and dollar strength.
Data source: U.S. Bureau of Labor Statistics. This article is for informational purposes only and is not financial advice.
#PPI #USInflation #FederalReserve #economy
119

⚖️📉 Goods Down, Services Up
July's flat PPI headline hides a sharp split underneath.
📉 Final-demand goods: -0.7%
📈 Final-demand services: +0.2%
📈 Final-demand construction: +2.2%
The overall index ended unchanged because these movements offset each other.
For $BTC and $ETH spot markets, the details matter more than the headline alone.
#usjulyppiflat
⚖️📉 Goods Down, Services Up
July's flat PPI headline hides a sharp split underneath.
📉 Final-demand goods: -0.7%
📈 Final-demand services: +0.2%
📈 Final-demand construction: +2.2%
The overall index ended unchanged because these movements offset each other.
For $BTC and $ETH spot markets, the details matter more than the headline alone.
#usjulyppiflat
July's flat PPI headline hides a sharp split underneath.
📉 Final-demand goods: -0.7%
📈 Final-demand services: +0.2%
📈 Final-demand construction: +2.2%
The overall index ended unchanged because these movements offset each other.
For $BTC and $ETH spot markets, the details matter more than the headline alone.
#usjulyppiflat
33

Verified
Holding $EDEN 0.5 USDT
#USJulyPPIFlat
#USJulyPPIFlat 📉
U.S. July PPI just came in **flat at 0.0% MoM** vs **0.2% expected**.
YoY also cooled to **4.7%** — meaning wholesale inflation is finally backing off. 🧊
That’s a big deal because the market now has a much cleaner reason to price in a **September rate cut**.
After yesterday’s CPI fakeout, this print feels like the kind of data bulls were waiting for. 🚀💚
If momentum follows through, risk assets could rip.
But traders know the rule: **confirm the breakout, don’t chase the noise.**
**What’s your take — real bullish fuel or another trap?**
$LDO
{spot}(LDOUSDT)
$EDEN
$H
{future}(HUSDT)
#RateCut #BinanceSquare #USJulyCPI&PPIDueThisWeek
#USJulyPPIFlat
#USJulyPPIFlat 📉
U.S. July PPI just came in **flat at 0.0% MoM** vs **0.2% expected**.
YoY also cooled to **4.7%** — meaning wholesale inflation is finally backing off. 🧊
That’s a big deal because the market now has a much cleaner reason to price in a **September rate cut**.
After yesterday’s CPI fakeout, this print feels like the kind of data bulls were waiting for. 🚀💚
If momentum follows through, risk assets could rip.
But traders know the rule: **confirm the breakout, don’t chase the noise.**
**What’s your take — real bullish fuel or another trap?**
$LDO
$EDEN
$H
#RateCut #BinanceSquare #USJulyCPI&PPIDueThisWeek
#USJulyPPIFlat 📉
U.S. July PPI just came in **flat at 0.0% MoM** vs **0.2% expected**.
YoY also cooled to **4.7%** — meaning wholesale inflation is finally backing off. 🧊
That’s a big deal because the market now has a much cleaner reason to price in a **September rate cut**.
After yesterday’s CPI fakeout, this print feels like the kind of data bulls were waiting for. 🚀💚
If momentum follows through, risk assets could rip.
But traders know the rule: **confirm the breakout, don’t chase the noise.**
**What’s your take — real bullish fuel or another trap?**
$LDO
$EDEN
$H
#RateCut #BinanceSquare #USJulyCPI&PPIDueThisWeek
261

#USJulyPPIFlat #USJulyPPIFlat 📊
The PPI of the http://US for July came in *flat*, giving the market some breathing room.
*Key points from today’s report*:
- *Monthly*: The producer price index for final demand showed no changes in July: 0.0%. It followed -0.1% in June.
- *Yearly*: It rose 4.7% versus 5.5% in June. It was lower than expected: economists had forecast 0.1% monthly and 4.9% annually.
- *Why*: Energy prices fell 3.1% month-over-month, with gasoline down 5.7%. Food prices also declined 0.9%.
- *Services*: Increased 0.2% month-over-month, driven by portfolio management costs (+6.5%).
- *Core PPI* excluding food and energy: +0.2% month-over-month and 4.2% year-over-year, cooling versus 4.7% in June. c1deb347
*What does it mean for the Fed?*
The weaker-than-expected data reduces the chances of a rate hike in September. With consumer inflation also easing, the report strengthens the case for keeping rates unchanged. c1deaf26b347
Note: the data was collected at the beginning of the month, so the late-July oil price rebound probably
#USJulyPPIFlat #USJulyPPIFlat 📊
The PPI of the http://US for July came in *flat*, giving the market some breathing room.
*Key points from today’s report*:
- *Monthly*: The producer price index for final demand showed no changes in July: 0.0%. It followed -0.1% in June.
- *Yearly*: It rose 4.7% versus 5.5% in June. It was lower than expected: economists had forecast 0.1% monthly and 4.9% annually.
- *Why*: Energy prices fell 3.1% month-over-month, with gasoline down 5.7%. Food prices also declined 0.9%.
- *Services*: Increased 0.2% month-over-month, driven by portfolio management costs (+6.5%).
- *Core PPI* excluding food and energy: +0.2% month-over-month and 4.2% year-over-year, cooling versus 4.7% in June. c1deb347
*What does it mean for the Fed?*
The weaker-than-expected data reduces the chances of a rate hike in September. With consumer inflation also easing, the report strengthens the case for keeping rates unchanged. c1deaf26b347
Note: the data was collected at the beginning of the month, so the late-July oil price rebound probably
The PPI of the http://US for July came in *flat*, giving the market some breathing room.
*Key points from today’s report*:
- *Monthly*: The producer price index for final demand showed no changes in July: 0.0%. It followed -0.1% in June.
- *Yearly*: It rose 4.7% versus 5.5% in June. It was lower than expected: economists had forecast 0.1% monthly and 4.9% annually.
- *Why*: Energy prices fell 3.1% month-over-month, with gasoline down 5.7%. Food prices also declined 0.9%.
- *Services*: Increased 0.2% month-over-month, driven by portfolio management costs (+6.5%).
- *Core PPI* excluding food and energy: +0.2% month-over-month and 4.2% year-over-year, cooling versus 4.7% in June. c1deb347
*What does it mean for the Fed?*
The weaker-than-expected data reduces the chances of a rate hike in September. With consumer inflation also easing, the report strengthens the case for keeping rates unchanged. c1deaf26b347
Note: the data was collected at the beginning of the month, so the late-July oil price rebound probably
133


·
--
Bullish
Verified
#usjulyppiflat
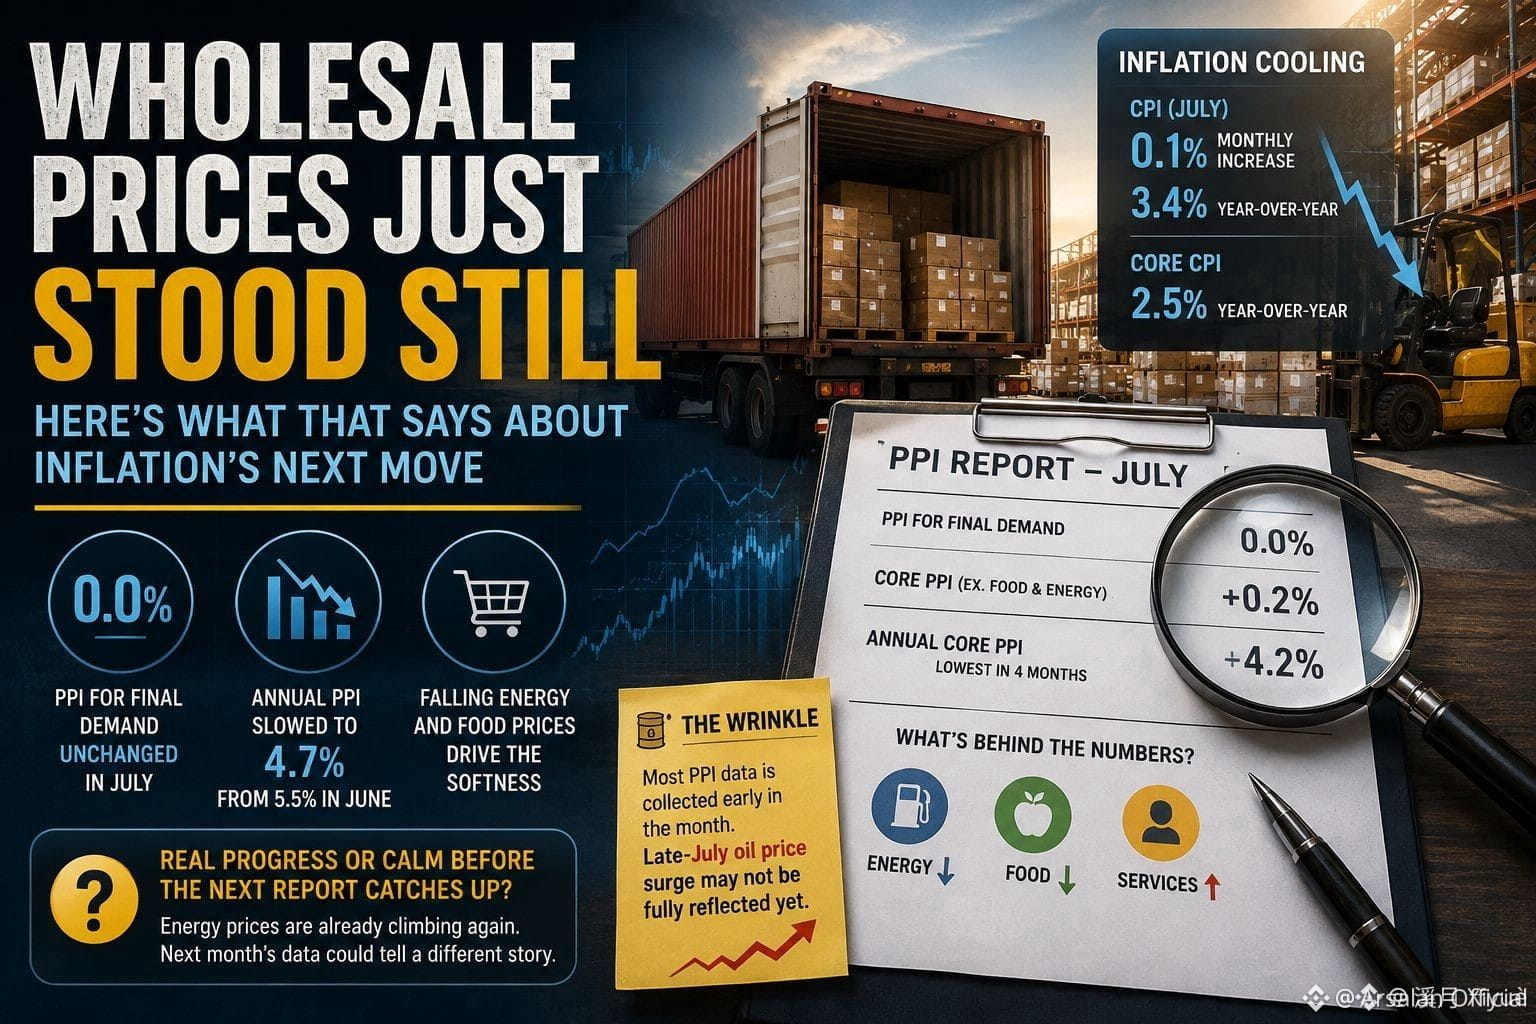
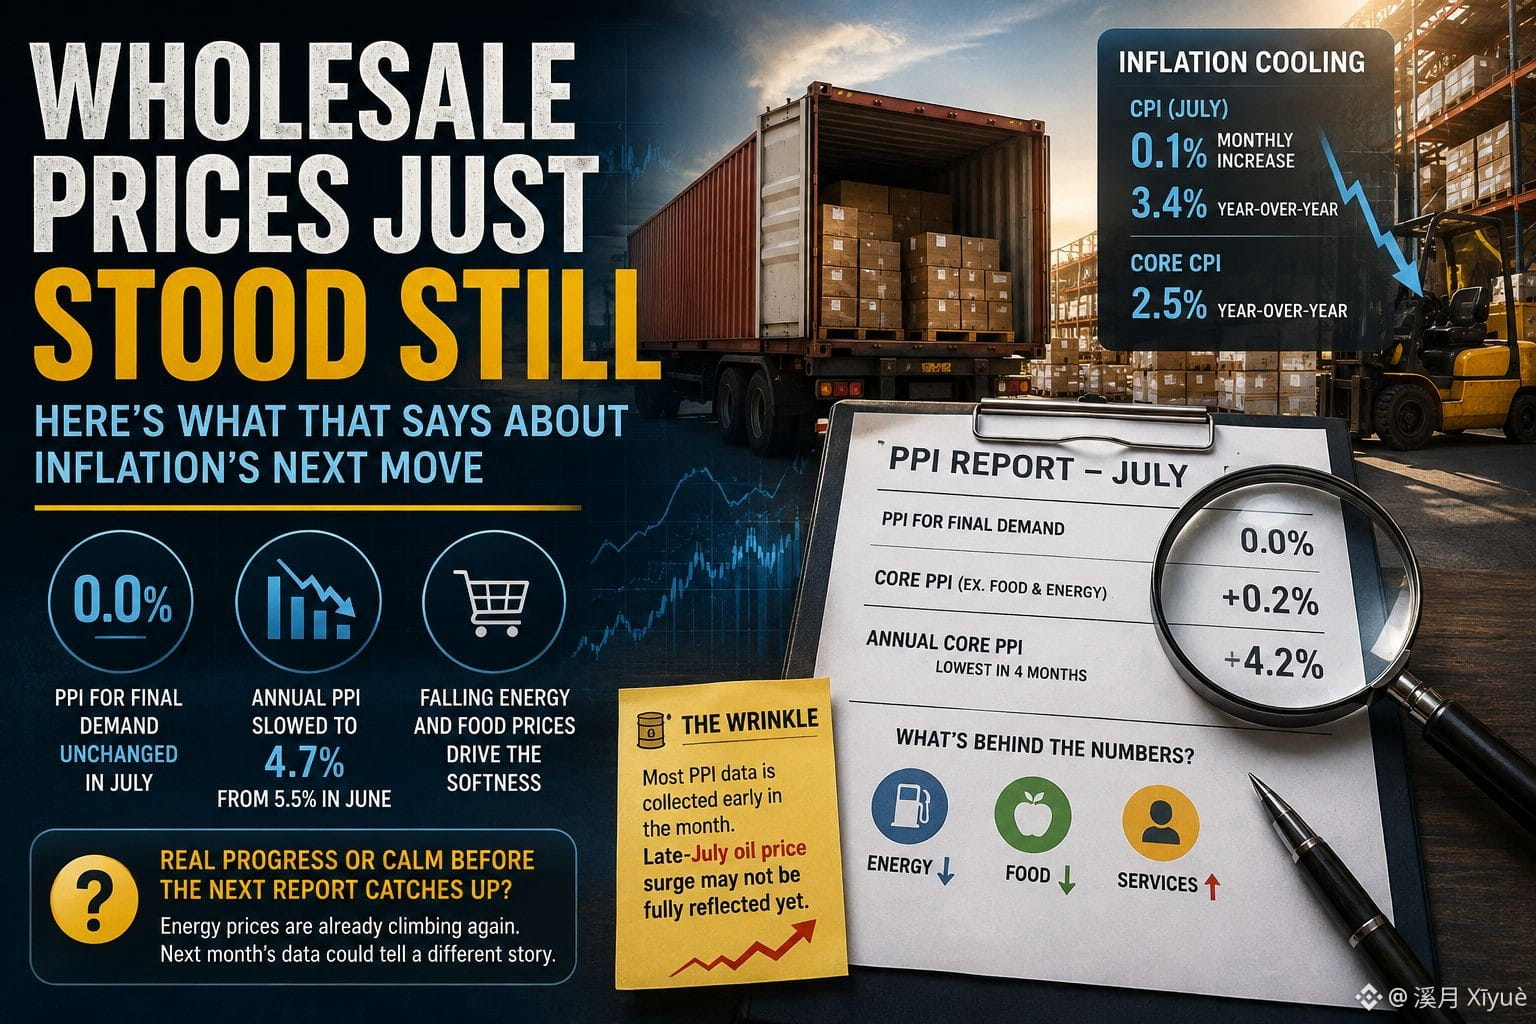
📦 Wholesale Prices Just Stood Still — Here's What That Says About Inflation's Next Move
A day after CPI showed inflation cooling, its producer-side counterpart delivered a similar message — with a few details worth a second look.
The breakdown: The Bureau of Labor Statistics reported Thursday that the Producer Price Index for final demand was unchanged in July, below the 0.2% increase economists had expected, following a 0.1% dip in June. On an annual basis, PPI slowed to 4.7% from 5.5% in June. Core PPI, which strips out food and energy, rose a modest 0.2% for the month against a 0.3% forecast, with the annual core rate easing to 4.2% — its lowest level in four months. The softness was driven mainly by falling energy and food prices, even as the cost of services still edged higher. This follows Wednesday's July CPI report, which showed a similar pattern: headline consumer prices rose just 0.1% for the month, with the annual rate slowing to 3.4% and core CPI easing to 2.5% year-over-year.
Why it matters: Two consecutive days of cooler-than-expected inflation data reinforce the disinflation narrative heading into the Fed's September meeting, giving policymakers more room to weigh their next move. There's a wrinkle worth noting, though: most PPI data is collected early in the month, meaning the late-July jump in oil prices tied to renewed Middle East tensions likely wasn't fully captured in this report — so some of today's relief could look different once next month's data catches up. A narrower measure that also strips out trade services showed a sharper pickup as well, pointing to some underlying service-sector cost pressure that hasn't fully faded even as the headline numbers cool.
Closing thought: With energy prices already climbing again since this data was collected, does today's flat reading mark real progress on inflation — or just a calm month before the next report catches up to it?
$EDEN
$TUT
$AKE
#usjulyppiflat
📦 Wholesale Prices Just Stood Still — Here's What That Says About Inflation's Next Move
A day after CPI showed inflation cooling, its producer-side counterpart delivered a similar message — with a few details worth a second look.
The breakdown: The Bureau of Labor Statistics reported Thursday that the Producer Price Index for final demand was unchanged in July, below the 0.2% increase economists had expected, following a 0.1% dip in June. On an annual basis, PPI slowed to 4.7% from 5.5% in June. Core PPI, which strips out food and energy, rose a modest 0.2% for the month against a 0.3% forecast, with the annual core rate easing to 4.2% — its lowest level in four months. The softness was driven mainly by falling energy and food prices, even as the cost of services still edged higher. This follows Wednesday's July CPI report, which showed a similar pattern: headline consumer prices rose just 0.1% for the month, with the annual rate slowing to 3.4% and core CPI easing to 2.5% year-over-year.
Why it matters: Two consecutive days of cooler-than-expected inflation data reinforce the disinflation narrative heading into the Fed's September meeting, giving policymakers more room to weigh their next move. There's a wrinkle worth noting, though: most PPI data is collected early in the month, meaning the late-July jump in oil prices tied to renewed Middle East tensions likely wasn't fully captured in this report — so some of today's relief could look different once next month's data catches up. A narrower measure that also strips out trade services showed a sharper pickup as well, pointing to some underlying service-sector cost pressure that hasn't fully faded even as the headline numbers cool.
Closing thought: With energy prices already climbing again since this data was collected, does today's flat reading mark real progress on inflation — or just a calm month before the next report catches up to it?
$EDEN
$TUT
$AKE
📦 Wholesale Prices Just Stood Still — Here's What That Says About Inflation's Next Move
A day after CPI showed inflation cooling, its producer-side counterpart delivered a similar message — with a few details worth a second look.
The breakdown: The Bureau of Labor Statistics reported Thursday that the Producer Price Index for final demand was unchanged in July, below the 0.2% increase economists had expected, following a 0.1% dip in June. On an annual basis, PPI slowed to 4.7% from 5.5% in June. Core PPI, which strips out food and energy, rose a modest 0.2% for the month against a 0.3% forecast, with the annual core rate easing to 4.2% — its lowest level in four months. The softness was driven mainly by falling energy and food prices, even as the cost of services still edged higher. This follows Wednesday's July CPI report, which showed a similar pattern: headline consumer prices rose just 0.1% for the month, with the annual rate slowing to 3.4% and core CPI easing to 2.5% year-over-year.
Why it matters: Two consecutive days of cooler-than-expected inflation data reinforce the disinflation narrative heading into the Fed's September meeting, giving policymakers more room to weigh their next move. There's a wrinkle worth noting, though: most PPI data is collected early in the month, meaning the late-July jump in oil prices tied to renewed Middle East tensions likely wasn't fully captured in this report — so some of today's relief could look different once next month's data catches up. A narrower measure that also strips out trade services showed a sharper pickup as well, pointing to some underlying service-sector cost pressure that hasn't fully faded even as the headline numbers cool.
Closing thought: With energy prices already climbing again since this data was collected, does today's flat reading mark real progress on inflation — or just a calm month before the next report catches up to it?
$EDEN
$TUT
$AKE
5
10.2k

·
--
Bullish
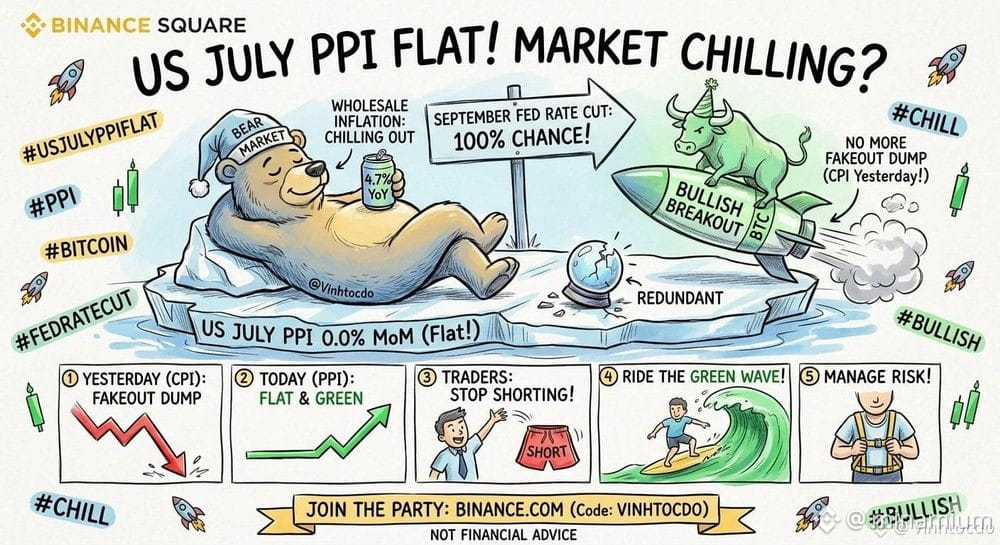
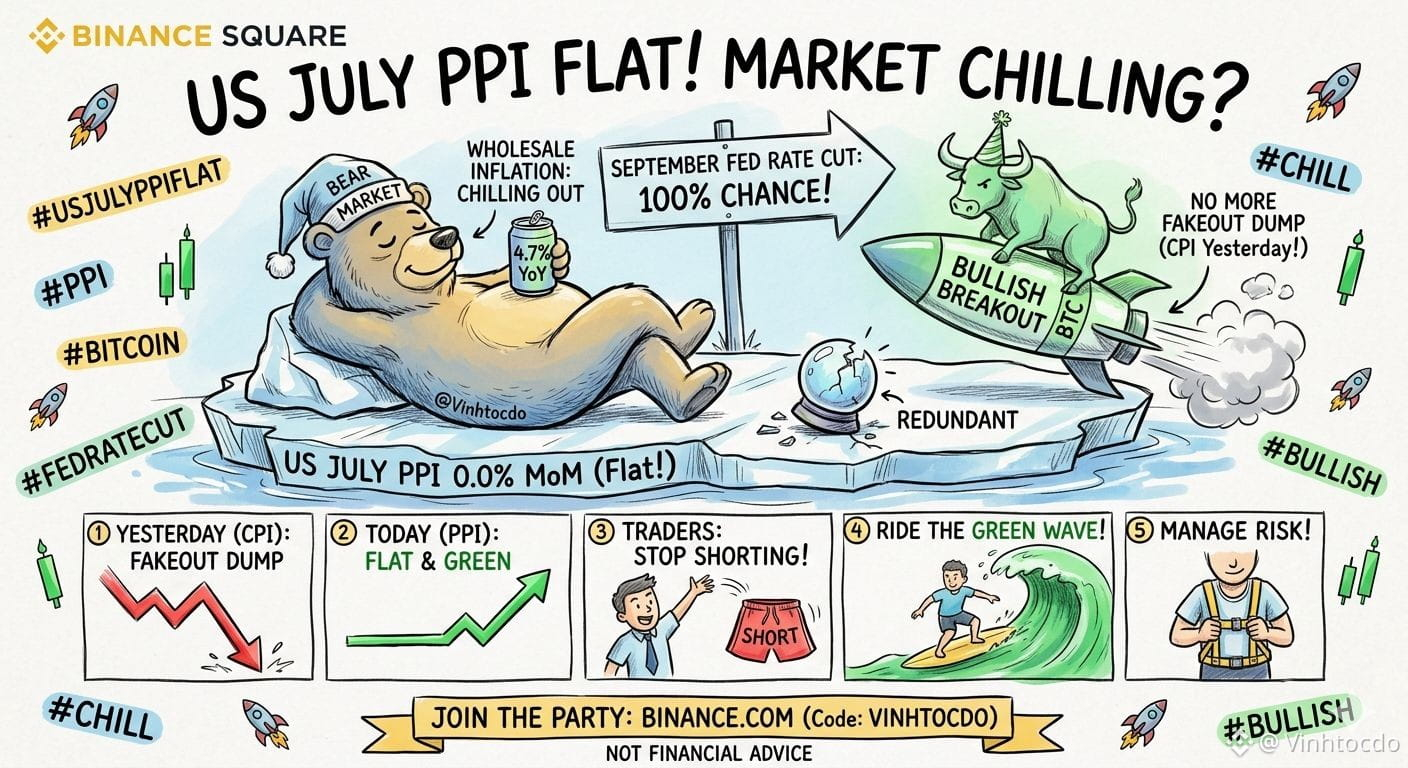
#usjulyppiflat 📉
U.S. July PPI came in flat at 0.0% MoM (vs 0.2% expected) and dropped to 4.7% YoY! Wholesale inflation is literally chilling out. 🧊
Forget the crystal ball—the CME FedWatch tool now shows a whopping 100% chance of a rate cut in September (with a 50+ bps cut odds spiking)! Will the market explode? Unlike yesterday's post-CPI fakeout dump, this flat PPI gives a solid green light for a real bullish breakout! 🚀💚
What should traders do? Don't let yesterday's trauma scare you. Stop shorting, ride the green wave, and manage your risk!
Join the party: [https://www.binance.com/register?ref=VINHTOCDO](https://www.binance.com/register?ref=VINHTOCDO) (Code: VINHTOCDO)
Not financial advice.
#PPI #bitcoin #FedRateCut #VINHTOCDO
$BTC
{future}(BTCUSDT)
$ETH
{future}(ETHUSDT)
$BNB
{future}(BNBUSDT)
#usjulyppiflat 📉
U.S. July PPI came in flat at 0.0% MoM (vs 0.2% expected) and dropped to 4.7% YoY! Wholesale inflation is literally chilling out. 🧊
Forget the crystal ball—the CME FedWatch tool now shows a whopping 100% chance of a rate cut in September (with a 50+ bps cut odds spiking)! Will the market explode? Unlike yesterday's post-CPI fakeout dump, this flat PPI gives a solid green light for a real bullish breakout! 🚀💚
What should traders do? Don't let yesterday's trauma scare you. Stop shorting, ride the green wave, and manage your risk!
Join the party: https://www.binance.com/register?ref=VINHTOCDO (Code: VINHTOCDO)
Not financial advice.
#PPI #bitcoin #FedRateCut #VINHTOCDO
$BTC
$ETH
$BNB
U.S. July PPI came in flat at 0.0% MoM (vs 0.2% expected) and dropped to 4.7% YoY! Wholesale inflation is literally chilling out. 🧊
Forget the crystal ball—the CME FedWatch tool now shows a whopping 100% chance of a rate cut in September (with a 50+ bps cut odds spiking)! Will the market explode? Unlike yesterday's post-CPI fakeout dump, this flat PPI gives a solid green light for a real bullish breakout! 🚀💚
What should traders do? Don't let yesterday's trauma scare you. Stop shorting, ride the green wave, and manage your risk!
Join the party: https://www.binance.com/register?ref=VINHTOCDO (Code: VINHTOCDO)
Not financial advice.
#PPI #bitcoin #FedRateCut #VINHTOCDO
$BTC
$ETH
$BNB
2
1.5k

·
--
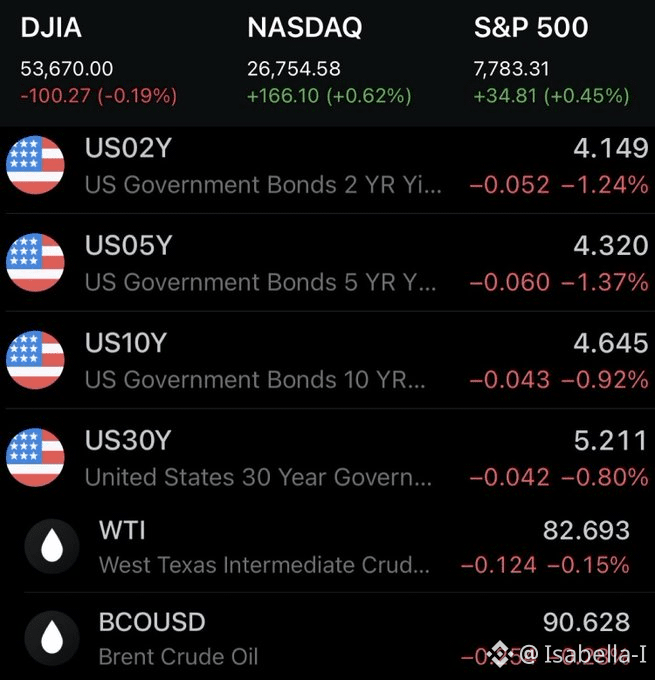
#usjulyppiflat So far it’s looking like another mixed day in the markets, as the cool PPI
report eased concerns of a rate hike in September, while tensions in the Middle East continue to cause volatility in oil and weigh on market sentiment.
PPI
came in cooler than expected with headline inflation at 4.7% YoY (down from 5.5% in June) and 0.0% MoM (the expectation was +0.2%, and was previous revised to –0.1%), and with Core inflation at 4.2% YoY (down from 4.7% in June) and +0.2% MoM (the expectation was +0.3%).
So just like the CPI report, PPI was cooler and added to the signals that the rate of inflation (an important distinction to make) is slowing down.
Whether inflation stays like this or not is up in the air, but with how this year has been so far, I for one have my doubts.
How did you feel about the PPI report and how the market is reacting to the data?$MMT $VANRY $BICO
#usjulyppiflat So far it’s looking like another mixed day in the markets, as the cool PPI
report eased concerns of a rate hike in September, while tensions in the Middle East continue to cause volatility in oil and weigh on market sentiment.
PPI
came in cooler than expected with headline inflation at 4.7% YoY (down from 5.5% in June) and 0.0% MoM (the expectation was +0.2%, and was previous revised to –0.1%), and with Core inflation at 4.2% YoY (down from 4.7% in June) and +0.2% MoM (the expectation was +0.3%).
So just like the CPI report, PPI was cooler and added to the signals that the rate of inflation (an important distinction to make) is slowing down.
Whether inflation stays like this or not is up in the air, but with how this year has been so far, I for one have my doubts.
How did you feel about the PPI report and how the market is reacting to the data?$MMT $VANRY $BICO
report eased concerns of a rate hike in September, while tensions in the Middle East continue to cause volatility in oil and weigh on market sentiment.
PPI
came in cooler than expected with headline inflation at 4.7% YoY (down from 5.5% in June) and 0.0% MoM (the expectation was +0.2%, and was previous revised to –0.1%), and with Core inflation at 4.2% YoY (down from 4.7% in June) and +0.2% MoM (the expectation was +0.3%).
So just like the CPI report, PPI was cooler and added to the signals that the rate of inflation (an important distinction to make) is slowing down.
Whether inflation stays like this or not is up in the air, but with how this year has been so far, I for one have my doubts.
How did you feel about the PPI report and how the market is reacting to the data?$MMT $VANRY $BICO
178

·
--
#USJulyPPIFlat
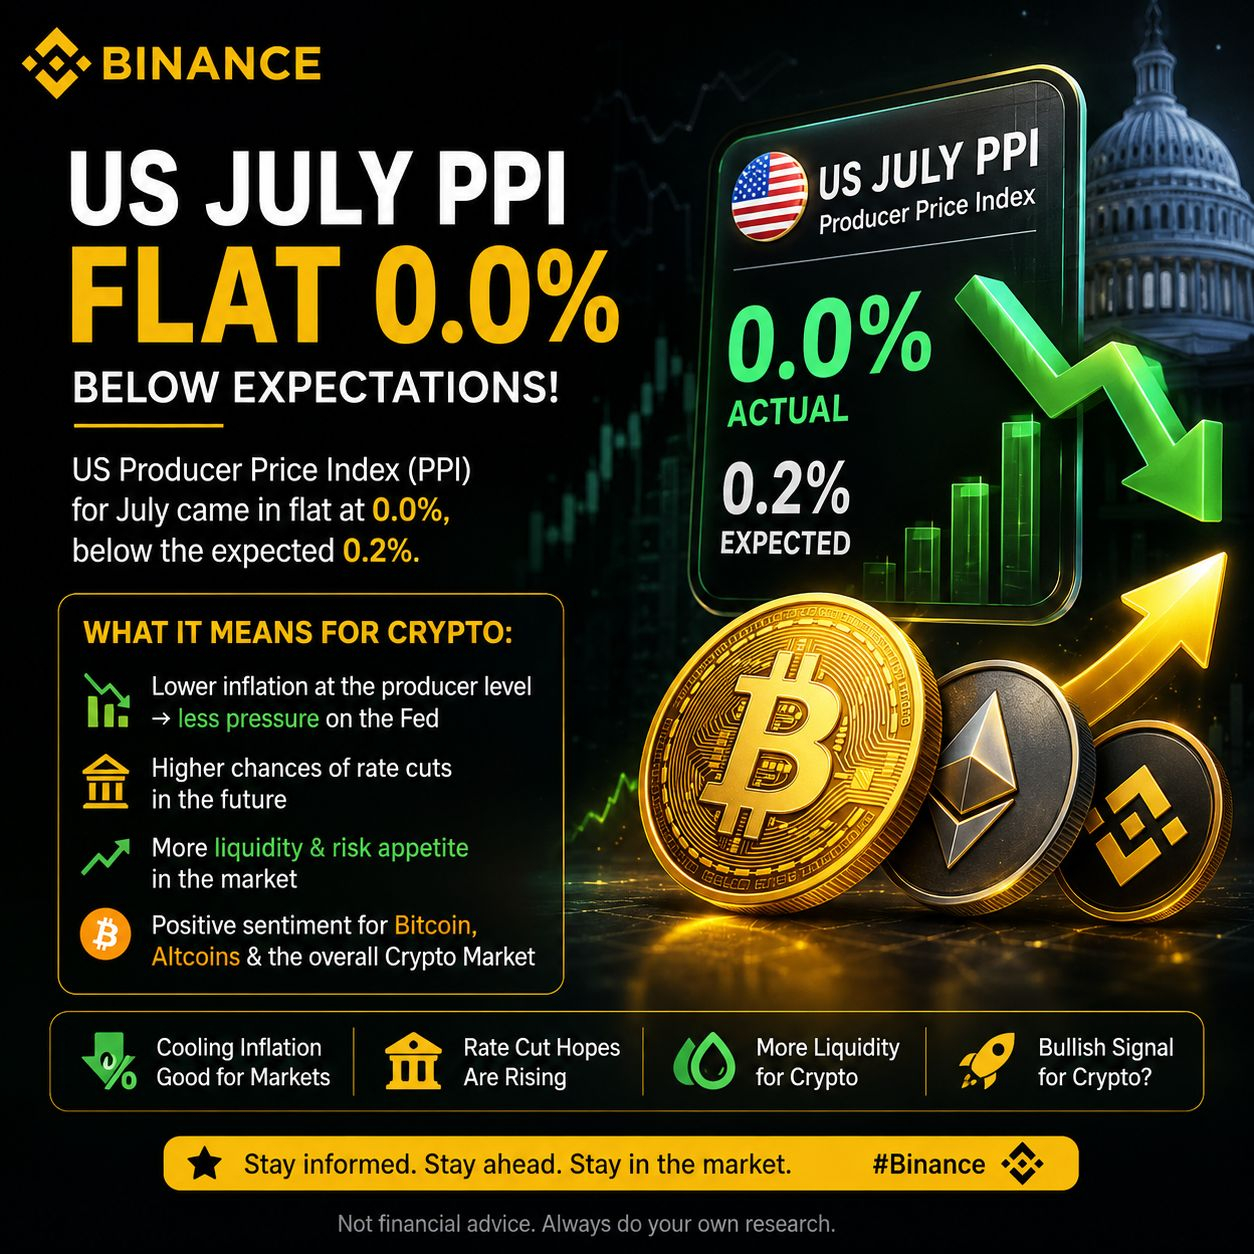
🇺🇸 US July PPI: 0.0% — What It Means for Crypto 📊
US July PPI came in flat at 0.0%, below market expectations. This suggests that producer-level inflation remained under control.
For crypto, this could be a positive signal as softer inflation may reduce pressure on the Federal Reserve to keep interest rates higher for longer. Lower rate expectations can improve liquidity and risk appetite, potentially supporting Bitcoin (BTC), Ethereum (ETH), and other risk assets.
However, traders will now be watching CPI, Fed policy, and upcoming economic data for confirmation. 📈
#USJulyPPIFlat
🇺🇸 US July PPI: 0.0% — What It Means for Crypto 📊
US July PPI came in flat at 0.0%, below market expectations. This suggests that producer-level inflation remained under control.
For crypto, this could be a positive signal as softer inflation may reduce pressure on the Federal Reserve to keep interest rates higher for longer. Lower rate expectations can improve liquidity and risk appetite, potentially supporting Bitcoin (BTC), Ethereum (ETH), and other risk assets.
However, traders will now be watching CPI, Fed policy, and upcoming economic data for confirmation. 📈
🇺🇸 US July PPI: 0.0% — What It Means for Crypto 📊
US July PPI came in flat at 0.0%, below market expectations. This suggests that producer-level inflation remained under control.
For crypto, this could be a positive signal as softer inflation may reduce pressure on the Federal Reserve to keep interest rates higher for longer. Lower rate expectations can improve liquidity and risk appetite, potentially supporting Bitcoin (BTC), Ethereum (ETH), and other risk assets.
However, traders will now be watching CPI, Fed policy, and upcoming economic data for confirmation. 📈
118

#USJulyPPIFlat
🌎 The United States Producer Price Index (PPI) for final demand was unchanged (0.0% MoM) in July 2026, coming in below the 0.2% monthly increase expected by economists. According to the U.S. Bureau of Labor Statistics (BLS), the flat headline reading was primarily driven by a sharp decline in energy costs, which offset moderate increases in services and construction.
On an annual basis, headline wholesale inflation slowed to 4.7% year-over-year, marking its lowest level since March and a notable step down from the 5.5% pace recorded in June.
💫Core PPI: Excluding volatile food and energy components, core producer prices rose 0.2% month-over-month. This also came in slightly below the Dow Jones consensus estimate of 0.3%. Year-over-year, core PPI cooled down to 4.2%.
💫Goods vs. Services: Final demand goods decreased by 0.7%, heavily pulled down by a 3.1% plunge in energy costs (including a 5.7% drop in gasoline and a 6.7% drop in diesel). Conversely, final demand services edged up by 0.2%.
💫Intermediate Demand: Further down the supply chain, processed goods for intermediate demand fell 0.6%, while unprocessed goods tumbled 1.8% due to an 11.9% drop in crude petroleum.
$SOL
{future}(SOLUSDT)
$BTC
{spot}(BTCUSDT)
#USJulyPPIFlat
#USJulyPPIFlat
🌎 The United States Producer Price Index (PPI) for final demand was unchanged (0.0% MoM) in July 2026, coming in below the 0.2% monthly increase expected by economists. According to the U.S. Bureau of Labor Statistics (BLS), the flat headline reading was primarily driven by a sharp decline in energy costs, which offset moderate increases in services and construction.
On an annual basis, headline wholesale inflation slowed to 4.7% year-over-year, marking its lowest level since March and a notable step down from the 5.5% pace recorded in June.
💫Core PPI: Excluding volatile food and energy components, core producer prices rose 0.2% month-over-month. This also came in slightly below the Dow Jones consensus estimate of 0.3%. Year-over-year, core PPI cooled down to 4.2%.
💫Goods vs. Services: Final demand goods decreased by 0.7%, heavily pulled down by a 3.1% plunge in energy costs (including a 5.7% drop in gasoline and a 6.7% drop in diesel). Conversely, final demand services edged up by 0.2%.
💫Intermediate Demand: Further down the supply chain, processed goods for intermediate demand fell 0.6%, while unprocessed goods tumbled 1.8% due to an 11.9% drop in crude petroleum.
$SOL
$BTC
#USJulyPPIFlat
🌎 The United States Producer Price Index (PPI) for final demand was unchanged (0.0% MoM) in July 2026, coming in below the 0.2% monthly increase expected by economists. According to the U.S. Bureau of Labor Statistics (BLS), the flat headline reading was primarily driven by a sharp decline in energy costs, which offset moderate increases in services and construction.
On an annual basis, headline wholesale inflation slowed to 4.7% year-over-year, marking its lowest level since March and a notable step down from the 5.5% pace recorded in June.
💫Core PPI: Excluding volatile food and energy components, core producer prices rose 0.2% month-over-month. This also came in slightly below the Dow Jones consensus estimate of 0.3%. Year-over-year, core PPI cooled down to 4.2%.
💫Goods vs. Services: Final demand goods decreased by 0.7%, heavily pulled down by a 3.1% plunge in energy costs (including a 5.7% drop in gasoline and a 6.7% drop in diesel). Conversely, final demand services edged up by 0.2%.
💫Intermediate Demand: Further down the supply chain, processed goods for intermediate demand fell 0.6%, while unprocessed goods tumbled 1.8% due to an 11.9% drop in crude petroleum.
$SOL
$BTC
#USJulyPPIFlat
91
Verified
🧩🏭 Flat Headline, Moving Components
July PPI looked calm at first glance: 0.0% monthly.
But underneath:
🔹 Services: +0.2%
🔹 Goods: -0.7%
🔹 Construction: +2.2%
🔹 Final demand: +4.7% year-over-year
The data show that a flat headline can still contain significant price movements across industries.
$BTC and $BNB spot investors can watch how future inflation reports develop.
#usjulyppiflat
🧩🏭 Flat Headline, Moving Components
July PPI looked calm at first glance: 0.0% monthly.
But underneath:
🔹 Services: +0.2%
🔹 Goods: -0.7%
🔹 Construction: +2.2%
🔹 Final demand: +4.7% year-over-year
The data show that a flat headline can still contain significant price movements across industries.
$BTC and $BNB spot investors can watch how future inflation reports develop.
#usjulyppiflat
July PPI looked calm at first glance: 0.0% monthly.
But underneath:
🔹 Services: +0.2%
🔹 Goods: -0.7%
🔹 Construction: +2.2%
🔹 Final demand: +4.7% year-over-year
The data show that a flat headline can still contain significant price movements across industries.
$BTC and $BNB spot investors can watch how future inflation reports develop.
#usjulyppiflat
949
·
--
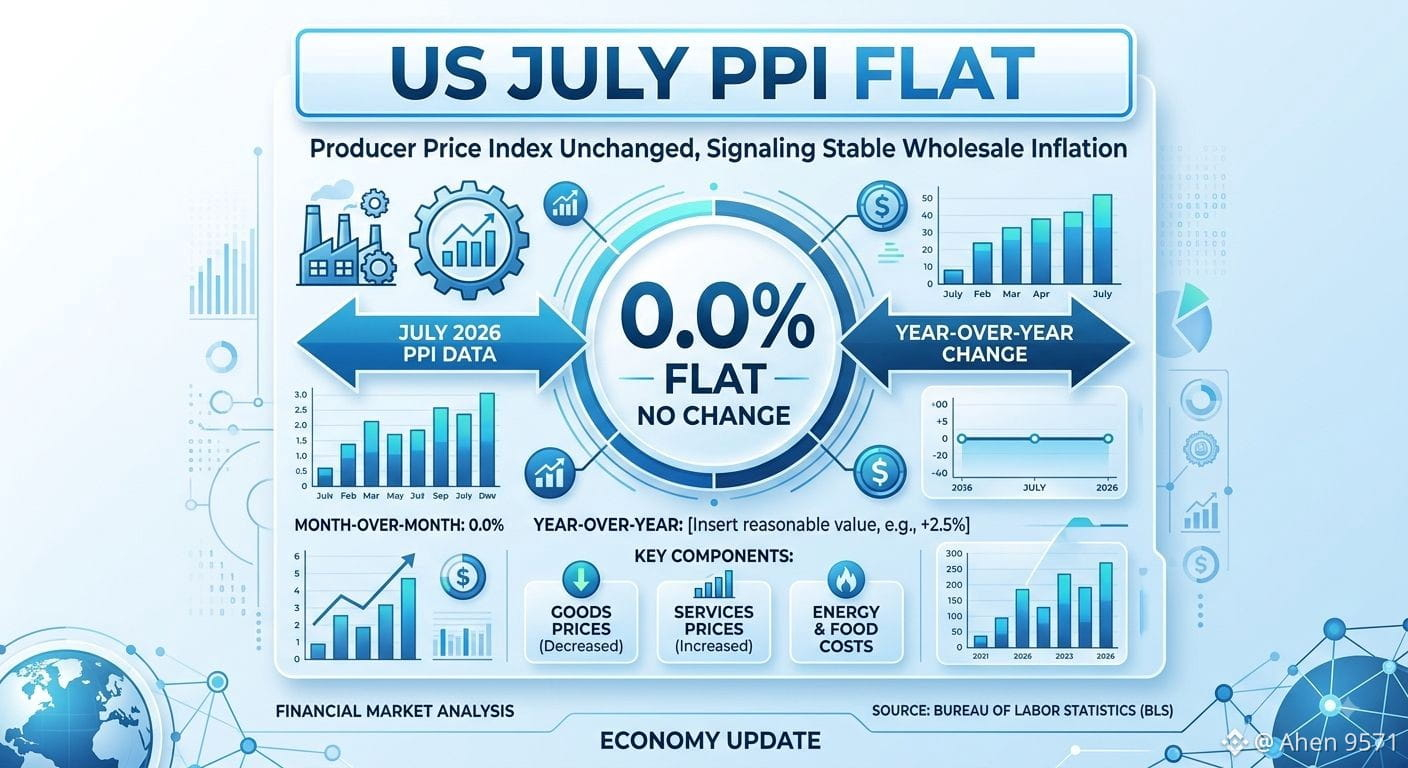
#usjulyppiflat US PPI came in flat (0.0%) for July
vs 0.2% expected.
Annual producer inflation drops sharply to 4.7% (down from 5.5% in June).
Coming right after softer CPI data, wholesale inflation pressures are clearly easing.$RARE $CRV $TUT
#usjulyppiflat US PPI came in flat (0.0%) for July
vs 0.2% expected.
Annual producer inflation drops sharply to 4.7% (down from 5.5% in June).
Coming right after softer CPI data, wholesale inflation pressures are clearly easing.$RARE $CRV $TUT
vs 0.2% expected.
Annual producer inflation drops sharply to 4.7% (down from 5.5% in June).
Coming right after softer CPI data, wholesale inflation pressures are clearly easing.$RARE $CRV $TUT
251
⛽📉 Energy Helped Push PPI Lower
Final-demand energy prices dropped 3.1% in July, while gasoline prices fell 5.7%.
That decline helped pull the goods component lower even as some other producer-price categories increased.
Meanwhile, overall final-demand PPI remained flat for the month and was still 4.7% higher year-over-year.
$BTC and $BNB investors now have another important macro data point to assess.
#usjulyppiflat
⛽📉 Energy Helped Push PPI Lower
Final-demand energy prices dropped 3.1% in July, while gasoline prices fell 5.7%.
That decline helped pull the goods component lower even as some other producer-price categories increased.
Meanwhile, overall final-demand PPI remained flat for the month and was still 4.7% higher year-over-year.
$BTC and $BNB investors now have another important macro data point to assess.
#usjulyppiflat
Final-demand energy prices dropped 3.1% in July, while gasoline prices fell 5.7%.
That decline helped pull the goods component lower even as some other producer-price categories increased.
Meanwhile, overall final-demand PPI remained flat for the month and was still 4.7% higher year-over-year.
$BTC and $BNB investors now have another important macro data point to assess.
#usjulyppiflat
20
Log in to explore more content
Join global crypto users on Binance Square
⚡️ Get latest and useful information about crypto.
💬 Trusted by the world’s largest crypto exchange.
👍 Discover real insights from verified creators.
Email / Phone number
Trending Topics
1
#AIStocksWhatNext
461,268 views
3,420 Discussing
2
#BitcoinTops$87KAtEightMonthHigh
202 views
14 Discussing
3
#ZECBreaksAbove$1600AtRecordHigh
0 views
0 Discussing
4
#BitwiseNEARStakingETPAssetsTop$100M
6,622 views
44 Discussing
5
#BitcoinBreaksAboveMayHighNears$86K
21,458 views
225 Discussing
6
#DogecoinRises15%
67,725 views
1,185 Discussing
7
#$14BBitcoinOptionsExpireFriday
6,029 views
103 Discussing
8
#BNBMarketCapPassesBNYMellon
41,934 views
869 Discussing
9
#CryptoMarketCapReclaims$3Trillion
8,545 views
87 Discussing
10
#MuseOvertakesChatGPTAsTopFreeIOSApp
24,102 views
632 Discussing