
#us30
us30
15,529 views
70 Discussing
Hot
Latest

·
--
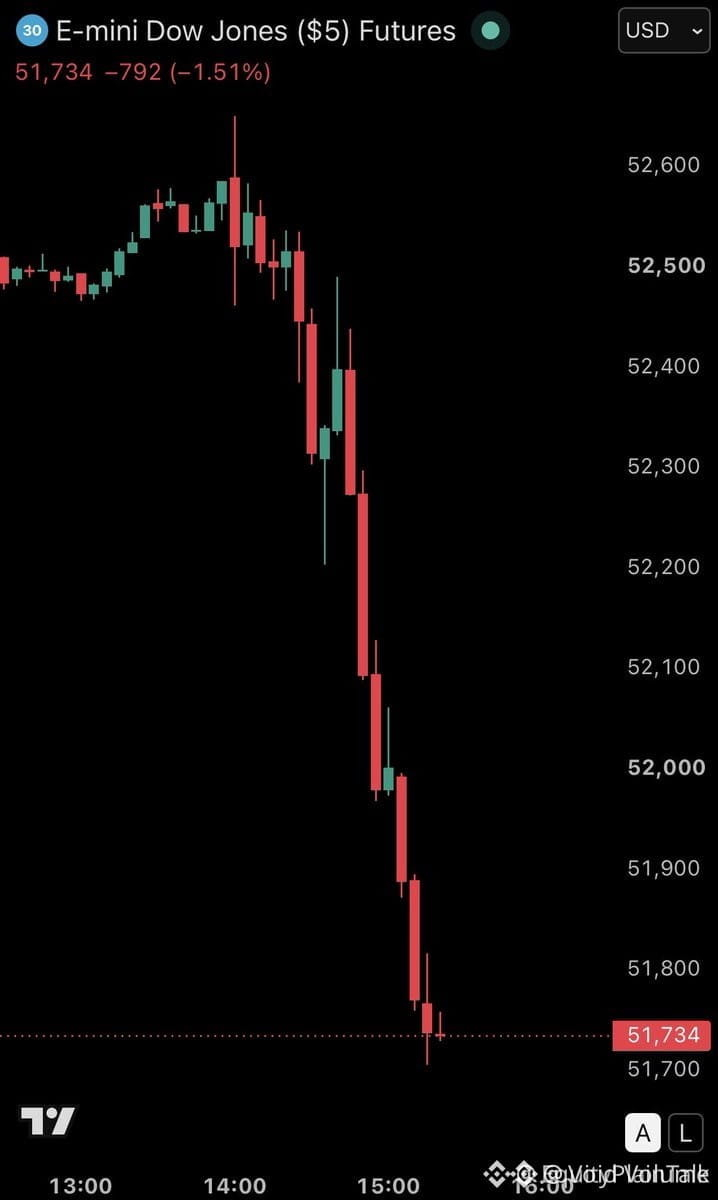
🚨 FED SHOCKS MARKETS AS $US30 SLIPS 800 POINTS ON HAWKISH RE-PRICING! 📉
Institutional re-pricing just triggered an 800-point selloff on $US30 as the Fed squashed premature rate-cut expectations. Smart money is aggressively hunting liquidity, reminding retail that inflation suppression remains the central bank’s sole priority over portfolio valuations. 📊
Rate-sensitive sectors like tech and growth are absorbing the brunt of this structural distribution, while defensive capital shifts toward stable value blocks. 🔍 The era of easy monetary expansion has paused, forcing a hard reset on risk management across all asset classes. 💡
💬 How are you positioning your portfolio as macro liquidity tightens across high-beta assets? 👇
⚠️ Not financial advice. Always manage your risk. 🛡️
🏷️ #US30 #Macro #Fed #MarketStructure #Crypto
🎯 🦈
🚨 FED SHOCKS MARKETS AS $US30 SLIPS 800 POINTS ON HAWKISH RE-PRICING! 📉
Institutional re-pricing just triggered an 800-point selloff on $US30 as the Fed squashed premature rate-cut expectations. Smart money is aggressively hunting liquidity, reminding retail that inflation suppression remains the central bank’s sole priority over portfolio valuations. 📊
Rate-sensitive sectors like tech and growth are absorbing the brunt of this structural distribution, while defensive capital shifts toward stable value blocks. 🔍 The era of easy monetary expansion has paused, forcing a hard reset on risk management across all asset classes. 💡
💬 How are you positioning your portfolio as macro liquidity tightens across high-beta assets? 👇
⚠️ Not financial advice. Always manage your risk. 🛡️
🏷️ #US30 #Macro #Fed #MarketStructure #Crypto
🎯 🦈
Institutional re-pricing just triggered an 800-point selloff on $US30 as the Fed squashed premature rate-cut expectations. Smart money is aggressively hunting liquidity, reminding retail that inflation suppression remains the central bank’s sole priority over portfolio valuations. 📊
Rate-sensitive sectors like tech and growth are absorbing the brunt of this structural distribution, while defensive capital shifts toward stable value blocks. 🔍 The era of easy monetary expansion has paused, forcing a hard reset on risk management across all asset classes. 💡
💬 How are you positioning your portfolio as macro liquidity tightens across high-beta assets? 👇
⚠️ Not financial advice. Always manage your risk. 🛡️
🏷️ #US30 #Macro #Fed #MarketStructure #Crypto
🎯 🦈
3

·
--
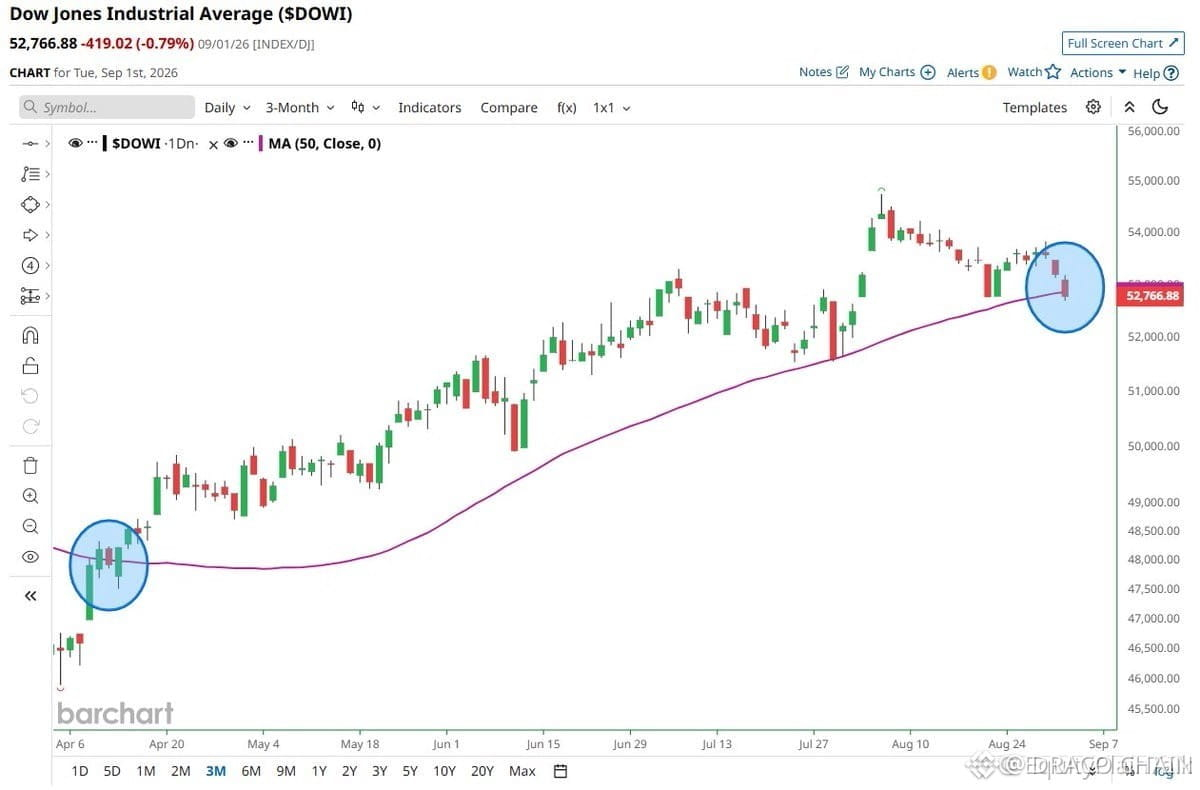
🚨 $US30 LOSES 7-MONTH CRITICAL SUPPORT AS INSTITUTIONAL MOMENTUM SHIFTS BEARISH! 📉
$US30 just surrendered its 50-day moving average for the first time since April, breaking a seven-month streak of continuous buyer control. 📊 This structural breakdown shifts short-term order flow into uncertain territory as macro headwinds replace prior momentum.
Unlike April's quick recovery, current price action faces higher interest rate expectations and clear rotation fatigue. 🔍 If smart money fails to reclaim this key dynamic pivot quickly, expect the previous support level to flip into overhead supply, leading to deeper corrective liquidity hunting.
💬 Will institutional buyers step in to force a reclaim, or are we staring at a prolonged structural distribution phase? 👇
⚠️ Not financial advice. Always manage your risk. 🛡️
🏷️ #US30 #Macro #MarketStructure #Stocks #Crypto
📊 🔍
🚨 $US30 LOSES 7-MONTH CRITICAL SUPPORT AS INSTITUTIONAL MOMENTUM SHIFTS BEARISH! 📉
$US30 just surrendered its 50-day moving average for the first time since April, breaking a seven-month streak of continuous buyer control. 📊 This structural breakdown shifts short-term order flow into uncertain territory as macro headwinds replace prior momentum.
Unlike April's quick recovery, current price action faces higher interest rate expectations and clear rotation fatigue. 🔍 If smart money fails to reclaim this key dynamic pivot quickly, expect the previous support level to flip into overhead supply, leading to deeper corrective liquidity hunting.
💬 Will institutional buyers step in to force a reclaim, or are we staring at a prolonged structural distribution phase? 👇
⚠️ Not financial advice. Always manage your risk. 🛡️
🏷️ #US30 #Macro #MarketStructure #Stocks #Crypto
📊 🔍
$US30 just surrendered its 50-day moving average for the first time since April, breaking a seven-month streak of continuous buyer control. 📊 This structural breakdown shifts short-term order flow into uncertain territory as macro headwinds replace prior momentum.
Unlike April's quick recovery, current price action faces higher interest rate expectations and clear rotation fatigue. 🔍 If smart money fails to reclaim this key dynamic pivot quickly, expect the previous support level to flip into overhead supply, leading to deeper corrective liquidity hunting.
💬 Will institutional buyers step in to force a reclaim, or are we staring at a prolonged structural distribution phase? 👇
⚠️ Not financial advice. Always manage your risk. 🛡️
🏷️ #US30 #Macro #MarketStructure #Stocks #Crypto
📊 🔍
1

·
--
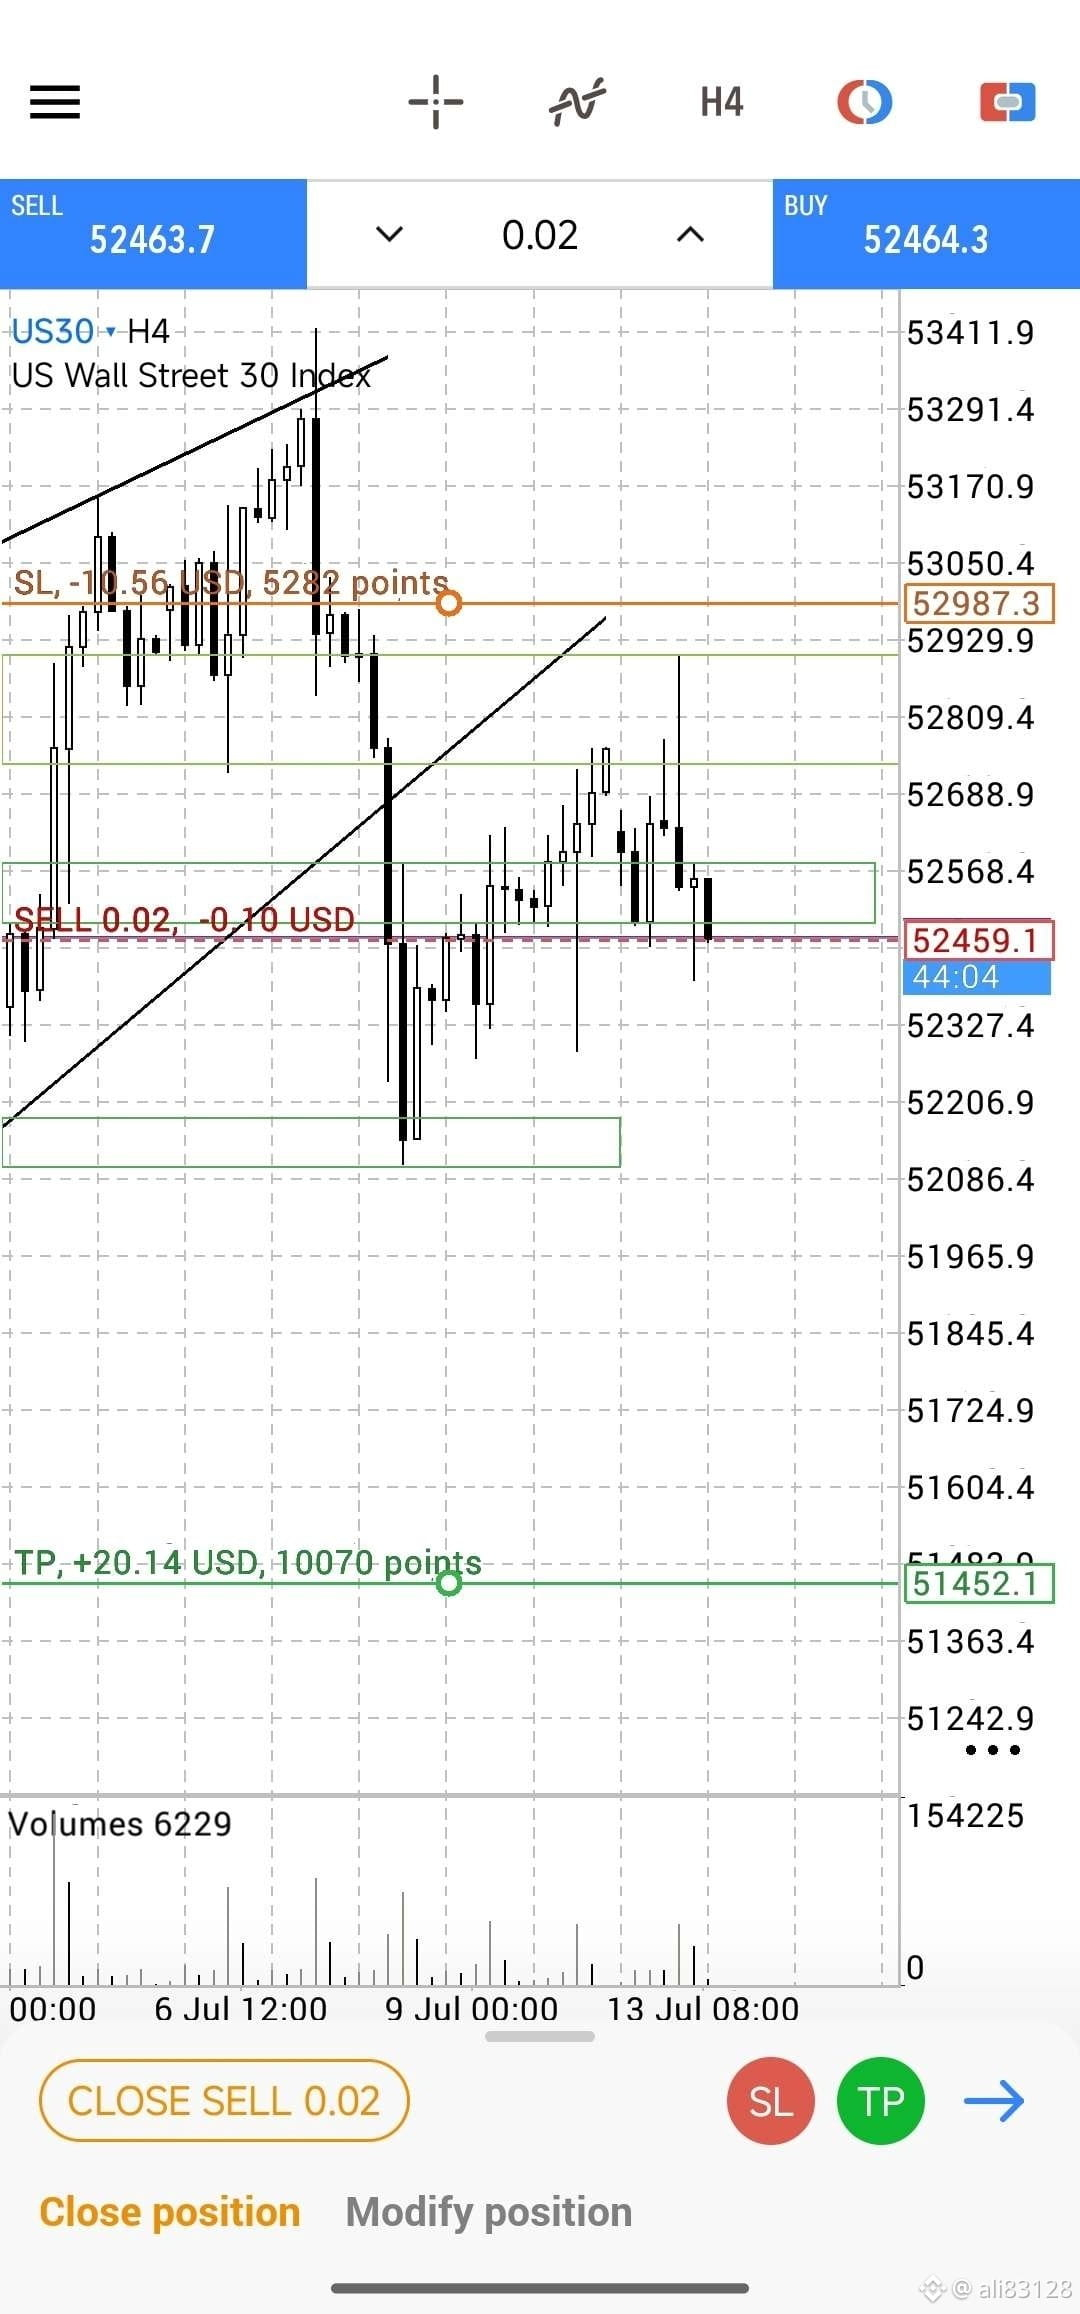
🔥 US30 SELL Signal
📍 Entry: 52463.7
🎯 TP: 51452.1
🛑 SL: 52987.3
📊 Chart: The chart shows a bearish bias with a sell position set between resistance at 52987.3 and support at 51452.1, following a recent price rejection.
US30 SELL ka time hai — miss mat karo!
⚠️ Always use proper risk management. This is not financial advice.
🔔 Follow karo — agla signal miss mat karo!
🎯 Kya tum ye trade le sakte the? Comment karo!
#US30 #Forex #Profit #FreeSignals
🔥 US30 SELL Signal
📍 Entry: 52463.7
🎯 TP: 51452.1
🛑 SL: 52987.3
📊 Chart: The chart shows a bearish bias with a sell position set between resistance at 52987.3 and support at 51452.1, following a recent price rejection.
US30 SELL ka time hai — miss mat karo!
⚠️ Always use proper risk management. This is not financial advice.
🔔 Follow karo — agla signal miss mat karo!
🎯 Kya tum ye trade le sakte the? Comment karo!
#US30 #Forex #Profit #FreeSignals
📍 Entry: 52463.7
🎯 TP: 51452.1
🛑 SL: 52987.3
📊 Chart: The chart shows a bearish bias with a sell position set between resistance at 52987.3 and support at 51452.1, following a recent price rejection.
US30 SELL ka time hai — miss mat karo!
⚠️ Always use proper risk management. This is not financial advice.
🔔 Follow karo — agla signal miss mat karo!
🎯 Kya tum ye trade le sakte the? Comment karo!
#US30 #Forex #Profit #FreeSignals
62
·
--
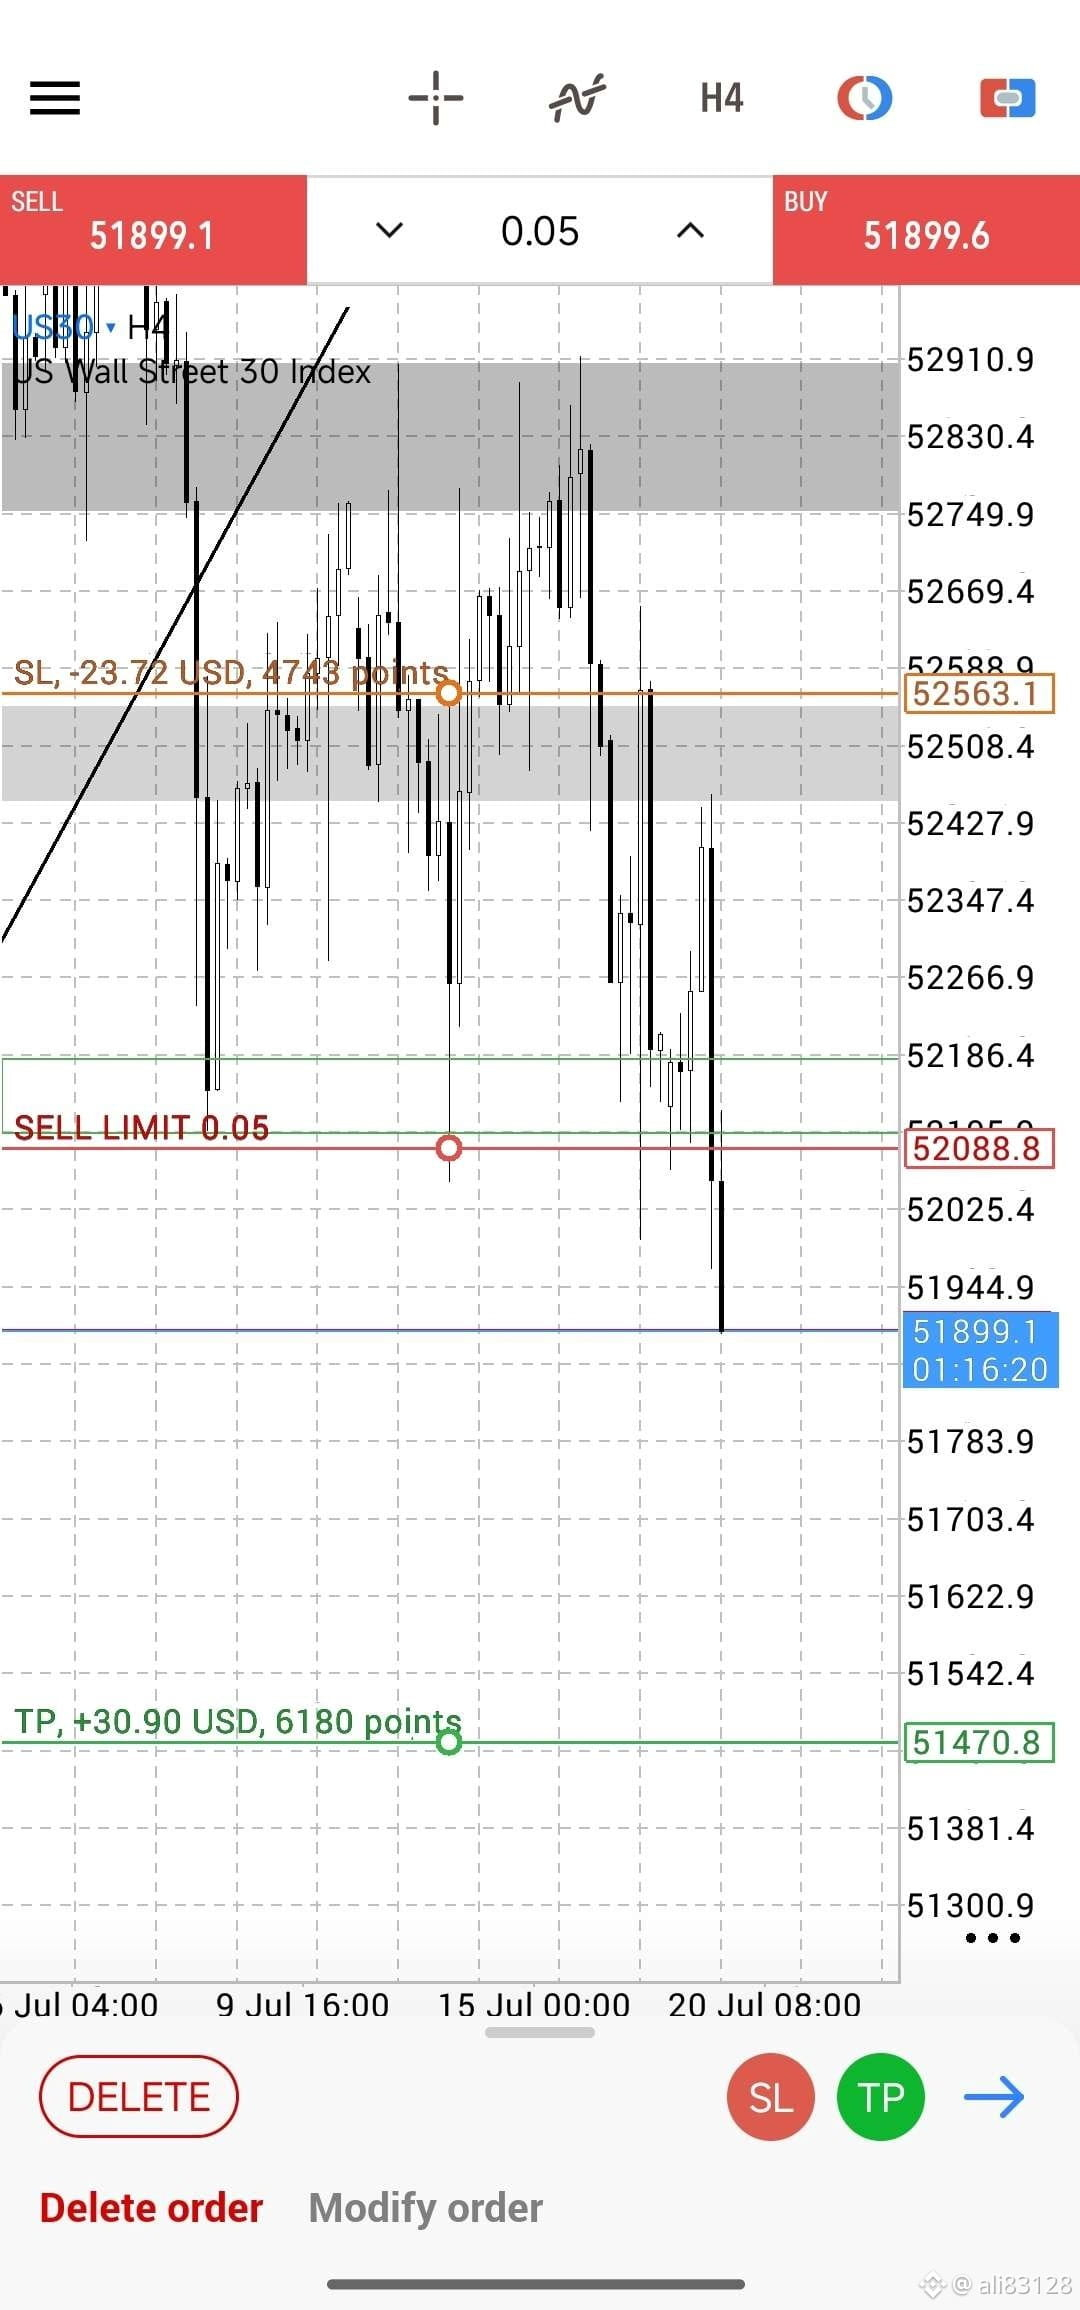
🔥 US30 SELL Signal
📍 Entry: 52088.8
🎯 TP1: 51614.5
🎯 TP2: 51140.2
🛑 SL: 52563.1
📊 Chart: The chart shows a bearish bias with a sell limit at 52088.8, a stop loss at 52563.1, and a target at 51470.8.
Kamaal ka setup! US30 SELL signal live hai!
⚠️ Always use proper risk management. This is not financial advice.
Kal ka signal miss kia? Aaj ka mat karna — Follow abhi!
#US30 #Forex #FreeSignals #Trading
🔥 US30 SELL Signal
📍 Entry: 52088.8
🎯 TP1: 51614.5
🎯 TP2: 51140.2
🛑 SL: 52563.1
📊 Chart: The chart shows a bearish bias with a sell limit at 52088.8, a stop loss at 52563.1, and a target at 51470.8.
Kamaal ka setup! US30 SELL signal live hai!
⚠️ Always use proper risk management. This is not financial advice.
Kal ka signal miss kia? Aaj ka mat karna — Follow abhi!
#US30 #Forex #FreeSignals #Trading
📍 Entry: 52088.8
🎯 TP1: 51614.5
🎯 TP2: 51140.2
🛑 SL: 52563.1
📊 Chart: The chart shows a bearish bias with a sell limit at 52088.8, a stop loss at 52563.1, and a target at 51470.8.
Kamaal ka setup! US30 SELL signal live hai!
⚠️ Always use proper risk management. This is not financial advice.
Kal ka signal miss kia? Aaj ka mat karna — Follow abhi!
#US30 #Forex #FreeSignals #Trading
103

#US30
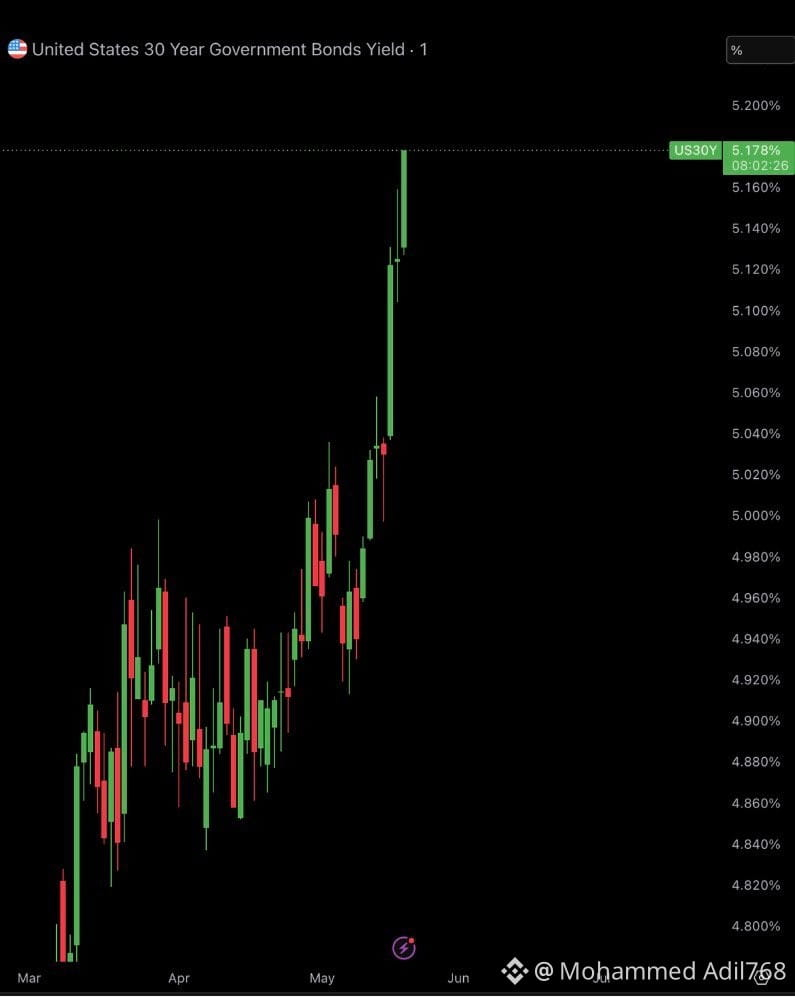
US 30-Year Bond Yield Surges to 5.178%, Hits Highest Level Since March*
_US30Y 1-Hour Chart Analysis_
The US 30-year government bond yield is spiking, hitting *5.178%* at 08:02 UTC after a sharp move higher over the past two weeks.
What the Chart Shows
- *Steep Uptrend*: Yields have climbed steadily from 4.80% in mid-March to 5.178% now, with momentum accelerating in May. The last few candles show large green bars, indicating aggressive selling in bonds.
- *Key Levels*:
- *Current Yield*: 5.178%
- *Recent Support*: 5.040% and 5.000% – these levels acted as resistance before the breakout.
- *Next Resistance*: 5.20% is the immediate psychological level to watch.
- *Structure*: The chart shows no major pullbacks since April. Every dip has been bought by sellers pushing yields higher.
What It Means
Rising yields signal falling bond prices and reflect expectations of higher rates for longer, inflation concerns, or increased fiscal risk. A move above 5.20% would take yields to levels not seen since late 2023 and put more pressure on equities and rate-sensitive assets.
If yields pull back, 5.12% and 5.04% are the first support zones where buyers could step in.
Bottom Line
The 30-year yield is in a strong uptrend with no clear signs of slowing. Watch 5.20% as the next test. A break above opens the door for a move toward 5.30%+.
#US30
US 30-Year Bond Yield Surges to 5.178%, Hits Highest Level Since March*
_US30Y 1-Hour Chart Analysis_
The US 30-year government bond yield is spiking, hitting *5.178%* at 08:02 UTC after a sharp move higher over the past two weeks.
What the Chart Shows
- *Steep Uptrend*: Yields have climbed steadily from 4.80% in mid-March to 5.178% now, with momentum accelerating in May. The last few candles show large green bars, indicating aggressive selling in bonds.
- *Key Levels*:
- *Current Yield*: 5.178%
- *Recent Support*: 5.040% and 5.000% – these levels acted as resistance before the breakout.
- *Next Resistance*: 5.20% is the immediate psychological level to watch.
- *Structure*: The chart shows no major pullbacks since April. Every dip has been bought by sellers pushing yields higher.
What It Means
Rising yields signal falling bond prices and reflect expectations of higher rates for longer, inflation concerns, or increased fiscal risk. A move above 5.20% would take yields to levels not seen since late 2023 and put more pressure on equities and rate-sensitive assets.
If yields pull back, 5.12% and 5.04% are the first support zones where buyers could step in.
Bottom Line
The 30-year yield is in a strong uptrend with no clear signs of slowing. Watch 5.20% as the next test. A break above opens the door for a move toward 5.30%+.
US 30-Year Bond Yield Surges to 5.178%, Hits Highest Level Since March*
_US30Y 1-Hour Chart Analysis_
The US 30-year government bond yield is spiking, hitting *5.178%* at 08:02 UTC after a sharp move higher over the past two weeks.
What the Chart Shows
- *Steep Uptrend*: Yields have climbed steadily from 4.80% in mid-March to 5.178% now, with momentum accelerating in May. The last few candles show large green bars, indicating aggressive selling in bonds.
- *Key Levels*:
- *Current Yield*: 5.178%
- *Recent Support*: 5.040% and 5.000% – these levels acted as resistance before the breakout.
- *Next Resistance*: 5.20% is the immediate psychological level to watch.
- *Structure*: The chart shows no major pullbacks since April. Every dip has been bought by sellers pushing yields higher.
What It Means
Rising yields signal falling bond prices and reflect expectations of higher rates for longer, inflation concerns, or increased fiscal risk. A move above 5.20% would take yields to levels not seen since late 2023 and put more pressure on equities and rate-sensitive assets.
If yields pull back, 5.12% and 5.04% are the first support zones where buyers could step in.
Bottom Line
The 30-year yield is in a strong uptrend with no clear signs of slowing. Watch 5.20% as the next test. A break above opens the door for a move toward 5.30%+.
24

·
--
Verified
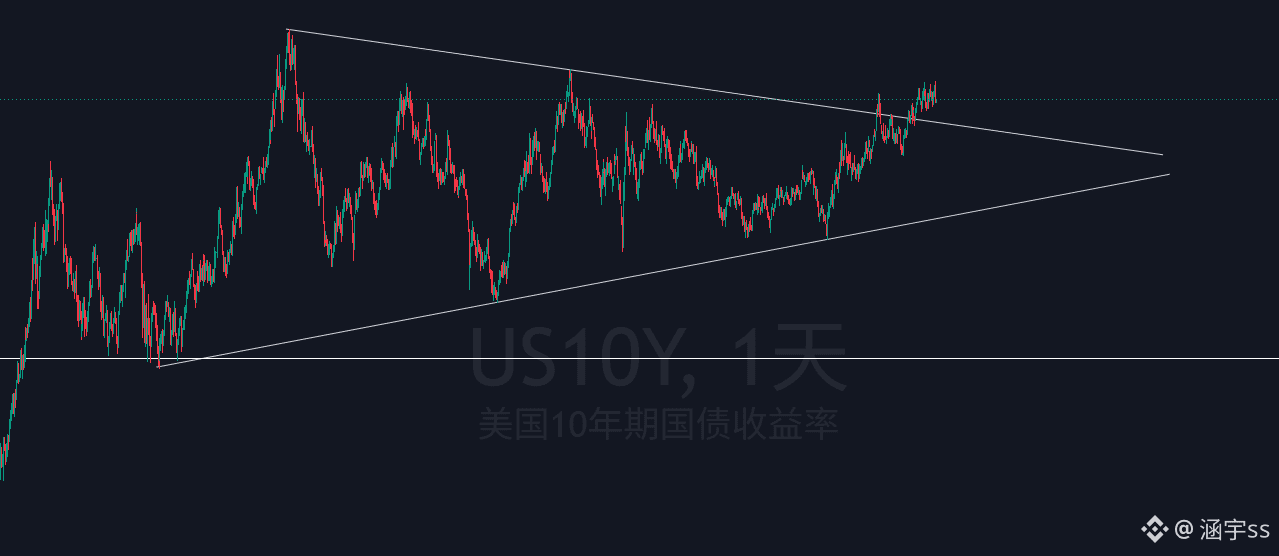
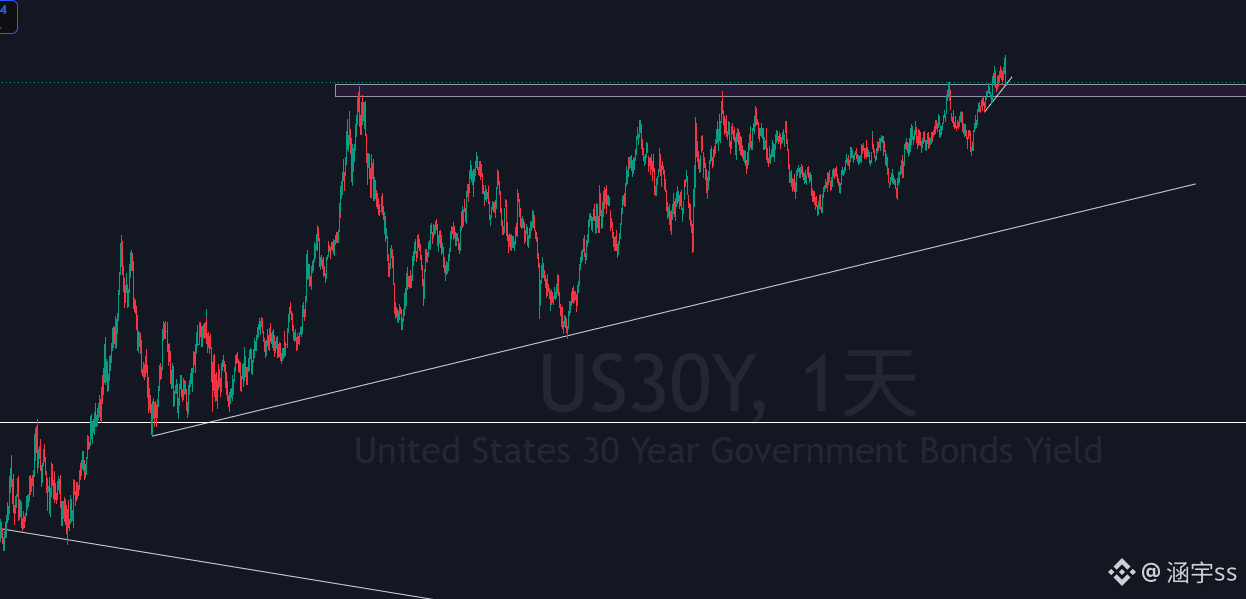
Yesterday, quite a lot of people on social media were saying that the reason for the big rise of $BTC was a pullback in the bond market.
So let’s take a look at the chart—has there really been a clear pullback in the bond market?
#US30 $ETH
{future}(BTCUSDT)
Yesterday, quite a lot of people on social media were saying that the reason for the big rise of $BTC was a pullback in the bond market.
So let’s take a look at the chart—has there really been a clear pullback in the bond market?
#US30 $ETH
So let’s take a look at the chart—has there really been a clear pullback in the bond market?
#US30 $ETH
1
1
731
#US30
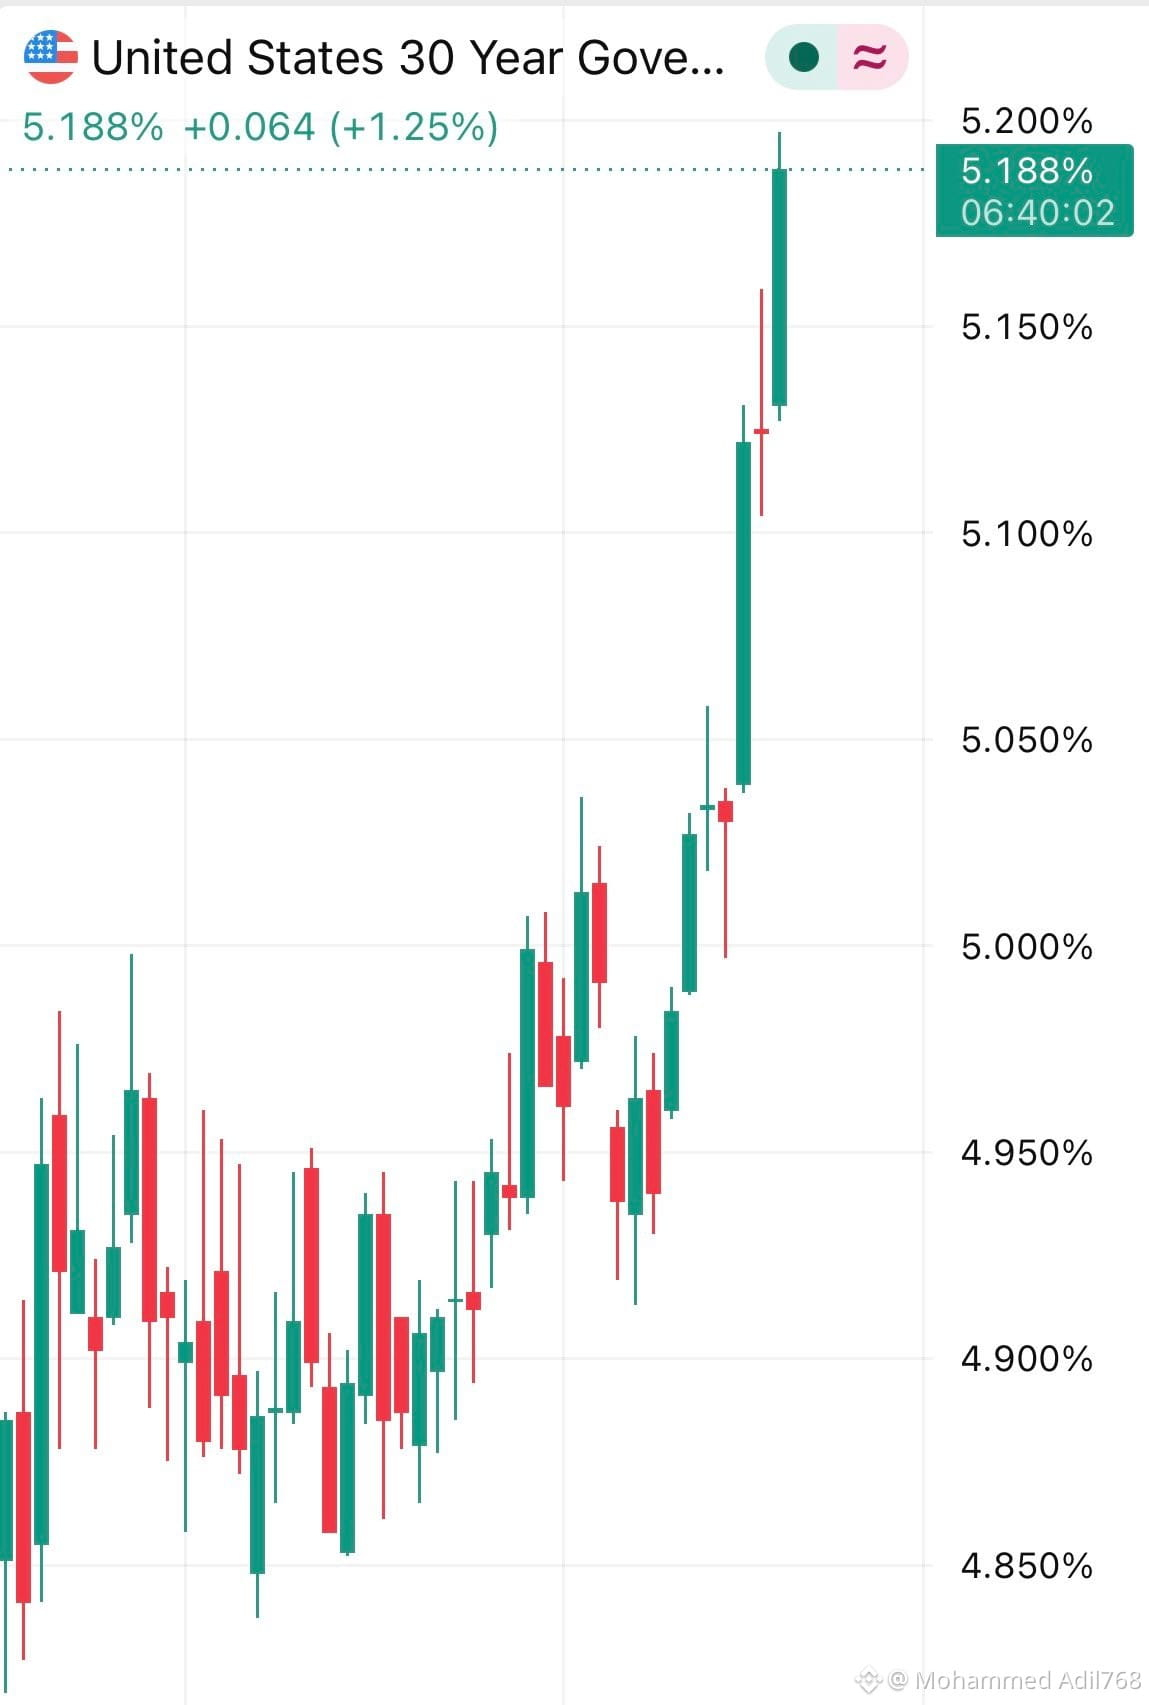
*US 30-Year Yield Spikes to 5.188%, Highest in Recent Months*
_Long-Term Bond Yields Surge as Selloff Accelerates_
The US 30-year government bond yield has jumped to *5.188%*, up 0.064 percentage points or *1.25%* on the day, marking a sharp move higher in long-term rates.
What the Chart Shows
- *Breakout Higher*: After consolidating between 4.85% and 4.95% for several sessions, yields broke out with a series of strong green candles, pushing straight through 5.00% and 5.15% resistance.
- *Momentum*: The move looks aggressive, with minimal pullbacks. Each red candle is quickly followed by a larger green candle, showing buyers of yield and sellers of bonds are in control.
- *Current Level*: 5.188% as of 06:40 UTC, near the session high of 5.200%.
Why It Matters
A rise in 30-year yields means bond prices are falling and long-term borrowing costs are climbing. It puts pressure on mortgages, corporate debt, and government financing. The speed of this move also signals growing concerns around inflation expectations, fiscal deficit, or reduced demand for long-duration US debt.
The 5.00% level, which acted as resistance, is now flipping to support. The next level to watch is 5.20%, and a break above could open the door toward 5.30%-5.35%.
Bottom Line
Long-term US yields are breaking out fast. If this pace continues, it will weigh on equities, especially growth and real estate sectors, while making fixed income more attractive for yield-seeking investors.
#US30
*US 30-Year Yield Spikes to 5.188%, Highest in Recent Months*
_Long-Term Bond Yields Surge as Selloff Accelerates_
The US 30-year government bond yield has jumped to *5.188%*, up 0.064 percentage points or *1.25%* on the day, marking a sharp move higher in long-term rates.
What the Chart Shows
- *Breakout Higher*: After consolidating between 4.85% and 4.95% for several sessions, yields broke out with a series of strong green candles, pushing straight through 5.00% and 5.15% resistance.
- *Momentum*: The move looks aggressive, with minimal pullbacks. Each red candle is quickly followed by a larger green candle, showing buyers of yield and sellers of bonds are in control.
- *Current Level*: 5.188% as of 06:40 UTC, near the session high of 5.200%.
Why It Matters
A rise in 30-year yields means bond prices are falling and long-term borrowing costs are climbing. It puts pressure on mortgages, corporate debt, and government financing. The speed of this move also signals growing concerns around inflation expectations, fiscal deficit, or reduced demand for long-duration US debt.
The 5.00% level, which acted as resistance, is now flipping to support. The next level to watch is 5.20%, and a break above could open the door toward 5.30%-5.35%.
Bottom Line
Long-term US yields are breaking out fast. If this pace continues, it will weigh on equities, especially growth and real estate sectors, while making fixed income more attractive for yield-seeking investors.
*US 30-Year Yield Spikes to 5.188%, Highest in Recent Months*
_Long-Term Bond Yields Surge as Selloff Accelerates_
The US 30-year government bond yield has jumped to *5.188%*, up 0.064 percentage points or *1.25%* on the day, marking a sharp move higher in long-term rates.
What the Chart Shows
- *Breakout Higher*: After consolidating between 4.85% and 4.95% for several sessions, yields broke out with a series of strong green candles, pushing straight through 5.00% and 5.15% resistance.
- *Momentum*: The move looks aggressive, with minimal pullbacks. Each red candle is quickly followed by a larger green candle, showing buyers of yield and sellers of bonds are in control.
- *Current Level*: 5.188% as of 06:40 UTC, near the session high of 5.200%.
Why It Matters
A rise in 30-year yields means bond prices are falling and long-term borrowing costs are climbing. It puts pressure on mortgages, corporate debt, and government financing. The speed of this move also signals growing concerns around inflation expectations, fiscal deficit, or reduced demand for long-duration US debt.
The 5.00% level, which acted as resistance, is now flipping to support. The next level to watch is 5.20%, and a break above could open the door toward 5.30%-5.35%.
Bottom Line
Long-term US yields are breaking out fast. If this pace continues, it will weigh on equities, especially growth and real estate sectors, while making fixed income more attractive for yield-seeking investors.
15

Log in to explore more content
Join global crypto users on Binance Square
⚡️ Get latest and useful information about crypto.
💬 Trusted by the world’s largest crypto exchange.
👍 Discover real insights from verified creators.
Email / Phone number
Trending Topics
1
#AIStocksWhatNext
619,634 views
4,640 Discussing
2
#21SharesLaunchesEuropesFirstZcashETP
6,733 views
293 Discussing
3
#CardanoJoinsX402PaymentStandard
5,382 views
240 Discussing
4
#BitcoinTops$87KAtEightMonthHigh
6,127 views
74 Discussing
5
#ZECBreaksAbove$1600AtRecordHigh
3,084 views
61 Discussing
6
#BitwiseNEARStakingETPAssetsTop$100M
25,179 views
74 Discussing
7
#BitcoinBreaksAboveMayHighNears$86K
27,114 views
257 Discussing
8
#DogecoinRises15%
99,303 views
1,657 Discussing
9
#$14BBitcoinOptionsExpireFriday
7,781 views
109 Discussing
10
#BNBMarketCapPassesBNYMellon
62,057 views
1,329 Discussing