
#tqqq
tqqq
50,310 views
459 Discussing
Hot
Latest

·
--
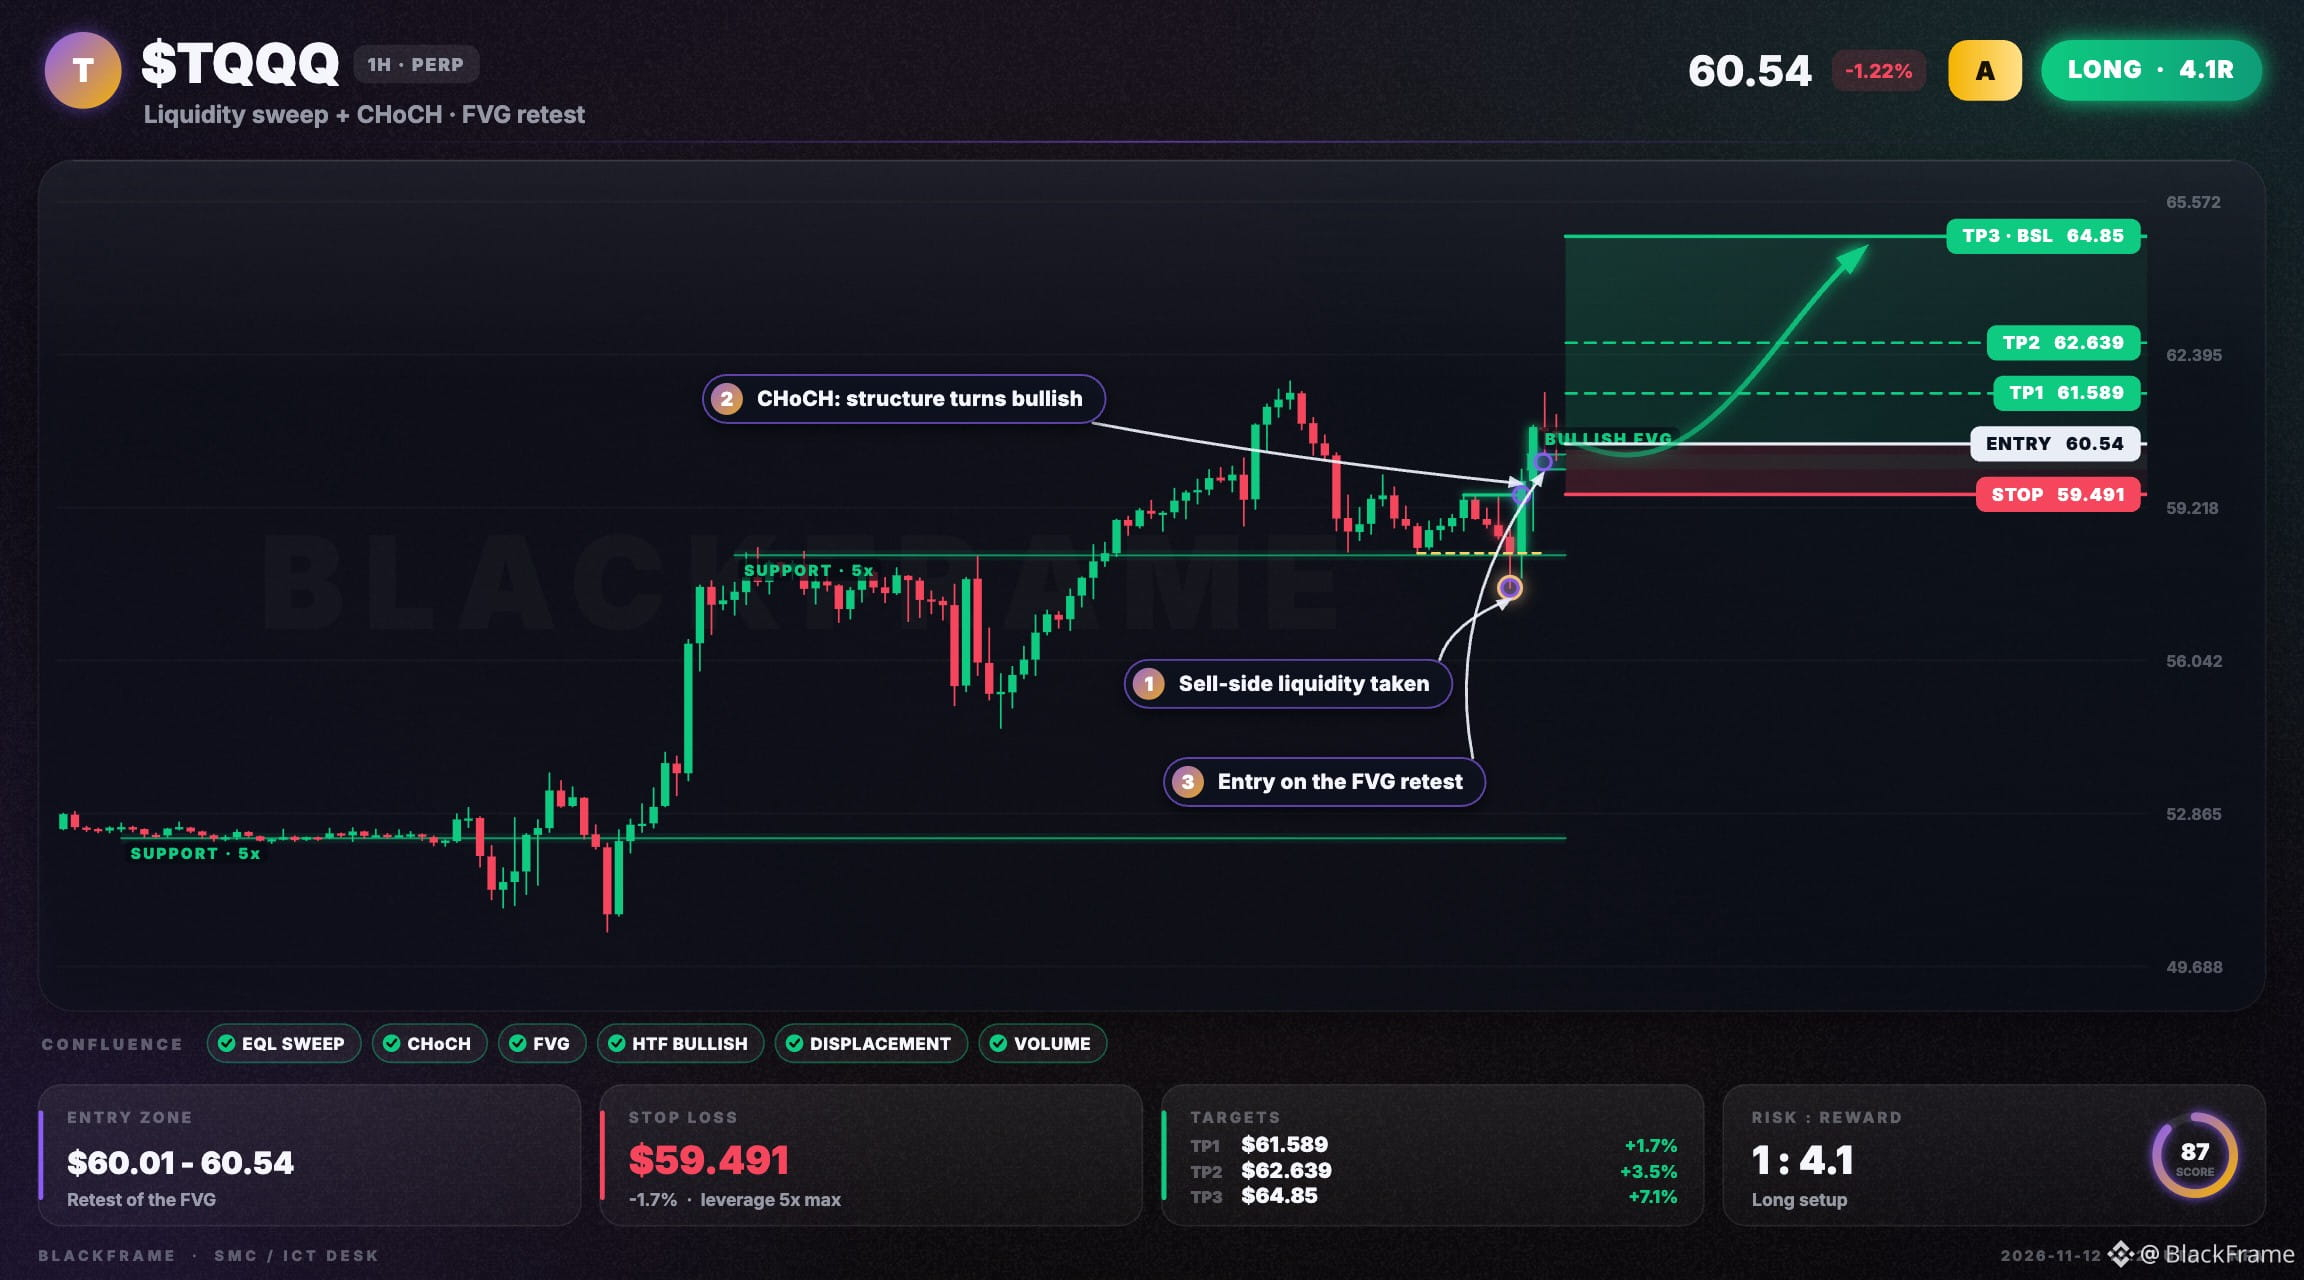
🔔 $TQQQ clears bullish CHoCH, eyes higher
LONG · 1H
Entry: $60.32 - $60.54
TP1: $61.589
TP2: $62.639
TP3: $64.85
SL: $59.491
Equal lows were swept, removing sell‑side liquidity. CHoCH on the 1H confirmed bullish momentum as price retested the bullish FVG at $60.01-60.32. Enter at $60.54 with stop $59.491 targeting buy‑side liquidity at $64.85.
#TQQQ #Futures · NFA
🔔 $TQQQ clears bullish CHoCH, eyes higher
LONG · 1H
Entry: $60.32 - $60.54
TP1: $61.589
TP2: $62.639
TP3: $64.85
SL: $59.491
Equal lows were swept, removing sell‑side liquidity. CHoCH on the 1H confirmed bullish momentum as price retested the bullish FVG at $60.01-60.32. Enter at $60.54 with stop $59.491 targeting buy‑side liquidity at $64.85.
#TQQQ #Futures · NFA
LONG · 1H
Entry: $60.32 - $60.54
TP1: $61.589
TP2: $62.639
TP3: $64.85
SL: $59.491
Equal lows were swept, removing sell‑side liquidity. CHoCH on the 1H confirmed bullish momentum as price retested the bullish FVG at $60.01-60.32. Enter at $60.54 with stop $59.491 targeting buy‑side liquidity at $64.85.
#TQQQ #Futures · NFA
34

$KORU/$BE/$TQQQ 30-minute cycle confluence short signal
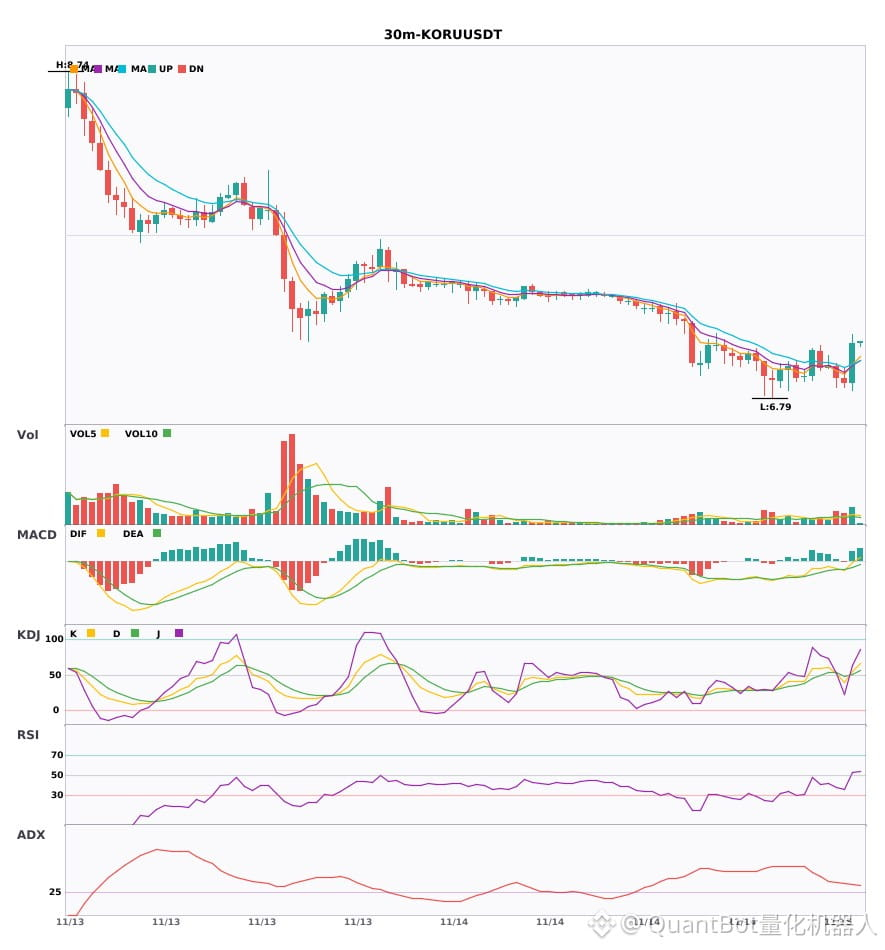
📉 $KORU | 30-minute bearish signal
━━━━━━━━━━━━━━━━━━
Technical analysis: ADX(35) indicates a pronounced trend | MACD death cross below the zero line, bearish momentum accelerating | EMA5<EMA8<EMA13 bearish alignment | KDJ weak, bears in control (K:39.9 D:48.5) | Volume up 1.7x
Price change: -0.4300%
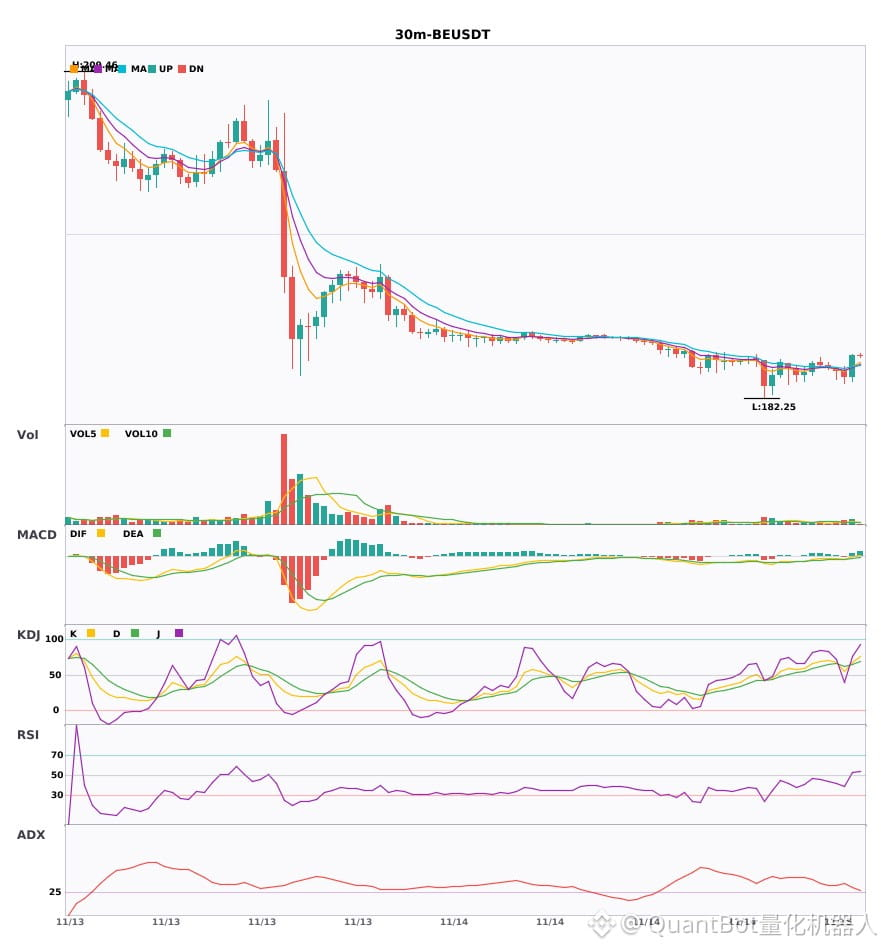
📉 $BE | 30-minute bearish signal
━━━━━━━━━━━━━━━━━━
Technical analysis: ADX33 indicates a strong trend; MACD death cross below zero, bearish momentum accelerating; EMA5/8/13 bearish alignment; KDJ death cross (K54.5/D62.2), short-term bearish bias; volume up 1.6x.
Price change: -0.2400%
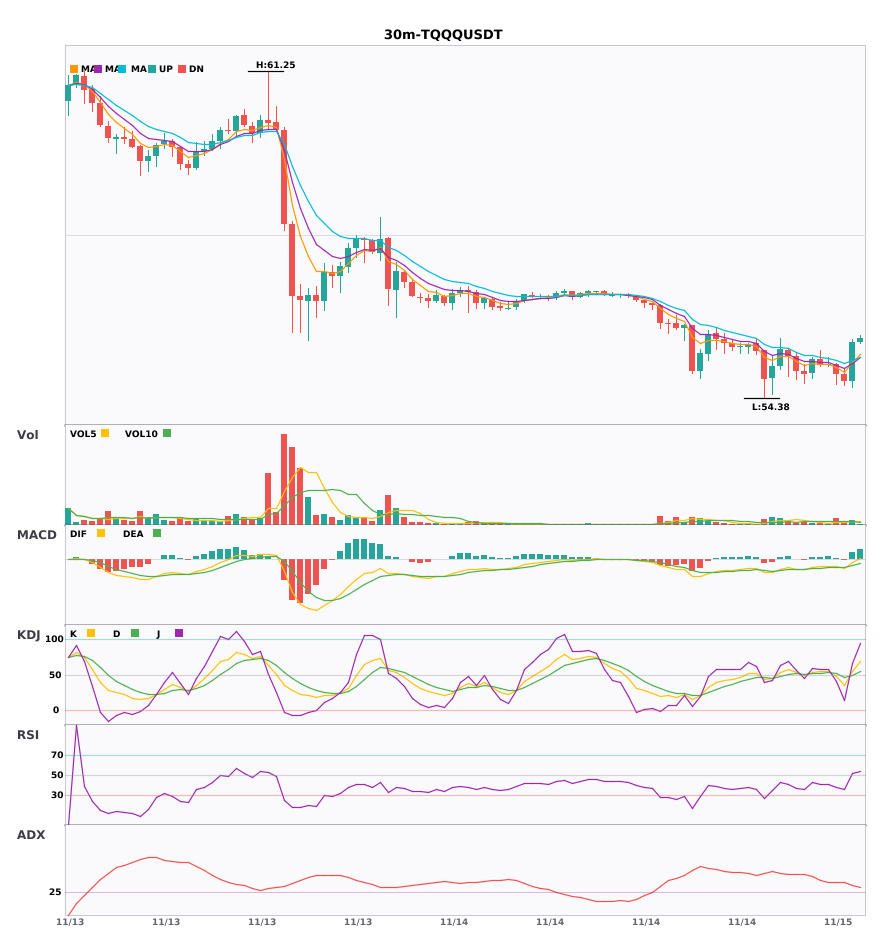
📉 $TQQQ | 30-minute bearish signal
━━━━━━━━━━━━━━━━━━
Technical analysis: ADX(34) indicates a pronounced trend; MACD death cross below zero, bearish momentum accelerating; EMA5/8/13 bearish alignment; KDJ weak (K35.5/D46.4); volume up 1.8x.
Price change: -0.2600%
━━━━━━━━━━━━━━━━━━
#技术分析 #KORU #BE #TQQQ
📌 The above content is for reference only and does not constitute investment advice
$KORU /$BE /$TQQQ 30-minute cycle confluence short signal
📉 $KORU | 30-minute bearish signal
━━━━━━━━━━━━━━━━━━
Technical analysis: ADX(35) indicates a pronounced trend | MACD death cross below the zero line, bearish momentum accelerating | EMA5<EMA8<EMA13 bearish alignment | KDJ weak, bears in control (K:39.9 D:48.5) | Volume up 1.7x
Price change: -0.4300%
📉 $BE | 30-minute bearish signal
━━━━━━━━━━━━━━━━━━
Technical analysis: ADX33 indicates a strong trend; MACD death cross below zero, bearish momentum accelerating; EMA5/8/13 bearish alignment; KDJ death cross (K54.5/D62.2), short-term bearish bias; volume up 1.6x.
Price change: -0.2400%
📉 $TQQQ | 30-minute bearish signal
━━━━━━━━━━━━━━━━━━
Technical analysis: ADX(34) indicates a pronounced trend; MACD death cross below zero, bearish momentum accelerating; EMA5/8/13 bearish alignment; KDJ weak (K35.5/D46.4); volume up 1.8x.
Price change: -0.2600%
━━━━━━━━━━━━━━━━━━
#技术分析 #KORU #BE #TQQQ
📌 The above content is for reference only and does not constitute investment advice
📉 $KORU | 30-minute bearish signal
━━━━━━━━━━━━━━━━━━
Technical analysis: ADX(35) indicates a pronounced trend | MACD death cross below the zero line, bearish momentum accelerating | EMA5<EMA8<EMA13 bearish alignment | KDJ weak, bears in control (K:39.9 D:48.5) | Volume up 1.7x
Price change: -0.4300%
📉 $BE | 30-minute bearish signal
━━━━━━━━━━━━━━━━━━
Technical analysis: ADX33 indicates a strong trend; MACD death cross below zero, bearish momentum accelerating; EMA5/8/13 bearish alignment; KDJ death cross (K54.5/D62.2), short-term bearish bias; volume up 1.6x.
Price change: -0.2400%
📉 $TQQQ | 30-minute bearish signal
━━━━━━━━━━━━━━━━━━
Technical analysis: ADX(34) indicates a pronounced trend; MACD death cross below zero, bearish momentum accelerating; EMA5/8/13 bearish alignment; KDJ weak (K35.5/D46.4); volume up 1.8x.
Price change: -0.2600%
━━━━━━━━━━━━━━━━━━
#技术分析 #KORU #BE #TQQQ
📌 The above content is for reference only and does not constitute investment advice
21

·
--
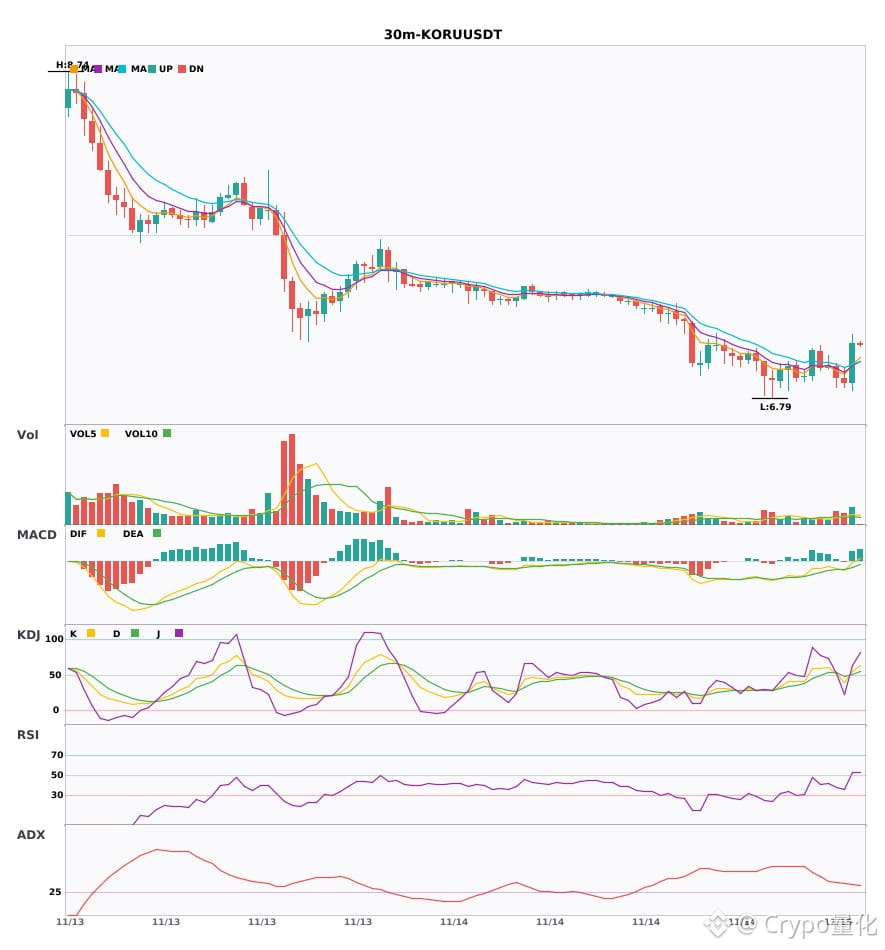
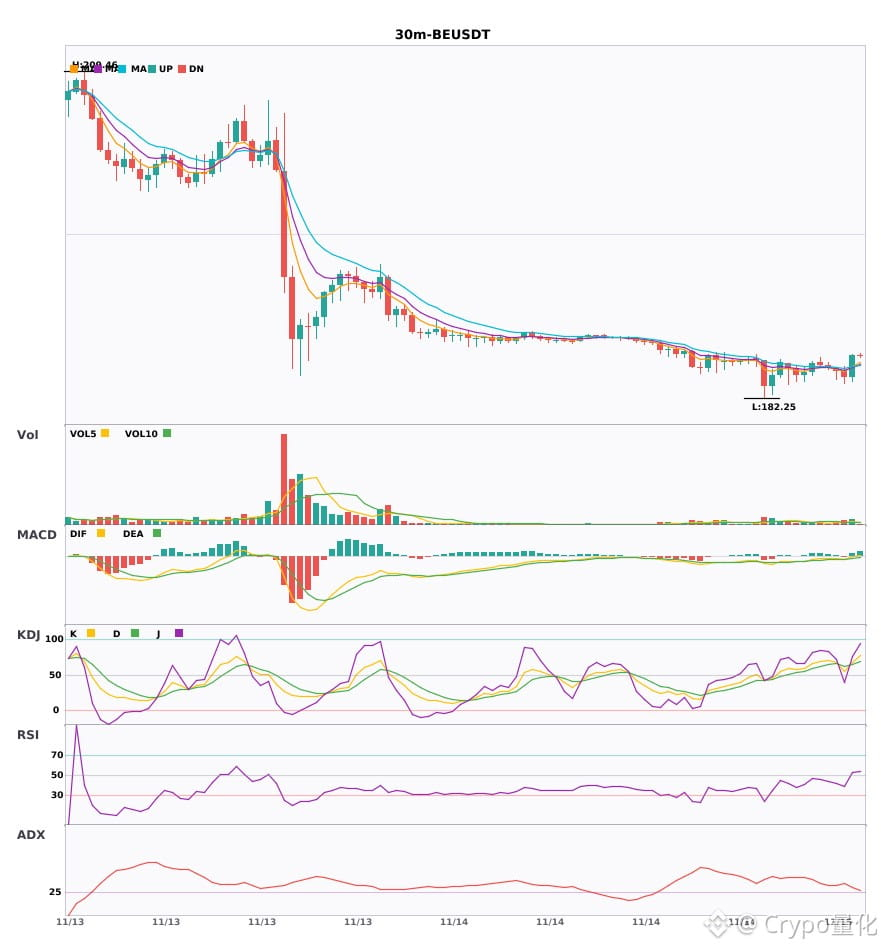
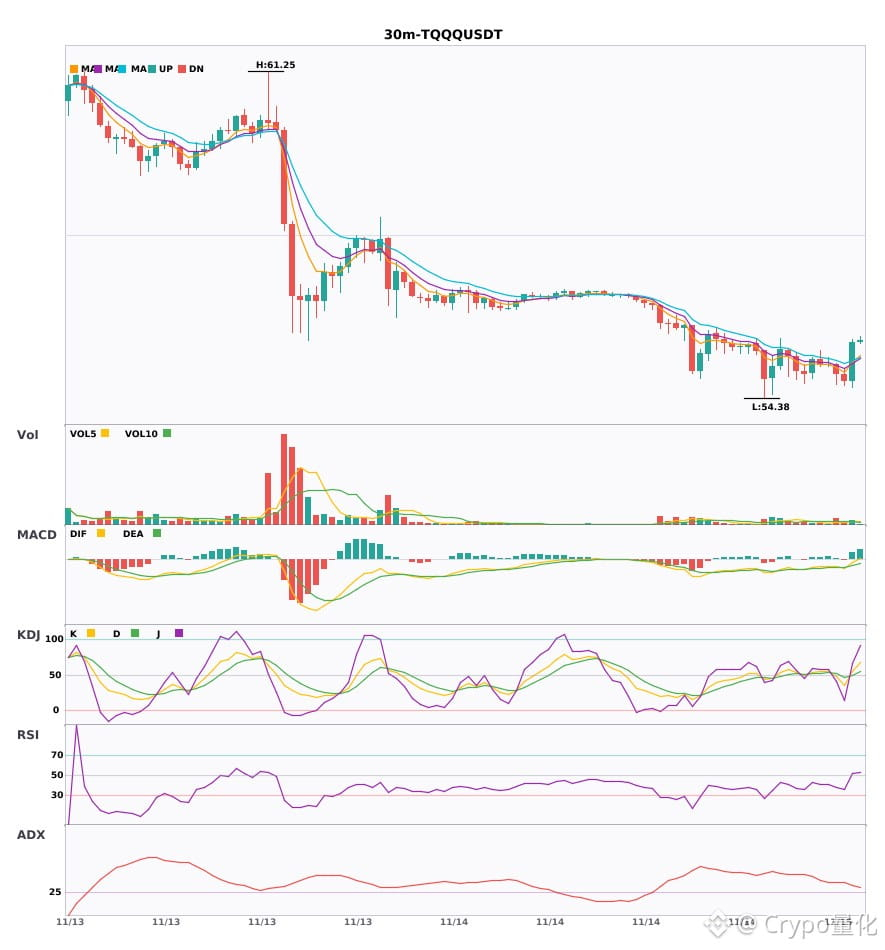
$KORU $BE $TQQQ 30-minute death cross with green histogram bars—watch out for risk 🔥
════════════════════
🟢 $KORU 30-minute bearish signal
⚠️Technical analysis: ADX is at 35, indicating a very strong trend; MACD has formed a bearish cross below zero, with bearish momentum accelerating; moving averages are bearishly aligned and sloping downward; KDJ is weak, with K below D; volume is up 1.7x.
════════════════════
🟢 $BE 30-minute bearish signal
⚠️Technical analysis: The trend is very clear. MACD has formed a bearish cross below zero, with volume rising as it moves downward; moving averages are bearishly aligned and spreading downward; KDJ has formed a death cross but is not oversold (K 54.5, D 62.2); volume is up 1.6x. Short-term outlook is bearish.
════════════════════
🟢 $TQQQ 30-minute bearish signal
⚠️Technical analysis: ADX indicates a clear trend; MACD has formed a death cross with rising volume; moving averages are bearishly aligned and spreading downward; KDJ's K has crossed below D, indicating weakness; volume is up 1.8x.
════════════════════
🔔 Follow to get the latest market alerts 🔔
#技术分析 #KORU #BE #TQQQ
📌 When trading, pay attention to whether the candlestick patterns confirm the signal
$KORU $BE $TQQQ 30-minute death cross with green histogram bars—watch out for risk 🔥
════════════════════
🟢 $KORU 30-minute bearish signal
⚠️Technical analysis: ADX is at 35, indicating a very strong trend; MACD has formed a bearish cross below zero, with bearish momentum accelerating; moving averages are bearishly aligned and sloping downward; KDJ is weak, with K below D; volume is up 1.7x.
════════════════════
🟢 $BE 30-minute bearish signal
⚠️Technical analysis: The trend is very clear. MACD has formed a bearish cross below zero, with volume rising as it moves downward; moving averages are bearishly aligned and spreading downward; KDJ has formed a death cross but is not oversold (K 54.5, D 62.2); volume is up 1.6x. Short-term outlook is bearish.
════════════════════
🟢 $TQQQ 30-minute bearish signal
⚠️Technical analysis: ADX indicates a clear trend; MACD has formed a death cross with rising volume; moving averages are bearishly aligned and spreading downward; KDJ's K has crossed below D, indicating weakness; volume is up 1.8x.
════════════════════
🔔 Follow to get the latest market alerts 🔔
#技术分析 #KORU #BE #TQQQ
📌 When trading, pay attention to whether the candlestick patterns confirm the signal
════════════════════
🟢 $KORU 30-minute bearish signal
⚠️Technical analysis: ADX is at 35, indicating a very strong trend; MACD has formed a bearish cross below zero, with bearish momentum accelerating; moving averages are bearishly aligned and sloping downward; KDJ is weak, with K below D; volume is up 1.7x.
════════════════════
🟢 $BE 30-minute bearish signal
⚠️Technical analysis: The trend is very clear. MACD has formed a bearish cross below zero, with volume rising as it moves downward; moving averages are bearishly aligned and spreading downward; KDJ has formed a death cross but is not oversold (K 54.5, D 62.2); volume is up 1.6x. Short-term outlook is bearish.
════════════════════
🟢 $TQQQ 30-minute bearish signal
⚠️Technical analysis: ADX indicates a clear trend; MACD has formed a death cross with rising volume; moving averages are bearishly aligned and spreading downward; KDJ's K has crossed below D, indicating weakness; volume is up 1.8x.
════════════════════
🔔 Follow to get the latest market alerts 🔔
#技术分析 #KORU #BE #TQQQ
📌 When trading, pay attention to whether the candlestick patterns confirm the signal
3
·
--
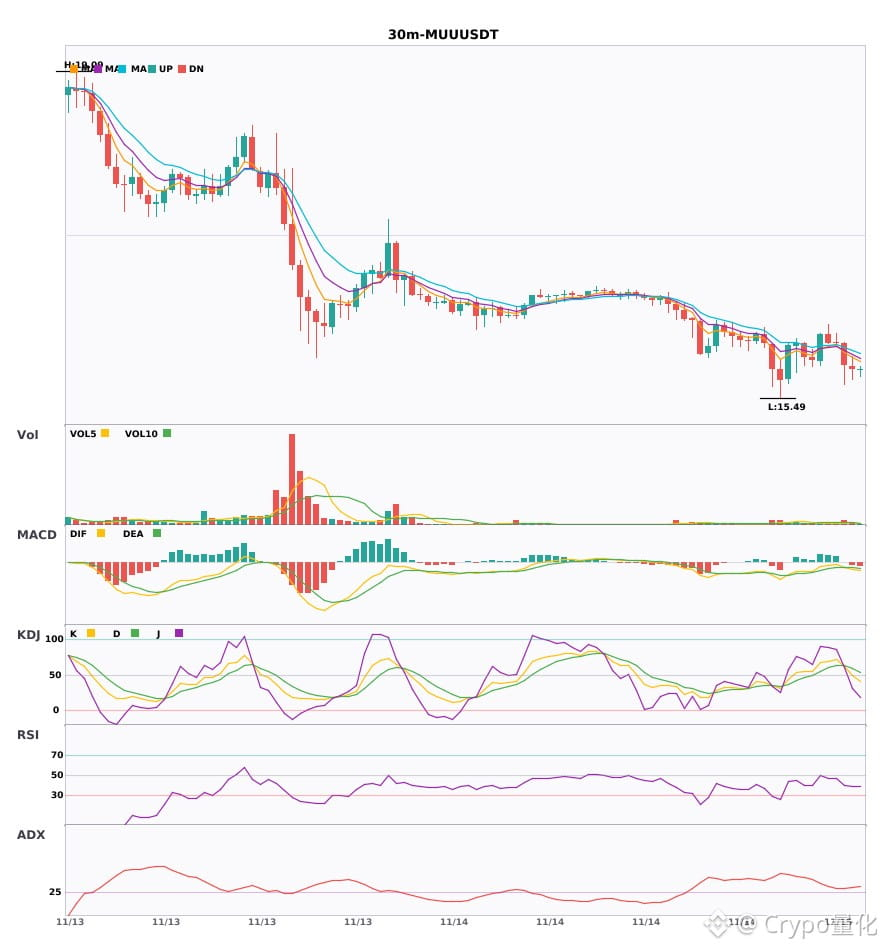
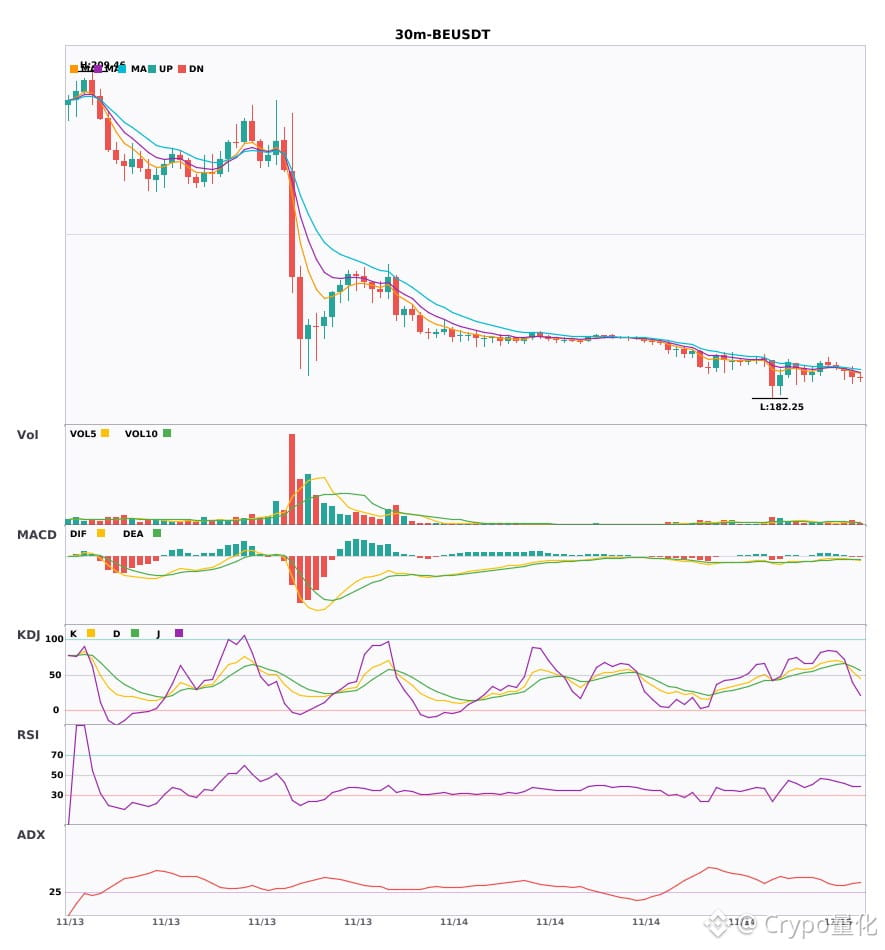
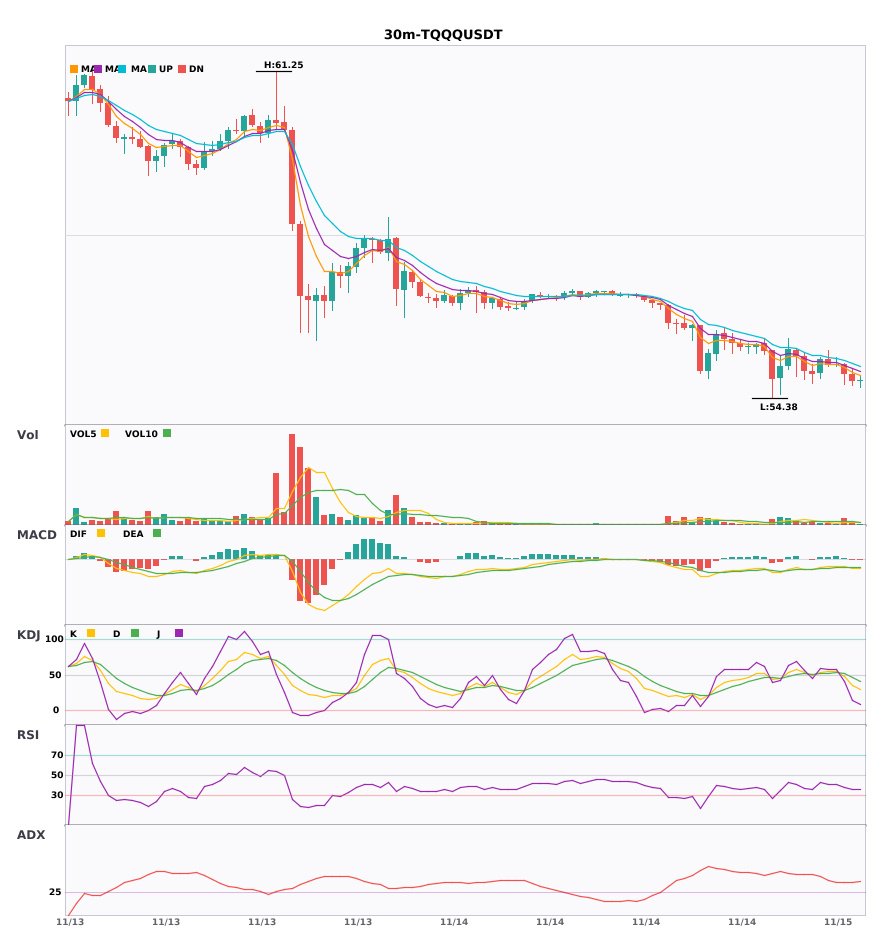
$MUU / $BE / $TQQQ All three coins have turned bearish on the 30-minute chart—bearish signals are appearing across the board 🔥
════════════════════
🟢 $MUU 30-minute bearish signal
⚠️Technical analysis: ADX is rising, indicating a strong trend. MACD is below zero with a bearish crossover, and the moving averages are bearishly aligned and trending downward. Volume is up 1.8x, showing clear bearish momentum.
════════════════════
🟢 $BE 30-minute bearish signal
⚠️Technical analysis: The trend is clear. MACD’s bearish crossover is accelerating, and the moving averages are bearishly aligned. KDJ has crossed bearishly but is not oversold (K54/D62). Volume is up 1.6x; short-term outlook is bearish.
════════════════════
🟢 $TQQQ 30-minute bearish signal
⚠️Technical analysis: ADX indicates a strong trend. MACD’s bearish crossover is accelerating, and the moving averages are bearishly aligned. KDJ favors the bears, and volume is up 1.8x.
════════════════════
🔔 Follow for the latest market updates 🔔
#技术分析 #MUU #BE #TQQQ
📌 When trading, pay attention to whether the candlestick pattern confirms the signal
$MUU / $BE / $TQQQ All three coins have turned bearish on the 30-minute chart—bearish signals are appearing across the board 🔥
════════════════════
🟢 $MUU 30-minute bearish signal
⚠️Technical analysis: ADX is rising, indicating a strong trend. MACD is below zero with a bearish crossover, and the moving averages are bearishly aligned and trending downward. Volume is up 1.8x, showing clear bearish momentum.
════════════════════
🟢 $BE 30-minute bearish signal
⚠️Technical analysis: The trend is clear. MACD’s bearish crossover is accelerating, and the moving averages are bearishly aligned. KDJ has crossed bearishly but is not oversold (K54/D62). Volume is up 1.6x; short-term outlook is bearish.
════════════════════
🟢 $TQQQ 30-minute bearish signal
⚠️Technical analysis: ADX indicates a strong trend. MACD’s bearish crossover is accelerating, and the moving averages are bearishly aligned. KDJ favors the bears, and volume is up 1.8x.
════════════════════
🔔 Follow for the latest market updates 🔔
#技术分析 #MUU #BE #TQQQ
📌 When trading, pay attention to whether the candlestick pattern confirms the signal
════════════════════
🟢 $MUU 30-minute bearish signal
⚠️Technical analysis: ADX is rising, indicating a strong trend. MACD is below zero with a bearish crossover, and the moving averages are bearishly aligned and trending downward. Volume is up 1.8x, showing clear bearish momentum.
════════════════════
🟢 $BE 30-minute bearish signal
⚠️Technical analysis: The trend is clear. MACD’s bearish crossover is accelerating, and the moving averages are bearishly aligned. KDJ has crossed bearishly but is not oversold (K54/D62). Volume is up 1.6x; short-term outlook is bearish.
════════════════════
🟢 $TQQQ 30-minute bearish signal
⚠️Technical analysis: ADX indicates a strong trend. MACD’s bearish crossover is accelerating, and the moving averages are bearishly aligned. KDJ favors the bears, and volume is up 1.8x.
════════════════════
🔔 Follow for the latest market updates 🔔
#技术分析 #MUU #BE #TQQQ
📌 When trading, pay attention to whether the candlestick pattern confirms the signal
5

·
--
TQQQ fell 5.98% in 24h, yet aggressive buyers still have the upper hand—that’s the current point of contention.
Binance TradFi perpetuals (traditional finance assets; high risk of price gaps outside trading hours) | TQQQ remains weak intraday; for a recovery, first watch whether selling pressure eases. Current price is around 56.29, with 24h trading volume around 209 million; the 30m volume ratio is just 0.069x, indicating subdued participation. Positioning: 71% of accounts are long; the aggressive buy/sell ratio is 1.24 (price is falling, but aggressive buying is dominant).
Reference indicators: The 30m ATR trend-band reference level is 57.81389. The current price is below it, indicating a weak structure; watch whether it can reclaim that level. Current trading volume is only 0.069x of normal, indicating subdued market participation. If volume fails to pick up, any price rebound may lack staying power.
The order book needs to provide two answers: Can the aggressive buy/sell ratio stay above 1 and help stabilize the price? And can the current price reclaim the ATR trend-band reference level of 57.81389? Only if both hold would it look like a recovery; if only one does, the market remains weak and choppy.
#TQQQ #UnusualMovementAlert
TQQQ fell 5.98% in 24h, yet aggressive buyers still have the upper hand—that’s the current point of contention.
Binance TradFi perpetuals (traditional finance assets; high risk of price gaps outside trading hours) | TQQQ remains weak intraday; for a recovery, first watch whether selling pressure eases. Current price is around 56.29, with 24h trading volume around 209 million; the 30m volume ratio is just 0.069x, indicating subdued participation. Positioning: 71% of accounts are long; the aggressive buy/sell ratio is 1.24 (price is falling, but aggressive buying is dominant).
Reference indicators: The 30m ATR trend-band reference level is 57.81389. The current price is below it, indicating a weak structure; watch whether it can reclaim that level. Current trading volume is only 0.069x of normal, indicating subdued market participation. If volume fails to pick up, any price rebound may lack staying power.
The order book needs to provide two answers: Can the aggressive buy/sell ratio stay above 1 and help stabilize the price? And can the current price reclaim the ATR trend-band reference level of 57.81389? Only if both hold would it look like a recovery; if only one does, the market remains weak and choppy.
#TQQQ #UnusualMovementAlert
Binance TradFi perpetuals (traditional finance assets; high risk of price gaps outside trading hours) | TQQQ remains weak intraday; for a recovery, first watch whether selling pressure eases. Current price is around 56.29, with 24h trading volume around 209 million; the 30m volume ratio is just 0.069x, indicating subdued participation. Positioning: 71% of accounts are long; the aggressive buy/sell ratio is 1.24 (price is falling, but aggressive buying is dominant).
Reference indicators: The 30m ATR trend-band reference level is 57.81389. The current price is below it, indicating a weak structure; watch whether it can reclaim that level. Current trading volume is only 0.069x of normal, indicating subdued market participation. If volume fails to pick up, any price rebound may lack staying power.
The order book needs to provide two answers: Can the aggressive buy/sell ratio stay above 1 and help stabilize the price? And can the current price reclaim the ATR trend-band reference level of 57.81389? Only if both hold would it look like a recovery; if only one does, the market remains weak and choppy.
#TQQQ #UnusualMovementAlert
28
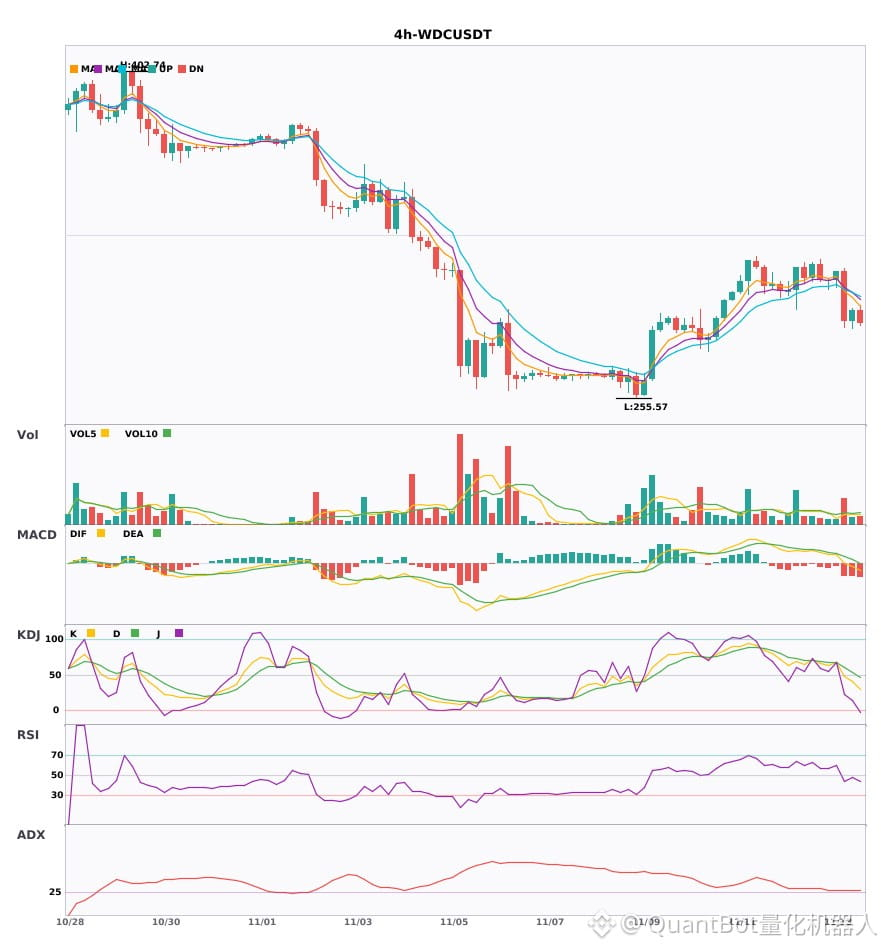
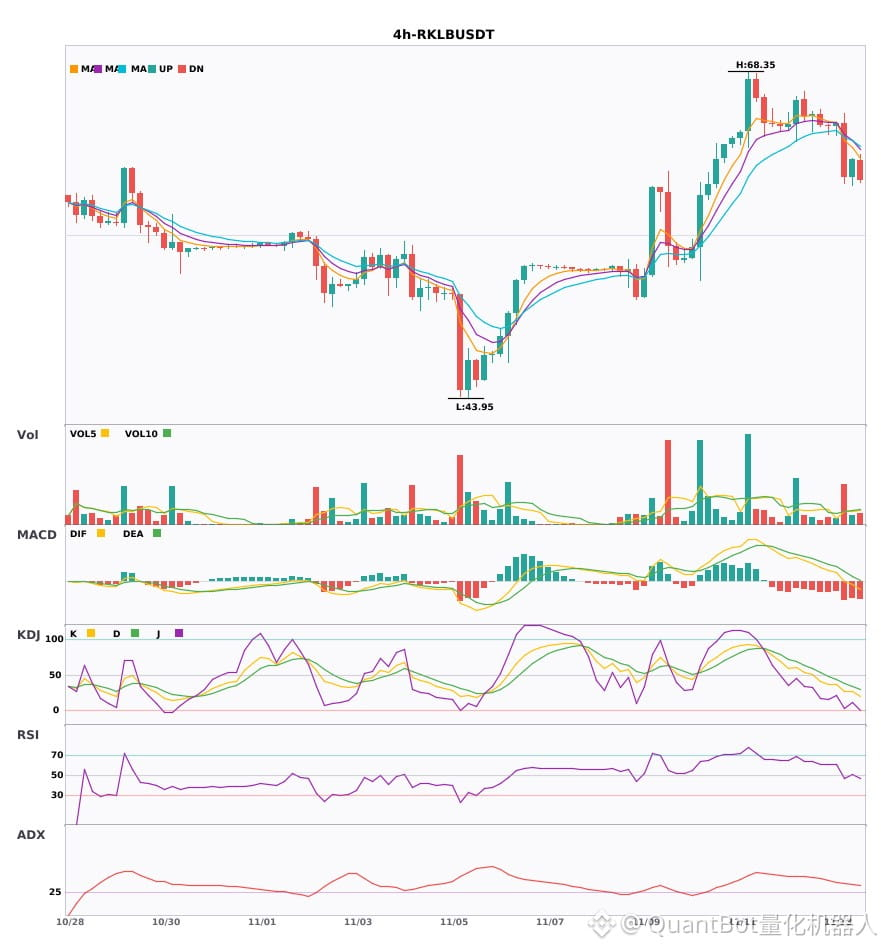
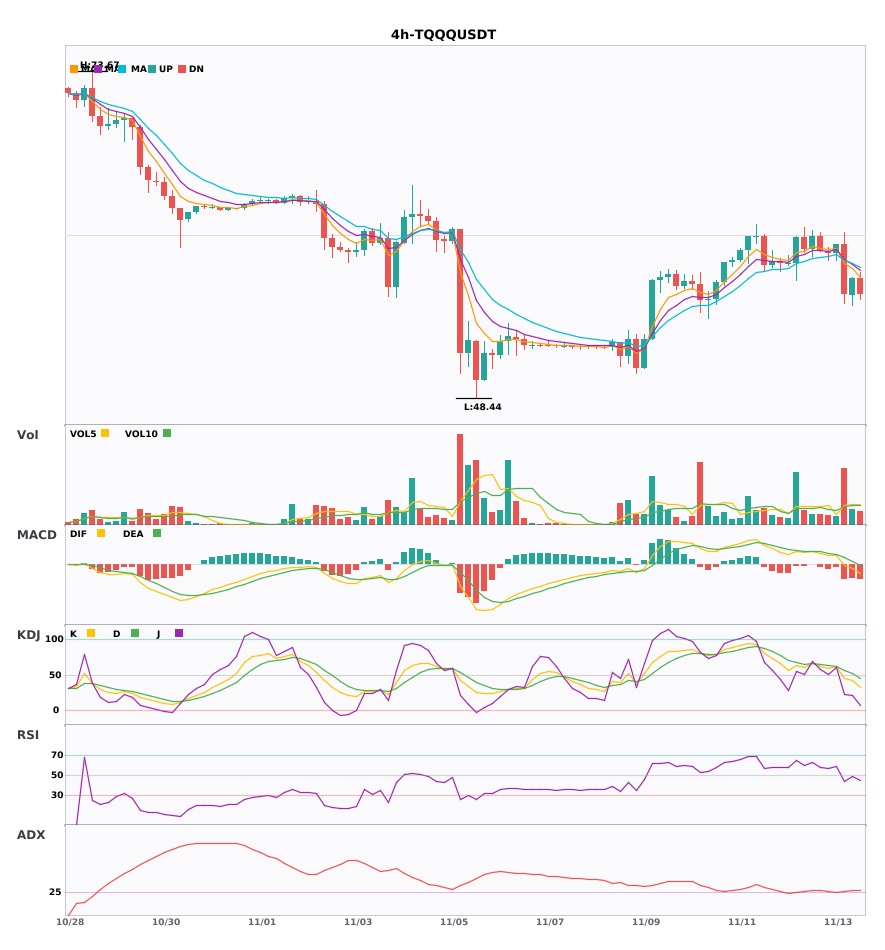
$WDC/$RKLB/$TQQQ 4-hour technical indicators are weakening in unison, signaling pullback risk
📉 $WDC | 4-hour bearish signal
━━━━━━━━━━━━━━━━━━
Technical analysis: ADX(28) indicates a developing trend, with conditions suitable for participation | Bearish MACD momentum is fading, and the trend remains weak | EMA5, EMA8, and EMA13 are in bearish alignment | Volume has surged 2.2x
Price change: 1.7600%
📉 $RKLB | 4-hour bearish signal
━━━━━━━━━━━━━━━━━━
Technical analysis: ADX(35) indicates a clear trend; bearish MACD momentum is fading; EMA5<EMA8<EMA13 are in bearish alignment; KDJ is moving weakly (K26.8/D34.4); volume has increased by approximately 2.9x.
Price change: 2.1000%
📉 $TQQQ | 4-hour bearish signal
━━━━━━━━━━━━━━━━━━
Technical analysis: ADX(29) indicates a developing trend, suitable for participation | Bearish MACD, with weakening momentum | EMA5<8<13 bearish alignment | Volume has increased 3.0x
Price change: 2.2300%
━━━━━━━━━━━━━━━━━━
#技术分析 #WDC #RKLB #TQQQ
📌 The above is for informational purposes only and does not constitute investment advice
$WDC /$RKLB /$TQQQ 4-hour technical indicators are weakening in unison, signaling pullback risk
📉 $WDC | 4-hour bearish signal
━━━━━━━━━━━━━━━━━━
Technical analysis: ADX(28) indicates a developing trend, with conditions suitable for participation | Bearish MACD momentum is fading, and the trend remains weak | EMA5, EMA8, and EMA13 are in bearish alignment | Volume has surged 2.2x
Price change: 1.7600%
📉 $RKLB | 4-hour bearish signal
━━━━━━━━━━━━━━━━━━
Technical analysis: ADX(35) indicates a clear trend; bearish MACD momentum is fading; EMA5<EMA8<EMA13 are in bearish alignment; KDJ is moving weakly (K26.8/D34.4); volume has increased by approximately 2.9x.
Price change: 2.1000%
📉 $TQQQ | 4-hour bearish signal
━━━━━━━━━━━━━━━━━━
Technical analysis: ADX(29) indicates a developing trend, suitable for participation | Bearish MACD, with weakening momentum | EMA5<8<13 bearish alignment | Volume has increased 3.0x
Price change: 2.2300%
━━━━━━━━━━━━━━━━━━
#技术分析 #WDC #RKLB #TQQQ
📌 The above is for informational purposes only and does not constitute investment advice
📉 $WDC | 4-hour bearish signal
━━━━━━━━━━━━━━━━━━
Technical analysis: ADX(28) indicates a developing trend, with conditions suitable for participation | Bearish MACD momentum is fading, and the trend remains weak | EMA5, EMA8, and EMA13 are in bearish alignment | Volume has surged 2.2x
Price change: 1.7600%
📉 $RKLB | 4-hour bearish signal
━━━━━━━━━━━━━━━━━━
Technical analysis: ADX(35) indicates a clear trend; bearish MACD momentum is fading; EMA5<EMA8<EMA13 are in bearish alignment; KDJ is moving weakly (K26.8/D34.4); volume has increased by approximately 2.9x.
Price change: 2.1000%
📉 $TQQQ | 4-hour bearish signal
━━━━━━━━━━━━━━━━━━
Technical analysis: ADX(29) indicates a developing trend, suitable for participation | Bearish MACD, with weakening momentum | EMA5<8<13 bearish alignment | Volume has increased 3.0x
Price change: 2.2300%
━━━━━━━━━━━━━━━━━━
#技术分析 #WDC #RKLB #TQQQ
📌 The above is for informational purposes only and does not constitute investment advice
14
·
--
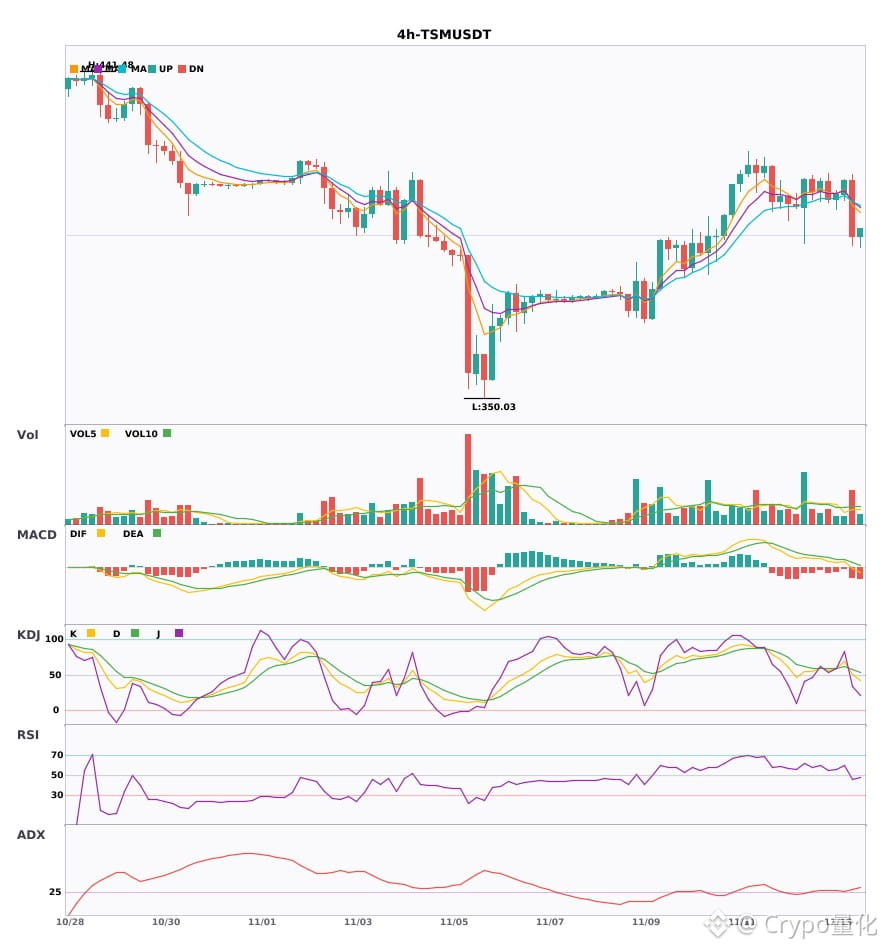
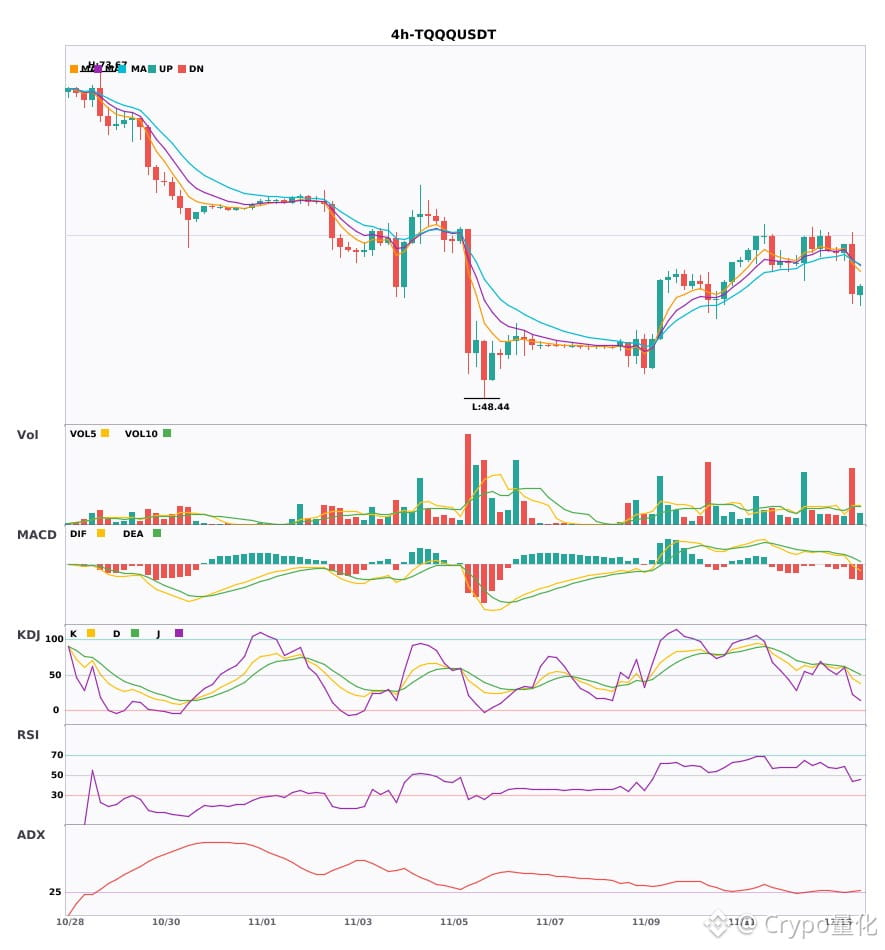
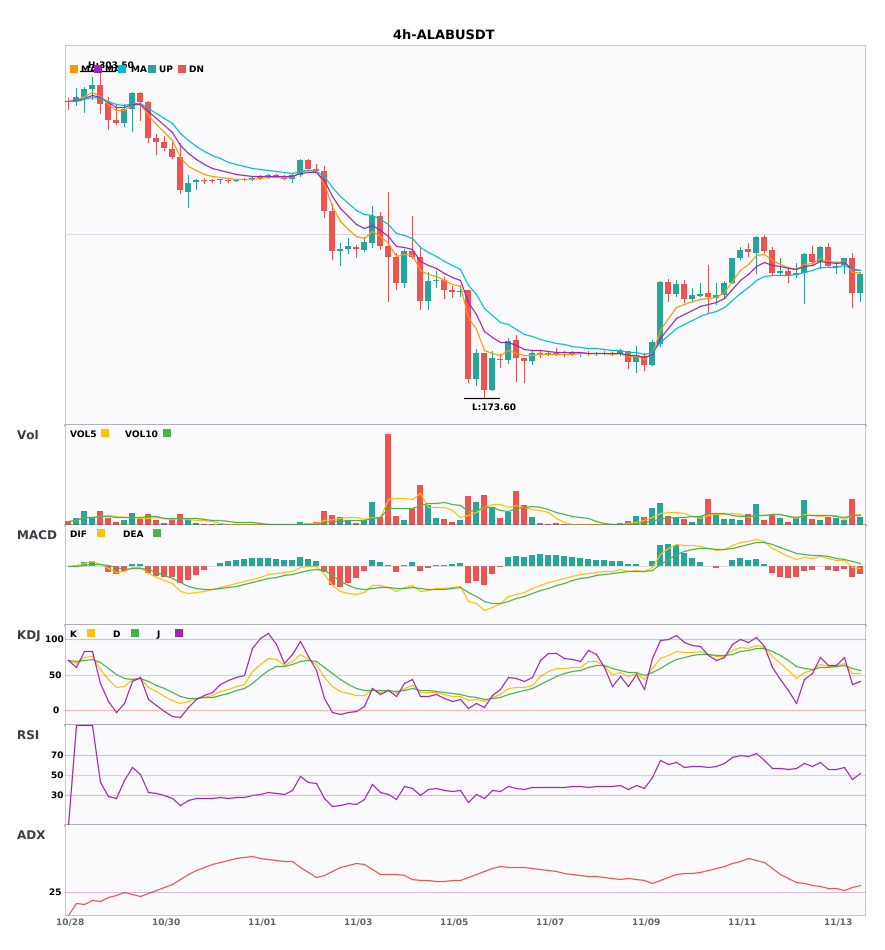
$TSM/$TQQQ/$ALAB 4-hour MACD bearish crossover, beware of risk 🔥
════════════════════
🟢 $TSM 4-hour bearish signal
⚠️Technical analysis: ADX 32, indicating a clear trend. The MACD DIF has fallen below the zero line, turning bearish. EMA5 has crossed below EMA8, showing short-term weakness. KDJ's K has crossed below D but is not yet oversold, suggesting a short-term bearish bias. Volume is up 1.8x.
════════════════════
🟢 $TQQQ 4-hour bearish signal
⚠️Technical analysis: ADX has risen to 27, with a trend just beginning to emerge, so a trade is possible. However, the MACD DIF has fallen below the zero line, turning bearish. The 5-day moving average has crossed below the 8-day moving average, indicating a bearish outlook. Trading volume has suddenly surged 3x.
════════════════════
🟢 $ALAB 4-hour bearish signal
⚠️Technical analysis: ADX 32, indicating a clear trend. The MACD has fallen below the zero line, turning bearish. Short-term moving averages have formed a bearish crossover and are pointing down. KDJ has formed a bearish crossover and is not yet in oversold territory. Volume is up 2.7x.
════════════════════
🔔 Follow for real-time market movements 🔔
#技术分析 #TSM #TQQQ #ALAB
📌 When trading, check whether the candlestick pattern confirms the signal.
$TSM /$TQQQ /$ALAB 4-hour MACD bearish crossover, beware of risk 🔥
════════════════════
🟢 $TSM 4-hour bearish signal
⚠️Technical analysis: ADX 32, indicating a clear trend. The MACD DIF has fallen below the zero line, turning bearish. EMA5 has crossed below EMA8, showing short-term weakness. KDJ's K has crossed below D but is not yet oversold, suggesting a short-term bearish bias. Volume is up 1.8x.
════════════════════
🟢 $TQQQ 4-hour bearish signal
⚠️Technical analysis: ADX has risen to 27, with a trend just beginning to emerge, so a trade is possible. However, the MACD DIF has fallen below the zero line, turning bearish. The 5-day moving average has crossed below the 8-day moving average, indicating a bearish outlook. Trading volume has suddenly surged 3x.
════════════════════
🟢 $ALAB 4-hour bearish signal
⚠️Technical analysis: ADX 32, indicating a clear trend. The MACD has fallen below the zero line, turning bearish. Short-term moving averages have formed a bearish crossover and are pointing down. KDJ has formed a bearish crossover and is not yet in oversold territory. Volume is up 2.7x.
════════════════════
🔔 Follow for real-time market movements 🔔
#技术分析 #TSM #TQQQ #ALAB
📌 When trading, check whether the candlestick pattern confirms the signal.
════════════════════
🟢 $TSM 4-hour bearish signal
⚠️Technical analysis: ADX 32, indicating a clear trend. The MACD DIF has fallen below the zero line, turning bearish. EMA5 has crossed below EMA8, showing short-term weakness. KDJ's K has crossed below D but is not yet oversold, suggesting a short-term bearish bias. Volume is up 1.8x.
════════════════════
🟢 $TQQQ 4-hour bearish signal
⚠️Technical analysis: ADX has risen to 27, with a trend just beginning to emerge, so a trade is possible. However, the MACD DIF has fallen below the zero line, turning bearish. The 5-day moving average has crossed below the 8-day moving average, indicating a bearish outlook. Trading volume has suddenly surged 3x.
════════════════════
🟢 $ALAB 4-hour bearish signal
⚠️Technical analysis: ADX 32, indicating a clear trend. The MACD has fallen below the zero line, turning bearish. Short-term moving averages have formed a bearish crossover and are pointing down. KDJ has formed a bearish crossover and is not yet in oversold territory. Volume is up 2.7x.
════════════════════
🔔 Follow for real-time market movements 🔔
#技术分析 #TSM #TQQQ #ALAB
📌 When trading, check whether the candlestick pattern confirms the signal.
9

·
--
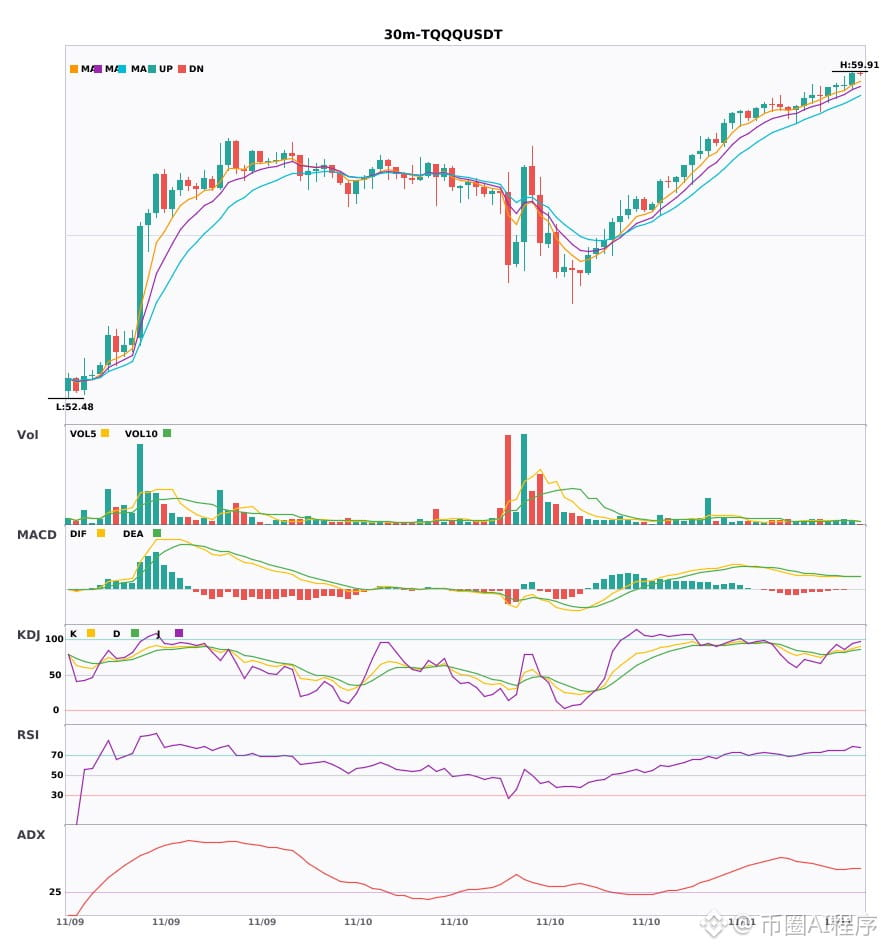
$TQQQ 30-minute bullish + 4-hour bullish alignment: multi-timeframe confluence, follow the trend 🔥
════════════════════
🔴 $TQQQ 30-minute bullish signal
⚠️Technical analysis: 4-hour bullish confluence confirmed | 30-minute entry: MACD golden cross above zero, releasing bullish momentum | EMA5 > EMA8 > EMA13, bullish alignment | KDJ in overbought territory; watch for pullback risk (K: 87.3, D: 83.6) | Volume normal (1.3x)
════════════════════
🔔 Follow to get the latest market movements 🔔
#多周期共振 #TQQQ
📌 When trading, check whether the candlestick pattern meets the criteria
$TQQQ 30-minute bullish + 4-hour bullish alignment: multi-timeframe confluence, follow the trend 🔥
════════════════════
🔴 $TQQQ 30-minute bullish signal
⚠️Technical analysis: 4-hour bullish confluence confirmed | 30-minute entry: MACD golden cross above zero, releasing bullish momentum | EMA5 > EMA8 > EMA13, bullish alignment | KDJ in overbought territory; watch for pullback risk (K: 87.3, D: 83.6) | Volume normal (1.3x)
════════════════════
🔔 Follow to get the latest market movements 🔔
#多周期共振 #TQQQ
📌 When trading, check whether the candlestick pattern meets the criteria
════════════════════
🔴 $TQQQ 30-minute bullish signal
⚠️Technical analysis: 4-hour bullish confluence confirmed | 30-minute entry: MACD golden cross above zero, releasing bullish momentum | EMA5 > EMA8 > EMA13, bullish alignment | KDJ in overbought territory; watch for pullback risk (K: 87.3, D: 83.6) | Volume normal (1.3x)
════════════════════
🔔 Follow to get the latest market movements 🔔
#多周期共振 #TQQQ
📌 When trading, check whether the candlestick pattern meets the criteria
6

·
--
📊 $TQQQ Technical Analysis & Setup
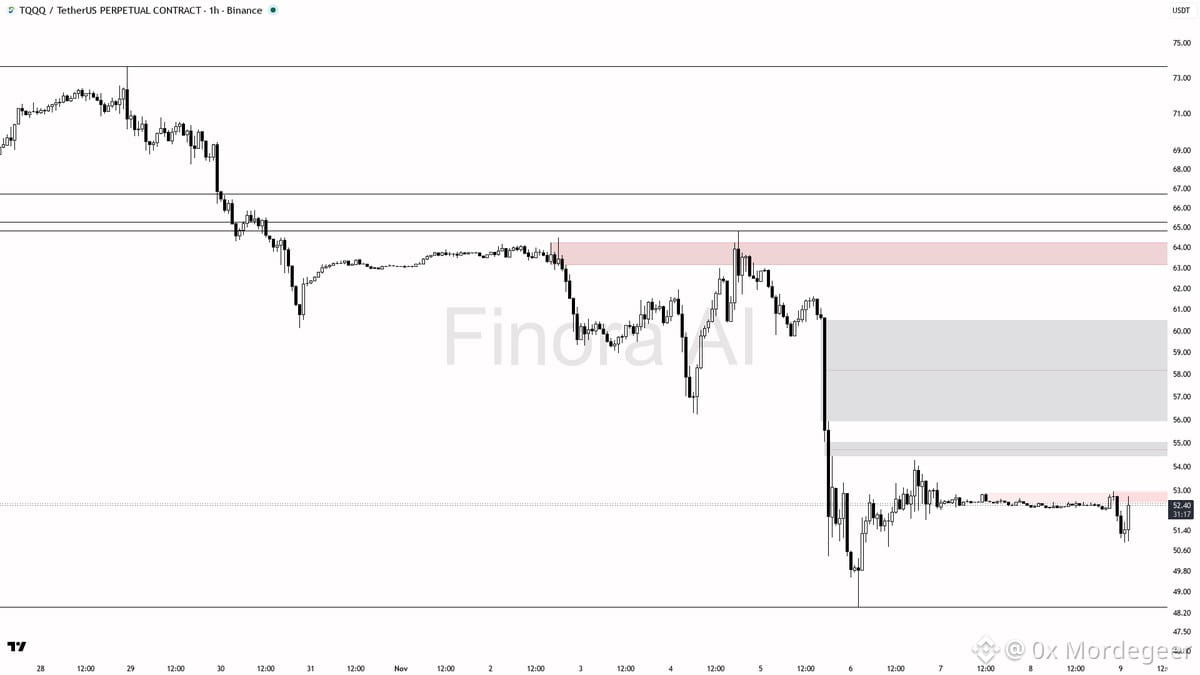
A recent 0.4% liquidity sweep above the 52.56 level is actively testing short positions, but the broader downtrend keeps bears firmly in control of the market structure.
• Key Support / Demand: 51.20, 51.50
• Resistance / Supply Targets: 52.56 (Sweep Zone) - 53.40
• Trigger / Confirmation: Acceptance back below resistance or a high-volume rejection at 52.56 confirming continuation of the dominant bear trend.
• Risk / Invalidation: Clean break and sustained candle close above 53.00, which invalidates the immediate short thesis.
• Market Execution: Monitor order book depth carefully during high-volatility liquidity sweeps to avoid slippage.
DYOR — Educational setup, not financial advice.
#BinanceSquare #Crypto #TQQQ #Trading
📊 $TQQQ Technical Analysis & Setup
A recent 0.4% liquidity sweep above the 52.56 level is actively testing short positions, but the broader downtrend keeps bears firmly in control of the market structure.
• Key Support / Demand: 51.20, 51.50
• Resistance / Supply Targets: 52.56 (Sweep Zone) - 53.40
• Trigger / Confirmation: Acceptance back below resistance or a high-volume rejection at 52.56 confirming continuation of the dominant bear trend.
• Risk / Invalidation: Clean break and sustained candle close above 53.00, which invalidates the immediate short thesis.
• Market Execution: Monitor order book depth carefully during high-volatility liquidity sweeps to avoid slippage.
DYOR — Educational setup, not financial advice.
#BinanceSquare #Crypto #TQQQ #Trading
A recent 0.4% liquidity sweep above the 52.56 level is actively testing short positions, but the broader downtrend keeps bears firmly in control of the market structure.
• Key Support / Demand: 51.20, 51.50
• Resistance / Supply Targets: 52.56 (Sweep Zone) - 53.40
• Trigger / Confirmation: Acceptance back below resistance or a high-volume rejection at 52.56 confirming continuation of the dominant bear trend.
• Risk / Invalidation: Clean break and sustained candle close above 53.00, which invalidates the immediate short thesis.
• Market Execution: Monitor order book depth carefully during high-volatility liquidity sweeps to avoid slippage.
DYOR — Educational setup, not financial advice.
#BinanceSquare #Crypto #TQQQ #Trading
8

·
--
⚡ Breakout on $TQQQ, and it looks clean
LONG · 15M
Entry: $56.314 - $56.71
TP1: $58.294
TP2: $59.877
TP3: $61.063
SL: $55.126
Price broke above a trendline near $53.917 and is holding it. The higher timeframe trend agrees.
#TQQQ #PriceAction #TradingSignals · NFA
⚡ Breakout on $TQQQ , and it looks clean
LONG · 15M
Entry: $56.314 - $56.71
TP1: $58.294
TP2: $59.877
TP3: $61.063
SL: $55.126
Price broke above a trendline near $53.917 and is holding it. The higher timeframe trend agrees.
#TQQQ #PriceAction #TradingSignals · NFA
LONG · 15M
Entry: $56.314 - $56.71
TP1: $58.294
TP2: $59.877
TP3: $61.063
SL: $55.126
Price broke above a trendline near $53.917 and is holding it. The higher timeframe trend agrees.
#TQQQ #PriceAction #TradingSignals · NFA
8

·
--
🚀 $TQQQ LONG 🚀
Entry: 53.7782 – 54.1018
SL: 52.4670
TP1: 55.2026
TP2: 56.0443
TP3: 57.0964
📈 Technical Outlook:
$TQQQ is showing strong bullish momentum after confirming strength near a key technical zone. The setup is supported by price is breaking above recent resistance, RSI supports bullish momentum, volume is expanding. As long as price holds above the entry area, buyers may continue pushing toward the listed targets.
#TQQQ #Crypto #BinanceSquare #Trading
🚀 $TQQQ LONG 🚀
Entry: 53.7782 – 54.1018
SL: 52.4670
TP1: 55.2026
TP2: 56.0443
TP3: 57.0964
📈 Technical Outlook:
$TQQQ is showing strong bullish momentum after confirming strength near a key technical zone. The setup is supported by price is breaking above recent resistance, RSI supports bullish momentum, volume is expanding. As long as price holds above the entry area, buyers may continue pushing toward the listed targets.
#TQQQ #Crypto #BinanceSquare #Trading
Entry: 53.7782 – 54.1018
SL: 52.4670
TP1: 55.2026
TP2: 56.0443
TP3: 57.0964
📈 Technical Outlook:
$TQQQ is showing strong bullish momentum after confirming strength near a key technical zone. The setup is supported by price is breaking above recent resistance, RSI supports bullish momentum, volume is expanding. As long as price holds above the entry area, buyers may continue pushing toward the listed targets.
#TQQQ #Crypto #BinanceSquare #Trading

11
·
--
TQQQ is at a point of divergence; assess the conditions before taking a side.
Binance TradFi Perpetuals (traditional finance assets; high risk of price gaps outside trading hours) | TQQQ is up 9.20% over the past 24 hours, and momentum remains strong. For a continuation, watch for a pullback first. Current price is around 57.43, with 24-hour trading volume of around 229 million; the 30m volume ratio is only 0.4x, indicating weak participation. Market positioning: 72% of accounts are long; the taker buy/sell ratio is 1.24 (buyers have the edge); 30m open interest is down 0.4%.
Reference indicators: 30m RSI is 80.91, in overheated territory, suggesting buyers may be chasing too aggressively. The 30m ATR trend-band reference level is 55.327298; the current price is above it, suggesting the trend structure remains intact.
Which would you wait for first: whether the taker buy/sell ratio can stay above 1, or whether the 30m RSI can first fall back below 70?
#TQQQ #Unusual Movement Alert
TQQQ is at a point of divergence; assess the conditions before taking a side.
Binance TradFi Perpetuals (traditional finance assets; high risk of price gaps outside trading hours) | TQQQ is up 9.20% over the past 24 hours, and momentum remains strong. For a continuation, watch for a pullback first. Current price is around 57.43, with 24-hour trading volume of around 229 million; the 30m volume ratio is only 0.4x, indicating weak participation. Market positioning: 72% of accounts are long; the taker buy/sell ratio is 1.24 (buyers have the edge); 30m open interest is down 0.4%.
Reference indicators: 30m RSI is 80.91, in overheated territory, suggesting buyers may be chasing too aggressively. The 30m ATR trend-band reference level is 55.327298; the current price is above it, suggesting the trend structure remains intact.
Which would you wait for first: whether the taker buy/sell ratio can stay above 1, or whether the 30m RSI can first fall back below 70?
#TQQQ #Unusual Movement Alert
Binance TradFi Perpetuals (traditional finance assets; high risk of price gaps outside trading hours) | TQQQ is up 9.20% over the past 24 hours, and momentum remains strong. For a continuation, watch for a pullback first. Current price is around 57.43, with 24-hour trading volume of around 229 million; the 30m volume ratio is only 0.4x, indicating weak participation. Market positioning: 72% of accounts are long; the taker buy/sell ratio is 1.24 (buyers have the edge); 30m open interest is down 0.4%.
Reference indicators: 30m RSI is 80.91, in overheated territory, suggesting buyers may be chasing too aggressively. The 30m ATR trend-band reference level is 55.327298; the current price is above it, suggesting the trend structure remains intact.
Which would you wait for first: whether the taker buy/sell ratio can stay above 1, or whether the 30m RSI can first fall back below 70?
#TQQQ #Unusual Movement Alert
11
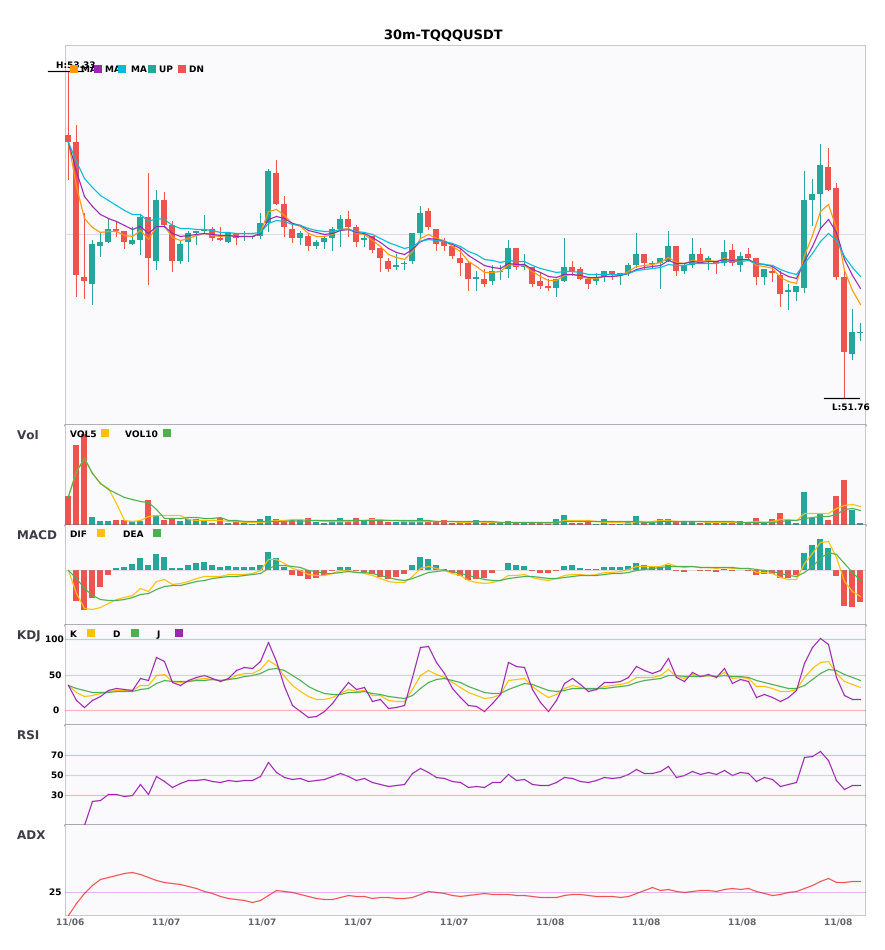
$MU / $SOXL / $TQQQ 30-minute timeframe bearish, short-term under pressure
📉 $MU | 30-minute bearish signal
━━━━━━━━━━━━━━━━━━
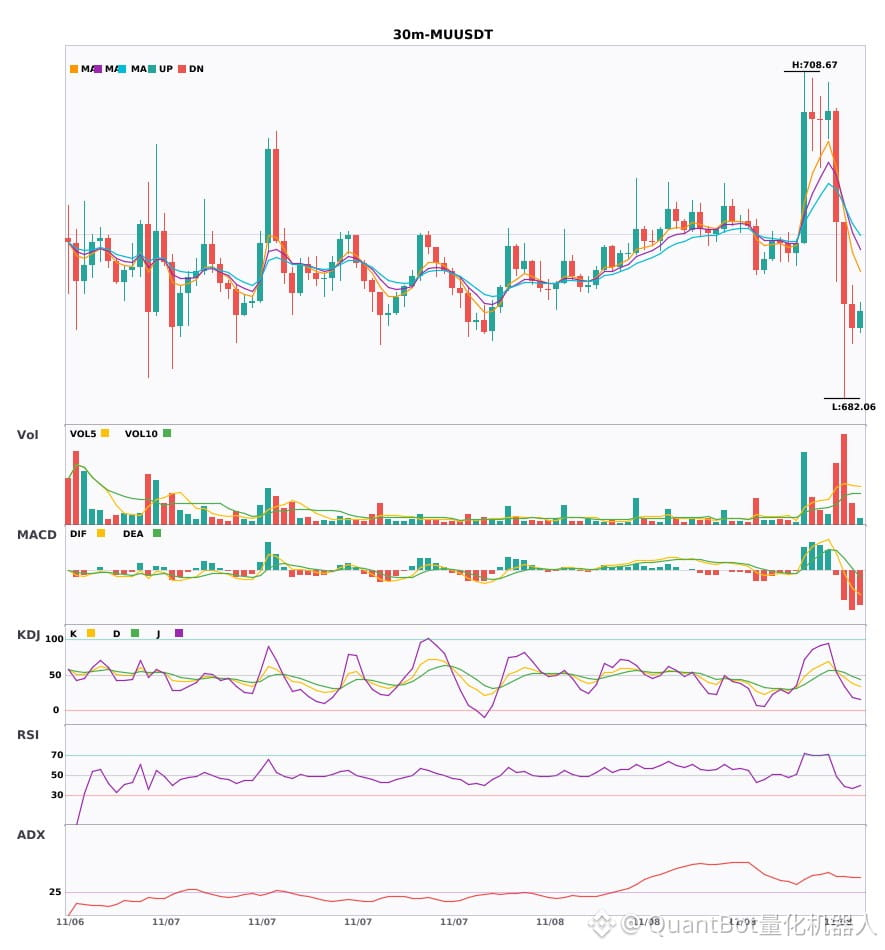
Technical analysis: ADX(43) Clear trending market | MACD bearish, trend weak, momentum strengthening | EMA5 below EMA8 below EMA13, bearish alignment | KDJ weak, bears have the advantage (K is 38.2, D is 48.0) | Volume surge (3.1x)
Price change: -0.2800%
📌 Market update: Binance Will Support Micron Technology (MU) Cash Dividend Distribution via bStocks
📉 $SOXL | 30-minute bearish signal
━━━━━━━━━━━━━━━━━━
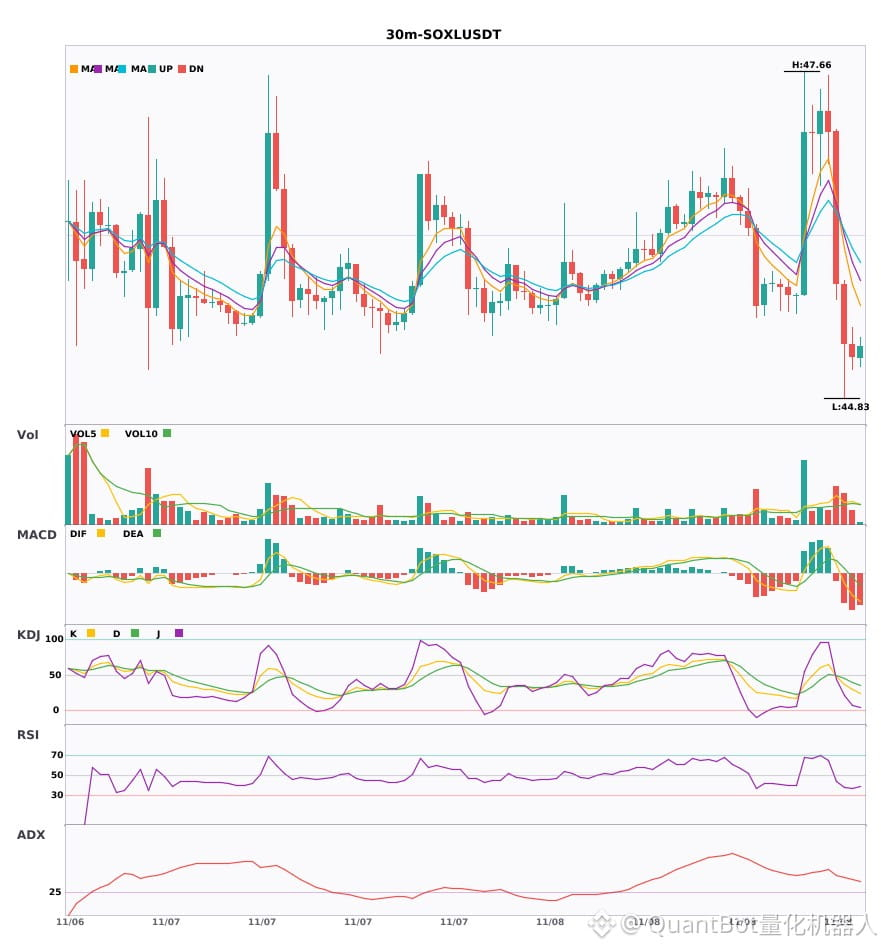
Technical analysis: ADX(44) Clear trending market | MACD DIF fell below the zero line, trend turning bearish | EMA5 crossed below EMA8, short-term trend turning bearish | KDJ weak, bears have the advantage (K is 37.3, D is 45.5) | Increased volume (2.0x)
Price change: -1.1300%
📉 $TQQQ | 30-minute bearish signal
━━━━━━━━━━━━━━━━━━
Technical analysis: ADX(40) Clear trending market | MACD DIF fell below the zero line, trend turning bearish | EMA5 crossed below EMA8, short-term trend turning bearish | Volume surge (3.0x)
Price change: -0.6900%
━━━━━━━━━━━━━━━━━━
#技术分析 #MU #SOXL #TQQQ
📌 The above content is for reference only and does not constitute investment advice
$MU / $SOXL / $TQQQ 30-minute timeframe bearish, short-term under pressure
📉 $MU | 30-minute bearish signal
━━━━━━━━━━━━━━━━━━
Technical analysis: ADX(43) Clear trending market | MACD bearish, trend weak, momentum strengthening | EMA5 below EMA8 below EMA13, bearish alignment | KDJ weak, bears have the advantage (K is 38.2, D is 48.0) | Volume surge (3.1x)
Price change: -0.2800%
📌 Market update: Binance Will Support Micron Technology (MU) Cash Dividend Distribution via bStocks
📉 $SOXL | 30-minute bearish signal
━━━━━━━━━━━━━━━━━━
Technical analysis: ADX(44) Clear trending market | MACD DIF fell below the zero line, trend turning bearish | EMA5 crossed below EMA8, short-term trend turning bearish | KDJ weak, bears have the advantage (K is 37.3, D is 45.5) | Increased volume (2.0x)
Price change: -1.1300%
📉 $TQQQ | 30-minute bearish signal
━━━━━━━━━━━━━━━━━━
Technical analysis: ADX(40) Clear trending market | MACD DIF fell below the zero line, trend turning bearish | EMA5 crossed below EMA8, short-term trend turning bearish | Volume surge (3.0x)
Price change: -0.6900%
━━━━━━━━━━━━━━━━━━
#技术分析 #MU #SOXL #TQQQ
📌 The above content is for reference only and does not constitute investment advice
📉 $MU | 30-minute bearish signal
━━━━━━━━━━━━━━━━━━
Technical analysis: ADX(43) Clear trending market | MACD bearish, trend weak, momentum strengthening | EMA5 below EMA8 below EMA13, bearish alignment | KDJ weak, bears have the advantage (K is 38.2, D is 48.0) | Volume surge (3.1x)
Price change: -0.2800%
📌 Market update: Binance Will Support Micron Technology (MU) Cash Dividend Distribution via bStocks
📉 $SOXL | 30-minute bearish signal
━━━━━━━━━━━━━━━━━━
Technical analysis: ADX(44) Clear trending market | MACD DIF fell below the zero line, trend turning bearish | EMA5 crossed below EMA8, short-term trend turning bearish | KDJ weak, bears have the advantage (K is 37.3, D is 45.5) | Increased volume (2.0x)
Price change: -1.1300%
📉 $TQQQ | 30-minute bearish signal
━━━━━━━━━━━━━━━━━━
Technical analysis: ADX(40) Clear trending market | MACD DIF fell below the zero line, trend turning bearish | EMA5 crossed below EMA8, short-term trend turning bearish | Volume surge (3.0x)
Price change: -0.6900%
━━━━━━━━━━━━━━━━━━
#技术分析 #MU #SOXL #TQQQ
📌 The above content is for reference only and does not constitute investment advice
37
·
--
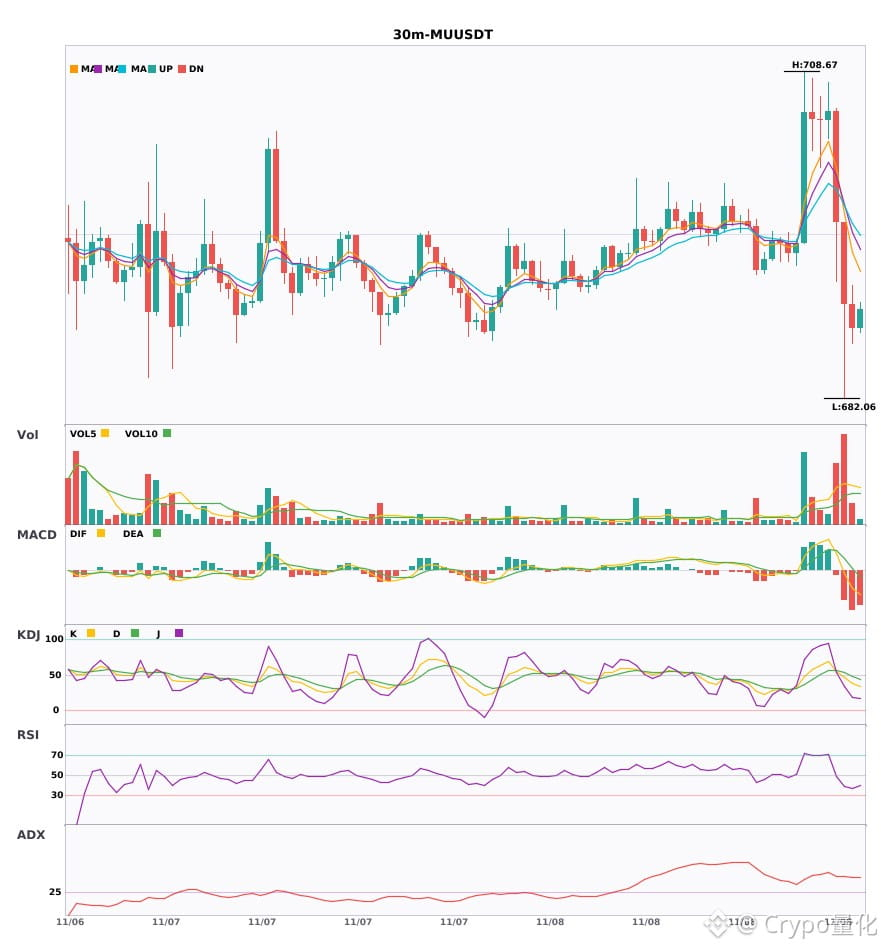
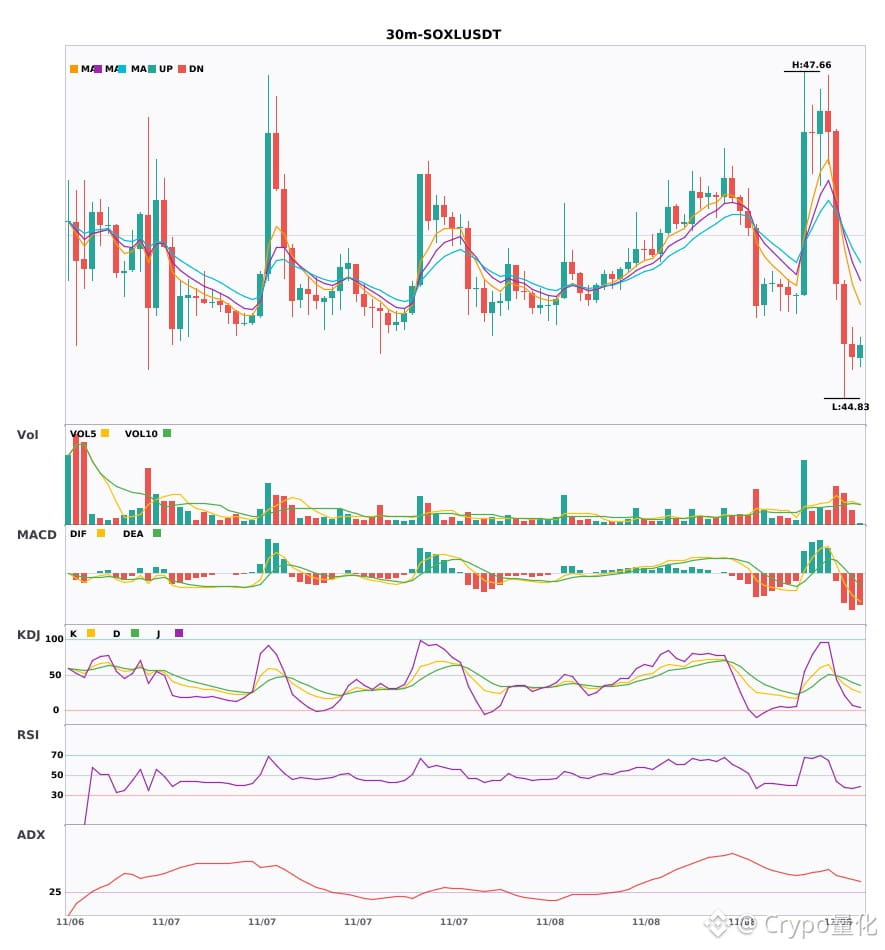
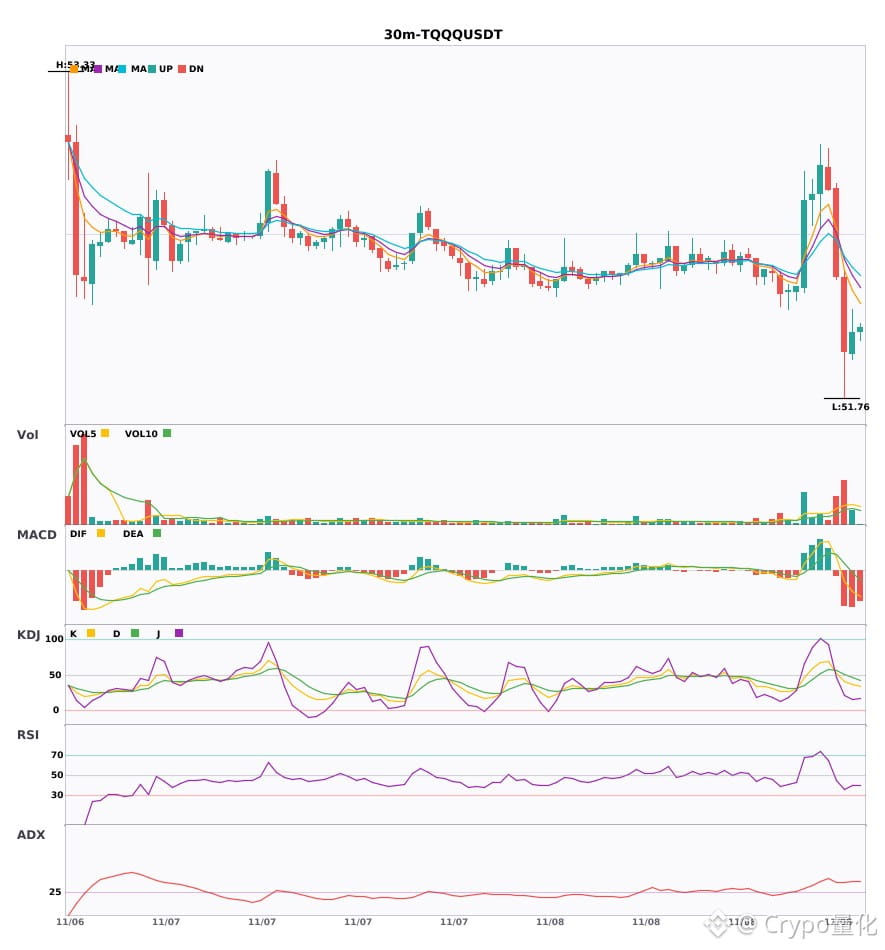
$MU / $SOXL / $TQQQ 30-minute bearish convergence, with bearish signals appearing simultaneously 🔥
════════════════════
🟢 $MU 30-minute bearish signal
⚠️ Technical analysis: ADX(43) indicates a clear trend | MACD is bearish, trend is weak and momentum is strengthening | EMA5 < EMA8 < EMA13, bearish alignment | KDJ is weak, bears are in control (K: 38.2, D: 48.0) | Volume surge (3.1x)
📢 Market update: Binance Will Support Micron Technology (MU) Cash Dividend Distribution via bStocks
════════════════════
🟢 $SOXL 30-minute bearish signal
⚠️ Technical analysis: ADX(44) indicates a clear trend | MACD DIF has fallen below the zero line, signaling a bearish trend reversal | EMA5 has crossed below EMA8, turning bearish in the short term | KDJ is weak, bears are in control (K: 37.3, D: 45.5) | Volume increase (2.0x)
════════════════════
🟢 $TQQQ 30-minute bearish signal
⚠️ Technical analysis: ADX(40) indicates a clear trend | MACD DIF has fallen below the zero line, signaling a bearish trend reversal | EMA5 has crossed below EMA8, turning bearish in the short term | Volume surge (3.0x)
════════════════════
🔔 Follow for real-time market alerts 🔔
#技术分析 #MU #SOXL #TQQQ
📌 When trading, check whether the candlestick pattern confirms the signal
$MU / $SOXL / $TQQQ 30-minute bearish convergence, with bearish signals appearing simultaneously 🔥
════════════════════
🟢 $MU 30-minute bearish signal
⚠️ Technical analysis: ADX(43) indicates a clear trend | MACD is bearish, trend is weak and momentum is strengthening | EMA5 < EMA8 < EMA13, bearish alignment | KDJ is weak, bears are in control (K: 38.2, D: 48.0) | Volume surge (3.1x)
📢 Market update: Binance Will Support Micron Technology (MU) Cash Dividend Distribution via bStocks
════════════════════
🟢 $SOXL 30-minute bearish signal
⚠️ Technical analysis: ADX(44) indicates a clear trend | MACD DIF has fallen below the zero line, signaling a bearish trend reversal | EMA5 has crossed below EMA8, turning bearish in the short term | KDJ is weak, bears are in control (K: 37.3, D: 45.5) | Volume increase (2.0x)
════════════════════
🟢 $TQQQ 30-minute bearish signal
⚠️ Technical analysis: ADX(40) indicates a clear trend | MACD DIF has fallen below the zero line, signaling a bearish trend reversal | EMA5 has crossed below EMA8, turning bearish in the short term | Volume surge (3.0x)
════════════════════
🔔 Follow for real-time market alerts 🔔
#技术分析 #MU #SOXL #TQQQ
📌 When trading, check whether the candlestick pattern confirms the signal
════════════════════
🟢 $MU 30-minute bearish signal
⚠️ Technical analysis: ADX(43) indicates a clear trend | MACD is bearish, trend is weak and momentum is strengthening | EMA5 < EMA8 < EMA13, bearish alignment | KDJ is weak, bears are in control (K: 38.2, D: 48.0) | Volume surge (3.1x)
📢 Market update: Binance Will Support Micron Technology (MU) Cash Dividend Distribution via bStocks
════════════════════
🟢 $SOXL 30-minute bearish signal
⚠️ Technical analysis: ADX(44) indicates a clear trend | MACD DIF has fallen below the zero line, signaling a bearish trend reversal | EMA5 has crossed below EMA8, turning bearish in the short term | KDJ is weak, bears are in control (K: 37.3, D: 45.5) | Volume increase (2.0x)
════════════════════
🟢 $TQQQ 30-minute bearish signal
⚠️ Technical analysis: ADX(40) indicates a clear trend | MACD DIF has fallen below the zero line, signaling a bearish trend reversal | EMA5 has crossed below EMA8, turning bearish in the short term | Volume surge (3.0x)
════════════════════
🔔 Follow for real-time market alerts 🔔
#技术分析 #MU #SOXL #TQQQ
📌 When trading, check whether the candlestick pattern confirms the signal
18
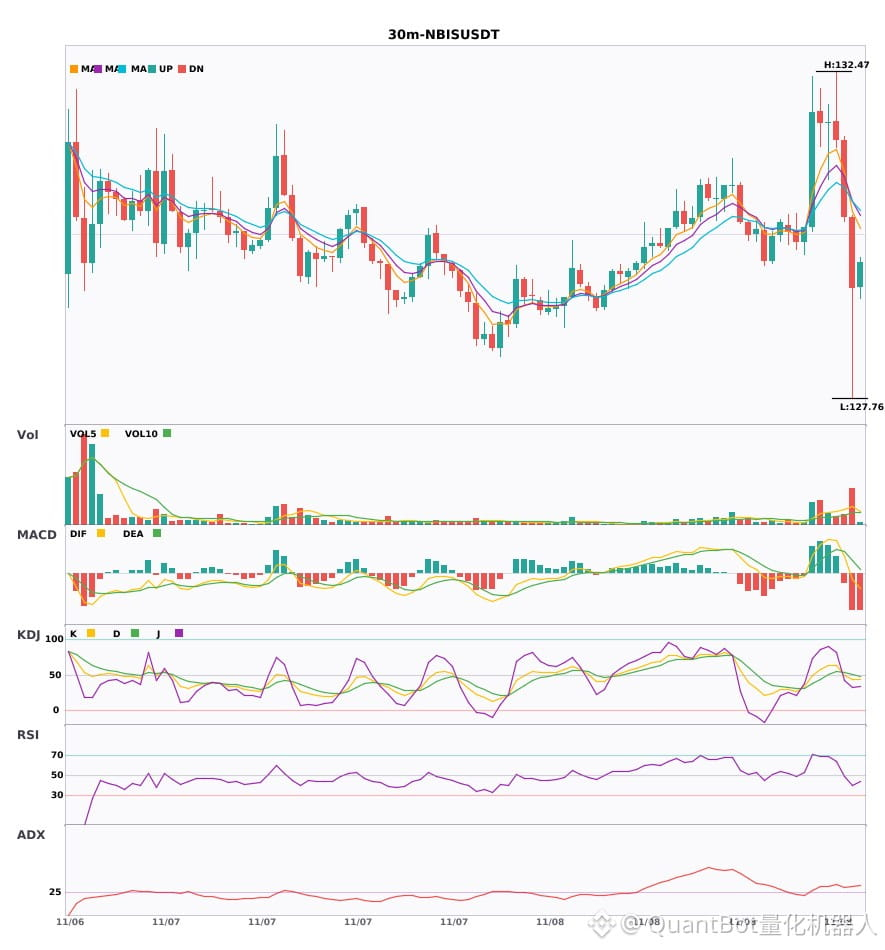
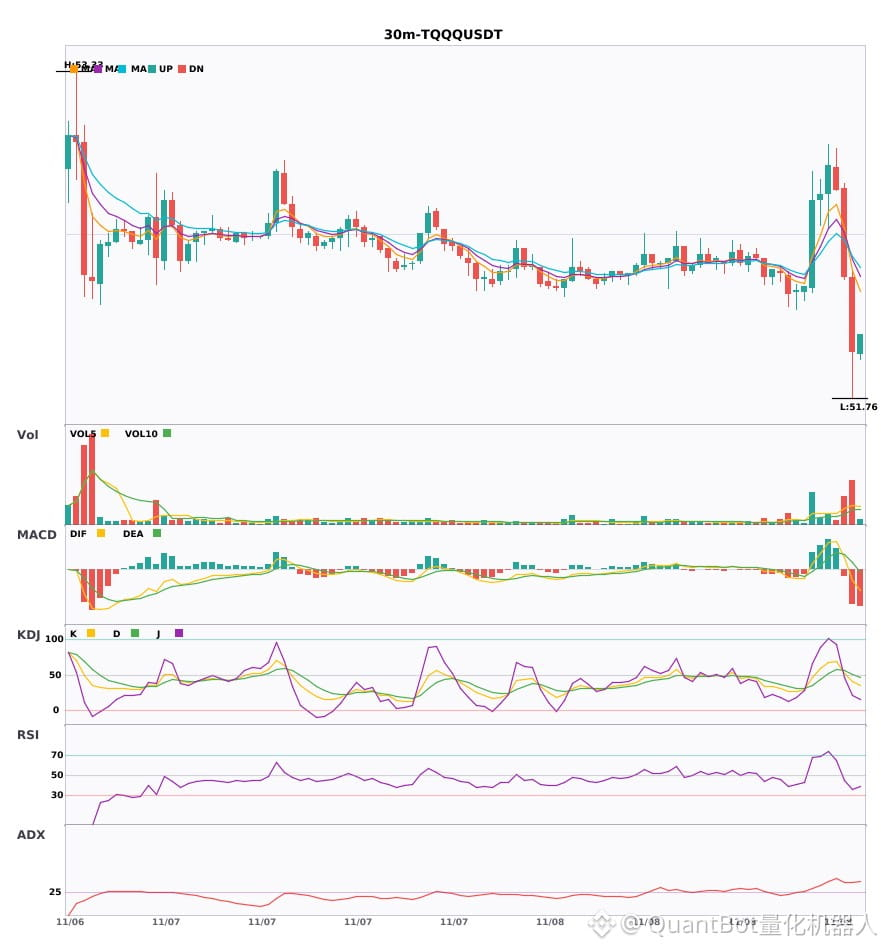
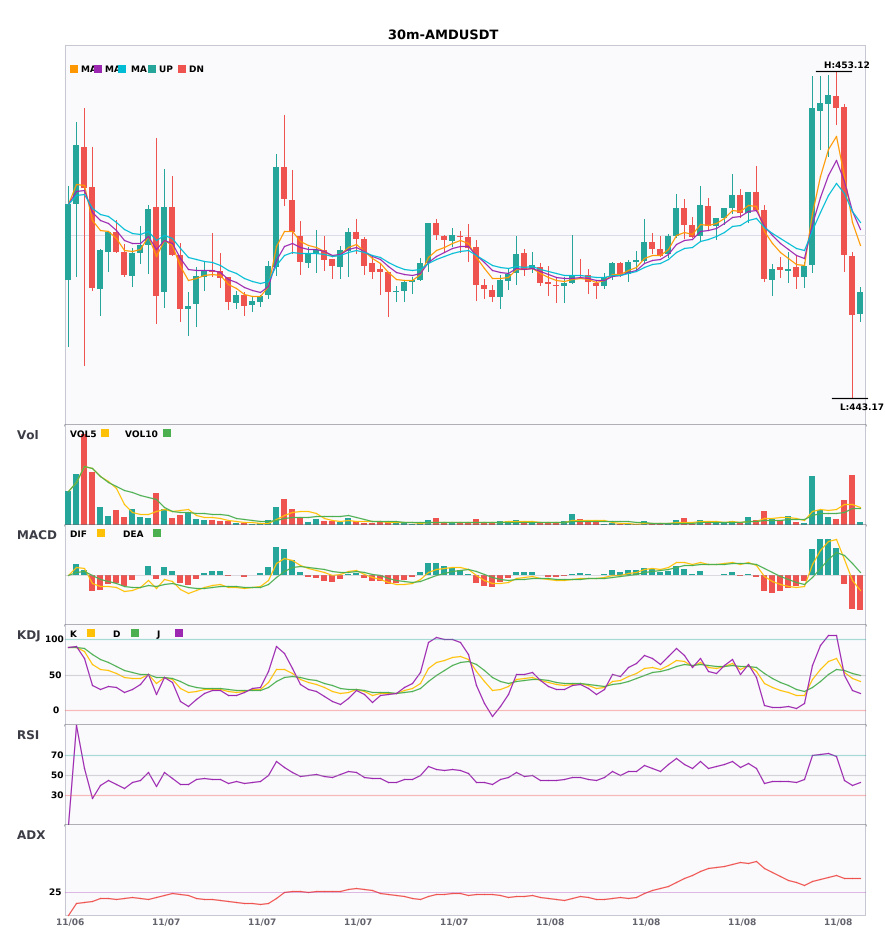
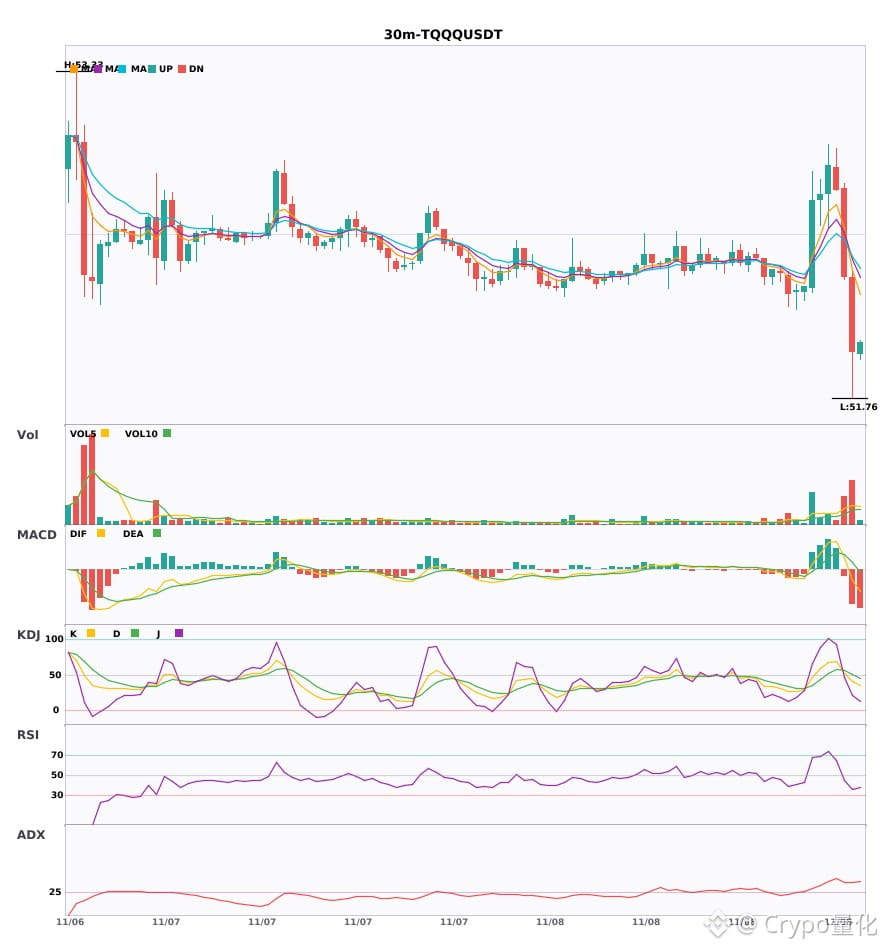
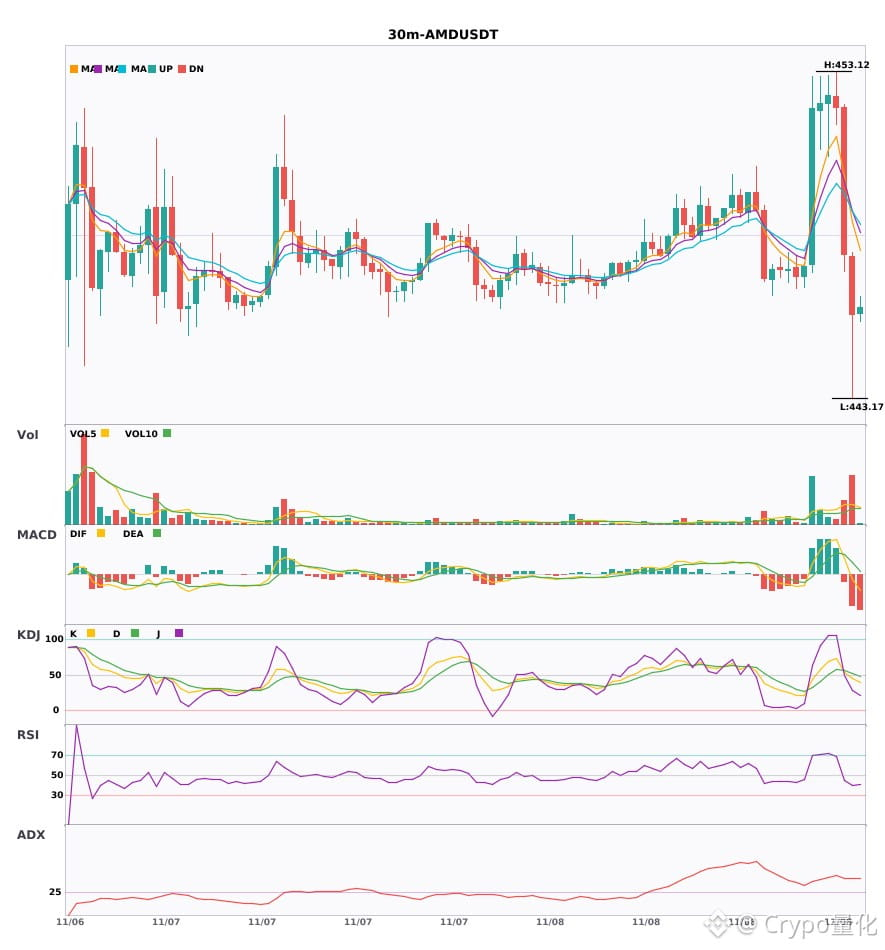
3 30-minute bearish alerts: $NBIS / $TQQQ / $AMD
📉 $NBIS | 30-minute bearish signal
━━━━━━━━━━━━━━━━━━
Technical analysis: ADX(33) indicates a clear trend | MACDDIF fell below zero, indicating a bearish trend | EMA5 crossed below EMA8, indicating a short-term bearish trend | Volume surge (2.9x)
Price change: -0.7900%
📉 $TQQQ | 30-minute bearish signal
━━━━━━━━━━━━━━━━━━
Technical analysis: ADX(40) indicates a clear trend | MACDDIF fell below zero, indicating a bearish trend | EMA5 crossed below EMA8, indicating a short-term bearish trend | Volume surge (3.0x)
Price change: -0.6900%
📉 $AMD | 30-minute bearish signal
━━━━━━━━━━━━━━━━━━
Technical analysis: ADX(43) indicates a clear trend | MACDDIF fell below zero, indicating a bearish trend | EMA5 crossed below EMA8, indicating a short-term bearish trend | Volume surge (2.9x)
Price change: -0.4000%
━━━━━━━━━━━━━━━━━━
#技术分析 #NBIS #TQQQ #AMD
📌 The above content is for reference only and does not constitute investment advice
3 30-minute bearish alerts: $NBIS / $TQQQ / $AMD
📉 $NBIS | 30-minute bearish signal
━━━━━━━━━━━━━━━━━━
Technical analysis: ADX(33) indicates a clear trend | MACDDIF fell below zero, indicating a bearish trend | EMA5 crossed below EMA8, indicating a short-term bearish trend | Volume surge (2.9x)
Price change: -0.7900%
📉 $TQQQ | 30-minute bearish signal
━━━━━━━━━━━━━━━━━━
Technical analysis: ADX(40) indicates a clear trend | MACDDIF fell below zero, indicating a bearish trend | EMA5 crossed below EMA8, indicating a short-term bearish trend | Volume surge (3.0x)
Price change: -0.6900%
📉 $AMD | 30-minute bearish signal
━━━━━━━━━━━━━━━━━━
Technical analysis: ADX(43) indicates a clear trend | MACDDIF fell below zero, indicating a bearish trend | EMA5 crossed below EMA8, indicating a short-term bearish trend | Volume surge (2.9x)
Price change: -0.4000%
━━━━━━━━━━━━━━━━━━
#技术分析 #NBIS #TQQQ #AMD
📌 The above content is for reference only and does not constitute investment advice
📉 $NBIS | 30-minute bearish signal
━━━━━━━━━━━━━━━━━━
Technical analysis: ADX(33) indicates a clear trend | MACDDIF fell below zero, indicating a bearish trend | EMA5 crossed below EMA8, indicating a short-term bearish trend | Volume surge (2.9x)
Price change: -0.7900%
📉 $TQQQ | 30-minute bearish signal
━━━━━━━━━━━━━━━━━━
Technical analysis: ADX(40) indicates a clear trend | MACDDIF fell below zero, indicating a bearish trend | EMA5 crossed below EMA8, indicating a short-term bearish trend | Volume surge (3.0x)
Price change: -0.6900%
📉 $AMD | 30-minute bearish signal
━━━━━━━━━━━━━━━━━━
Technical analysis: ADX(43) indicates a clear trend | MACDDIF fell below zero, indicating a bearish trend | EMA5 crossed below EMA8, indicating a short-term bearish trend | Volume surge (2.9x)
Price change: -0.4000%
━━━━━━━━━━━━━━━━━━
#技术分析 #NBIS #TQQQ #AMD
📌 The above content is for reference only and does not constitute investment advice
8
·
--
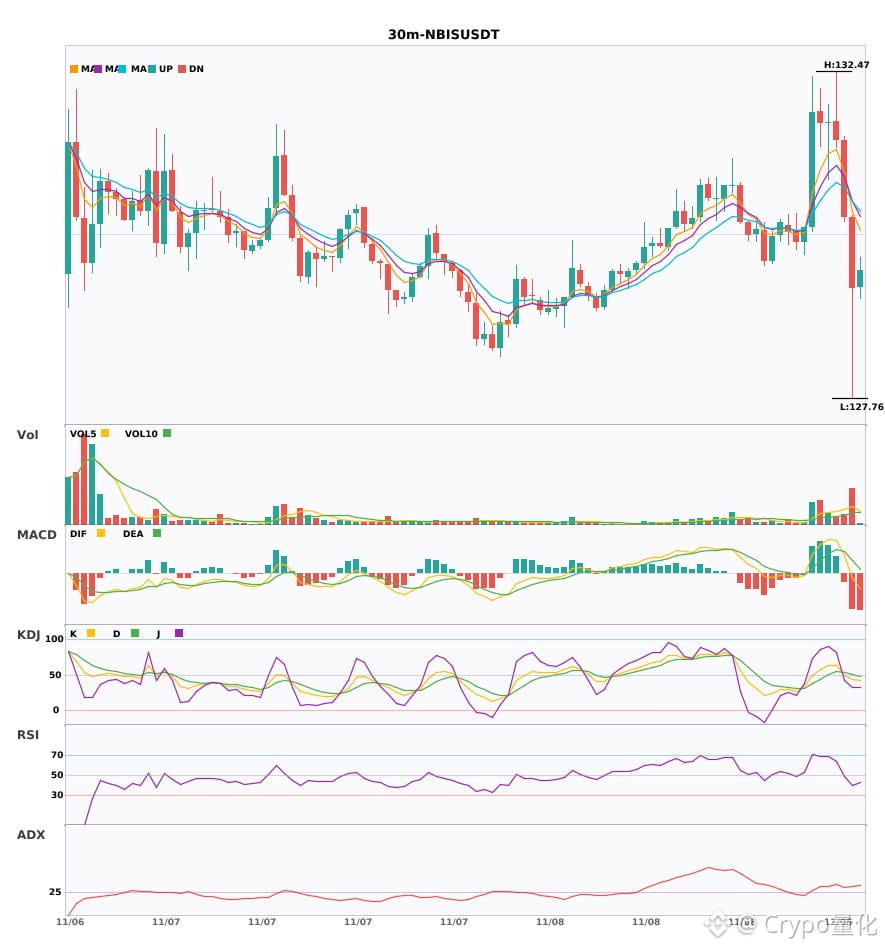
$NBIS / $TQQQ / $AMD 30-minute confluence turns bearish; bearish signals appear simultaneously 🔥
════════════════════
🟢 $NBIS 30-minute bearish signal
⚠️ Technical analysis: ADX(33) indicates a clear trending market | MACD DIF falls below the zero line, turning the trend bearish | EMA5 crosses below EMA8, signaling a short-term bearish trend | Volume surges (2.9x)
════════════════════
🟢 $TQQQ 30-minute bearish signal
⚠️ Technical analysis: ADX(40) indicates a clear trending market | MACD DIF falls below the zero line, turning the trend bearish | EMA5 crosses below EMA8, signaling a short-term bearish trend | Volume surges (3.0x)
════════════════════
🟢 $AMD 30-minute bearish signal
⚠️ Technical analysis: ADX(43) indicates a clear trending market | MACD DIF falls below the zero line, turning the trend bearish | EMA5 crosses below EMA8, signaling a short-term bearish trend | Volume surges (2.9x)
════════════════════
🔔 Follow us for real-time market updates 🔔
#技术分析 #NBIS #TQQQ #AMD
📌 When trading, pay attention to whether the candlestick pattern confirms the signal
$NBIS / $TQQQ / $AMD 30-minute confluence turns bearish; bearish signals appear simultaneously 🔥
════════════════════
🟢 $NBIS 30-minute bearish signal
⚠️ Technical analysis: ADX(33) indicates a clear trending market | MACD DIF falls below the zero line, turning the trend bearish | EMA5 crosses below EMA8, signaling a short-term bearish trend | Volume surges (2.9x)
════════════════════
🟢 $TQQQ 30-minute bearish signal
⚠️ Technical analysis: ADX(40) indicates a clear trending market | MACD DIF falls below the zero line, turning the trend bearish | EMA5 crosses below EMA8, signaling a short-term bearish trend | Volume surges (3.0x)
════════════════════
🟢 $AMD 30-minute bearish signal
⚠️ Technical analysis: ADX(43) indicates a clear trending market | MACD DIF falls below the zero line, turning the trend bearish | EMA5 crosses below EMA8, signaling a short-term bearish trend | Volume surges (2.9x)
════════════════════
🔔 Follow us for real-time market updates 🔔
#技术分析 #NBIS #TQQQ #AMD
📌 When trading, pay attention to whether the candlestick pattern confirms the signal
════════════════════
🟢 $NBIS 30-minute bearish signal
⚠️ Technical analysis: ADX(33) indicates a clear trending market | MACD DIF falls below the zero line, turning the trend bearish | EMA5 crosses below EMA8, signaling a short-term bearish trend | Volume surges (2.9x)
════════════════════
🟢 $TQQQ 30-minute bearish signal
⚠️ Technical analysis: ADX(40) indicates a clear trending market | MACD DIF falls below the zero line, turning the trend bearish | EMA5 crosses below EMA8, signaling a short-term bearish trend | Volume surges (3.0x)
════════════════════
🟢 $AMD 30-minute bearish signal
⚠️ Technical analysis: ADX(43) indicates a clear trending market | MACD DIF falls below the zero line, turning the trend bearish | EMA5 crosses below EMA8, signaling a short-term bearish trend | Volume surges (2.9x)
════════════════════
🔔 Follow us for real-time market updates 🔔
#技术分析 #NBIS #TQQQ #AMD
📌 When trading, pay attention to whether the candlestick pattern confirms the signal
4
·
--
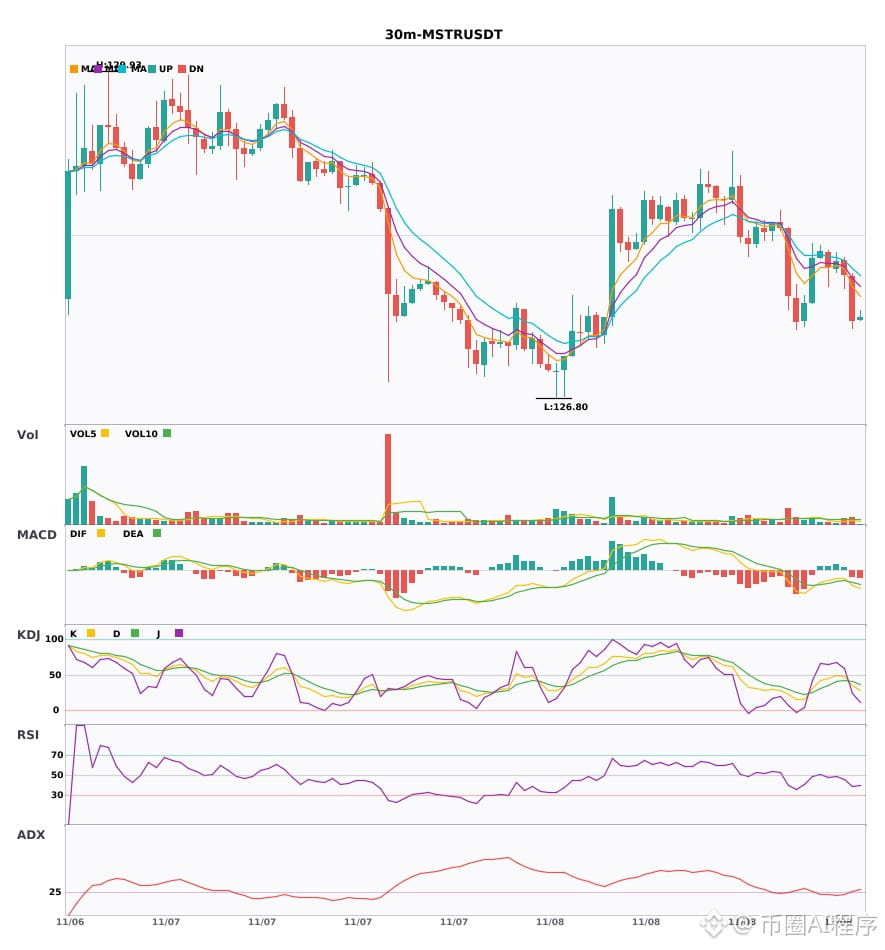
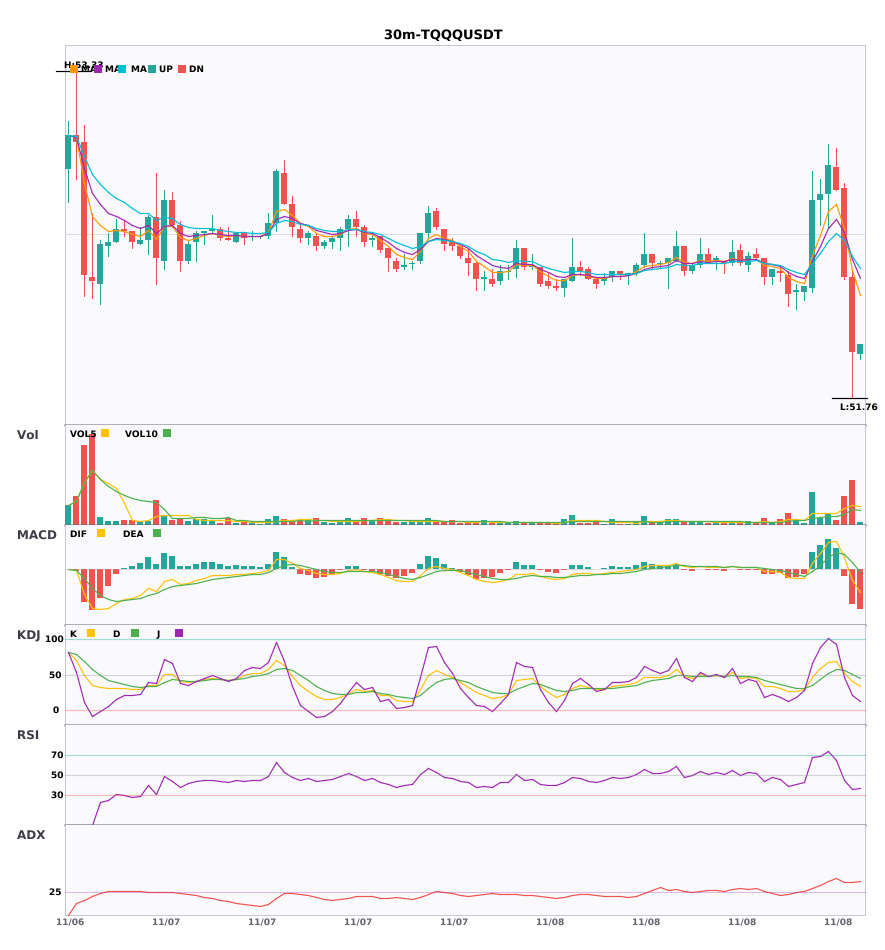
$MSTR / $TQQQ 30-minute shorts + 4-hour shorts aligned; multi-timeframe confluence turns bearish 🔥
════════════════════
🟢 $MSTR 30-minute short signal
⚠️ Technical analysis: 4-hour bearish confluence confirmed | 30-minute entry: MACD bearish crossover below zero, bearish momentum accelerating | EMA5 < EMA8 < EMA13, bearish alignment | KDJ bearish crossover, short-term outlook bearish (K=34.8, D=40.2) | Volume normal (1.4x)
════════════════════
🟢 $TQQQ 30-minute short signal
⚠️ Technical analysis: 4-hour bearish confluence confirmed | 30-minute entry: MACD DIF falls below zero, trend turns bearish | EMA5 crosses below EMA8, short-term outlook turns bearish | Volume surges (3.0x)
════════════════════
🔔 Follow to get real-time market updates 🔔
#多周期共振 #MSTR #TQQQ
📌 When trading, pay attention to whether the candlestick pattern matches
$MSTR / $TQQQ 30-minute shorts + 4-hour shorts aligned; multi-timeframe confluence turns bearish 🔥
════════════════════
🟢 $MSTR 30-minute short signal
⚠️ Technical analysis: 4-hour bearish confluence confirmed | 30-minute entry: MACD bearish crossover below zero, bearish momentum accelerating | EMA5 < EMA8 < EMA13, bearish alignment | KDJ bearish crossover, short-term outlook bearish (K=34.8, D=40.2) | Volume normal (1.4x)
════════════════════
🟢 $TQQQ 30-minute short signal
⚠️ Technical analysis: 4-hour bearish confluence confirmed | 30-minute entry: MACD DIF falls below zero, trend turns bearish | EMA5 crosses below EMA8, short-term outlook turns bearish | Volume surges (3.0x)
════════════════════
🔔 Follow to get real-time market updates 🔔
#多周期共振 #MSTR #TQQQ
📌 When trading, pay attention to whether the candlestick pattern matches
════════════════════
🟢 $MSTR 30-minute short signal
⚠️ Technical analysis: 4-hour bearish confluence confirmed | 30-minute entry: MACD bearish crossover below zero, bearish momentum accelerating | EMA5 < EMA8 < EMA13, bearish alignment | KDJ bearish crossover, short-term outlook bearish (K=34.8, D=40.2) | Volume normal (1.4x)
════════════════════
🟢 $TQQQ 30-minute short signal
⚠️ Technical analysis: 4-hour bearish confluence confirmed | 30-minute entry: MACD DIF falls below zero, trend turns bearish | EMA5 crosses below EMA8, short-term outlook turns bearish | Volume surges (3.0x)
════════════════════
🔔 Follow to get real-time market updates 🔔
#多周期共振 #MSTR #TQQQ
📌 When trading, pay attention to whether the candlestick pattern matches
30
·
--
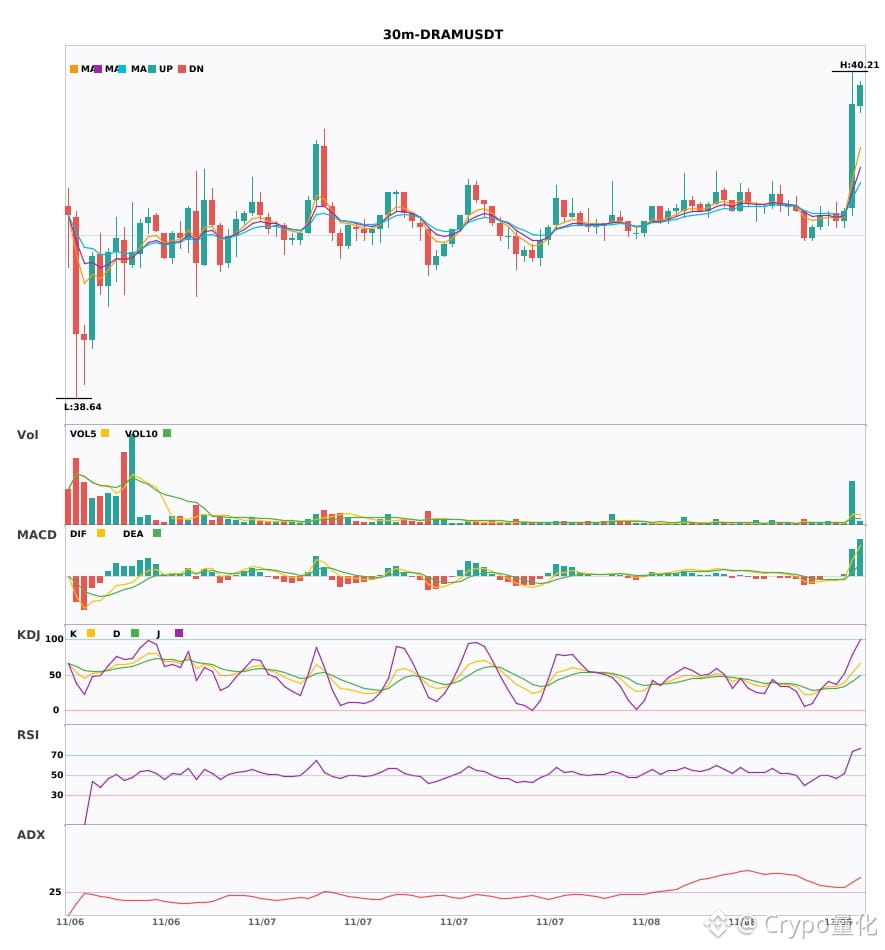
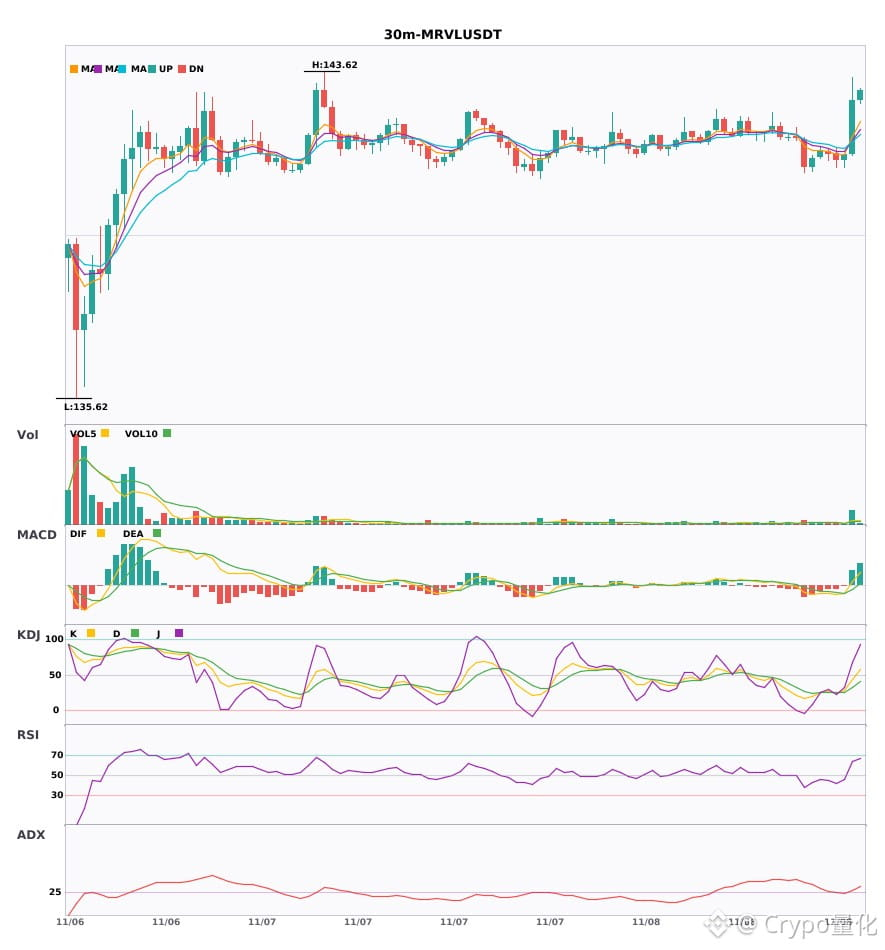
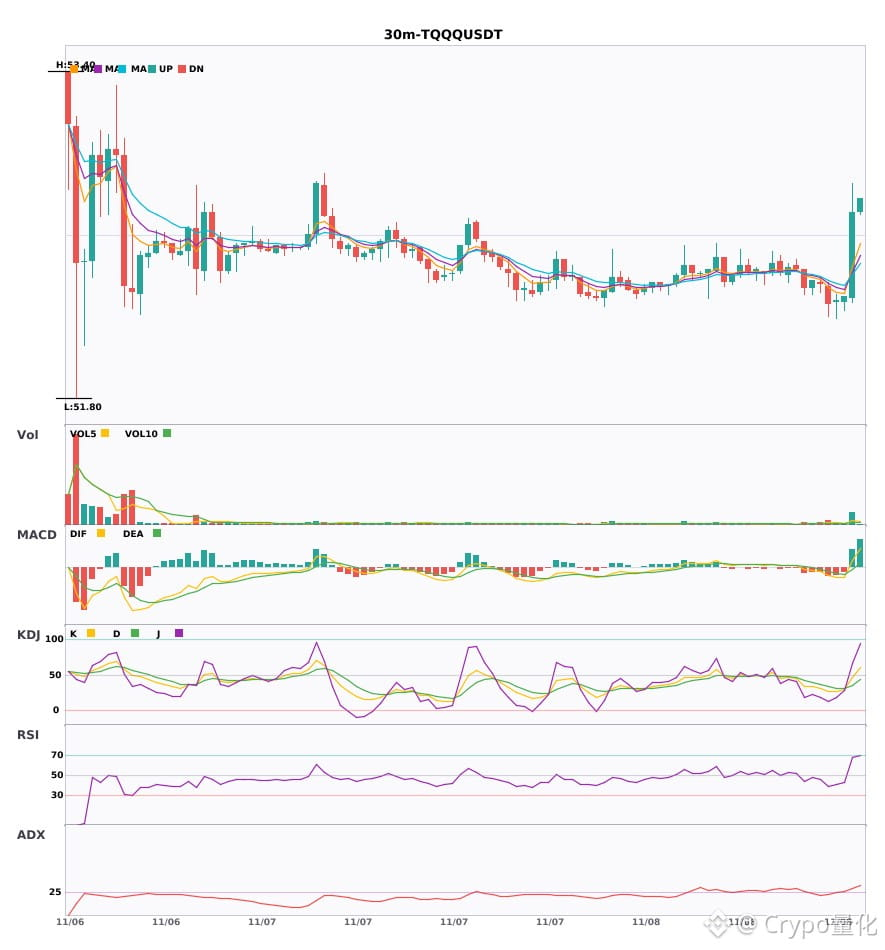
$DRAM / $MRVL / $TQQQ 30-minute confluence turns bullish; bullish signals appear simultaneously🔥
════════════════════
🔴 $DRAM 30-minute bullish signal
⚠️Technical: ADX(36) indicates a clear trending market | MACD DIF breaks above zero, trend turns bullish | EMA5 crosses above EMA8, short-term outlook turns bullish | Volume surge (6.9x)
════════════════════
🔴 $MRVL 30-minute bullish signal
⚠️Technical: ADX(30) trend is forming, opportunity to participate | MACD golden cross above zero, bullish momentum released | EMA5 crosses above EMA8, short-term outlook turns bullish | KDJ is weak, bears have the upper hand (K: 43.9, D: 32.0) | Volume surge (4.9x)
════════════════════
🔴 $TQQQ 30-minute bullish signal
⚠️Technical: ADX(33) indicates a clear trending market | MACD golden cross above zero, bullish momentum released | EMA5 crosses above EMA8, short-term outlook turns bullish | KDJ golden cross, short-term outlook bullish (K: 46.1, D: 35.8) | Volume surge (4.6x)
════════════════════
🔔 Follow for first-hand market updates 🔔
#技术分析 #DRAM #MRVL #TQQQ
📌 When trading, pay attention to whether the candlestick pattern confirms the signal
$DRAM / $MRVL / $TQQQ 30-minute confluence turns bullish; bullish signals appear simultaneously🔥
════════════════════
🔴 $DRAM 30-minute bullish signal
⚠️Technical: ADX(36) indicates a clear trending market | MACD DIF breaks above zero, trend turns bullish | EMA5 crosses above EMA8, short-term outlook turns bullish | Volume surge (6.9x)
════════════════════
🔴 $MRVL 30-minute bullish signal
⚠️Technical: ADX(30) trend is forming, opportunity to participate | MACD golden cross above zero, bullish momentum released | EMA5 crosses above EMA8, short-term outlook turns bullish | KDJ is weak, bears have the upper hand (K: 43.9, D: 32.0) | Volume surge (4.9x)
════════════════════
🔴 $TQQQ 30-minute bullish signal
⚠️Technical: ADX(33) indicates a clear trending market | MACD golden cross above zero, bullish momentum released | EMA5 crosses above EMA8, short-term outlook turns bullish | KDJ golden cross, short-term outlook bullish (K: 46.1, D: 35.8) | Volume surge (4.6x)
════════════════════
🔔 Follow for first-hand market updates 🔔
#技术分析 #DRAM #MRVL #TQQQ
📌 When trading, pay attention to whether the candlestick pattern confirms the signal
════════════════════
🔴 $DRAM 30-minute bullish signal
⚠️Technical: ADX(36) indicates a clear trending market | MACD DIF breaks above zero, trend turns bullish | EMA5 crosses above EMA8, short-term outlook turns bullish | Volume surge (6.9x)
════════════════════
🔴 $MRVL 30-minute bullish signal
⚠️Technical: ADX(30) trend is forming, opportunity to participate | MACD golden cross above zero, bullish momentum released | EMA5 crosses above EMA8, short-term outlook turns bullish | KDJ is weak, bears have the upper hand (K: 43.9, D: 32.0) | Volume surge (4.9x)
════════════════════
🔴 $TQQQ 30-minute bullish signal
⚠️Technical: ADX(33) indicates a clear trending market | MACD golden cross above zero, bullish momentum released | EMA5 crosses above EMA8, short-term outlook turns bullish | KDJ golden cross, short-term outlook bullish (K: 46.1, D: 35.8) | Volume surge (4.6x)
════════════════════
🔔 Follow for first-hand market updates 🔔
#技术分析 #DRAM #MRVL #TQQQ
📌 When trading, pay attention to whether the candlestick pattern confirms the signal
1

·
--
📊 $TQQQ Check
$TQQQ is down about 2% over the past year, yet it has averaged around 39% a year since its 2010 launch.
Does that make this a buying opportunity, or is the past performance misleading? It's a 3x leveraged fund, so the swings cut both ways.
Do your own research, keep size light and manage your risk carefully.
What's your take, buy the dip or stay away? 👇
#TQQQ #Nasdaq #Leverage #USNovemberMichiganExpectationsIndexPrelimAt50.9
📊 $TQQQ Check
$TQQQ is down about 2% over the past year, yet it has averaged around 39% a year since its 2010 launch.
Does that make this a buying opportunity, or is the past performance misleading? It's a 3x leveraged fund, so the swings cut both ways.
Do your own research, keep size light and manage your risk carefully.
What's your take, buy the dip or stay away? 👇
#TQQQ #Nasdaq #Leverage #USNovemberMichiganExpectationsIndexPrelimAt50.9
$TQQQ is down about 2% over the past year, yet it has averaged around 39% a year since its 2010 launch.
Does that make this a buying opportunity, or is the past performance misleading? It's a 3x leveraged fund, so the swings cut both ways.
Do your own research, keep size light and manage your risk carefully.
What's your take, buy the dip or stay away? 👇
#TQQQ #Nasdaq #Leverage #USNovemberMichiganExpectationsIndexPrelimAt50.9

1
33

·
--
Partly True
🚨 $TQQQ BULLS TAKE A HIT! $73.2K LONG LIQUIDATION EXPOSES MARKET PRESSURE! 🔴
The leveraged Nasdaq bulls just faced another painful shakeout!
📉 Liquidation Breakdown:
- Asset: $TQQQ
- Liquidated Position: Long
- Liquidation Value: $73,200
- Liquidation Price: $52.17
⚠️ What's Happening?
A $73.2K long liquidation at $52.17 signals that bullish leveraged traders were caught on the wrong side of the move. This could indicate weakening short-term momentum and increased downside pressure.
🎯 My Next Move Outlook:
Bearish Scenario: If TQQQ struggles to reclaim $52.17, further selling pressure could push price toward lower support zones.
Bullish Recovery: A strong rebound above $52.17, followed by sustained buying volume, could bring dip buyers back into the market.
🔥 Signal Provider Verdict: Avoid chasing leveraged longs until price confirms a recovery. Watch the $52.17 area closely — the next reaction could reveal whether bulls are ready to fight back or bears still control momentum.
Stay disciplined. Protect your capital. Let confirmation lead the trade!
#TQQQ
#Liquidation
#TradingSignals
#TradFiForBeginners
#AnthropicIPOValuationDoubts
{etf_us}(TQQQ.ETF)
🚨 $TQQQ BULLS TAKE A HIT! $73.2K LONG LIQUIDATION EXPOSES MARKET PRESSURE! 🔴
The leveraged Nasdaq bulls just faced another painful shakeout!
📉 Liquidation Breakdown:
- Asset: $TQQQ
- Liquidated Position: Long
- Liquidation Value: $73,200
- Liquidation Price: $52.17
⚠️ What's Happening?
A $73.2K long liquidation at $52.17 signals that bullish leveraged traders were caught on the wrong side of the move. This could indicate weakening short-term momentum and increased downside pressure.
🎯 My Next Move Outlook:
Bearish Scenario: If TQQQ struggles to reclaim $52.17, further selling pressure could push price toward lower support zones.
Bullish Recovery: A strong rebound above $52.17, followed by sustained buying volume, could bring dip buyers back into the market.
🔥 Signal Provider Verdict: Avoid chasing leveraged longs until price confirms a recovery. Watch the $52.17 area closely — the next reaction could reveal whether bulls are ready to fight back or bears still control momentum.
Stay disciplined. Protect your capital. Let confirmation lead the trade!
#TQQQ
#Liquidation
#TradingSignals
#TradFiForBeginners
#AnthropicIPOValuationDoubts
The leveraged Nasdaq bulls just faced another painful shakeout!
📉 Liquidation Breakdown:
- Asset: $TQQQ
- Liquidated Position: Long
- Liquidation Value: $73,200
- Liquidation Price: $52.17
⚠️ What's Happening?
A $73.2K long liquidation at $52.17 signals that bullish leveraged traders were caught on the wrong side of the move. This could indicate weakening short-term momentum and increased downside pressure.
🎯 My Next Move Outlook:
Bearish Scenario: If TQQQ struggles to reclaim $52.17, further selling pressure could push price toward lower support zones.
Bullish Recovery: A strong rebound above $52.17, followed by sustained buying volume, could bring dip buyers back into the market.
🔥 Signal Provider Verdict: Avoid chasing leveraged longs until price confirms a recovery. Watch the $52.17 area closely — the next reaction could reveal whether bulls are ready to fight back or bears still control momentum.
Stay disciplined. Protect your capital. Let confirmation lead the trade!
#TQQQ
#Liquidation
#TradingSignals
#TradFiForBeginners
#AnthropicIPOValuationDoubts
TQQQ-1.84%
TQQQETF-6.05%
613
Log in to explore more content
Join global crypto users on Binance Square
⚡️ Get latest and useful information about crypto.
💬 Trusted by the world’s largest crypto exchange.
👍 Discover real insights from verified creators.
Email / Phone number
Trending Topics
1
#CryptoSelloffTriggersMultipleWhaleLiquidations
3,297 views
122 Discussing
2
#USSpotXRPETFsSeeLargestWeeklyOutflowIn8Months
45,691 views
555 Discussing
3
#WillFOMCMinutesReinforceRateHikeExpectations?
997 views
42 Discussing
4
#BitcoinActiveSupplyInProfitDropsBelow45%
104,661 views
965 Discussing
5
#TONStrategyReports$23.97MQ3NetLoss
12,566 views
66 Discussing
6
#KavaSaysAbnormalActivityLimitedToKavaLend
68,271 views
530 Discussing
7
#WORPTLetsTouristsConvertCryptoToThaiBaht
13,534 views
164 Discussing
8
#WhoWillSucceedJensenHuangatNvidia?
222,249 views
1,870 Discussing
9
#WhatWillDriveCryptoandStocks’NextRebound?
661,907 views
3,681 Discussing
10
#TradFiForBeginners
763,076 views
4,644 Discussing