
#priceactionpower
priceactionpower
2,827 views
32 Discussing
Hot
Latest

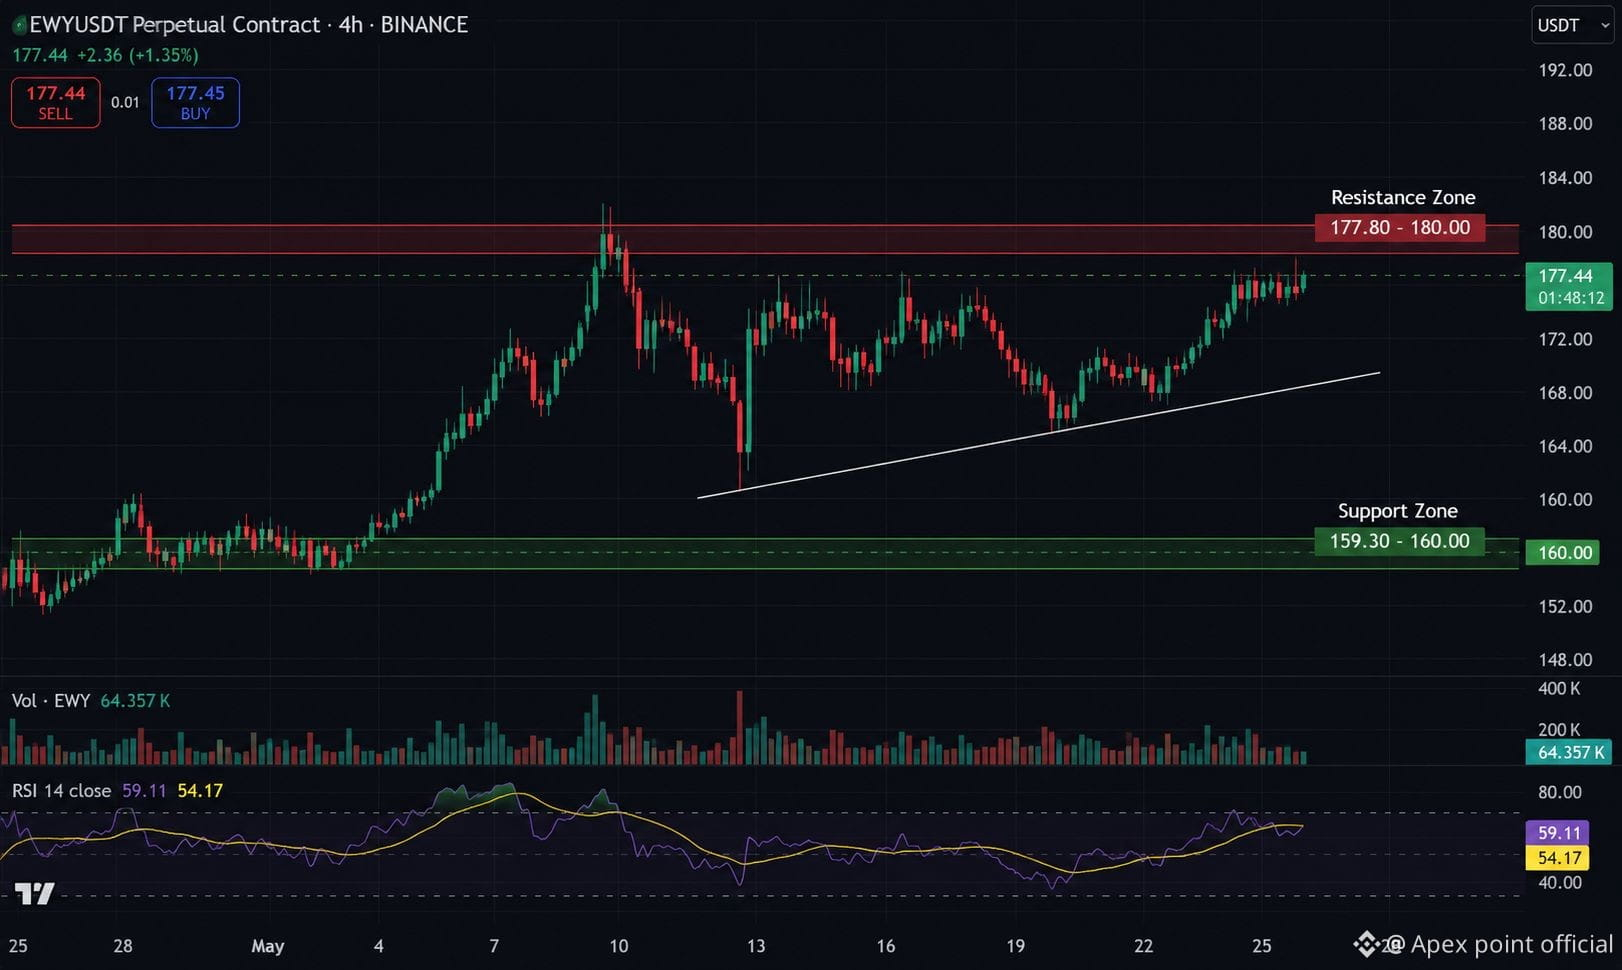
🚨 $EWYB Market Update — Is a Breakout Coming?
💰 Current Price: 177.44 USDT
📊 Key Levels to Watch: 🔹 Resistance: 177.80 – 180.00 USDT
🔸 Support: 159.30 – 160.00 USDT
📈 Market Outlook
$EWYB is currently trading near a critical resistance zone. A strong close above 177.80 USDT with increasing volume could confirm a bullish breakout and open the door for further upside.
On the downside, if the price loses the 159.30 USDT support zone, sellers may regain control and trigger a deeper correction.
✅ What Traders Should Watch
✔️ Wait for candle confirmation before entering.
✔️ Confirm every breakout with strong trading volume.
✔️ Avoid FOMO—let the market come to you.
✔️ Always trade with proper risk management and a stop-loss.
Successful traders react to price action—they don't predict it.
DYOR (Do Your Own Research). This is not financial advice.
#EWYUSDT #TradingCommunity #BinanceSquareTalks #PriceActionPower #RiskManagement
{spot}(EWYBUSDT)
🚨 $EWYB Market Update — Is a Breakout Coming?
💰 Current Price: 177.44 USDT
📊 Key Levels to Watch: 🔹 Resistance: 177.80 – 180.00 USDT
🔸 Support: 159.30 – 160.00 USDT
📈 Market Outlook
$EWYB is currently trading near a critical resistance zone. A strong close above 177.80 USDT with increasing volume could confirm a bullish breakout and open the door for further upside.
On the downside, if the price loses the 159.30 USDT support zone, sellers may regain control and trigger a deeper correction.
✅ What Traders Should Watch
✔️ Wait for candle confirmation before entering.
✔️ Confirm every breakout with strong trading volume.
✔️ Avoid FOMO—let the market come to you.
✔️ Always trade with proper risk management and a stop-loss.
Successful traders react to price action—they don't predict it.
DYOR (Do Your Own Research). This is not financial advice.
#EWYUSDT #TradingCommunity #BinanceSquareTalks #PriceActionPower #RiskManagement
💰 Current Price: 177.44 USDT
📊 Key Levels to Watch: 🔹 Resistance: 177.80 – 180.00 USDT
🔸 Support: 159.30 – 160.00 USDT
📈 Market Outlook
$EWYB is currently trading near a critical resistance zone. A strong close above 177.80 USDT with increasing volume could confirm a bullish breakout and open the door for further upside.
On the downside, if the price loses the 159.30 USDT support zone, sellers may regain control and trigger a deeper correction.
✅ What Traders Should Watch
✔️ Wait for candle confirmation before entering.
✔️ Confirm every breakout with strong trading volume.
✔️ Avoid FOMO—let the market come to you.
✔️ Always trade with proper risk management and a stop-loss.
Successful traders react to price action—they don't predict it.
DYOR (Do Your Own Research). This is not financial advice.
#EWYUSDT #TradingCommunity #BinanceSquareTalks #PriceActionPower #RiskManagement
1
90

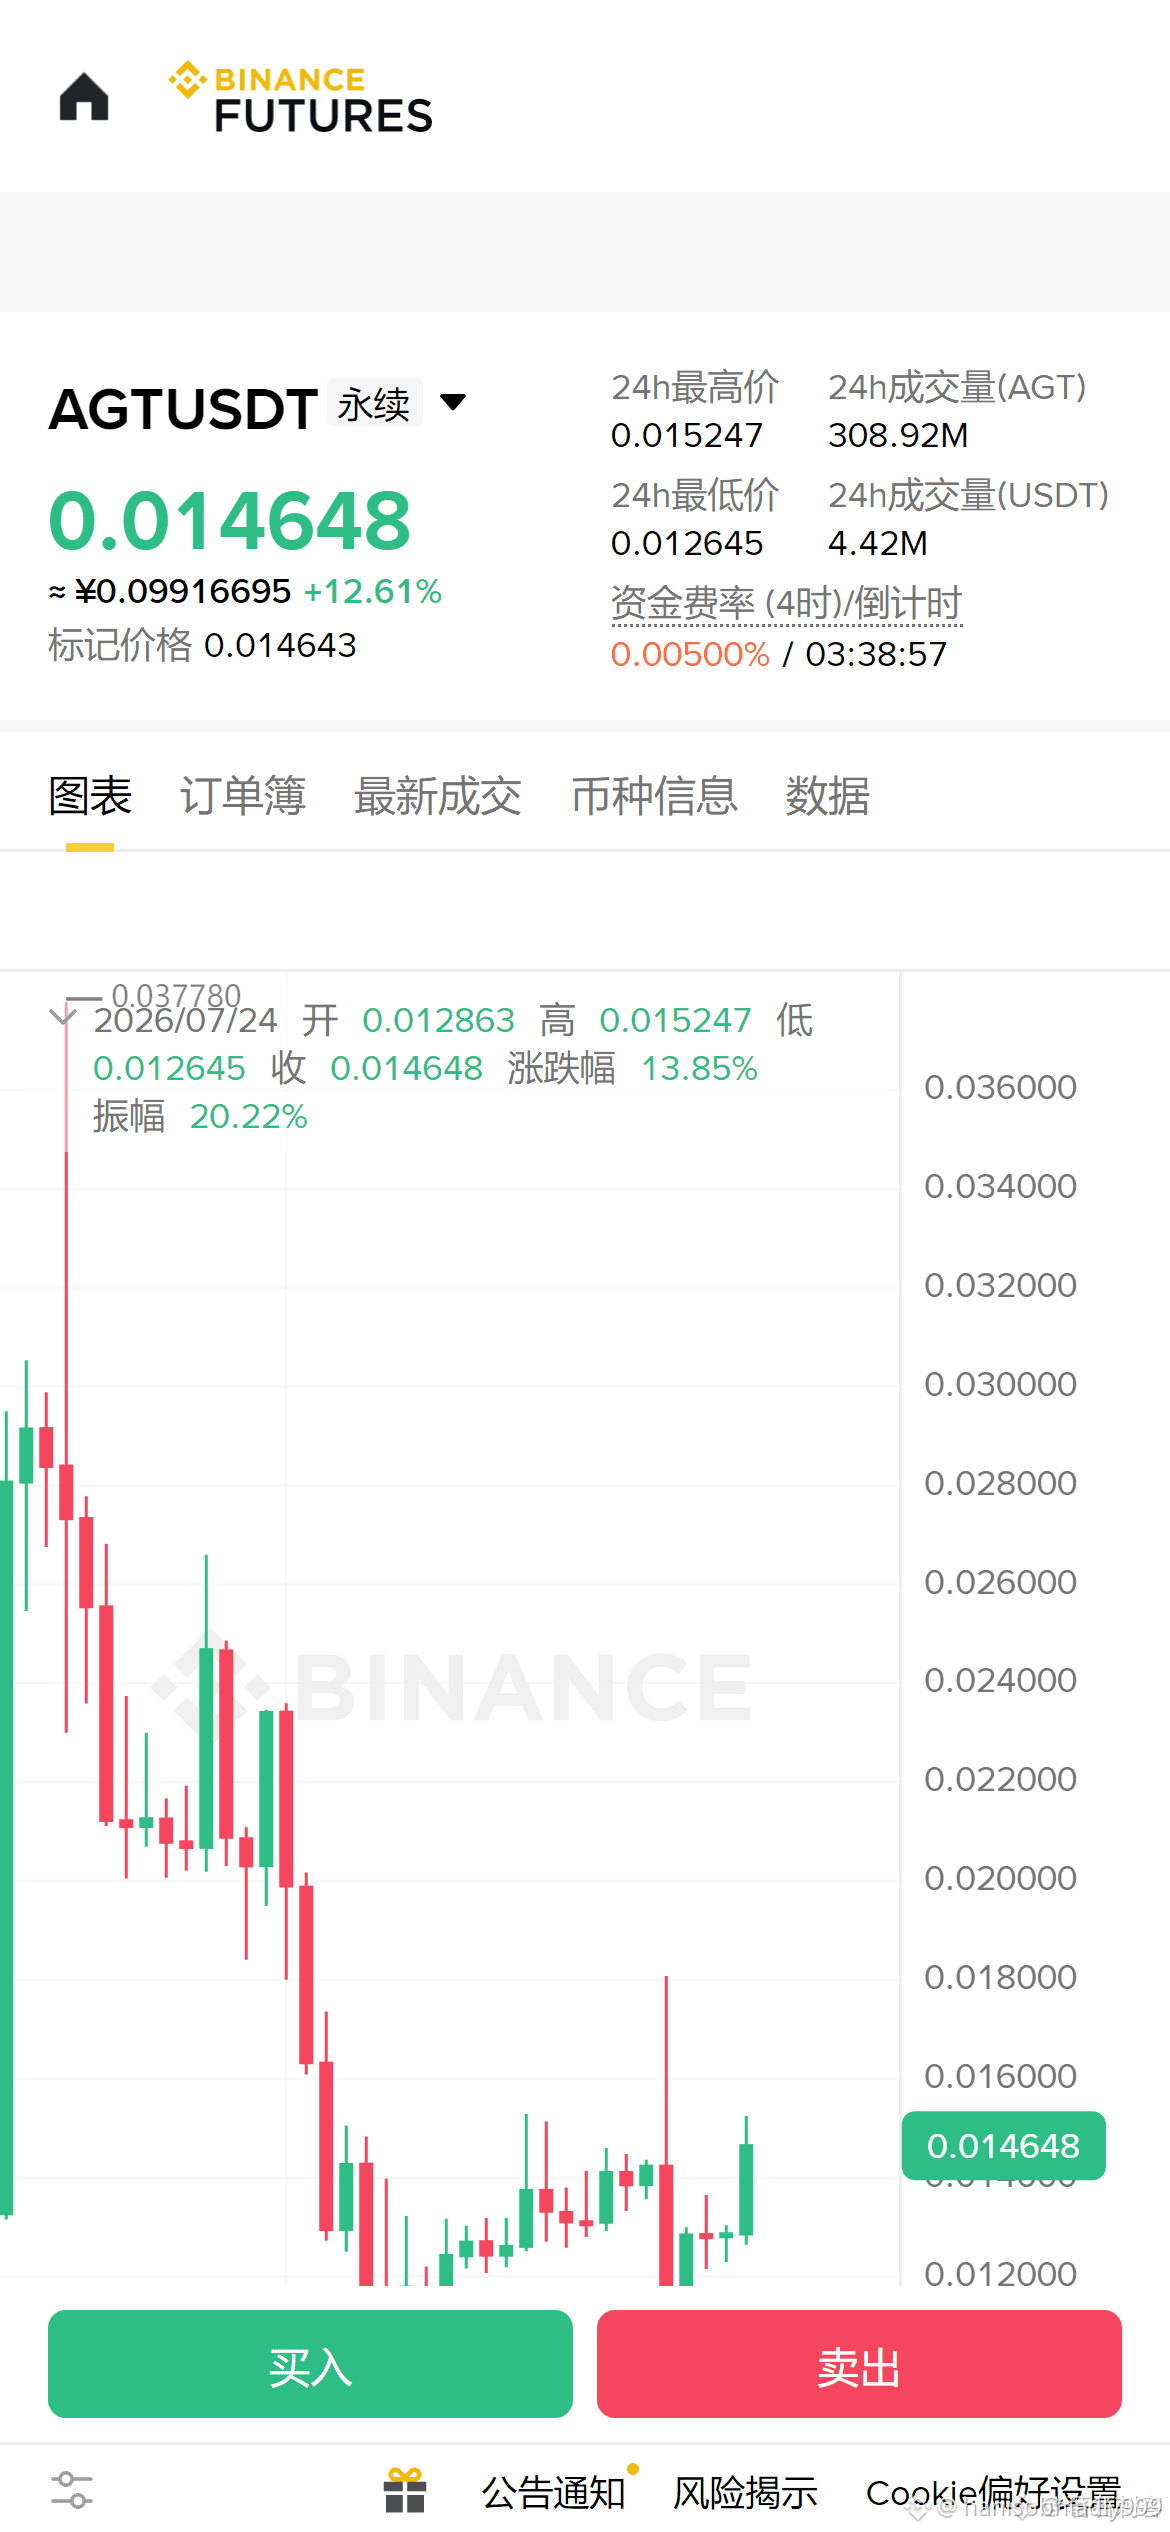
🚀 $AGT | Momentum Is Building! 🔥
$AGT is waking up fast! ⚡
In just a couple of hours, momentum has accelerated and the market is finally paying attention. 👀
😏 If you're already in, congratulations.
If you're watching from the sidelines, don't chase blindly—wait for confirmation and manage your risk.
The best trades come from discipline, not emotion.
$AGT | $SUI | $SEI | $INJ
#AGT #Crypto #Trading #Altcoins #Momentum #PriceActionPower
🚀 $AGT | Momentum Is Building! 🔥
$AGT is waking up fast! ⚡
In just a couple of hours, momentum has accelerated and the market is finally paying attention. 👀
😏 If you're already in, congratulations.
If you're watching from the sidelines, don't chase blindly—wait for confirmation and manage your risk.
The best trades come from discipline, not emotion.
$AGT | $SUI | $SEI | $INJ
#AGT #Crypto #Trading #Altcoins #Momentum #PriceActionPower
$AGT is waking up fast! ⚡
In just a couple of hours, momentum has accelerated and the market is finally paying attention. 👀
😏 If you're already in, congratulations.
If you're watching from the sidelines, don't chase blindly—wait for confirmation and manage your risk.
The best trades come from discipline, not emotion.
$AGT | $SUI | $SEI | $INJ
#AGT #Crypto #Trading #Altcoins #Momentum #PriceActionPower
238

·
--
Bullish
Patience, discipline, and precise analysis always pay off in the market! 📈💡
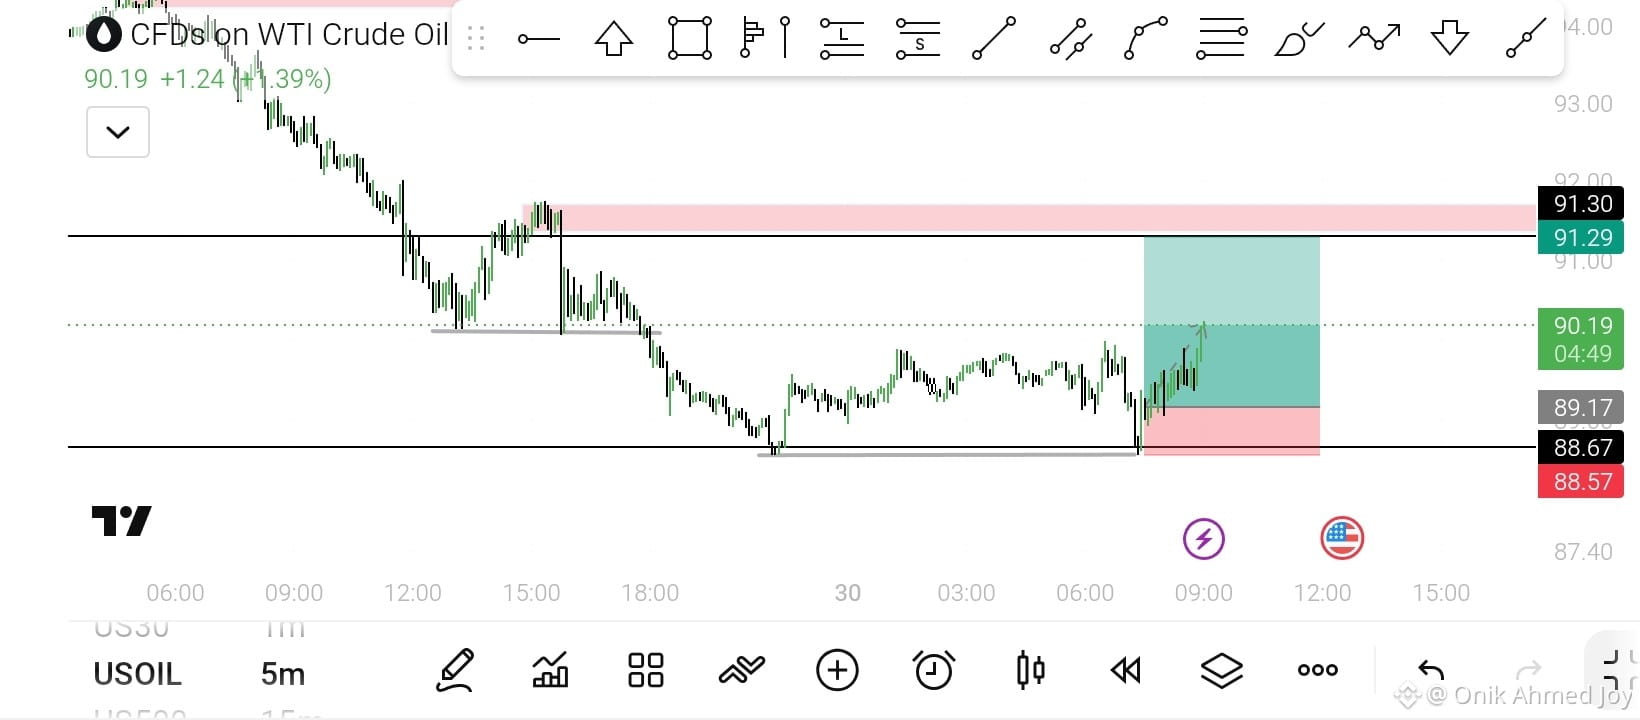
Check out my latest USOIL setup — perfect liquidity sweep at 88.67 leading to a strong bullish move towards 91.30!
What is your take on this setup? Drop your analysis below! 👇🤩
#USOIL #tradingmindset #TechnicalAnalysis #PriceActionPower
Patience, discipline, and precise analysis always pay off in the market! 📈💡
Check out my latest USOIL setup — perfect liquidity sweep at 88.67 leading to a strong bullish move towards 91.30!
What is your take on this setup? Drop your analysis below! 👇🤩
#USOIL #tradingmindset #TechnicalAnalysis #PriceActionPower
Check out my latest USOIL setup — perfect liquidity sweep at 88.67 leading to a strong bullish move towards 91.30!
What is your take on this setup? Drop your analysis below! 👇🤩
#USOIL #tradingmindset #TechnicalAnalysis #PriceActionPower
1
1
292

·
--
Bullish
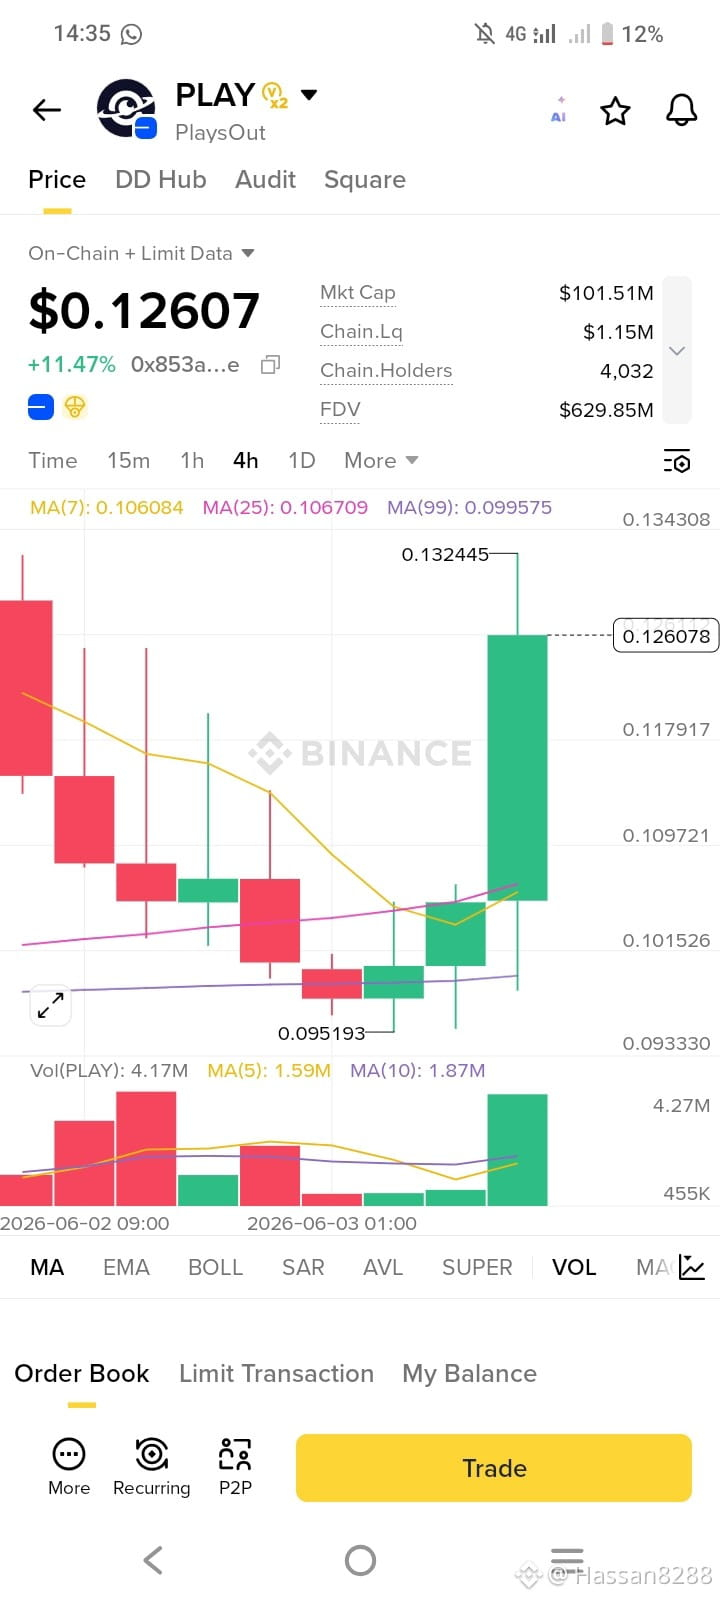
$PLAY PLAY/USDT Technical Analysis (4H)
PLAY is showing a strong bullish breakout on the 4H timeframe. Price has surged from the recent low around $0.095 and is now trading near $0.126, printing a large bullish candle accompanied by a significant increase in volume.
📈 Key Observations:
Strong bullish momentum with a breakout above short-term resistance.
Price is trading above the MA(7), MA(25), and MA(99), indicating trend strength.
Volume expansion confirms buyer interest and supports the upward move.
Recent high at $0.1324 is the next key resistance zone.
If bulls maintain control, further upside continuation is possible.
A pullback toward the $0.118–$0.121 area could offer support before the next move higher.
🎯 Bullish Scenario
Hold above $0.118 support.
Break and close above $0.1324 resistance.
Potential continuation toward higher price discovery levels.
⚠️ Risk
Failure to hold above support may trigger profit-taking and a short-term correction.
Overall Bias: BULLISH 🟢
#PLAY #PLAYUSDT #Crypto #CryptoTrading #Binance #Altcoin #PriceActionTrade h #TechnicalAnalysis #PriceActionPower on #WorldcoinGainsOnAnthropicIPOBuzz oSignals #TradingView #DeFi #Web3 #Altcoins #CryptoCommunity #VolumeBreakout #BullRun #USDT #WorldcoinGainsOnAnthropicIPOBuzz Blockchain #TradingAnalysis
$PLAY PLAY/USDT Technical Analysis (4H)
PLAY is showing a strong bullish breakout on the 4H timeframe. Price has surged from the recent low around $0.095 and is now trading near $0.126, printing a large bullish candle accompanied by a significant increase in volume.
📈 Key Observations:
Strong bullish momentum with a breakout above short-term resistance.
Price is trading above the MA(7), MA(25), and MA(99), indicating trend strength.
Volume expansion confirms buyer interest and supports the upward move.
Recent high at $0.1324 is the next key resistance zone.
If bulls maintain control, further upside continuation is possible.
A pullback toward the $0.118–$0.121 area could offer support before the next move higher.
🎯 Bullish Scenario
Hold above $0.118 support.
Break and close above $0.1324 resistance.
Potential continuation toward higher price discovery levels.
⚠️ Risk
Failure to hold above support may trigger profit-taking and a short-term correction.
Overall Bias: BULLISH 🟢
#PLAY #PLAYUSDT #Crypto #CryptoTrading #Binance #Altcoin #PriceActionTrade h #TechnicalAnalysis #PriceActionPower on #WorldcoinGainsOnAnthropicIPOBuzz oSignals #TradingView #DeFi #Web3 #Altcoins #CryptoCommunity #VolumeBreakout #BullRun #USDT #WorldcoinGainsOnAnthropicIPOBuzz Blockchain #TradingAnalysis
PLAY is showing a strong bullish breakout on the 4H timeframe. Price has surged from the recent low around $0.095 and is now trading near $0.126, printing a large bullish candle accompanied by a significant increase in volume.
📈 Key Observations:
Strong bullish momentum with a breakout above short-term resistance.
Price is trading above the MA(7), MA(25), and MA(99), indicating trend strength.
Volume expansion confirms buyer interest and supports the upward move.
Recent high at $0.1324 is the next key resistance zone.
If bulls maintain control, further upside continuation is possible.
A pullback toward the $0.118–$0.121 area could offer support before the next move higher.
🎯 Bullish Scenario
Hold above $0.118 support.
Break and close above $0.1324 resistance.
Potential continuation toward higher price discovery levels.
⚠️ Risk
Failure to hold above support may trigger profit-taking and a short-term correction.
Overall Bias: BULLISH 🟢
#PLAY #PLAYUSDT #Crypto #CryptoTrading #Binance #Altcoin #PriceActionTrade h #TechnicalAnalysis #PriceActionPower on #WorldcoinGainsOnAnthropicIPOBuzz oSignals #TradingView #DeFi #Web3 #Altcoins #CryptoCommunity #VolumeBreakout #BullRun #USDT #WorldcoinGainsOnAnthropicIPOBuzz Blockchain #TradingAnalysis
148

·
--
Bearish
BTCUSDT – Key Trigger Levels & Bearish Breakdown Setup
Market Structure & Key Observation
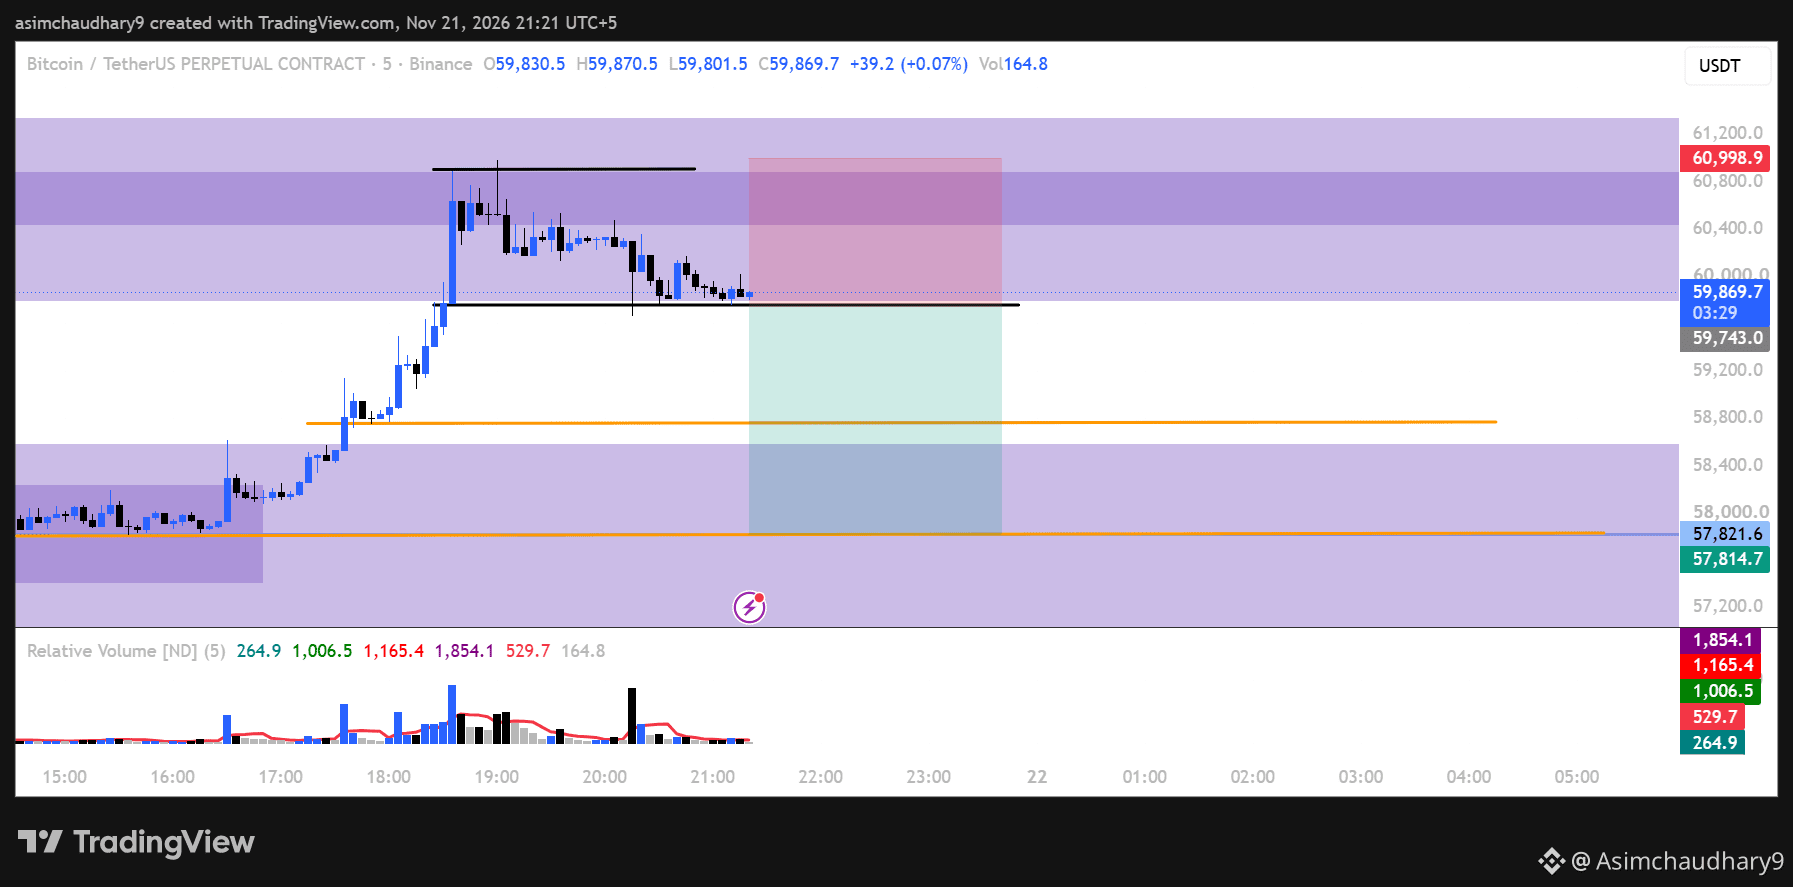
Bitcoin is currently trading inside an important 1H Point of Interest (POI), highlighted by the purple zone on the chart. Price previously made a strong bullish impulsive move and is now showing consolidation with gradual downward movement.
Important Trigger Levels
The two bold black horizontal lines represent our key trigger levels. The upper line acts as the upper boundary of the current price structure, while the lower trigger at $59,748 is the critical downside level.
Bearish Scenario – Breakdown Confirmation
If BTC breaks below $59,748 with proper candle-close confirmation, it could indicate bearish continuation.
TP1: $58,772
TP2: $57,813
BTC is currently sitting inside a significant 1H POI. A confirmed breakdown below $59,748 could open the way toward $58,772 and potentially $57,813. Patience and confirmation are key. Let the market reveal its direction before taking a position.
This analysis is based on technical levels and represents a potential market scenario, not a guaranteed price prediction. Always manage your risk.
#BTC #Bitcoin #BTCUSDT #CryptoTrading #TechnicalAnalysis #BinanceSquare #PriceActionPower
BTCUSDT – Key Trigger Levels & Bearish Breakdown Setup
Market Structure & Key Observation
Bitcoin is currently trading inside an important 1H Point of Interest (POI), highlighted by the purple zone on the chart. Price previously made a strong bullish impulsive move and is now showing consolidation with gradual downward movement.
Important Trigger Levels
The two bold black horizontal lines represent our key trigger levels. The upper line acts as the upper boundary of the current price structure, while the lower trigger at $59,748 is the critical downside level.
Bearish Scenario – Breakdown Confirmation
If BTC breaks below $59,748 with proper candle-close confirmation, it could indicate bearish continuation.
TP1: $58,772
TP2: $57,813
BTC is currently sitting inside a significant 1H POI. A confirmed breakdown below $59,748 could open the way toward $58,772 and potentially $57,813. Patience and confirmation are key. Let the market reveal its direction before taking a position.
This analysis is based on technical levels and represents a potential market scenario, not a guaranteed price prediction. Always manage your risk.
#BTC #Bitcoin #BTCUSDT #CryptoTrading #TechnicalAnalysis #BinanceSquare #PriceActionPower
Market Structure & Key Observation
Bitcoin is currently trading inside an important 1H Point of Interest (POI), highlighted by the purple zone on the chart. Price previously made a strong bullish impulsive move and is now showing consolidation with gradual downward movement.
Important Trigger Levels
The two bold black horizontal lines represent our key trigger levels. The upper line acts as the upper boundary of the current price structure, while the lower trigger at $59,748 is the critical downside level.
Bearish Scenario – Breakdown Confirmation
If BTC breaks below $59,748 with proper candle-close confirmation, it could indicate bearish continuation.
TP1: $58,772
TP2: $57,813
BTC is currently sitting inside a significant 1H POI. A confirmed breakdown below $59,748 could open the way toward $58,772 and potentially $57,813. Patience and confirmation are key. Let the market reveal its direction before taking a position.
This analysis is based on technical levels and represents a potential market scenario, not a guaranteed price prediction. Always manage your risk.
#BTC #Bitcoin #BTCUSDT #CryptoTrading #TechnicalAnalysis #BinanceSquare #PriceActionPower
107

·
--
$NAVER
{future}(NAVERUSDT)
/USDT — LONG WATCH 🟢
NAVER is under strong selling pressure, but the price has approached the local support zone at 117.97–118.50, where a short-term bounce is possible.
Entry zone: 118.00–118.50
🛑 SL: 117.60
🎯 TP1: 119.00
🎯 TP2: 120.10
🎯 TP3: 122.00
15M: attempt to form a local bottom.
1H: weakness, with a possible short-term bounce.
4H: the primary trend remains downward.
⚠️ LONG — only a potential countertrend opportunity. Confirmation of a reversal is needed. Don’t try to catch a falling knife.
#NAVRUSDT #LongOpportunity #CryptoTrading #PriceActionPower #NEXUSTradeAI
$NAVER
/USDT — LONG WATCH 🟢
NAVER is under strong selling pressure, but the price has approached the local support zone at 117.97–118.50, where a short-term bounce is possible.
Entry zone: 118.00–118.50
🛑 SL: 117.60
🎯 TP1: 119.00
🎯 TP2: 120.10
🎯 TP3: 122.00
15M: attempt to form a local bottom.
1H: weakness, with a possible short-term bounce.
4H: the primary trend remains downward.
⚠️ LONG — only a potential countertrend opportunity. Confirmation of a reversal is needed. Don’t try to catch a falling knife.
#NAVRUSDT #LongOpportunity #CryptoTrading #PriceActionPower #NEXUSTradeAI
/USDT — LONG WATCH 🟢
NAVER is under strong selling pressure, but the price has approached the local support zone at 117.97–118.50, where a short-term bounce is possible.
Entry zone: 118.00–118.50
🛑 SL: 117.60
🎯 TP1: 119.00
🎯 TP2: 120.10
🎯 TP3: 122.00
15M: attempt to form a local bottom.
1H: weakness, with a possible short-term bounce.
4H: the primary trend remains downward.
⚠️ LONG — only a potential countertrend opportunity. Confirmation of a reversal is needed. Don’t try to catch a falling knife.
#NAVRUSDT #LongOpportunity #CryptoTrading #PriceActionPower #NEXUSTradeAI
1
2
81

🥇 GOLD ($XAU USD) — TP HIT! 🎯
Yesterday's Analysis. Today's Execution.
As discussed yesterday, our plan was very clear:
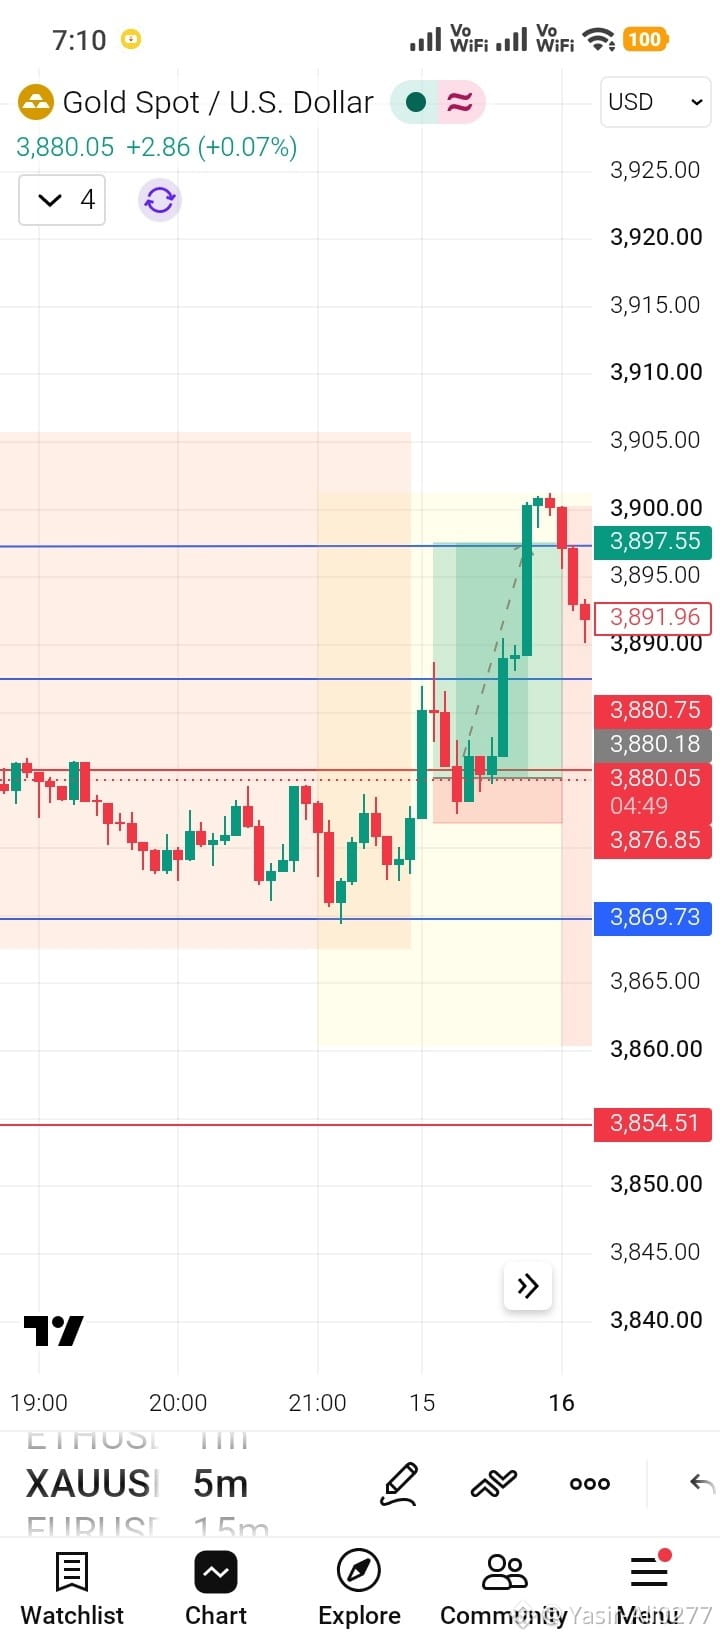
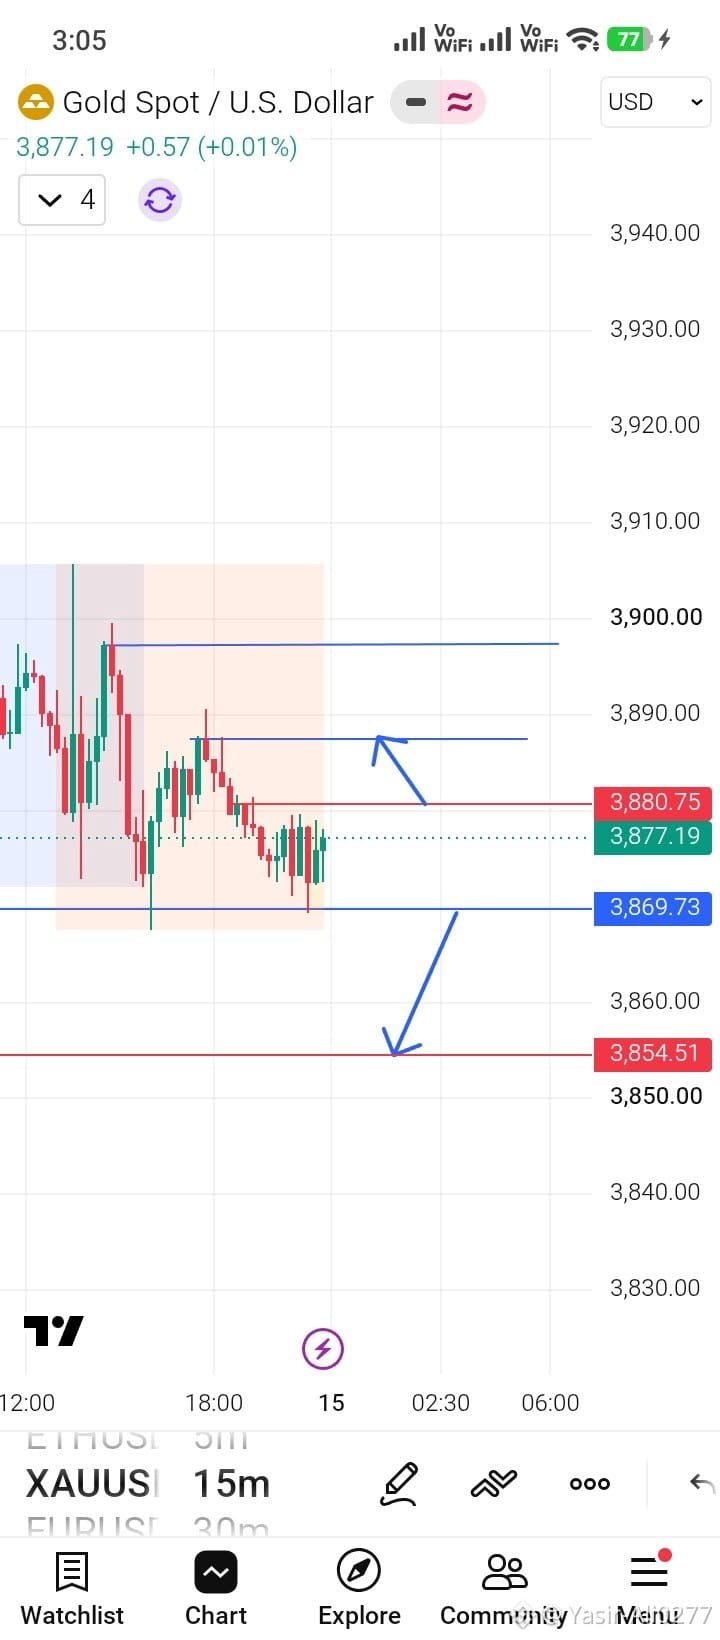
If Gold managed to get a candle close above our marked resistance level, we would accept the next upside move towards our target zone.
We didn't chase the market. We waited for confirmation.
And guess what? Gold respected the setup and delivered a beautiful move during today's Sydney Session. 🇦🇺
<badge> TARGET ACHIEVED ✅</badge>
📊 Trade Breakdown:
- Instrument: XAUUSD (Gold)
- Strategy: Candle Close Confirmation
- Entry: As per our planned setup
- Target: 3897.55
- Result: TP HIT 🎯
The best part? We shared this analysis yesterday, before the move happened.
This is what trading is about:
Patience, confirmation, discipline and execution.
No FOMO. No emotional entries. Just a clear plan and a disciplined approach.
🔥 AliTrader | Trade the Setup, Not the Emotion.
#XAUUSD #GoldETF #goldtrading #TPHit #SydneySession #PriceActionPower #TradingStrategy #AliTrader
🥇 GOLD ($XAU USD) — TP HIT! 🎯
Yesterday's Analysis. Today's Execution.
As discussed yesterday, our plan was very clear:
If Gold managed to get a candle close above our marked resistance level, we would accept the next upside move towards our target zone.
We didn't chase the market. We waited for confirmation.
And guess what? Gold respected the setup and delivered a beautiful move during today's Sydney Session. 🇦🇺
<badge> TARGET ACHIEVED ✅</badge>
📊 Trade Breakdown:
- Instrument: XAUUSD (Gold)
- Strategy: Candle Close Confirmation
- Entry: As per our planned setup
- Target: 3897.55
- Result: TP HIT 🎯
The best part? We shared this analysis yesterday, before the move happened.
This is what trading is about:
Patience, confirmation, discipline and execution.
No FOMO. No emotional entries. Just a clear plan and a disciplined approach.
🔥 AliTrader | Trade the Setup, Not the Emotion.
#XAUUSD #GoldETF #goldtrading #TPHit #SydneySession #PriceActionPower #TradingStrategy #AliTrader
Yesterday's Analysis. Today's Execution.
As discussed yesterday, our plan was very clear:
If Gold managed to get a candle close above our marked resistance level, we would accept the next upside move towards our target zone.
We didn't chase the market. We waited for confirmation.
And guess what? Gold respected the setup and delivered a beautiful move during today's Sydney Session. 🇦🇺
<badge> TARGET ACHIEVED ✅</badge>
📊 Trade Breakdown:
- Instrument: XAUUSD (Gold)
- Strategy: Candle Close Confirmation
- Entry: As per our planned setup
- Target: 3897.55
- Result: TP HIT 🎯
The best part? We shared this analysis yesterday, before the move happened.
This is what trading is about:
Patience, confirmation, discipline and execution.
No FOMO. No emotional entries. Just a clear plan and a disciplined approach.
🔥 AliTrader | Trade the Setup, Not the Emotion.
#XAUUSD #GoldETF #goldtrading #TPHit #SydneySession #PriceActionPower #TradingStrategy #AliTrader
183
$BTC /USDT — 30M Trading Plan 📊
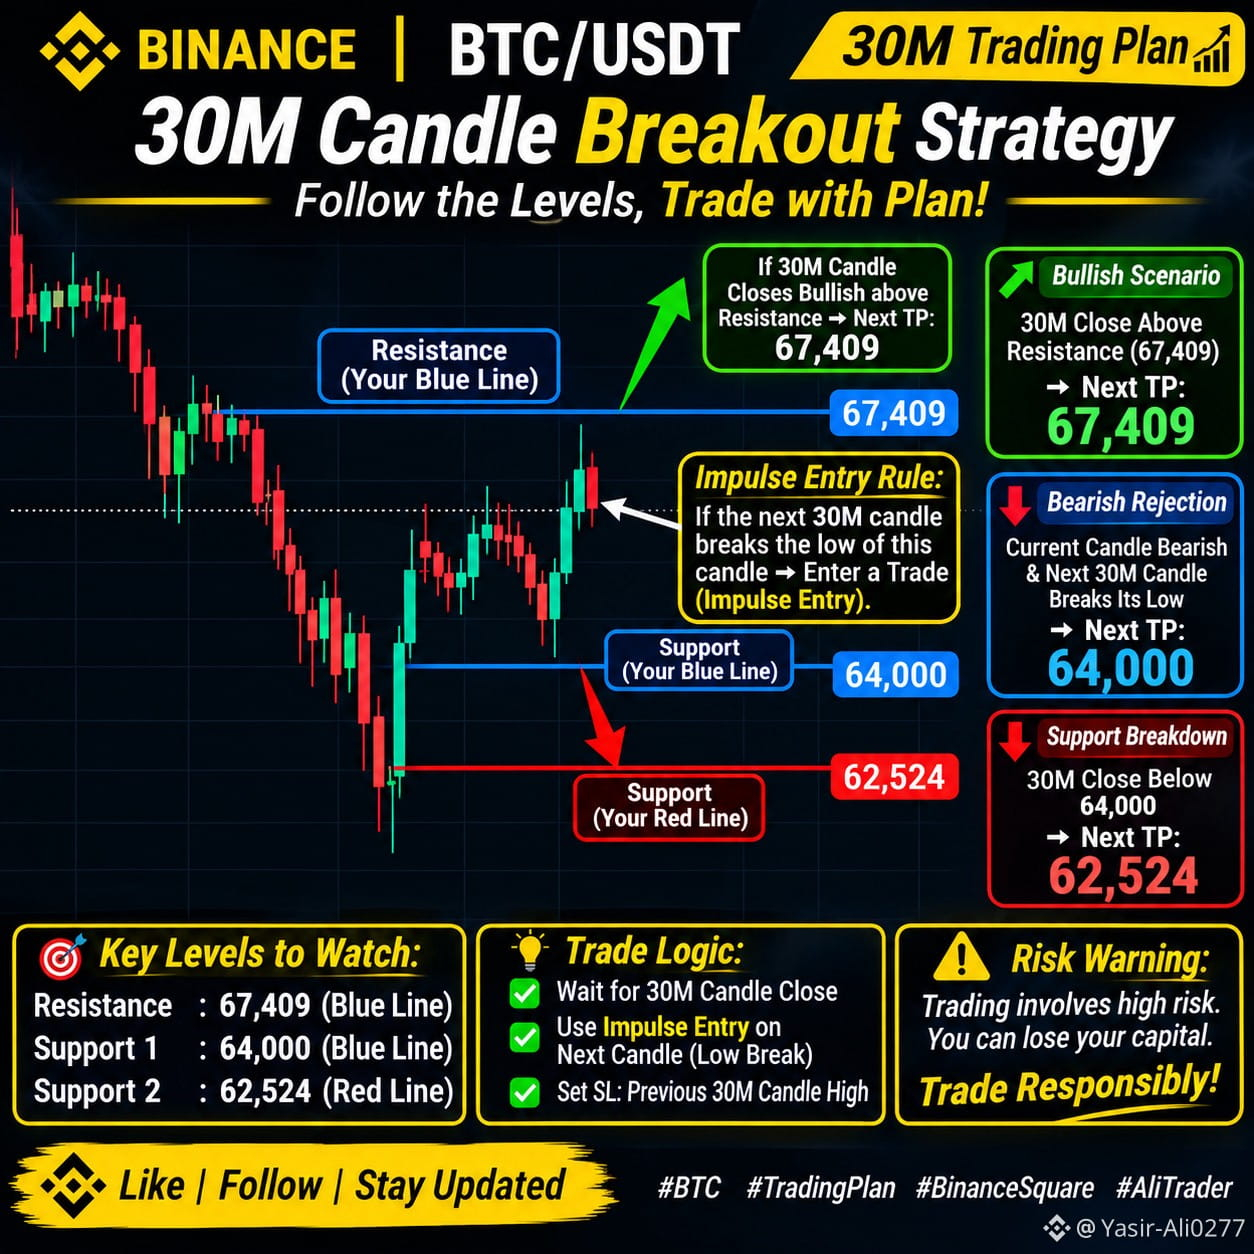
Three scenarios. One strategy: Wait for confirmation, then execute.
🟢 Bullish Scenario
A confirmed 30M candle close above resistance opens the way toward 67,409.
🔴 Bearish Impulse Entry
If the current 30M candle closes bearish and the next 30M candle breaks its LOW, it triggers a potential Impulse Entry (Short).
Stop Loss: Above the previous 30M candle's HIGH.
First TP: 64,000 Support.
⚠️ Support Breakdown
If a 30M candle closes below 64,000, the next downside target becomes 62,524.
My Trading Rule:
No confirmation, no trade. Let price action decide the direction.
Risk management comes first. Every trade carries risk, and capital protection is essential.
Trade Smart. Stay Disciplined. Let the Market Confirm.
#BTC☀️ #Bitcoin #Tradingplane #PriceActionPower #BinanceSquare #AliTrader
$BTC /USDT — 30M Trading Plan 📊
Three scenarios. One strategy: Wait for confirmation, then execute.
🟢 Bullish Scenario
A confirmed 30M candle close above resistance opens the way toward 67,409.
🔴 Bearish Impulse Entry
If the current 30M candle closes bearish and the next 30M candle breaks its LOW, it triggers a potential Impulse Entry (Short).
Stop Loss: Above the previous 30M candle's HIGH.
First TP: 64,000 Support.
⚠️ Support Breakdown
If a 30M candle closes below 64,000, the next downside target becomes 62,524.
My Trading Rule:
No confirmation, no trade. Let price action decide the direction.
Risk management comes first. Every trade carries risk, and capital protection is essential.
Trade Smart. Stay Disciplined. Let the Market Confirm.
#BTC☀️ #Bitcoin #Tradingplane #PriceActionPower #BinanceSquare #AliTrader
Three scenarios. One strategy: Wait for confirmation, then execute.
🟢 Bullish Scenario
A confirmed 30M candle close above resistance opens the way toward 67,409.
🔴 Bearish Impulse Entry
If the current 30M candle closes bearish and the next 30M candle breaks its LOW, it triggers a potential Impulse Entry (Short).
Stop Loss: Above the previous 30M candle's HIGH.
First TP: 64,000 Support.
⚠️ Support Breakdown
If a 30M candle closes below 64,000, the next downside target becomes 62,524.
My Trading Rule:
No confirmation, no trade. Let price action decide the direction.
Risk management comes first. Every trade carries risk, and capital protection is essential.
Trade Smart. Stay Disciplined. Let the Market Confirm.
#BTC☀️ #Bitcoin #Tradingplane #PriceActionPower #BinanceSquare #AliTrader
97

📈 I’m Not Here to Look Like an Expert. I’m Here to Become One.
Every chart has a lesson.
Every mistake has a message.
Every day is an opportunity to learn.
I'm building my trading knowledge one step at a time — focusing on market structure, risk management, and discipline.
No fake promises. No shortcuts. Just learning and consistent progress. 🧠
Question for traders: What is the ONE lesson you wish you had learned earlier?
#tradingjourney #PriceActionPower #tradingmindset #RiskManagementk #learntrading
📈 I’m Not Here to Look Like an Expert. I’m Here to Become One.
Every chart has a lesson.
Every mistake has a message.
Every day is an opportunity to learn.
I'm building my trading knowledge one step at a time — focusing on market structure, risk management, and discipline.
No fake promises. No shortcuts. Just learning and consistent progress. 🧠
Question for traders: What is the ONE lesson you wish you had learned earlier?
#tradingjourney #PriceActionPower #tradingmindset #RiskManagementk #learntrading
Every chart has a lesson.
Every mistake has a message.
Every day is an opportunity to learn.
I'm building my trading knowledge one step at a time — focusing on market structure, risk management, and discipline.
No fake promises. No shortcuts. Just learning and consistent progress. 🧠
Question for traders: What is the ONE lesson you wish you had learned earlier?
#tradingjourney #PriceActionPower #tradingmindset #RiskManagementk #learntrading
83

·
--
Bullish
🚨 $LAB Long Setup
$LAB is showing a strong reversal signal after reclaiming a key support zone. Bulls are stepping back in, while crowded shorts could fuel the next move.
📍 Entry: $9.70–$10.05
🎯 TP1: $10.80
🎯 TP2: $12.00
🎯 TP3: $13.50
🛑 SL: $8.90
Negative funding and declining open interest suggest short-squeeze potential. As long as $9.70 holds, momentum favors the upside.
Trade here👇
LABUSDT
#LAB #Crypto #BinanceSquare #Trading #Altcoins #PriceActionPower $LAB
🚨 $LAB Long Setup
$LAB is showing a strong reversal signal after reclaiming a key support zone. Bulls are stepping back in, while crowded shorts could fuel the next move.
📍 Entry: $9.70–$10.05
🎯 TP1: $10.80
🎯 TP2: $12.00
🎯 TP3: $13.50
🛑 SL: $8.90
Negative funding and declining open interest suggest short-squeeze potential. As long as $9.70 holds, momentum favors the upside.
Trade here👇
LABUSDT
#LAB #Crypto #BinanceSquare #Trading #Altcoins #PriceActionPower $LAB
$LAB is showing a strong reversal signal after reclaiming a key support zone. Bulls are stepping back in, while crowded shorts could fuel the next move.
📍 Entry: $9.70–$10.05
🎯 TP1: $10.80
🎯 TP2: $12.00
🎯 TP3: $13.50
🛑 SL: $8.90
Negative funding and declining open interest suggest short-squeeze potential. As long as $9.70 holds, momentum favors the upside.
Trade here👇
LABUSDT
#LAB #Crypto #BinanceSquare #Trading #Altcoins #PriceActionPower $LAB
1
137

·
--
Bullish
🚨 XAUUSDT SUDDENLY MOVES FAST
Gold has just made an aggressive breakout with little retrace.
What's dangerous is not the pump.
But traders who only realize after a long candle appears.
The current structure is clear:
✅ EMA7 > EMA25 > EMA99
✅ Clean upward momentum
✅ Volume also spikes
✅ Breaks previous high
What does it mean?
The market is in an impulsive move phase.
BUT…
Usually after an expansion candle like this, there are 2 possibilities:
1️⃣ Continue squeeze → Short trapped
2️⃣ Fake continuation → Late buyers become liquidity
The area I'm paying attention to now:
📍 5,300 – 5,285 = reaction zone / healthy retest
As long as the price holds above this area,
the bias is still bullish continuation.
The biggest problem for traders:
They enter because they see green,
not because they have a plan.
Poll 👇
If you see a move like this, you:
A️⃣ Immediately Long to chase momentum
B️⃣ Wait for a retrace first
C️⃣ Look for Short against the trend
#xauusdtrading #GOLD_UPDATE #TradingSignals #PriceActionPower #BinanceSquare $XAU
🚨 XAUUSDT SUDDENLY MOVES FAST
Gold has just made an aggressive breakout with little retrace.
What's dangerous is not the pump.
But traders who only realize after a long candle appears.
The current structure is clear:
✅ EMA7 > EMA25 > EMA99
✅ Clean upward momentum
✅ Volume also spikes
✅ Breaks previous high
What does it mean?
The market is in an impulsive move phase.
BUT…
Usually after an expansion candle like this, there are 2 possibilities:
1️⃣ Continue squeeze → Short trapped
2️⃣ Fake continuation → Late buyers become liquidity
The area I'm paying attention to now:
📍 5,300 – 5,285 = reaction zone / healthy retest
As long as the price holds above this area,
the bias is still bullish continuation.
The biggest problem for traders:
They enter because they see green,
not because they have a plan.
Poll 👇
If you see a move like this, you:
A️⃣ Immediately Long to chase momentum
B️⃣ Wait for a retrace first
C️⃣ Look for Short against the trend
#xauusdtrading #GOLD_UPDATE #TradingSignals #PriceActionPower #BinanceSquare $XAU
Gold has just made an aggressive breakout with little retrace.
What's dangerous is not the pump.
But traders who only realize after a long candle appears.
The current structure is clear:
✅ EMA7 > EMA25 > EMA99
✅ Clean upward momentum
✅ Volume also spikes
✅ Breaks previous high
What does it mean?
The market is in an impulsive move phase.
BUT…
Usually after an expansion candle like this, there are 2 possibilities:
1️⃣ Continue squeeze → Short trapped
2️⃣ Fake continuation → Late buyers become liquidity
The area I'm paying attention to now:
📍 5,300 – 5,285 = reaction zone / healthy retest
As long as the price holds above this area,
the bias is still bullish continuation.
The biggest problem for traders:
They enter because they see green,
not because they have a plan.
Poll 👇
If you see a move like this, you:
A️⃣ Immediately Long to chase momentum
B️⃣ Wait for a retrace first
C️⃣ Look for Short against the trend
#xauusdtrading #GOLD_UPDATE #TradingSignals #PriceActionPower #BinanceSquare $XAU
1
816
·
--
Bearish
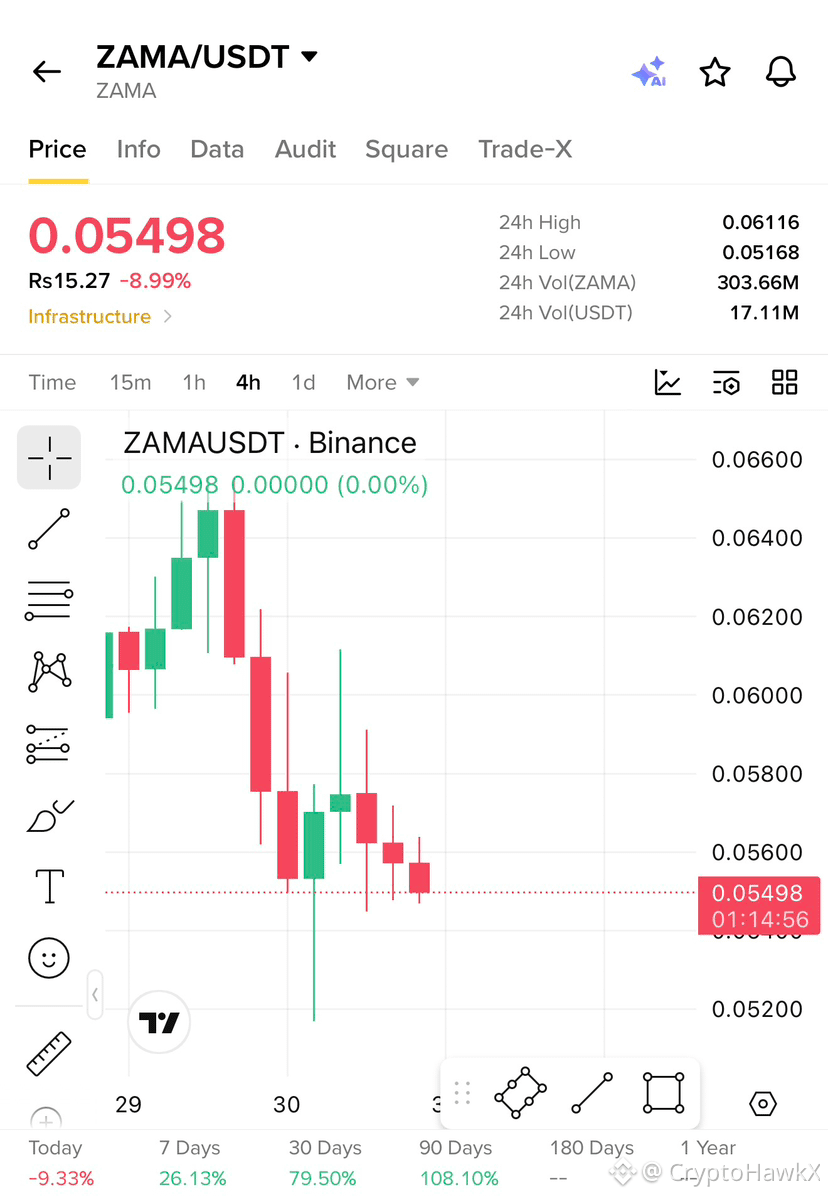
📉 $ZAMA /USDT Market Update
ZAMA is trading under strong bearish pressure on the 4H timeframe, with sellers maintaining control after a sharp rejection from recent highs. Price is approaching a key support zone around 0.0540–0.0520. A strong bounce from this area could trigger a short-term recovery, while a breakdown may extend the downtrend.
Market Bias: Bearish 🐻
#ZhongjiInnolightFalls12.77%OnHKDebut l#FOMCWatching #FOMCWatching #PriceActionPower #FOMCWatching
📉 $ZAMA /USDT Market Update
ZAMA is trading under strong bearish pressure on the 4H timeframe, with sellers maintaining control after a sharp rejection from recent highs. Price is approaching a key support zone around 0.0540–0.0520. A strong bounce from this area could trigger a short-term recovery, while a breakdown may extend the downtrend.
Market Bias: Bearish 🐻
#ZhongjiInnolightFalls12.77%OnHKDebut l#FOMCWatching #FOMCWatching #PriceActionPower #FOMCWatching
ZAMA is trading under strong bearish pressure on the 4H timeframe, with sellers maintaining control after a sharp rejection from recent highs. Price is approaching a key support zone around 0.0540–0.0520. A strong bounce from this area could trigger a short-term recovery, while a breakdown may extend the downtrend.
Market Bias: Bearish 🐻
#ZhongjiInnolightFalls12.77%OnHKDebut l#FOMCWatching #FOMCWatching #PriceActionPower #FOMCWatching
66

·
--
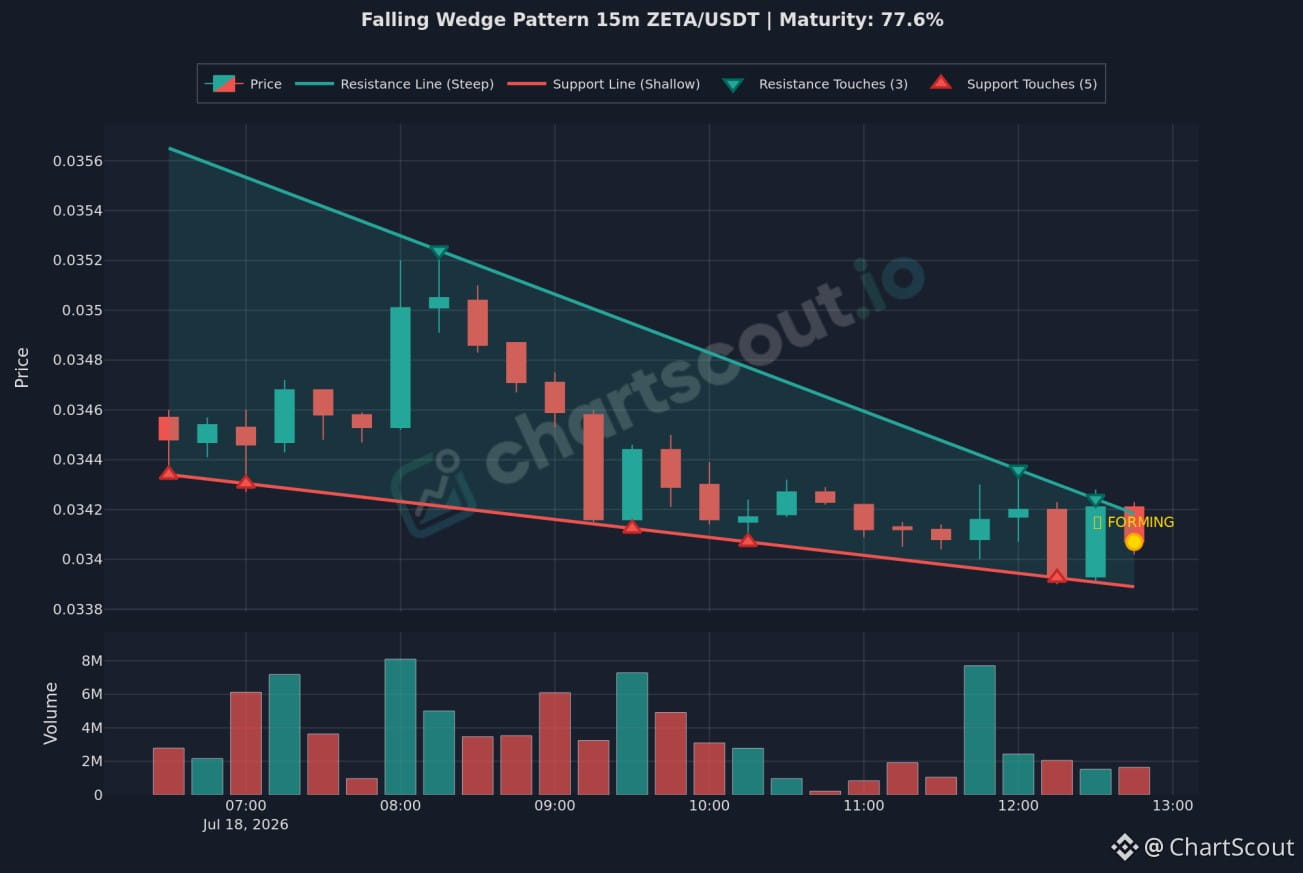
ZETA/USDT is shaping into a Falling Wedge on the 15m, and the pattern is already 77.6% mature.
Price has been compressing between a steep descending resistance line and a shallow support line, with 3 resistance touches and 5 support touches keeping the structure tight. That kind of squeeze often shows up when the market is losing downside momentum and preparing for a sharper reaction.
What stands out here is the way candles keep getting smaller while the wedge narrows. That usually means the chart is nearing a decision point, so this one deserves attention before the next move starts.
DYOR before making any decisions. 🧠
#ChartScout #zeta #FallingWedge #CryptoTA #PriceActionPower
ZETA/USDT is shaping into a Falling Wedge on the 15m, and the pattern is already 77.6% mature.
Price has been compressing between a steep descending resistance line and a shallow support line, with 3 resistance touches and 5 support touches keeping the structure tight. That kind of squeeze often shows up when the market is losing downside momentum and preparing for a sharper reaction.
What stands out here is the way candles keep getting smaller while the wedge narrows. That usually means the chart is nearing a decision point, so this one deserves attention before the next move starts.
DYOR before making any decisions. 🧠
#ChartScout #zeta #FallingWedge #CryptoTA #PriceActionPower
Price has been compressing between a steep descending resistance line and a shallow support line, with 3 resistance touches and 5 support touches keeping the structure tight. That kind of squeeze often shows up when the market is losing downside momentum and preparing for a sharper reaction.
What stands out here is the way candles keep getting smaller while the wedge narrows. That usually means the chart is nearing a decision point, so this one deserves attention before the next move starts.
DYOR before making any decisions. 🧠
#ChartScout #zeta #FallingWedge #CryptoTA #PriceActionPower
31

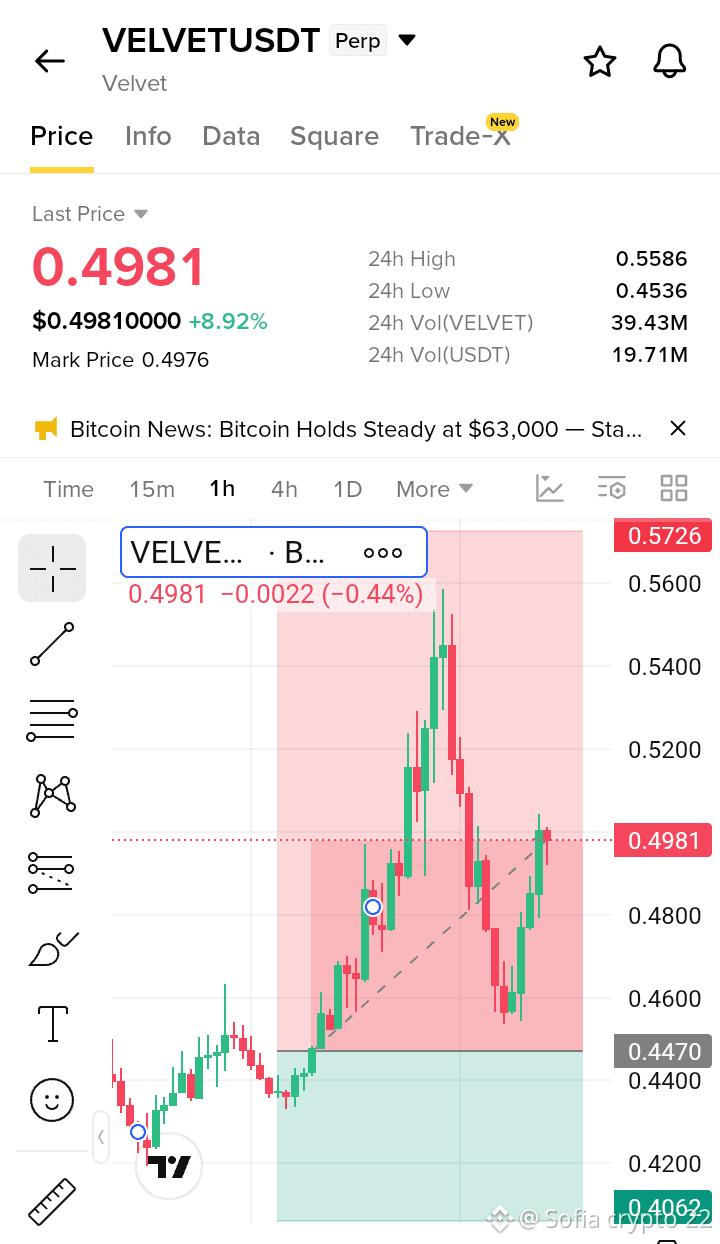
🚨 $VELVET – Resistance Pullback Alert
⚠️ VELVET is facing strong resistance and showing a pullback after rejection.
📍 Watch the current support zone closely.
✅ Hold support → Potential bullish continuation.
❌ Lose support → Deeper correction likely.
🛡️ Wait for confirmation before entering. Manage risk and avoid FOMO.
#VELVET #cryptouniverseofficial #PriceActionPower
$VELVET
{future}(VELVETUSDT)
🚨 $VELVET – Resistance Pullback Alert
⚠️ VELVET is facing strong resistance and showing a pullback after rejection.
📍 Watch the current support zone closely.
✅ Hold support → Potential bullish continuation.
❌ Lose support → Deeper correction likely.
🛡️ Wait for confirmation before entering. Manage risk and avoid FOMO.
#VELVET #cryptouniverseofficial #PriceActionPower
$VELVET
⚠️ VELVET is facing strong resistance and showing a pullback after rejection.
📍 Watch the current support zone closely.
✅ Hold support → Potential bullish continuation.
❌ Lose support → Deeper correction likely.
🛡️ Wait for confirmation before entering. Manage risk and avoid FOMO.
#VELVET #cryptouniverseofficial #PriceActionPower
$VELVET
105

$BTC $ETH $BNB 📉 As told since morning — bearish pressure playing out across the market 🐻
all following the downside structure 📊
Lower highs, weak bounces, and sellers staying in control ⚠️
Market clearly showing risk-off sentiment — no strong reversal confirmation yet
Trend is simple:
Resistance holding → liquidity getting swept → continuation down 🔻
Stay with price action, not emotions 🎯
#Crypto #Bitcoin #Ethereum #BNB #SOL #Bearish #Trading #Binance #PriceActionPower
$BTC $ETH $BNB 📉 As told since morning — bearish pressure playing out across the market 🐻
all following the downside structure 📊
Lower highs, weak bounces, and sellers staying in control ⚠️
Market clearly showing risk-off sentiment — no strong reversal confirmation yet
Trend is simple:
Resistance holding → liquidity getting swept → continuation down 🔻
Stay with price action, not emotions 🎯
#Crypto #Bitcoin #Ethereum #BNB #SOL #Bearish #Trading #Binance #PriceActionPower
all following the downside structure 📊
Lower highs, weak bounces, and sellers staying in control ⚠️
Market clearly showing risk-off sentiment — no strong reversal confirmation yet
Trend is simple:
Resistance holding → liquidity getting swept → continuation down 🔻
Stay with price action, not emotions 🎯
#Crypto #Bitcoin #Ethereum #BNB #SOL #Bearish #Trading #Binance #PriceActionPower
45

·
--
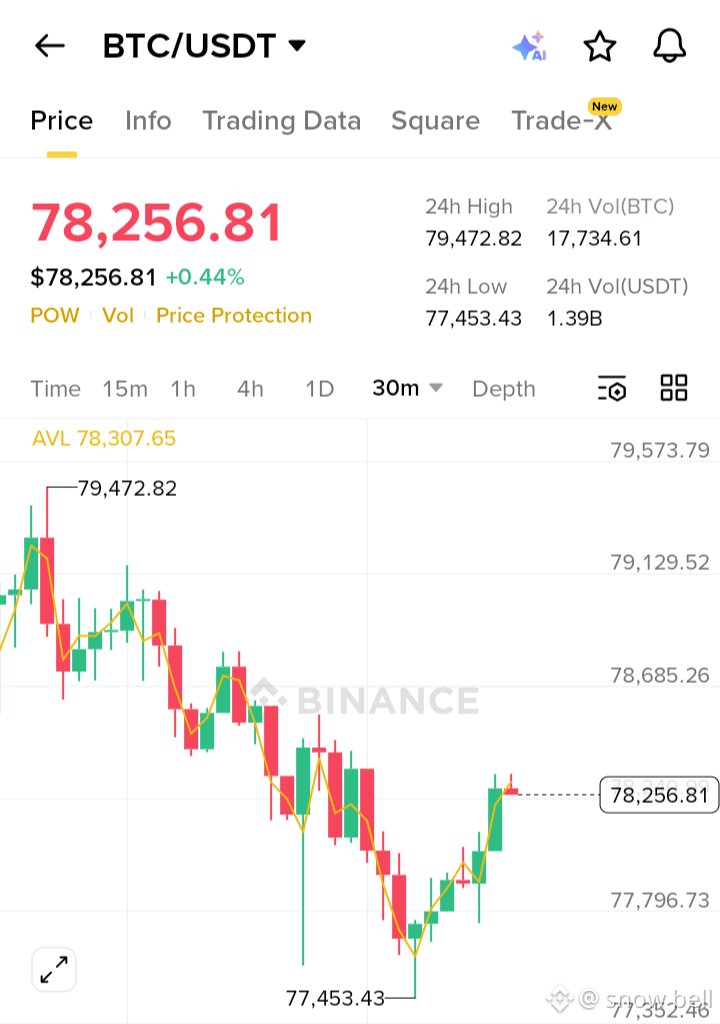
$BTC/USDT BULLISH REVERSAL SETUP AFTER SHORT-TERM DOWNTREND $BTC
ENTRY ZONE: On minor pullback or breakout confirmation above resistance
TP1: 78,700
TP2: 79,100
TP3: 79,500
SL: 77,400
#BTCUSDT #CryptoTrading. #TechnicalAnalysis #PriceActionPower #CryptoMarket
$BTC /USDT BULLISH REVERSAL SETUP AFTER SHORT-TERM DOWNTREND $BTC
ENTRY ZONE: On minor pullback or breakout confirmation above resistance
TP1: 78,700
TP2: 79,100
TP3: 79,500
SL: 77,400
#BTCUSDT #CryptoTrading. #TechnicalAnalysis #PriceActionPower #CryptoMarket
ENTRY ZONE: On minor pullback or breakout confirmation above resistance
TP1: 78,700
TP2: 79,100
TP3: 79,500
SL: 77,400
#BTCUSDT #CryptoTrading. #TechnicalAnalysis #PriceActionPower #CryptoMarket
37
·
--
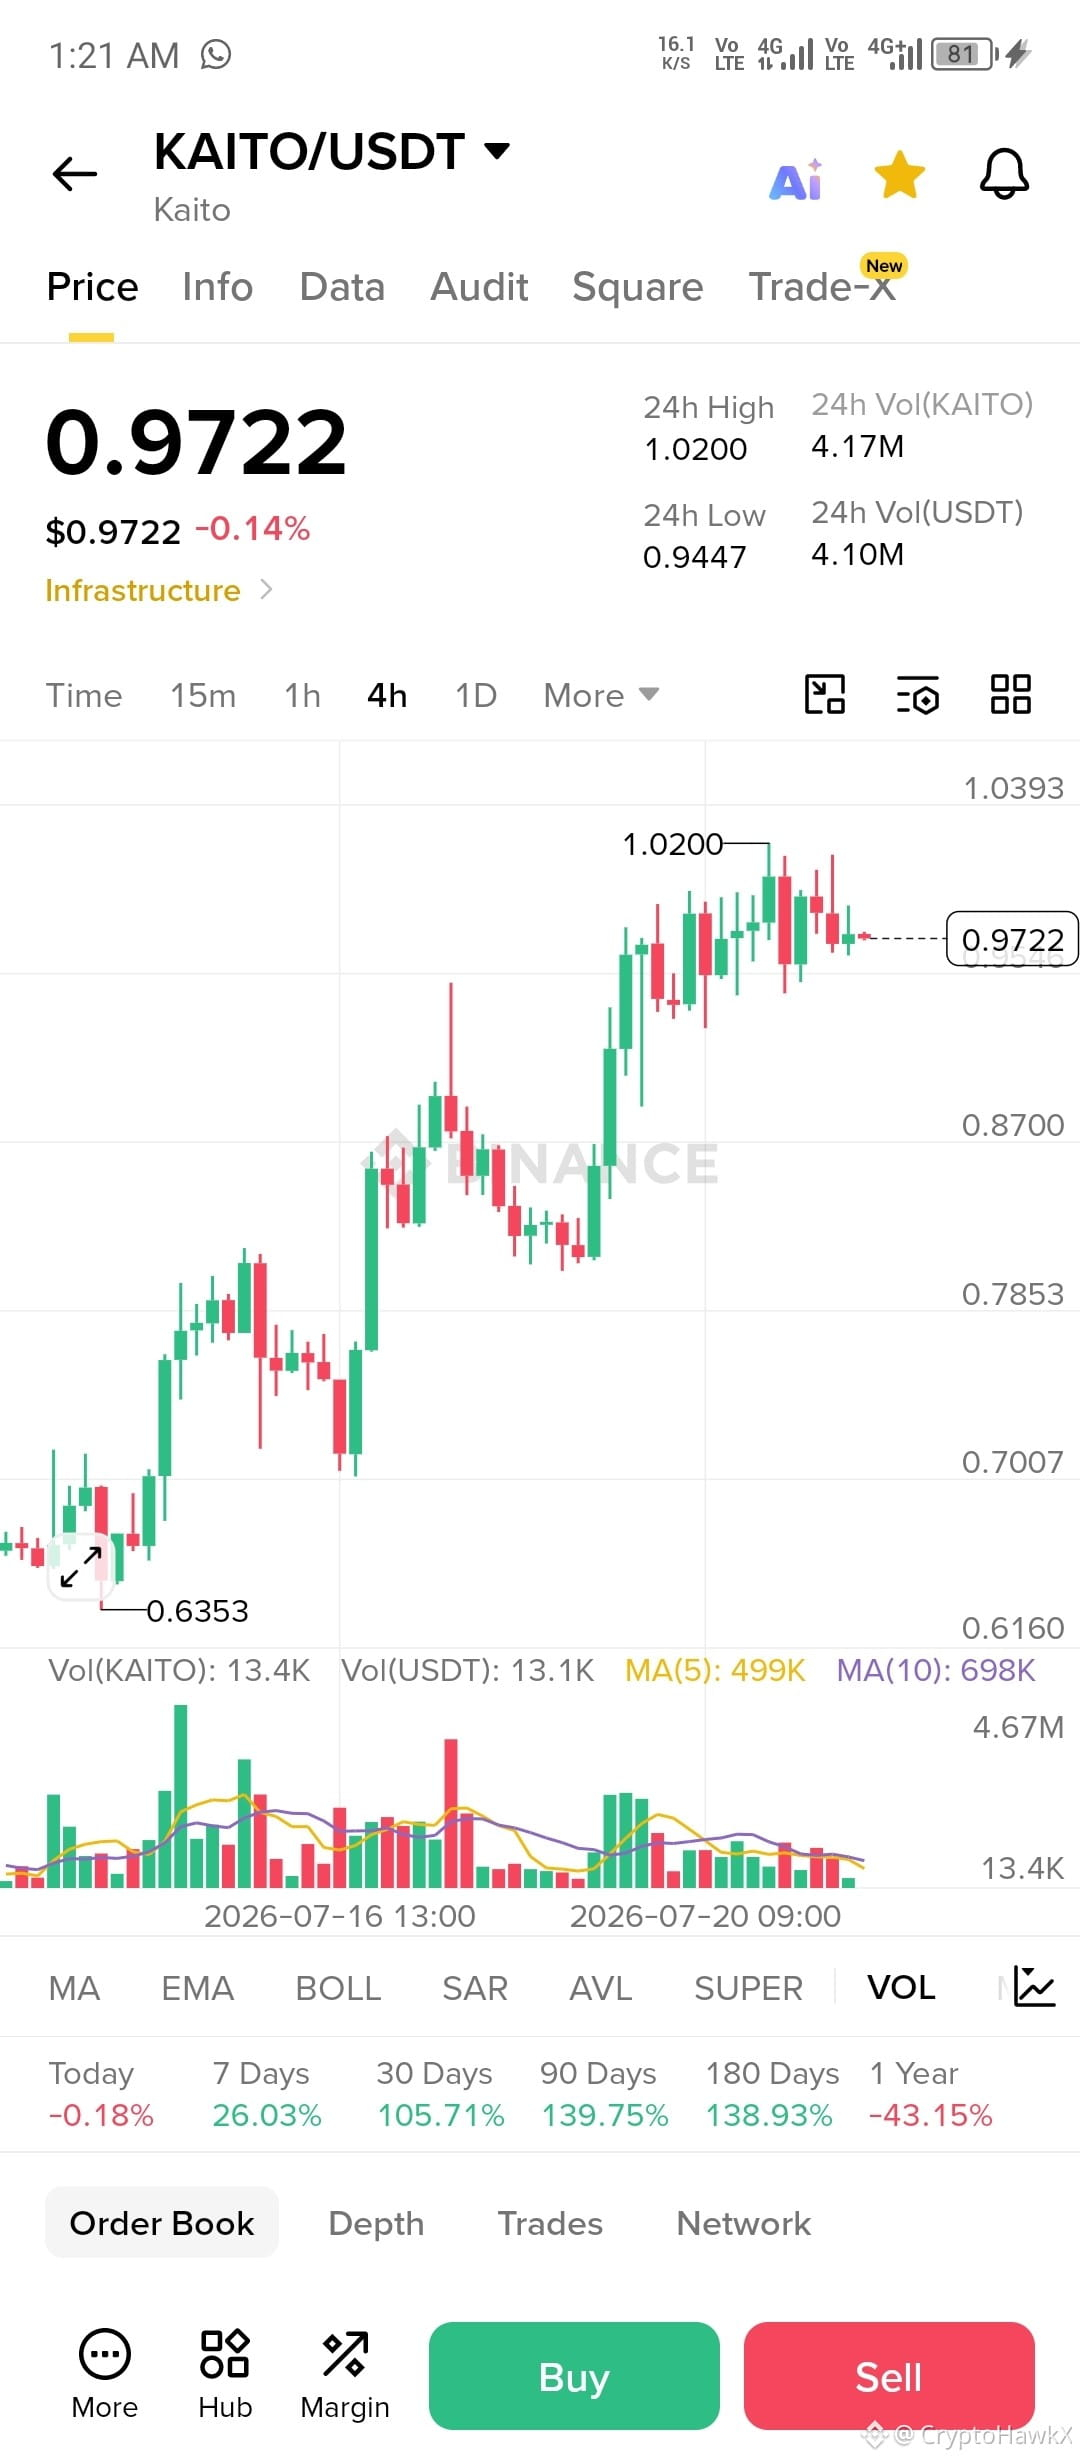
$KAITO
{future}(KAITOUSDT)
KAITO/USDT is maintaining a bullish market structure on the 4H timeframe. Price is consolidating near resistance after a strong rally. A breakout above 1.02 could signal continuation, while holding higher lows keeps the bullish bias intact.
Market Structure: Bullish 📈
Hashtags:
#PriceActionAnalysis #KAITOUSDT #CryptoTrading #MarketStructure2021 #PriceActionPower
$KAITO
KAITO/USDT is maintaining a bullish market structure on the 4H timeframe. Price is consolidating near resistance after a strong rally. A breakout above 1.02 could signal continuation, while holding higher lows keeps the bullish bias intact.
Market Structure: Bullish 📈
Hashtags:
#PriceActionAnalysis #KAITOUSDT #CryptoTrading #MarketStructure2021 #PriceActionPower
KAITO/USDT is maintaining a bullish market structure on the 4H timeframe. Price is consolidating near resistance after a strong rally. A breakout above 1.02 could signal continuation, while holding higher lows keeps the bullish bias intact.
Market Structure: Bullish 📈
Hashtags:
#PriceActionAnalysis #KAITOUSDT #CryptoTrading #MarketStructure2021 #PriceActionPower
130
·
--
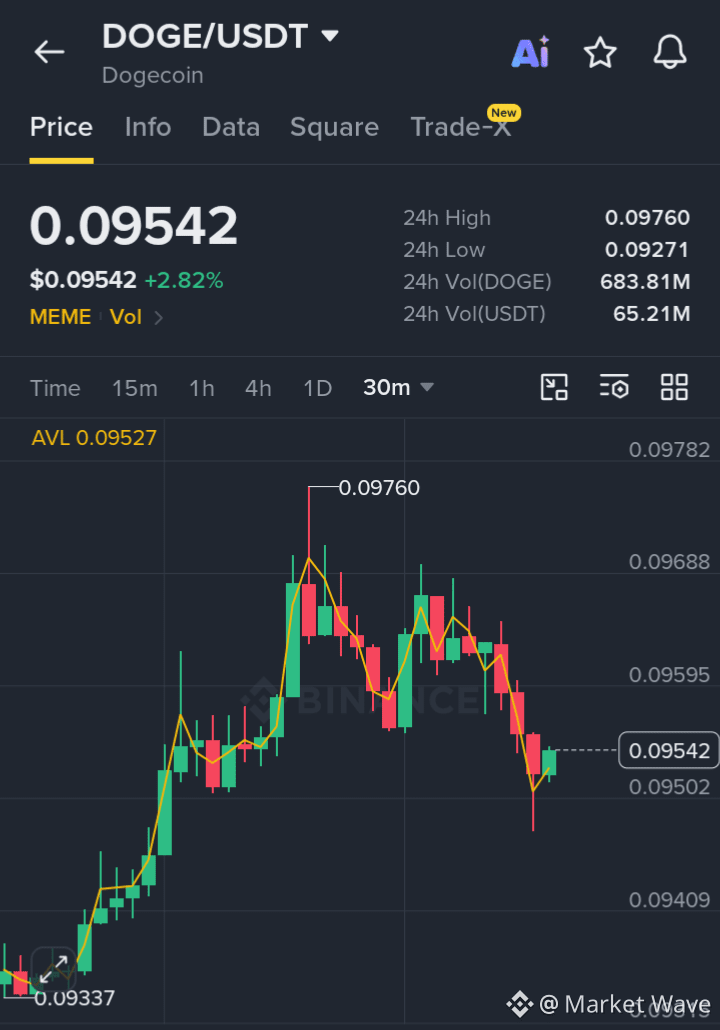
$DOGE/USDT TECHNICAL ANALYSIS: BULLISH REBOUND EXPECTED $DOGE
Target 1: 0.09650
Target 2: 0.09760
Target 3: 0.09880
Stop Loss: 0.09300
#CryptoAnalysis #TechnicalAnalysiss #BullishSetupa #TradingStrategyMis #PriceActionPower
$DOGE /USDT TECHNICAL ANALYSIS: BULLISH REBOUND EXPECTED $DOGE
Target 1: 0.09650
Target 2: 0.09760
Target 3: 0.09880
Stop Loss: 0.09300
#CryptoAnalysis #TechnicalAnalysiss #BullishSetupa #TradingStrategyMis #PriceActionPower
Target 1: 0.09650
Target 2: 0.09760
Target 3: 0.09880
Stop Loss: 0.09300
#CryptoAnalysis #TechnicalAnalysiss #BullishSetupa #TradingStrategyMis #PriceActionPower
72
·
--
Bullish
💰 PROFIT UPDATE | $BANK LONG 🚀
The bulls are defending support exactly as expected.
📈 LONG $BANK is gaining momentum, and buyers continue to build strength from the key demand zone.
🎯 Stay disciplined.
Lock in profits step by step.
Never let greed take back what the market has already given you.
Trade the plan, not the emotions.
$BANK | $BTC | $ETH
#BANK #Crypto #Trading #LONG #Profit #PriceActionPower
💰 PROFIT UPDATE | $BANK LONG 🚀
The bulls are defending support exactly as expected.
📈 LONG $BANK is gaining momentum, and buyers continue to build strength from the key demand zone.
🎯 Stay disciplined.
Lock in profits step by step.
Never let greed take back what the market has already given you.
Trade the plan, not the emotions.
$BANK | $BTC | $ETH
#BANK #Crypto #Trading #LONG #Profit #PriceActionPower
The bulls are defending support exactly as expected.
📈 LONG $BANK is gaining momentum, and buyers continue to build strength from the key demand zone.
🎯 Stay disciplined.
Lock in profits step by step.
Never let greed take back what the market has already given you.
Trade the plan, not the emotions.
$BANK | $BTC | $ETH
#BANK #Crypto #Trading #LONG #Profit #PriceActionPower
181
·
--
Bearish
Based on the 4H chart, SYN/USDT is not bullish or consolidating. It is showing a bearish trend, with a series of lower highs and lower lows after a sharp rejection.
Market Bias: 🔴 Bearish
Short Binance Post:
📉 $SYN /USDT Trade Setup | 4H
SYN remains under selling pressure as the price continues to form lower highs and lower lows. Bears are in control, and the current structure favors downside until a strong reversal or breakout above key resistance occurs. Watch for confirmation before considering any bullish entries.
Bias: 🔴 Bearish
#SYN #BitcoinMiningDifficultyMayFall1.2% #PensionFundsTurnNetBuyersOfKoreanShares #TechnicalAnalysisc #BearishPattern #PriceActionPower
Based on the 4H chart, SYN/USDT is not bullish or consolidating. It is showing a bearish trend, with a series of lower highs and lower lows after a sharp rejection.
Market Bias: 🔴 Bearish
Short Binance Post:
📉 $SYN /USDT Trade Setup | 4H
SYN remains under selling pressure as the price continues to form lower highs and lower lows. Bears are in control, and the current structure favors downside until a strong reversal or breakout above key resistance occurs. Watch for confirmation before considering any bullish entries.
Bias: 🔴 Bearish
#SYN #BitcoinMiningDifficultyMayFall1.2% #PensionFundsTurnNetBuyersOfKoreanShares #TechnicalAnalysisc #BearishPattern #PriceActionPower
Market Bias: 🔴 Bearish
Short Binance Post:
📉 $SYN /USDT Trade Setup | 4H
SYN remains under selling pressure as the price continues to form lower highs and lower lows. Bears are in control, and the current structure favors downside until a strong reversal or breakout above key resistance occurs. Watch for confirmation before considering any bullish entries.
Bias: 🔴 Bearish
#SYN #BitcoinMiningDifficultyMayFall1.2% #PensionFundsTurnNetBuyersOfKoreanShares #TechnicalAnalysisc #BearishPattern #PriceActionPower
34
Log in to explore more content
Join global crypto users on Binance Square
⚡️ Get latest and useful information about crypto.
💬 Trusted by the world’s largest crypto exchange.
👍 Discover real insights from verified creators.
Email / Phone number
Trending Topics
1
#NvidiaLoses$2.7TrillionInMonthAndAHalf
12,001 views
101 Discussing
2
#CanBTCReboundAfterFallingBelow60K?
692,191 views
2,838 Discussing
3
#GlobalStocksFaceLongestLosingStreakSince2023
246,041 views
1,920 Discussing
4
#BlackRockIBITPostsRecord$541MSingleDayOutflow
26,997 views
80 Discussing
5
#AnthropicPlungesTowardIPOPriceonDay2
123,617 views
1,159 Discussing
6
#TwentyOneCapitalAdds172.25BTC
55,126 views
628 Discussing
7
#HKBillWouldExcludeTokenizedDepositsFromVirtualAssets
6,559 views
49 Discussing
8
#BNBDropsBelow540USDTWith8.46%DailyDecline
69,336 views
613 Discussing
9
#HKBillProposesHK$100KFineForUnauthorizedCryptoTitles
2,312 views
22 Discussing
10
#BitMineFaces$10.1BUnrealizedETHLoss
4,652 views
26 Discussing