

#nvdlusdt
nvdlusdt
561 views
12 Discussing
Hot
Latest

·
--
🚀 NVDL BULLISH MOMENTUM: Breaking Resistance! 🚀
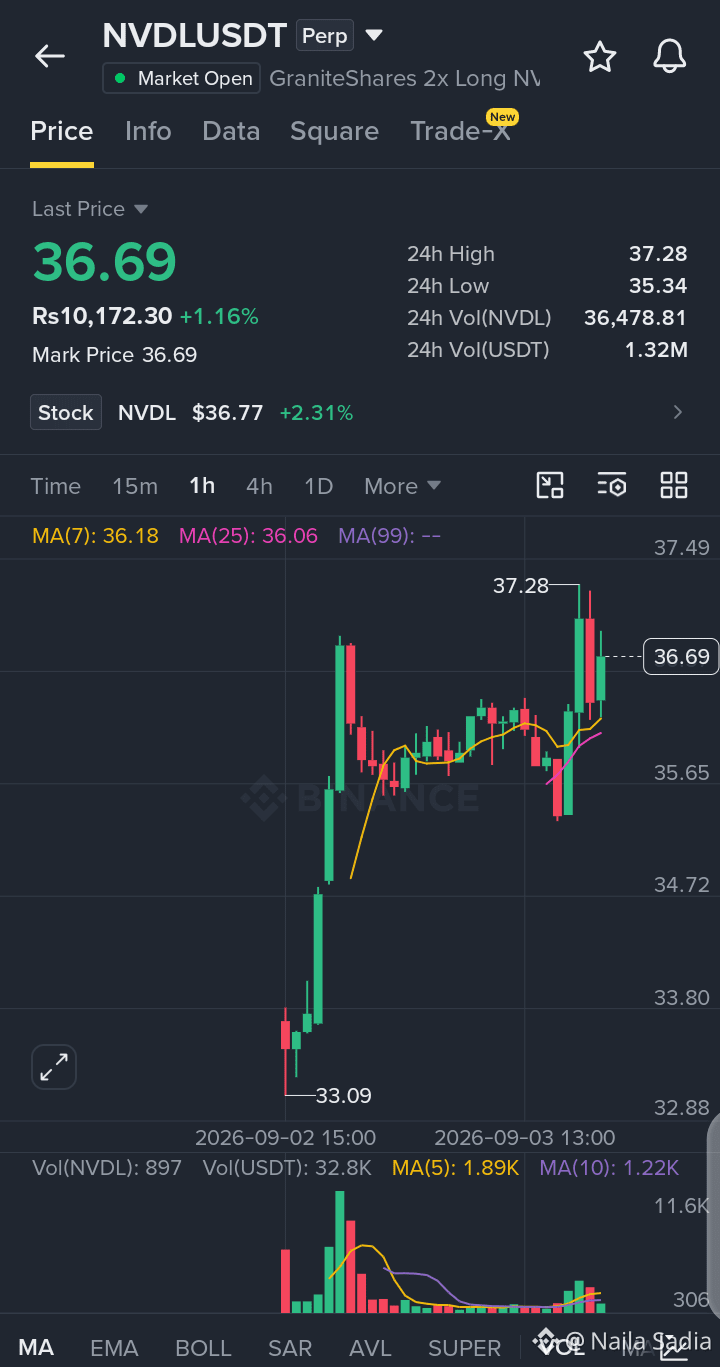
$NVDL (GraniteShares 2x Long NVDA) is pushing higher on the 1H chart, up +1.16% to trade at 36.69. After a explosive rally off the 33.09 low, price is consolidating above its 36.18 MA7 and 36.06 MA25, showing strong buyer control as it targets recent highs.
⚙️ TRADE PLAN:
🚀 Direction: LONG
🚀 Entry: 36.20 – 36.69
🛑 Stop Loss: 35.30
🎯 TP1: 37.28 (24h High)
🎯 TP2: 38.00
🟢 Floor: 36.18 (MA7 Support Zone)
💡 Market View: NVDL has successfully reclaimed its key moving averages following a sharp breakout. As long as price holds above the 36.00–36.18 support pocket, the path remains open for a retest and breakout above 37.28.
👇 Will NVDL clear 37.28 next or retest MA7 support first? Comment below! 👇
👉 Click here for trade:
$NVDL
{future}(NVDLUSDT)
#NVDLUSDT #NVDL #cryptotrading #BinanceSquare #TechnicalAnalysis
🚀 NVDL BULLISH MOMENTUM: Breaking Resistance! 🚀
$NVDL (GraniteShares 2x Long NVDA) is pushing higher on the 1H chart, up +1.16% to trade at 36.69. After a explosive rally off the 33.09 low, price is consolidating above its 36.18 MA7 and 36.06 MA25, showing strong buyer control as it targets recent highs.
⚙️ TRADE PLAN:
🚀 Direction: LONG
🚀 Entry: 36.20 – 36.69
🛑 Stop Loss: 35.30
🎯 TP1: 37.28 (24h High)
🎯 TP2: 38.00
🟢 Floor: 36.18 (MA7 Support Zone)
💡 Market View: NVDL has successfully reclaimed its key moving averages following a sharp breakout. As long as price holds above the 36.00–36.18 support pocket, the path remains open for a retest and breakout above 37.28.
👇 Will NVDL clear 37.28 next or retest MA7 support first? Comment below! 👇
👉 Click here for trade:
$NVDL
#NVDLUSDT #NVDL #cryptotrading #BinanceSquare #TechnicalAnalysis
$NVDL (GraniteShares 2x Long NVDA) is pushing higher on the 1H chart, up +1.16% to trade at 36.69. After a explosive rally off the 33.09 low, price is consolidating above its 36.18 MA7 and 36.06 MA25, showing strong buyer control as it targets recent highs.
⚙️ TRADE PLAN:
🚀 Direction: LONG
🚀 Entry: 36.20 – 36.69
🛑 Stop Loss: 35.30
🎯 TP1: 37.28 (24h High)
🎯 TP2: 38.00
🟢 Floor: 36.18 (MA7 Support Zone)
💡 Market View: NVDL has successfully reclaimed its key moving averages following a sharp breakout. As long as price holds above the 36.00–36.18 support pocket, the path remains open for a retest and breakout above 37.28.
👇 Will NVDL clear 37.28 next or retest MA7 support first? Comment below! 👇
👉 Click here for trade:
$NVDL
#NVDLUSDT #NVDL #cryptotrading #BinanceSquare #TechnicalAnalysis
144

🍄 The endless sprouting of new technology ideas enriches the market and increases the value of assets.
🎯 LONG $NVDL
Entry: 36.47
TP: 38.293 | SL: 32.823
🛰️ The increase in the active wallet suggests that money flow is very dynamic.
📊 The Elder Ray indicator shows buying pressure is surging to high levels.
📈 Always remember your original goal when you begin your journey into crypto.
🌸 May the joy of victory always be with you on every path.
#NVDLUSDT $NVDLUSDT
🍄 The endless sprouting of new technology ideas enriches the market and increases the value of assets.
🎯 LONG $NVDL
Entry: 36.47
TP: 38.293 | SL: 32.823
🛰️ The increase in the active wallet suggests that money flow is very dynamic.
📊 The Elder Ray indicator shows buying pressure is surging to high levels.
📈 Always remember your original goal when you begin your journey into crypto.
🌸 May the joy of victory always be with you on every path.
#NVDLUSDT $NVDLUSDT
🎯 LONG $NVDL
Entry: 36.47
TP: 38.293 | SL: 32.823
🛰️ The increase in the active wallet suggests that money flow is very dynamic.
📊 The Elder Ray indicator shows buying pressure is surging to high levels.
📈 Always remember your original goal when you begin your journey into crypto.
🌸 May the joy of victory always be with you on every path.
#NVDLUSDT $NVDLUSDT
50

finally finally launch the new coin......
$NVDL /USDT LONG TRADE
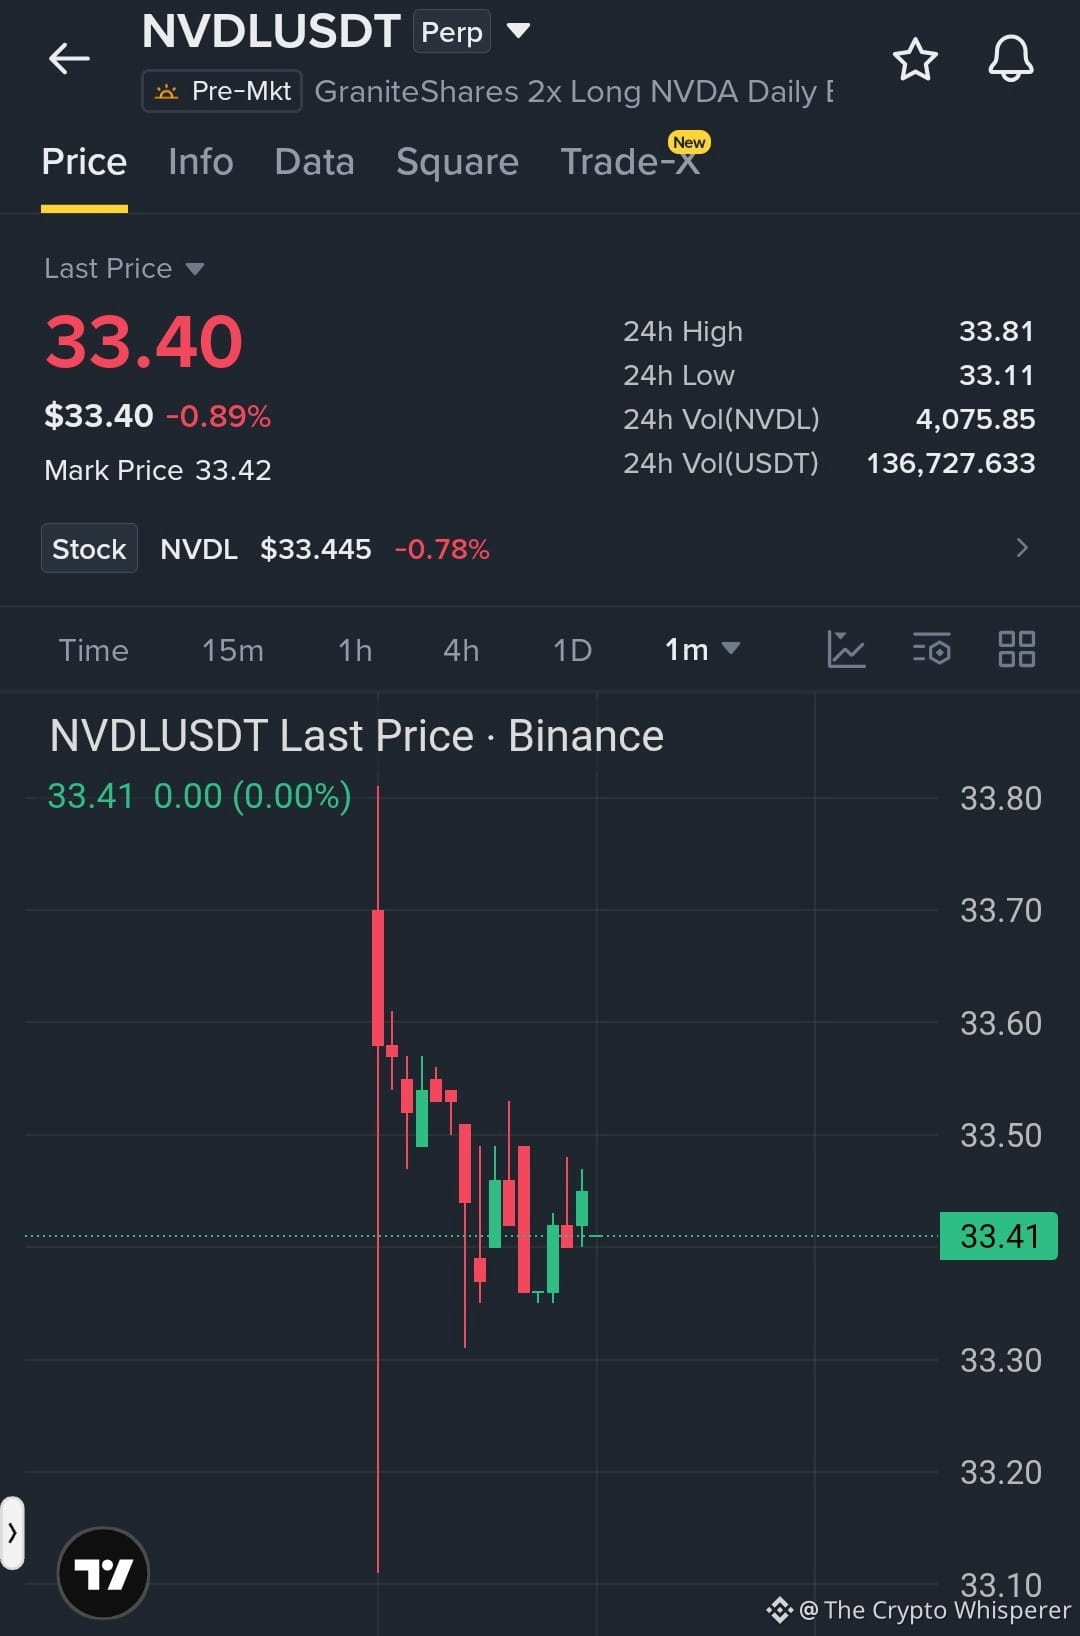
📈 Price is consolidating around 33.40 after bouncing from 33.30–33.35 support. A break above 33.50 can open the way for further upside.
🎯 Trade Setup: • Entry: 33.40–33.45 • TP1: 33.55 • TP2: 33.65 • TP3: 33.75 • SL: 33.30
🔭 Short Outlook: A breakdown below 33.30 could weaken the setup and send price toward 33.20–33.10.
#NVDLUSDT #LongSignal #CryptoTrading #TechnicalAnalysis
finally finally launch the new coin......
$NVDL /USDT LONG TRADE
📈 Price is consolidating around 33.40 after bouncing from 33.30–33.35 support. A break above 33.50 can open the way for further upside.
🎯 Trade Setup: • Entry: 33.40–33.45 • TP1: 33.55 • TP2: 33.65 • TP3: 33.75 • SL: 33.30
🔭 Short Outlook: A breakdown below 33.30 could weaken the setup and send price toward 33.20–33.10.
#NVDLUSDT #LongSignal #CryptoTrading #TechnicalAnalysis
$NVDL /USDT LONG TRADE
📈 Price is consolidating around 33.40 after bouncing from 33.30–33.35 support. A break above 33.50 can open the way for further upside.
🎯 Trade Setup: • Entry: 33.40–33.45 • TP1: 33.55 • TP2: 33.65 • TP3: 33.75 • SL: 33.30
🔭 Short Outlook: A breakdown below 33.30 could weaken the setup and send price toward 33.20–33.10.
#NVDLUSDT #LongSignal #CryptoTrading #TechnicalAnalysis
138


·
--
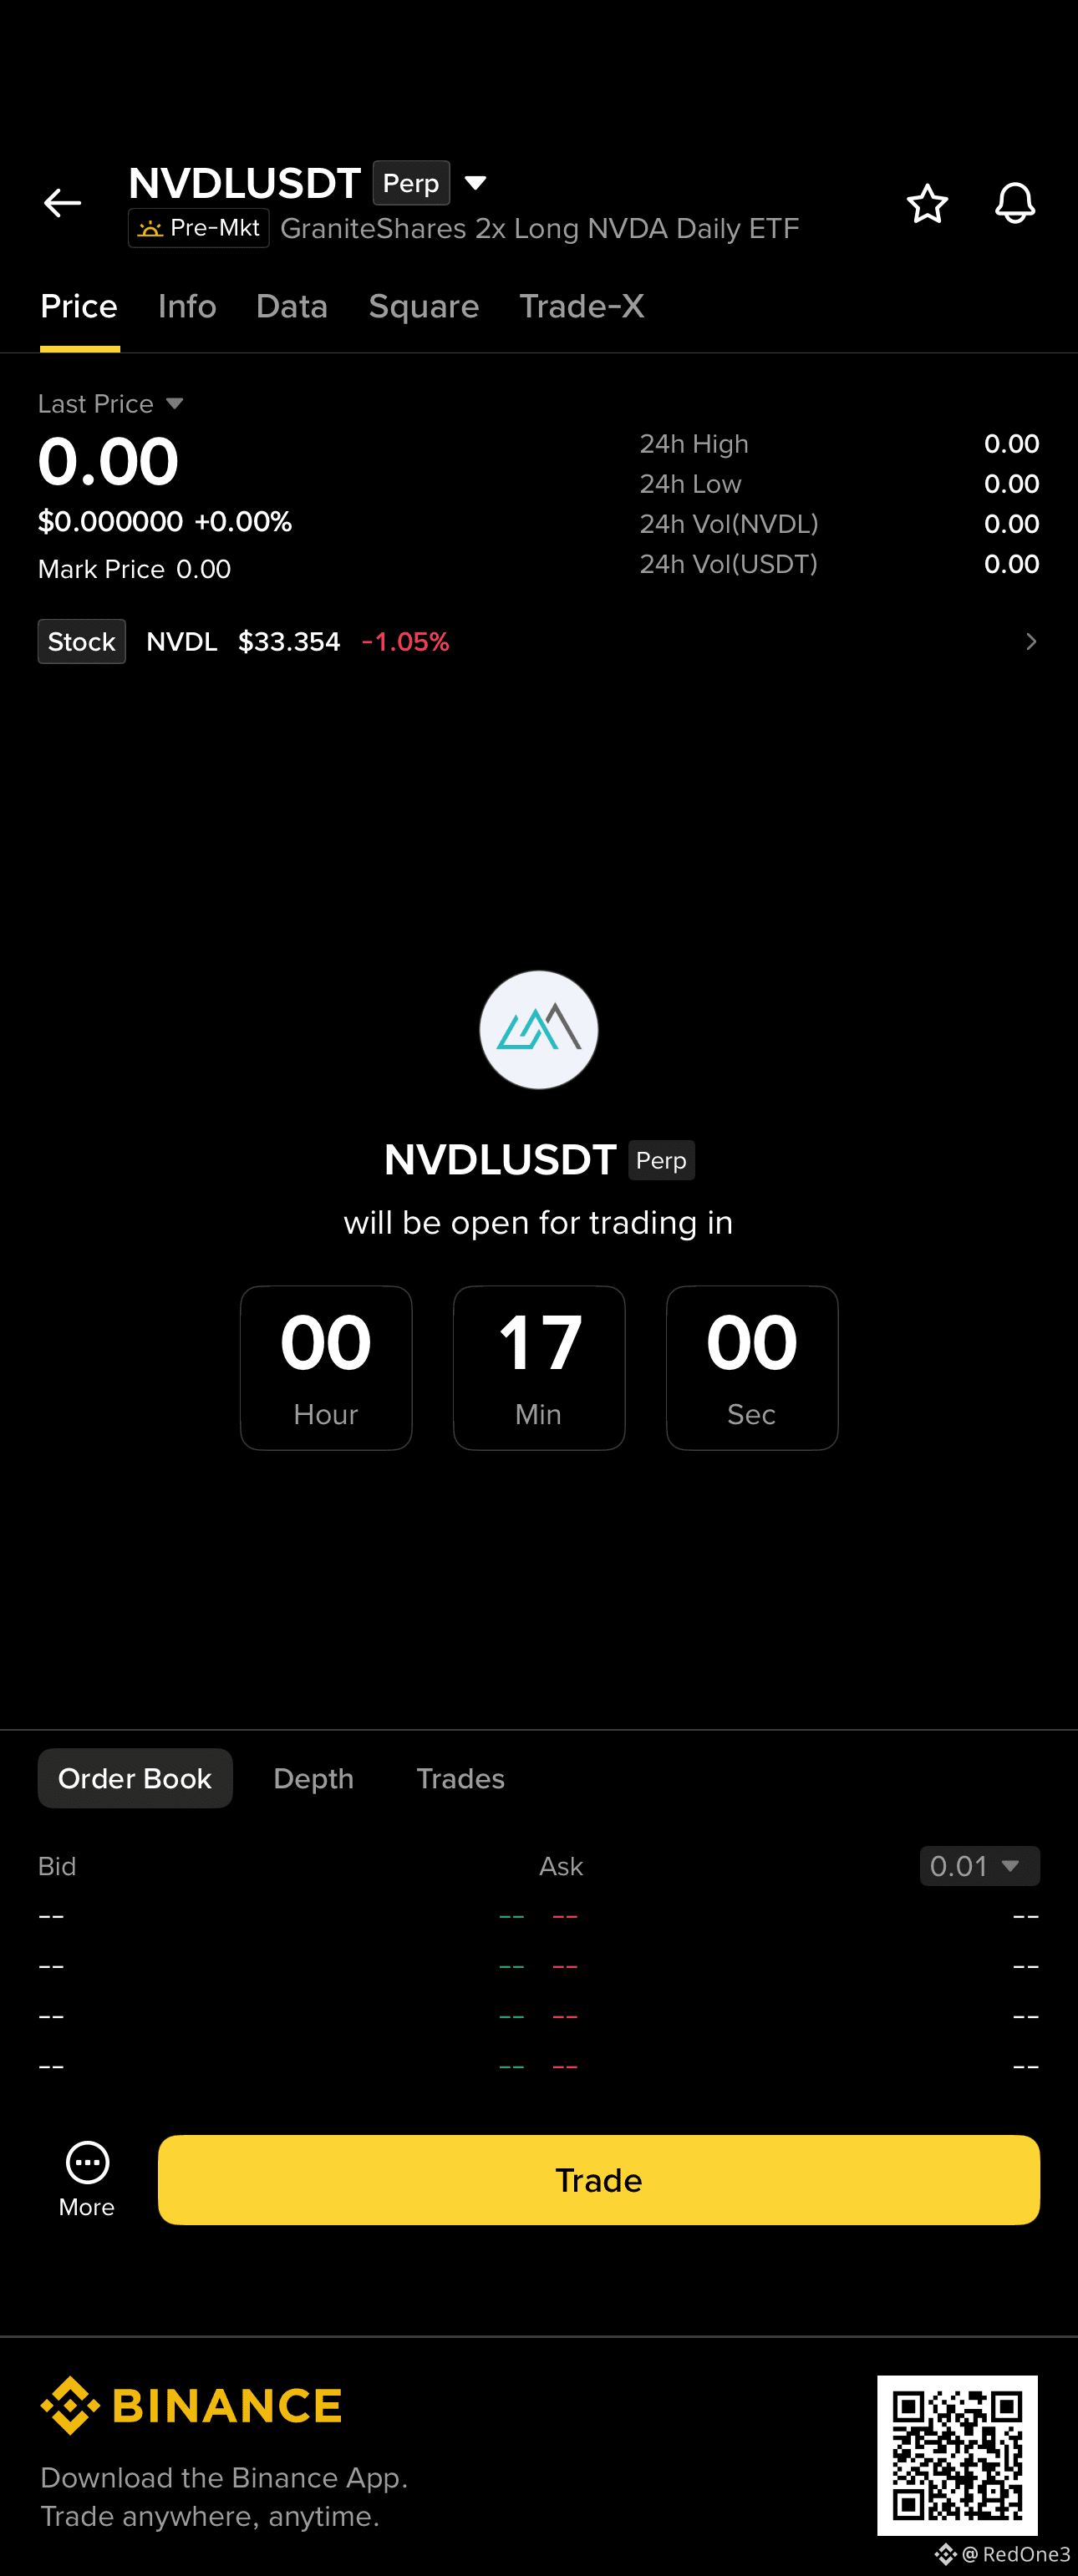
🚀 New Listing Alert: NVDLUSDT Perpetual Contract is Live Soon!
Trade the price action of GraniteShares 2x Long NVDA Daily ETF (NVDL) directly on Binance Futures with USDT margin! 📈⚡️
Get ready to leverage your positions on NVIDIA's leveraged ETF with up to 24/7 exposure.
⏳ Trading opens in just a few minutes!
Check the order book and prepare your strategies:
Risk Warning: Crypto derivatives trading involves significant risk and leverage can amplify both gains and losses. Trade responsibly.
#NVDLUSDT #NVDIA $NVDAB
🚀 New Listing Alert: NVDLUSDT Perpetual Contract is Live Soon!
Trade the price action of GraniteShares 2x Long NVDA Daily ETF (NVDL) directly on Binance Futures with USDT margin! 📈⚡️
Get ready to leverage your positions on NVIDIA's leveraged ETF with up to 24/7 exposure.
⏳ Trading opens in just a few minutes!
Check the order book and prepare your strategies:
Risk Warning: Crypto derivatives trading involves significant risk and leverage can amplify both gains and losses. Trade responsibly.
#NVDLUSDT #NVDIA $NVDAB
Trade the price action of GraniteShares 2x Long NVDA Daily ETF (NVDL) directly on Binance Futures with USDT margin! 📈⚡️
Get ready to leverage your positions on NVIDIA's leveraged ETF with up to 24/7 exposure.
⏳ Trading opens in just a few minutes!
Check the order book and prepare your strategies:
Risk Warning: Crypto derivatives trading involves significant risk and leverage can amplify both gains and losses. Trade responsibly.
#NVDLUSDT #NVDIA $NVDAB
Sourced by user sharing on Binance
435

·
--
[M1_mag7]
In the past 24 hours it dropped 1.341%, closing at 34.58. The intraday swings of this on-chain perpetual contract, $NVDL, match the “hold your breath” feeling that US stock tech giants create right before Monday’s trading opens. The perpetual funding rate is 0—an absolutely neutral number—which means neither the longs nor the shorts are paying anyone right now; the leveraged market has, for the moment, drawn level on this particular scoreboard.
Put simply, a zero funding rate is a somewhat counterintuitive signal in the current environment. When prices fall, and market sentiment is skewed bearish, shorts would typically pay longs (i.e., the funding rate would be negative). Now it’s zero, meaning that even though the price is dropping, the force driving active shorting—and the willingness to pay the cost for it—is not as strong as people might assume. Likewise, the long side hasn’t been aggressive enough to bid up the price using a positive funding rate to snap up positions. With an open interest of 4727.70 units and a trading volume of $108,777.75, the numbers themselves aren’t large and liquidity isn’t very robust. This creates a point of observation: against the backdrop of the Mag7 segment being deeply tied to SPY/QQQ, the on-chain order book for $NVDL shows a low-liquidity, short-term standoff between longs and shorts—it’s not the leading indicator of this tech-stock volatility; it’s more like a shadow that follows along but lacks sufficient sensitivity.
So, old dog’s view is: $NVDL’s on-chain perpetuals are currently stuck in a liquidity trough that the market has temporarily forgotten. They track the volatility of the underlying asset (US tech giants), but the contract’s own pricing and leverage interest are oscillating at low levels. The strongest counter-evidence is this: if SPY or QQQ at the current level were to break out clearly in either direction, this stalemate would be shattered instantly. A large amount of capital would rush into a contract that hasn’t been priced sufficiently, causing both the contract price and the funding rate to swing sharply. Next, if the broader market chooses a direction, the cost will likely be borne by the holders who currently have relatively small positions but aren’t firmly committed in terms of direction. They’ll be forced to make a quick choice, and the sudden influx of liquidity would amplify the contract’s short-term deviation relative to the underlying.
My current action: observe, don’t touch. Add this product to a key watchlist. The condition to trigger adding to the position is: $NVDL price breaking out on increased volume above the upper bound of the current range (based on the existing 34.58 price, we need to see a strong, sustained pull upward on consecutive hour-level candles), and at the same time the funding rate turns positive and keeps rising.
Trading tag: #BinanceFutures #TradFi #USDⓈM #NVDL #NVDLUSDT $NVDL
[M1_mag7]
In the past 24 hours it dropped 1.341%, closing at 34.58. The intraday swings of this on-chain perpetual contract, $NVDL , match the “hold your breath” feeling that US stock tech giants create right before Monday’s trading opens. The perpetual funding rate is 0—an absolutely neutral number—which means neither the longs nor the shorts are paying anyone right now; the leveraged market has, for the moment, drawn level on this particular scoreboard.
Put simply, a zero funding rate is a somewhat counterintuitive signal in the current environment. When prices fall, and market sentiment is skewed bearish, shorts would typically pay longs (i.e., the funding rate would be negative). Now it’s zero, meaning that even though the price is dropping, the force driving active shorting—and the willingness to pay the cost for it—is not as strong as people might assume. Likewise, the long side hasn’t been aggressive enough to bid up the price using a positive funding rate to snap up positions. With an open interest of 4727.70 units and a trading volume of $108,777.75, the numbers themselves aren’t large and liquidity isn’t very robust. This creates a point of observation: against the backdrop of the Mag7 segment being deeply tied to SPY/QQQ, the on-chain order book for $NVDL shows a low-liquidity, short-term standoff between longs and shorts—it’s not the leading indicator of this tech-stock volatility; it’s more like a shadow that follows along but lacks sufficient sensitivity.
So, old dog’s view is: $NVDL ’s on-chain perpetuals are currently stuck in a liquidity trough that the market has temporarily forgotten. They track the volatility of the underlying asset (US tech giants), but the contract’s own pricing and leverage interest are oscillating at low levels. The strongest counter-evidence is this: if SPY or QQQ at the current level were to break out clearly in either direction, this stalemate would be shattered instantly. A large amount of capital would rush into a contract that hasn’t been priced sufficiently, causing both the contract price and the funding rate to swing sharply. Next, if the broader market chooses a direction, the cost will likely be borne by the holders who currently have relatively small positions but aren’t firmly committed in terms of direction. They’ll be forced to make a quick choice, and the sudden influx of liquidity would amplify the contract’s short-term deviation relative to the underlying.
My current action: observe, don’t touch. Add this product to a key watchlist. The condition to trigger adding to the position is: $NVDL price breaking out on increased volume above the upper bound of the current range (based on the existing 34.58 price, we need to see a strong, sustained pull upward on consecutive hour-level candles), and at the same time the funding rate turns positive and keeps rising.
Trading tag: #BinanceFutures #TradFi #USDⓈM #NVDL #NVDLUSDT $NVDL
In the past 24 hours it dropped 1.341%, closing at 34.58. The intraday swings of this on-chain perpetual contract, $NVDL , match the “hold your breath” feeling that US stock tech giants create right before Monday’s trading opens. The perpetual funding rate is 0—an absolutely neutral number—which means neither the longs nor the shorts are paying anyone right now; the leveraged market has, for the moment, drawn level on this particular scoreboard.
Put simply, a zero funding rate is a somewhat counterintuitive signal in the current environment. When prices fall, and market sentiment is skewed bearish, shorts would typically pay longs (i.e., the funding rate would be negative). Now it’s zero, meaning that even though the price is dropping, the force driving active shorting—and the willingness to pay the cost for it—is not as strong as people might assume. Likewise, the long side hasn’t been aggressive enough to bid up the price using a positive funding rate to snap up positions. With an open interest of 4727.70 units and a trading volume of $108,777.75, the numbers themselves aren’t large and liquidity isn’t very robust. This creates a point of observation: against the backdrop of the Mag7 segment being deeply tied to SPY/QQQ, the on-chain order book for $NVDL shows a low-liquidity, short-term standoff between longs and shorts—it’s not the leading indicator of this tech-stock volatility; it’s more like a shadow that follows along but lacks sufficient sensitivity.
So, old dog’s view is: $NVDL ’s on-chain perpetuals are currently stuck in a liquidity trough that the market has temporarily forgotten. They track the volatility of the underlying asset (US tech giants), but the contract’s own pricing and leverage interest are oscillating at low levels. The strongest counter-evidence is this: if SPY or QQQ at the current level were to break out clearly in either direction, this stalemate would be shattered instantly. A large amount of capital would rush into a contract that hasn’t been priced sufficiently, causing both the contract price and the funding rate to swing sharply. Next, if the broader market chooses a direction, the cost will likely be borne by the holders who currently have relatively small positions but aren’t firmly committed in terms of direction. They’ll be forced to make a quick choice, and the sudden influx of liquidity would amplify the contract’s short-term deviation relative to the underlying.
My current action: observe, don’t touch. Add this product to a key watchlist. The condition to trigger adding to the position is: $NVDL price breaking out on increased volume above the upper bound of the current range (based on the existing 34.58 price, we need to see a strong, sustained pull upward on consecutive hour-level candles), and at the same time the funding rate turns positive and keeps rising.
Trading tag: #BinanceFutures #TradFi #USDⓈM #NVDL #NVDLUSDT $NVDL
95
·
--
An old dog glanced at $NVDL: the price was 31.94, down 3.882% over the past 24 hours, with trading volume surging to nearly 300,000 lots. But the funding rate still calmly sits at 0. This scene is kind of interesting. In the semiconductor chain, the underlying is down—but in the funding market, neither the longs nor the shorts have really paid each other money. The market is in a delicate balance state.
From the perspective of the M2_semi semiconductor/AI chain, this pullback isn’t small, especially without any secondary meme for comparison—so you can only focus on $NVDL itself. Trading volume of 299,365.952 versus open interest of 5,693.83 implies extremely high turnover, suggesting frequent in-and-out activity from short-term funds, yet the price remains under pressure. The key point is the funding rate being 0. It’s neither positive nor negative, meaning the current position cost is the same for both longs and shorts—there’s no classic “longs crowded” or “shorts crowded” signal. In a funding-rate-neutral environment, a price drop is more likely attributable to spot selling pressure or new short positions opening, rather than existing long positions being forced out via liquidation.
So my view is that the current weakness is driven more by spot selling or sentiment, not by a systemic risk showing up in the derivatives market. With the funding rate at zero, it indicates position costs are balanced, and during the decline there hasn’t formed the typical squeeze structure—longs holding on to bleed negative funding, or shorts being forced out by positive funding. That implies the price may stop falling and stabilize without first squeezing out a batch of stubborn counterparty positions.
What’s the strongest counter-evidence? It’s the trading volume itself. If during the drop the volume continues to expand and the funding rate remains 0, it could also mean shorts are constantly opening new positions, and since they’re not paying funding costs for the moment, the downtrend could have more inertia. But we don’t currently have enough continuous data to verify that. On a second-order impact: if the price keeps drifting lower under a zero funding rate, it may attract even more short-term shorts to enter, until the funding rate turns negative—then the situation may shift.
My invalidation conditions are very clear: the funding rate turns. If next the funding rate turns positive, even slightly—say to +0.01%—while the price is still falling, that would mean longs are passively adding or stubbornly holding, and my original judgment would be wrong: the market would enter a more dangerous long-squeeze/crowding phase. Conversely, if the funding rate turns negative and the price rebounds, that’s a signal of a short squeeze. Right now the funding rate is 0, so my action is straightforward: observe, not rush in. Wait until the funding rate shows a clear directional tilt (for example, continuously above or below ±0.01%), and then decide.
Trading tag: #BinanceFutures #TradFi #USDⓈM #NVDL #NVDLUSDT $NVDL
An old dog glanced at $NVDL : the price was 31.94, down 3.882% over the past 24 hours, with trading volume surging to nearly 300,000 lots. But the funding rate still calmly sits at 0. This scene is kind of interesting. In the semiconductor chain, the underlying is down—but in the funding market, neither the longs nor the shorts have really paid each other money. The market is in a delicate balance state.
From the perspective of the M2_semi semiconductor/AI chain, this pullback isn’t small, especially without any secondary meme for comparison—so you can only focus on $NVDL itself. Trading volume of 299,365.952 versus open interest of 5,693.83 implies extremely high turnover, suggesting frequent in-and-out activity from short-term funds, yet the price remains under pressure. The key point is the funding rate being 0. It’s neither positive nor negative, meaning the current position cost is the same for both longs and shorts—there’s no classic “longs crowded” or “shorts crowded” signal. In a funding-rate-neutral environment, a price drop is more likely attributable to spot selling pressure or new short positions opening, rather than existing long positions being forced out via liquidation.
So my view is that the current weakness is driven more by spot selling or sentiment, not by a systemic risk showing up in the derivatives market. With the funding rate at zero, it indicates position costs are balanced, and during the decline there hasn’t formed the typical squeeze structure—longs holding on to bleed negative funding, or shorts being forced out by positive funding. That implies the price may stop falling and stabilize without first squeezing out a batch of stubborn counterparty positions.
What’s the strongest counter-evidence? It’s the trading volume itself. If during the drop the volume continues to expand and the funding rate remains 0, it could also mean shorts are constantly opening new positions, and since they’re not paying funding costs for the moment, the downtrend could have more inertia. But we don’t currently have enough continuous data to verify that. On a second-order impact: if the price keeps drifting lower under a zero funding rate, it may attract even more short-term shorts to enter, until the funding rate turns negative—then the situation may shift.
My invalidation conditions are very clear: the funding rate turns. If next the funding rate turns positive, even slightly—say to +0.01%—while the price is still falling, that would mean longs are passively adding or stubbornly holding, and my original judgment would be wrong: the market would enter a more dangerous long-squeeze/crowding phase. Conversely, if the funding rate turns negative and the price rebounds, that’s a signal of a short squeeze. Right now the funding rate is 0, so my action is straightforward: observe, not rush in. Wait until the funding rate shows a clear directional tilt (for example, continuously above or below ±0.01%), and then decide.
Trading tag: #BinanceFutures #TradFi #USDⓈM #NVDL #NVDLUSDT $NVDL
From the perspective of the M2_semi semiconductor/AI chain, this pullback isn’t small, especially without any secondary meme for comparison—so you can only focus on $NVDL itself. Trading volume of 299,365.952 versus open interest of 5,693.83 implies extremely high turnover, suggesting frequent in-and-out activity from short-term funds, yet the price remains under pressure. The key point is the funding rate being 0. It’s neither positive nor negative, meaning the current position cost is the same for both longs and shorts—there’s no classic “longs crowded” or “shorts crowded” signal. In a funding-rate-neutral environment, a price drop is more likely attributable to spot selling pressure or new short positions opening, rather than existing long positions being forced out via liquidation.
So my view is that the current weakness is driven more by spot selling or sentiment, not by a systemic risk showing up in the derivatives market. With the funding rate at zero, it indicates position costs are balanced, and during the decline there hasn’t formed the typical squeeze structure—longs holding on to bleed negative funding, or shorts being forced out by positive funding. That implies the price may stop falling and stabilize without first squeezing out a batch of stubborn counterparty positions.
What’s the strongest counter-evidence? It’s the trading volume itself. If during the drop the volume continues to expand and the funding rate remains 0, it could also mean shorts are constantly opening new positions, and since they’re not paying funding costs for the moment, the downtrend could have more inertia. But we don’t currently have enough continuous data to verify that. On a second-order impact: if the price keeps drifting lower under a zero funding rate, it may attract even more short-term shorts to enter, until the funding rate turns negative—then the situation may shift.
My invalidation conditions are very clear: the funding rate turns. If next the funding rate turns positive, even slightly—say to +0.01%—while the price is still falling, that would mean longs are passively adding or stubbornly holding, and my original judgment would be wrong: the market would enter a more dangerous long-squeeze/crowding phase. Conversely, if the funding rate turns negative and the price rebounds, that’s a signal of a short squeeze. Right now the funding rate is 0, so my action is straightforward: observe, not rush in. Wait until the funding rate shows a clear directional tilt (for example, continuously above or below ±0.01%), and then decide.
Trading tag: #BinanceFutures #TradFi #USDⓈM #NVDL #NVDLUSDT $NVDL
38
·
--
$NVDL In the past 24 hours, it dropped 2.495%. The price is hovering around 33.22. Trading volume is about 62,000 units. The funding rate stays at zero, and the open interest remains at 4807.72. The old dog took a quick look: this set of data is laid out on the order book for the semiconductor/AI track—like a neutral thermometer. It’s down, but there’s no panic; the funding rate isn’t skewed; and the position hasn’t been liquidated. The angle is M2_semi—watching sector peers and where we are in the cycle—but since the input didn’t include secondary data for other coins, I can only dig it out from $NVDL itself.
Why is the semiconductor chain “catching its breath” right now? From the funding rate: a zero funding rate means neither bulls nor bears are being forced to pay. Market sentiment isn’t cold or hot—it’s not crowded enough to blow someone up. With open interest at 4807.72, compared to 62,000 traded in the last 24 hours, turnover isn’t particularly fierce. The old dog judges this isn’t panic selling; it looks more like a natural pullback from a high point in the cycle. In the industry, people often say AI and semiconductors are in the middle stage of a technical upgrade cycle—demand is holding up, but valuations still need to digest. As an on-chain “US equities” proxy, $NVDL follows the swings of giants like Nvidia, but since the input doesn’t provide specific peer data, I won’t make anything up. With a single signal: price falling alongside a zero funding rate suggests selling pressure may come from profit-taking rather than bears pushing the market down. Because if bears were truly strong, the funding rate should turn negative.
So my take is: this drop in $NVDL is part of the semiconductor chain’s cycle adjustment, not a trend reversal. The trigger is simple: if the price breaks below 33.00 (near the low area of the past 24 hours), I’ll cut my position by 30%, because a breakdown could cause longs to stop out along the chain. If the funding rate turns positive and the price rebounds, I’ll watch whether it’s a fake breakout. The contrarian part is that the market might treat a zero funding rate as a safety cushion, but the old dog thinks a zero funding rate actually reveals directional ambiguity. In that kind of situation, chasing higher can trap you somewhere around mid-mountain. As for positioning: I advocate staying light and observing, not going heavy on a bet—wait for the semiconductor chain to produce a clear signal, like a sudden spike in open interest or the funding rate tilting.
Where can this judgment most easily be wrong? If the semiconductor industry suddenly releases good news—say, AI application rollout accelerates or policy support arrives—$NVDL could quickly regain lost ground. Then a break above 34.00 (recent resistance reference) would mean the adjustment is over, and I’d need to撤销 my bearish stance. Or if the funding rate suddenly turns negative, indicating the bears are gaining strength, the drop may continue—but the current data doesn’t support that.
Trading tag: #BinanceFutures #TradFi #USDⓈM #NVDL #NVDLUSDT $NVDL
$NVDL In the past 24 hours, it dropped 2.495%. The price is hovering around 33.22. Trading volume is about 62,000 units. The funding rate stays at zero, and the open interest remains at 4807.72. The old dog took a quick look: this set of data is laid out on the order book for the semiconductor/AI track—like a neutral thermometer. It’s down, but there’s no panic; the funding rate isn’t skewed; and the position hasn’t been liquidated. The angle is M2_semi—watching sector peers and where we are in the cycle—but since the input didn’t include secondary data for other coins, I can only dig it out from $NVDL itself.
Why is the semiconductor chain “catching its breath” right now? From the funding rate: a zero funding rate means neither bulls nor bears are being forced to pay. Market sentiment isn’t cold or hot—it’s not crowded enough to blow someone up. With open interest at 4807.72, compared to 62,000 traded in the last 24 hours, turnover isn’t particularly fierce. The old dog judges this isn’t panic selling; it looks more like a natural pullback from a high point in the cycle. In the industry, people often say AI and semiconductors are in the middle stage of a technical upgrade cycle—demand is holding up, but valuations still need to digest. As an on-chain “US equities” proxy, $NVDL follows the swings of giants like Nvidia, but since the input doesn’t provide specific peer data, I won’t make anything up. With a single signal: price falling alongside a zero funding rate suggests selling pressure may come from profit-taking rather than bears pushing the market down. Because if bears were truly strong, the funding rate should turn negative.
So my take is: this drop in $NVDL is part of the semiconductor chain’s cycle adjustment, not a trend reversal. The trigger is simple: if the price breaks below 33.00 (near the low area of the past 24 hours), I’ll cut my position by 30%, because a breakdown could cause longs to stop out along the chain. If the funding rate turns positive and the price rebounds, I’ll watch whether it’s a fake breakout. The contrarian part is that the market might treat a zero funding rate as a safety cushion, but the old dog thinks a zero funding rate actually reveals directional ambiguity. In that kind of situation, chasing higher can trap you somewhere around mid-mountain. As for positioning: I advocate staying light and observing, not going heavy on a bet—wait for the semiconductor chain to produce a clear signal, like a sudden spike in open interest or the funding rate tilting.
Where can this judgment most easily be wrong? If the semiconductor industry suddenly releases good news—say, AI application rollout accelerates or policy support arrives—$NVDL could quickly regain lost ground. Then a break above 34.00 (recent resistance reference) would mean the adjustment is over, and I’d need to撤销 my bearish stance. Or if the funding rate suddenly turns negative, indicating the bears are gaining strength, the drop may continue—but the current data doesn’t support that.
Trading tag: #BinanceFutures #TradFi #USDⓈM #NVDL #NVDLUSDT $NVDL
Why is the semiconductor chain “catching its breath” right now? From the funding rate: a zero funding rate means neither bulls nor bears are being forced to pay. Market sentiment isn’t cold or hot—it’s not crowded enough to blow someone up. With open interest at 4807.72, compared to 62,000 traded in the last 24 hours, turnover isn’t particularly fierce. The old dog judges this isn’t panic selling; it looks more like a natural pullback from a high point in the cycle. In the industry, people often say AI and semiconductors are in the middle stage of a technical upgrade cycle—demand is holding up, but valuations still need to digest. As an on-chain “US equities” proxy, $NVDL follows the swings of giants like Nvidia, but since the input doesn’t provide specific peer data, I won’t make anything up. With a single signal: price falling alongside a zero funding rate suggests selling pressure may come from profit-taking rather than bears pushing the market down. Because if bears were truly strong, the funding rate should turn negative.
So my take is: this drop in $NVDL is part of the semiconductor chain’s cycle adjustment, not a trend reversal. The trigger is simple: if the price breaks below 33.00 (near the low area of the past 24 hours), I’ll cut my position by 30%, because a breakdown could cause longs to stop out along the chain. If the funding rate turns positive and the price rebounds, I’ll watch whether it’s a fake breakout. The contrarian part is that the market might treat a zero funding rate as a safety cushion, but the old dog thinks a zero funding rate actually reveals directional ambiguity. In that kind of situation, chasing higher can trap you somewhere around mid-mountain. As for positioning: I advocate staying light and observing, not going heavy on a bet—wait for the semiconductor chain to produce a clear signal, like a sudden spike in open interest or the funding rate tilting.
Where can this judgment most easily be wrong? If the semiconductor industry suddenly releases good news—say, AI application rollout accelerates or policy support arrives—$NVDL could quickly regain lost ground. Then a break above 34.00 (recent resistance reference) would mean the adjustment is over, and I’d need to撤销 my bearish stance. Or if the funding rate suddenly turns negative, indicating the bears are gaining strength, the drop may continue—but the current data doesn’t support that.
Trading tag: #BinanceFutures #TradFi #USDⓈM #NVDL #NVDLUSDT $NVDL
24
·
--
[M1_mag7]
The old dog took a look at $NVDL. It is down 2.779% over 24 hours, with the price at 37.78. This on-chain U.S. stock contract is benchmarked to NVDA, and while it falls under the tech-heavy weight of the Mag7, today’s performance is clearly lagging most peers.
The funding rate is 0, so longs and shorts are not being squeezed; the position structure is fairly clean. OI is holding at 3032.37, with trading volume just above 300,000. Liquidity is moderately thin, so large orders can easily move the price. As a liquidity indicator for this on-chain TradFi contract, this OI level suggests market interest has not picked up yet. Compared with the broader SPY/QQQ, the current linkage is just a one-way downward transmission, with no independent capital supporting the price.
My view: do not trade for now. Funding being flat means leverage sentiment is neutral, but in a slow decline, buyers are staying on the sidelines. If it breaks below the 37 level, I would reduce the position; unless the price can hold above 38.5 for two consecutive days, I would not consider adding.
The strongest bearish counterpoint is that if NVDA suddenly releases positive news, or if market sentiment reverses, $NVDL could rebound quickly. But there is no such signal in the current data, and the tradfi_news field is also empty.
Trading tag: #BinanceFutures #TradFi #USDⓈM #NVDL #NVDLUSDT $NVDL
[M1_mag7]
The old dog took a look at $NVDL . It is down 2.779% over 24 hours, with the price at 37.78. This on-chain U.S. stock contract is benchmarked to NVDA, and while it falls under the tech-heavy weight of the Mag7, today’s performance is clearly lagging most peers.
The funding rate is 0, so longs and shorts are not being squeezed; the position structure is fairly clean. OI is holding at 3032.37, with trading volume just above 300,000. Liquidity is moderately thin, so large orders can easily move the price. As a liquidity indicator for this on-chain TradFi contract, this OI level suggests market interest has not picked up yet. Compared with the broader SPY/QQQ, the current linkage is just a one-way downward transmission, with no independent capital supporting the price.
My view: do not trade for now. Funding being flat means leverage sentiment is neutral, but in a slow decline, buyers are staying on the sidelines. If it breaks below the 37 level, I would reduce the position; unless the price can hold above 38.5 for two consecutive days, I would not consider adding.
The strongest bearish counterpoint is that if NVDA suddenly releases positive news, or if market sentiment reverses, $NVDL could rebound quickly. But there is no such signal in the current data, and the tradfi_news field is also empty.
Trading tag: #BinanceFutures #TradFi #USDⓈM #NVDL #NVDLUSDT $NVDL
The old dog took a look at $NVDL . It is down 2.779% over 24 hours, with the price at 37.78. This on-chain U.S. stock contract is benchmarked to NVDA, and while it falls under the tech-heavy weight of the Mag7, today’s performance is clearly lagging most peers.
The funding rate is 0, so longs and shorts are not being squeezed; the position structure is fairly clean. OI is holding at 3032.37, with trading volume just above 300,000. Liquidity is moderately thin, so large orders can easily move the price. As a liquidity indicator for this on-chain TradFi contract, this OI level suggests market interest has not picked up yet. Compared with the broader SPY/QQQ, the current linkage is just a one-way downward transmission, with no independent capital supporting the price.
My view: do not trade for now. Funding being flat means leverage sentiment is neutral, but in a slow decline, buyers are staying on the sidelines. If it breaks below the 37 level, I would reduce the position; unless the price can hold above 38.5 for two consecutive days, I would not consider adding.
The strongest bearish counterpoint is that if NVDA suddenly releases positive news, or if market sentiment reverses, $NVDL could rebound quickly. But there is no such signal in the current data, and the tradfi_news field is also empty.
Trading tag: #BinanceFutures #TradFi #USDⓈM #NVDL #NVDLUSDT $NVDL
112
·
--
$NVDL In the past 24 hours, it has posted a 6.202% gain; the price is holding at 35.79. Old dog took a glance at its on-chain contract data: the funding rate is -0.00117559, and the open position size is 2758.45. This setup is quite interesting: the price is pushing upward, but the people holding short positions are paying the longs.
It directly points to the essence of M3_crypto_link. $NVDL itself tracks an NVIDIA leveraged ETF, but it turns TradFi’s leveraged products into on-chain tradeable derivatives via perpetual contracts. A negative funding rate means shorts are crowded. Shorts are paying the funding cost. Meanwhile, the price is rising—this is a classic short squeeze structure. Shorts are losing money and also have to keep paying, so the burden on holding positions can rise exponentially. The same logic is common in crypto for many low-cap “sh*tcoin” pumps: they use imbalances in the derivatives market structure to drive spot prices. So while there are no other comparison coins within this week’s sector (secondary_memes is empty), looking only at $NVDL’s contract data right now, it’s not moving due to fundamentals or news. It’s moving because of an ongoing imbalance between longs and shorts in the contract market.
My view is: this negative funding rate combined with the upward move suggests that the on-chain perpetual market’s short pressure has not been scared off by the rally—it’s actually becoming entrenched. This gives room for the price to squeeze higher, until shorts capitulate and close out, or the funding rate turns positive. In terms of action, I won’t proactively chase longs at this spot—risk/reward isn’t good. A more稳妥 approach is to watch the change in open interest (Open Interest). If open interest remains elevated or even increases while price is consolidating or pulling back slightly, it means shorts are still stubbornly holding on, and the short-squeeze game may not be over. I would consider a small test long position only when open interest clearly rises and the price breaks out of the current narrow range. Conversely, if open interest drops quickly, regardless of whether price is up or down, that means shorts are retreating and the squeeze logic will likely fail soon.
The most counterintuitive point is this: many people see a negative funding rate and immediately want to short against the trend, thinking it’s “cheap.” But with an instrument like $NVDL, a negative funding rate is a congestion signal formed by shorts voting with real money. Going short against the move is essentially betting that a side that has been bleeding will suddenly launch a counterattack—which usually isn’t what smart money chooses.
Trading tag: #BinanceFutures #TradFi #USDⓈM #NVDL #NVDLUSDT $NVDL
$NVDL In the past 24 hours, it has posted a 6.202% gain; the price is holding at 35.79. Old dog took a glance at its on-chain contract data: the funding rate is -0.00117559, and the open position size is 2758.45. This setup is quite interesting: the price is pushing upward, but the people holding short positions are paying the longs.
It directly points to the essence of M3_crypto_link. $NVDL itself tracks an NVIDIA leveraged ETF, but it turns TradFi’s leveraged products into on-chain tradeable derivatives via perpetual contracts. A negative funding rate means shorts are crowded. Shorts are paying the funding cost. Meanwhile, the price is rising—this is a classic short squeeze structure. Shorts are losing money and also have to keep paying, so the burden on holding positions can rise exponentially. The same logic is common in crypto for many low-cap “sh*tcoin” pumps: they use imbalances in the derivatives market structure to drive spot prices. So while there are no other comparison coins within this week’s sector (secondary_memes is empty), looking only at $NVDL ’s contract data right now, it’s not moving due to fundamentals or news. It’s moving because of an ongoing imbalance between longs and shorts in the contract market.
My view is: this negative funding rate combined with the upward move suggests that the on-chain perpetual market’s short pressure has not been scared off by the rally—it’s actually becoming entrenched. This gives room for the price to squeeze higher, until shorts capitulate and close out, or the funding rate turns positive. In terms of action, I won’t proactively chase longs at this spot—risk/reward isn’t good. A more稳妥 approach is to watch the change in open interest (Open Interest). If open interest remains elevated or even increases while price is consolidating or pulling back slightly, it means shorts are still stubbornly holding on, and the short-squeeze game may not be over. I would consider a small test long position only when open interest clearly rises and the price breaks out of the current narrow range. Conversely, if open interest drops quickly, regardless of whether price is up or down, that means shorts are retreating and the squeeze logic will likely fail soon.
The most counterintuitive point is this: many people see a negative funding rate and immediately want to short against the trend, thinking it’s “cheap.” But with an instrument like $NVDL , a negative funding rate is a congestion signal formed by shorts voting with real money. Going short against the move is essentially betting that a side that has been bleeding will suddenly launch a counterattack—which usually isn’t what smart money chooses.
Trading tag: #BinanceFutures #TradFi #USDⓈM #NVDL #NVDLUSDT $NVDL
It directly points to the essence of M3_crypto_link. $NVDL itself tracks an NVIDIA leveraged ETF, but it turns TradFi’s leveraged products into on-chain tradeable derivatives via perpetual contracts. A negative funding rate means shorts are crowded. Shorts are paying the funding cost. Meanwhile, the price is rising—this is a classic short squeeze structure. Shorts are losing money and also have to keep paying, so the burden on holding positions can rise exponentially. The same logic is common in crypto for many low-cap “sh*tcoin” pumps: they use imbalances in the derivatives market structure to drive spot prices. So while there are no other comparison coins within this week’s sector (secondary_memes is empty), looking only at $NVDL ’s contract data right now, it’s not moving due to fundamentals or news. It’s moving because of an ongoing imbalance between longs and shorts in the contract market.
My view is: this negative funding rate combined with the upward move suggests that the on-chain perpetual market’s short pressure has not been scared off by the rally—it’s actually becoming entrenched. This gives room for the price to squeeze higher, until shorts capitulate and close out, or the funding rate turns positive. In terms of action, I won’t proactively chase longs at this spot—risk/reward isn’t good. A more稳妥 approach is to watch the change in open interest (Open Interest). If open interest remains elevated or even increases while price is consolidating or pulling back slightly, it means shorts are still stubbornly holding on, and the short-squeeze game may not be over. I would consider a small test long position only when open interest clearly rises and the price breaks out of the current narrow range. Conversely, if open interest drops quickly, regardless of whether price is up or down, that means shorts are retreating and the squeeze logic will likely fail soon.
The most counterintuitive point is this: many people see a negative funding rate and immediately want to short against the trend, thinking it’s “cheap.” But with an instrument like $NVDL , a negative funding rate is a congestion signal formed by shorts voting with real money. Going short against the move is essentially betting that a side that has been bleeding will suddenly launch a counterattack—which usually isn’t what smart money chooses.
Trading tag: #BinanceFutures #TradFi #USDⓈM #NVDL #NVDLUSDT $NVDL
72
·
--
$NVDL 24 hours, it rose 6.914%, and the price went back to 36.03. But the old dog checked the funding rate: -0.0014525. The shorts are paying extra to the longs. Price is going up, yet the funding rate is negative—this is a classic case of shorts being squeezed into holding up positions.
This is a common issue with perpetuals on the semiconductor/AI chain. Leveraged products on-chain play the game of amplifying volatility. $NVDL is pegged to spot NVDA; when the spot rises, NVDL naturally jumps with it. But the current structure is interesting: price increases coexist with a negative funding rate, meaning that in this push higher, the short side has not only been wrong on direction—they’re also continuously paying costs.
When the funding rate is below zero, the logic is that shorts are crowded. They’re forced to close or bleed continuously; that process itself creates upward friction for the price. This is what people call a short squeeze environment. Open interest is 3288.52. Without comparison data, I can’t judge how severe it is, but combined with the negative funding rate, it’s clear the short positions haven’t been fully cleaned out.
My view is: the current negative funding rate is a buffer/support for the short term $NVDL price. As long as the semiconductor narrative on the spot side doesn’t die down, this “short squeeze crowding” game can last for a while. The logic chain is: spot is strong → leveraged products follow higher → shorts’ losses worsen and funding stays negative → shorts close, pushing the price higher → cycle repeats.
The triggers are simple: if spot NVDA (not $NVDL) on the daily timeframe fails to break below the key moving average, and the funding rate doesn’t turn positive, I’ll hold my existing position—no adding, no cutting. On the other hand, the market might be over-focused on leveraged losses, while underestimating the upward bounce elasticity caused by the short squeeze.
The strongest counterevidence is right in front of us: this kind of rally with a negative funding rate depends heavily on continuous buying on the spot side. Once the semiconductor sector rotates to other tracks, or if NVDA itself sees any negative news, and the spot leads lower, the negative funding rate of $NVDL will instantly turn into the longs’ graveyard—because then the drop will stack with leveraged backlash. The second-order effect is: if this squeeze succeeds and blows up the shorts, the funding rate will quickly turn positive; then the market will enter a new phase of “crowded longs waiting for a pullback.”
The invalidation conditions are very clear: my core bet is wrong if the spot side loses momentum. The specific signals are: spot NVDA’s price starts to sink with consecutive bearish candles, and simultaneously $NVDL’s funding rate rapidly returns from negative to zero, or even turns positive. If either of these signals appears, I’ll conclude the short-term squeeze logic has failed and prepare to撤.
Trading tag: #BinanceFutures #TradFi #USDⓈM #NVDL #NVDLUSDT $NVDL
$NVDL 24 hours, it rose 6.914%, and the price went back to 36.03. But the old dog checked the funding rate: -0.0014525. The shorts are paying extra to the longs. Price is going up, yet the funding rate is negative—this is a classic case of shorts being squeezed into holding up positions.
This is a common issue with perpetuals on the semiconductor/AI chain. Leveraged products on-chain play the game of amplifying volatility. $NVDL is pegged to spot NVDA; when the spot rises, NVDL naturally jumps with it. But the current structure is interesting: price increases coexist with a negative funding rate, meaning that in this push higher, the short side has not only been wrong on direction—they’re also continuously paying costs.
When the funding rate is below zero, the logic is that shorts are crowded. They’re forced to close or bleed continuously; that process itself creates upward friction for the price. This is what people call a short squeeze environment. Open interest is 3288.52. Without comparison data, I can’t judge how severe it is, but combined with the negative funding rate, it’s clear the short positions haven’t been fully cleaned out.
My view is: the current negative funding rate is a buffer/support for the short term $NVDL price. As long as the semiconductor narrative on the spot side doesn’t die down, this “short squeeze crowding” game can last for a while. The logic chain is: spot is strong → leveraged products follow higher → shorts’ losses worsen and funding stays negative → shorts close, pushing the price higher → cycle repeats.
The triggers are simple: if spot NVDA (not $NVDL ) on the daily timeframe fails to break below the key moving average, and the funding rate doesn’t turn positive, I’ll hold my existing position—no adding, no cutting. On the other hand, the market might be over-focused on leveraged losses, while underestimating the upward bounce elasticity caused by the short squeeze.
The strongest counterevidence is right in front of us: this kind of rally with a negative funding rate depends heavily on continuous buying on the spot side. Once the semiconductor sector rotates to other tracks, or if NVDA itself sees any negative news, and the spot leads lower, the negative funding rate of $NVDL will instantly turn into the longs’ graveyard—because then the drop will stack with leveraged backlash. The second-order effect is: if this squeeze succeeds and blows up the shorts, the funding rate will quickly turn positive; then the market will enter a new phase of “crowded longs waiting for a pullback.”
The invalidation conditions are very clear: my core bet is wrong if the spot side loses momentum. The specific signals are: spot NVDA’s price starts to sink with consecutive bearish candles, and simultaneously $NVDL ’s funding rate rapidly returns from negative to zero, or even turns positive. If either of these signals appears, I’ll conclude the short-term squeeze logic has failed and prepare to撤.
Trading tag: #BinanceFutures #TradFi #USDⓈM #NVDL #NVDLUSDT $NVDL
This is a common issue with perpetuals on the semiconductor/AI chain. Leveraged products on-chain play the game of amplifying volatility. $NVDL is pegged to spot NVDA; when the spot rises, NVDL naturally jumps with it. But the current structure is interesting: price increases coexist with a negative funding rate, meaning that in this push higher, the short side has not only been wrong on direction—they’re also continuously paying costs.
When the funding rate is below zero, the logic is that shorts are crowded. They’re forced to close or bleed continuously; that process itself creates upward friction for the price. This is what people call a short squeeze environment. Open interest is 3288.52. Without comparison data, I can’t judge how severe it is, but combined with the negative funding rate, it’s clear the short positions haven’t been fully cleaned out.
My view is: the current negative funding rate is a buffer/support for the short term $NVDL price. As long as the semiconductor narrative on the spot side doesn’t die down, this “short squeeze crowding” game can last for a while. The logic chain is: spot is strong → leveraged products follow higher → shorts’ losses worsen and funding stays negative → shorts close, pushing the price higher → cycle repeats.
The triggers are simple: if spot NVDA (not $NVDL ) on the daily timeframe fails to break below the key moving average, and the funding rate doesn’t turn positive, I’ll hold my existing position—no adding, no cutting. On the other hand, the market might be over-focused on leveraged losses, while underestimating the upward bounce elasticity caused by the short squeeze.
The strongest counterevidence is right in front of us: this kind of rally with a negative funding rate depends heavily on continuous buying on the spot side. Once the semiconductor sector rotates to other tracks, or if NVDA itself sees any negative news, and the spot leads lower, the negative funding rate of $NVDL will instantly turn into the longs’ graveyard—because then the drop will stack with leveraged backlash. The second-order effect is: if this squeeze succeeds and blows up the shorts, the funding rate will quickly turn positive; then the market will enter a new phase of “crowded longs waiting for a pullback.”
The invalidation conditions are very clear: my core bet is wrong if the spot side loses momentum. The specific signals are: spot NVDA’s price starts to sink with consecutive bearish candles, and simultaneously $NVDL ’s funding rate rapidly returns from negative to zero, or even turns positive. If either of these signals appears, I’ll conclude the short-term squeeze logic has failed and prepare to撤.
Trading tag: #BinanceFutures #TradFi #USDⓈM #NVDL #NVDLUSDT $NVDL
87

Log in to explore more content
Join global crypto users on Binance Square
⚡️ Get latest and useful information about crypto.
💬 Trusted by the world’s largest crypto exchange.
👍 Discover real insights from verified creators.
Email / Phone number
Trending Topics
1
#BinanceWillListHyperliquid(HYPE)
38,148 views
1,037 Discussing
2
#FedOctoberRateHikeOddsRiseTo69.7%
2,963 views
223 Discussing
3
#BitcoinFallsBelow$83,000
1,664 views
20 Discussing
4
#BitcoinFallsToAround$84,600ThisWeek
0 views
0 Discussing
5
#US30YearYieldHighestSince2004
8,200 views
251 Discussing
6
#ETHBreaksAbove$2,700
878 views
20 Discussing
7
#USWeighsPromotingDollarStablecoinsAbroad
35,184 views
1,088 Discussing
8
#US10YTreasuryYieldHits19YearHigh
33,818 views
837 Discussing
9
#SpotBitcoinETFsInflow$2.31BInFourDays
4,552 views
60 Discussing
10
#BitcoinRejectedAt$87,300Twice
0 views
0 Discussing