
#mvllb
mvllb
26,825 views
545 Discussing
Hot
Latest

·
--
Bullish
🔻 $MVLLB
{spot}(MVLLBUSDT)
SLIDES 7.61% — ANOTHER WEAK MARKET PERFORMER!
MVLLB has recorded a notable decline in Binance's latest market rankings.
📉 24-hour change: -7.61%
📊 What should investors consider?
Price movements in tokenized assets can be influenced by the underlying reference asset, trading liquidity and market conditions.
Traders should investigate the underlying instrument and its trading activity rather than relying only on percentage changes.
⚠️ A sharp decline can create volatility in both directions.
What do you think happens next?
#MVLLB #TokenizedAssets #Binance #MarketWatch
🔻 $MVLLB
SLIDES 7.61% — ANOTHER WEAK MARKET PERFORMER!
MVLLB has recorded a notable decline in Binance's latest market rankings.
📉 24-hour change: -7.61%
📊 What should investors consider?
Price movements in tokenized assets can be influenced by the underlying reference asset, trading liquidity and market conditions.
Traders should investigate the underlying instrument and its trading activity rather than relying only on percentage changes.
⚠️ A sharp decline can create volatility in both directions.
What do you think happens next?
#MVLLB #TokenizedAssets #Binance #MarketWatch
SLIDES 7.61% — ANOTHER WEAK MARKET PERFORMER!
MVLLB has recorded a notable decline in Binance's latest market rankings.
📉 24-hour change: -7.61%
📊 What should investors consider?
Price movements in tokenized assets can be influenced by the underlying reference asset, trading liquidity and market conditions.
Traders should investigate the underlying instrument and its trading activity rather than relying only on percentage changes.
⚠️ A sharp decline can create volatility in both directions.
What do you think happens next?
#MVLLB #TokenizedAssets #Binance #MarketWatch
吴多多:
是不是还的跌😂😂😂
1
1
63

⚡ $MVLLB PRESSING INTO HIGH-RISK LONG ZONE FOR AN EXPLOSIVE SWEEP! 💥
Entry: 30.00 - 30.30 ⚡
Target: 30.50 / 31.00 / 31.50 🚀
Stop Loss: 29.40 ⚠️
Price action is coiling tightly around the 30.00 support shelf, setting up a sharp high-conviction setup for nimble order flow traders. 📊 Buyers are actively absorbing sell orders at these lows, building distinct momentum for a squeeze overhead.
Keep risk management surgical on this play, as order books thin out rapidly on upside pushes. 💡 If 29.40 holds, the path toward targeted liquidity at 31.50 opens up fast. 💬 Are you front-running this momentum scalp, or waiting on the sideline for confirmed volume? 👇
⚠️ Not financial advice. Always manage your risk. 🛡️
🏷️ #MVLLB #Crypto #LongSetup #Trading #Breakout
🔥 💎
⚡ $MVLLB PRESSING INTO HIGH-RISK LONG ZONE FOR AN EXPLOSIVE SWEEP! 💥
Entry: 30.00 - 30.30 ⚡
Target: 30.50 / 31.00 / 31.50 🚀
Stop Loss: 29.40 ⚠️
Price action is coiling tightly around the 30.00 support shelf, setting up a sharp high-conviction setup for nimble order flow traders. 📊 Buyers are actively absorbing sell orders at these lows, building distinct momentum for a squeeze overhead.
Keep risk management surgical on this play, as order books thin out rapidly on upside pushes. 💡 If 29.40 holds, the path toward targeted liquidity at 31.50 opens up fast. 💬 Are you front-running this momentum scalp, or waiting on the sideline for confirmed volume? 👇
⚠️ Not financial advice. Always manage your risk. 🛡️
🏷️ #MVLLB #Crypto #LongSetup #Trading #Breakout
🔥 💎
Entry: 30.00 - 30.30 ⚡
Target: 30.50 / 31.00 / 31.50 🚀
Stop Loss: 29.40 ⚠️
Price action is coiling tightly around the 30.00 support shelf, setting up a sharp high-conviction setup for nimble order flow traders. 📊 Buyers are actively absorbing sell orders at these lows, building distinct momentum for a squeeze overhead.
Keep risk management surgical on this play, as order books thin out rapidly on upside pushes. 💡 If 29.40 holds, the path toward targeted liquidity at 31.50 opens up fast. 💬 Are you front-running this momentum scalp, or waiting on the sideline for confirmed volume? 👇
⚠️ Not financial advice. Always manage your risk. 🛡️
🏷️ #MVLLB #Crypto #LongSetup #Trading #Breakout
🔥 💎
11
$MVLLB BREAKS CONSOLIDATION AS BUYERS STEP IN WITH HIGH-CONVICTION MOMENTUM! 🚀💥
Entry: 32.20 - 32.50 ⚡
Target: 33.00 - 35.00 🚀
Stop Loss: 31.40 ⚠️
Price action on $MVLLB just sliced through a tight accumulation range, signaling a decisive shift in order flow. 📊 Aggressive market bids are absorbing overhead supply as buyers firmly defend the newly reclaimed support level.
With seller inventory drying up fast, this setup offers an exceptional risk-to-reward ratio for traders positioned for momentum expansion. 💡 As long as price holds firm above the entry zone, the path toward higher targets remains wide open. 💬 Are you bidding this breakout early or waiting for a retest of support? 👇
⚠️ Not financial advice. Always manage your risk. 🛡️
🏷️ #MVLLB #LongSetup #Breakout #Crypto #Trading
🔥 ⚡
$MVLLB BREAKS CONSOLIDATION AS BUYERS STEP IN WITH HIGH-CONVICTION MOMENTUM! 🚀💥
Entry: 32.20 - 32.50 ⚡
Target: 33.00 - 35.00 🚀
Stop Loss: 31.40 ⚠️
Price action on $MVLLB just sliced through a tight accumulation range, signaling a decisive shift in order flow. 📊 Aggressive market bids are absorbing overhead supply as buyers firmly defend the newly reclaimed support level.
With seller inventory drying up fast, this setup offers an exceptional risk-to-reward ratio for traders positioned for momentum expansion. 💡 As long as price holds firm above the entry zone, the path toward higher targets remains wide open. 💬 Are you bidding this breakout early or waiting for a retest of support? 👇
⚠️ Not financial advice. Always manage your risk. 🛡️
🏷️ #MVLLB #LongSetup #Breakout #Crypto #Trading
🔥 ⚡
Entry: 32.20 - 32.50 ⚡
Target: 33.00 - 35.00 🚀
Stop Loss: 31.40 ⚠️
Price action on $MVLLB just sliced through a tight accumulation range, signaling a decisive shift in order flow. 📊 Aggressive market bids are absorbing overhead supply as buyers firmly defend the newly reclaimed support level.
With seller inventory drying up fast, this setup offers an exceptional risk-to-reward ratio for traders positioned for momentum expansion. 💡 As long as price holds firm above the entry zone, the path toward higher targets remains wide open. 💬 Are you bidding this breakout early or waiting for a retest of support? 👇
⚠️ Not financial advice. Always manage your risk. 🛡️
🏷️ #MVLLB #LongSetup #Breakout #Crypto #Trading
🔥 ⚡
15

·
--
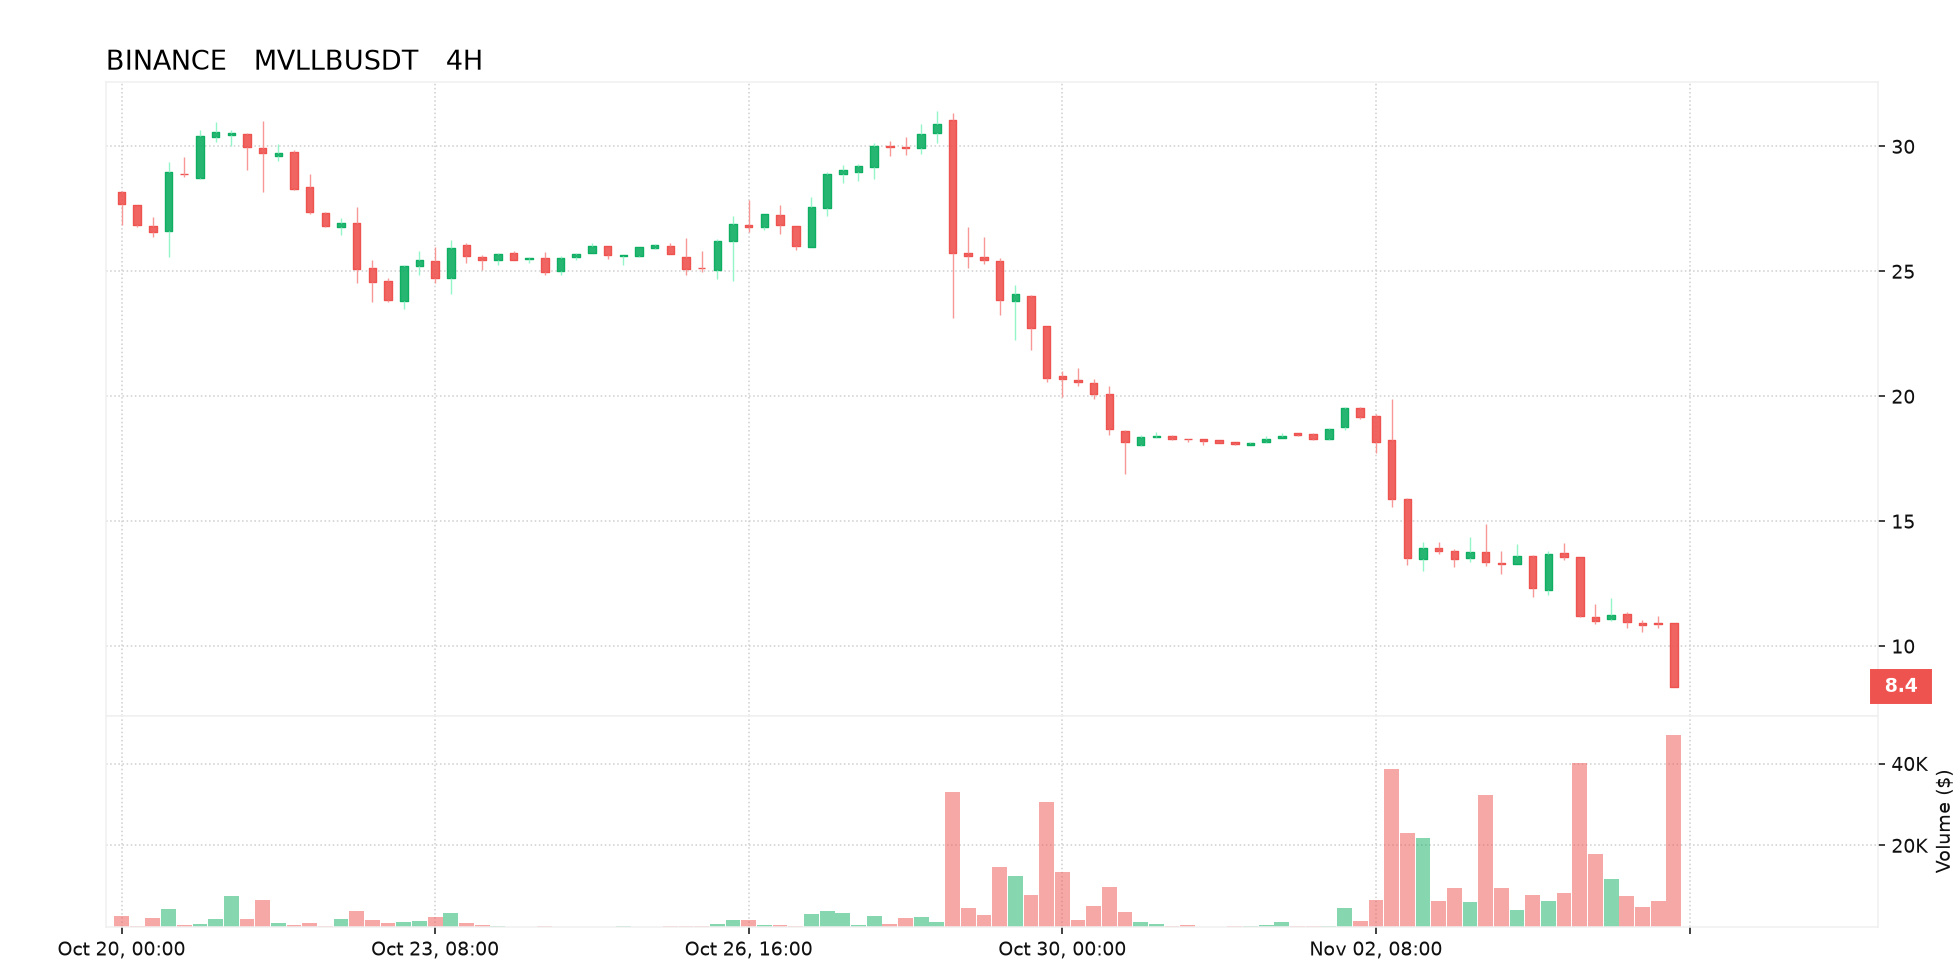
MVLLB’s Binance spike looks event-driven: a fresh announcement/listing trigger sparked speculation, and thin liquidity magnified it. No confirmed fundamental news—avoid chasing.
$MVLLB #MVLLB
Not a financial advice. Be responsible for your own financial decision.
MVLLB’s Binance spike looks event-driven: a fresh announcement/listing trigger sparked speculation, and thin liquidity magnified it. No confirmed fundamental news—avoid chasing.
$MVLLB #MVLLB
Not a financial advice. Be responsible for your own financial decision.
$MVLLB #MVLLB
Not a financial advice. Be responsible for your own financial decision.
232
🚀 $MVLLB PRESSES AGAINST KEY RESISTANCE AS BULLS EYE A CLEAN EXPANSION TO $36! 💥
Entry: 31.80 - 32.40 ⚡
Target: 33.50 / 35.00 / 36.50 🚀
Stop Loss: 30.70 ⚠️
Buyers are refusing to let $MVLLB drop below the crucial $32 mark, absorbing seller pressure while building intense energy right underneath the $33.07 local peak. 📌 Order flow reflects steady bid activity, signalling that smart money is actively defending this consolidation shelf. ⚡
Slicing through this immediate overhead supply unlocks a clear runway straight into the major liquidity pool between $35.00 and $36.50. 📊 As long as structure holds above $31.80, the path of least resistance points decisively higher. 💡
💬 Are you positioning inside this demand block or waiting for the $33 breakout push? 👇
⚠️ Not financial advice. Always manage your risk. 🛡️
🏷️ #MVLLB #Breakout #Crypto #LongSetup # Trading
🔥 💎
🚀 $MVLLB PRESSES AGAINST KEY RESISTANCE AS BULLS EYE A CLEAN EXPANSION TO $36! 💥
Entry: 31.80 - 32.40 ⚡
Target: 33.50 / 35.00 / 36.50 🚀
Stop Loss: 30.70 ⚠️
Buyers are refusing to let $MVLLB drop below the crucial $32 mark, absorbing seller pressure while building intense energy right underneath the $33.07 local peak. 📌 Order flow reflects steady bid activity, signalling that smart money is actively defending this consolidation shelf. ⚡
Slicing through this immediate overhead supply unlocks a clear runway straight into the major liquidity pool between $35.00 and $36.50. 📊 As long as structure holds above $31.80, the path of least resistance points decisively higher. 💡
💬 Are you positioning inside this demand block or waiting for the $33 breakout push? 👇
⚠️ Not financial advice. Always manage your risk. 🛡️
🏷️ #MVLLB #Breakout #Crypto #LongSetup # Trading
🔥 💎
Entry: 31.80 - 32.40 ⚡
Target: 33.50 / 35.00 / 36.50 🚀
Stop Loss: 30.70 ⚠️
Buyers are refusing to let $MVLLB drop below the crucial $32 mark, absorbing seller pressure while building intense energy right underneath the $33.07 local peak. 📌 Order flow reflects steady bid activity, signalling that smart money is actively defending this consolidation shelf. ⚡
Slicing through this immediate overhead supply unlocks a clear runway straight into the major liquidity pool between $35.00 and $36.50. 📊 As long as structure holds above $31.80, the path of least resistance points decisively higher. 💡
💬 Are you positioning inside this demand block or waiting for the $33 breakout push? 👇
⚠️ Not financial advice. Always manage your risk. 🛡️
🏷️ #MVLLB #Breakout #Crypto #LongSetup # Trading
🔥 💎
17
🚨 $MVLLB DEFENDS THE 28 SUPPORT AND RECLAIMS 30 WITH POWERFUL BUYING MOMENTUM! 🚀
Entry: 30.30 - 30.80 ⚡
Target: 31.80 - 35.00 🚀
Stop Loss: 29.20 ⚠️
📌 Sellers tried to push $MVLLB lower, but the 28.00 support zone held firm, absorbing downside pressure and sparking a clean structural recovery. Reclaiming 30.00 demonstrates clear buyer dominance, keeping the bid strong even through immediate pullbacks.
📊 Order flow is expanding nicely off this level, paving a path toward higher overhead targets as liquidity gets swept above. 💡 Holding 30.00 converts prior resistance into fresh demand for the next leg up.
💬 Are you jumping on this reclaim above 30.00 or waiting for one more dip? 👇
⚠️ Not financial advice. Always manage your risk. 🛡️
🏷️ #MVLLB #LongSetup #Crypto #Breakout
🔥 💎
🚨 $MVLLB DEFENDS THE 28 SUPPORT AND RECLAIMS 30 WITH POWERFUL BUYING MOMENTUM! 🚀
Entry: 30.30 - 30.80 ⚡
Target: 31.80 - 35.00 🚀
Stop Loss: 29.20 ⚠️
📌 Sellers tried to push $MVLLB lower, but the 28.00 support zone held firm, absorbing downside pressure and sparking a clean structural recovery. Reclaiming 30.00 demonstrates clear buyer dominance, keeping the bid strong even through immediate pullbacks.
📊 Order flow is expanding nicely off this level, paving a path toward higher overhead targets as liquidity gets swept above. 💡 Holding 30.00 converts prior resistance into fresh demand for the next leg up.
💬 Are you jumping on this reclaim above 30.00 or waiting for one more dip? 👇
⚠️ Not financial advice. Always manage your risk. 🛡️
🏷️ #MVLLB #LongSetup #Crypto #Breakout
🔥 💎
Entry: 30.30 - 30.80 ⚡
Target: 31.80 - 35.00 🚀
Stop Loss: 29.20 ⚠️
📌 Sellers tried to push $MVLLB lower, but the 28.00 support zone held firm, absorbing downside pressure and sparking a clean structural recovery. Reclaiming 30.00 demonstrates clear buyer dominance, keeping the bid strong even through immediate pullbacks.
📊 Order flow is expanding nicely off this level, paving a path toward higher overhead targets as liquidity gets swept above. 💡 Holding 30.00 converts prior resistance into fresh demand for the next leg up.
💬 Are you jumping on this reclaim above 30.00 or waiting for one more dip? 👇
⚠️ Not financial advice. Always manage your risk. 🛡️
🏷️ #MVLLB #LongSetup #Crypto #Breakout
🔥 💎
17

·
--
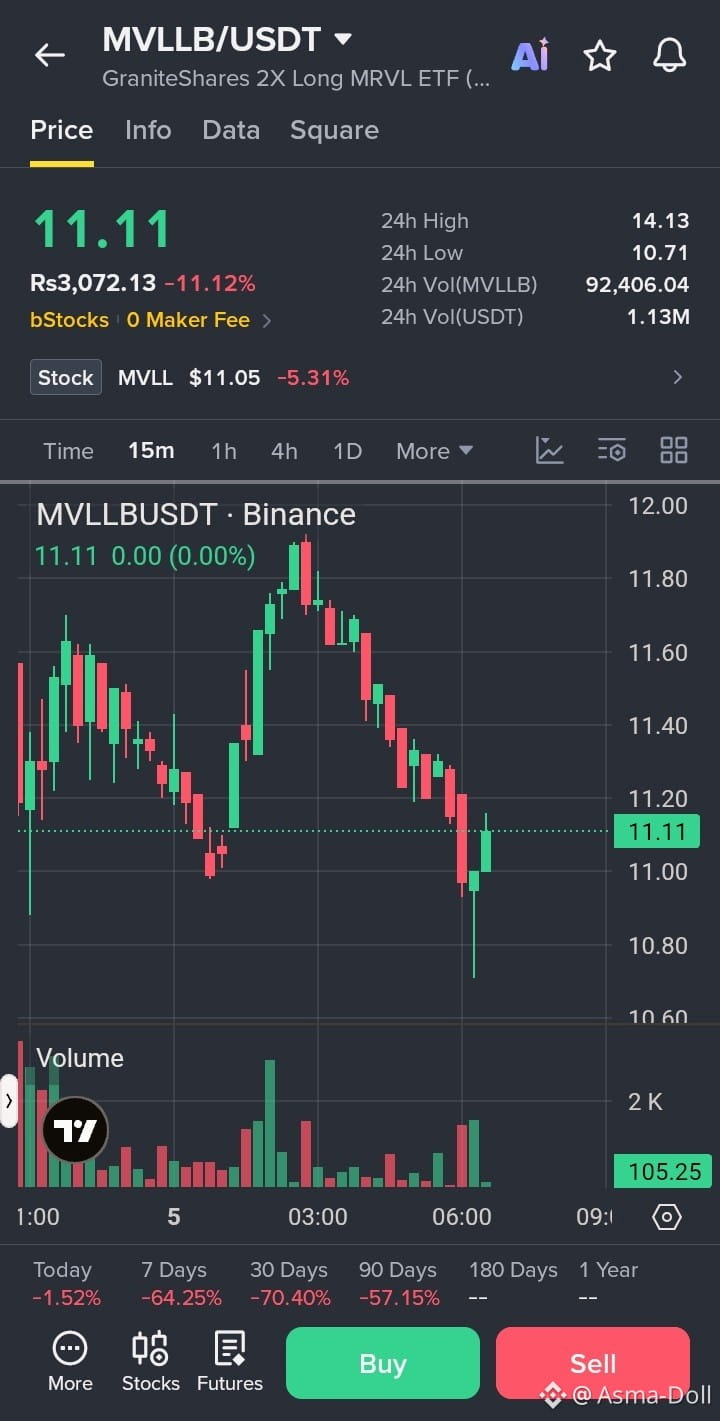
🔴 $MVLLB /USDT – SHORT SIGNAL
Trade Plan:
Direction: SHORT 📉
Entry: 11.10 – 11.40
Stop Loss (SL): 12.00
Take Profit Targets:
TP1: 10.80
TP2: 10.40
TP3: 9.90
Trade here $MVLLB
{spot}(MVLLBUSDT)
Analysis:
Strong bearish pressure after a major decline.
Down 11.12% in 24 hours.
Price remains below the recent high of 14.13.
Weak recovery suggests buyers lack strength.
Trading near support at 10.71, increasing breakdown risk.
Confirmation: A clean 15-minute candle close below 10.70 with strong selling volume confirms further downside.
Risk-to-Reward:
TP1: 1:0.3
TP2: 1:0.8
TP3: 1:1.3
⚠️ Wait for breakdown confirmation. Avoid shorting directly into support; a failed breakdown can cause a sharp rebound.
#MVLLB #MRVL #SHORTSignal #BinanceTrading #StockTrading
🔴 $MVLLB /USDT – SHORT SIGNAL
Trade Plan:
Direction: SHORT 📉
Entry: 11.10 – 11.40
Stop Loss (SL): 12.00
Take Profit Targets:
TP1: 10.80
TP2: 10.40
TP3: 9.90
Trade here $MVLLB
Analysis:
Strong bearish pressure after a major decline.
Down 11.12% in 24 hours.
Price remains below the recent high of 14.13.
Weak recovery suggests buyers lack strength.
Trading near support at 10.71, increasing breakdown risk.
Confirmation: A clean 15-minute candle close below 10.70 with strong selling volume confirms further downside.
Risk-to-Reward:
TP1: 1:0.3
TP2: 1:0.8
TP3: 1:1.3
⚠️ Wait for breakdown confirmation. Avoid shorting directly into support; a failed breakdown can cause a sharp rebound.
#MVLLB #MRVL #SHORTSignal #BinanceTrading #StockTrading
Trade Plan:
Direction: SHORT 📉
Entry: 11.10 – 11.40
Stop Loss (SL): 12.00
Take Profit Targets:
TP1: 10.80
TP2: 10.40
TP3: 9.90
Trade here $MVLLB
Analysis:
Strong bearish pressure after a major decline.
Down 11.12% in 24 hours.
Price remains below the recent high of 14.13.
Weak recovery suggests buyers lack strength.
Trading near support at 10.71, increasing breakdown risk.
Confirmation: A clean 15-minute candle close below 10.70 with strong selling volume confirms further downside.
Risk-to-Reward:
TP1: 1:0.3
TP2: 1:0.8
TP3: 1:1.3
⚠️ Wait for breakdown confirmation. Avoid shorting directly into support; a failed breakdown can cause a sharp rebound.
#MVLLB #MRVL #SHORTSignal #BinanceTrading #StockTrading
37
·
--
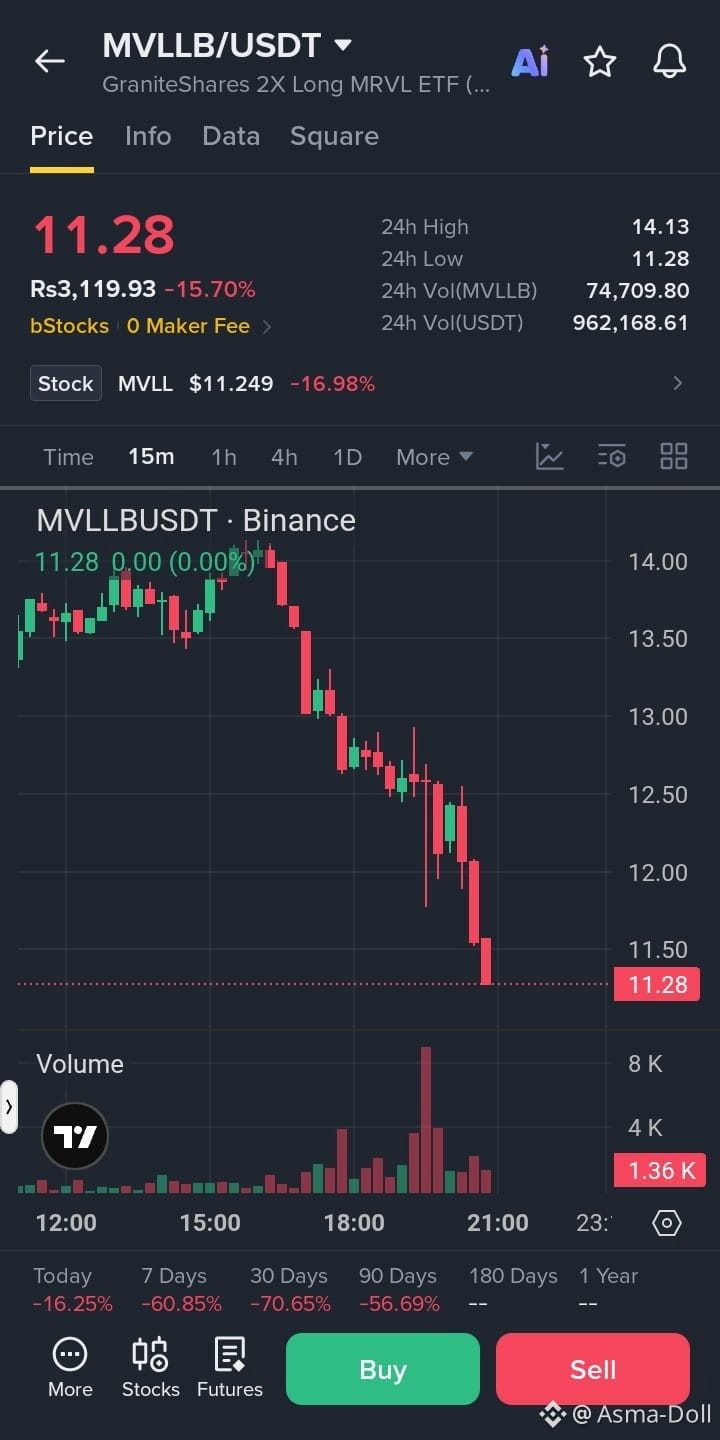
🔴 $MVLLB /USDT – SHORT SIGNAL
Trade Plan:
Entry: $11.25 – $11.50
Stop Loss (SL): $12.05
Take Profit Targets:
TP1: $10.90
TP2: $10.50
TP3: $10.00
Trade here$MVLLB
{spot}(MVLLBUSDT)
Analysis:
Heavy selling pressure with a sharp 15.70% daily drop.
Price rejected strongly from the $14.13 high.
Trading near the 24-hour low indicates weak buying strength.
Momentum remains bearish.
Further downside possible if support breaks.
Confirmation:
Clean break below $11.20 with strong selling volume.
Avoid chasing if price rebounds sharply.
Risk-to-Reward: Approximately 1:1 to 1:2.8, depending on entry and target.
⚠️ Invalidation: Sustained move above $12.05.
Trade smart. Manage risk! ⚡
#MVLLB #SHORTSignal #CryptoTrading #Binance #BearishTrend
Note: This is a speculative setup based on the supplied snapshot, not confirmed live market data. MVLLB is a leveraged ETF token, so volatility and gap risk can be significant.
🔴 $MVLLB /USDT – SHORT SIGNAL
Trade Plan:
Entry: $11.25 – $11.50
Stop Loss (SL): $12.05
Take Profit Targets:
TP1: $10.90
TP2: $10.50
TP3: $10.00
Trade here$MVLLB
Analysis:
Heavy selling pressure with a sharp 15.70% daily drop.
Price rejected strongly from the $14.13 high.
Trading near the 24-hour low indicates weak buying strength.
Momentum remains bearish.
Further downside possible if support breaks.
Confirmation:
Clean break below $11.20 with strong selling volume.
Avoid chasing if price rebounds sharply.
Risk-to-Reward: Approximately 1:1 to 1:2.8, depending on entry and target.
⚠️ Invalidation: Sustained move above $12.05.
Trade smart. Manage risk! ⚡
#MVLLB #SHORTSignal #CryptoTrading #Binance #BearishTrend
Note: This is a speculative setup based on the supplied snapshot, not confirmed live market data. MVLLB is a leveraged ETF token, so volatility and gap risk can be significant.
Trade Plan:
Entry: $11.25 – $11.50
Stop Loss (SL): $12.05
Take Profit Targets:
TP1: $10.90
TP2: $10.50
TP3: $10.00
Trade here$MVLLB
Analysis:
Heavy selling pressure with a sharp 15.70% daily drop.
Price rejected strongly from the $14.13 high.
Trading near the 24-hour low indicates weak buying strength.
Momentum remains bearish.
Further downside possible if support breaks.
Confirmation:
Clean break below $11.20 with strong selling volume.
Avoid chasing if price rebounds sharply.
Risk-to-Reward: Approximately 1:1 to 1:2.8, depending on entry and target.
⚠️ Invalidation: Sustained move above $12.05.
Trade smart. Manage risk! ⚡
#MVLLB #SHORTSignal #CryptoTrading #Binance #BearishTrend
Note: This is a speculative setup based on the supplied snapshot, not confirmed live market data. MVLLB is a leveraged ETF token, so volatility and gap risk can be significant.
1
36

·
--
📉 MVLLB — WHAT'S NEXT? 🔍
$MVLLB
MVLLB (GraniteShares 2X Long MRVL ETF Tokenized bStocks) is showing significant volatility.
📊 24H Change: +2.07% (latest reported snapshot)
📉 7D Change: -26.02% (earlier snapshot)
⚠️ Price swings remain unusually large.
🔍 Key factors to watch:
• Marvell Technology (MRVL) stock performance
• Trading volume and market sentiment
• Underlying ETF performance
• Daily leverage and volatility decay
📌 Outlook: Uncertain. Further downside and a recovery are both possible.
💬 Do you think MVLLB can recover?
#MVLLB #CryptoAnalysis #BinanceSquare
📉 MVLLB — WHAT'S NEXT? 🔍
$MVLLB
MVLLB (GraniteShares 2X Long MRVL ETF Tokenized bStocks) is showing significant volatility.
📊 24H Change: +2.07% (latest reported snapshot)
📉 7D Change: -26.02% (earlier snapshot)
⚠️ Price swings remain unusually large.
🔍 Key factors to watch:
• Marvell Technology (MRVL) stock performance
• Trading volume and market sentiment
• Underlying ETF performance
• Daily leverage and volatility decay
📌 Outlook: Uncertain. Further downside and a recovery are both possible.
💬 Do you think MVLLB can recover?
#MVLLB #CryptoAnalysis #BinanceSquare
$MVLLB
MVLLB (GraniteShares 2X Long MRVL ETF Tokenized bStocks) is showing significant volatility.
📊 24H Change: +2.07% (latest reported snapshot)
📉 7D Change: -26.02% (earlier snapshot)
⚠️ Price swings remain unusually large.
🔍 Key factors to watch:
• Marvell Technology (MRVL) stock performance
• Trading volume and market sentiment
• Underlying ETF performance
• Daily leverage and volatility decay
📌 Outlook: Uncertain. Further downside and a recovery are both possible.
💬 Do you think MVLLB can recover?
#MVLLB #CryptoAnalysis #BinanceSquare

1
969


Verified
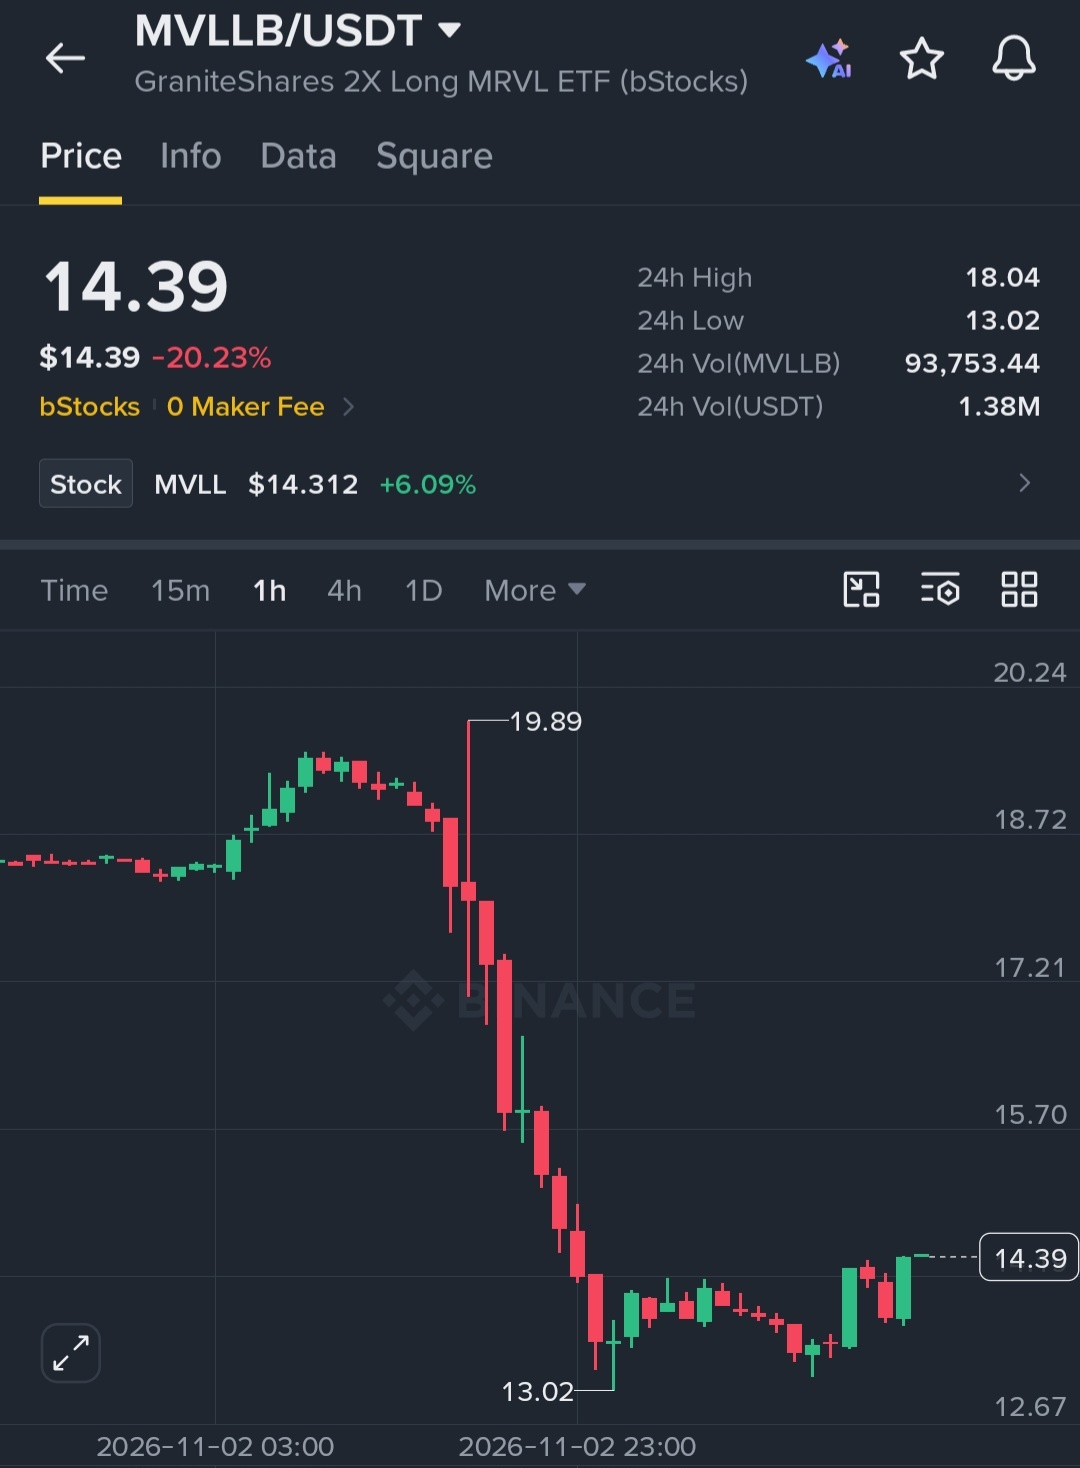
📉 $MVLLB /USDT — 🔴 SHORT · Conf 58%
━━━━━━━━━━━━━━
📍 Entry: 14.347 – 14.433
🛑 SL: 15.098
🎯 TP1: 13.671
✅ TP2: 13.096
🏆 TP3: 12.233
━━━━━━━━━━━━━━
🔎 After the deal announcement, MVLLB collapsed from 19.89 to 13.02, and the bounce stalled near 14.4—weak consolidation below the announcement gap. For a 2x leveraged ETF, volatility decay during an uncertain merger integration is a structural drag, not temporary noise.
🧠 $MVLLB : This is the tokenized version of GraniteShares' 2x long MRVL ETF. Marvell signed an all-stock deal for Lumentum at roughly $115B enterprise value. In an all-stock merger, MRVL's share count gets diluted, and a leveraged ETF's NAV decay under dilution expectations is non-linear.
💬 When the acquired company's valuation is denominated in the acquirer's stock, is the dilution risk for leveraged product holders a one-time hit or a compounding decay?
#MVLLB #GraniteShares #Marvell #MRVL #Bstocks
{spot}(MVLLBUSDT)
📉 $MVLLB /USDT — 🔴 SHORT · Conf 58%
━━━━━━━━━━━━━━
📍 Entry: 14.347 – 14.433
🛑 SL: 15.098
🎯 TP1: 13.671
✅ TP2: 13.096
🏆 TP3: 12.233
━━━━━━━━━━━━━━
🔎 After the deal announcement, MVLLB collapsed from 19.89 to 13.02, and the bounce stalled near 14.4—weak consolidation below the announcement gap. For a 2x leveraged ETF, volatility decay during an uncertain merger integration is a structural drag, not temporary noise.
🧠 $MVLLB : This is the tokenized version of GraniteShares' 2x long MRVL ETF. Marvell signed an all-stock deal for Lumentum at roughly $115B enterprise value. In an all-stock merger, MRVL's share count gets diluted, and a leveraged ETF's NAV decay under dilution expectations is non-linear.
💬 When the acquired company's valuation is denominated in the acquirer's stock, is the dilution risk for leveraged product holders a one-time hit or a compounding decay?
#MVLLB #GraniteShares #Marvell #MRVL #Bstocks
━━━━━━━━━━━━━━
📍 Entry: 14.347 – 14.433
🛑 SL: 15.098
🎯 TP1: 13.671
✅ TP2: 13.096
🏆 TP3: 12.233
━━━━━━━━━━━━━━
🔎 After the deal announcement, MVLLB collapsed from 19.89 to 13.02, and the bounce stalled near 14.4—weak consolidation below the announcement gap. For a 2x leveraged ETF, volatility decay during an uncertain merger integration is a structural drag, not temporary noise.
🧠 $MVLLB : This is the tokenized version of GraniteShares' 2x long MRVL ETF. Marvell signed an all-stock deal for Lumentum at roughly $115B enterprise value. In an all-stock merger, MRVL's share count gets diluted, and a leveraged ETF's NAV decay under dilution expectations is non-linear.
💬 When the acquired company's valuation is denominated in the acquirer's stock, is the dilution risk for leveraged product holders a one-time hit or a compounding decay?
#MVLLB #GraniteShares #Marvell #MRVL #Bstocks

1
990

$MVLLB
{spot}(MVLLBUSDT)
/USDT: Sharp Sell-Off Raises Questions About a Potential Recovery
$MVLLB /USDT is facing significant selling pressure, showing a strong bearish structure. The recent price action suggests that sellers remain firmly in control, while buyers have yet to demonstrate convincing recovery strength.
Market observation based on the provided chart
### Technical Market Overview
* Current Price: $13.92
* 24H Change: -19.07%
* 24H High: $19.89
* 24H Low: $13.02
* MA(7): $18.49
* MA(25): $26.31
* MA(99): $28.56
### Key Levels to Watch
Support zone:
* $13.02 — recent low and immediate support.
* $11.37 — next visible chart reference if selling continues.
Resistance zone:
* $18.62 — nearby resistance.
* $25.86 — stronger resistance area.
### What Could Happen Next?
The price is trading below all three major moving averages, confirming a bearish trend.
A move above $18.62 with strong volume could indicate an initial recovery attempt. However, if the $13.02 support breaks, further downside pressure may develop.
### My Market Perspective
I would remain cautious at current levels rather than rushing into a position. A strong reversal candle, improving volume, and confirmation above resistance would make the recovery scenario more interesting.
Remember, MVLLB is a 2X leveraged ETF, so its price movements can be particularly volatile. It is not the same as holding ordinary MRVL shares.
What do you think? Is $MVLLB approaching a potential bottom, or could sellers push the price even lower
Share your thoughts in the comments.
#MVLLB #USDT #TechnicalAnalysis #CryptoMarket #TradingStrategy #MarketWatch
$MVLLB
/USDT: Sharp Sell-Off Raises Questions About a Potential Recovery
$MVLLB /USDT is facing significant selling pressure, showing a strong bearish structure. The recent price action suggests that sellers remain firmly in control, while buyers have yet to demonstrate convincing recovery strength.
Market observation based on the provided chart
### Technical Market Overview
* Current Price: $13.92
* 24H Change: -19.07%
* 24H High: $19.89
* 24H Low: $13.02
* MA(7): $18.49
* MA(25): $26.31
* MA(99): $28.56
### Key Levels to Watch
Support zone:
* $13.02 — recent low and immediate support.
* $11.37 — next visible chart reference if selling continues.
Resistance zone:
* $18.62 — nearby resistance.
* $25.86 — stronger resistance area.
### What Could Happen Next?
The price is trading below all three major moving averages, confirming a bearish trend.
A move above $18.62 with strong volume could indicate an initial recovery attempt. However, if the $13.02 support breaks, further downside pressure may develop.
### My Market Perspective
I would remain cautious at current levels rather than rushing into a position. A strong reversal candle, improving volume, and confirmation above resistance would make the recovery scenario more interesting.
Remember, MVLLB is a 2X leveraged ETF, so its price movements can be particularly volatile. It is not the same as holding ordinary MRVL shares.
What do you think? Is $MVLLB approaching a potential bottom, or could sellers push the price even lower
Share your thoughts in the comments.
#MVLLB #USDT #TechnicalAnalysis #CryptoMarket #TradingStrategy #MarketWatch
/USDT: Sharp Sell-Off Raises Questions About a Potential Recovery
$MVLLB /USDT is facing significant selling pressure, showing a strong bearish structure. The recent price action suggests that sellers remain firmly in control, while buyers have yet to demonstrate convincing recovery strength.
Market observation based on the provided chart
### Technical Market Overview
* Current Price: $13.92
* 24H Change: -19.07%
* 24H High: $19.89
* 24H Low: $13.02
* MA(7): $18.49
* MA(25): $26.31
* MA(99): $28.56
### Key Levels to Watch
Support zone:
* $13.02 — recent low and immediate support.
* $11.37 — next visible chart reference if selling continues.
Resistance zone:
* $18.62 — nearby resistance.
* $25.86 — stronger resistance area.
### What Could Happen Next?
The price is trading below all three major moving averages, confirming a bearish trend.
A move above $18.62 with strong volume could indicate an initial recovery attempt. However, if the $13.02 support breaks, further downside pressure may develop.
### My Market Perspective
I would remain cautious at current levels rather than rushing into a position. A strong reversal candle, improving volume, and confirmation above resistance would make the recovery scenario more interesting.
Remember, MVLLB is a 2X leveraged ETF, so its price movements can be particularly volatile. It is not the same as holding ordinary MRVL shares.
What do you think? Is $MVLLB approaching a potential bottom, or could sellers push the price even lower
Share your thoughts in the comments.
#MVLLB #USDT #TechnicalAnalysis #CryptoMarket #TradingStrategy #MarketWatch

387

🚨 $MVLLB SMASHES LOCAL RESISTANCE AFTER 10% SURGE AS BUYERS EYE MACRO TARGETS! 💥
Target: 41.50 🚀
Buyers just took back control as $MVLLB ripped over 10.9% off the $30.53 low, driving price action directly into the $35.94 zone. 📊 Heavy order flow shows aggressive accumulation, with dip-buyers absorbing supply cleanly above key breakout levels.
💡 Holding these elevated zones signals strong trend continuation, clearing a smooth path toward the next liquidity pocket at $41.50 and secondary resistance around $46.00. 🌊 Momentum remains firmly with the bulls on this move. 💬 Are you riding this expansion up to target or waiting for a pullback? 👇
⚠️ Not financial advice. Always manage your risk. 🛡️
🏷️ #MVLLB #Breakout #Momentum #Crypto
⚡ 🎯
🚨 $MVLLB SMASHES LOCAL RESISTANCE AFTER 10% SURGE AS BUYERS EYE MACRO TARGETS! 💥
Target: 41.50 🚀
Buyers just took back control as $MVLLB ripped over 10.9% off the $30.53 low, driving price action directly into the $35.94 zone. 📊 Heavy order flow shows aggressive accumulation, with dip-buyers absorbing supply cleanly above key breakout levels.
💡 Holding these elevated zones signals strong trend continuation, clearing a smooth path toward the next liquidity pocket at $41.50 and secondary resistance around $46.00. 🌊 Momentum remains firmly with the bulls on this move. 💬 Are you riding this expansion up to target or waiting for a pullback? 👇
⚠️ Not financial advice. Always manage your risk. 🛡️
🏷️ #MVLLB #Breakout #Momentum #Crypto
⚡ 🎯
Target: 41.50 🚀
Buyers just took back control as $MVLLB ripped over 10.9% off the $30.53 low, driving price action directly into the $35.94 zone. 📊 Heavy order flow shows aggressive accumulation, with dip-buyers absorbing supply cleanly above key breakout levels.
💡 Holding these elevated zones signals strong trend continuation, clearing a smooth path toward the next liquidity pocket at $41.50 and secondary resistance around $46.00. 🌊 Momentum remains firmly with the bulls on this move. 💬 Are you riding this expansion up to target or waiting for a pullback? 👇
⚠️ Not financial advice. Always manage your risk. 🛡️
🏷️ #MVLLB #Breakout #Momentum #Crypto
⚡ 🎯
2

·
--
MVLLB is now at 26.340, down 9.67% in 24 hours and still down 5.83% over 7 days. The intraday range was 23.120–31.410, with a 35.9% amplitude.
【Market Action】
Volatility has been extreme over the past few days, leaving MVLLB with a very wide intraday range.
But these are exactly the conditions when you need to watch out for shakeouts; short-term sentiment can overheat easily.
MVLLB moved lower throughout the day, from 23.120 to 31.410, and the rebound was clearly on low volume.
The rebound came on lower volume while the decline came on higher volume—a bearish price-volume pattern.
The broader market was up 0.51% over the same period, but MVLLB fell 9.67%, underperforming the market average.
【Macro】 Overnight, U.S. stocks closed higher: Nasdaq +0.82% and S&P 500 +0.70% (2026-10-27 close). Spot BTC ETFs have seen approximately $45.2 billion in net outflows this month. U.S. CPI came in at 3.7% year over year, above expectations, and the probability of an interest rate hike at the 2026-10-27/28 meeting is around 47%. Spot BTC ETFs have seen approximately $45.2 billion in net outflows this month, as institutional buying has dried up.
The short-term outlook leans bearish.
【Bearish Reasons】
MVLLB moved from 23.120 to 31.410, and the 9.67% one-day loss has set off a wave of FOMO among those chasing the price.
It slid from 31.410 to around 26.340, and the short-term trend is still moving lower.
What’s lacking has never been market action—it’s discipline.
If volume suddenly surges near 23.120, that would signal buyers are stepping in. Don’t overstay your position then.
$MVLLB #MVLLB
MVLLB is now at 26.340, down 9.67% in 24 hours and still down 5.83% over 7 days. The intraday range was 23.120–31.410, with a 35.9% amplitude.
【Market Action】
Volatility has been extreme over the past few days, leaving MVLLB with a very wide intraday range.
But these are exactly the conditions when you need to watch out for shakeouts; short-term sentiment can overheat easily.
MVLLB moved lower throughout the day, from 23.120 to 31.410, and the rebound was clearly on low volume.
The rebound came on lower volume while the decline came on higher volume—a bearish price-volume pattern.
The broader market was up 0.51% over the same period, but MVLLB fell 9.67%, underperforming the market average.
【Macro】 Overnight, U.S. stocks closed higher: Nasdaq +0.82% and S&P 500 +0.70% (2026-10-27 close). Spot BTC ETFs have seen approximately $45.2 billion in net outflows this month. U.S. CPI came in at 3.7% year over year, above expectations, and the probability of an interest rate hike at the 2026-10-27/28 meeting is around 47%. Spot BTC ETFs have seen approximately $45.2 billion in net outflows this month, as institutional buying has dried up.
The short-term outlook leans bearish.
【Bearish Reasons】
MVLLB moved from 23.120 to 31.410, and the 9.67% one-day loss has set off a wave of FOMO among those chasing the price.
It slid from 31.410 to around 26.340, and the short-term trend is still moving lower.
What’s lacking has never been market action—it’s discipline.
If volume suddenly surges near 23.120, that would signal buyers are stepping in. Don’t overstay your position then.
$MVLLB #MVLLB
【Market Action】
Volatility has been extreme over the past few days, leaving MVLLB with a very wide intraday range.
But these are exactly the conditions when you need to watch out for shakeouts; short-term sentiment can overheat easily.
MVLLB moved lower throughout the day, from 23.120 to 31.410, and the rebound was clearly on low volume.
The rebound came on lower volume while the decline came on higher volume—a bearish price-volume pattern.
The broader market was up 0.51% over the same period, but MVLLB fell 9.67%, underperforming the market average.
【Macro】 Overnight, U.S. stocks closed higher: Nasdaq +0.82% and S&P 500 +0.70% (2026-10-27 close). Spot BTC ETFs have seen approximately $45.2 billion in net outflows this month. U.S. CPI came in at 3.7% year over year, above expectations, and the probability of an interest rate hike at the 2026-10-27/28 meeting is around 47%. Spot BTC ETFs have seen approximately $45.2 billion in net outflows this month, as institutional buying has dried up.
The short-term outlook leans bearish.
【Bearish Reasons】
MVLLB moved from 23.120 to 31.410, and the 9.67% one-day loss has set off a wave of FOMO among those chasing the price.
It slid from 31.410 to around 26.340, and the short-term trend is still moving lower.
What’s lacking has never been market action—it’s discipline.
If volume suddenly surges near 23.120, that would signal buyers are stepping in. Don’t overstay your position then.
$MVLLB #MVLLB

·
--
Bullish
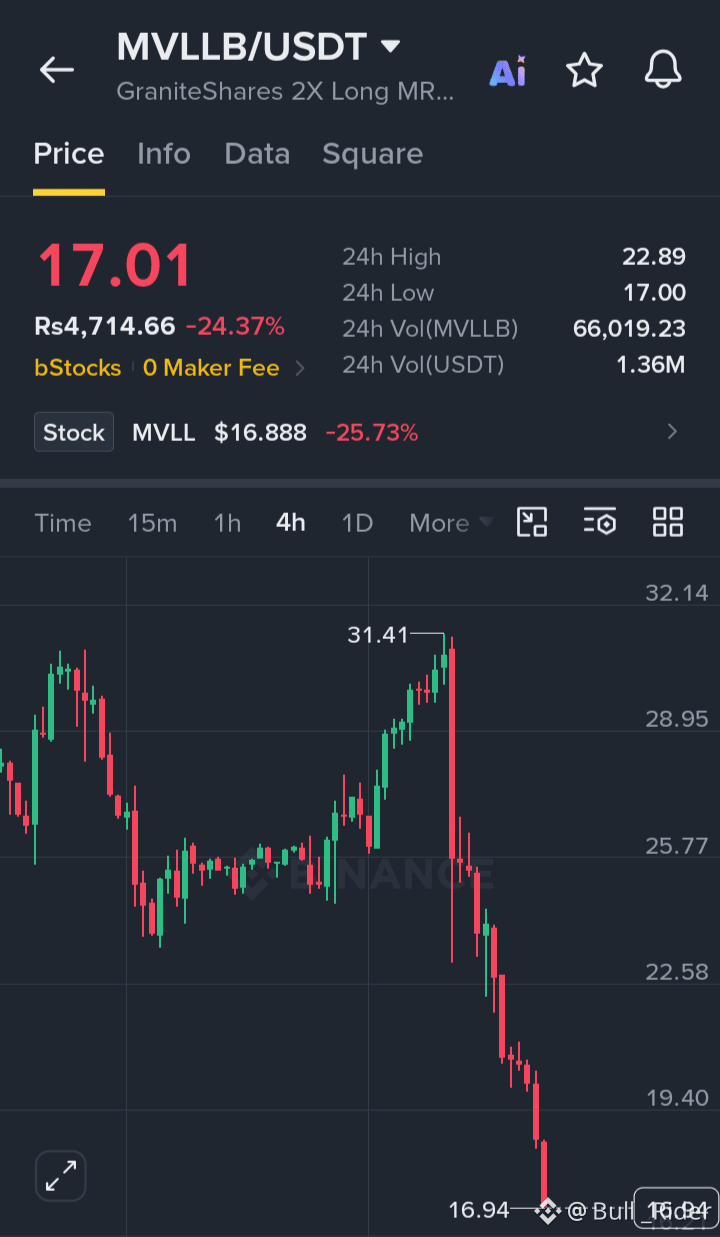
$MVLLB is facing strong selling pressure after a sharp decline, with price testing the $17.00 support zone. A recovery above nearby resistance could help build momentum for a rebound.
Entry: 17.00–17.50
TP1: 19.40
TP2: 22.58
TP3: 25.77
SL: 16.00
Buy and Trade $RSR
{future}(RSRUSDT)
#MVLLB $LSK
{future}(LSKUSDT)
{spot}(MVLLBUSDT)
$MVLLB is facing strong selling pressure after a sharp decline, with price testing the $17.00 support zone. A recovery above nearby resistance could help build momentum for a rebound.
Entry: 17.00–17.50
TP1: 19.40
TP2: 22.58
TP3: 25.77
SL: 16.00
Buy and Trade $RSR
#MVLLB $LSK
Entry: 17.00–17.50
TP1: 19.40
TP2: 22.58
TP3: 25.77
SL: 16.00
Buy and Trade $RSR
#MVLLB $LSK
1
58
·
--
Bearish
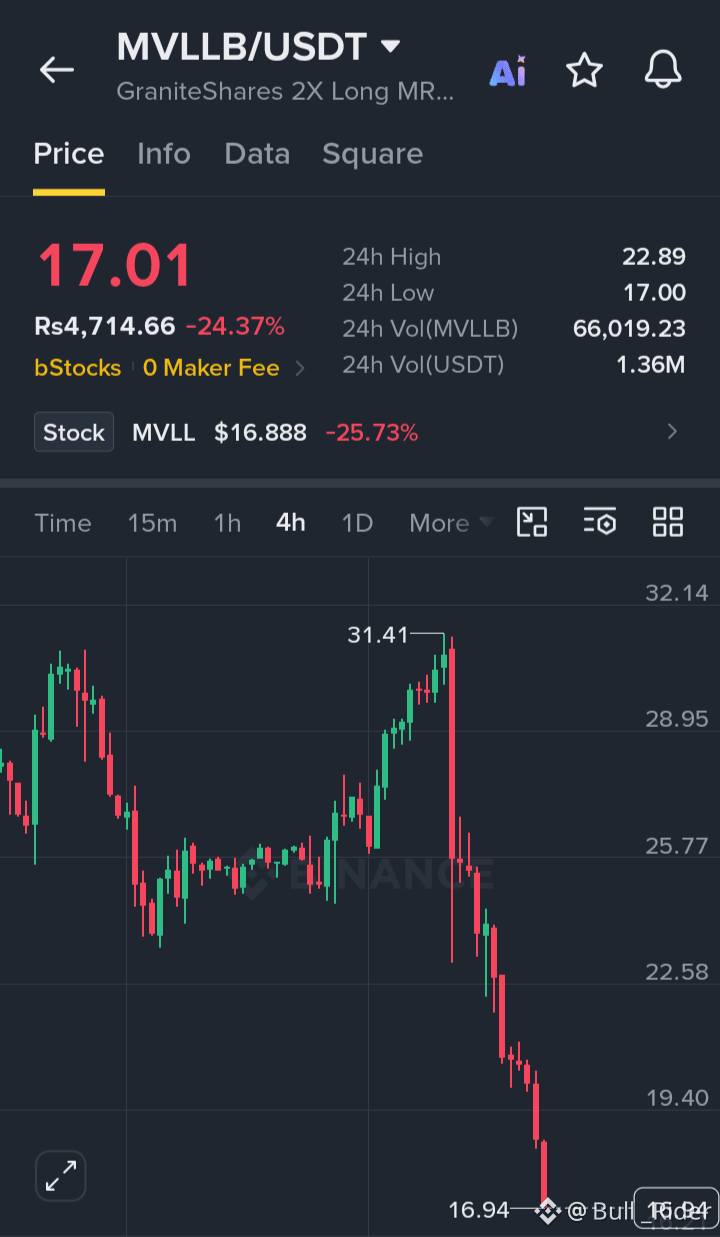
$MVLLB is facing strong selling pressure after dropping 24.37%, with price testing support near 16.94. Buyers may attempt a recovery from this level, but confirmation is needed before expecting a bullish reversal.
Entry: 17.00–17.50
TP1: 18.50
TP2: 19.40
TP3: 22.58
SL: 16.00
Buy and Trade $MVLLB
#MVLLB $MVLL
{future}(MVLLUSDT)
{spot}(MVLLBUSDT)
$MVLLB is facing strong selling pressure after dropping 24.37%, with price testing support near 16.94. Buyers may attempt a recovery from this level, but confirmation is needed before expecting a bullish reversal.
Entry: 17.00–17.50
TP1: 18.50
TP2: 19.40
TP3: 22.58
SL: 16.00
Buy and Trade $MVLLB
#MVLLB $MVLL
Entry: 17.00–17.50
TP1: 18.50
TP2: 19.40
TP3: 22.58
SL: 16.00
Buy and Trade $MVLLB
#MVLLB $MVLL
1
19

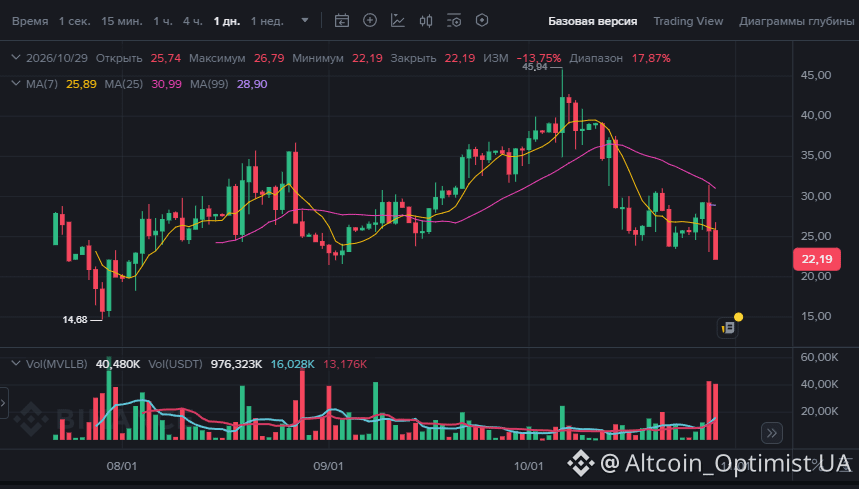
📉 $MVLLB Down 28% — Is It Time to Buy the Dip?
MVLLB continues to fall. On the daily chart, the price has dropped to 22.19 USDT, accompanied by a sharp increase in selling volume. The price is trading below MA(7), MA(25), and MA(99), keeping the short-term trend bearish.
🔎 What’s behind the sell-off?
Marvell Technology has come under pressure following reports of a potential acquisition of Lumentum. The market is assessing the deal’s potential cost and financing risks. The broader tech sector is also facing pressure amid concerns about the returns on AI investments.
📊 My $MVLLB Trading Plan
🟢 Entry: 22 USDT
🎯 Take Profit: 30 USDT
🔴 Stop Loss: 19 USDT
Potential profit: 8 USDT per unit.
Potential risk: 3 USDT per unit.
Risk-to-reward ratio: 2.67:1.
The breakeven win rate is approximately 27.3%, excluding trading fees. My expected win rate for this setup is 60%.
📍 Key Levels to Watch:
22–23 USDT — potential stabilization zone.
20–21 USDT — next potential support zone.
25.8–26.8 USDT — first resistance zone.
28.9–30 USDT — target exit area.
My strategy: I’m considering buying near 22 USDT, with a take-profit target at 30 and a stop-loss at 19. If buyers defend support, I expect an attempt at a rebound. If 22 USDT breaks down, I’ll watch how the price reacts around 20–21 USDT.
Will $MVLLB rebound toward 30 USDT, or will sellers push it even lower?
#MVLLB #MRVL #Trading #BinanceSquare
📉 $MVLLB Down 28% — Is It Time to Buy the Dip?
MVLLB continues to fall. On the daily chart, the price has dropped to 22.19 USDT, accompanied by a sharp increase in selling volume. The price is trading below MA(7), MA(25), and MA(99), keeping the short-term trend bearish.
🔎 What’s behind the sell-off?
Marvell Technology has come under pressure following reports of a potential acquisition of Lumentum. The market is assessing the deal’s potential cost and financing risks. The broader tech sector is also facing pressure amid concerns about the returns on AI investments.
📊 My $MVLLB Trading Plan
🟢 Entry: 22 USDT
🎯 Take Profit: 30 USDT
🔴 Stop Loss: 19 USDT
Potential profit: 8 USDT per unit.
Potential risk: 3 USDT per unit.
Risk-to-reward ratio: 2.67:1.
The breakeven win rate is approximately 27.3%, excluding trading fees. My expected win rate for this setup is 60%.
📍 Key Levels to Watch:
22–23 USDT — potential stabilization zone.
20–21 USDT — next potential support zone.
25.8–26.8 USDT — first resistance zone.
28.9–30 USDT — target exit area.
My strategy: I’m considering buying near 22 USDT, with a take-profit target at 30 and a stop-loss at 19. If buyers defend support, I expect an attempt at a rebound. If 22 USDT breaks down, I’ll watch how the price reacts around 20–21 USDT.
Will $MVLLB rebound toward 30 USDT, or will sellers push it even lower?
#MVLLB #MRVL #Trading #BinanceSquare
MVLLB continues to fall. On the daily chart, the price has dropped to 22.19 USDT, accompanied by a sharp increase in selling volume. The price is trading below MA(7), MA(25), and MA(99), keeping the short-term trend bearish.
🔎 What’s behind the sell-off?
Marvell Technology has come under pressure following reports of a potential acquisition of Lumentum. The market is assessing the deal’s potential cost and financing risks. The broader tech sector is also facing pressure amid concerns about the returns on AI investments.
📊 My $MVLLB Trading Plan
🟢 Entry: 22 USDT
🎯 Take Profit: 30 USDT
🔴 Stop Loss: 19 USDT
Potential profit: 8 USDT per unit.
Potential risk: 3 USDT per unit.
Risk-to-reward ratio: 2.67:1.
The breakeven win rate is approximately 27.3%, excluding trading fees. My expected win rate for this setup is 60%.
📍 Key Levels to Watch:
22–23 USDT — potential stabilization zone.
20–21 USDT — next potential support zone.
25.8–26.8 USDT — first resistance zone.
28.9–30 USDT — target exit area.
My strategy: I’m considering buying near 22 USDT, with a take-profit target at 30 and a stop-loss at 19. If buyers defend support, I expect an attempt at a rebound. If 22 USDT breaks down, I’ll watch how the price reacts around 20–21 USDT.
Will $MVLLB rebound toward 30 USDT, or will sellers push it even lower?
#MVLLB #MRVL #Trading #BinanceSquare
394

·
--
Bearish
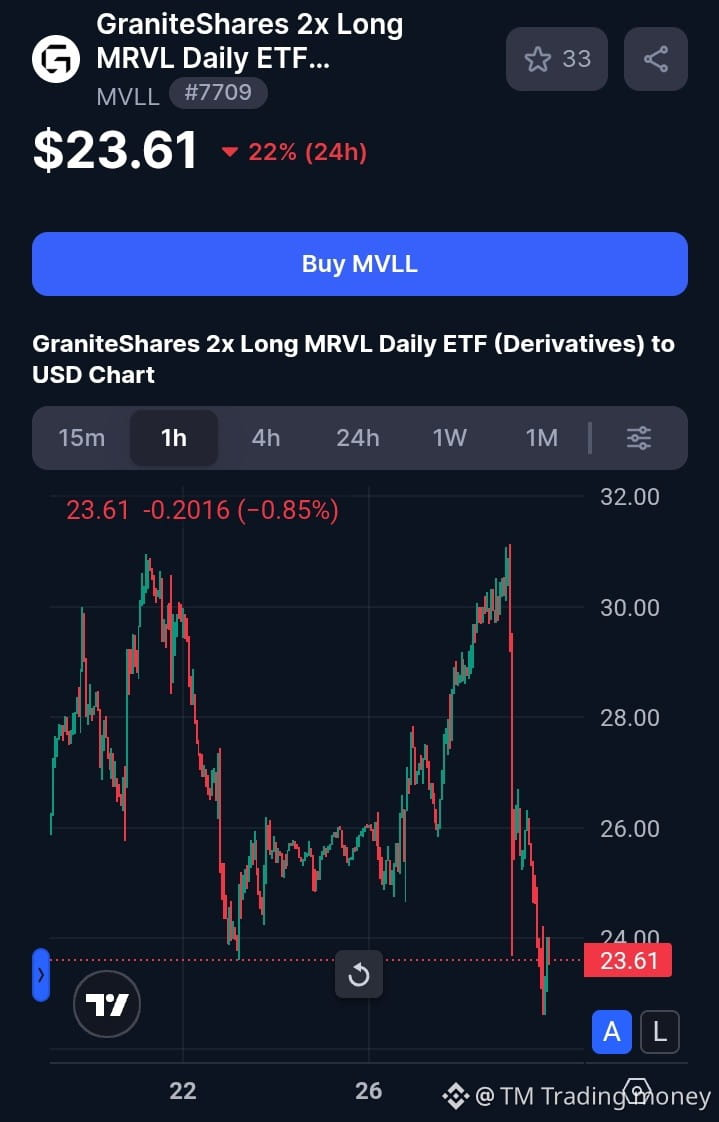
🚨 $MVLLB COIN DROPS 22.38% IN 24 HOURS! 📉
{spot}(MVLLBUSDT)
💰 Price: $23.62
🔴 24H Change: -22.38%
📉 MVLLB is facing strong selling pressure, with its price falling from a 24-hour high of $30.99 to around $25.62. The price is approaching the recent low near $24.34. Can buyers step in for a recovery, or will the decline continue?
📊 BOUNCE BACK OR MORE DOWNSIDE? 👀
💬 BULLISH 🟢 or BEARISH 🔴? Share your prediction!
⚠️ High volatility — manage your risk carefully.
#MVLLB #Crypto #Trading #TokenizedStocks #MarketUpdate
🚨 $MVLLB COIN DROPS 22.38% IN 24 HOURS! 📉
💰 Price: $23.62
🔴 24H Change: -22.38%
📉 MVLLB is facing strong selling pressure, with its price falling from a 24-hour high of $30.99 to around $25.62. The price is approaching the recent low near $24.34. Can buyers step in for a recovery, or will the decline continue?
📊 BOUNCE BACK OR MORE DOWNSIDE? 👀
💬 BULLISH 🟢 or BEARISH 🔴? Share your prediction!
⚠️ High volatility — manage your risk carefully.
#MVLLB #Crypto #Trading #TokenizedStocks #MarketUpdate
💰 Price: $23.62
🔴 24H Change: -22.38%
📉 MVLLB is facing strong selling pressure, with its price falling from a 24-hour high of $30.99 to around $25.62. The price is approaching the recent low near $24.34. Can buyers step in for a recovery, or will the decline continue?
📊 BOUNCE BACK OR MORE DOWNSIDE? 👀
💬 BULLISH 🟢 or BEARISH 🔴? Share your prediction!
⚠️ High volatility — manage your risk carefully.
#MVLLB #Crypto #Trading #TokenizedStocks #MarketUpdate
168

·
--
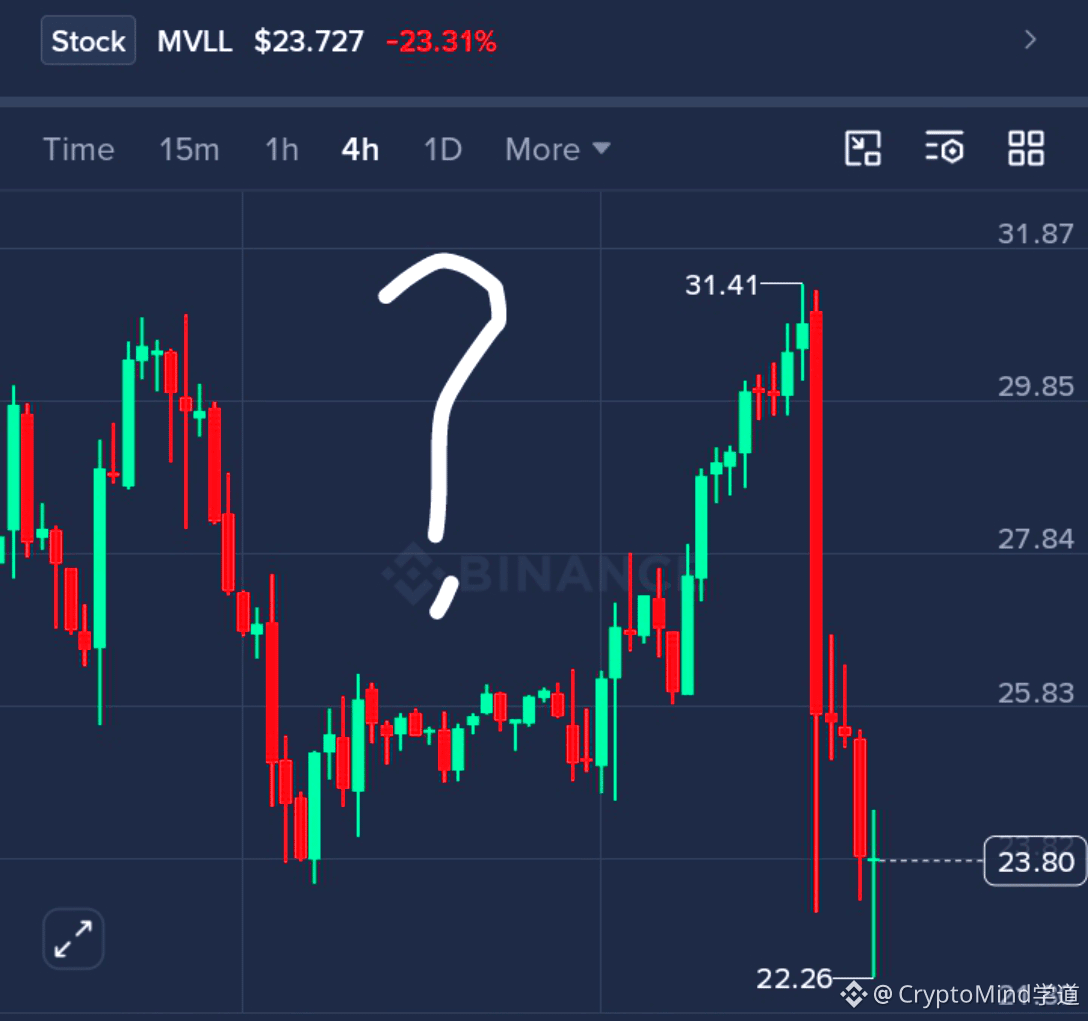
Buying the dip on a tokenized stock just because the RSI looks "oversold" is how you get financially nuked... 💀
Look at $MVLLB right now. Down 21% in a single day, straight into the dirt.
You see that massive red candle and the RSI screaming at 18, and your brain tells you, "It has to bounce, let's buy the bottom!"
But this isn't your average crypto coin. $MVLLB is a tokenized stock ETF. You aren't just trading crypto anymore—you are trading traditional equities on-chain.
The problem? You're treating a TradFi asset like a memecoin. When the underlying stock (MRVL) takes a hit, the token follows. Spotting a "bounce" on a crypto exchange won't save you if the actual stock market is bleeding.
Stop blindly buying red candles on tokenized stocks. Respect the traditional markets.
Before you touch $MVLLB, you need to zoom out and check the actual stock market. Look at the underlying asset's earnings, its daily structure, and the broader market sentiment. Don't trade a tokenized equity based on a 15-minute crypto chart.
By actually understanding what you're holding, you protect your capital from catastrophic drawdowns. You stop becoming exit liquidity for tradfi whales crossing over into Web3. You survive to trade another day.
Have you ever invested in tokenized stocks on-chain, or do you strictly stick to crypto? Drop your thoughts below. 👇📉
{spot}(MVLLBUSDT)
#MVLLB #MVLLBUSDT
Buying the dip on a tokenized stock just because the RSI looks "oversold" is how you get financially nuked... 💀
Look at $MVLLB right now. Down 21% in a single day, straight into the dirt.
You see that massive red candle and the RSI screaming at 18, and your brain tells you, "It has to bounce, let's buy the bottom!"
But this isn't your average crypto coin. $MVLLB is a tokenized stock ETF. You aren't just trading crypto anymore—you are trading traditional equities on-chain.
The problem? You're treating a TradFi asset like a memecoin. When the underlying stock (MRVL) takes a hit, the token follows. Spotting a "bounce" on a crypto exchange won't save you if the actual stock market is bleeding.
Stop blindly buying red candles on tokenized stocks. Respect the traditional markets.
Before you touch $MVLLB , you need to zoom out and check the actual stock market. Look at the underlying asset's earnings, its daily structure, and the broader market sentiment. Don't trade a tokenized equity based on a 15-minute crypto chart.
By actually understanding what you're holding, you protect your capital from catastrophic drawdowns. You stop becoming exit liquidity for tradfi whales crossing over into Web3. You survive to trade another day.
Have you ever invested in tokenized stocks on-chain, or do you strictly stick to crypto? Drop your thoughts below. 👇📉
#MVLLB #MVLLBUSDT
Look at $MVLLB right now. Down 21% in a single day, straight into the dirt.
You see that massive red candle and the RSI screaming at 18, and your brain tells you, "It has to bounce, let's buy the bottom!"
But this isn't your average crypto coin. $MVLLB is a tokenized stock ETF. You aren't just trading crypto anymore—you are trading traditional equities on-chain.
The problem? You're treating a TradFi asset like a memecoin. When the underlying stock (MRVL) takes a hit, the token follows. Spotting a "bounce" on a crypto exchange won't save you if the actual stock market is bleeding.
Stop blindly buying red candles on tokenized stocks. Respect the traditional markets.
Before you touch $MVLLB , you need to zoom out and check the actual stock market. Look at the underlying asset's earnings, its daily structure, and the broader market sentiment. Don't trade a tokenized equity based on a 15-minute crypto chart.
By actually understanding what you're holding, you protect your capital from catastrophic drawdowns. You stop becoming exit liquidity for tradfi whales crossing over into Web3. You survive to trade another day.
Have you ever invested in tokenized stocks on-chain, or do you strictly stick to crypto? Drop your thoughts below. 👇📉
#MVLLB #MVLLBUSDT
164
·
--
Bearish
$MVLLB
{spot}(MVLLBUSDT)
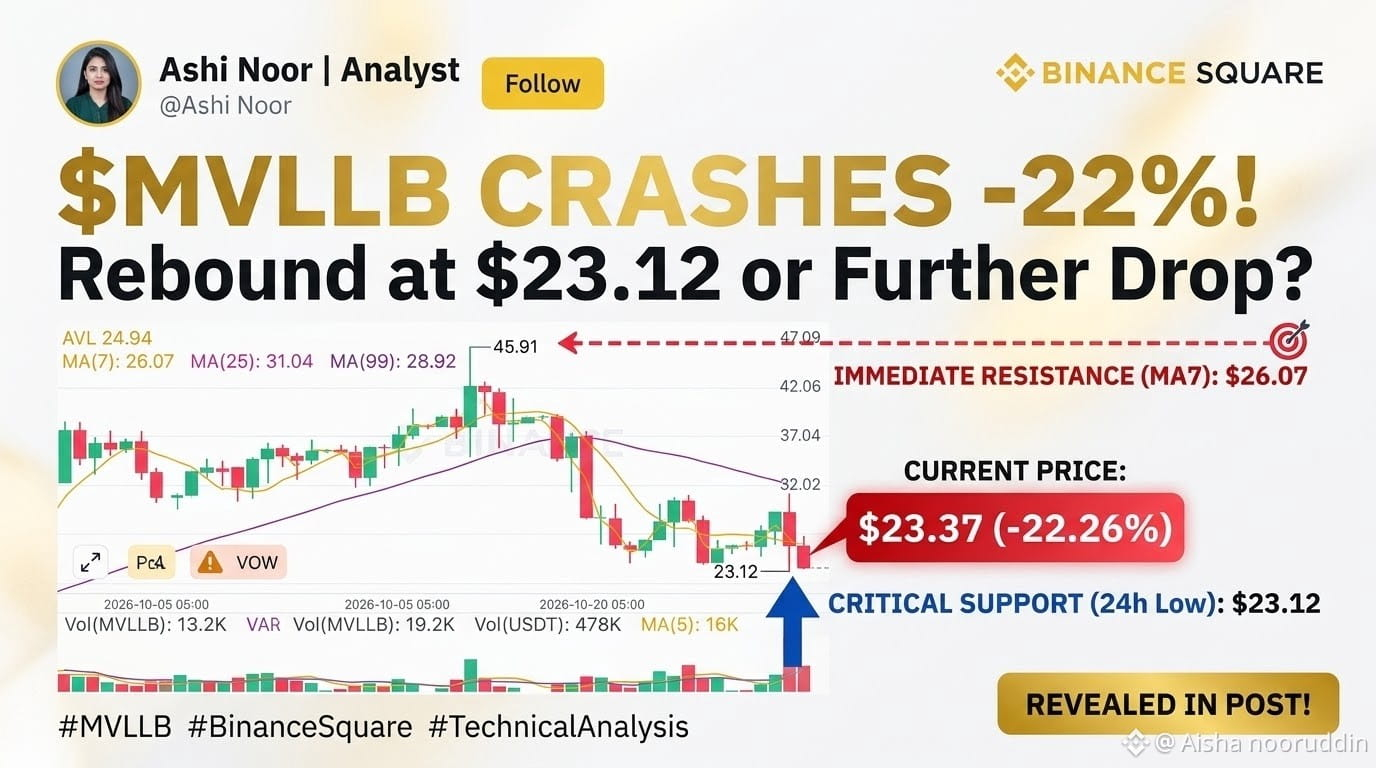
Down -22%! Rebound at $23.12 or Further Crash?
The $MVLLB /USDT daily chart printed a steep -22% red candle, rejecting hard from $31+ resistance down to $23.37 on massive volume.
📊 Key Technical Levels:
* Current Price: $23.37 (24h Low: $23.12 | 24h High: $31.41)
* Immediate Support Floor: $23.12 (Critical 24h Low)
* Overhead Resistance (MA7): $26.07
* Macro Baseline (MA99): $28.92
💡 Trade Scenarios:
* Bullish Relief Bounce: Holding the $23.12 support floor opens a path for a technical relief retest toward $26.07 (MA7).
* Bearish Breakdown: A close below $23.12 signals extended liquidation toward the $21.00 zone.
⚠️ Leveraged ETF asset — manage risk with strict stop-losses!
👇 Community Discussion:
Are you buying the dip near $23.12 or waiting for a deeper pull down? Comment below! 👇
📌 Follow @Ashi Noor | Analyst for daily high-impact technical updates!
#Write2Earn #BinanceSquare #MVLLB #MRVL #TechnicalAnalysis $[MVLLB]
$MVLLB
Down -22%! Rebound at $23.12 or Further Crash?
The $MVLLB /USDT daily chart printed a steep -22% red candle, rejecting hard from $31+ resistance down to $23.37 on massive volume.
📊 Key Technical Levels:
* Current Price: $23.37 (24h Low: $23.12 | 24h High: $31.41)
* Immediate Support Floor: $23.12 (Critical 24h Low)
* Overhead Resistance (MA7): $26.07
* Macro Baseline (MA99): $28.92
💡 Trade Scenarios:
* Bullish Relief Bounce: Holding the $23.12 support floor opens a path for a technical relief retest toward $26.07 (MA7).
* Bearish Breakdown: A close below $23.12 signals extended liquidation toward the $21.00 zone.
⚠️ Leveraged ETF asset — manage risk with strict stop-losses!
👇 Community Discussion:
Are you buying the dip near $23.12 or waiting for a deeper pull down? Comment below! 👇
📌 Follow @Ashi Noor | Analyst for daily high-impact technical updates!
#Write2Earn #BinanceSquare #MVLLB #MRVL #TechnicalAnalysis $[MVLLB]
Down -22%! Rebound at $23.12 or Further Crash?
The $MVLLB /USDT daily chart printed a steep -22% red candle, rejecting hard from $31+ resistance down to $23.37 on massive volume.
📊 Key Technical Levels:
* Current Price: $23.37 (24h Low: $23.12 | 24h High: $31.41)
* Immediate Support Floor: $23.12 (Critical 24h Low)
* Overhead Resistance (MA7): $26.07
* Macro Baseline (MA99): $28.92
💡 Trade Scenarios:
* Bullish Relief Bounce: Holding the $23.12 support floor opens a path for a technical relief retest toward $26.07 (MA7).
* Bearish Breakdown: A close below $23.12 signals extended liquidation toward the $21.00 zone.
⚠️ Leveraged ETF asset — manage risk with strict stop-losses!
👇 Community Discussion:
Are you buying the dip near $23.12 or waiting for a deeper pull down? Comment below! 👇
📌 Follow @Ashi Noor | Analyst for daily high-impact technical updates!
#Write2Earn #BinanceSquare #MVLLB #MRVL #TechnicalAnalysis $[MVLLB]
172

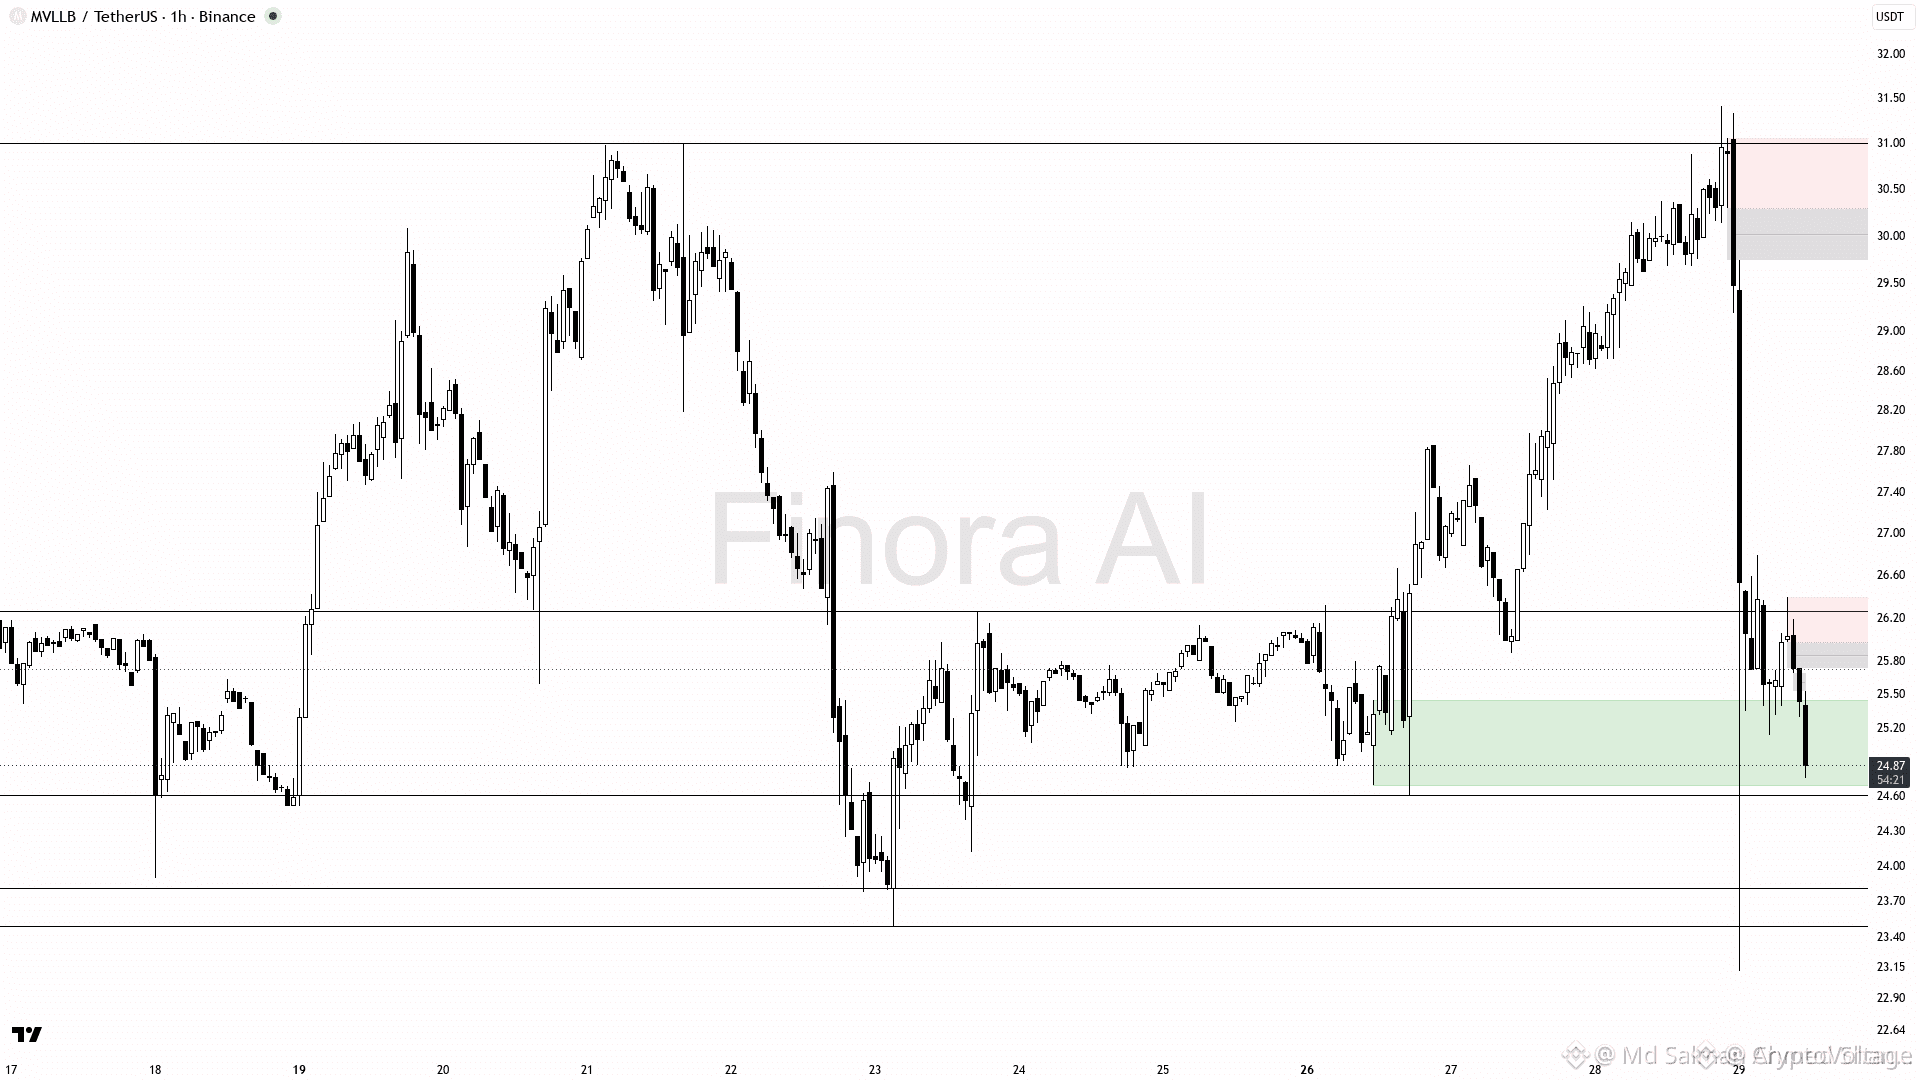
📉 $MVLLB DROPS 16.4% — Is More Downside Ahead?
The selling pressure on $MVLLB is hard to ignore. A sharp decline combined with an 8x volume spike raises questions about whether buyers are stepping aside or forced selling is accelerating.
My current bias is bearish, with the 1-hour structure pointing lower and broader market weakness adding to the risk.
🔻 Potential SHORT Setup
- Entry Zone: $25.87–$26.26
- 🎯 TP1: $24.60
- 🎯 TP2: $23.12
The preferred setup would be a weak bounce into resistance followed by a clear rejection or lower-timeframe breakdown.
⚠️ If price reclaims the supply zone with strength, the bearish thesis needs to be reassessed. High-volume sell-offs can also trigger sharp relief rallies.
Question: Is $MVLLB heading toward $23.12, or are sellers running out of steam?
#MVLLB #CryptoAnalysis #ShortSetup #altcoins #BinanceSquare
📉 $MVLLB DROPS 16.4% — Is More Downside Ahead?
The selling pressure on $MVLLB is hard to ignore. A sharp decline combined with an 8x volume spike raises questions about whether buyers are stepping aside or forced selling is accelerating.
My current bias is bearish, with the 1-hour structure pointing lower and broader market weakness adding to the risk.
🔻 Potential SHORT Setup
- Entry Zone: $25.87–$26.26
- 🎯 TP1: $24.60
- 🎯 TP2: $23.12
The preferred setup would be a weak bounce into resistance followed by a clear rejection or lower-timeframe breakdown.
⚠️ If price reclaims the supply zone with strength, the bearish thesis needs to be reassessed. High-volume sell-offs can also trigger sharp relief rallies.
Question: Is $MVLLB heading toward $23.12, or are sellers running out of steam?
#MVLLB #CryptoAnalysis #ShortSetup #altcoins #BinanceSquare
The selling pressure on $MVLLB is hard to ignore. A sharp decline combined with an 8x volume spike raises questions about whether buyers are stepping aside or forced selling is accelerating.
My current bias is bearish, with the 1-hour structure pointing lower and broader market weakness adding to the risk.
🔻 Potential SHORT Setup
- Entry Zone: $25.87–$26.26
- 🎯 TP1: $24.60
- 🎯 TP2: $23.12
The preferred setup would be a weak bounce into resistance followed by a clear rejection or lower-timeframe breakdown.
⚠️ If price reclaims the supply zone with strength, the bearish thesis needs to be reassessed. High-volume sell-offs can also trigger sharp relief rallies.
Question: Is $MVLLB heading toward $23.12, or are sellers running out of steam?
#MVLLB #CryptoAnalysis #ShortSetup #altcoins #BinanceSquare
99
Log in to explore more content
Join global crypto users on Binance Square
⚡️ Get latest and useful information about crypto.
💬 Trusted by the world’s largest crypto exchange.
👍 Discover real insights from verified creators.
Email / Phone number
Trending Topics
1
#BinanceReopensWithdrawalsForHYPE&APT
107,493 views
1,053 Discussing
2
#SouthKoreaDraftLawTargets15To20%ShareholderCap
102,626 views
698 Discussing
3
#TradFiForBeginners
192,780 views
1,916 Discussing
4
#KeplrAdvisesSocialLoginUsersToTransferAssets
52,083 views
539 Discussing
5
#TetherPlans€28.8MForJuventusCapitalIncrease
40,533 views
419 Discussing
6
#JobsReportRaisesHikeOdds
896,873 views
4,481 Discussing
7
#CPITestsDecemberRateOutlook
372,386 views
1,910 Discussing
8
#US Data Center Rules May Constrain AI Expansion
136,222 views
261 Discussing
9
#ARKPlans14ThematicETFsCoveringAIAndTokenizedMarkets
10,130 views
90 Discussing
10
#WillAnthropicListOnTime
282,469 views
1,900 Discussing