
最新行情速看
1.5k Posts

最新行情速看
Report
Block User
Open Trade
Occasional Trader
5.6 Years
1 Following
69 Followers
79 Liked
Posts
Portfolio
All
Quotes
Videos
·
--
【Look Upward】
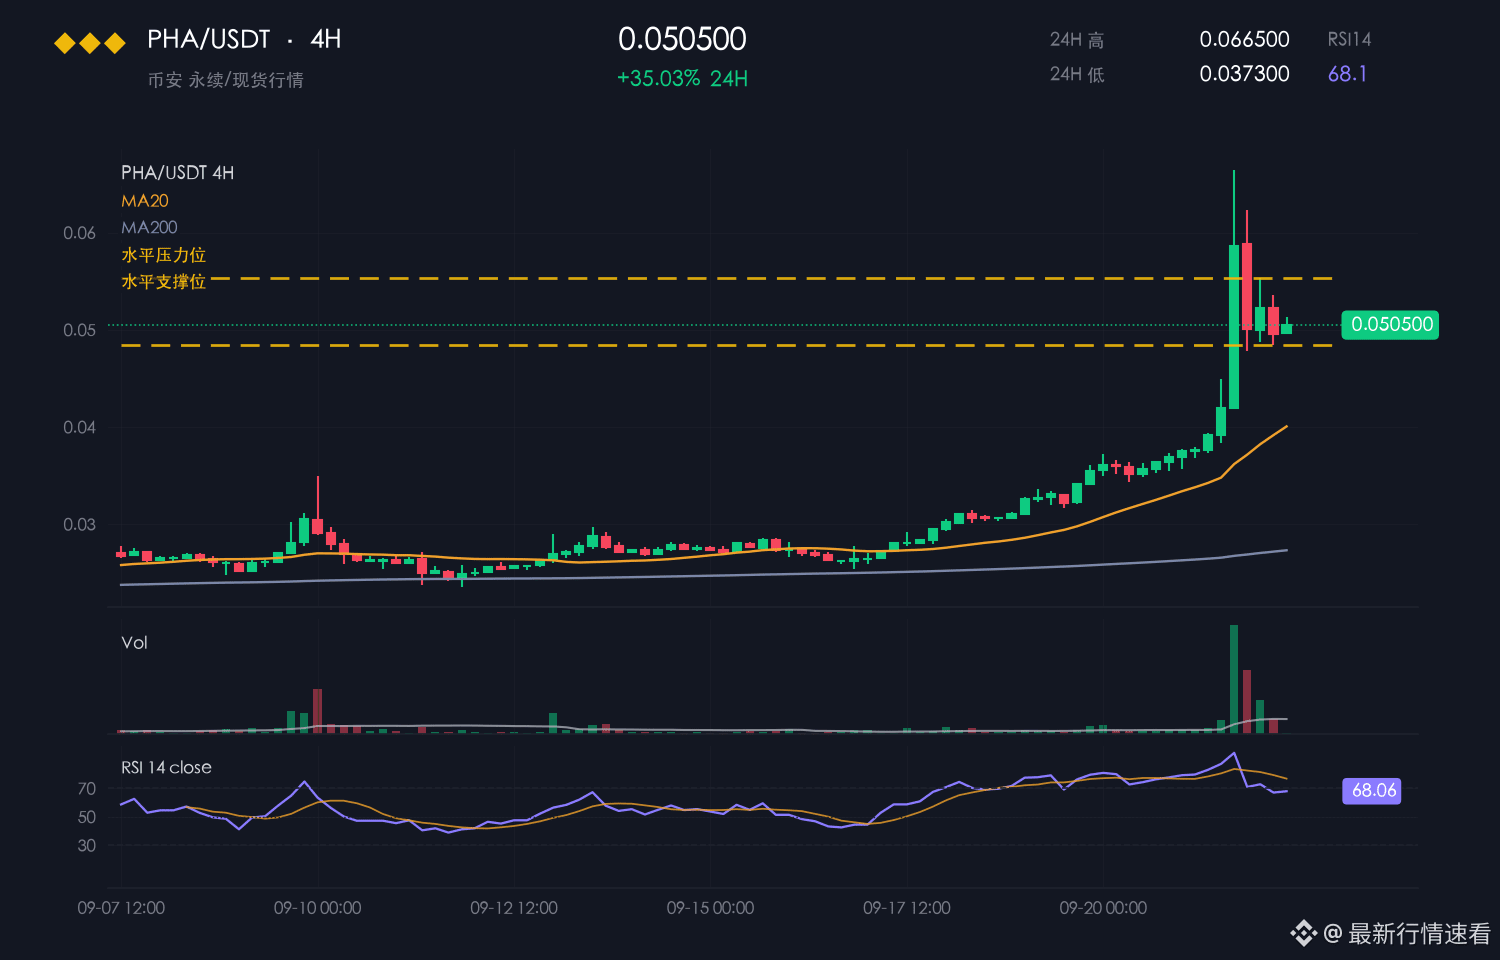
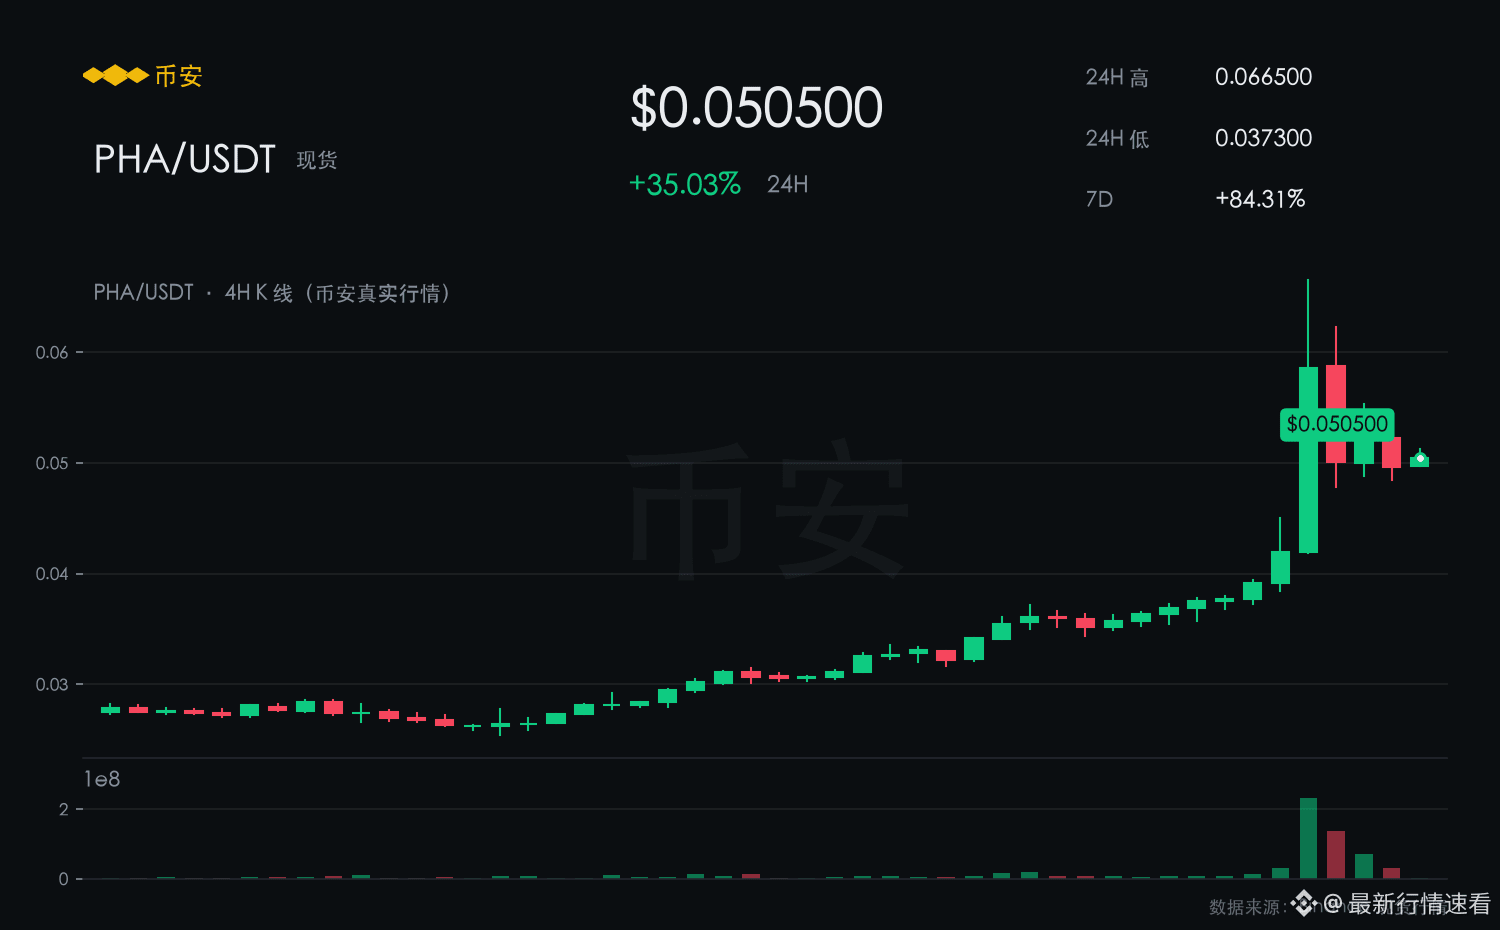
PHA is currently reporting 0.0505; it is up 35.03% over the past 24 hours and 84.31% over the past 7 days. The intraday range is 0.0373–0.0665, with a volatility of 78.3%.
【Market View】
In recent 4-hour candlesticks, the center of gravity has been rising continuously, showing clear signs that the bulls are controlling the market.
As long as 0.0373 is not lost, even the current pullback can be considered a strong consolidation.
When compared with BTC’s +6.24%, PHA is clearly stronger than the market’s average level.
In the short term, it leans bullish.
【Bullish Reasons】
From 0.0373 pushing up to around 0.0505, the short-term center of gravity is still moving upward.
In the 24-hour rally of 35.03%, the intraday high of 0.0665 has been tested repeatedly, indicating that overhead resistance is being digested.
The risk is that after the short-term surge, profit-taking could happen at any time; chasing higher may get “wicked” by a sudden spike downward.
In terms of strategy: use 0.0373 as the stop-loss level, and look upward for a breakout toward 0.0665.
$PHA #PHA
【Look Upward】
PHA is currently reporting 0.0505; it is up 35.03% over the past 24 hours and 84.31% over the past 7 days. The intraday range is 0.0373–0.0665, with a volatility of 78.3%.
【Market View】
In recent 4-hour candlesticks, the center of gravity has been rising continuously, showing clear signs that the bulls are controlling the market.
As long as 0.0373 is not lost, even the current pullback can be considered a strong consolidation.
When compared with BTC’s +6.24%, PHA is clearly stronger than the market’s average level.
In the short term, it leans bullish.
【Bullish Reasons】
From 0.0373 pushing up to around 0.0505, the short-term center of gravity is still moving upward.
In the 24-hour rally of 35.03%, the intraday high of 0.0665 has been tested repeatedly, indicating that overhead resistance is being digested.
The risk is that after the short-term surge, profit-taking could happen at any time; chasing higher may get “wicked” by a sudden spike downward.
In terms of strategy: use 0.0373 as the stop-loss level, and look upward for a breakout toward 0.0665.
$PHA #PHA
PHA is currently reporting 0.0505; it is up 35.03% over the past 24 hours and 84.31% over the past 7 days. The intraday range is 0.0373–0.0665, with a volatility of 78.3%.
【Market View】
In recent 4-hour candlesticks, the center of gravity has been rising continuously, showing clear signs that the bulls are controlling the market.
As long as 0.0373 is not lost, even the current pullback can be considered a strong consolidation.
When compared with BTC’s +6.24%, PHA is clearly stronger than the market’s average level.
In the short term, it leans bullish.
【Bullish Reasons】
From 0.0373 pushing up to around 0.0505, the short-term center of gravity is still moving upward.
In the 24-hour rally of 35.03%, the intraday high of 0.0665 has been tested repeatedly, indicating that overhead resistance is being digested.
The risk is that after the short-term surge, profit-taking could happen at any time; chasing higher may get “wicked” by a sudden spike downward.
In terms of strategy: use 0.0373 as the stop-loss level, and look upward for a breakout toward 0.0665.
$PHA #PHA
95
·
--
【Look Down】
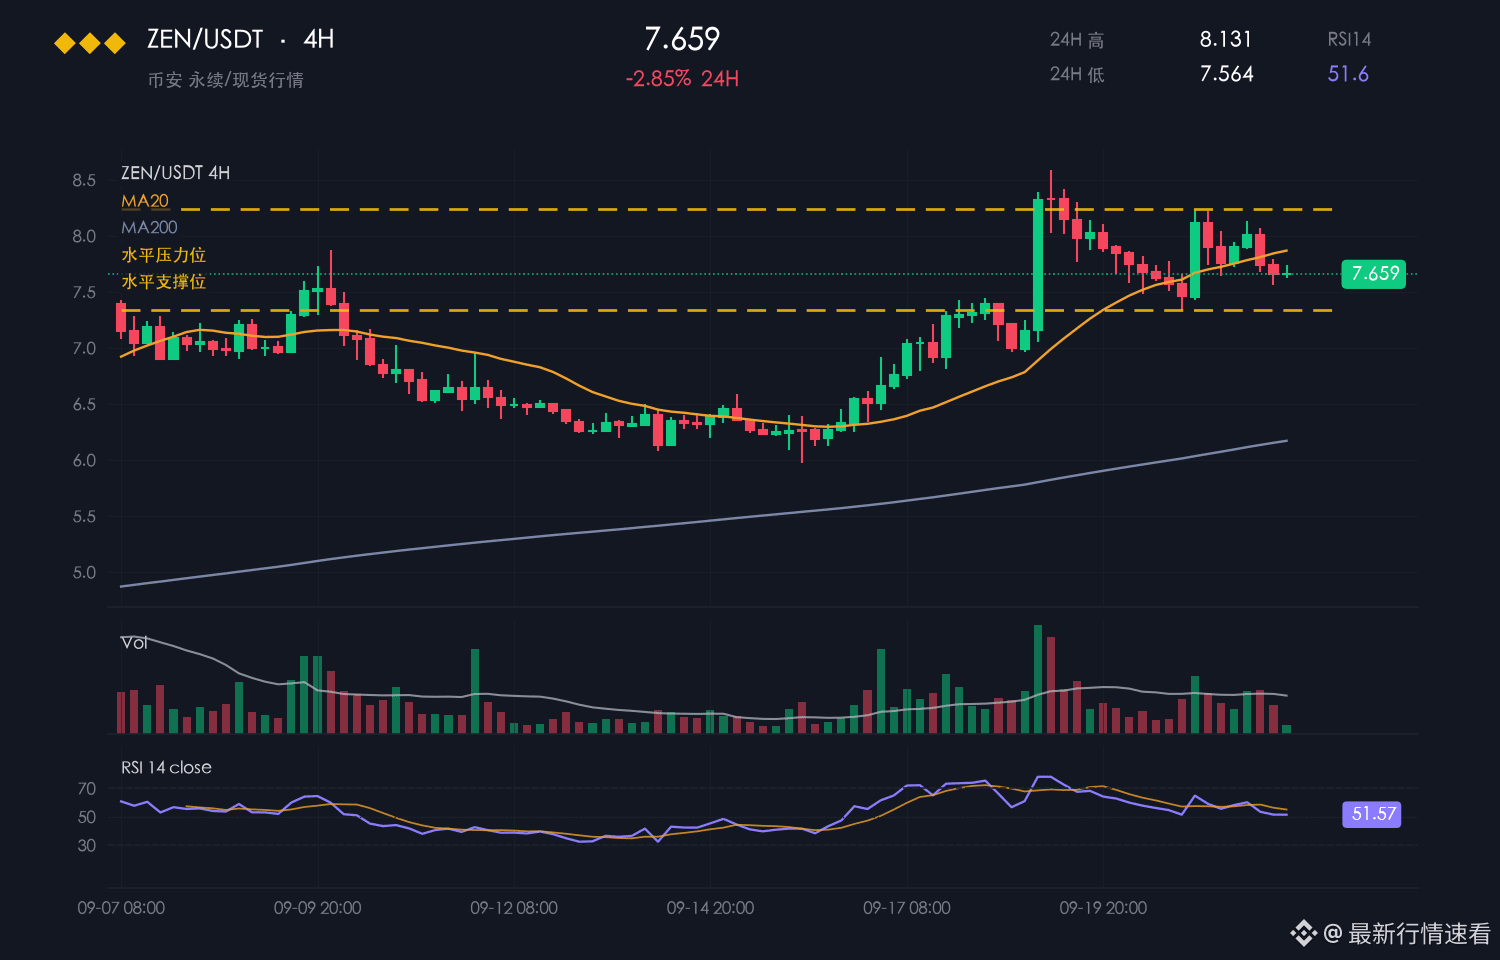
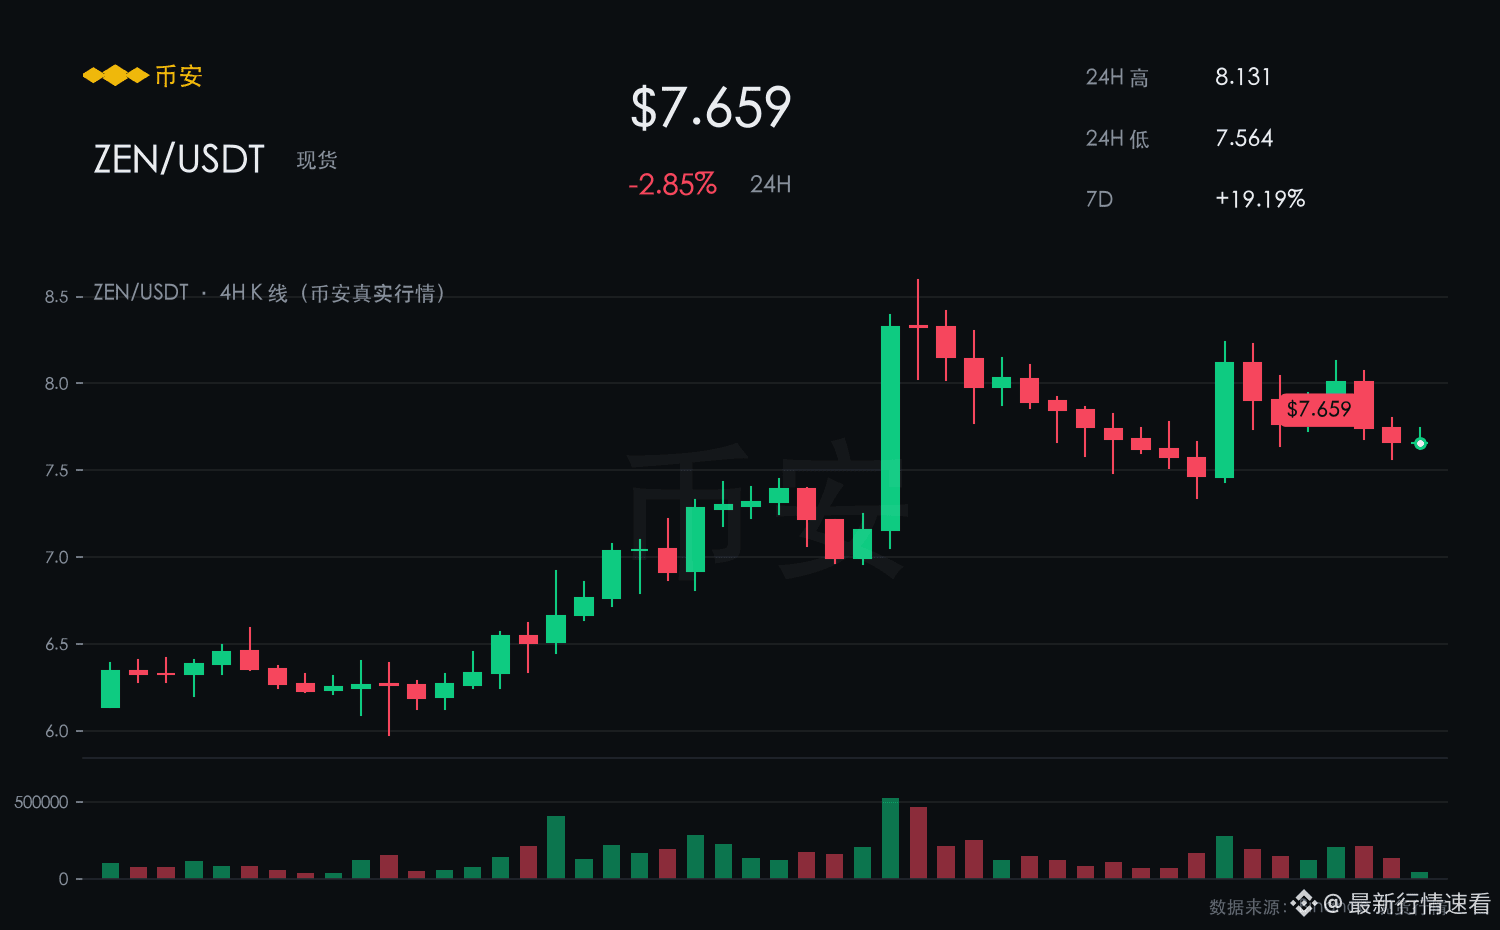
ZEN reports 7.655, down 2.90% over the past 24 hours. It is still up 19.13% over 7 days. The intraday range is 7.564–8.131, with a 7.5% amplitude.
【Market View】
After being down 2.90% over 24 hours, ZEN failed to hold 8.131, and the short-term focus remains shifting downward.
The rebound comes on lower volume while the decline comes on higher volume; the volume-price structure is bearish.
In the same period, BTC is up 7.28% over 24 hours, while ZEN’s 2.90% drop clearly underperforms the broader market, with funds withdrawing.
In the short term, the outlook leans bearish.
【Bearish Rationale】
The selling pressure near 8.131 has not been fully digested yet, and each time the price rebounds, the strength is weaker than the last.
Price is trading around 7.564; the balance between buyers and sellers at this level is clearly skewed toward sellers.
With the bearish arrangement, rebounds can easily become repetitive—don’t carry overly heavy positions.
For trading, treat 8.131 as the rebound resistance level, and 7.564 as the next observation point.
$ZEN #ZEN
【Look Down】
ZEN reports 7.655, down 2.90% over the past 24 hours. It is still up 19.13% over 7 days. The intraday range is 7.564–8.131, with a 7.5% amplitude.
【Market View】
After being down 2.90% over 24 hours, ZEN failed to hold 8.131, and the short-term focus remains shifting downward.
The rebound comes on lower volume while the decline comes on higher volume; the volume-price structure is bearish.
In the same period, BTC is up 7.28% over 24 hours, while ZEN’s 2.90% drop clearly underperforms the broader market, with funds withdrawing.
In the short term, the outlook leans bearish.
【Bearish Rationale】
The selling pressure near 8.131 has not been fully digested yet, and each time the price rebounds, the strength is weaker than the last.
Price is trading around 7.564; the balance between buyers and sellers at this level is clearly skewed toward sellers.
With the bearish arrangement, rebounds can easily become repetitive—don’t carry overly heavy positions.
For trading, treat 8.131 as the rebound resistance level, and 7.564 as the next observation point.
$ZEN #ZEN
ZEN reports 7.655, down 2.90% over the past 24 hours. It is still up 19.13% over 7 days. The intraday range is 7.564–8.131, with a 7.5% amplitude.
【Market View】
After being down 2.90% over 24 hours, ZEN failed to hold 8.131, and the short-term focus remains shifting downward.
The rebound comes on lower volume while the decline comes on higher volume; the volume-price structure is bearish.
In the same period, BTC is up 7.28% over 24 hours, while ZEN’s 2.90% drop clearly underperforms the broader market, with funds withdrawing.
In the short term, the outlook leans bearish.
【Bearish Rationale】
The selling pressure near 8.131 has not been fully digested yet, and each time the price rebounds, the strength is weaker than the last.
Price is trading around 7.564; the balance between buyers and sellers at this level is clearly skewed toward sellers.
With the bearish arrangement, rebounds can easily become repetitive—don’t carry overly heavy positions.
For trading, treat 8.131 as the rebound resistance level, and 7.564 as the next observation point.
$ZEN #ZEN
151
·
--
【See Decline】
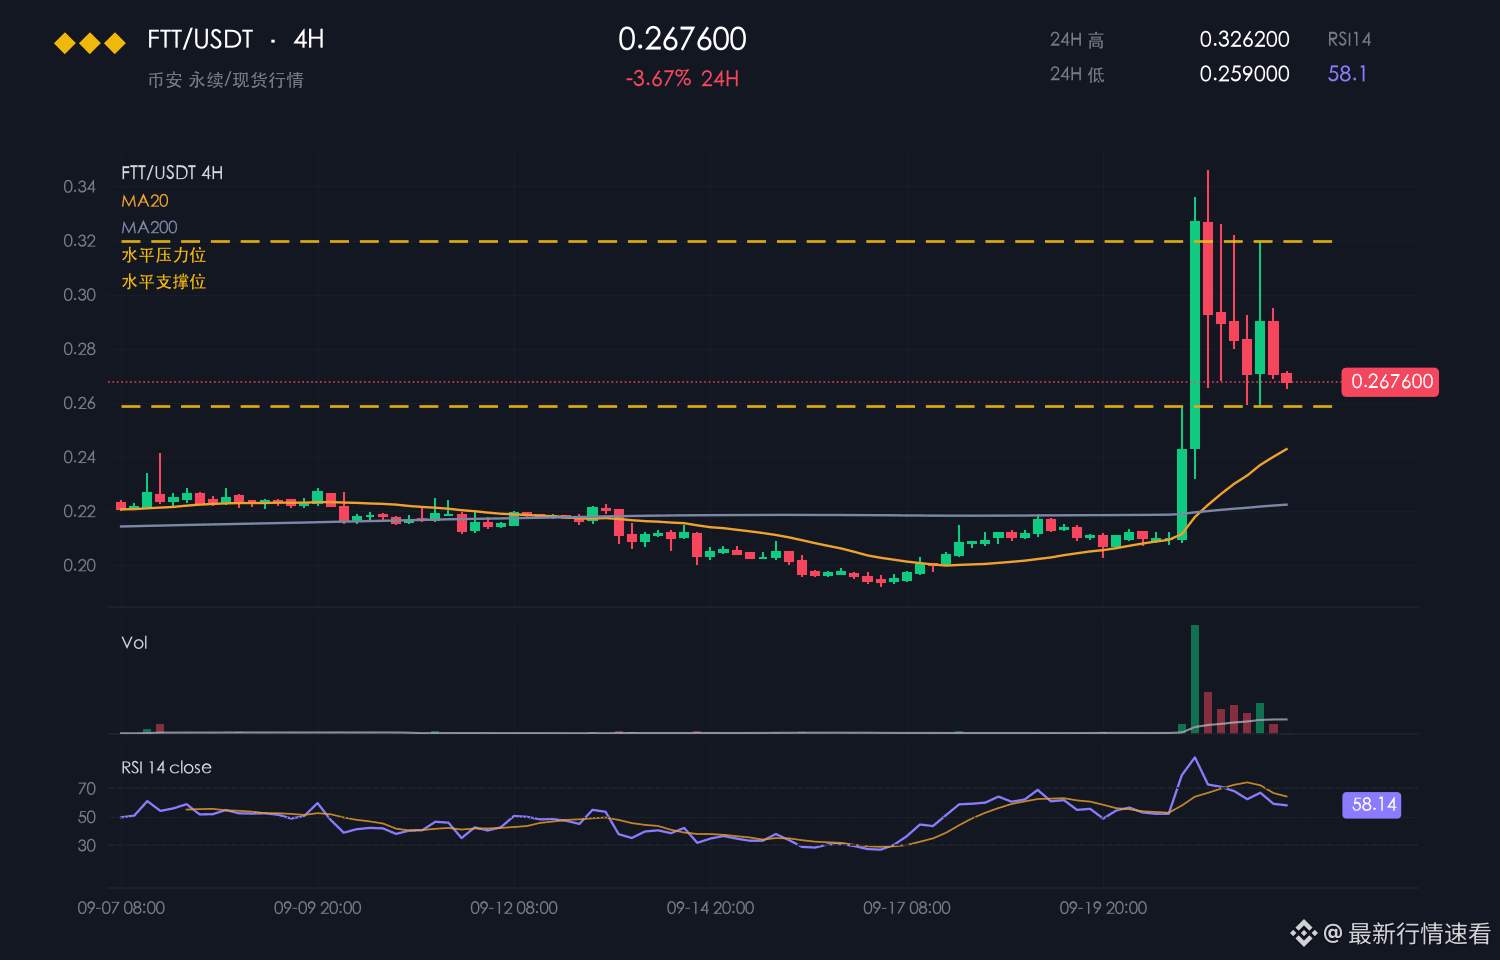
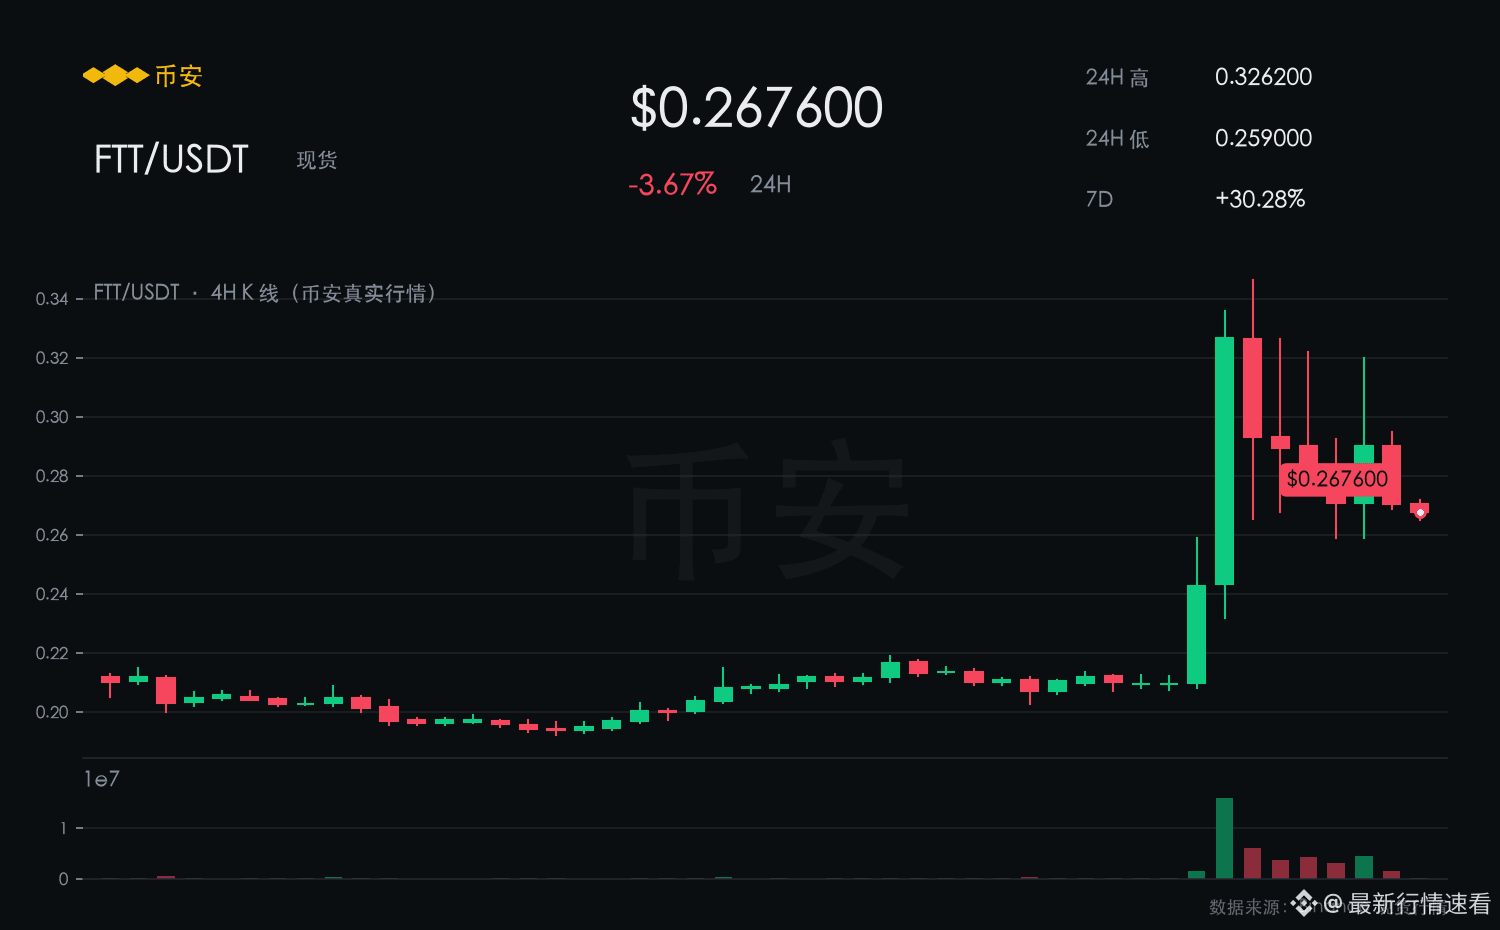
FTT is currently reported at 0.2676; over the past 24 hours it has fallen 3.67%. In the past 7 days it is still up 30.28%. Intraday range: 0.2590–0.3262, with a volatility of 25.9%.
【Market View】
After the 24-hour drop of 3.67%, FTT failed to hold 0.3262, and the near-term focus is still shifting downward.
The price is hovering around 0.2590; once this level is lost, it could trigger a rapid sell-off.
Over the same period, BTC is up 7.28% over 24 hours, while FTT’s 3.67% decline clearly underperforms the broader market—funds are withdrawing.
In the short term, the bias is bearish.
【Reasons for the Bearish View】
Even though over 7 days it still retains a gain of 30.28%, in the past 24 hours it has flipped to a decline of 3.67%, showing signs of a high-and-retrace.
With the price trading around 0.2590, the balance between buyers and sellers is clearly tilted toward the sell side.
The risk is that after an oversold move, a technical rebound could happen at any time; short positions should also set stop-losses.
In terms of strategy: treat 0.3262 as the resistance level for a rebound; 0.2590 is the next observation point.
$FTT #FTT
【See Decline】
FTT is currently reported at 0.2676; over the past 24 hours it has fallen 3.67%. In the past 7 days it is still up 30.28%. Intraday range: 0.2590–0.3262, with a volatility of 25.9%.
【Market View】
After the 24-hour drop of 3.67%, FTT failed to hold 0.3262, and the near-term focus is still shifting downward.
The price is hovering around 0.2590; once this level is lost, it could trigger a rapid sell-off.
Over the same period, BTC is up 7.28% over 24 hours, while FTT’s 3.67% decline clearly underperforms the broader market—funds are withdrawing.
In the short term, the bias is bearish.
【Reasons for the Bearish View】
Even though over 7 days it still retains a gain of 30.28%, in the past 24 hours it has flipped to a decline of 3.67%, showing signs of a high-and-retrace.
With the price trading around 0.2590, the balance between buyers and sellers is clearly tilted toward the sell side.
The risk is that after an oversold move, a technical rebound could happen at any time; short positions should also set stop-losses.
In terms of strategy: treat 0.3262 as the resistance level for a rebound; 0.2590 is the next observation point.
$FTT #FTT
FTT is currently reported at 0.2676; over the past 24 hours it has fallen 3.67%. In the past 7 days it is still up 30.28%. Intraday range: 0.2590–0.3262, with a volatility of 25.9%.
【Market View】
After the 24-hour drop of 3.67%, FTT failed to hold 0.3262, and the near-term focus is still shifting downward.
The price is hovering around 0.2590; once this level is lost, it could trigger a rapid sell-off.
Over the same period, BTC is up 7.28% over 24 hours, while FTT’s 3.67% decline clearly underperforms the broader market—funds are withdrawing.
In the short term, the bias is bearish.
【Reasons for the Bearish View】
Even though over 7 days it still retains a gain of 30.28%, in the past 24 hours it has flipped to a decline of 3.67%, showing signs of a high-and-retrace.
With the price trading around 0.2590, the balance between buyers and sellers is clearly tilted toward the sell side.
The risk is that after an oversold move, a technical rebound could happen at any time; short positions should also set stop-losses.
In terms of strategy: treat 0.3262 as the resistance level for a rebound; 0.2590 is the next observation point.
$FTT #FTT
195
·
--
【See the Drop】
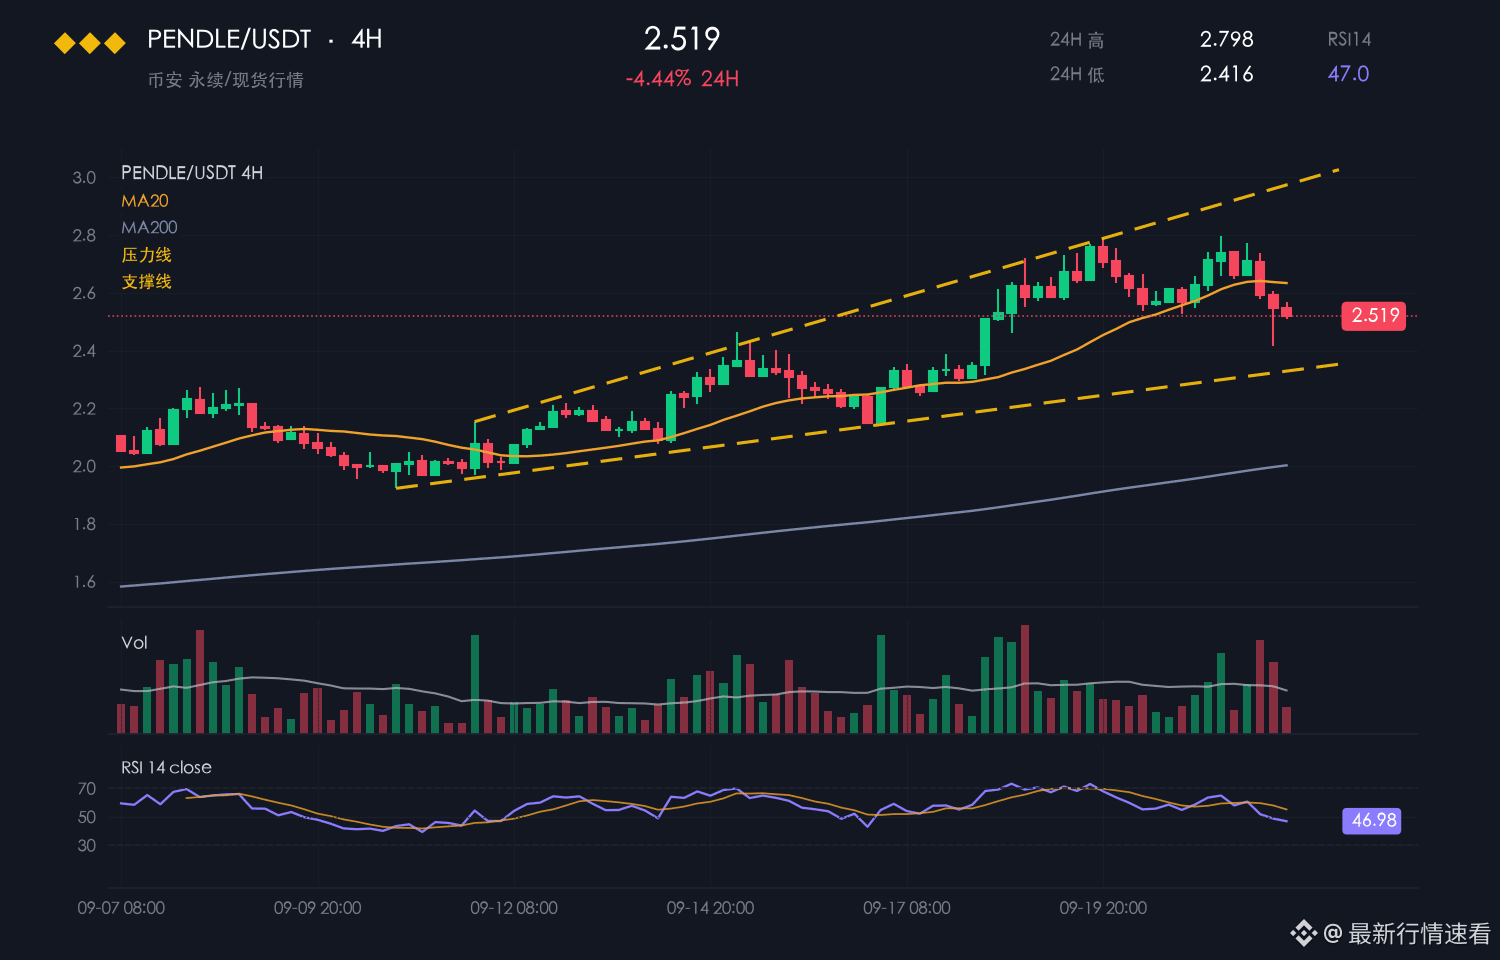
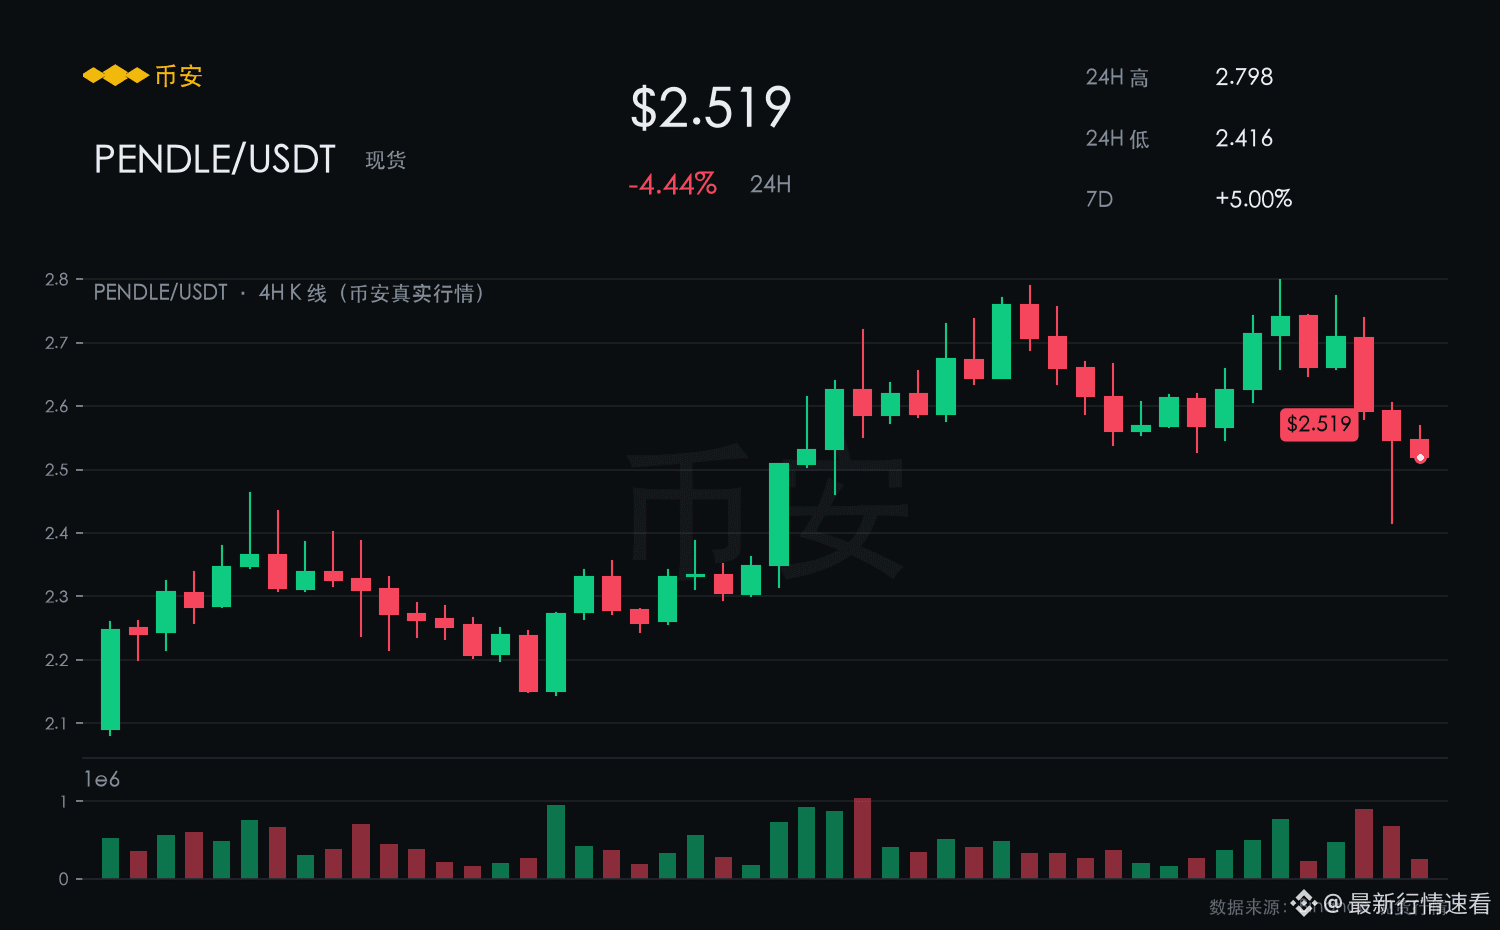
PENDLE is currently quoted at 2.519; over the past 24 hours it is down 4.44%. It is still up 5.00% over 7 days. The intraday range is 2.416–2.798, with a volatility of 15.8%.
【Market View】
After falling 4.44% over the past 24 hours, PENDLE failed to hold 2.798, and the near-term focus is still shifting downward.
Price is trading near 2.416; once this level is broken, selling pressure will accelerate.
Meanwhile, the broader market is up 7.28% over the same period, but PENDLE is down 4.44%, underperforming the market average.
In the short term, it leans bearish.
【Bearish Rationale】
On the 7-day timeframe there is still a gain of 5.00%, but over the last 24 hours it has flipped to a decline of 4.44%, showing signs of a rally that topped out and reversed.
With price hovering around 2.416, the balance between buyers and sellers clearly favors the sell side.
Under a bearish order structure, rebounds are prone to repeated swings—don’t carry overly heavy positions.
If 2.416 breaks, price will likely continue downward in search of support; rebounds toward the 2.798 area face stronger resistance.
$PENDLE #PENDLE
【See the Drop】
PENDLE is currently quoted at 2.519; over the past 24 hours it is down 4.44%. It is still up 5.00% over 7 days. The intraday range is 2.416–2.798, with a volatility of 15.8%.
【Market View】
After falling 4.44% over the past 24 hours, PENDLE failed to hold 2.798, and the near-term focus is still shifting downward.
Price is trading near 2.416; once this level is broken, selling pressure will accelerate.
Meanwhile, the broader market is up 7.28% over the same period, but PENDLE is down 4.44%, underperforming the market average.
In the short term, it leans bearish.
【Bearish Rationale】
On the 7-day timeframe there is still a gain of 5.00%, but over the last 24 hours it has flipped to a decline of 4.44%, showing signs of a rally that topped out and reversed.
With price hovering around 2.416, the balance between buyers and sellers clearly favors the sell side.
Under a bearish order structure, rebounds are prone to repeated swings—don’t carry overly heavy positions.
If 2.416 breaks, price will likely continue downward in search of support; rebounds toward the 2.798 area face stronger resistance.
$PENDLE #PENDLE
PENDLE is currently quoted at 2.519; over the past 24 hours it is down 4.44%. It is still up 5.00% over 7 days. The intraday range is 2.416–2.798, with a volatility of 15.8%.
【Market View】
After falling 4.44% over the past 24 hours, PENDLE failed to hold 2.798, and the near-term focus is still shifting downward.
Price is trading near 2.416; once this level is broken, selling pressure will accelerate.
Meanwhile, the broader market is up 7.28% over the same period, but PENDLE is down 4.44%, underperforming the market average.
In the short term, it leans bearish.
【Bearish Rationale】
On the 7-day timeframe there is still a gain of 5.00%, but over the last 24 hours it has flipped to a decline of 4.44%, showing signs of a rally that topped out and reversed.
With price hovering around 2.416, the balance between buyers and sellers clearly favors the sell side.
Under a bearish order structure, rebounds are prone to repeated swings—don’t carry overly heavy positions.
If 2.416 breaks, price will likely continue downward in search of support; rebounds toward the 2.798 area face stronger resistance.
$PENDLE #PENDLE
5
·
--
【See Drop】
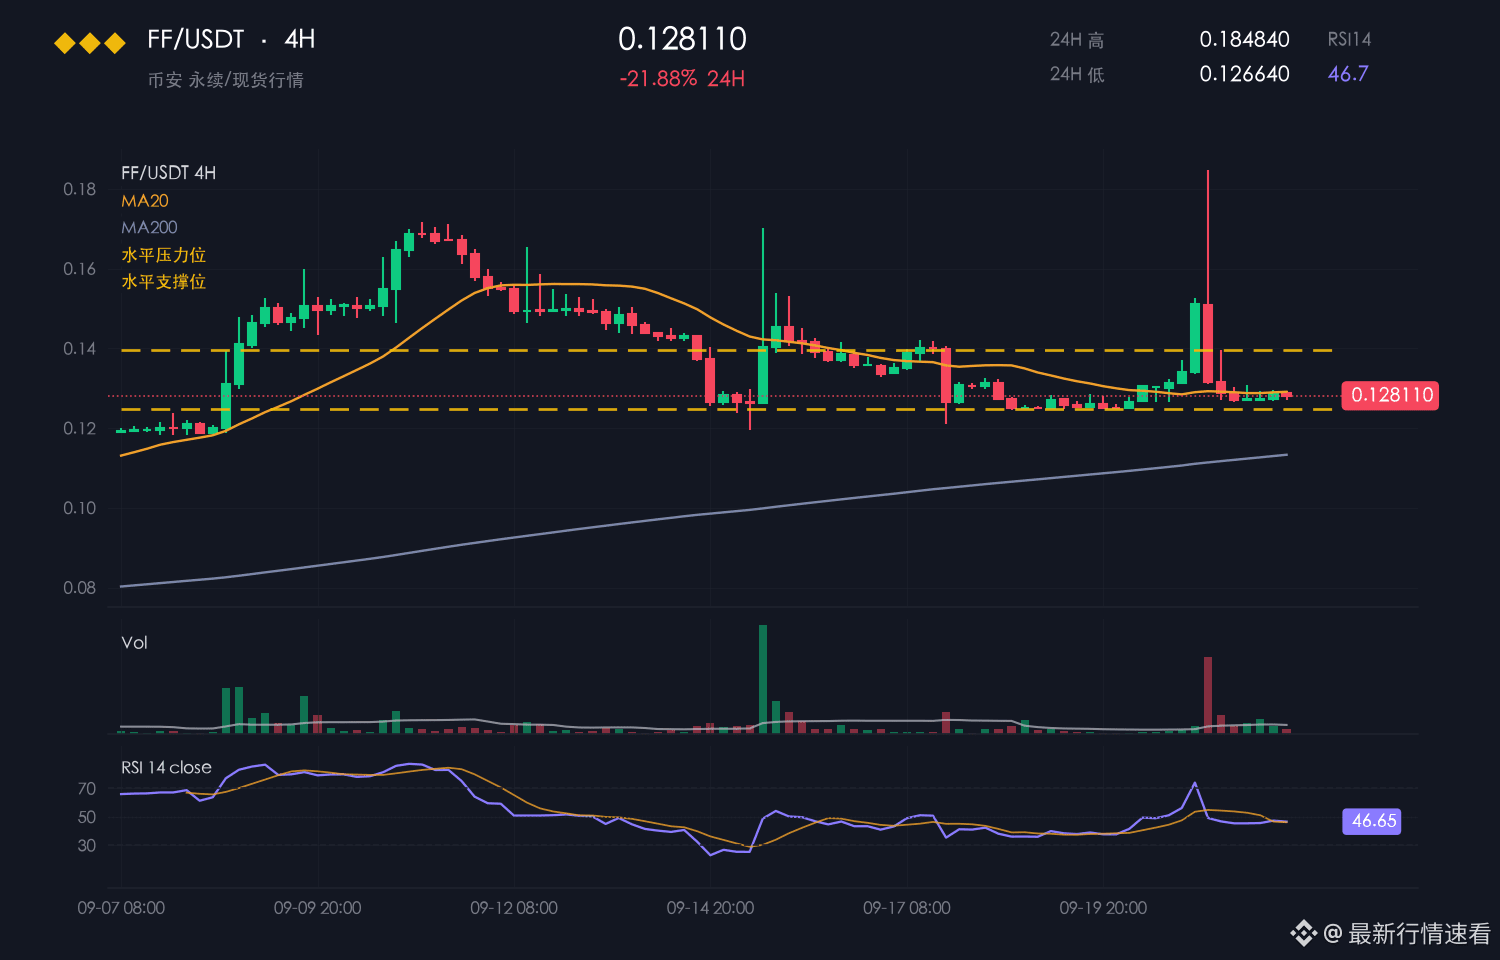
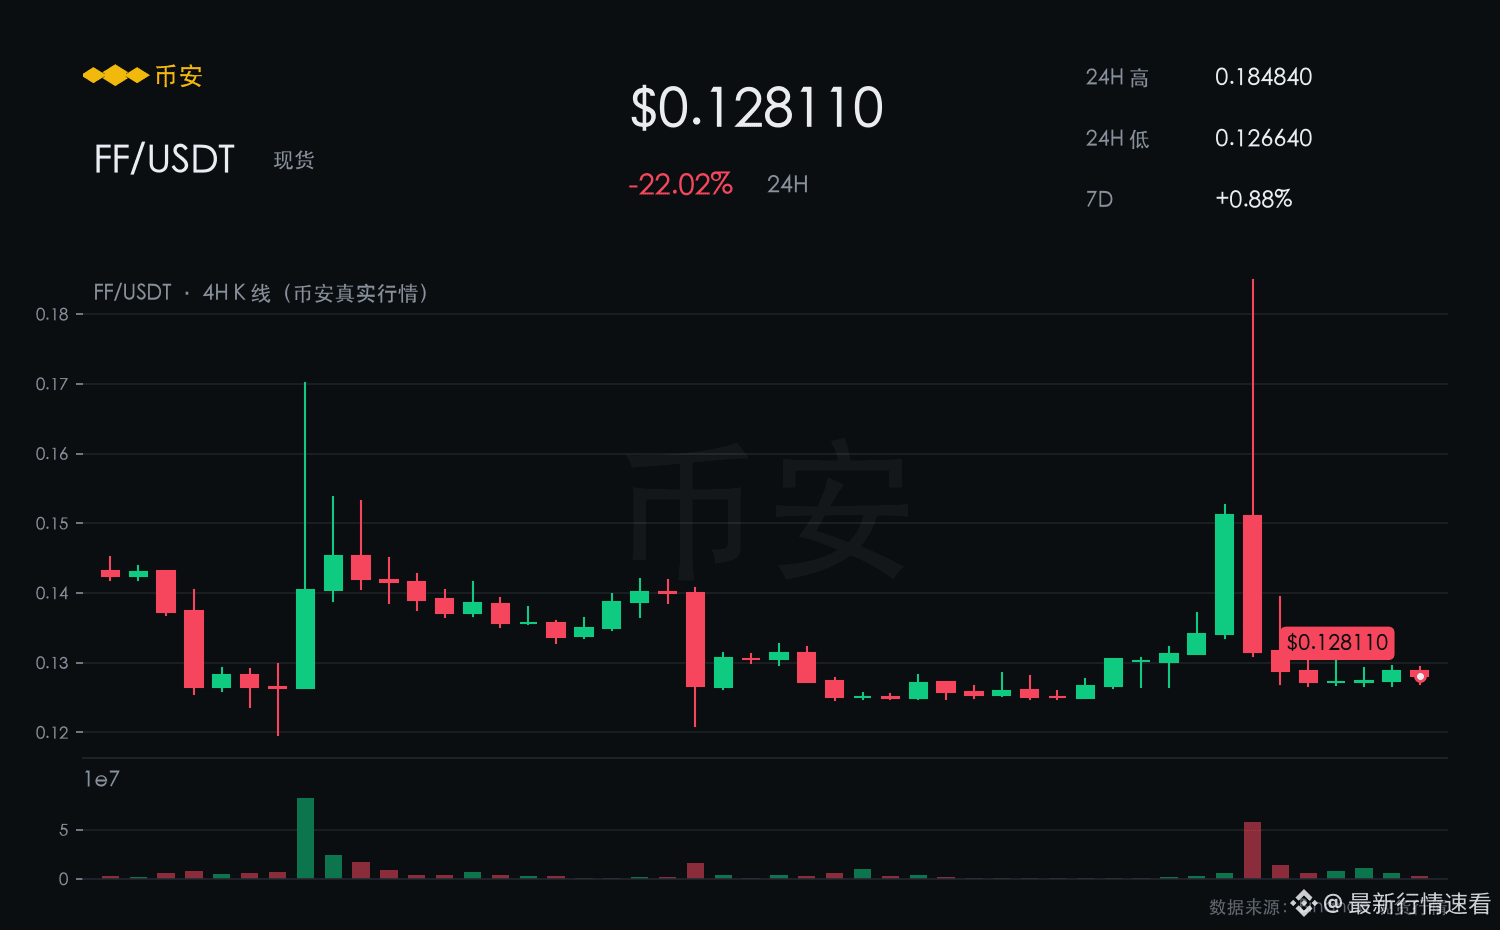
FF currently reports 0.1281, down 21.88% over the past 24 hours, still up 0.88% over the past 7 days. Intraday range: 0.1266–0.1848; amplitude: 46.0%.
【Market View】
FF moved steadily lower within the intraday range of 0.1266–0.1848, and the rebound was clearly on low volume.
Price is trading right around 0.1266; once this level is broken, it will likely accelerate downward.
When you put BTC’s +7.28% next to FF’s performance, FF’s trend looks clearly weaker.
In the short term, the bias is bearish.
【Bearish Rationale】
Over the past 7 days, there is still +0.88%, but in the last 24 hours it has flipped to a -21.88% drop—signs of a peak and reversal are already showing.
The rebound is on shrinking volume, while the sell-off is on rising volume; with this kind of structure, every rally back (an intraday pullback) is likely to be sold into again.
A -21.88% move doesn’t necessarily mean the bottom is in—before catching the falling knife, first check the volume and momentum.
Once 0.1266 breaks, it will likely continue searching for support lower down; rallies toward the 0.1848 area face strong resistance.
$FF #FF
【See Drop】
FF currently reports 0.1281, down 21.88% over the past 24 hours, still up 0.88% over the past 7 days. Intraday range: 0.1266–0.1848; amplitude: 46.0%.
【Market View】
FF moved steadily lower within the intraday range of 0.1266–0.1848, and the rebound was clearly on low volume.
Price is trading right around 0.1266; once this level is broken, it will likely accelerate downward.
When you put BTC’s +7.28% next to FF’s performance, FF’s trend looks clearly weaker.
In the short term, the bias is bearish.
【Bearish Rationale】
Over the past 7 days, there is still +0.88%, but in the last 24 hours it has flipped to a -21.88% drop—signs of a peak and reversal are already showing.
The rebound is on shrinking volume, while the sell-off is on rising volume; with this kind of structure, every rally back (an intraday pullback) is likely to be sold into again.
A -21.88% move doesn’t necessarily mean the bottom is in—before catching the falling knife, first check the volume and momentum.
Once 0.1266 breaks, it will likely continue searching for support lower down; rallies toward the 0.1848 area face strong resistance.
$FF #FF
FF currently reports 0.1281, down 21.88% over the past 24 hours, still up 0.88% over the past 7 days. Intraday range: 0.1266–0.1848; amplitude: 46.0%.
【Market View】
FF moved steadily lower within the intraday range of 0.1266–0.1848, and the rebound was clearly on low volume.
Price is trading right around 0.1266; once this level is broken, it will likely accelerate downward.
When you put BTC’s +7.28% next to FF’s performance, FF’s trend looks clearly weaker.
In the short term, the bias is bearish.
【Bearish Rationale】
Over the past 7 days, there is still +0.88%, but in the last 24 hours it has flipped to a -21.88% drop—signs of a peak and reversal are already showing.
The rebound is on shrinking volume, while the sell-off is on rising volume; with this kind of structure, every rally back (an intraday pullback) is likely to be sold into again.
A -21.88% move doesn’t necessarily mean the bottom is in—before catching the falling knife, first check the volume and momentum.
Once 0.1266 breaks, it will likely continue searching for support lower down; rallies toward the 0.1848 area face strong resistance.
$FF #FF
7
·
--
【See Rise】
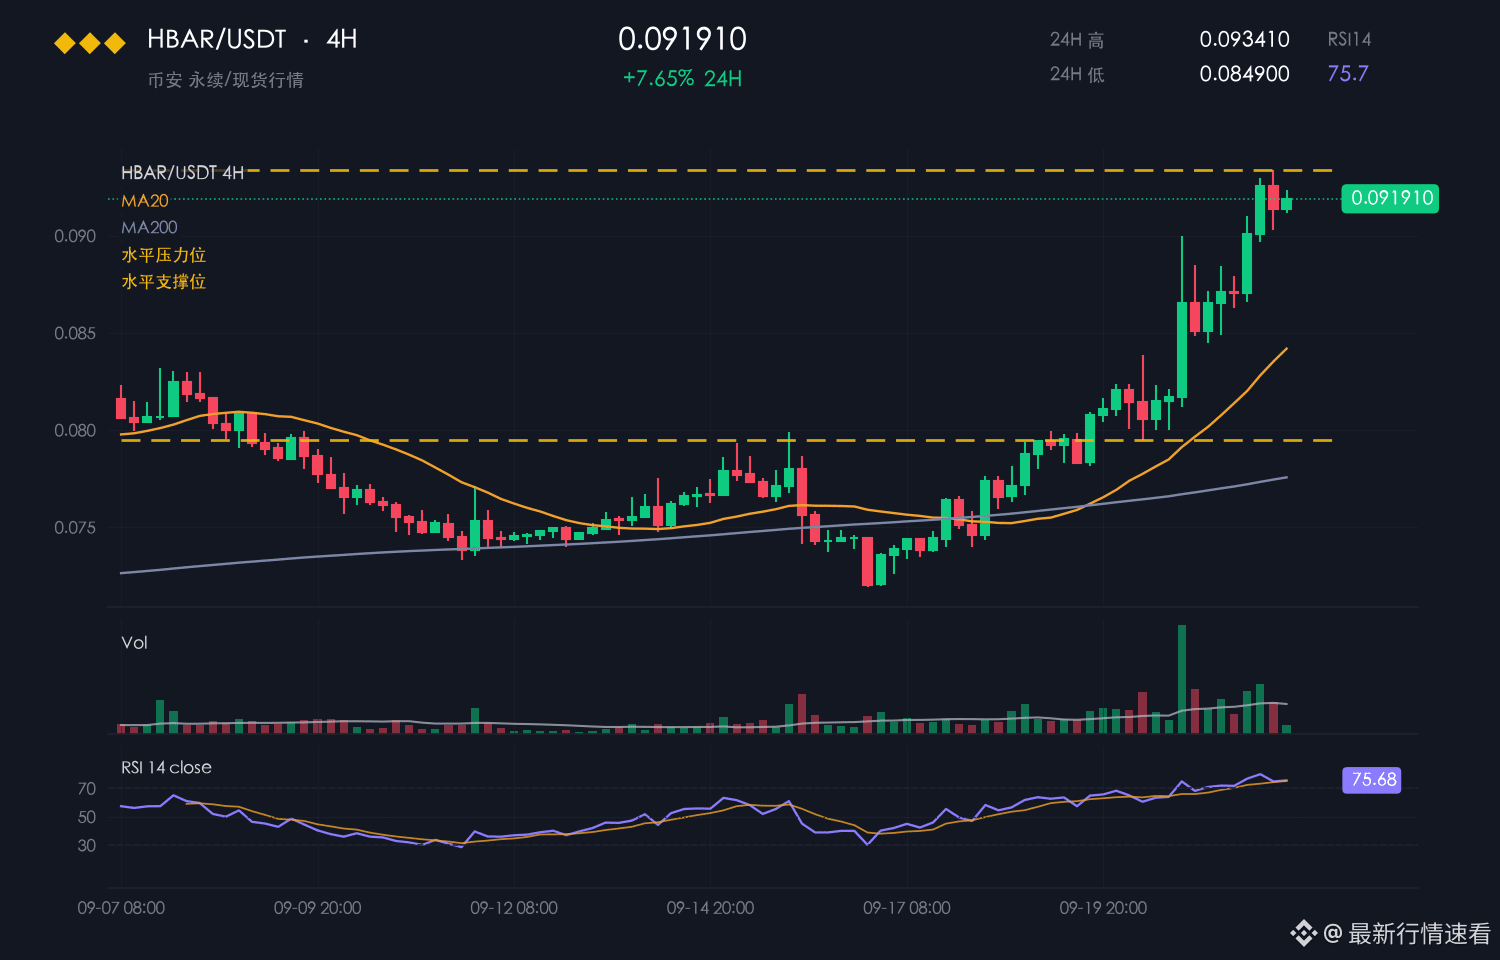
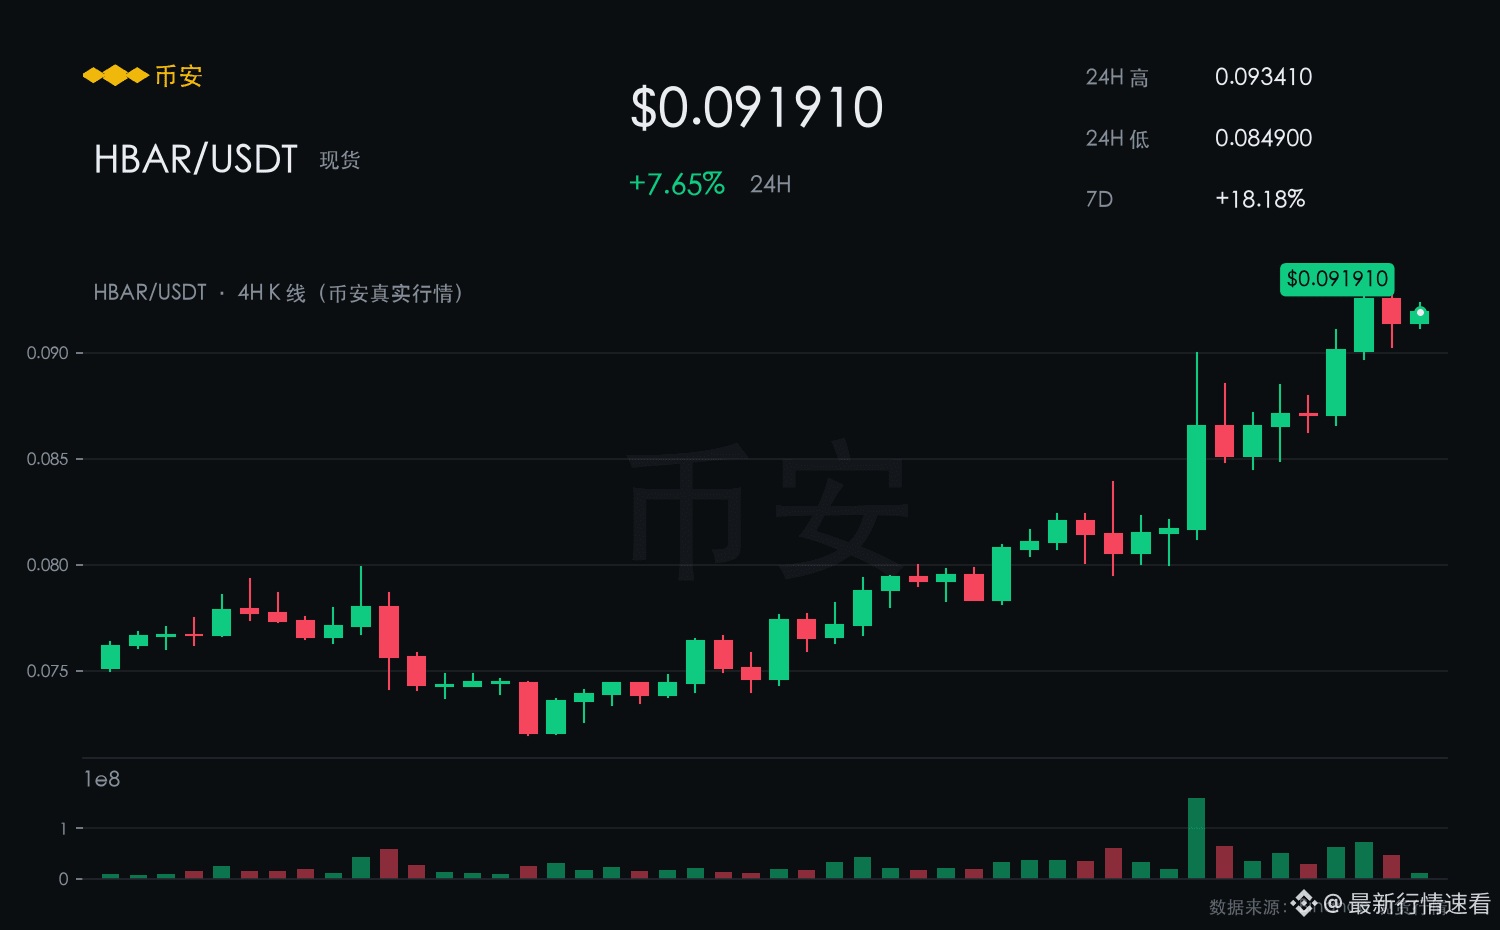
HBAR is currently quoted at 0.0919, up 7.65% over the past 24 hours and 18.18% over the past 7 days. The intraday range is 0.0849–0.0934, with a volatility of 10.0%.
【Market View】
The weight/center of the recent few 4-hour K-lines has been steadily rising, and there are fairly clear signs of bullish control.
The level of 0.0849 has been tested and failed to break through multiple times, and pullbacks have been met with strong support.
Meanwhile, the broader market is up only +7.28%; HBAR’s +7.65% is relatively better—an excess return.
In the short term, it is biased bullish.
【Bullish Reasons】
A 7.65% gain over 24 hours, together with an 18.18% gain over 7 days, shows continuity rather than a one-day spike.
Within the 24-hour +7.65% rally, the intraday high at 0.0934 has been tested repeatedly, indicating that overhead resistance is being digested.
The fact that it’s rising quickly also implies withdrawals/pullbacks are likely to be quicker—so leaving some room in position sizing feels more comfortable than going all-in.
For execution: use 0.0849 as the stop-loss level, and look for upside toward a breakout above 0.0934.
$HBAR #HBAR
【See Rise】
HBAR is currently quoted at 0.0919, up 7.65% over the past 24 hours and 18.18% over the past 7 days. The intraday range is 0.0849–0.0934, with a volatility of 10.0%.
【Market View】
The weight/center of the recent few 4-hour K-lines has been steadily rising, and there are fairly clear signs of bullish control.
The level of 0.0849 has been tested and failed to break through multiple times, and pullbacks have been met with strong support.
Meanwhile, the broader market is up only +7.28%; HBAR’s +7.65% is relatively better—an excess return.
In the short term, it is biased bullish.
【Bullish Reasons】
A 7.65% gain over 24 hours, together with an 18.18% gain over 7 days, shows continuity rather than a one-day spike.
Within the 24-hour +7.65% rally, the intraday high at 0.0934 has been tested repeatedly, indicating that overhead resistance is being digested.
The fact that it’s rising quickly also implies withdrawals/pullbacks are likely to be quicker—so leaving some room in position sizing feels more comfortable than going all-in.
For execution: use 0.0849 as the stop-loss level, and look for upside toward a breakout above 0.0934.
$HBAR #HBAR
HBAR is currently quoted at 0.0919, up 7.65% over the past 24 hours and 18.18% over the past 7 days. The intraday range is 0.0849–0.0934, with a volatility of 10.0%.
【Market View】
The weight/center of the recent few 4-hour K-lines has been steadily rising, and there are fairly clear signs of bullish control.
The level of 0.0849 has been tested and failed to break through multiple times, and pullbacks have been met with strong support.
Meanwhile, the broader market is up only +7.28%; HBAR’s +7.65% is relatively better—an excess return.
In the short term, it is biased bullish.
【Bullish Reasons】
A 7.65% gain over 24 hours, together with an 18.18% gain over 7 days, shows continuity rather than a one-day spike.
Within the 24-hour +7.65% rally, the intraday high at 0.0934 has been tested repeatedly, indicating that overhead resistance is being digested.
The fact that it’s rising quickly also implies withdrawals/pullbacks are likely to be quicker—so leaving some room in position sizing feels more comfortable than going all-in.
For execution: use 0.0849 as the stop-loss level, and look for upside toward a breakout above 0.0934.
$HBAR #HBAR
2
·
--
【See Rise】
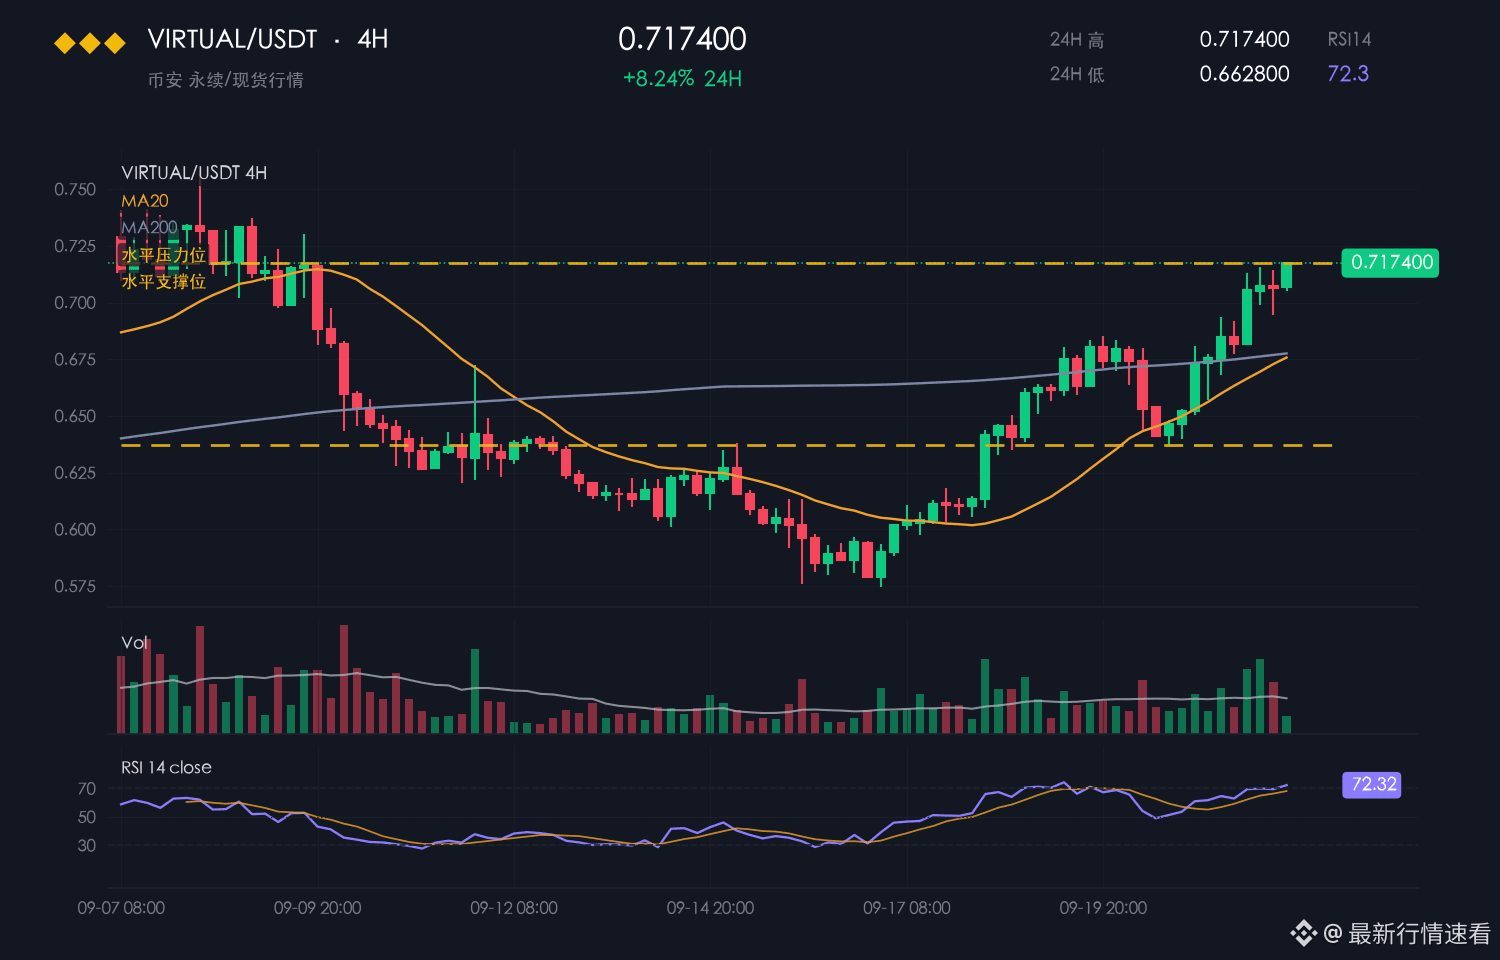
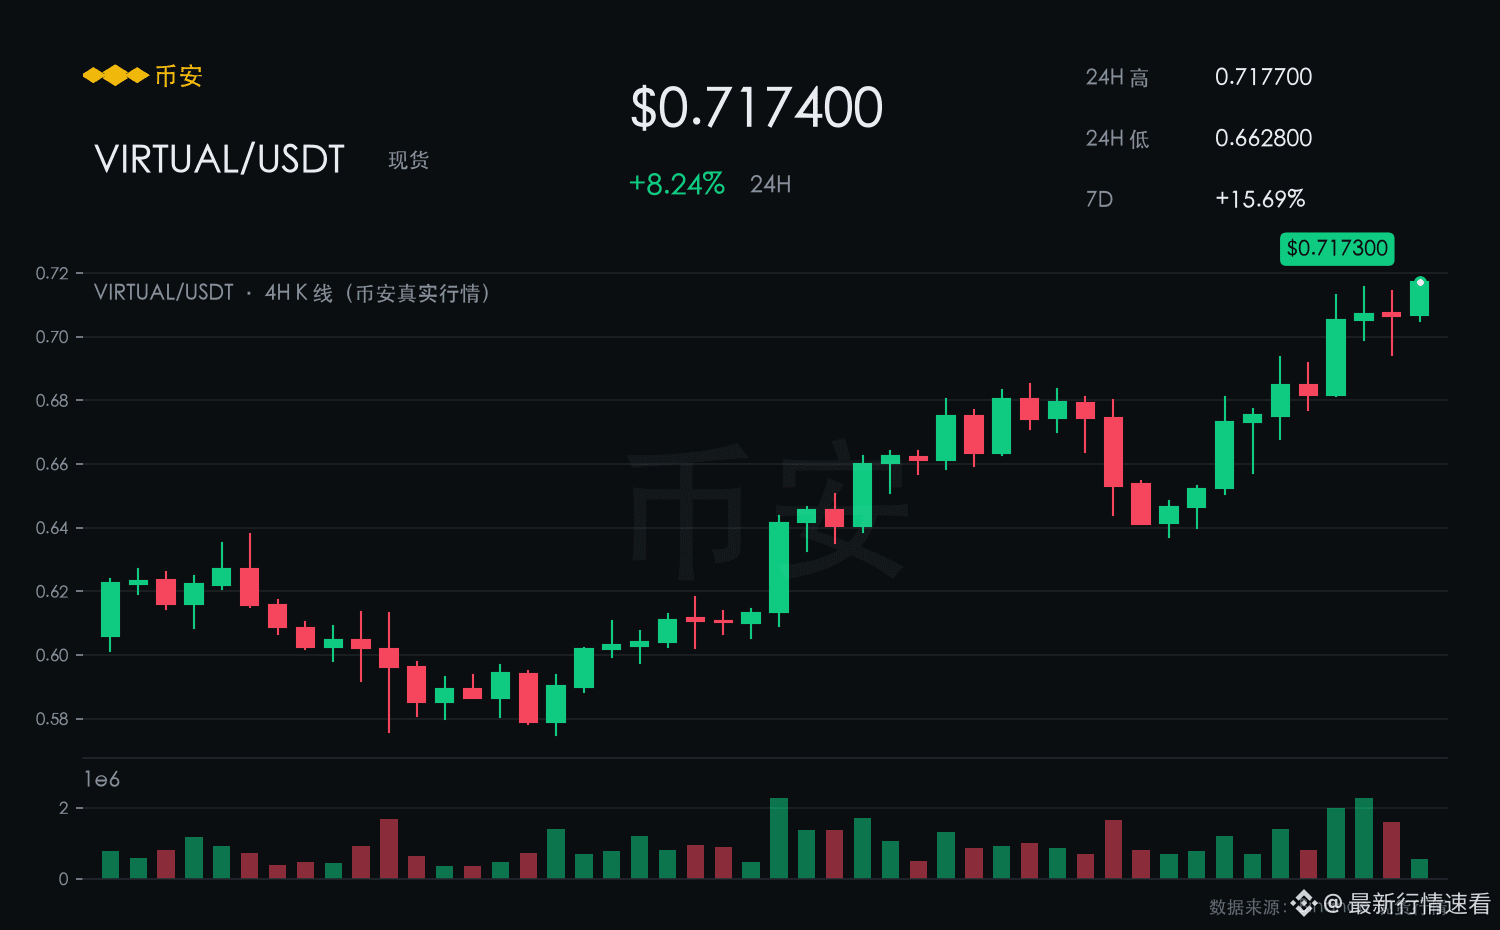
VIRTUAL is currently quoted at 0.7169, up 8.16% over the past 24 hours. The 7-day increase is 15.61%. The intraday range is 0.6628–0.7172, with a volatility of 8.2%.
【Market View】
VIRTUAL’s price action is clearly decoupled from the broader market and is moving to its own rhythm.
As long as 0.6628 is held, the current pullback can be considered a strong consolidation.
Compared with BTC’s +7.28%, VIRTUAL’s relative strength is leading. Assets like this are usually rebound pioneers.
Near term, the bias is bullish.
【Bullish Rationale】
Pushed from 0.6628 to around 0.7169, the short-term focus is still trending upward.
The structure above 0.6628 hasn’t broken down. 0.7172 is the next resistance level to break through.
The risk is that after the short-term surge, profit-taking could appear at any time—chasing higher may get you poked by a wick.
Short-term resistance is at 0.7172; break it on higher volume and you’ll likely catch the follow-through. 0.6628 is the long-side defense level for this move.
$VIRTUAL #VIRTUAL
【See Rise】
VIRTUAL is currently quoted at 0.7169, up 8.16% over the past 24 hours. The 7-day increase is 15.61%. The intraday range is 0.6628–0.7172, with a volatility of 8.2%.
【Market View】
VIRTUAL’s price action is clearly decoupled from the broader market and is moving to its own rhythm.
As long as 0.6628 is held, the current pullback can be considered a strong consolidation.
Compared with BTC’s +7.28%, VIRTUAL’s relative strength is leading. Assets like this are usually rebound pioneers.
Near term, the bias is bullish.
【Bullish Rationale】
Pushed from 0.6628 to around 0.7169, the short-term focus is still trending upward.
The structure above 0.6628 hasn’t broken down. 0.7172 is the next resistance level to break through.
The risk is that after the short-term surge, profit-taking could appear at any time—chasing higher may get you poked by a wick.
Short-term resistance is at 0.7172; break it on higher volume and you’ll likely catch the follow-through. 0.6628 is the long-side defense level for this move.
$VIRTUAL #VIRTUAL
VIRTUAL is currently quoted at 0.7169, up 8.16% over the past 24 hours. The 7-day increase is 15.61%. The intraday range is 0.6628–0.7172, with a volatility of 8.2%.
【Market View】
VIRTUAL’s price action is clearly decoupled from the broader market and is moving to its own rhythm.
As long as 0.6628 is held, the current pullback can be considered a strong consolidation.
Compared with BTC’s +7.28%, VIRTUAL’s relative strength is leading. Assets like this are usually rebound pioneers.
Near term, the bias is bullish.
【Bullish Rationale】
Pushed from 0.6628 to around 0.7169, the short-term focus is still trending upward.
The structure above 0.6628 hasn’t broken down. 0.7172 is the next resistance level to break through.
The risk is that after the short-term surge, profit-taking could appear at any time—chasing higher may get you poked by a wick.
Short-term resistance is at 0.7172; break it on higher volume and you’ll likely catch the follow-through. 0.6628 is the long-side defense level for this move.
$VIRTUAL #VIRTUAL
136
·
--
【See Rise】
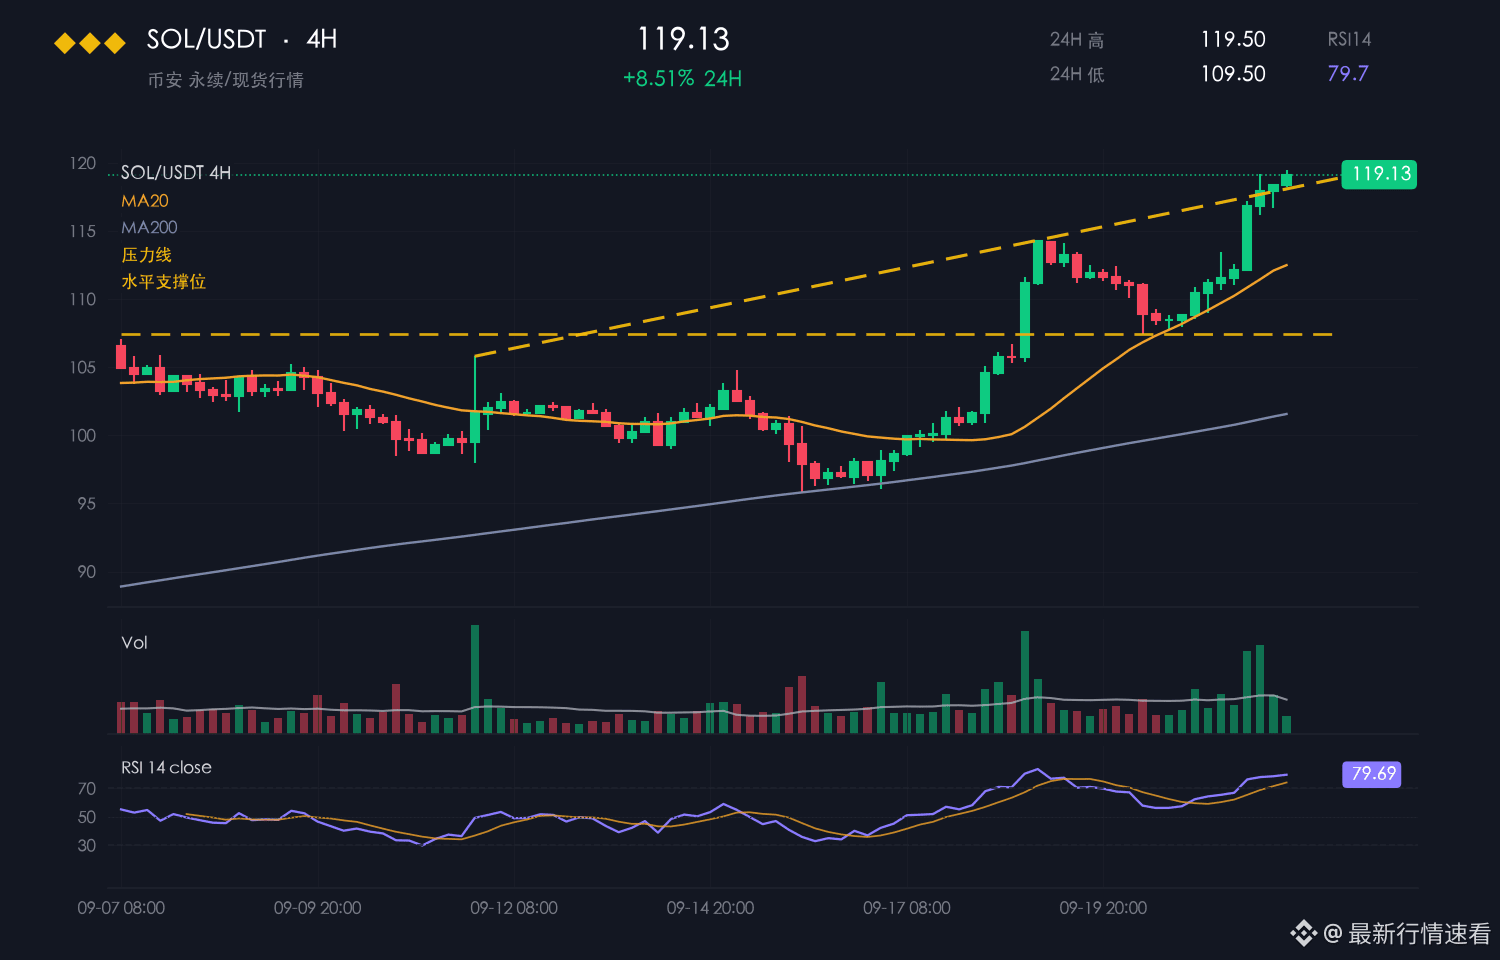
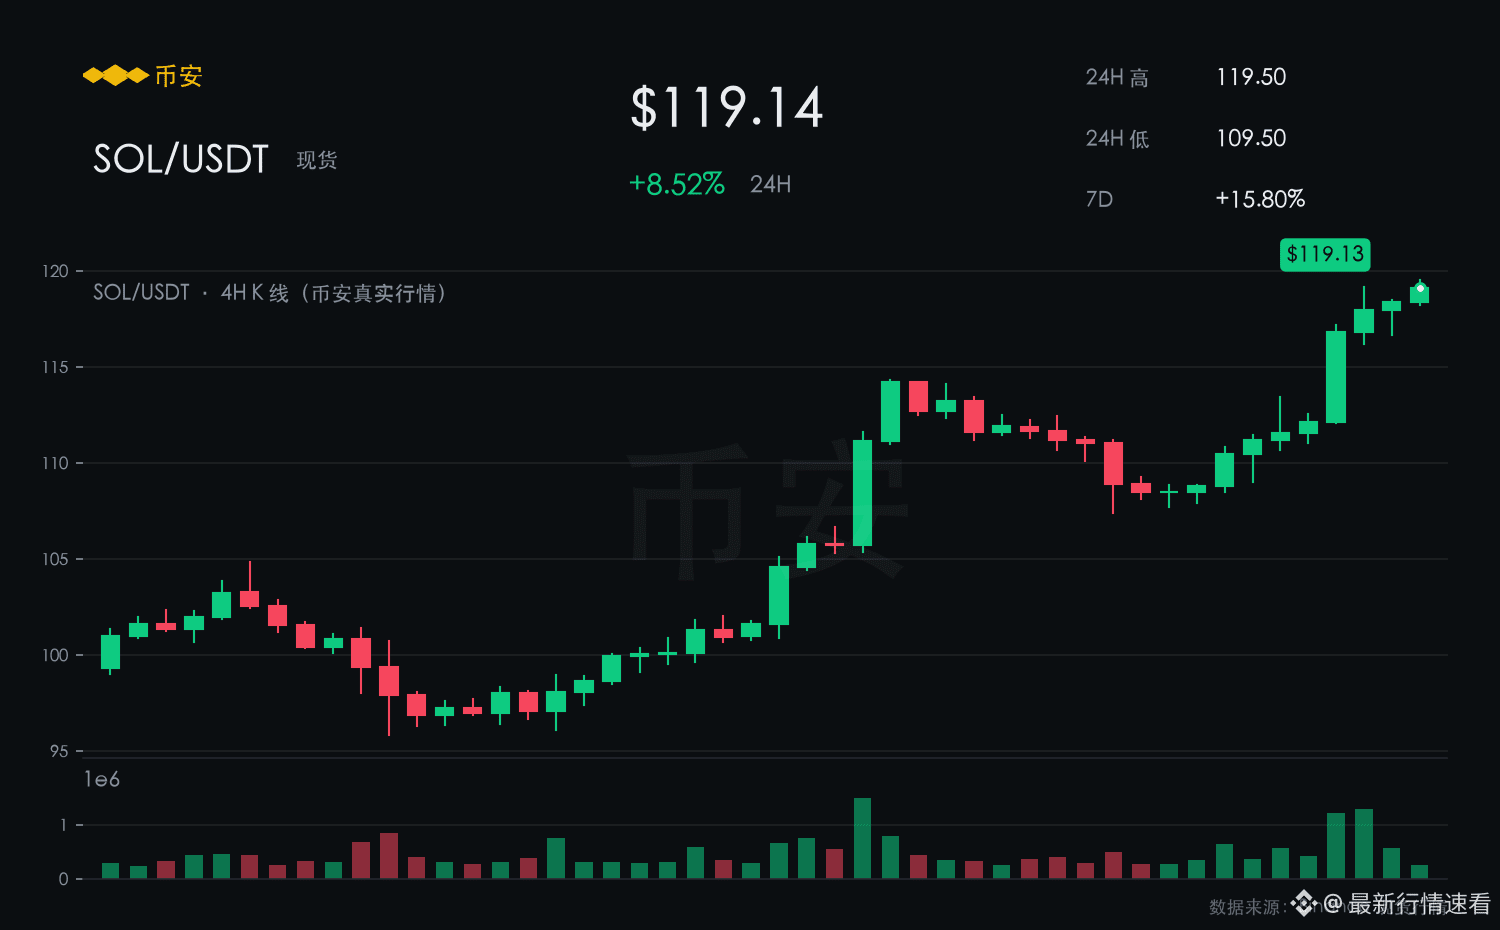
SOL is currently quoted at 119.15, up 8.53% over the past 24 hours. The 7-day increase is 15.81%. The intraday range is 109.50–119.50, with a volatility of 9.1%.
【Market View】
SOL’s price action is clearly decoupled from the broader market, moving to its own rhythm.
The 109.50 area is the breakout point for this round of gains, and pullbacks to this level offer a decent risk-reward.
In the same period, BTC is up 7.28% over 24 hours, while SOL’s 8.53% clearly outperforms the overall market—showing stronger capital preference.
In the short term, the bias is bullish.
【Bullish Reasons】
A single-day gain of 8.53% is right here, and in the short run, the bulls are on the better side.
The structure above 109.50 has not broken down. 119.50 is the next resistance level to chew through.
The short-term rally is a bit fast, so the risk of price “spikes” can’t be ignored. Waiting for a pullback and then confirmation before acting is steadier.
If it holds above 109.50, the next target is 119.50; a breakdown below 109.50 means the structure has deteriorated.
$SOL #SOL
【See Rise】
SOL is currently quoted at 119.15, up 8.53% over the past 24 hours. The 7-day increase is 15.81%. The intraday range is 109.50–119.50, with a volatility of 9.1%.
【Market View】
SOL’s price action is clearly decoupled from the broader market, moving to its own rhythm.
The 109.50 area is the breakout point for this round of gains, and pullbacks to this level offer a decent risk-reward.
In the same period, BTC is up 7.28% over 24 hours, while SOL’s 8.53% clearly outperforms the overall market—showing stronger capital preference.
In the short term, the bias is bullish.
【Bullish Reasons】
A single-day gain of 8.53% is right here, and in the short run, the bulls are on the better side.
The structure above 109.50 has not broken down. 119.50 is the next resistance level to chew through.
The short-term rally is a bit fast, so the risk of price “spikes” can’t be ignored. Waiting for a pullback and then confirmation before acting is steadier.
If it holds above 109.50, the next target is 119.50; a breakdown below 109.50 means the structure has deteriorated.
$SOL #SOL
SOL is currently quoted at 119.15, up 8.53% over the past 24 hours. The 7-day increase is 15.81%. The intraday range is 109.50–119.50, with a volatility of 9.1%.
【Market View】
SOL’s price action is clearly decoupled from the broader market, moving to its own rhythm.
The 109.50 area is the breakout point for this round of gains, and pullbacks to this level offer a decent risk-reward.
In the same period, BTC is up 7.28% over 24 hours, while SOL’s 8.53% clearly outperforms the overall market—showing stronger capital preference.
In the short term, the bias is bullish.
【Bullish Reasons】
A single-day gain of 8.53% is right here, and in the short run, the bulls are on the better side.
The structure above 109.50 has not broken down. 119.50 is the next resistance level to chew through.
The short-term rally is a bit fast, so the risk of price “spikes” can’t be ignored. Waiting for a pullback and then confirmation before acting is steadier.
If it holds above 109.50, the next target is 119.50; a breakdown below 109.50 means the structure has deteriorated.
$SOL #SOL
158
·
--
【See Gains】
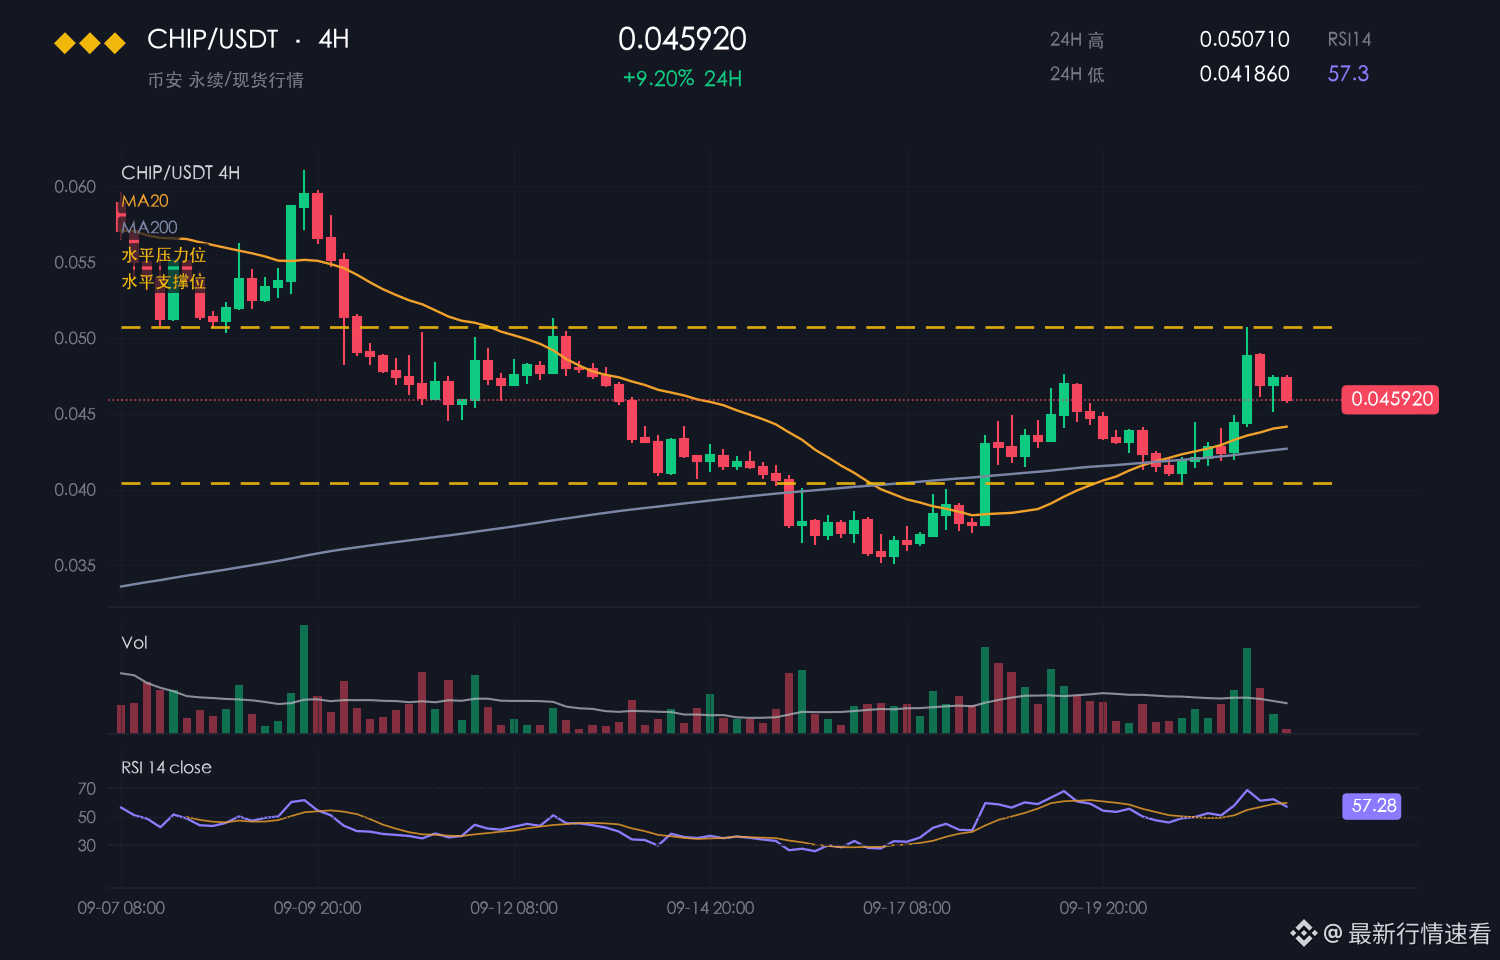
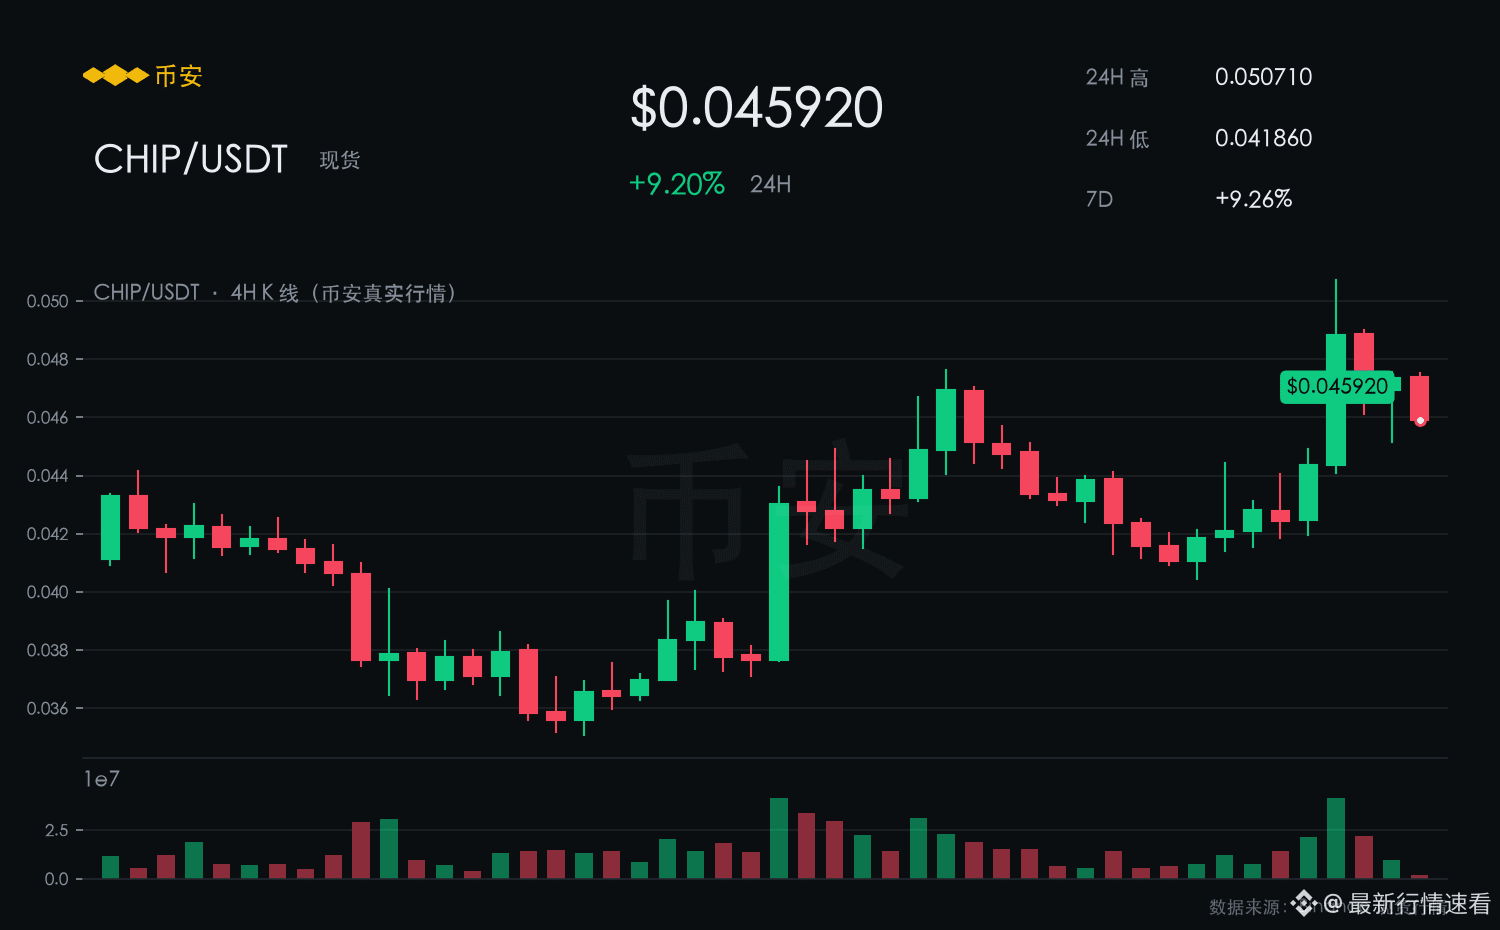
CHIP is currently reported at 0.0459; it’s up 9.20% over the past 24 hours and 9.26% over 7 days. The intraday range is 0.0419–0.0507, with a volatility of 21.1%.
【Market Snapshot】
In a market where it’s more common to fall but not rise, CHIP goes the opposite way—turning green over 24 hours is the attitude.
After the price moved away from 0.0419, it hasn’t broken down, and the overall room for pullbacks remains controllable.
Over the same period, BTC is up 7.28% in 24 hours, while CHIP’s 9.20% clearly outperforms the broader market—indicating a stronger preference for capital.
In the short term, the bias is bullish.
【Bullish Rationale】
A 9.20% gain over 24 hours, paired with the 0.0419–0.0507 volatility band, shows that right now the side that is initiating longs is in control.
The 0.0507 level has been tested repeatedly, and the bulls have not shown any intention to back off—for now.
Fast rallies also mean faster pullbacks, so leaving a bit of buffer in position sizing feels better than going all-in.
For resistance, first look for the intraday high at 0.0507. After a confirmed breakout, new room opens up; if 0.0419 is lost, then it shifts to a wait-and-see stance.
$CHIP #CHIP
【See Gains】
CHIP is currently reported at 0.0459; it’s up 9.20% over the past 24 hours and 9.26% over 7 days. The intraday range is 0.0419–0.0507, with a volatility of 21.1%.
【Market Snapshot】
In a market where it’s more common to fall but not rise, CHIP goes the opposite way—turning green over 24 hours is the attitude.
After the price moved away from 0.0419, it hasn’t broken down, and the overall room for pullbacks remains controllable.
Over the same period, BTC is up 7.28% in 24 hours, while CHIP’s 9.20% clearly outperforms the broader market—indicating a stronger preference for capital.
In the short term, the bias is bullish.
【Bullish Rationale】
A 9.20% gain over 24 hours, paired with the 0.0419–0.0507 volatility band, shows that right now the side that is initiating longs is in control.
The 0.0507 level has been tested repeatedly, and the bulls have not shown any intention to back off—for now.
Fast rallies also mean faster pullbacks, so leaving a bit of buffer in position sizing feels better than going all-in.
For resistance, first look for the intraday high at 0.0507. After a confirmed breakout, new room opens up; if 0.0419 is lost, then it shifts to a wait-and-see stance.
$CHIP #CHIP
CHIP is currently reported at 0.0459; it’s up 9.20% over the past 24 hours and 9.26% over 7 days. The intraday range is 0.0419–0.0507, with a volatility of 21.1%.
【Market Snapshot】
In a market where it’s more common to fall but not rise, CHIP goes the opposite way—turning green over 24 hours is the attitude.
After the price moved away from 0.0419, it hasn’t broken down, and the overall room for pullbacks remains controllable.
Over the same period, BTC is up 7.28% in 24 hours, while CHIP’s 9.20% clearly outperforms the broader market—indicating a stronger preference for capital.
In the short term, the bias is bullish.
【Bullish Rationale】
A 9.20% gain over 24 hours, paired with the 0.0419–0.0507 volatility band, shows that right now the side that is initiating longs is in control.
The 0.0507 level has been tested repeatedly, and the bulls have not shown any intention to back off—for now.
Fast rallies also mean faster pullbacks, so leaving a bit of buffer in position sizing feels better than going all-in.
For resistance, first look for the intraday high at 0.0507. After a confirmed breakout, new room opens up; if 0.0419 is lost, then it shifts to a wait-and-see stance.
$CHIP #CHIP
8
·
--
【See Increase】
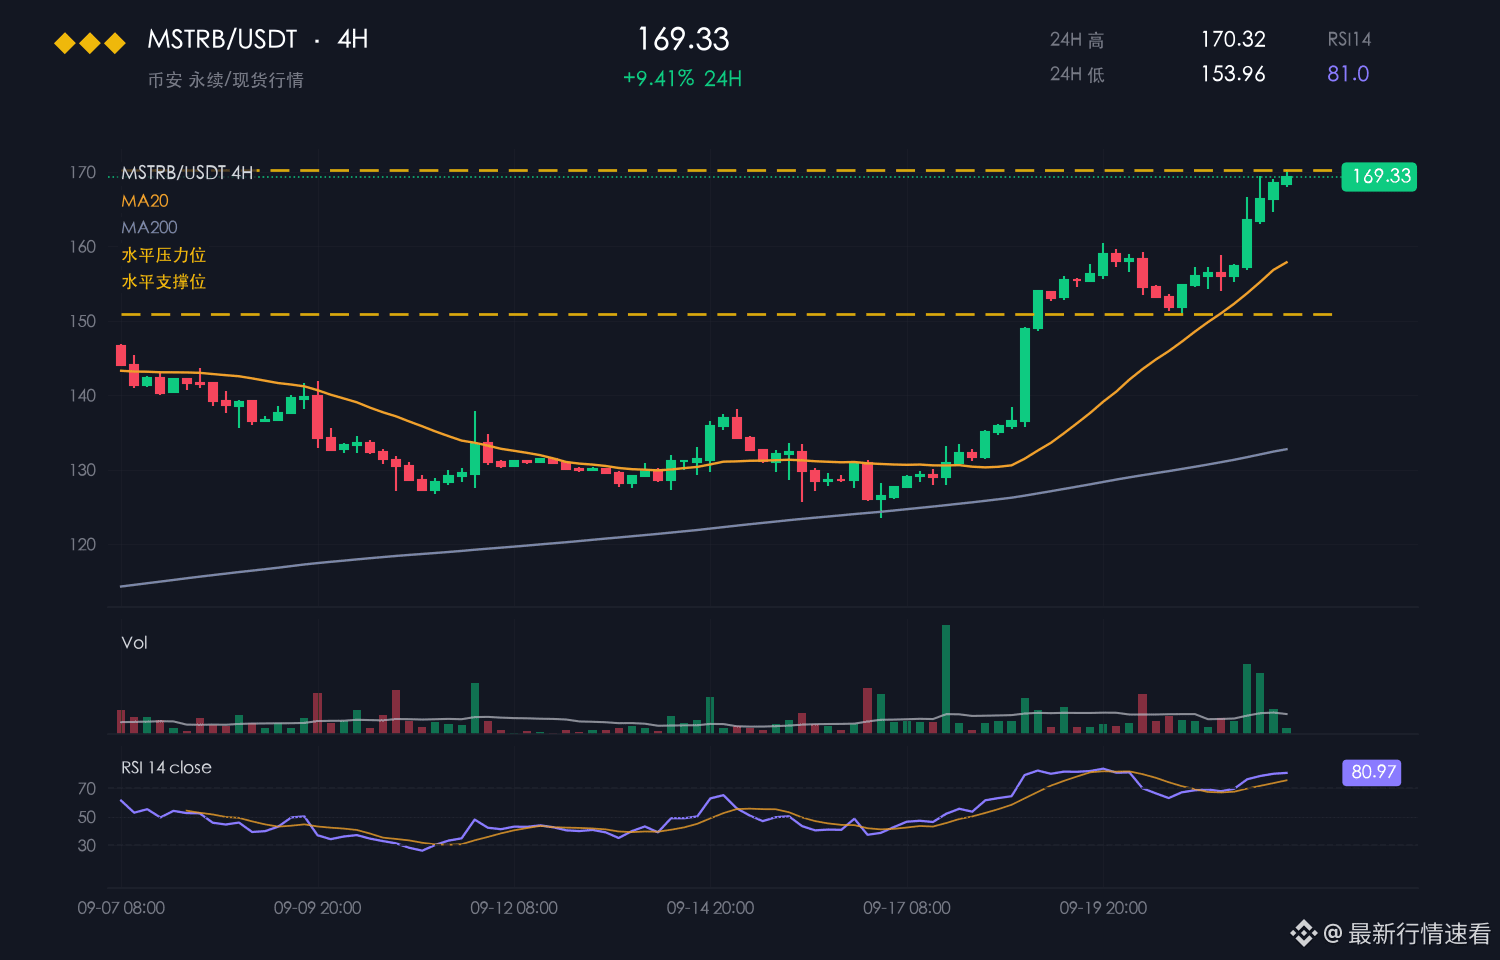
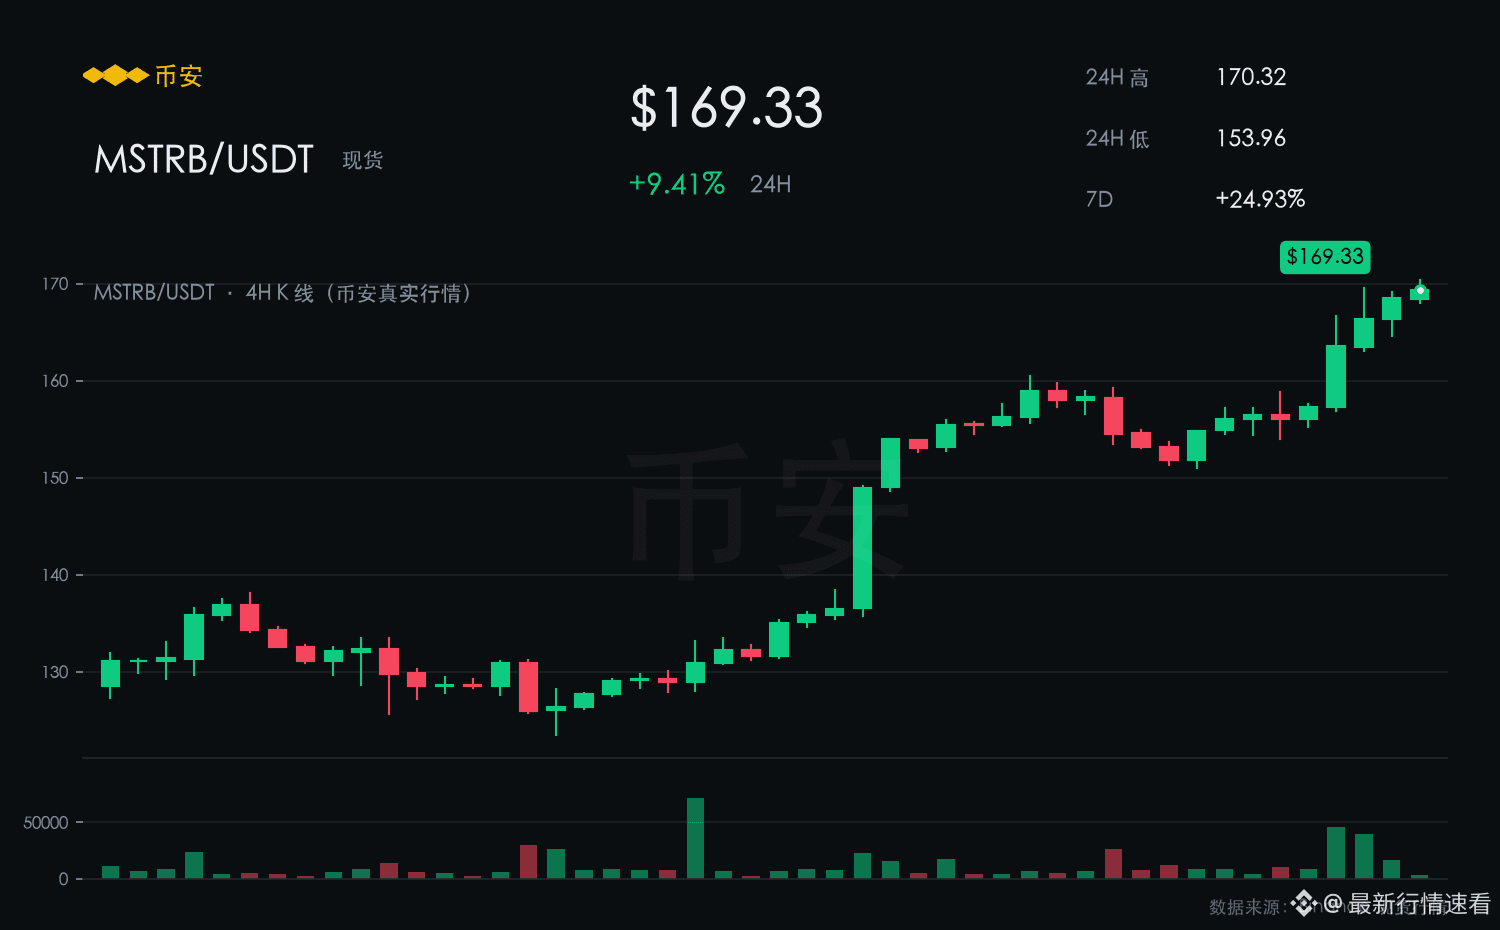
MSTRB is currently 169.33, up 9.41% over the past 24 hours, with a 7-day gain of 24.93%. Its intraday range is 153.96–170.32, with a volatility of 10.6%.
【Market View】
Over the last 24 hours, red candles have held near 169.33, and short-term buy pressure has been relatively proactive.
At the 153.96 level, it has been tested multiple times without breaking; pullbacks have been met with strong support.
Compared with BTC’s +7.28%, MSTRB’s relative strength is stronger—these kinds of assets are typically rebound pioneers.
In the short term, the bias is bullish.
【Reasons to Be Bullish】
With a single-day gain of 9.41% right here, short-term bulls have the upper hand.
Within the 24-hour +9.41% rise, the intraday high at 170.32 has been tested repeatedly, indicating that resistance above is being digested.
Be mindful that if the broader market turns and pulls back, high-position lots in MSTRB could loosen at any time.
For a rebound, first target the intraday high at 170.32—after a valid breakout, new upside space may open. If 153.96 is lost, it turns into a wait-and-see situation.
$MSTRB #MSTRB
【See Increase】
MSTRB is currently 169.33, up 9.41% over the past 24 hours, with a 7-day gain of 24.93%. Its intraday range is 153.96–170.32, with a volatility of 10.6%.
【Market View】
Over the last 24 hours, red candles have held near 169.33, and short-term buy pressure has been relatively proactive.
At the 153.96 level, it has been tested multiple times without breaking; pullbacks have been met with strong support.
Compared with BTC’s +7.28%, MSTRB’s relative strength is stronger—these kinds of assets are typically rebound pioneers.
In the short term, the bias is bullish.
【Reasons to Be Bullish】
With a single-day gain of 9.41% right here, short-term bulls have the upper hand.
Within the 24-hour +9.41% rise, the intraday high at 170.32 has been tested repeatedly, indicating that resistance above is being digested.
Be mindful that if the broader market turns and pulls back, high-position lots in MSTRB could loosen at any time.
For a rebound, first target the intraday high at 170.32—after a valid breakout, new upside space may open. If 153.96 is lost, it turns into a wait-and-see situation.
$MSTRB #MSTRB
MSTRB is currently 169.33, up 9.41% over the past 24 hours, with a 7-day gain of 24.93%. Its intraday range is 153.96–170.32, with a volatility of 10.6%.
【Market View】
Over the last 24 hours, red candles have held near 169.33, and short-term buy pressure has been relatively proactive.
At the 153.96 level, it has been tested multiple times without breaking; pullbacks have been met with strong support.
Compared with BTC’s +7.28%, MSTRB’s relative strength is stronger—these kinds of assets are typically rebound pioneers.
In the short term, the bias is bullish.
【Reasons to Be Bullish】
With a single-day gain of 9.41% right here, short-term bulls have the upper hand.
Within the 24-hour +9.41% rise, the intraday high at 170.32 has been tested repeatedly, indicating that resistance above is being digested.
Be mindful that if the broader market turns and pulls back, high-position lots in MSTRB could loosen at any time.
For a rebound, first target the intraday high at 170.32—after a valid breakout, new upside space may open. If 153.96 is lost, it turns into a wait-and-see situation.
$MSTRB #MSTRB
2
·
--
【See Rise】
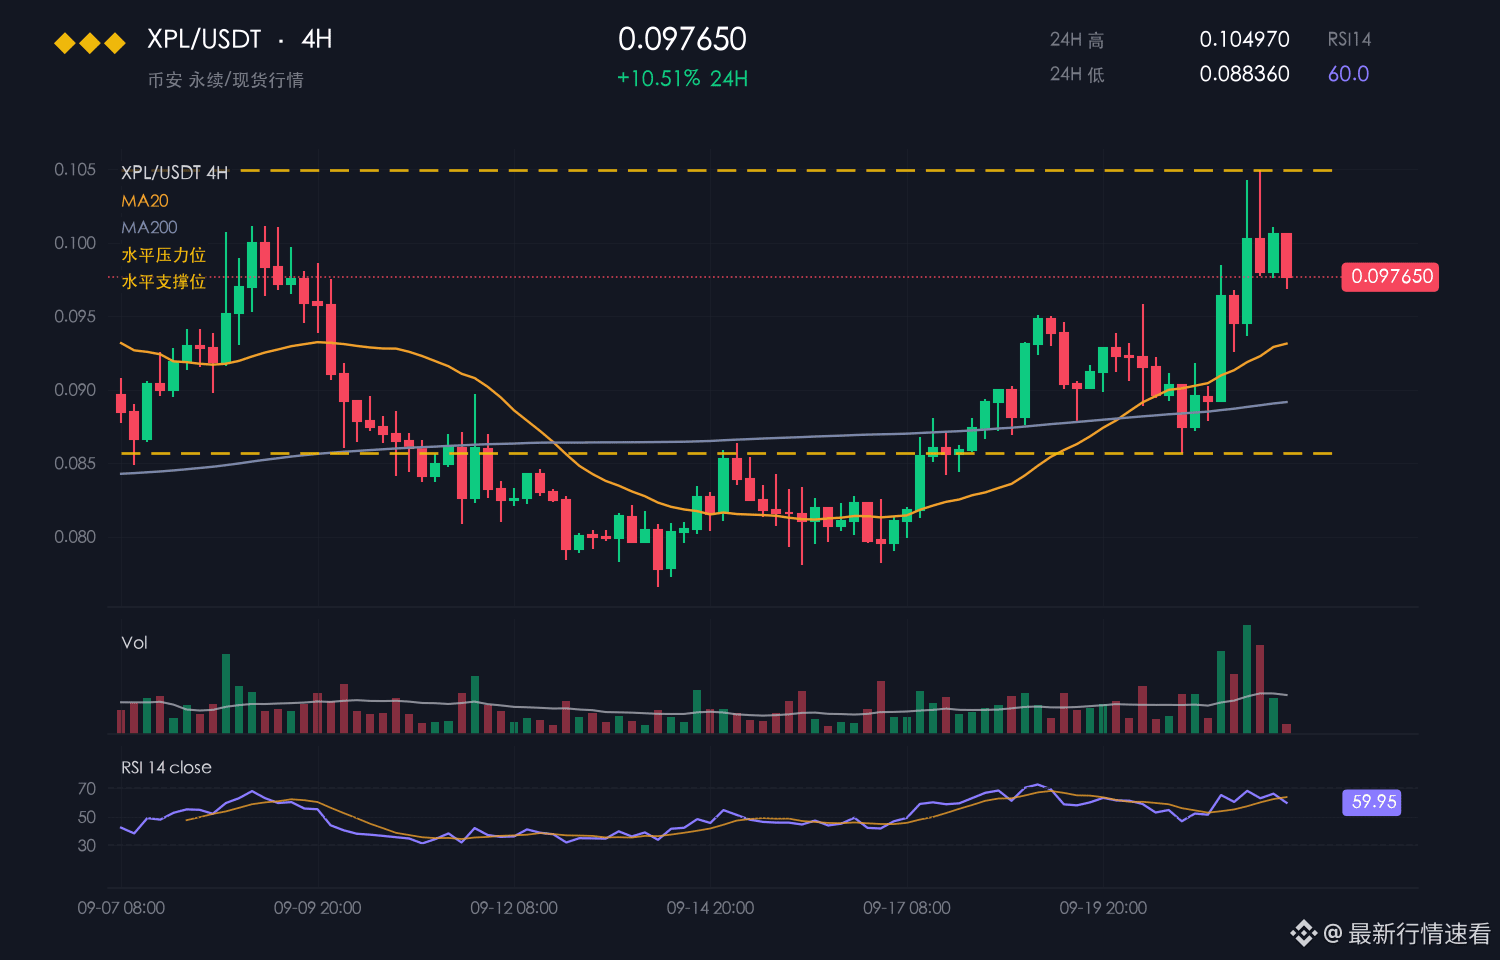
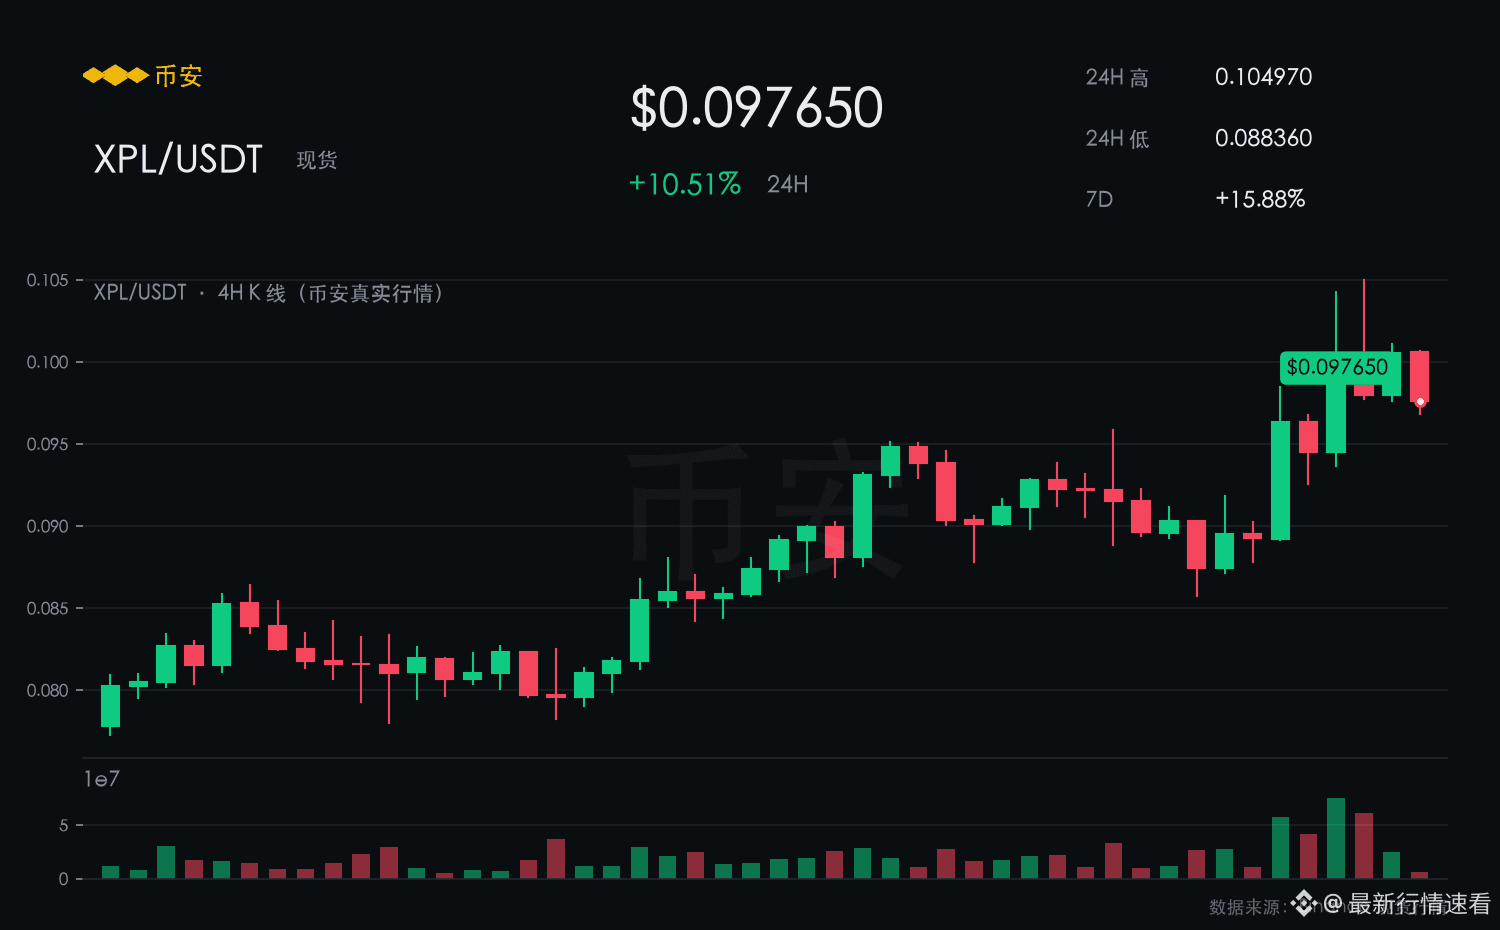
XPL is currently reporting 0.0977, up 10.51% over the past 24 hours, with a 7-day increase of 15.88%. The intraday range is 0.0884–0.1050, and the amplitude is 18.8%.
【Market View】
In the last few 4-hour K-lines, the center of gravity has been steadily rising, and there are clear signs that the bulls are controlling the market.
0.0884 is the breakout point for this round of upswing, and the pullback to this level offers a fairly good risk-reward.
When you compare BTC’s +7.28% to this, XPL is clearly stronger than the market average.
In the short term, the outlook is bullish.
【Reasons for Bullishness】
With a single-day gain of 10.51% right here, short-term bulls hold the advantage.
Pullbacks have support, and breakouts have volume—this kind of rhythm is more sustainable than a one-way surge.
Fast gains also mean fast retracements, so leaving a bit of room in your position rather than going all-in feels more comfortable.
Short-term resistance is at 0.1050—if it breaks through on increased volume, follow along. 0.0884 is the bull defense level for this move.
$XPL #XPL
【See Rise】
XPL is currently reporting 0.0977, up 10.51% over the past 24 hours, with a 7-day increase of 15.88%. The intraday range is 0.0884–0.1050, and the amplitude is 18.8%.
【Market View】
In the last few 4-hour K-lines, the center of gravity has been steadily rising, and there are clear signs that the bulls are controlling the market.
0.0884 is the breakout point for this round of upswing, and the pullback to this level offers a fairly good risk-reward.
When you compare BTC’s +7.28% to this, XPL is clearly stronger than the market average.
In the short term, the outlook is bullish.
【Reasons for Bullishness】
With a single-day gain of 10.51% right here, short-term bulls hold the advantage.
Pullbacks have support, and breakouts have volume—this kind of rhythm is more sustainable than a one-way surge.
Fast gains also mean fast retracements, so leaving a bit of room in your position rather than going all-in feels more comfortable.
Short-term resistance is at 0.1050—if it breaks through on increased volume, follow along. 0.0884 is the bull defense level for this move.
$XPL #XPL
XPL is currently reporting 0.0977, up 10.51% over the past 24 hours, with a 7-day increase of 15.88%. The intraday range is 0.0884–0.1050, and the amplitude is 18.8%.
【Market View】
In the last few 4-hour K-lines, the center of gravity has been steadily rising, and there are clear signs that the bulls are controlling the market.
0.0884 is the breakout point for this round of upswing, and the pullback to this level offers a fairly good risk-reward.
When you compare BTC’s +7.28% to this, XPL is clearly stronger than the market average.
In the short term, the outlook is bullish.
【Reasons for Bullishness】
With a single-day gain of 10.51% right here, short-term bulls hold the advantage.
Pullbacks have support, and breakouts have volume—this kind of rhythm is more sustainable than a one-way surge.
Fast gains also mean fast retracements, so leaving a bit of room in your position rather than going all-in feels more comfortable.
Short-term resistance is at 0.1050—if it breaks through on increased volume, follow along. 0.0884 is the bull defense level for this move.
$XPL #XPL
172
·
--
【See Rise】
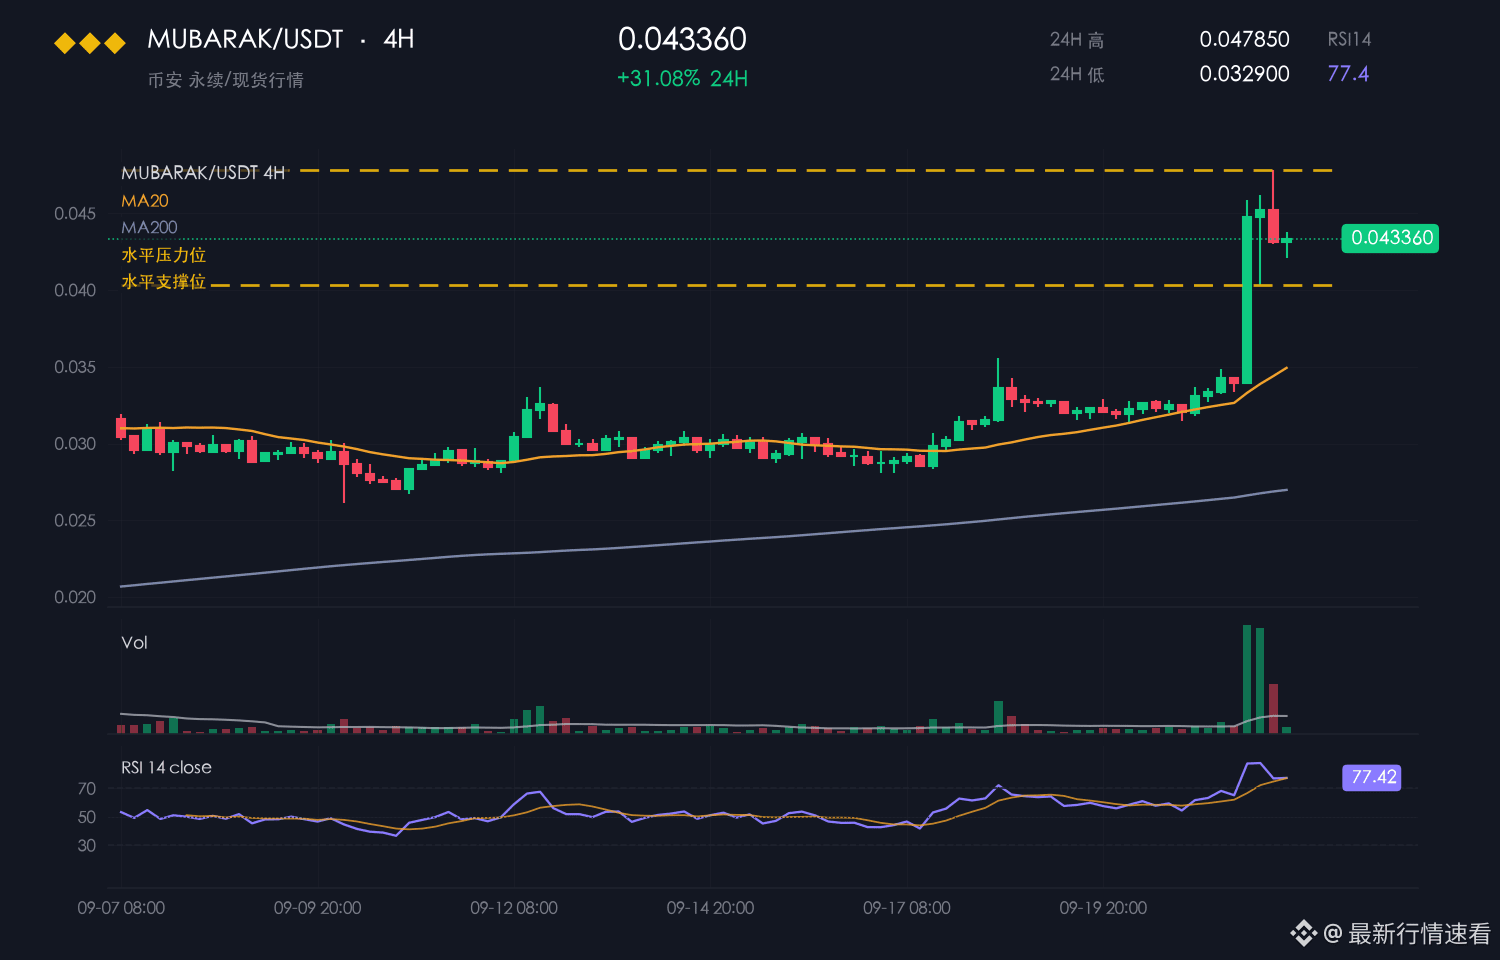
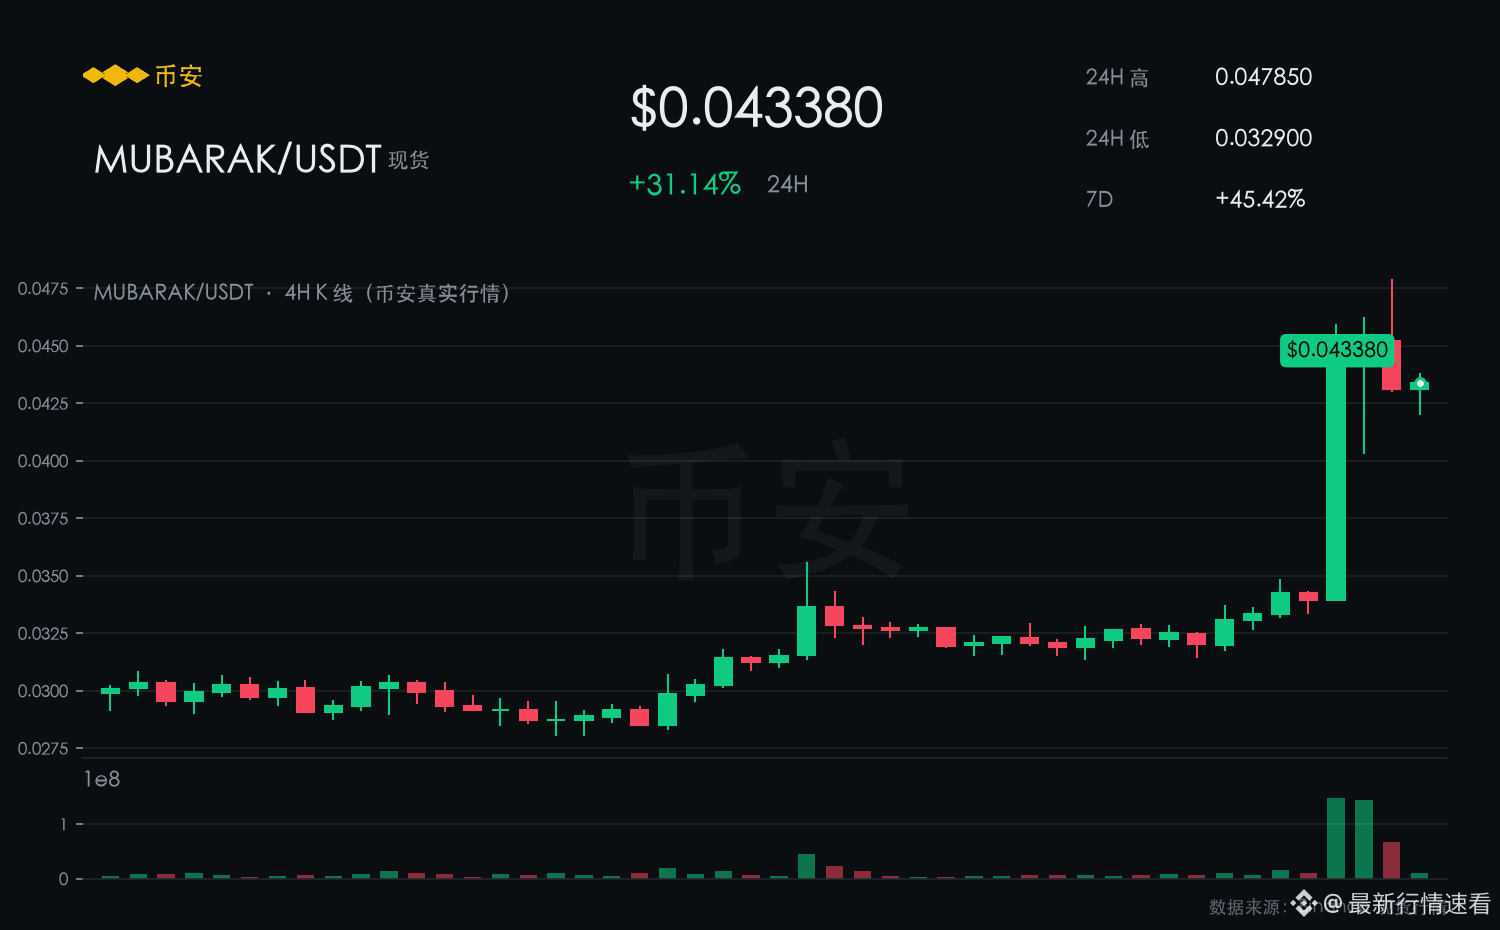
MUBARAK is currently reported at 0.0434; it is up 31.08% over the past 24 hours and 45.36% over the past 7 days. The intraday range is 0.0329–0.0478, with a volatility of 45.4%.
【Market View】
MUBARAK’s movement is clearly decoupled from the broader market—it has been following its own rhythm.
Around 0.0329 is the takeoff point for this round of gains; when it pulls back to this level, the value proposition isn’t bad.
During the same period, the broader market is only up +7.28%, so MUBARAK’s +31.08% represents excess returns.
In the short term, the outlook is bullish.
【Bullish Reasons】
With a single-day gain of 31.08% right here, short-term bulls have the advantage.
In the 24-hour rally of 31.08%, the intraday high of 0.0478 has been tested repeatedly, indicating that overhead resistance is being absorbed.
The risk is that after a short-term surge, profit-taking could happen at any time; chasing higher is likely to get “pinched” by wick spikes.
For execution, use 0.0329 as the stop-loss level and look for upside potential from a break above 0.0478.
$MUBARAK #MUBARAK
【See Rise】
MUBARAK is currently reported at 0.0434; it is up 31.08% over the past 24 hours and 45.36% over the past 7 days. The intraday range is 0.0329–0.0478, with a volatility of 45.4%.
【Market View】
MUBARAK’s movement is clearly decoupled from the broader market—it has been following its own rhythm.
Around 0.0329 is the takeoff point for this round of gains; when it pulls back to this level, the value proposition isn’t bad.
During the same period, the broader market is only up +7.28%, so MUBARAK’s +31.08% represents excess returns.
In the short term, the outlook is bullish.
【Bullish Reasons】
With a single-day gain of 31.08% right here, short-term bulls have the advantage.
In the 24-hour rally of 31.08%, the intraday high of 0.0478 has been tested repeatedly, indicating that overhead resistance is being absorbed.
The risk is that after a short-term surge, profit-taking could happen at any time; chasing higher is likely to get “pinched” by wick spikes.
For execution, use 0.0329 as the stop-loss level and look for upside potential from a break above 0.0478.
$MUBARAK #MUBARAK
MUBARAK is currently reported at 0.0434; it is up 31.08% over the past 24 hours and 45.36% over the past 7 days. The intraday range is 0.0329–0.0478, with a volatility of 45.4%.
【Market View】
MUBARAK’s movement is clearly decoupled from the broader market—it has been following its own rhythm.
Around 0.0329 is the takeoff point for this round of gains; when it pulls back to this level, the value proposition isn’t bad.
During the same period, the broader market is only up +7.28%, so MUBARAK’s +31.08% represents excess returns.
In the short term, the outlook is bullish.
【Bullish Reasons】
With a single-day gain of 31.08% right here, short-term bulls have the advantage.
In the 24-hour rally of 31.08%, the intraday high of 0.0478 has been tested repeatedly, indicating that overhead resistance is being absorbed.
The risk is that after a short-term surge, profit-taking could happen at any time; chasing higher is likely to get “pinched” by wick spikes.
For execution, use 0.0329 as the stop-loss level and look for upside potential from a break above 0.0478.
$MUBARAK #MUBARAK
31
·
--
【See Decline】
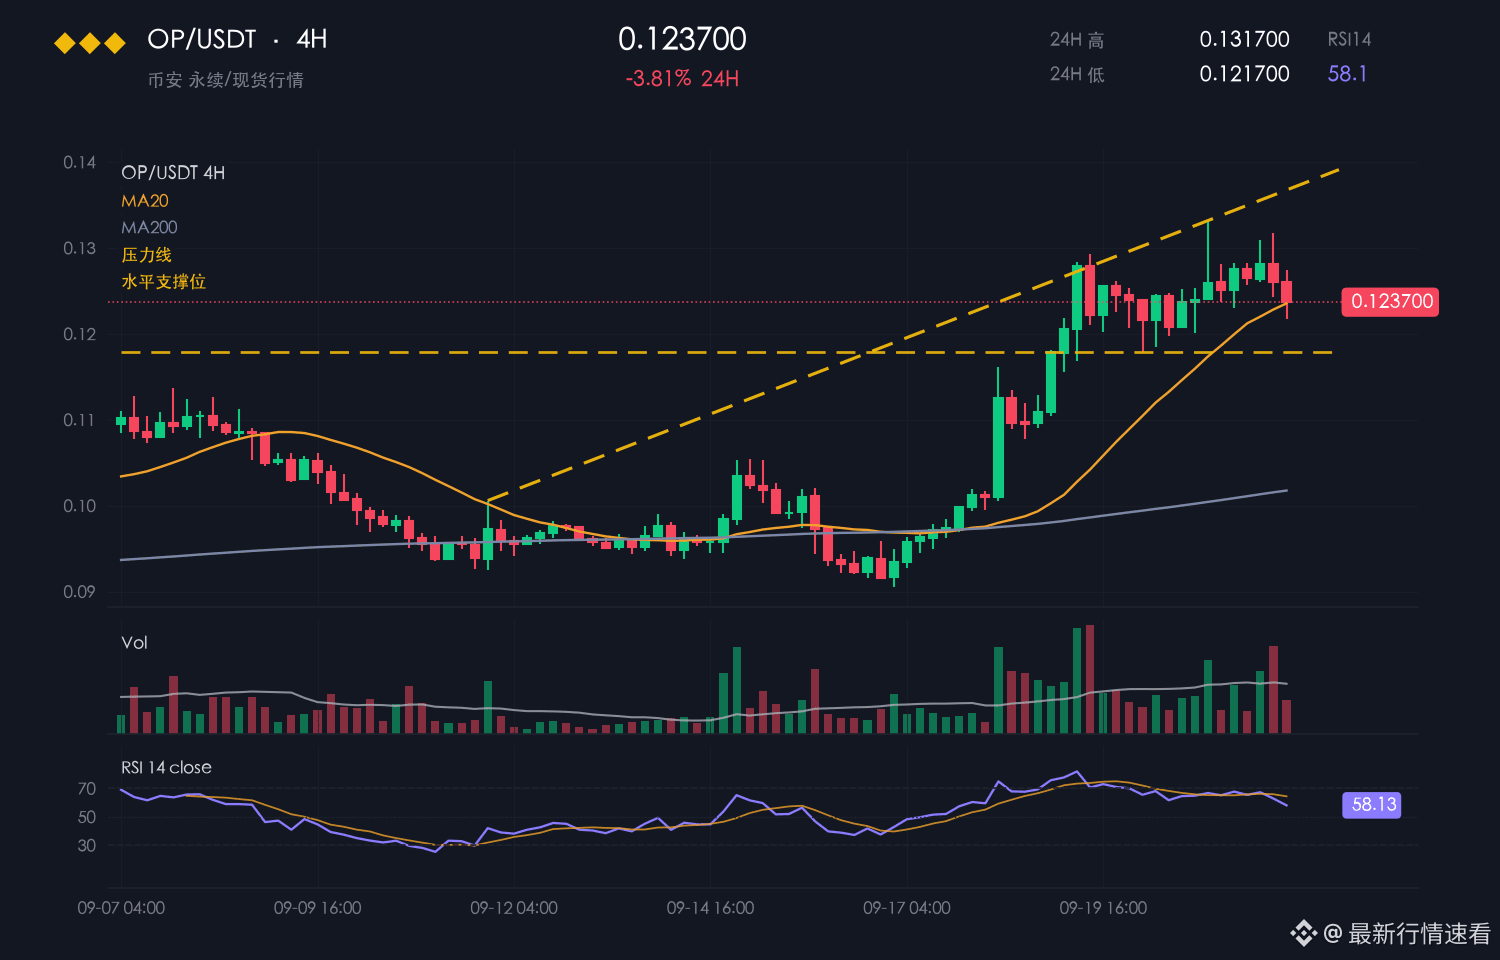
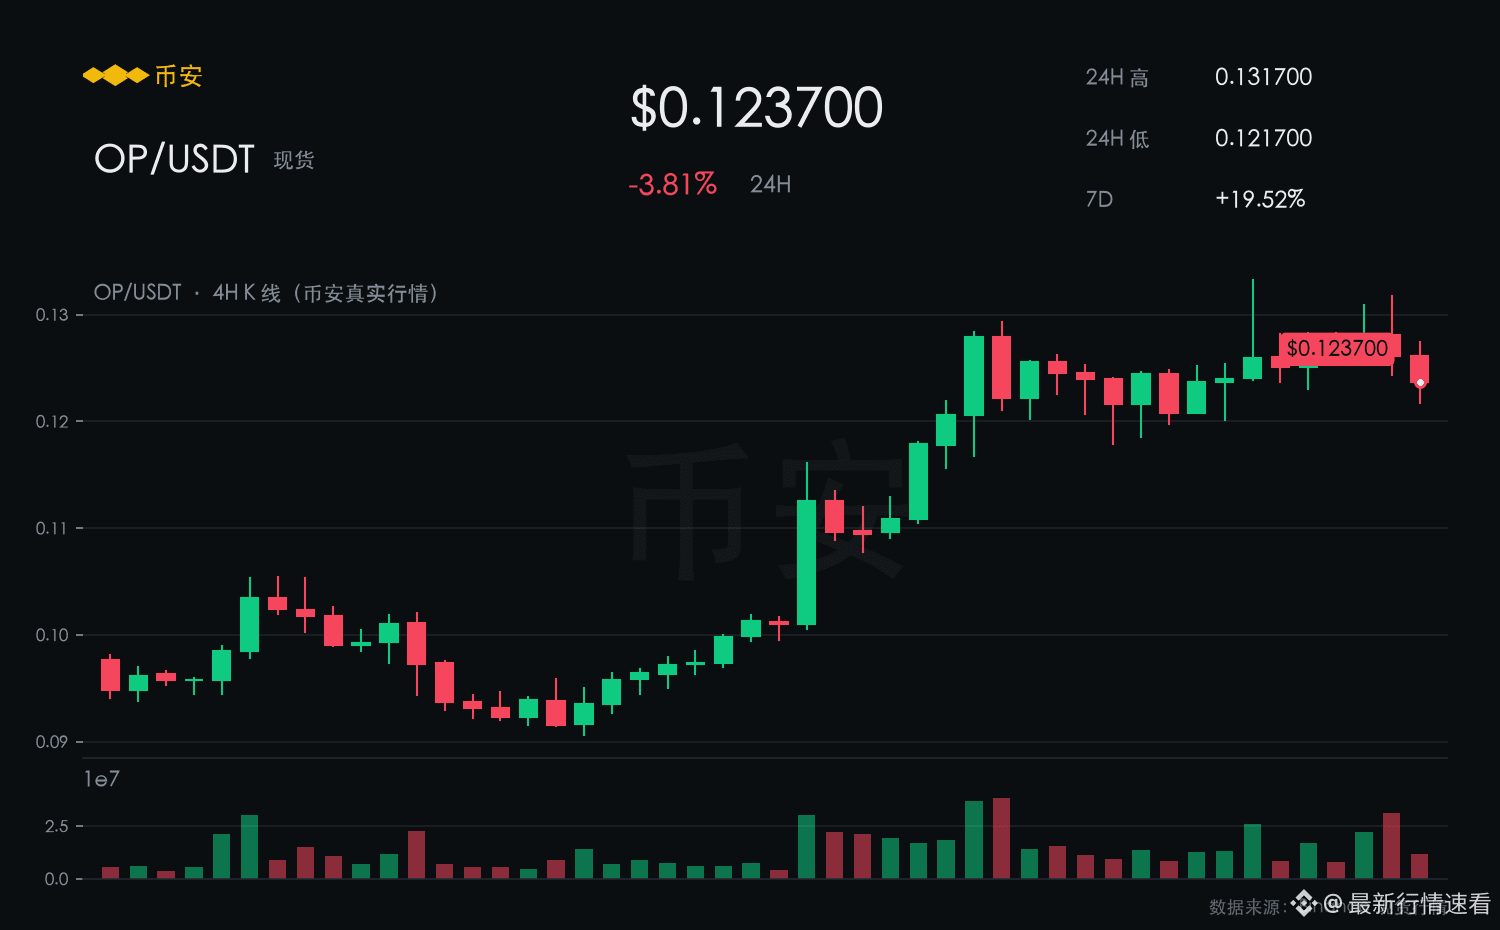
OP currently reported at 0.1237. Over the past 24 hours, it is down 3.74%. It is still up 19.52% over 7 days. The intraday range is 0.1217–0.1317, with a volatility of 8.2%.
【Market Overview】
Over the past 24 hours, OP is down 3.74%. After rebounding to around 0.1317, it was pushed back down again, as there is a high density of trapped sell orders overhead.
In the short term, there are still no signs that weakness has been reversed, and selling pressure continues to be released.
During the same period, BTC is up 5.70% over 24 hours. OP’s decline of 3.74% is clearly underperforming the broader market, and funds are pulling out.
In the near term, the outlook is bearish.
【Bearish Rationale】
The sell pressure around 0.1317 has not been fully digested. Each rebound attempt has weaker strength than the last.
The focus continues to shift downward below 0.1317, and there is no solid sign of support taking hold in the short term.
A drop of 3.74% doesn’t mean it’s bottomed out. Before catching the falling knife, check the volume and momentum.
If a rebound does not stand above 0.1317 on increased volume, treat it as weak consolidation.
$OP #OP
【See Decline】
OP currently reported at 0.1237. Over the past 24 hours, it is down 3.74%. It is still up 19.52% over 7 days. The intraday range is 0.1217–0.1317, with a volatility of 8.2%.
【Market Overview】
Over the past 24 hours, OP is down 3.74%. After rebounding to around 0.1317, it was pushed back down again, as there is a high density of trapped sell orders overhead.
In the short term, there are still no signs that weakness has been reversed, and selling pressure continues to be released.
During the same period, BTC is up 5.70% over 24 hours. OP’s decline of 3.74% is clearly underperforming the broader market, and funds are pulling out.
In the near term, the outlook is bearish.
【Bearish Rationale】
The sell pressure around 0.1317 has not been fully digested. Each rebound attempt has weaker strength than the last.
The focus continues to shift downward below 0.1317, and there is no solid sign of support taking hold in the short term.
A drop of 3.74% doesn’t mean it’s bottomed out. Before catching the falling knife, check the volume and momentum.
If a rebound does not stand above 0.1317 on increased volume, treat it as weak consolidation.
$OP #OP
OP currently reported at 0.1237. Over the past 24 hours, it is down 3.74%. It is still up 19.52% over 7 days. The intraday range is 0.1217–0.1317, with a volatility of 8.2%.
【Market Overview】
Over the past 24 hours, OP is down 3.74%. After rebounding to around 0.1317, it was pushed back down again, as there is a high density of trapped sell orders overhead.
In the short term, there are still no signs that weakness has been reversed, and selling pressure continues to be released.
During the same period, BTC is up 5.70% over 24 hours. OP’s decline of 3.74% is clearly underperforming the broader market, and funds are pulling out.
In the near term, the outlook is bearish.
【Bearish Rationale】
The sell pressure around 0.1317 has not been fully digested. Each rebound attempt has weaker strength than the last.
The focus continues to shift downward below 0.1317, and there is no solid sign of support taking hold in the short term.
A drop of 3.74% doesn’t mean it’s bottomed out. Before catching the falling knife, check the volume and momentum.
If a rebound does not stand above 0.1317 on increased volume, treat it as weak consolidation.
$OP #OP
178
·
--
【See Drop】
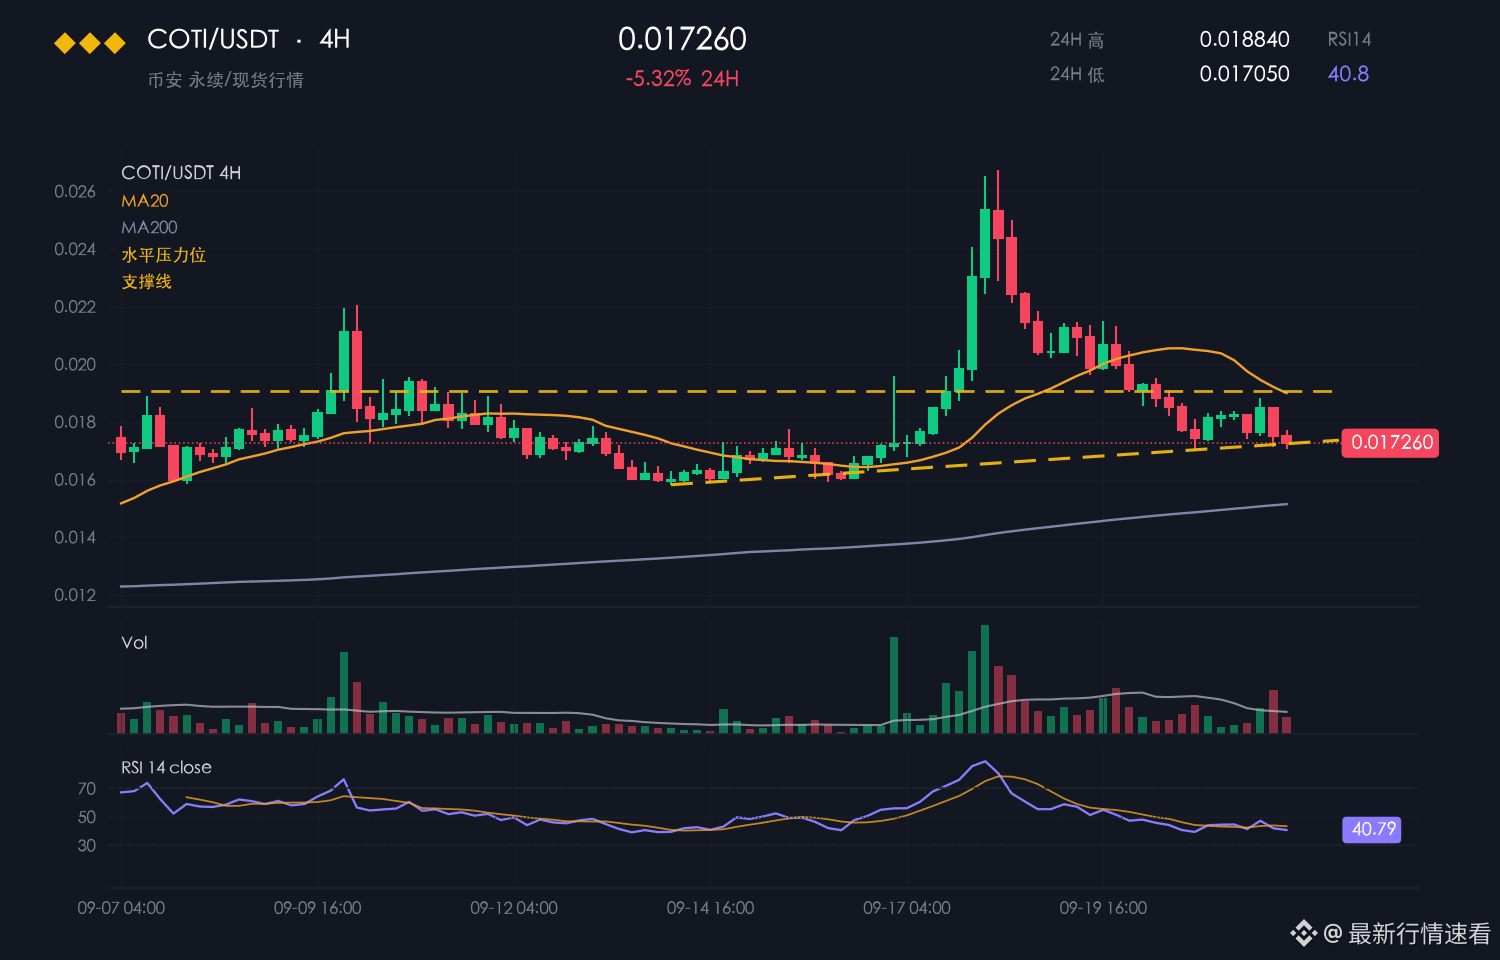
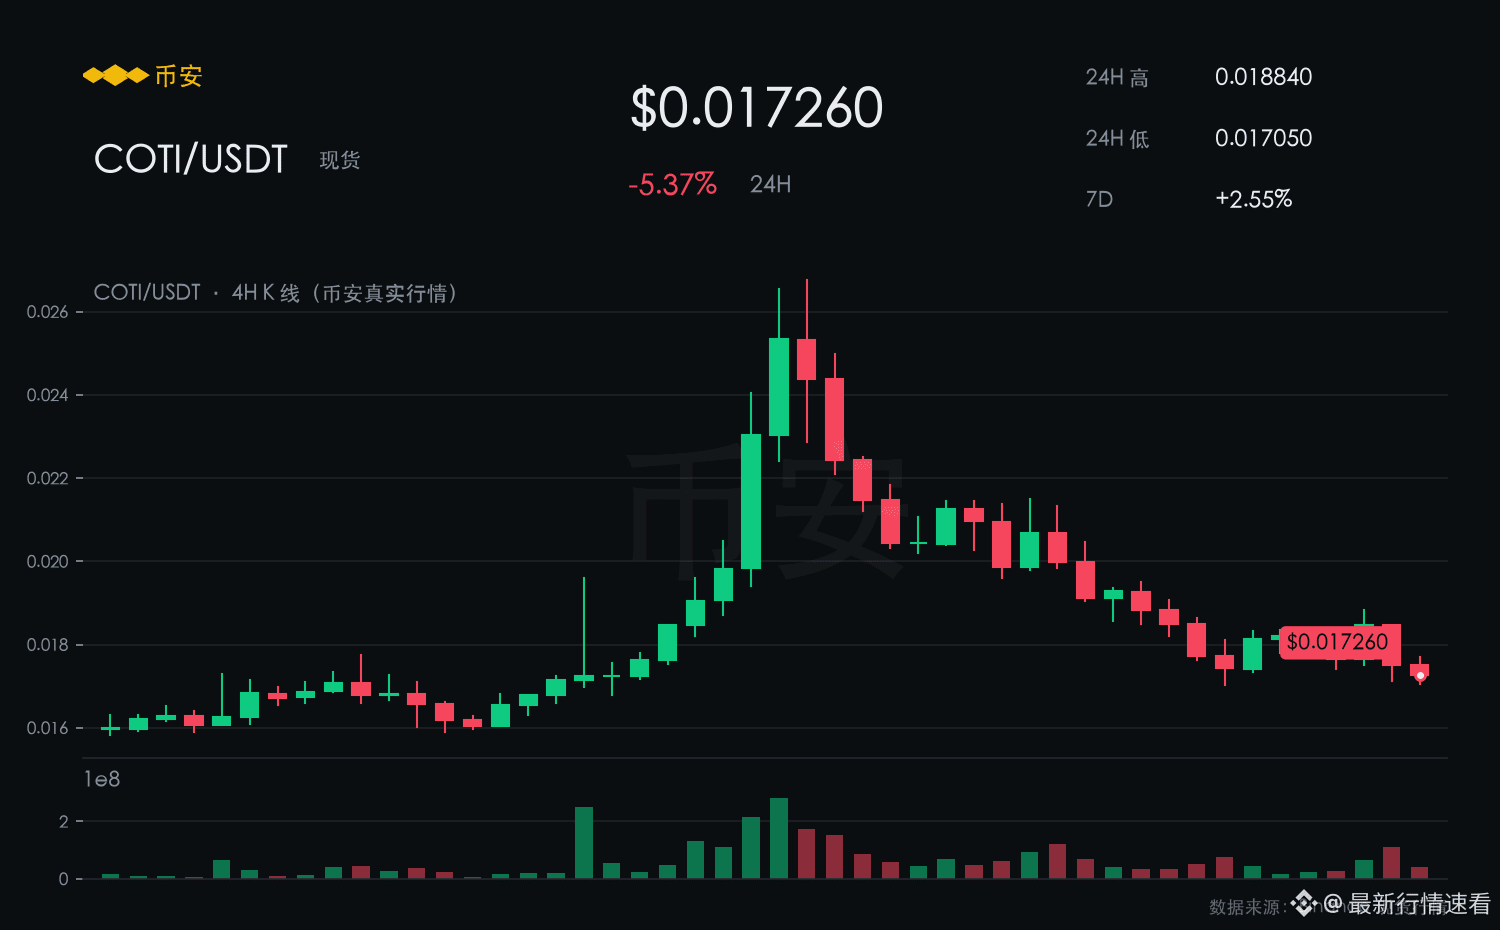
COTI is currently reported at 0.0173; over the past 24 hours it has fallen 5.32%. Over 7 days it is still up 2.55%. The intraday range is 0.0170–0.0188, with a volatility of 10.5%.
【Market Snapshot】
COTI is down 5.32% over the past 24 hours. After rebounding to around 0.0188, it was pushed back down again, with a high density of trapped sell orders overhead.
Price is trading right around 0.0170. Once this level is lost, downside acceleration is likely.
Meanwhile, the overall market is up 5.70% during the same period, but COTI has dropped 5.32%, underperforming the market average.
In the short term, the bias is bearish.
【Bearish Rationale】
The 7-day chart still shows a gain of 2.55%, but the last 24 hours have flipped to a 5.32% decline—signs of a high-and-fall are already appearing.
With price hovering around 0.0170, the balance between buyers and sellers is clearly leaning toward the sell side.
If trading volume suddenly spikes near 0.0170, it suggests funds are starting to bottom-pick. At that time, don’t fight for too long.
For the short term, first watch whether 0.0170 can hold. If it breaks down, don’t rush to catch falling knives.
$COTI #COTI
【See Drop】
COTI is currently reported at 0.0173; over the past 24 hours it has fallen 5.32%. Over 7 days it is still up 2.55%. The intraday range is 0.0170–0.0188, with a volatility of 10.5%.
【Market Snapshot】
COTI is down 5.32% over the past 24 hours. After rebounding to around 0.0188, it was pushed back down again, with a high density of trapped sell orders overhead.
Price is trading right around 0.0170. Once this level is lost, downside acceleration is likely.
Meanwhile, the overall market is up 5.70% during the same period, but COTI has dropped 5.32%, underperforming the market average.
In the short term, the bias is bearish.
【Bearish Rationale】
The 7-day chart still shows a gain of 2.55%, but the last 24 hours have flipped to a 5.32% decline—signs of a high-and-fall are already appearing.
With price hovering around 0.0170, the balance between buyers and sellers is clearly leaning toward the sell side.
If trading volume suddenly spikes near 0.0170, it suggests funds are starting to bottom-pick. At that time, don’t fight for too long.
For the short term, first watch whether 0.0170 can hold. If it breaks down, don’t rush to catch falling knives.
$COTI #COTI
COTI is currently reported at 0.0173; over the past 24 hours it has fallen 5.32%. Over 7 days it is still up 2.55%. The intraday range is 0.0170–0.0188, with a volatility of 10.5%.
【Market Snapshot】
COTI is down 5.32% over the past 24 hours. After rebounding to around 0.0188, it was pushed back down again, with a high density of trapped sell orders overhead.
Price is trading right around 0.0170. Once this level is lost, downside acceleration is likely.
Meanwhile, the overall market is up 5.70% during the same period, but COTI has dropped 5.32%, underperforming the market average.
In the short term, the bias is bearish.
【Bearish Rationale】
The 7-day chart still shows a gain of 2.55%, but the last 24 hours have flipped to a 5.32% decline—signs of a high-and-fall are already appearing.
With price hovering around 0.0170, the balance between buyers and sellers is clearly leaning toward the sell side.
If trading volume suddenly spikes near 0.0170, it suggests funds are starting to bottom-pick. At that time, don’t fight for too long.
For the short term, first watch whether 0.0170 can hold. If it breaks down, don’t rush to catch falling knives.
$COTI #COTI
7
·
--
【Watching the Decline】
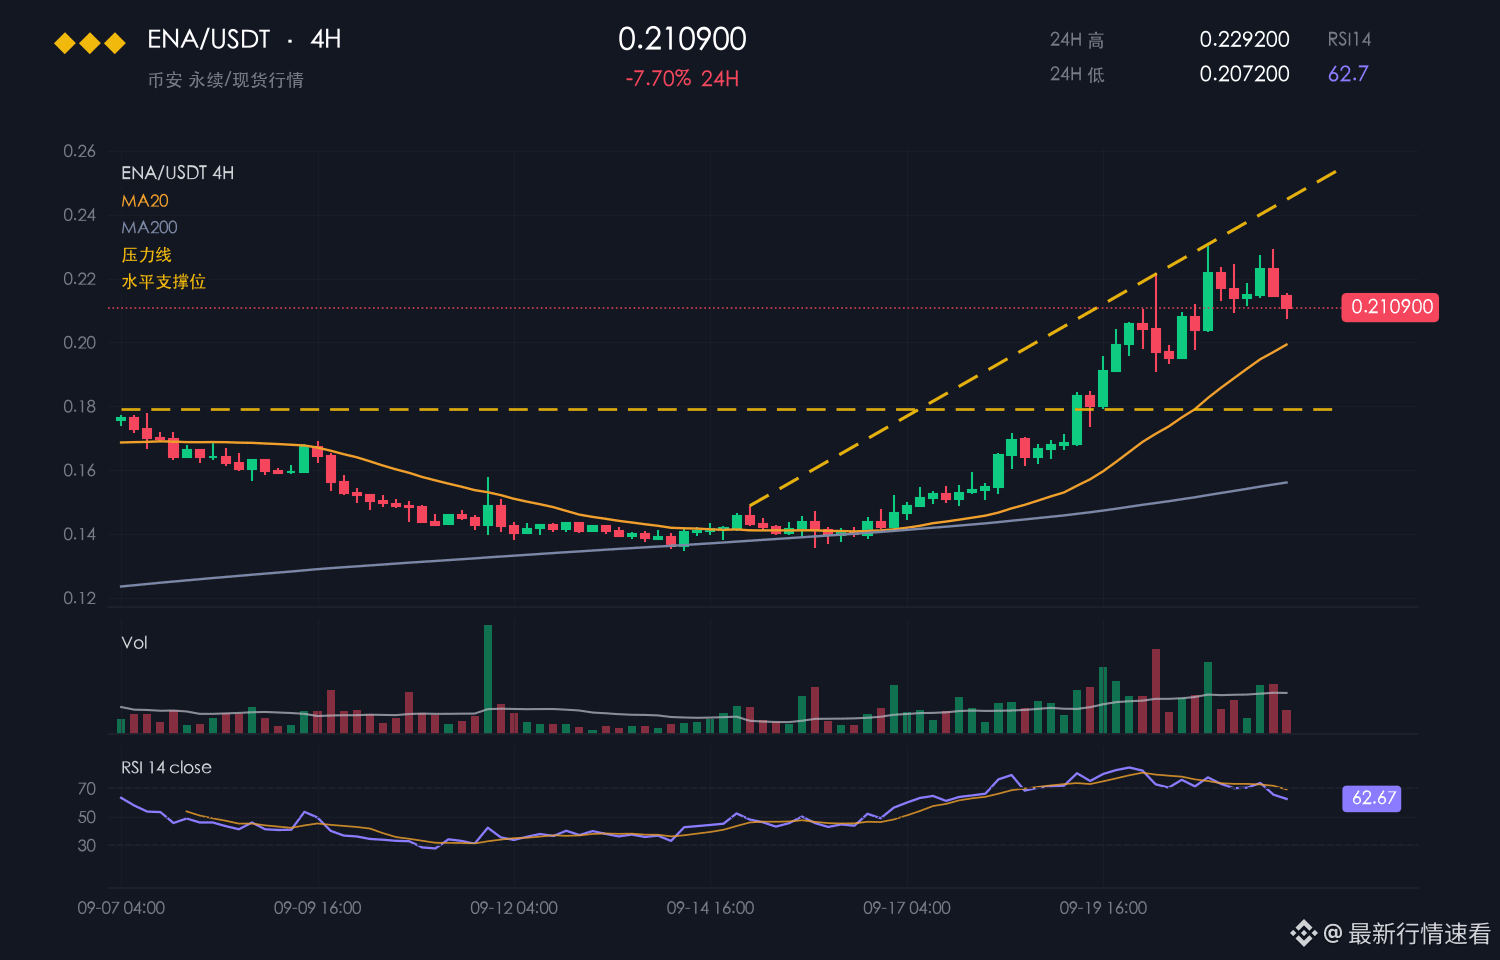
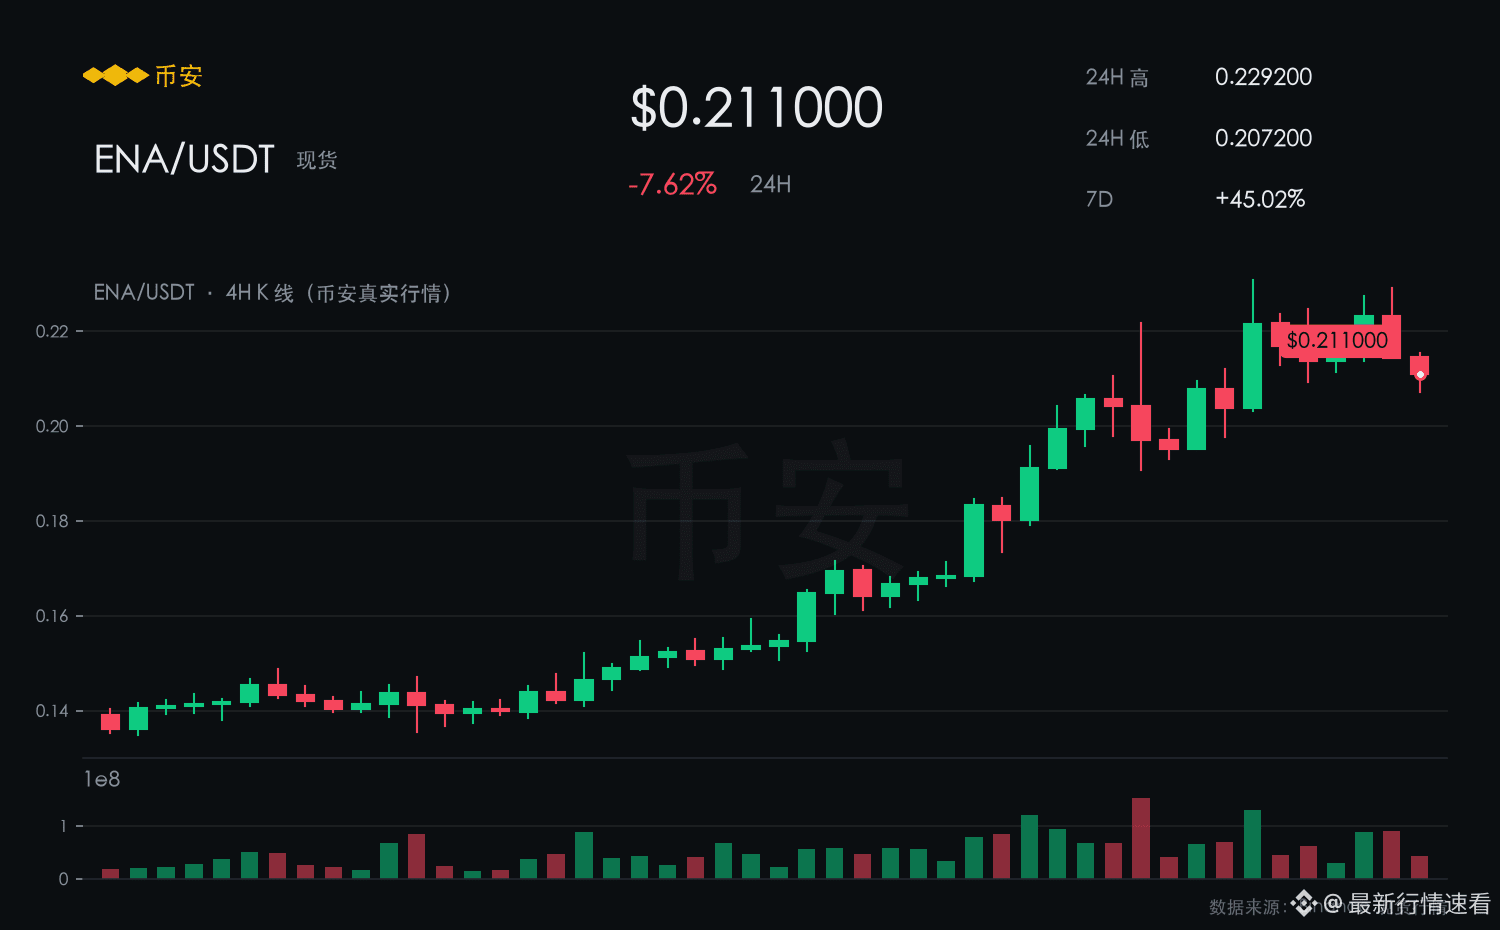
ENA is currently quoted at 0.2109, down 7.66% over the past 24 hours. It is still up 44.95% over the last 7 days. Intraday range: 0.2072–0.2292, with a volatility of 10.6%.
【Market View】
After a 7.66% drop over 24 hours, ENA failed to hold 0.2292, and the short-term focus remains shifting downward.
The support at 0.2072 has not been tested with real, concrete trading, so confidence is not strong.
While the broader market is up 5.70% in the same period, ENA is down 7.66%, underperforming the market average.
In the near term, the bias is bearish.
【Bearish Rationale】
The selling pressure near 0.2292 has not been fully digested yet, and each subsequent rebound has had weaker force than the last.
A 7.66% decline over the past 24 hours indicates that active sell orders have not yet exhausted.
Being down 7.66% doesn’t mean the bottom is in—before catching a falling knife, first check trading volume.
For now, watch whether 0.2072 can hold in the short term; if it breaks, don’t rush to catch the falling knife.
$ENA #ENA
【Watching the Decline】
ENA is currently quoted at 0.2109, down 7.66% over the past 24 hours. It is still up 44.95% over the last 7 days. Intraday range: 0.2072–0.2292, with a volatility of 10.6%.
【Market View】
After a 7.66% drop over 24 hours, ENA failed to hold 0.2292, and the short-term focus remains shifting downward.
The support at 0.2072 has not been tested with real, concrete trading, so confidence is not strong.
While the broader market is up 5.70% in the same period, ENA is down 7.66%, underperforming the market average.
In the near term, the bias is bearish.
【Bearish Rationale】
The selling pressure near 0.2292 has not been fully digested yet, and each subsequent rebound has had weaker force than the last.
A 7.66% decline over the past 24 hours indicates that active sell orders have not yet exhausted.
Being down 7.66% doesn’t mean the bottom is in—before catching a falling knife, first check trading volume.
For now, watch whether 0.2072 can hold in the short term; if it breaks, don’t rush to catch the falling knife.
$ENA #ENA
ENA is currently quoted at 0.2109, down 7.66% over the past 24 hours. It is still up 44.95% over the last 7 days. Intraday range: 0.2072–0.2292, with a volatility of 10.6%.
【Market View】
After a 7.66% drop over 24 hours, ENA failed to hold 0.2292, and the short-term focus remains shifting downward.
The support at 0.2072 has not been tested with real, concrete trading, so confidence is not strong.
While the broader market is up 5.70% in the same period, ENA is down 7.66%, underperforming the market average.
In the near term, the bias is bearish.
【Bearish Rationale】
The selling pressure near 0.2292 has not been fully digested yet, and each subsequent rebound has had weaker force than the last.
A 7.66% decline over the past 24 hours indicates that active sell orders have not yet exhausted.
Being down 7.66% doesn’t mean the bottom is in—before catching a falling knife, first check trading volume.
For now, watch whether 0.2072 can hold in the short term; if it breaks, don’t rush to catch the falling knife.
$ENA #ENA
6
·
--
【See Decline】
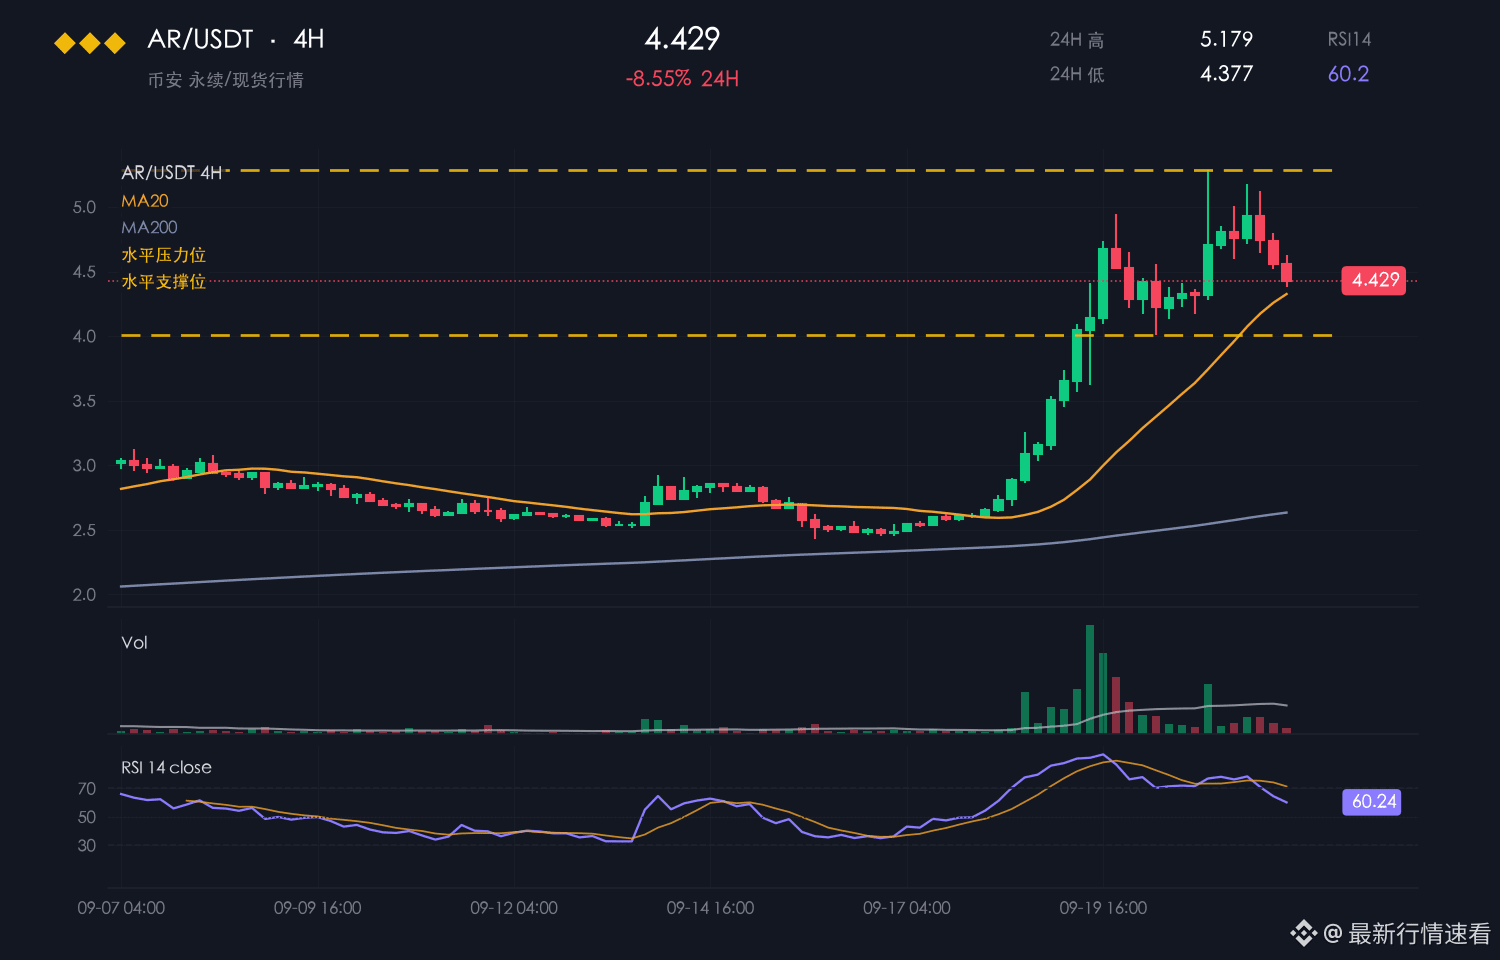
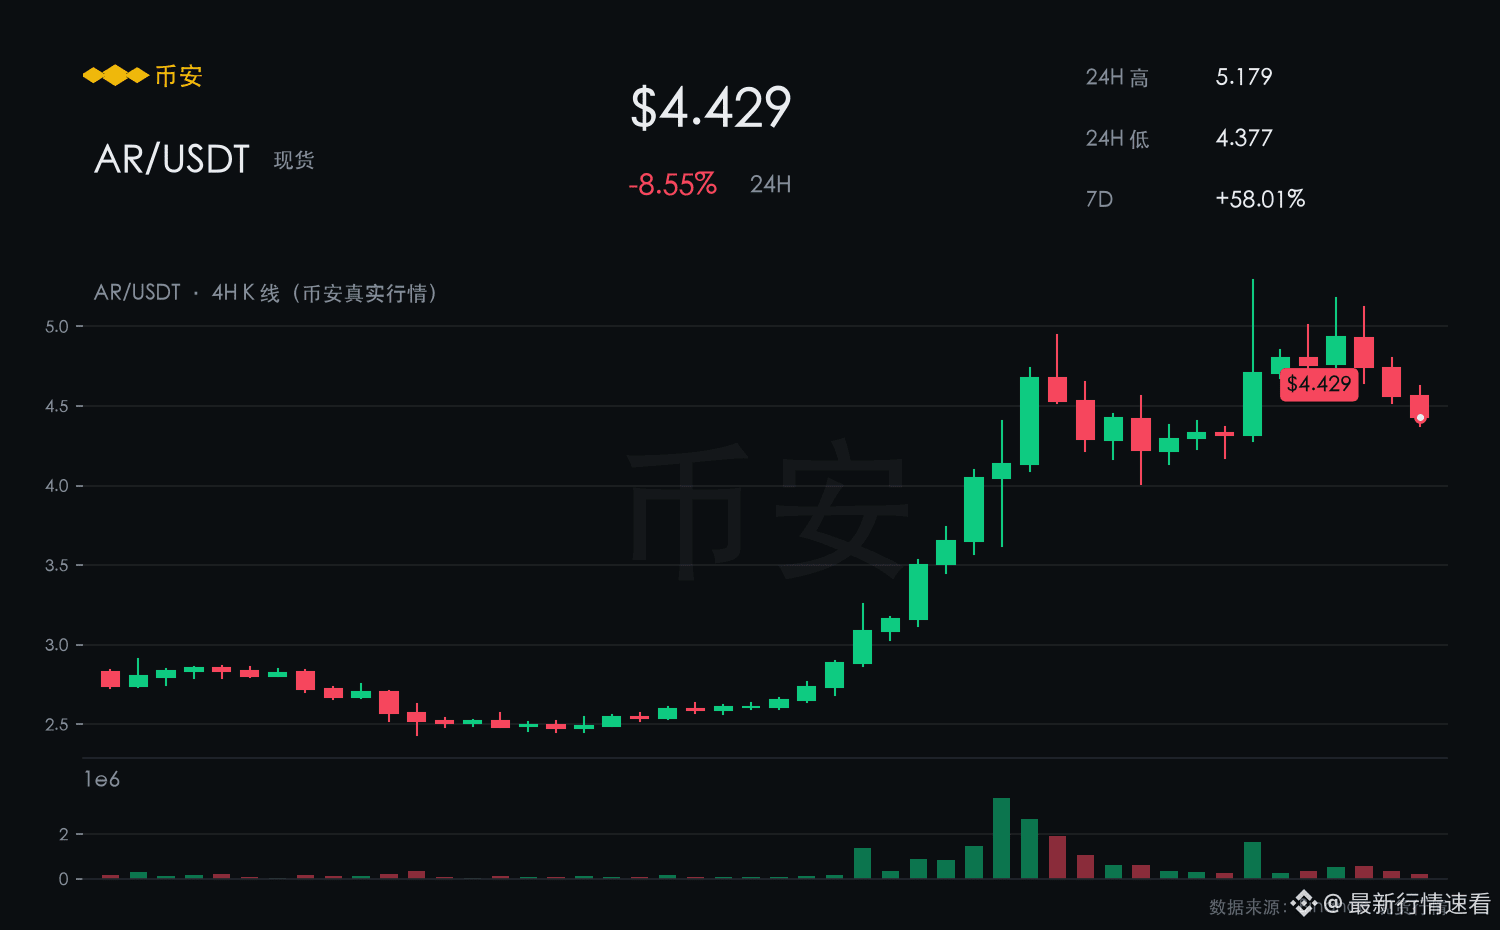
AR current quote 4.429, down 8.53% over the past 24 hours, still up 58.01% over 7 days. Intraday range 4.377–5.179, with a 18.3% swing.
【Market View】
AR is down 8.53% over the past 24 hours. It rebounded toward 5.179 but was pushed back down near that level, where there is a high density of trapped positions.
Support at 4.377 has not been truly tested with real bids, so confidence is lacking.
Compared with BTC’s +5.70%, AR’s relative strength is at the bottom—one of the tiers the market has essentially abandoned.
In the short term, the bias is bearish.
【Bearish Rationale】
Over 7 days it still shows a 58.01% gain, but in the past 24 hours it has turned to decline by 8.53%—signs of a peak-and-fade are already appearing.
The focus below 5.179 continues to shift downward, and there is still no sign of a decent pull-in/support in the near term.
A drop of 8.53% doesn’t necessarily mean it’s the bottom—before catching a falling knife, first check the volume.
If the rebound cannot stand above 5.179 with volume, treat it as consolidation under weak conditions.
$AR #AR
【See Decline】
AR current quote 4.429, down 8.53% over the past 24 hours, still up 58.01% over 7 days. Intraday range 4.377–5.179, with a 18.3% swing.
【Market View】
AR is down 8.53% over the past 24 hours. It rebounded toward 5.179 but was pushed back down near that level, where there is a high density of trapped positions.
Support at 4.377 has not been truly tested with real bids, so confidence is lacking.
Compared with BTC’s +5.70%, AR’s relative strength is at the bottom—one of the tiers the market has essentially abandoned.
In the short term, the bias is bearish.
【Bearish Rationale】
Over 7 days it still shows a 58.01% gain, but in the past 24 hours it has turned to decline by 8.53%—signs of a peak-and-fade are already appearing.
The focus below 5.179 continues to shift downward, and there is still no sign of a decent pull-in/support in the near term.
A drop of 8.53% doesn’t necessarily mean it’s the bottom—before catching a falling knife, first check the volume.
If the rebound cannot stand above 5.179 with volume, treat it as consolidation under weak conditions.
$AR #AR
AR current quote 4.429, down 8.53% over the past 24 hours, still up 58.01% over 7 days. Intraday range 4.377–5.179, with a 18.3% swing.
【Market View】
AR is down 8.53% over the past 24 hours. It rebounded toward 5.179 but was pushed back down near that level, where there is a high density of trapped positions.
Support at 4.377 has not been truly tested with real bids, so confidence is lacking.
Compared with BTC’s +5.70%, AR’s relative strength is at the bottom—one of the tiers the market has essentially abandoned.
In the short term, the bias is bearish.
【Bearish Rationale】
Over 7 days it still shows a 58.01% gain, but in the past 24 hours it has turned to decline by 8.53%—signs of a peak-and-fade are already appearing.
The focus below 5.179 continues to shift downward, and there is still no sign of a decent pull-in/support in the near term.
A drop of 8.53% doesn’t necessarily mean it’s the bottom—before catching a falling knife, first check the volume.
If the rebound cannot stand above 5.179 with volume, treat it as consolidation under weak conditions.
$AR #AR
1
·
--
【See Rise】
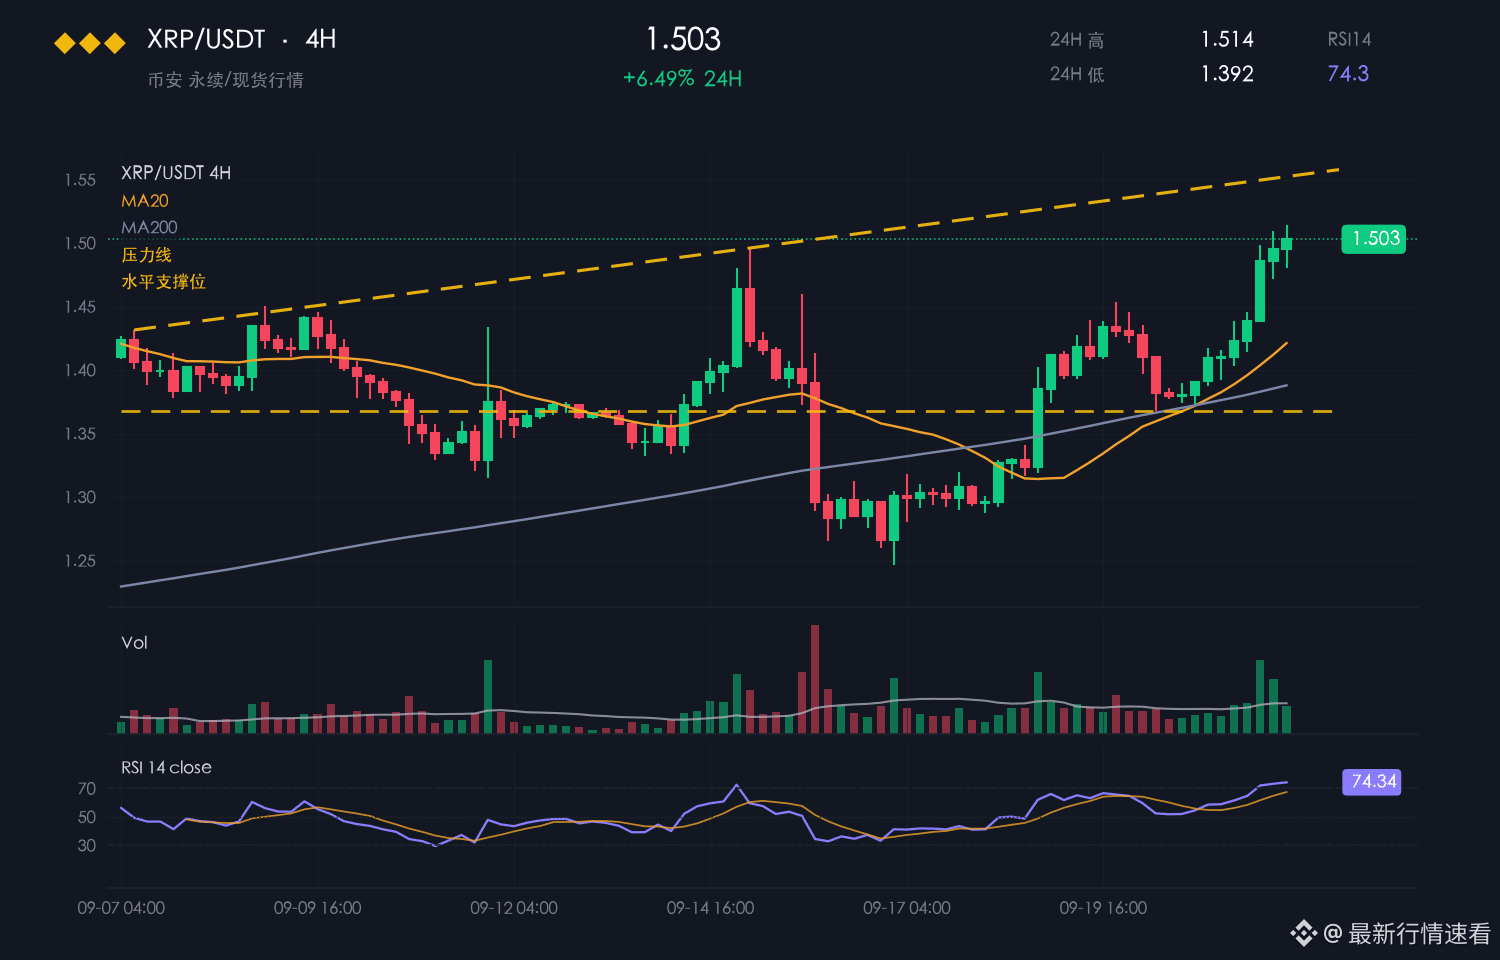
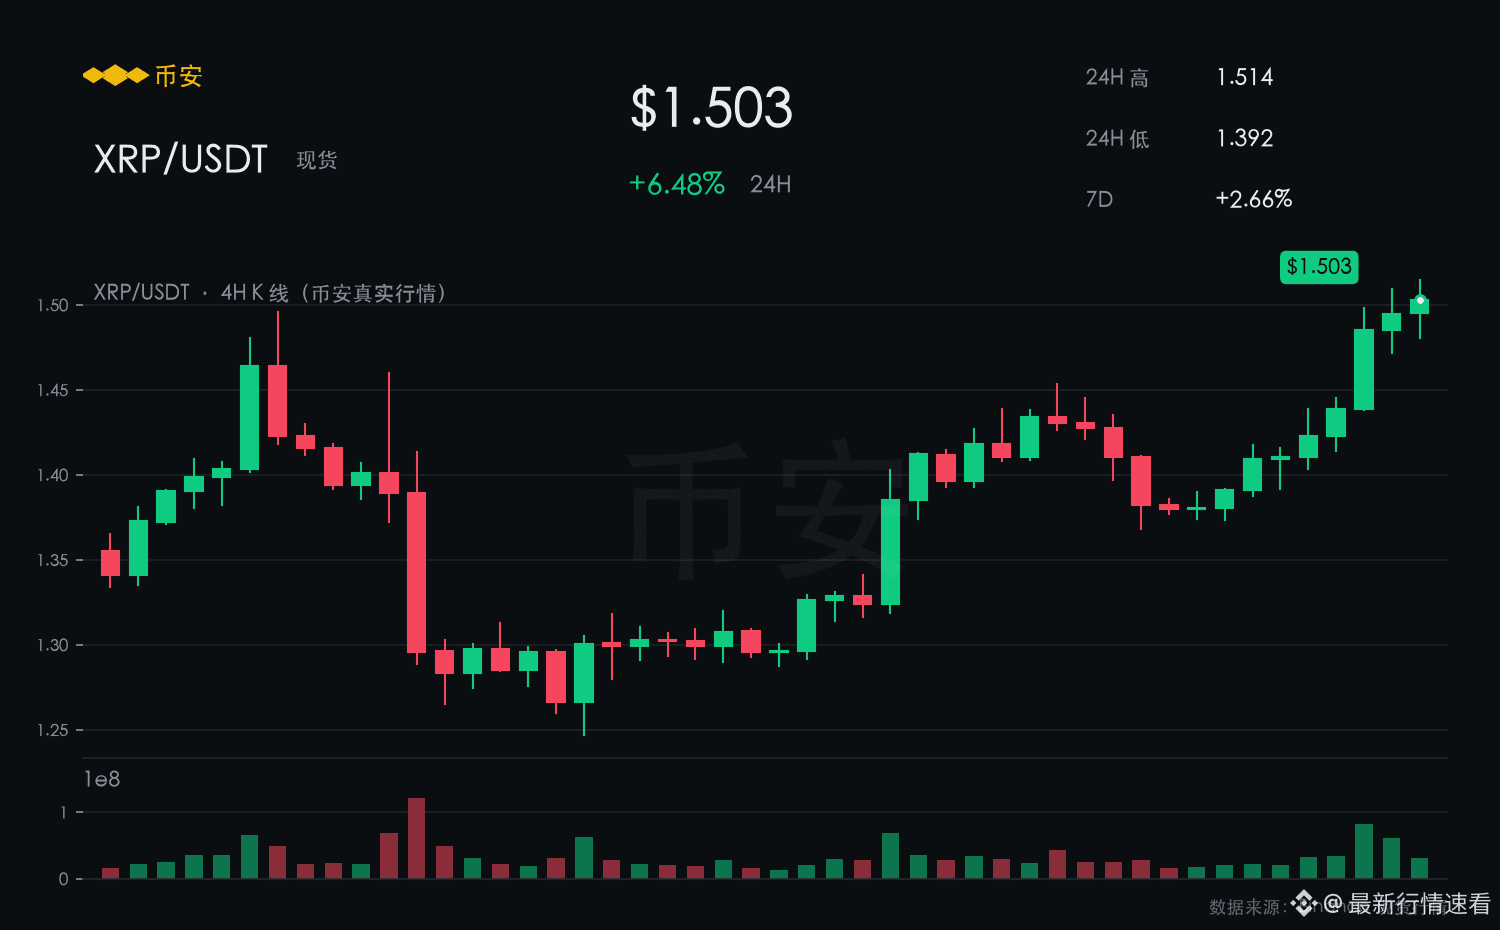
XRP is currently trading at 1.503, up 6.48% over the past 24 hours. Its 7-day gain is 2.66%. The intraday range is 1.392–1.514, with a volatility of 8.8%.
【Market View】
In the last few 4-hour candles, the center of gravity has been steadily rising, showing fairly clear signs of bullish control.
The 1.392 support level below has held firm after two rounds of testing.
Compared with BTC’s +5.70%, XRP’s relative strength is leading; such assets are usually rebound vanguards.
In the short term, the bias is bullish.
【Bullish Rationale】
Pushed from 1.392 to around 1.503, the short-term center of gravity is still moving higher.
In the 24-hour rally of 6.48%, the intraday high at 1.514 has been tested repeatedly, indicating that overhead pressure is being digested.
A fast rise also implies a fast pullback—so keeping a bit of room in position sizing feels better than going all-in.
If it holds above 1.392, the next target is 1.514; a breakdown below 1.392 means the structure has deteriorated.
$XRP #XRP
【See Rise】
XRP is currently trading at 1.503, up 6.48% over the past 24 hours. Its 7-day gain is 2.66%. The intraday range is 1.392–1.514, with a volatility of 8.8%.
【Market View】
In the last few 4-hour candles, the center of gravity has been steadily rising, showing fairly clear signs of bullish control.
The 1.392 support level below has held firm after two rounds of testing.
Compared with BTC’s +5.70%, XRP’s relative strength is leading; such assets are usually rebound vanguards.
In the short term, the bias is bullish.
【Bullish Rationale】
Pushed from 1.392 to around 1.503, the short-term center of gravity is still moving higher.
In the 24-hour rally of 6.48%, the intraday high at 1.514 has been tested repeatedly, indicating that overhead pressure is being digested.
A fast rise also implies a fast pullback—so keeping a bit of room in position sizing feels better than going all-in.
If it holds above 1.392, the next target is 1.514; a breakdown below 1.392 means the structure has deteriorated.
$XRP #XRP
XRP is currently trading at 1.503, up 6.48% over the past 24 hours. Its 7-day gain is 2.66%. The intraday range is 1.392–1.514, with a volatility of 8.8%.
【Market View】
In the last few 4-hour candles, the center of gravity has been steadily rising, showing fairly clear signs of bullish control.
The 1.392 support level below has held firm after two rounds of testing.
Compared with BTC’s +5.70%, XRP’s relative strength is leading; such assets are usually rebound vanguards.
In the short term, the bias is bullish.
【Bullish Rationale】
Pushed from 1.392 to around 1.503, the short-term center of gravity is still moving higher.
In the 24-hour rally of 6.48%, the intraday high at 1.514 has been tested repeatedly, indicating that overhead pressure is being digested.
A fast rise also implies a fast pullback—so keeping a bit of room in position sizing feels better than going all-in.
If it holds above 1.392, the next target is 1.514; a breakdown below 1.392 means the structure has deteriorated.
$XRP #XRP
499
·
--
【See Rise】
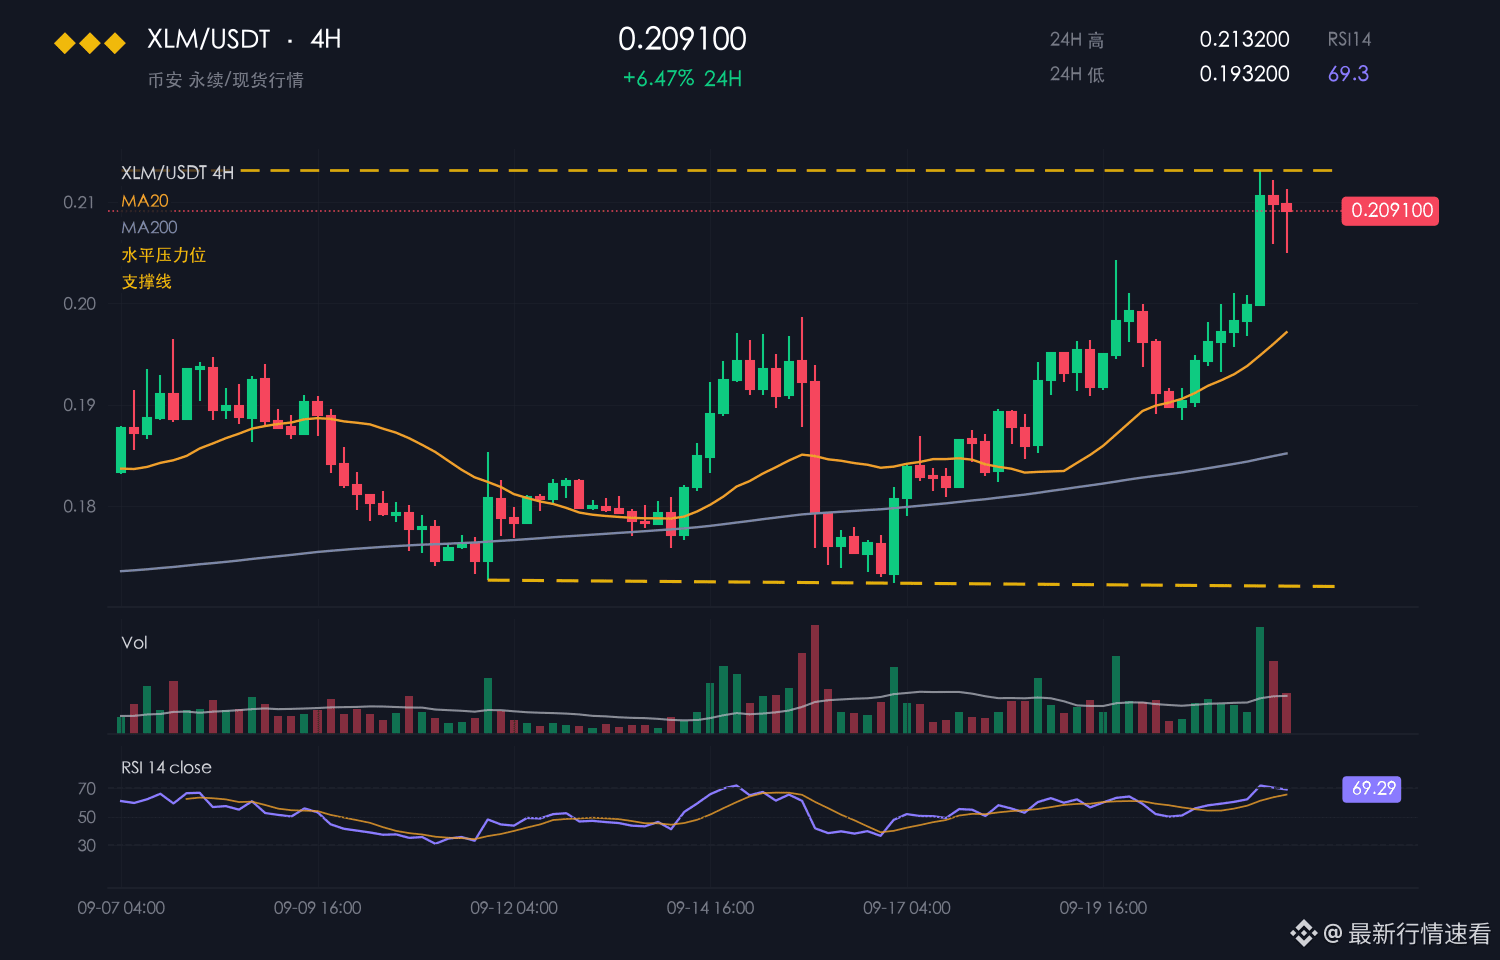
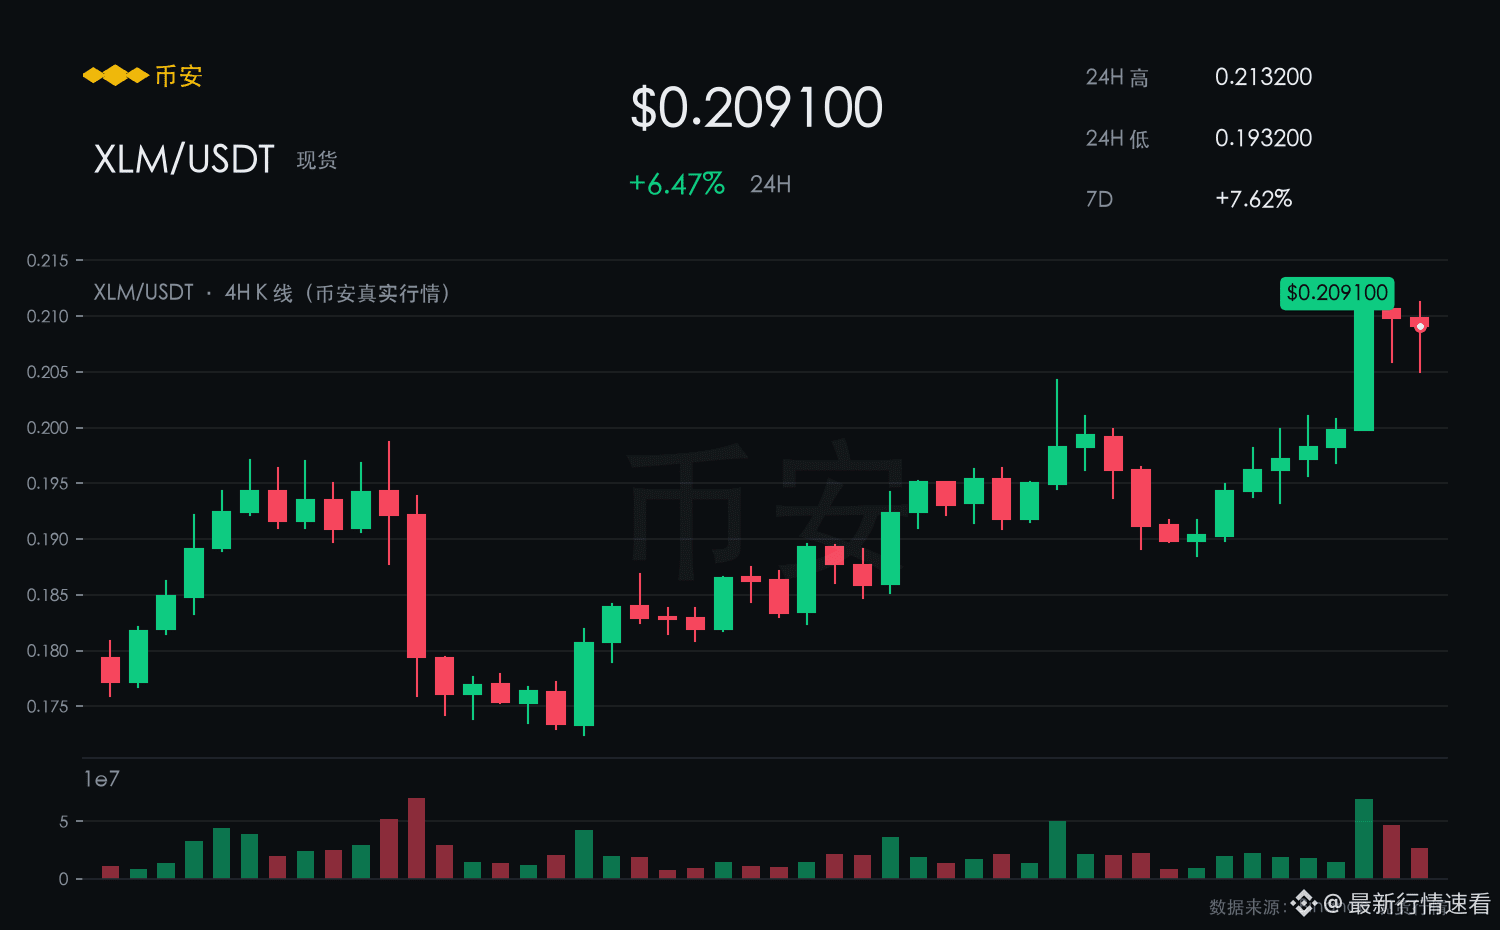
XLM is currently quoted at 0.2091, up 6.41% over the past 24 hours, with a 7-day increase of 7.62%. The intraday range is 0.1932–0.2132, and the amplitude is 10.4%.
【Market Snapshot】
Over the past 24 hours, the red market has hovered near 0.2091, with near-term buy orders showing relatively strong initiative.
The 0.1932 area is the breakout point for this leg higher; a pullback to this level offers a decent value.
Meanwhile, the broader market is only up +5.70%, and XLM’s +6.41% represents outperformance.
In the near term, the outlook is bullish.
【Reasons for Bullish View】
The 7-day gain of 7.62% and the 24-hour rise of 6.41% point in the same direction—short-term momentum and the medium-term trend are not in conflict.
The 0.2132 line has been tested repeatedly, and the bulls have not shown any sign of backing off for now.
Keep an eye on the broader market: if it turns and pulls back, the higher-position holdings in XLM could loosen at any time.
Near-term resistance is at 0.2132—break and pass it with higher volume, and you can follow along. 0.1932 is the bullish defense level for this move.
$XLM #XLM
【See Rise】
XLM is currently quoted at 0.2091, up 6.41% over the past 24 hours, with a 7-day increase of 7.62%. The intraday range is 0.1932–0.2132, and the amplitude is 10.4%.
【Market Snapshot】
Over the past 24 hours, the red market has hovered near 0.2091, with near-term buy orders showing relatively strong initiative.
The 0.1932 area is the breakout point for this leg higher; a pullback to this level offers a decent value.
Meanwhile, the broader market is only up +5.70%, and XLM’s +6.41% represents outperformance.
In the near term, the outlook is bullish.
【Reasons for Bullish View】
The 7-day gain of 7.62% and the 24-hour rise of 6.41% point in the same direction—short-term momentum and the medium-term trend are not in conflict.
The 0.2132 line has been tested repeatedly, and the bulls have not shown any sign of backing off for now.
Keep an eye on the broader market: if it turns and pulls back, the higher-position holdings in XLM could loosen at any time.
Near-term resistance is at 0.2132—break and pass it with higher volume, and you can follow along. 0.1932 is the bullish defense level for this move.
$XLM #XLM
XLM is currently quoted at 0.2091, up 6.41% over the past 24 hours, with a 7-day increase of 7.62%. The intraday range is 0.1932–0.2132, and the amplitude is 10.4%.
【Market Snapshot】
Over the past 24 hours, the red market has hovered near 0.2091, with near-term buy orders showing relatively strong initiative.
The 0.1932 area is the breakout point for this leg higher; a pullback to this level offers a decent value.
Meanwhile, the broader market is only up +5.70%, and XLM’s +6.41% represents outperformance.
In the near term, the outlook is bullish.
【Reasons for Bullish View】
The 7-day gain of 7.62% and the 24-hour rise of 6.41% point in the same direction—short-term momentum and the medium-term trend are not in conflict.
The 0.2132 line has been tested repeatedly, and the bulls have not shown any sign of backing off for now.
Keep an eye on the broader market: if it turns and pulls back, the higher-position holdings in XLM could loosen at any time.
Near-term resistance is at 0.2132—break and pass it with higher volume, and you can follow along. 0.1932 is the bullish defense level for this move.
$XLM #XLM
41
·
--
【See Rise】
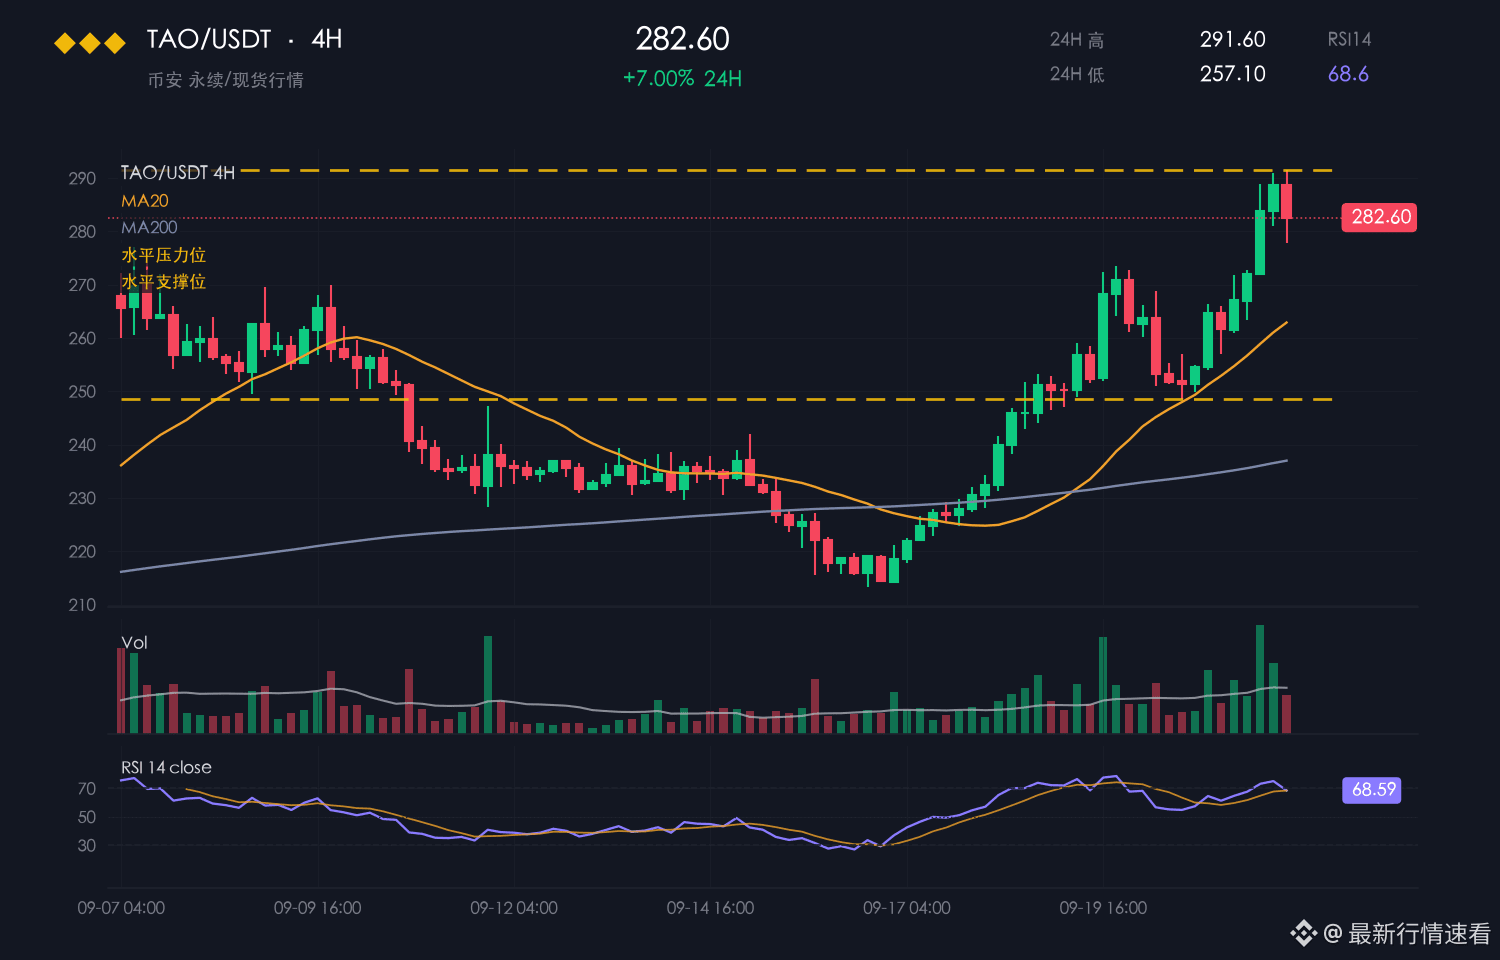
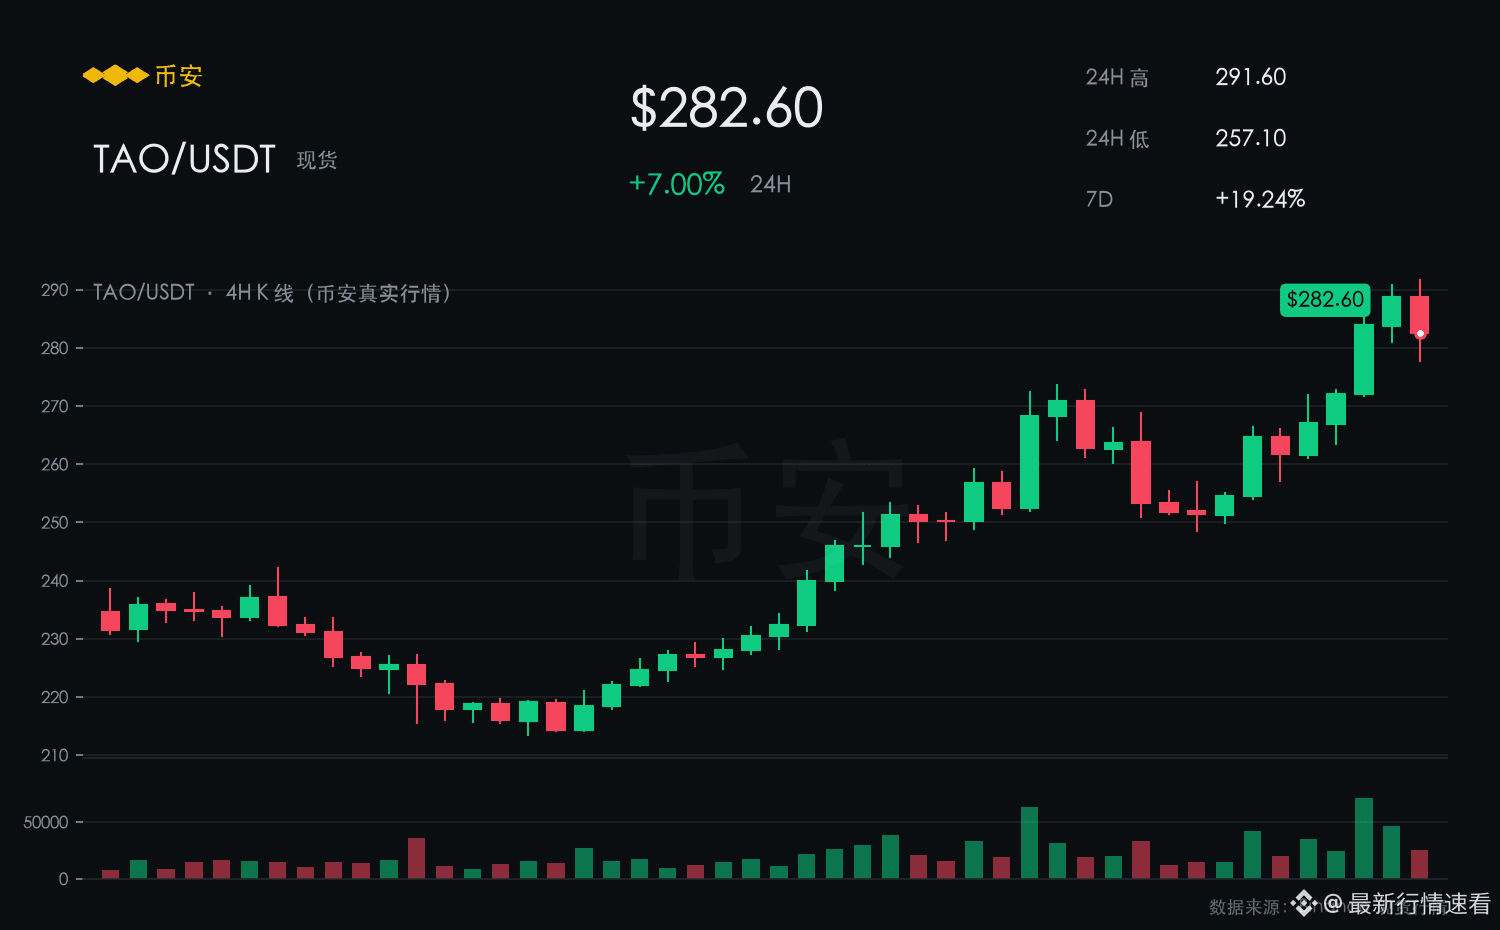
TAO is currently quoted at 282.60; in the past 24 hours it is up 7.00%. Over the past 7 days, it is up 19.24%. The intraday range is 257.10–291.60, with a volatility of 13.4%.
【Market View】
In the recent several 4-hour candlesticks, the focal level has been steadily rising, suggesting fairly clear signs that the bulls are controlling the market.
The support at 257.10 has held up after two rounds of tests.
During the same period, BTC is up +5.70% over 24 hours, while TAO’s +7.00% clearly outperforms the market; capital shows a stronger preference.
In the short term, it is biased bullish.
【Bullish Rationale】
A single-day gain of 7.00% is right here—short-term bulls are in the dominant position.
The structure above 257.10 hasn’t turned bad; 291.60 is the next resistance level to break through.
The rebound pace is a bit fast, so the risk of wick spikes should not be ignored. It’s more prudent to wait for a pullback and confirmation before taking action.
First, expect a move toward the intraday high of 291.60. After an effective breakout, it can open up new space; if it fails to hold 257.10, it turns into a wait-and-see.
$TAO #TAO
【See Rise】
TAO is currently quoted at 282.60; in the past 24 hours it is up 7.00%. Over the past 7 days, it is up 19.24%. The intraday range is 257.10–291.60, with a volatility of 13.4%.
【Market View】
In the recent several 4-hour candlesticks, the focal level has been steadily rising, suggesting fairly clear signs that the bulls are controlling the market.
The support at 257.10 has held up after two rounds of tests.
During the same period, BTC is up +5.70% over 24 hours, while TAO’s +7.00% clearly outperforms the market; capital shows a stronger preference.
In the short term, it is biased bullish.
【Bullish Rationale】
A single-day gain of 7.00% is right here—short-term bulls are in the dominant position.
The structure above 257.10 hasn’t turned bad; 291.60 is the next resistance level to break through.
The rebound pace is a bit fast, so the risk of wick spikes should not be ignored. It’s more prudent to wait for a pullback and confirmation before taking action.
First, expect a move toward the intraday high of 291.60. After an effective breakout, it can open up new space; if it fails to hold 257.10, it turns into a wait-and-see.
$TAO #TAO
TAO is currently quoted at 282.60; in the past 24 hours it is up 7.00%. Over the past 7 days, it is up 19.24%. The intraday range is 257.10–291.60, with a volatility of 13.4%.
【Market View】
In the recent several 4-hour candlesticks, the focal level has been steadily rising, suggesting fairly clear signs that the bulls are controlling the market.
The support at 257.10 has held up after two rounds of tests.
During the same period, BTC is up +5.70% over 24 hours, while TAO’s +7.00% clearly outperforms the market; capital shows a stronger preference.
In the short term, it is biased bullish.
【Bullish Rationale】
A single-day gain of 7.00% is right here—short-term bulls are in the dominant position.
The structure above 257.10 hasn’t turned bad; 291.60 is the next resistance level to break through.
The rebound pace is a bit fast, so the risk of wick spikes should not be ignored. It’s more prudent to wait for a pullback and confirmation before taking action.
First, expect a move toward the intraday high of 291.60. After an effective breakout, it can open up new space; if it fails to hold 257.10, it turns into a wait-and-see.
$TAO #TAO
10
·
--
【See Rise】
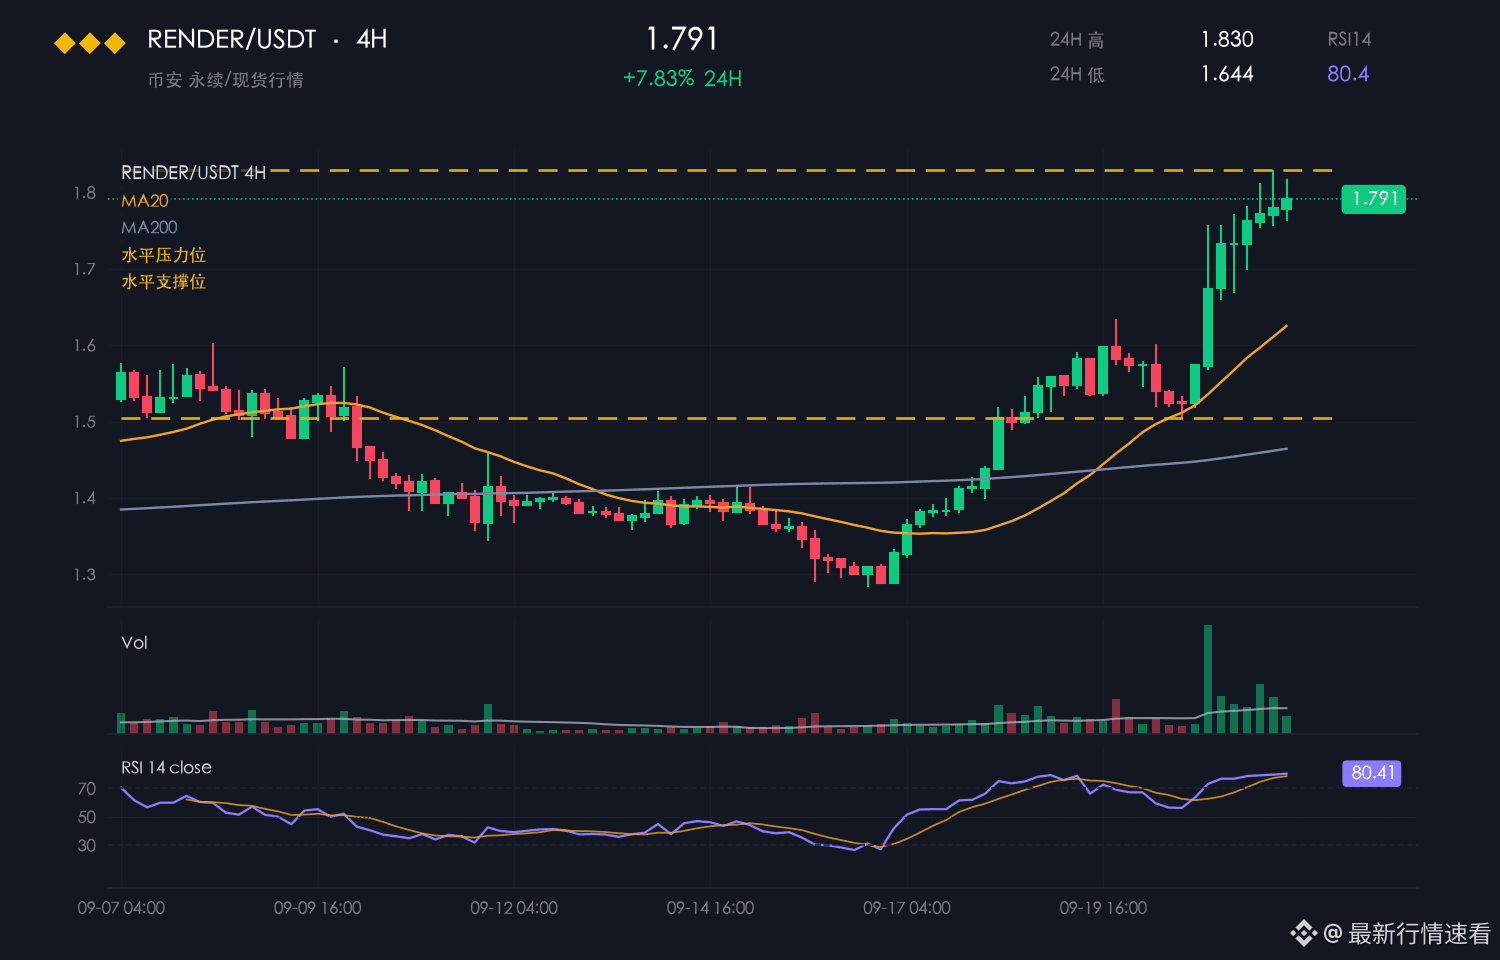
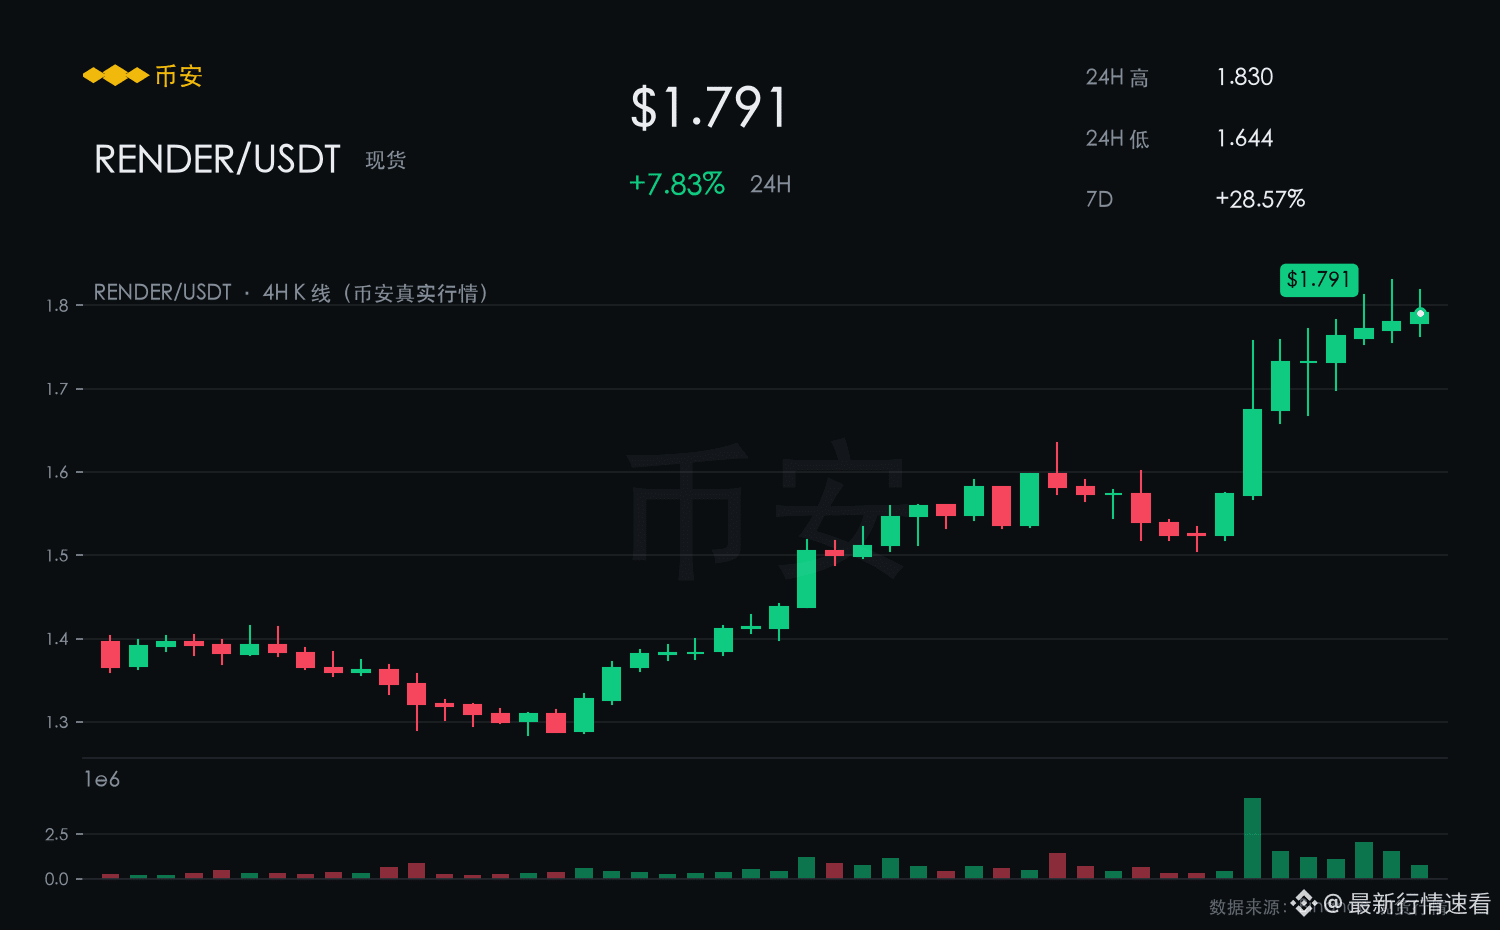
RENDER is reporting at 1.791, up 7.83% over the past 24 hours. The 7-day increase is 28.57%. Intraday range: 1.644–1.830, with a volatility of 11.3%.
【Market View】
In the recent several 4-hour candlesticks, the center of gravity has been steadily rising, with fairly clear signs of bullish control.
The 1.644 area is the launch point of this round of the uptrend; buying the pullback to this level offers decent value.
When you compare BTC’s +5.70%, RENDER is clearly stronger than the market’s average level.
In the short term, the outlook leans bullish.
【Bullish Reasons】
The 7-day move of 28.57% has already opened up significant upside room, and this rally is backed by support at the weekly level.
Pullbacks have been met with follow-through, and the push upward comes with volume—this kind of pace is more sustainable than a one-way surge.
Fast gains also imply fast pullbacks, so keeping a bit of room rather than going all-in feels more comfortable.
If it holds above 1.644, the next target is 1.830. If it breaks below 1.644, it means the structure has turned bad.
$RENDER #RENDER
【See Rise】
RENDER is reporting at 1.791, up 7.83% over the past 24 hours. The 7-day increase is 28.57%. Intraday range: 1.644–1.830, with a volatility of 11.3%.
【Market View】
In the recent several 4-hour candlesticks, the center of gravity has been steadily rising, with fairly clear signs of bullish control.
The 1.644 area is the launch point of this round of the uptrend; buying the pullback to this level offers decent value.
When you compare BTC’s +5.70%, RENDER is clearly stronger than the market’s average level.
In the short term, the outlook leans bullish.
【Bullish Reasons】
The 7-day move of 28.57% has already opened up significant upside room, and this rally is backed by support at the weekly level.
Pullbacks have been met with follow-through, and the push upward comes with volume—this kind of pace is more sustainable than a one-way surge.
Fast gains also imply fast pullbacks, so keeping a bit of room rather than going all-in feels more comfortable.
If it holds above 1.644, the next target is 1.830. If it breaks below 1.644, it means the structure has turned bad.
$RENDER #RENDER
RENDER is reporting at 1.791, up 7.83% over the past 24 hours. The 7-day increase is 28.57%. Intraday range: 1.644–1.830, with a volatility of 11.3%.
【Market View】
In the recent several 4-hour candlesticks, the center of gravity has been steadily rising, with fairly clear signs of bullish control.
The 1.644 area is the launch point of this round of the uptrend; buying the pullback to this level offers decent value.
When you compare BTC’s +5.70%, RENDER is clearly stronger than the market’s average level.
In the short term, the outlook leans bullish.
【Bullish Reasons】
The 7-day move of 28.57% has already opened up significant upside room, and this rally is backed by support at the weekly level.
Pullbacks have been met with follow-through, and the push upward comes with volume—this kind of pace is more sustainable than a one-way surge.
Fast gains also imply fast pullbacks, so keeping a bit of room rather than going all-in feels more comfortable.
If it holds above 1.644, the next target is 1.830. If it breaks below 1.644, it means the structure has turned bad.
$RENDER #RENDER
1
2
Log in to explore more content
Join global crypto users on Binance Square
⚡️ Get latest and useful information about crypto.
💬 Trusted by the world’s largest crypto exchange.
👍 Discover real insights from verified creators.
Email / Phone number
Trending Topics
NEARRisesNearly80%InAWeek
32,510 views
794 Discussing
#nearrisesnearly80%inaweek
🚨 NEAR RALLIES NEARLY 80% IN ONE WEEK
NEAR Protocol’s native token has delivered a major weekly move, gaining roughly 78% over the past seven days and trading around $4.29 on September 21, according to reported CoinGecko data.
📊 WHAT’S DRIVING THE ATTENTION?
• NEAR climbed from roughly $2.20 to above $4.20 within about a week
• NEAR Intents cumulative volume is approaching $30B
• Recent activity around confidential perpetual-futures trading has added another major narrative around the ecosystem
• NEAR’s weekly performance has significantly outpaced the broader crypto market, which gained around 6% over the same period
🔎 WHY IT MATTERS
The rally puts renewed focus on NEAR’s cross-chain liquidity infrastructure, Intents ecosystem and privacy-focused trading developments.
But after such a rapid move, volatility and profit-taking are also important risks to watch. A strong weekly gain does not guarantee that momentum will continue.
📌 WATCH NEXT
Traders may be watching whether NEAR can maintain the recent breakout and whether network activity continues to support the market narrative.
NEAR’s price move is strong — but the next test is whether ecosystem activity can keep pace with the speculation.
$MUBARAK $PHA $NIL
顾清妍
·2 Likes
·1.7k views
MultiversXPlansHardForkRecovery
29,201 views
609 Discussing
CircleLaunchesInstitutionalBTCBackedBorrowing
28,389 views
712 Discussing