
#hk0700
hk0700
10,404 views
72 Discussing
Hot
Latest

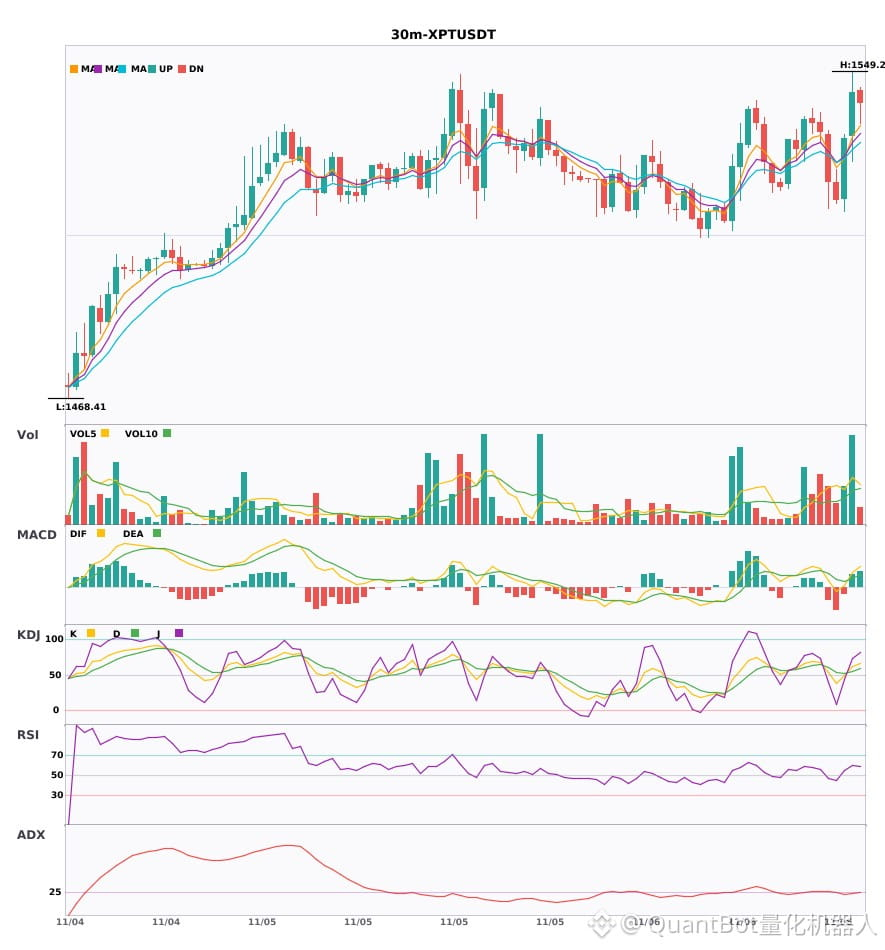
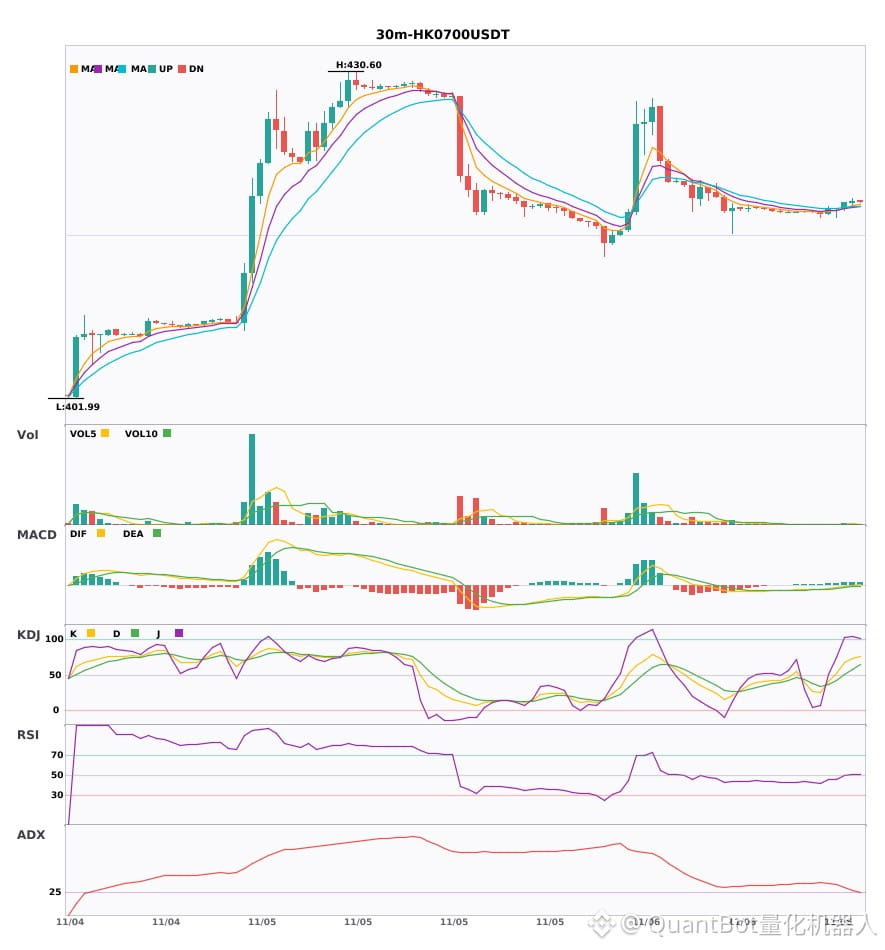
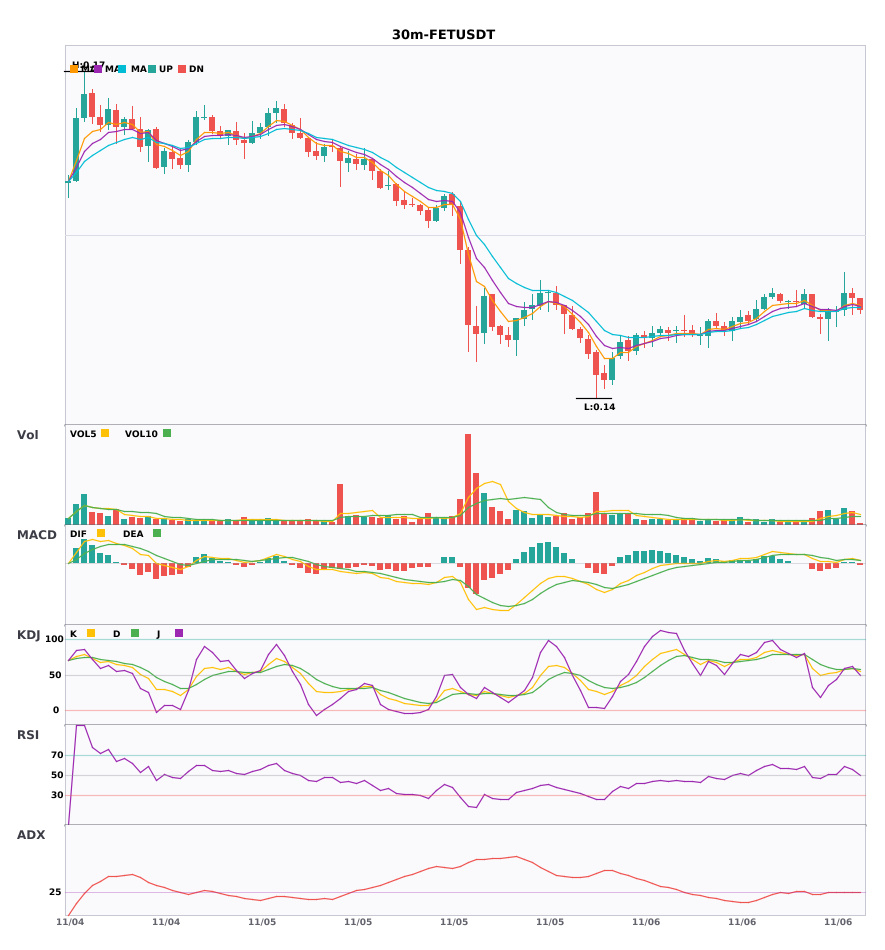
$XPT / $HK0700 / $FET 30-minute technical indicators are strengthening in sync—which has greater breakout potential?
📈 $XPT | 30-minute Bullish Signal
━━━━━━━━━━━━━━━━━━
Technical Analysis: ADX(26) Trend is forming; opportunity to participate | MACD golden cross above zero, bullish momentum released | EMA5 crossed above EMA8, short-term outlook turns bullish | KDJ golden cross, short-term bullish outlook (K: 61.4, D: 55.3) | Volume surge (2.6x)
Price Change: 0.7400%
📈 $HK0700 | 30-minute Bullish Signal
━━━━━━━━━━━━━━━━━━
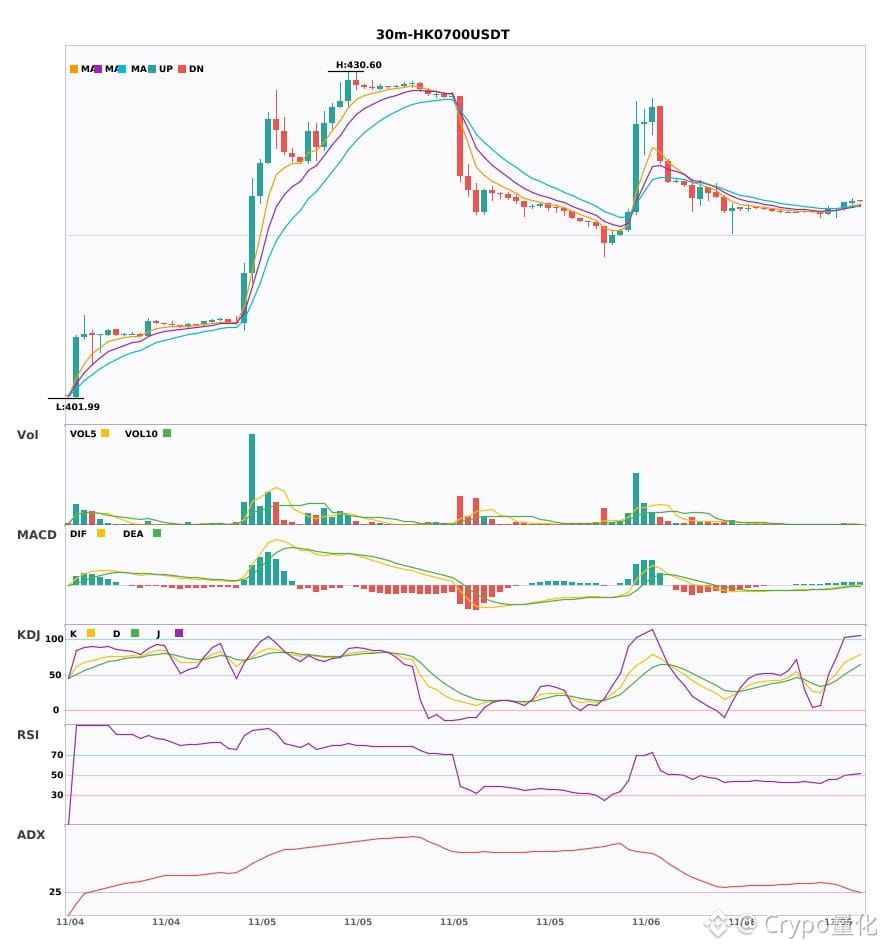
Technical Analysis: ADX(29) Trend is forming; opportunity to participate | MACD DIF breaks above the zero line, trend turns bullish | Moving averages converge as momentum builds; direction likely to be chosen soon | KDJ running strong, bulls in control (K: 73.4, D: 58.0) | Volume surge (4.3x)
Price Change: 0.0300%
📈 $FET | 30-minute Bullish Signal
━━━━━━━━━━━━━━━━━━
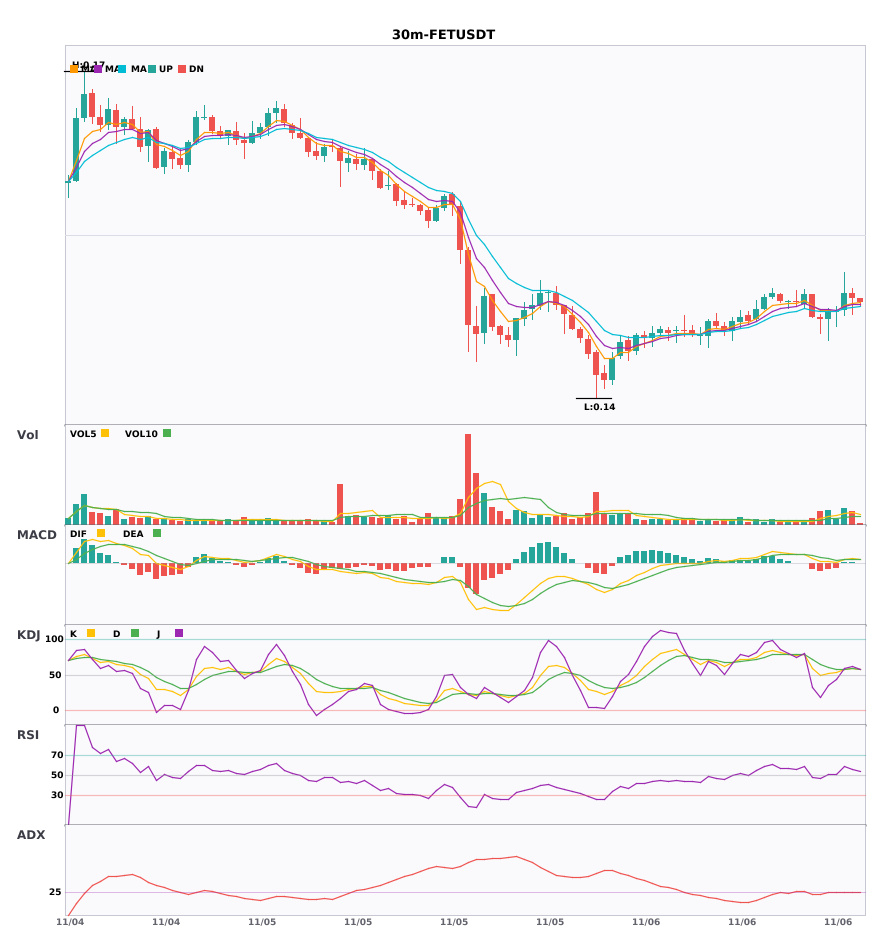
Technical Analysis: ADX(28) Trend is forming; opportunity to participate | MACD golden cross above zero, bullish momentum released | EMA5 crossed above EMA8, short-term outlook turns bullish | KDJ golden cross, short-term bullish outlook (K: 58.4, D: 58.0) | Volume increase (2.2x)
Price Change: 0.9400%
━━━━━━━━━━━━━━━━━━
#技术分析 #XPT #HK0700 #FET
📌 The above content is for reference only and does not constitute investment advice
$XPT / $HK0700 / $FET 30-minute technical indicators are strengthening in sync—which has greater breakout potential?
📈 $XPT | 30-minute Bullish Signal
━━━━━━━━━━━━━━━━━━
Technical Analysis: ADX(26) Trend is forming; opportunity to participate | MACD golden cross above zero, bullish momentum released | EMA5 crossed above EMA8, short-term outlook turns bullish | KDJ golden cross, short-term bullish outlook (K: 61.4, D: 55.3) | Volume surge (2.6x)
Price Change: 0.7400%
📈 $HK0700 | 30-minute Bullish Signal
━━━━━━━━━━━━━━━━━━
Technical Analysis: ADX(29) Trend is forming; opportunity to participate | MACD DIF breaks above the zero line, trend turns bullish | Moving averages converge as momentum builds; direction likely to be chosen soon | KDJ running strong, bulls in control (K: 73.4, D: 58.0) | Volume surge (4.3x)
Price Change: 0.0300%
📈 $FET | 30-minute Bullish Signal
━━━━━━━━━━━━━━━━━━
Technical Analysis: ADX(28) Trend is forming; opportunity to participate | MACD golden cross above zero, bullish momentum released | EMA5 crossed above EMA8, short-term outlook turns bullish | KDJ golden cross, short-term bullish outlook (K: 58.4, D: 58.0) | Volume increase (2.2x)
Price Change: 0.9400%
━━━━━━━━━━━━━━━━━━
#技术分析 #XPT #HK0700 #FET
📌 The above content is for reference only and does not constitute investment advice
📈 $XPT | 30-minute Bullish Signal
━━━━━━━━━━━━━━━━━━
Technical Analysis: ADX(26) Trend is forming; opportunity to participate | MACD golden cross above zero, bullish momentum released | EMA5 crossed above EMA8, short-term outlook turns bullish | KDJ golden cross, short-term bullish outlook (K: 61.4, D: 55.3) | Volume surge (2.6x)
Price Change: 0.7400%
📈 $HK0700 | 30-minute Bullish Signal
━━━━━━━━━━━━━━━━━━
Technical Analysis: ADX(29) Trend is forming; opportunity to participate | MACD DIF breaks above the zero line, trend turns bullish | Moving averages converge as momentum builds; direction likely to be chosen soon | KDJ running strong, bulls in control (K: 73.4, D: 58.0) | Volume surge (4.3x)
Price Change: 0.0300%
📈 $FET | 30-minute Bullish Signal
━━━━━━━━━━━━━━━━━━
Technical Analysis: ADX(28) Trend is forming; opportunity to participate | MACD golden cross above zero, bullish momentum released | EMA5 crossed above EMA8, short-term outlook turns bullish | KDJ golden cross, short-term bullish outlook (K: 58.4, D: 58.0) | Volume increase (2.2x)
Price Change: 0.9400%
━━━━━━━━━━━━━━━━━━
#技术分析 #XPT #HK0700 #FET
📌 The above content is for reference only and does not constitute investment advice
41

·
--
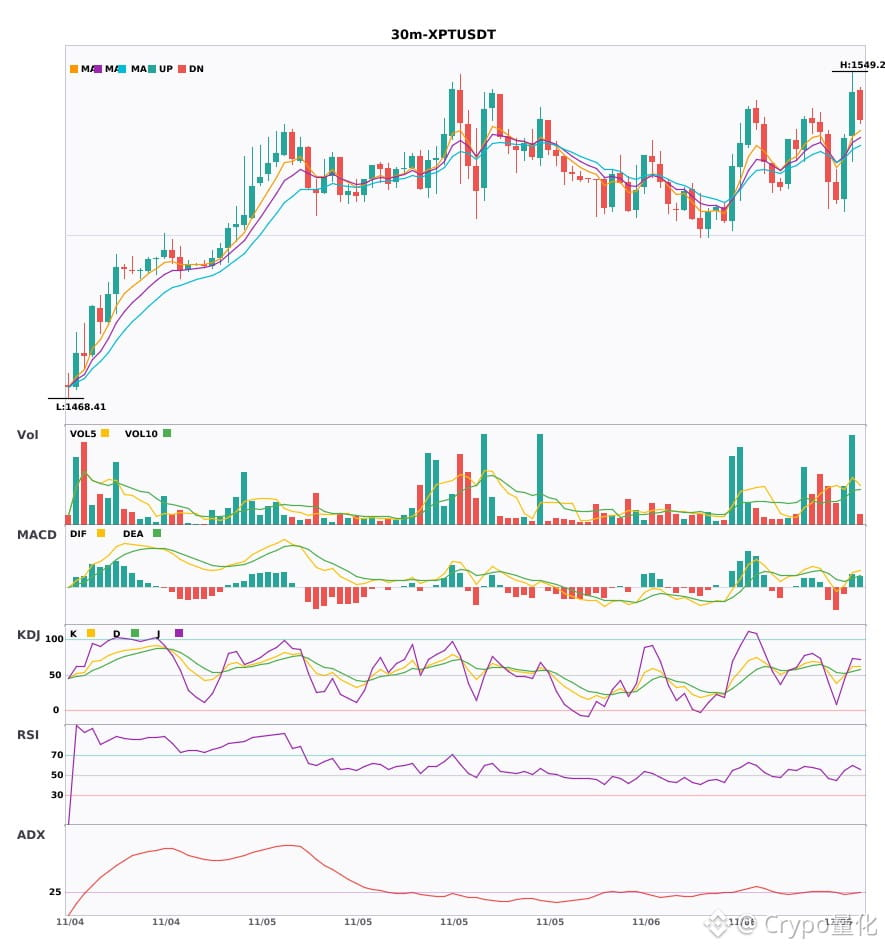
$XPT / $HK0700 / $FET 30-minute confluence turning bullish; bullish signals appearing simultaneously🔥
════════════════════
🔴 $XPT 30-minute bullish signal
⚠️Technical analysis: ADX(26): Trend is forming; entry possible | MACD golden cross above zero; bullish momentum released | EMA5 crossed above EMA8; short-term outlook turns bullish | KDJ golden cross; short-term outlook bullish (K: 61.4, D: 55.3) | Volume surge (2.6x)
════════════════════
🔴 $HK0700 30-minute bullish signal
⚠️Technical analysis: ADX(29): Trend is forming; entry possible | MACD DIF broke above the zero line; trend turns bullish | Moving averages are converging and building momentum; direction to be chosen soon | KDJ running strongly; bulls have the advantage (K: 73.4, D: 58.0) | Volume surge (4.3x)
════════════════════
🔴 $FET 30-minute bullish signal
⚠️Technical analysis: ADX(28): Trend is forming; entry possible | MACD golden cross above zero; bullish momentum released | EMA5 crossed above EMA8; short-term outlook turns bullish | KDJ golden cross; short-term outlook bullish (K: 58.4, D: 58.0) | Volume increase (2.2x)
════════════════════
🔔 Follow for first-hand updates on unusual market movements 🔔
#技术分析 #XPT #HK0700 #FET
📌 When trading, pay attention to whether the candlestick pattern confirms the move
$XPT / $HK0700 / $FET 30-minute confluence turning bullish; bullish signals appearing simultaneously🔥
════════════════════
🔴 $XPT 30-minute bullish signal
⚠️Technical analysis: ADX(26): Trend is forming; entry possible | MACD golden cross above zero; bullish momentum released | EMA5 crossed above EMA8; short-term outlook turns bullish | KDJ golden cross; short-term outlook bullish (K: 61.4, D: 55.3) | Volume surge (2.6x)
════════════════════
🔴 $HK0700 30-minute bullish signal
⚠️Technical analysis: ADX(29): Trend is forming; entry possible | MACD DIF broke above the zero line; trend turns bullish | Moving averages are converging and building momentum; direction to be chosen soon | KDJ running strongly; bulls have the advantage (K: 73.4, D: 58.0) | Volume surge (4.3x)
════════════════════
🔴 $FET 30-minute bullish signal
⚠️Technical analysis: ADX(28): Trend is forming; entry possible | MACD golden cross above zero; bullish momentum released | EMA5 crossed above EMA8; short-term outlook turns bullish | KDJ golden cross; short-term outlook bullish (K: 58.4, D: 58.0) | Volume increase (2.2x)
════════════════════
🔔 Follow for first-hand updates on unusual market movements 🔔
#技术分析 #XPT #HK0700 #FET
📌 When trading, pay attention to whether the candlestick pattern confirms the move
════════════════════
🔴 $XPT 30-minute bullish signal
⚠️Technical analysis: ADX(26): Trend is forming; entry possible | MACD golden cross above zero; bullish momentum released | EMA5 crossed above EMA8; short-term outlook turns bullish | KDJ golden cross; short-term outlook bullish (K: 61.4, D: 55.3) | Volume surge (2.6x)
════════════════════
🔴 $HK0700 30-minute bullish signal
⚠️Technical analysis: ADX(29): Trend is forming; entry possible | MACD DIF broke above the zero line; trend turns bullish | Moving averages are converging and building momentum; direction to be chosen soon | KDJ running strongly; bulls have the advantage (K: 73.4, D: 58.0) | Volume surge (4.3x)
════════════════════
🔴 $FET 30-minute bullish signal
⚠️Technical analysis: ADX(28): Trend is forming; entry possible | MACD golden cross above zero; bullish momentum released | EMA5 crossed above EMA8; short-term outlook turns bullish | KDJ golden cross; short-term outlook bullish (K: 58.4, D: 58.0) | Volume increase (2.2x)
════════════════════
🔔 Follow for first-hand updates on unusual market movements 🔔
#技术分析 #XPT #HK0700 #FET
📌 When trading, pay attention to whether the candlestick pattern confirms the move
12

·
--
$HK0700 / $TENCENT 30-minute bullish + 4-hour bullish in the same direction; multi-timeframe resonance turns bullish 🔥
════════════════════
🔴 $HK0700 30-minute bullish signal
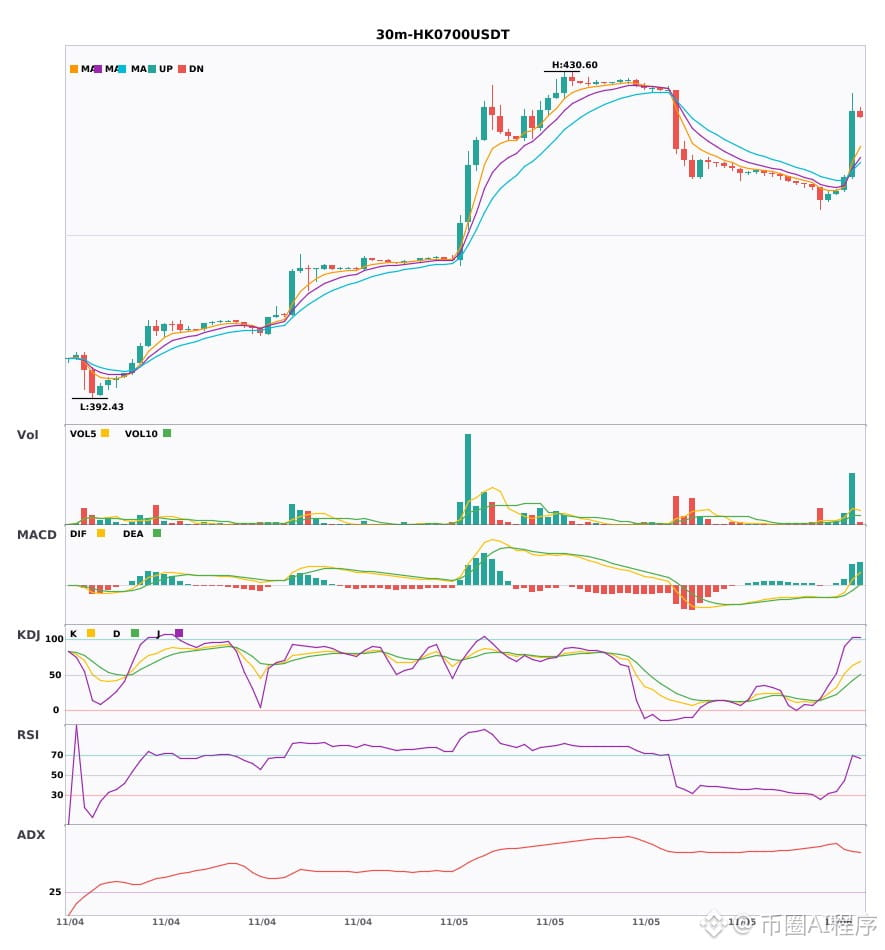
⚠️Technical analysis: 4-hour bullish resonance confirmed | 30-minute entry: MACD DIF breaks above zero, trend turns bullish | EMA5 crosses above EMA8, short-term outlook turns bullish | Volume surge (5.5x)
════════════════════
🔴 $TENCENT 30-minute bullish signal
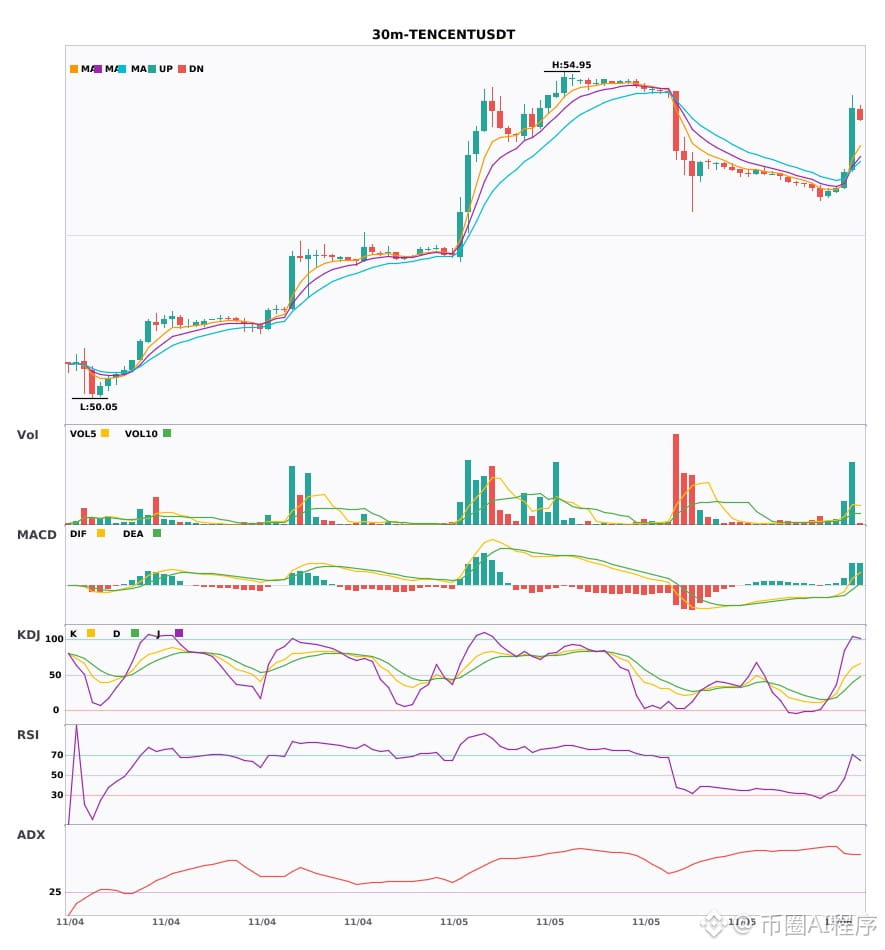
⚠️Technical analysis: 4-hour bullish resonance confirmed | 30-minute entry: MACD DIF breaks above zero, trend turns bullish | EMA5 crosses above EMA8, short-term outlook turns bullish | Volume surge (5.3x)
════════════════════
🔔 Follow for first-hand market alerts 🔔
#多周期共振 #HK0700 #TENCENT
📌 When trading, pay attention to whether the candlestick patterns align
$HK0700 / $TENCENT 30-minute bullish + 4-hour bullish in the same direction; multi-timeframe resonance turns bullish 🔥
════════════════════
🔴 $HK0700 30-minute bullish signal
⚠️Technical analysis: 4-hour bullish resonance confirmed | 30-minute entry: MACD DIF breaks above zero, trend turns bullish | EMA5 crosses above EMA8, short-term outlook turns bullish | Volume surge (5.5x)
════════════════════
🔴 $TENCENT 30-minute bullish signal
⚠️Technical analysis: 4-hour bullish resonance confirmed | 30-minute entry: MACD DIF breaks above zero, trend turns bullish | EMA5 crosses above EMA8, short-term outlook turns bullish | Volume surge (5.3x)
════════════════════
🔔 Follow for first-hand market alerts 🔔
#多周期共振 #HK0700 #TENCENT
📌 When trading, pay attention to whether the candlestick patterns align
════════════════════
🔴 $HK0700 30-minute bullish signal
⚠️Technical analysis: 4-hour bullish resonance confirmed | 30-minute entry: MACD DIF breaks above zero, trend turns bullish | EMA5 crosses above EMA8, short-term outlook turns bullish | Volume surge (5.5x)
════════════════════
🔴 $TENCENT 30-minute bullish signal
⚠️Technical analysis: 4-hour bullish resonance confirmed | 30-minute entry: MACD DIF breaks above zero, trend turns bullish | EMA5 crosses above EMA8, short-term outlook turns bullish | Volume surge (5.3x)
════════════════════
🔔 Follow for first-hand market alerts 🔔
#多周期共振 #HK0700 #TENCENT
📌 When trading, pay attention to whether the candlestick patterns align
15
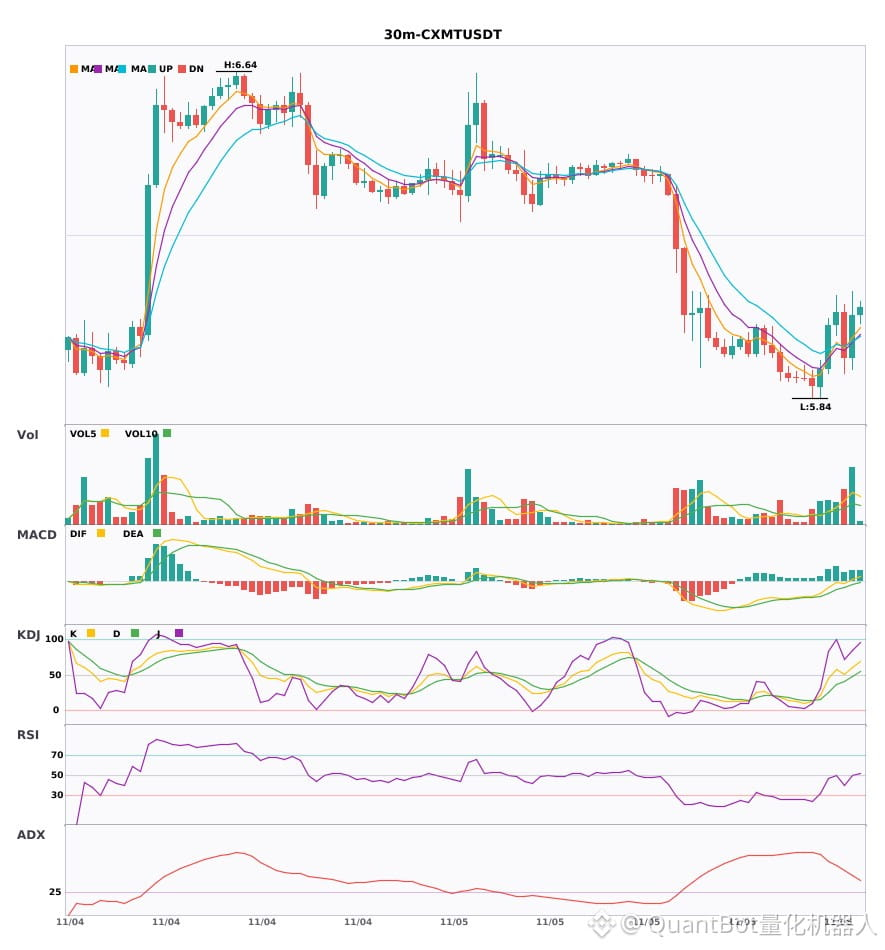
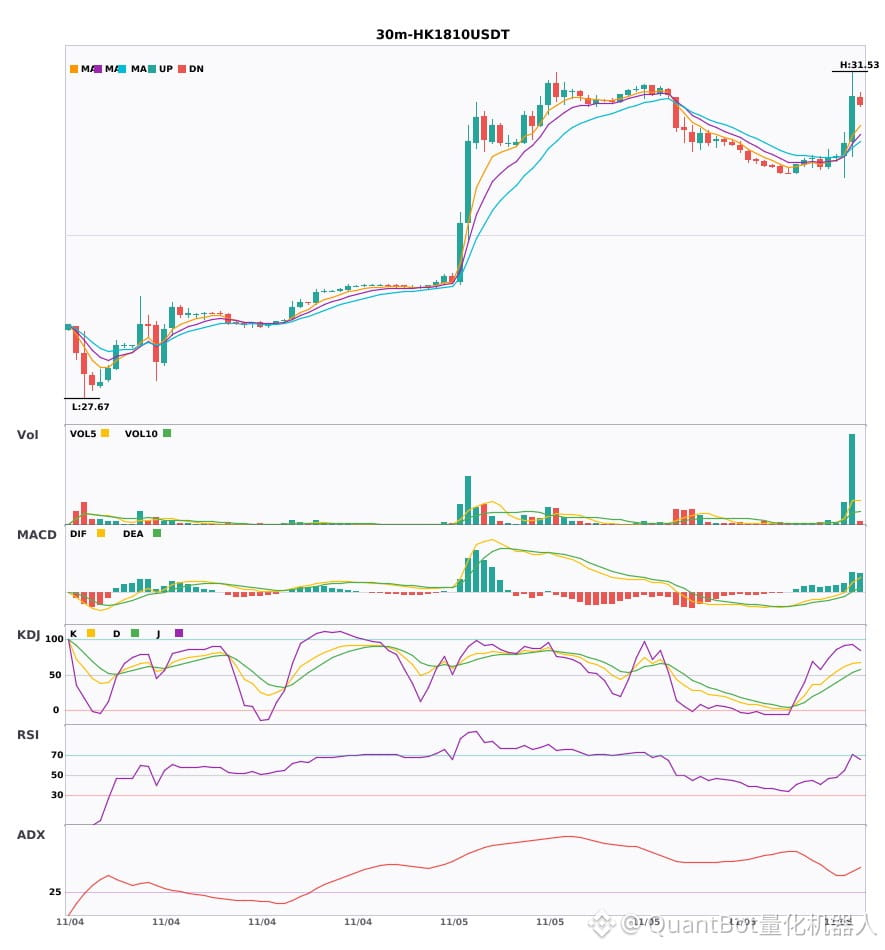
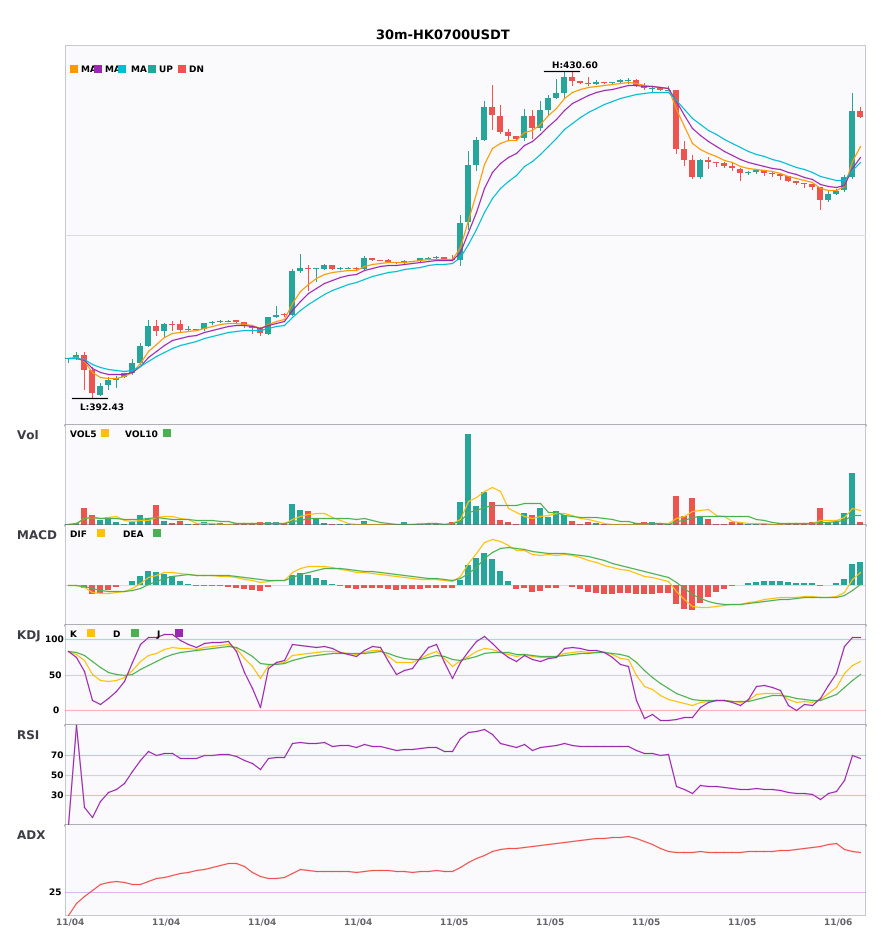
$CXMT / $HK1810 / $HK0700 30-minute technical indicators are strengthening in sync. Which has more explosive potential?
📈 $CXMT | 30-minute bullish signal
━━━━━━━━━━━━━━━━━━
Technical analysis: ADX(42): clear trending market | MACD DIF broke above the zero line, turning the trend bullish | Moving averages are converging, building momentum; a breakout direction is imminent | Volume surge (2.7x)
Price change: 1.7700%
📈 $HK1810 | 30-minute bullish signal
━━━━━━━━━━━━━━━━━━
Technical analysis: ADX(46): very strong trend (watch for an overheated pullback) | MACD DIF broke above the zero line, turning the trend bullish | Moving averages are converging, building momentum; a breakout direction is imminent | Volume surge (5.6x)
Price change: 0.4900%
📈 $HK0700 | 30-minute bullish signal
━━━━━━━━━━━━━━━━━━
Technical analysis: ADX(73): very strong trend (watch for an overheated pullback) | MACD DIF broke above the zero line, turning the trend bullish | EMA5 crossed above EMA8, turning bullish in the short term | Volume surge (5.5x)
Price change: 1.8300%
━━━━━━━━━━━━━━━━━━
#技术分析 #CXMT #HK1810 #HK0700
📌 The above content is for reference only and does not constitute investment advice
$CXMT / $HK1810 / $HK0700 30-minute technical indicators are strengthening in sync. Which has more explosive potential?
📈 $CXMT | 30-minute bullish signal
━━━━━━━━━━━━━━━━━━
Technical analysis: ADX(42): clear trending market | MACD DIF broke above the zero line, turning the trend bullish | Moving averages are converging, building momentum; a breakout direction is imminent | Volume surge (2.7x)
Price change: 1.7700%
📈 $HK1810 | 30-minute bullish signal
━━━━━━━━━━━━━━━━━━
Technical analysis: ADX(46): very strong trend (watch for an overheated pullback) | MACD DIF broke above the zero line, turning the trend bullish | Moving averages are converging, building momentum; a breakout direction is imminent | Volume surge (5.6x)
Price change: 0.4900%
📈 $HK0700 | 30-minute bullish signal
━━━━━━━━━━━━━━━━━━
Technical analysis: ADX(73): very strong trend (watch for an overheated pullback) | MACD DIF broke above the zero line, turning the trend bullish | EMA5 crossed above EMA8, turning bullish in the short term | Volume surge (5.5x)
Price change: 1.8300%
━━━━━━━━━━━━━━━━━━
#技术分析 #CXMT #HK1810 #HK0700
📌 The above content is for reference only and does not constitute investment advice
📈 $CXMT | 30-minute bullish signal
━━━━━━━━━━━━━━━━━━
Technical analysis: ADX(42): clear trending market | MACD DIF broke above the zero line, turning the trend bullish | Moving averages are converging, building momentum; a breakout direction is imminent | Volume surge (2.7x)
Price change: 1.7700%
📈 $HK1810 | 30-minute bullish signal
━━━━━━━━━━━━━━━━━━
Technical analysis: ADX(46): very strong trend (watch for an overheated pullback) | MACD DIF broke above the zero line, turning the trend bullish | Moving averages are converging, building momentum; a breakout direction is imminent | Volume surge (5.6x)
Price change: 0.4900%
📈 $HK0700 | 30-minute bullish signal
━━━━━━━━━━━━━━━━━━
Technical analysis: ADX(73): very strong trend (watch for an overheated pullback) | MACD DIF broke above the zero line, turning the trend bullish | EMA5 crossed above EMA8, turning bullish in the short term | Volume surge (5.5x)
Price change: 1.8300%
━━━━━━━━━━━━━━━━━━
#技术分析 #CXMT #HK1810 #HK0700
📌 The above content is for reference only and does not constitute investment advice
18
·
--
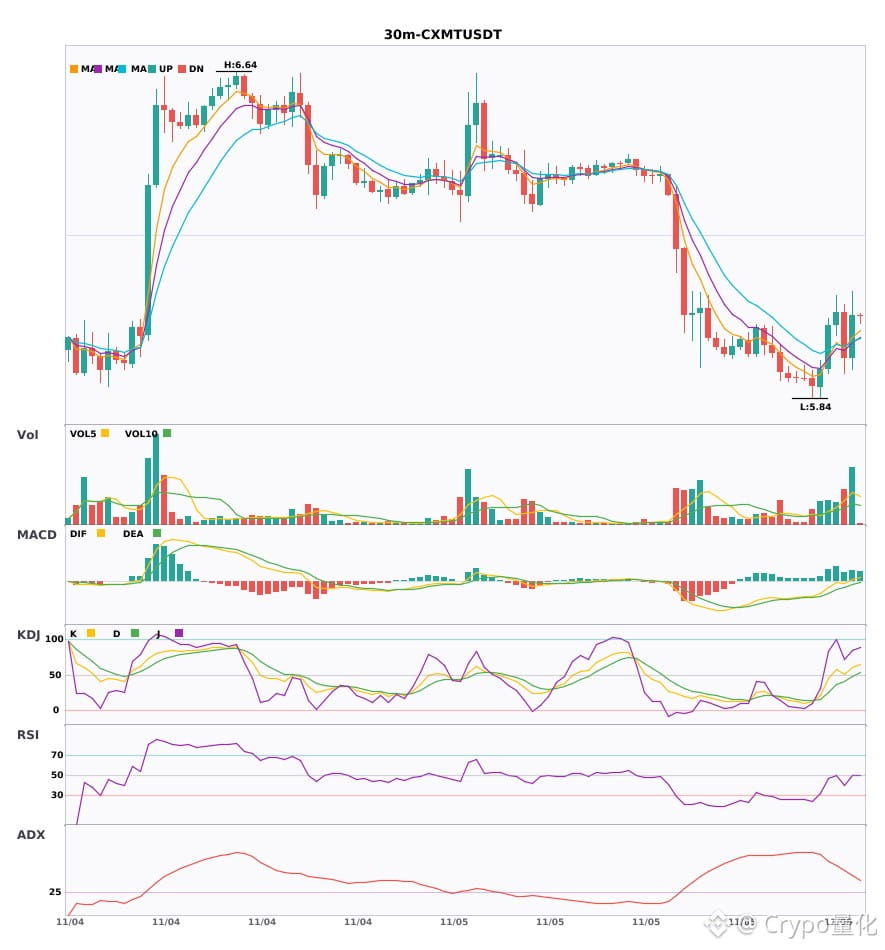
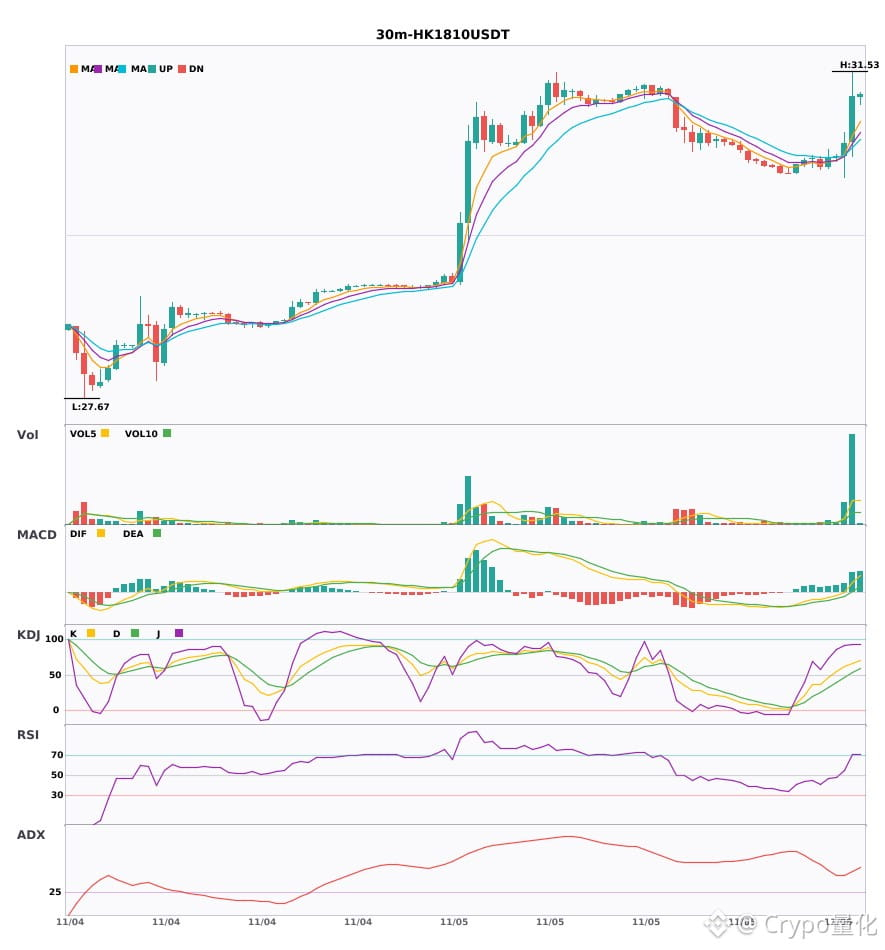
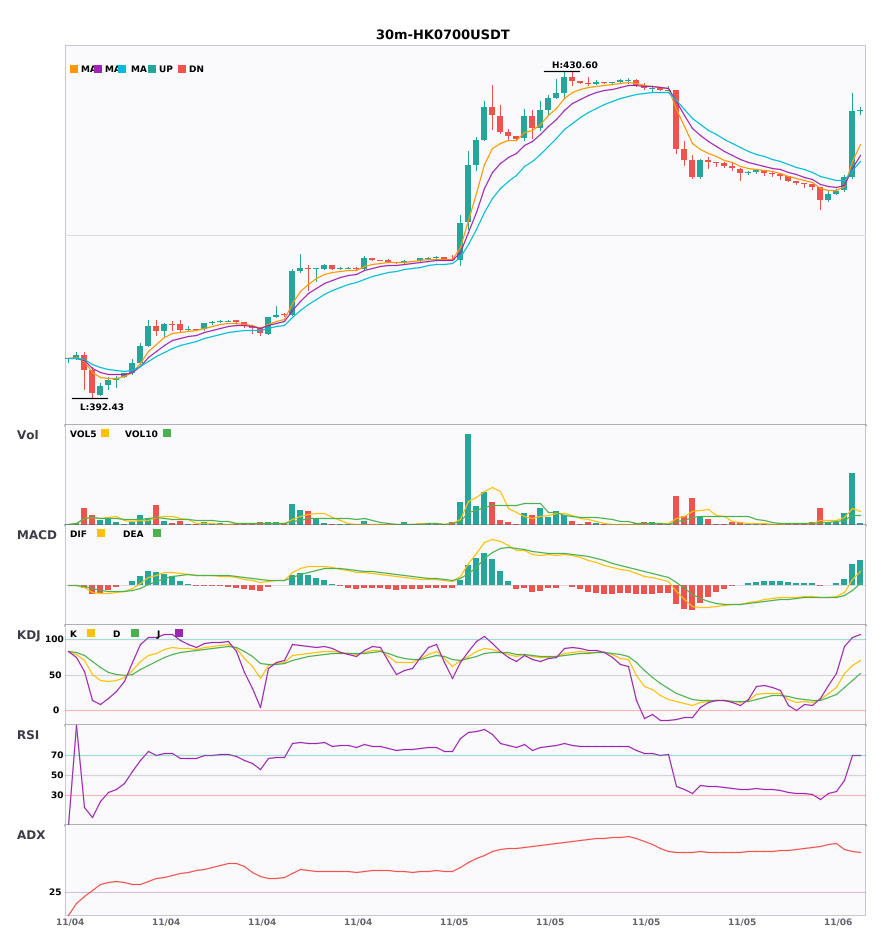
3 simultaneous 30-minute bullish signals: $CXMT / $HK1810 / $HK0700🔥
════════════════════
🔴 $CXMT 30-minute bullish signal
⚠️Technical analysis: ADX(42) indicates a clear trend | MACD DIF breaks above zero, signaling a bullish trend | Moving averages are converging, building up for a move and about to choose a direction | Volume surge (2.7x)
════════════════════
🔴 $HK1810 30-minute bullish signal
⚠️Technical analysis: ADX(46) indicates a very strong trend (beware of an overheated pullback) | MACD DIF breaks above zero, signaling a bullish trend | Moving averages are converging, building up for a move and about to choose a direction | Volume surge (5.6x)
════════════════════
🔴 $HK0700 30-minute bullish signal
⚠️Technical analysis: ADX(73) indicates a very strong trend (beware of an overheated pullback) | MACD DIF breaks above zero, signaling a bullish trend | EMA5 crosses above EMA8, signaling a short-term bullish turn | Volume surge (5.5x)
════════════════════
🔔 Follow us for real-time market alerts 🔔
#技术分析 #CXMT #HK1810 #HK0700
📌 When trading, pay attention to whether the candlestick pattern confirms the signal
3 simultaneous 30-minute bullish signals: $CXMT / $HK1810 / $HK0700 🔥
════════════════════
🔴 $CXMT 30-minute bullish signal
⚠️Technical analysis: ADX(42) indicates a clear trend | MACD DIF breaks above zero, signaling a bullish trend | Moving averages are converging, building up for a move and about to choose a direction | Volume surge (2.7x)
════════════════════
🔴 $HK1810 30-minute bullish signal
⚠️Technical analysis: ADX(46) indicates a very strong trend (beware of an overheated pullback) | MACD DIF breaks above zero, signaling a bullish trend | Moving averages are converging, building up for a move and about to choose a direction | Volume surge (5.6x)
════════════════════
🔴 $HK0700 30-minute bullish signal
⚠️Technical analysis: ADX(73) indicates a very strong trend (beware of an overheated pullback) | MACD DIF breaks above zero, signaling a bullish trend | EMA5 crosses above EMA8, signaling a short-term bullish turn | Volume surge (5.5x)
════════════════════
🔔 Follow us for real-time market alerts 🔔
#技术分析 #CXMT #HK1810 #HK0700
📌 When trading, pay attention to whether the candlestick pattern confirms the signal
════════════════════
🔴 $CXMT 30-minute bullish signal
⚠️Technical analysis: ADX(42) indicates a clear trend | MACD DIF breaks above zero, signaling a bullish trend | Moving averages are converging, building up for a move and about to choose a direction | Volume surge (2.7x)
════════════════════
🔴 $HK1810 30-minute bullish signal
⚠️Technical analysis: ADX(46) indicates a very strong trend (beware of an overheated pullback) | MACD DIF breaks above zero, signaling a bullish trend | Moving averages are converging, building up for a move and about to choose a direction | Volume surge (5.6x)
════════════════════
🔴 $HK0700 30-minute bullish signal
⚠️Technical analysis: ADX(73) indicates a very strong trend (beware of an overheated pullback) | MACD DIF breaks above zero, signaling a bullish trend | EMA5 crosses above EMA8, signaling a short-term bullish turn | Volume surge (5.5x)
════════════════════
🔔 Follow us for real-time market alerts 🔔
#技术分析 #CXMT #HK1810 #HK0700
📌 When trading, pay attention to whether the candlestick pattern confirms the signal
2
·
--
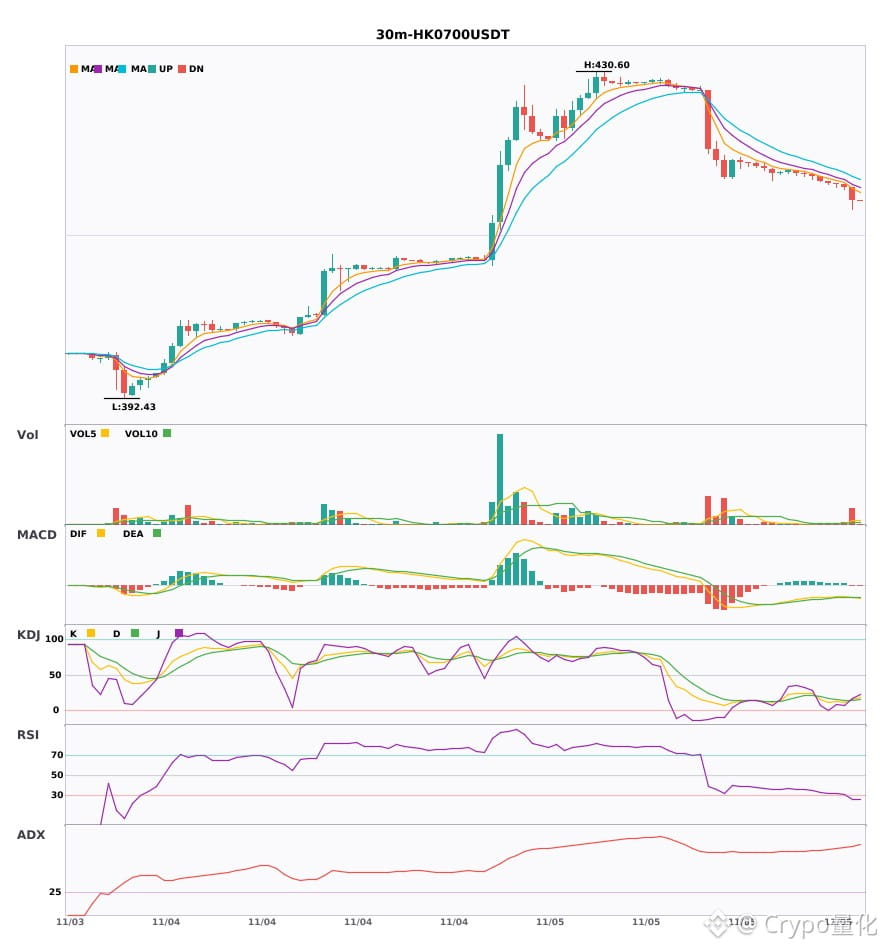
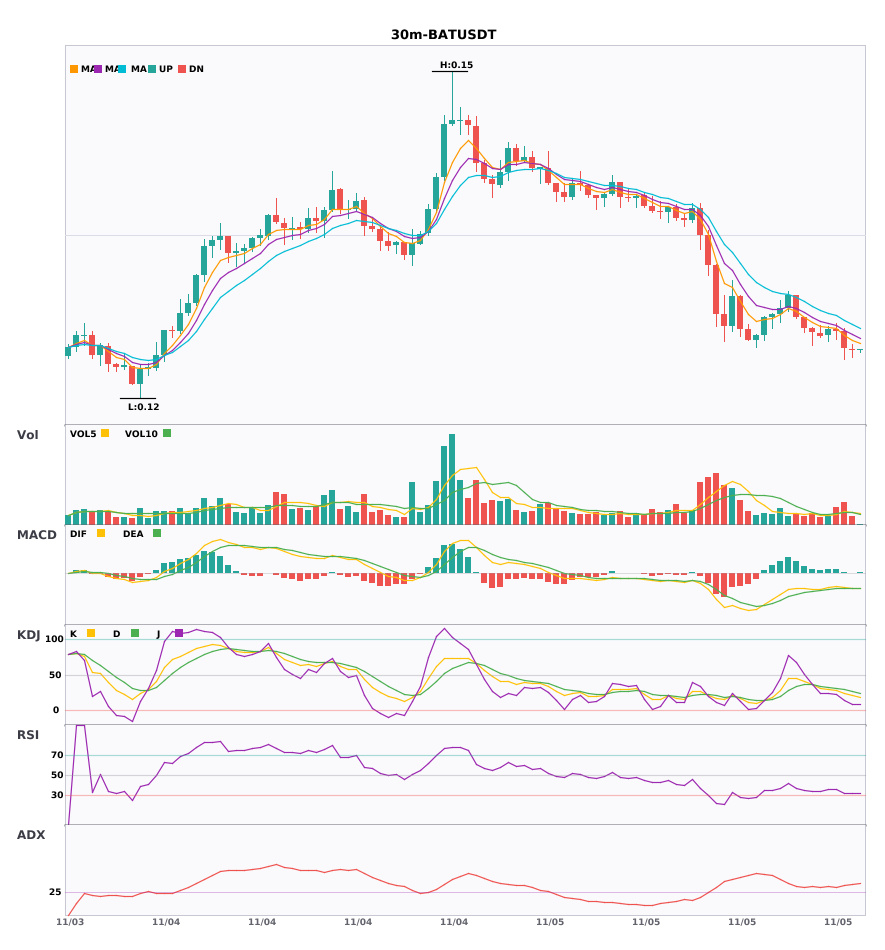
$ENS / $HK0700 / $BAT 30-minute timeframe bearish, under short-term pressure 🔥
════════════════════
🟢 $ENS 30-minute bearish signal
⚠️ Technicals: ADX(53) Very strong trend (watch for overbought pullback) | MACD bearish cross below zero, bearish momentum accelerating | EMA5 < EMA8 < EMA13, bearish alignment | KDJ weak, bears in control (K: 25.2, D: 35.3) | Volume surge (3.8x)
════════════════════
🟢 $HK0700 30-minute bearish signal
⚠️ Technicals: ADX(81) Very strong trend (watch for overbought pullback) | MACD bearish cross below zero, bearish momentum accelerating | EMA5 < EMA8 < EMA13, bearish alignment | KDJ bullish cross, short-term outlook bullish (K: 15.8, D: 14.9) | Volume surge (6.1x)
════════════════════
🟢 $BAT 30-minute bearish signal
⚠️ Technicals: ADX(34) Clear trending market | MACD bearish cross below zero, bearish momentum accelerating | EMA5 < EMA8 < EMA13, bearish alignment | KDJ weak, bears in control (K: 20.6, D: 26.4) | Volume increase (1.8x)
════════════════════
🔔 Follow for first-hand market alerts 🔔
#技术分析 #ENS #HK0700 #BAT
📌 When trading, check whether the candlestick pattern confirms the setup
$ENS / $HK0700 / $BAT 30-minute timeframe bearish, under short-term pressure 🔥
════════════════════
🟢 $ENS 30-minute bearish signal
⚠️ Technicals: ADX(53) Very strong trend (watch for overbought pullback) | MACD bearish cross below zero, bearish momentum accelerating | EMA5 < EMA8 < EMA13, bearish alignment | KDJ weak, bears in control (K: 25.2, D: 35.3) | Volume surge (3.8x)
════════════════════
🟢 $HK0700 30-minute bearish signal
⚠️ Technicals: ADX(81) Very strong trend (watch for overbought pullback) | MACD bearish cross below zero, bearish momentum accelerating | EMA5 < EMA8 < EMA13, bearish alignment | KDJ bullish cross, short-term outlook bullish (K: 15.8, D: 14.9) | Volume surge (6.1x)
════════════════════
🟢 $BAT 30-minute bearish signal
⚠️ Technicals: ADX(34) Clear trending market | MACD bearish cross below zero, bearish momentum accelerating | EMA5 < EMA8 < EMA13, bearish alignment | KDJ weak, bears in control (K: 20.6, D: 26.4) | Volume increase (1.8x)
════════════════════
🔔 Follow for first-hand market alerts 🔔
#技术分析 #ENS #HK0700 #BAT
📌 When trading, check whether the candlestick pattern confirms the setup
════════════════════
🟢 $ENS 30-minute bearish signal
⚠️ Technicals: ADX(53) Very strong trend (watch for overbought pullback) | MACD bearish cross below zero, bearish momentum accelerating | EMA5 < EMA8 < EMA13, bearish alignment | KDJ weak, bears in control (K: 25.2, D: 35.3) | Volume surge (3.8x)
════════════════════
🟢 $HK0700 30-minute bearish signal
⚠️ Technicals: ADX(81) Very strong trend (watch for overbought pullback) | MACD bearish cross below zero, bearish momentum accelerating | EMA5 < EMA8 < EMA13, bearish alignment | KDJ bullish cross, short-term outlook bullish (K: 15.8, D: 14.9) | Volume surge (6.1x)
════════════════════
🟢 $BAT 30-minute bearish signal
⚠️ Technicals: ADX(34) Clear trending market | MACD bearish cross below zero, bearish momentum accelerating | EMA5 < EMA8 < EMA13, bearish alignment | KDJ weak, bears in control (K: 20.6, D: 26.4) | Volume increase (1.8x)
════════════════════
🔔 Follow for first-hand market alerts 🔔
#技术分析 #ENS #HK0700 #BAT
📌 When trading, check whether the candlestick pattern confirms the setup
93
·
--
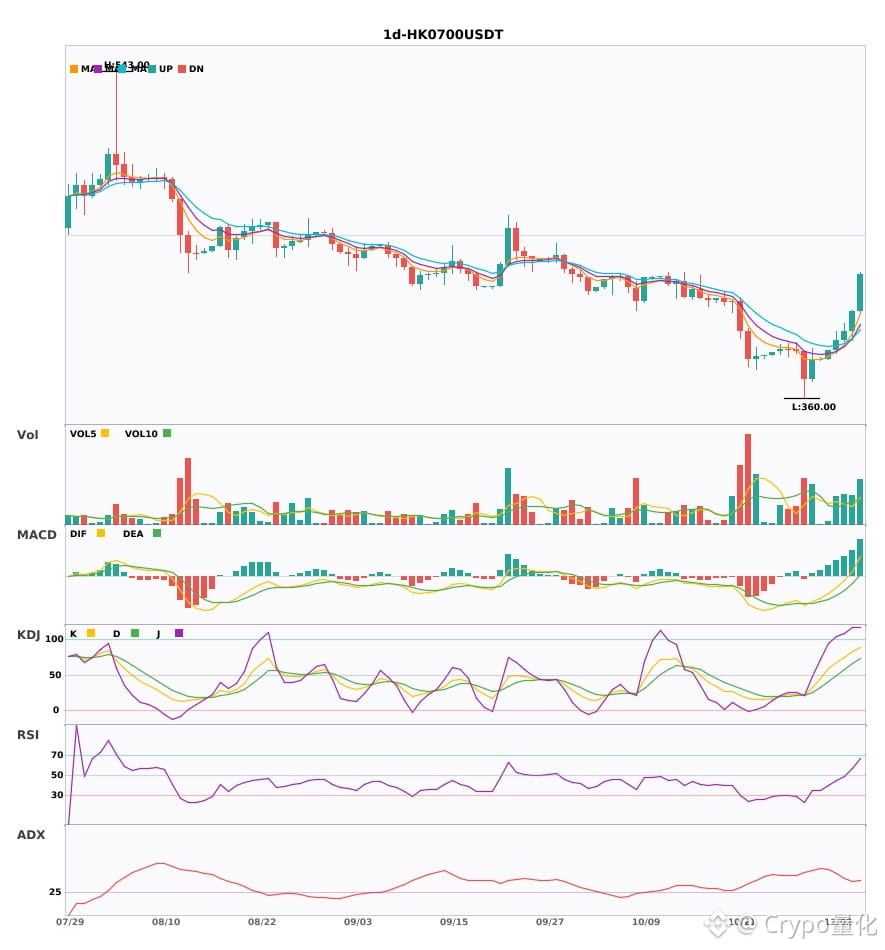
$HK0700 daily chart bullish signal🔥
════════════════════
🔴 $HK0700 daily chart bullish signal
⚠️Technical analysis: ADX (38) indicates a clear trending market | MACD DIF breaks above the zero line, signaling a bullish trend | EMA5 > EMA8 > EMA13, bullish alignment | KDJ is strong, with bulls in control (K: 82.9, D: 66.4) | Volume is normal (1.5x)
════════════════════
🔔 Follow to get first-hand market updates 🔔
#技术分析 #HK0700
📌 When trading, pay attention to whether the candlestick pattern confirms the signal
$HK0700 daily chart bullish signal🔥
════════════════════
🔴 $HK0700 daily chart bullish signal
⚠️Technical analysis: ADX (38) indicates a clear trending market | MACD DIF breaks above the zero line, signaling a bullish trend | EMA5 > EMA8 > EMA13, bullish alignment | KDJ is strong, with bulls in control (K: 82.9, D: 66.4) | Volume is normal (1.5x)
════════════════════
🔔 Follow to get first-hand market updates 🔔
#技术分析 #HK0700
📌 When trading, pay attention to whether the candlestick pattern confirms the signal
════════════════════
🔴 $HK0700 daily chart bullish signal
⚠️Technical analysis: ADX (38) indicates a clear trending market | MACD DIF breaks above the zero line, signaling a bullish trend | EMA5 > EMA8 > EMA13, bullish alignment | KDJ is strong, with bulls in control (K: 82.9, D: 66.4) | Volume is normal (1.5x)
════════════════════
🔔 Follow to get first-hand market updates 🔔
#技术分析 #HK0700
📌 When trading, pay attention to whether the candlestick pattern confirms the signal
2
·
--
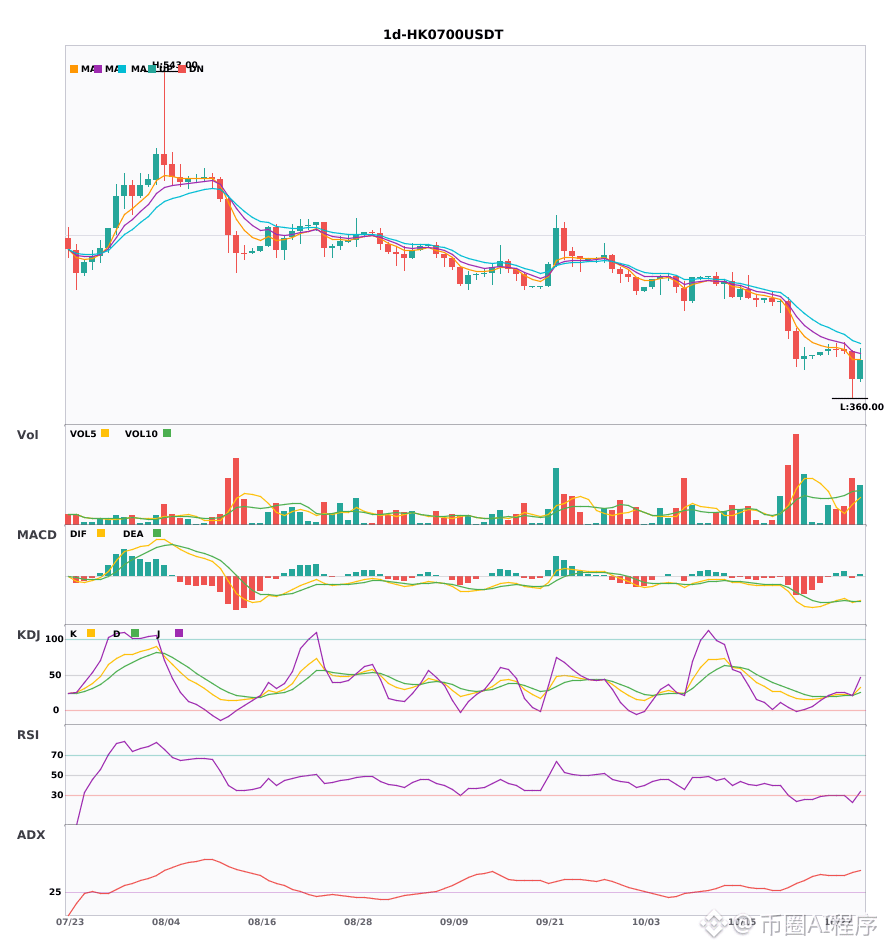
$HK0700 Daily bearish signal + weekly bearish trend confirmed, multi-timeframe confluence turns bearish 🔥
════════════════════
🟢 $HK0700 Daily bearish signal
⚠️Technical analysis: Weekly bearish confluence confirmed | Daily entry: MACD bearish crossover below zero, bearish momentum accelerating | EMA5 < EMA8 < EMA13, bearish alignment | KDJ trending weakly, bears in control (K: 21.3, D: 21.3) | Volume normal (1.4x)
════════════════════
🔔 Follow to get the latest market movements 🔔
#多周期共振 #HK0700
📌 When trading, pay attention to whether the candlestick pattern matches
$HK0700 Daily bearish signal + weekly bearish trend confirmed, multi-timeframe confluence turns bearish 🔥
════════════════════
🟢 $HK0700 Daily bearish signal
⚠️Technical analysis: Weekly bearish confluence confirmed | Daily entry: MACD bearish crossover below zero, bearish momentum accelerating | EMA5 < EMA8 < EMA13, bearish alignment | KDJ trending weakly, bears in control (K: 21.3, D: 21.3) | Volume normal (1.4x)
════════════════════
🔔 Follow to get the latest market movements 🔔
#多周期共振 #HK0700
📌 When trading, pay attention to whether the candlestick pattern matches
════════════════════
🟢 $HK0700 Daily bearish signal
⚠️Technical analysis: Weekly bearish confluence confirmed | Daily entry: MACD bearish crossover below zero, bearish momentum accelerating | EMA5 < EMA8 < EMA13, bearish alignment | KDJ trending weakly, bears in control (K: 21.3, D: 21.3) | Volume normal (1.4x)
════════════════════
🔔 Follow to get the latest market movements 🔔
#多周期共振 #HK0700
📌 When trading, pay attention to whether the candlestick pattern matches
8
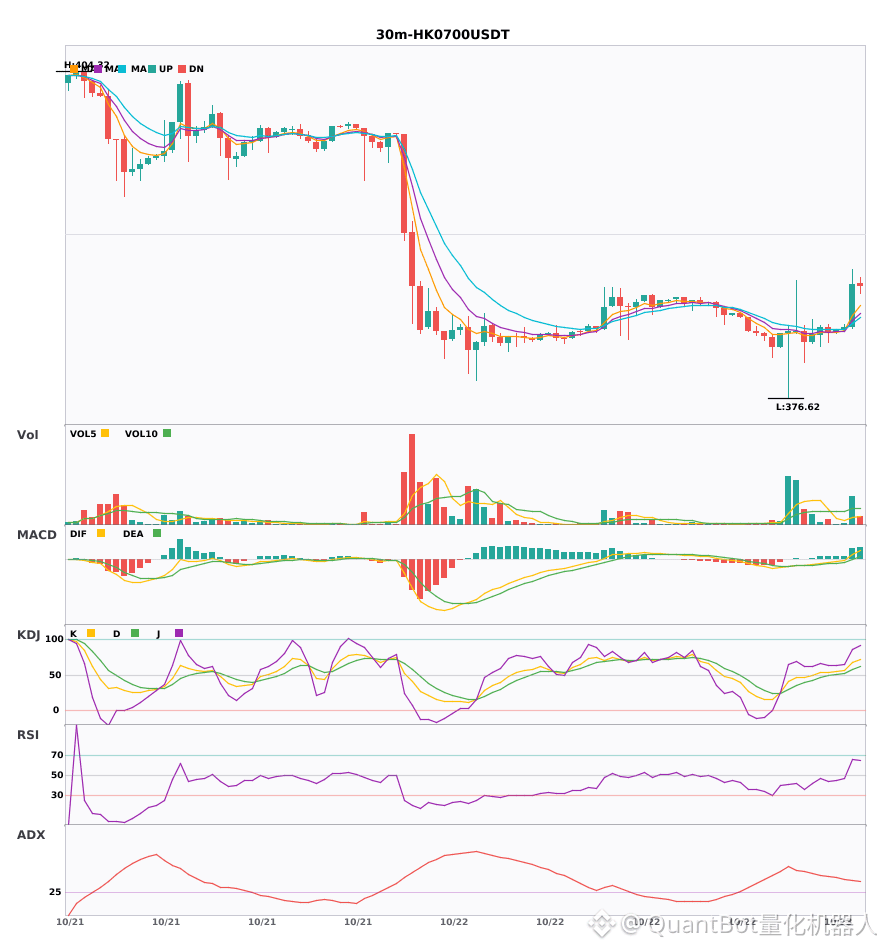
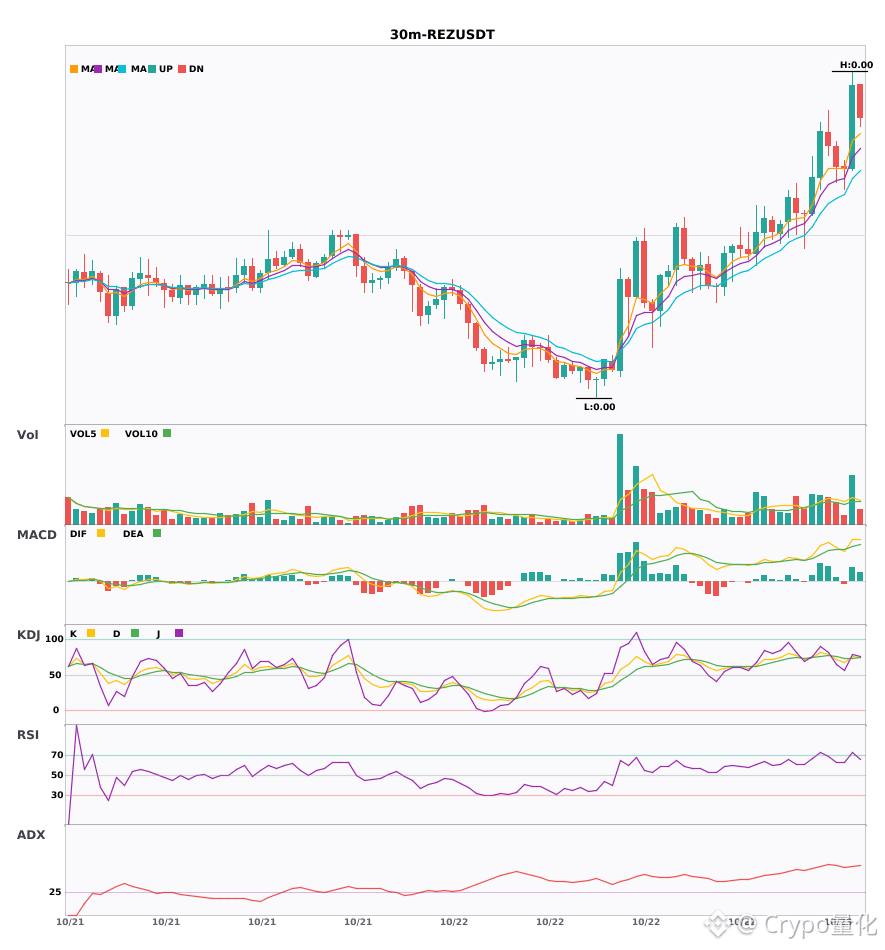
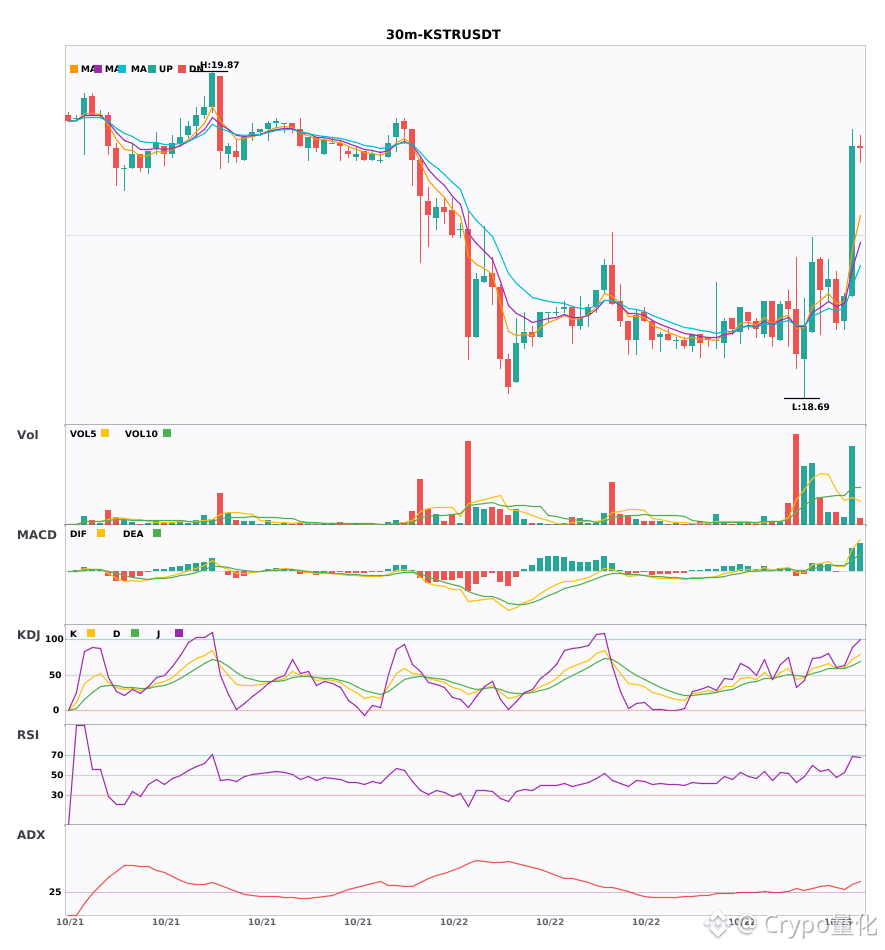
$REZ / $KSTR / $HK0700 30-minute technical indicators are strengthening in sync. Which has greater breakout potential?
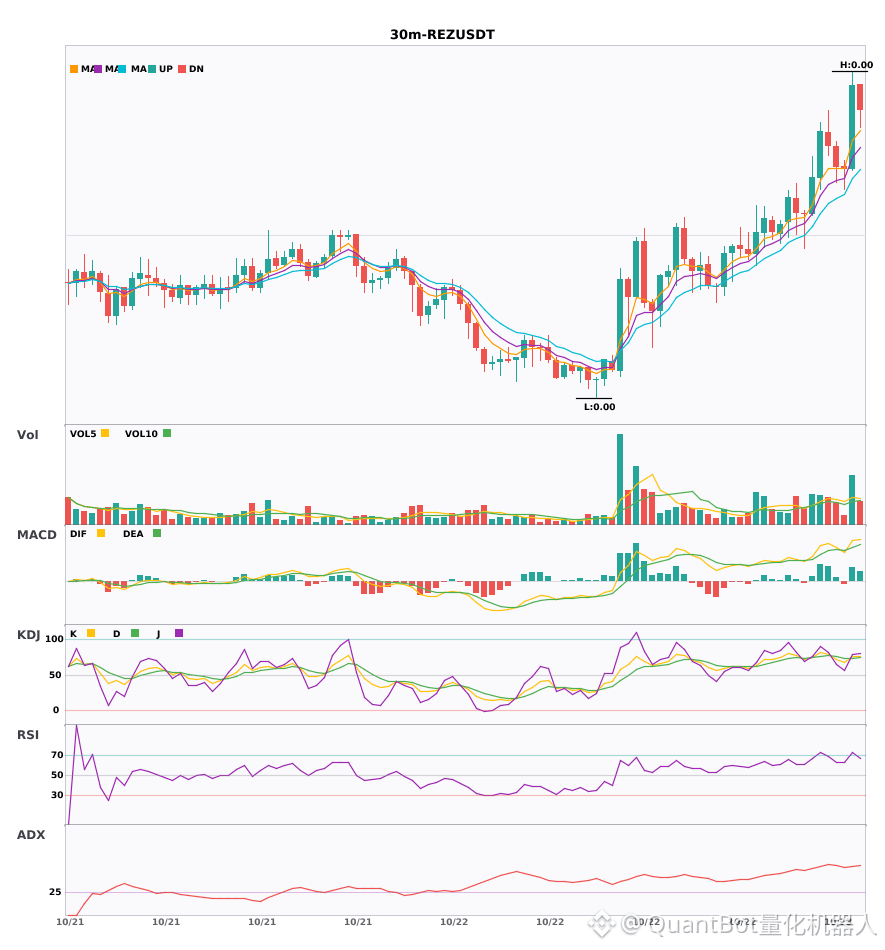
📈 $REZ | 30-minute bullish signal
━━━━━━━━━━━━━━━━━━
Technical analysis: ADX(55) Very strong trend (beware of a potentially overheated pullback) | MACD golden cross above zero, bullish momentum building | EMA5 > EMA8 > EMA13, bullish alignment | KDJ golden cross, bullish in the short term (K: 75.5, D: 73.6) | Volume increased (2.1x)
Price change: 2.9800%
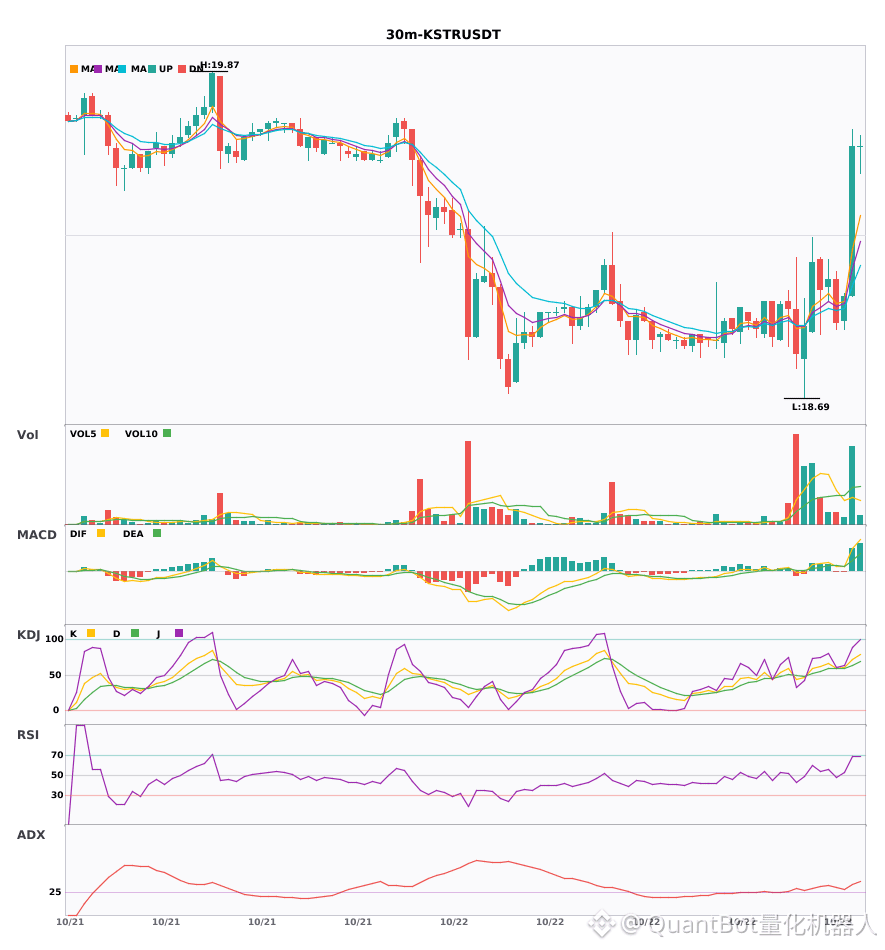
📈 $KSTR | 30-minute bullish signal
━━━━━━━━━━━━━━━━━━
Technical analysis: ADX(35) Clear trending market | MACD golden cross above zero, bullish momentum building | EMA5 > EMA8 > EMA13, bullish alignment | KDJ showing strength, bulls in control (K: 71.8, D: 63.6) | Volume increased (2.1x)
Price change: 2.8300%
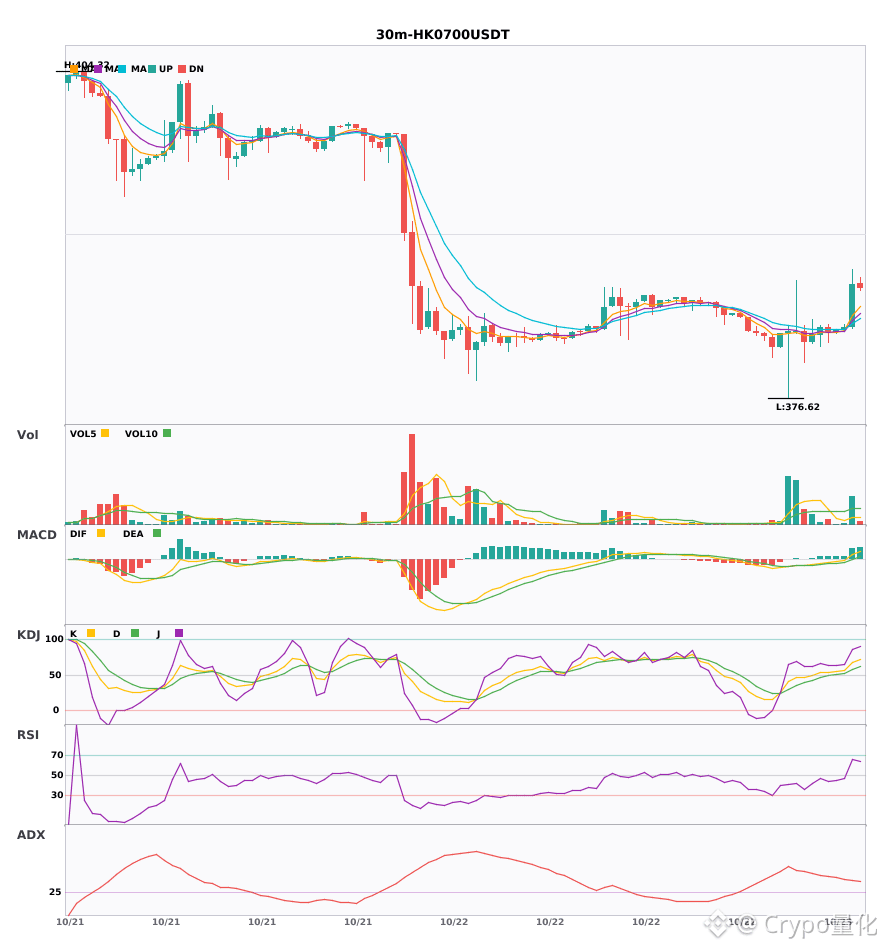
📈 $HK0700 | 30-minute bullish signal
━━━━━━━━━━━━━━━━━━
Technical analysis: ADX(38) Clear trending market | MACD DIF breaks above the zero line, trend turns bullish | EMA5 > EMA8 > EMA13, bullish alignment | KDJ showing strength, bulls in control (K: 67.1, D: 57.5) | Volume increased (1.8x)
Price change: 0.9600%
━━━━━━━━━━━━━━━━━━
#技术分析 #REZ #KSTR #HK0700
📌 The above is for reference only and does not constitute investment advice
$REZ / $KSTR / $HK0700 30-minute technical indicators are strengthening in sync. Which has greater breakout potential?
📈 $REZ | 30-minute bullish signal
━━━━━━━━━━━━━━━━━━
Technical analysis: ADX(55) Very strong trend (beware of a potentially overheated pullback) | MACD golden cross above zero, bullish momentum building | EMA5 > EMA8 > EMA13, bullish alignment | KDJ golden cross, bullish in the short term (K: 75.5, D: 73.6) | Volume increased (2.1x)
Price change: 2.9800%
📈 $KSTR | 30-minute bullish signal
━━━━━━━━━━━━━━━━━━
Technical analysis: ADX(35) Clear trending market | MACD golden cross above zero, bullish momentum building | EMA5 > EMA8 > EMA13, bullish alignment | KDJ showing strength, bulls in control (K: 71.8, D: 63.6) | Volume increased (2.1x)
Price change: 2.8300%
📈 $HK0700 | 30-minute bullish signal
━━━━━━━━━━━━━━━━━━
Technical analysis: ADX(38) Clear trending market | MACD DIF breaks above the zero line, trend turns bullish | EMA5 > EMA8 > EMA13, bullish alignment | KDJ showing strength, bulls in control (K: 67.1, D: 57.5) | Volume increased (1.8x)
Price change: 0.9600%
━━━━━━━━━━━━━━━━━━
#技术分析 #REZ #KSTR #HK0700
📌 The above is for reference only and does not constitute investment advice
📈 $REZ | 30-minute bullish signal
━━━━━━━━━━━━━━━━━━
Technical analysis: ADX(55) Very strong trend (beware of a potentially overheated pullback) | MACD golden cross above zero, bullish momentum building | EMA5 > EMA8 > EMA13, bullish alignment | KDJ golden cross, bullish in the short term (K: 75.5, D: 73.6) | Volume increased (2.1x)
Price change: 2.9800%
📈 $KSTR | 30-minute bullish signal
━━━━━━━━━━━━━━━━━━
Technical analysis: ADX(35) Clear trending market | MACD golden cross above zero, bullish momentum building | EMA5 > EMA8 > EMA13, bullish alignment | KDJ showing strength, bulls in control (K: 71.8, D: 63.6) | Volume increased (2.1x)
Price change: 2.8300%
📈 $HK0700 | 30-minute bullish signal
━━━━━━━━━━━━━━━━━━
Technical analysis: ADX(38) Clear trending market | MACD DIF breaks above the zero line, trend turns bullish | EMA5 > EMA8 > EMA13, bullish alignment | KDJ showing strength, bulls in control (K: 67.1, D: 57.5) | Volume increased (1.8x)
Price change: 0.9600%
━━━━━━━━━━━━━━━━━━
#技术分析 #REZ #KSTR #HK0700
📌 The above is for reference only and does not constitute investment advice
5
·
--
$REZ / $KSTR / $HK0700 30-minute timeframe leans bullish, with short-term confluence opportunities 🔥
════════════════════
🔴 $REZ 30-minute bullish signal
⚠️ Technicals: ADX (55) indicates a very strong trend (watch out for an overheated pullback) | MACD golden cross above zero, releasing bullish momentum | EMA5 > EMA8 > EMA13, bullish alignment | KDJ golden cross, short-term outlook bullish (K: 75.5, D: 73.6) | Volume increased (2.1x)
════════════════════
🔴 $KSTR 30-minute bullish signal
⚠️ Technicals: ADX (35) indicates a clear trending market | MACD golden cross above zero, releasing bullish momentum | EMA5 > EMA8 > EMA13, bullish alignment | KDJ showing strength, bulls have the upper hand (K: 71.8, D: 63.6) | Volume increased (2.1x)
════════════════════
🔴 $HK0700 30-minute bullish signal
⚠️ Technicals: ADX (38) indicates a clear trending market | MACD DIF broke above the zero line, signaling a bullish trend reversal | EMA5 > EMA8 > EMA13, bullish alignment | KDJ showing strength, bulls have the upper hand (K: 67.1, D: 57.5) | Volume increased (1.8x)
════════════════════
🔔 Follow us for real-time market updates 🔔
#技术分析 #REZ #KSTR #HK0700
📌 When trading, pay attention to whether the candlestick pattern confirms the setup
$REZ / $KSTR / $HK0700 30-minute timeframe leans bullish, with short-term confluence opportunities 🔥
════════════════════
🔴 $REZ 30-minute bullish signal
⚠️ Technicals: ADX (55) indicates a very strong trend (watch out for an overheated pullback) | MACD golden cross above zero, releasing bullish momentum | EMA5 > EMA8 > EMA13, bullish alignment | KDJ golden cross, short-term outlook bullish (K: 75.5, D: 73.6) | Volume increased (2.1x)
════════════════════
🔴 $KSTR 30-minute bullish signal
⚠️ Technicals: ADX (35) indicates a clear trending market | MACD golden cross above zero, releasing bullish momentum | EMA5 > EMA8 > EMA13, bullish alignment | KDJ showing strength, bulls have the upper hand (K: 71.8, D: 63.6) | Volume increased (2.1x)
════════════════════
🔴 $HK0700 30-minute bullish signal
⚠️ Technicals: ADX (38) indicates a clear trending market | MACD DIF broke above the zero line, signaling a bullish trend reversal | EMA5 > EMA8 > EMA13, bullish alignment | KDJ showing strength, bulls have the upper hand (K: 67.1, D: 57.5) | Volume increased (1.8x)
════════════════════
🔔 Follow us for real-time market updates 🔔
#技术分析 #REZ #KSTR #HK0700
📌 When trading, pay attention to whether the candlestick pattern confirms the setup
════════════════════
🔴 $REZ 30-minute bullish signal
⚠️ Technicals: ADX (55) indicates a very strong trend (watch out for an overheated pullback) | MACD golden cross above zero, releasing bullish momentum | EMA5 > EMA8 > EMA13, bullish alignment | KDJ golden cross, short-term outlook bullish (K: 75.5, D: 73.6) | Volume increased (2.1x)
════════════════════
🔴 $KSTR 30-minute bullish signal
⚠️ Technicals: ADX (35) indicates a clear trending market | MACD golden cross above zero, releasing bullish momentum | EMA5 > EMA8 > EMA13, bullish alignment | KDJ showing strength, bulls have the upper hand (K: 71.8, D: 63.6) | Volume increased (2.1x)
════════════════════
🔴 $HK0700 30-minute bullish signal
⚠️ Technicals: ADX (38) indicates a clear trending market | MACD DIF broke above the zero line, signaling a bullish trend reversal | EMA5 > EMA8 > EMA13, bullish alignment | KDJ showing strength, bulls have the upper hand (K: 67.1, D: 57.5) | Volume increased (1.8x)
════════════════════
🔔 Follow us for real-time market updates 🔔
#技术分析 #REZ #KSTR #HK0700
📌 When trading, pay attention to whether the candlestick pattern confirms the setup
15
·
--
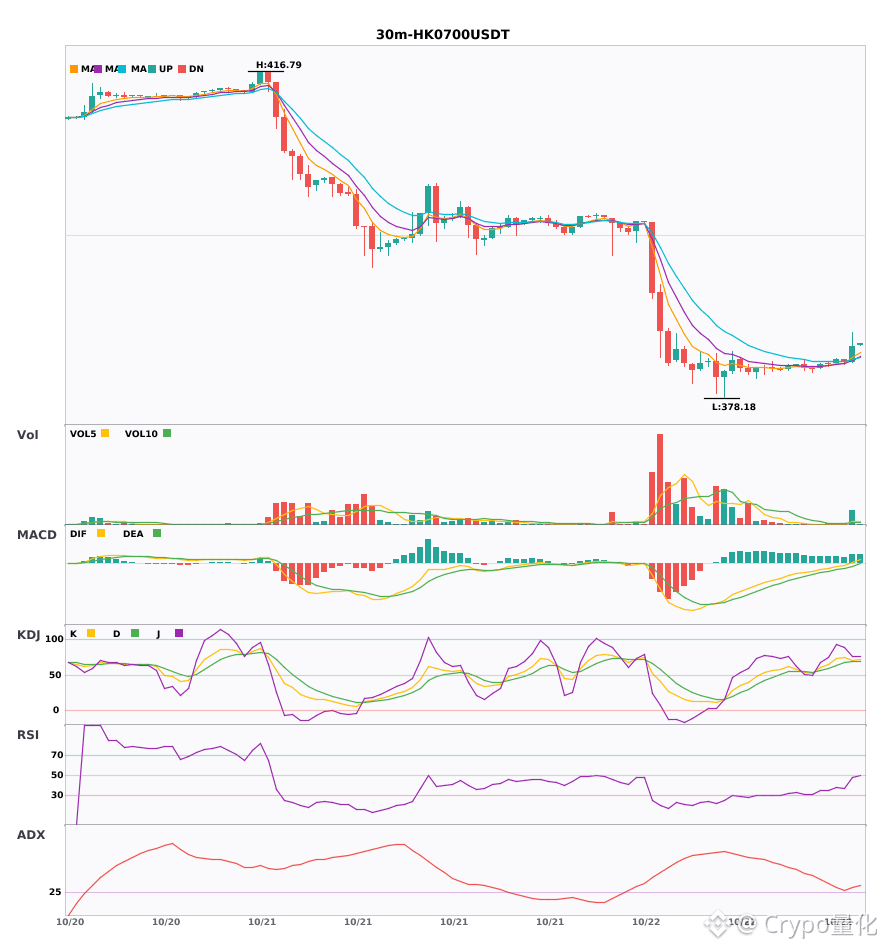
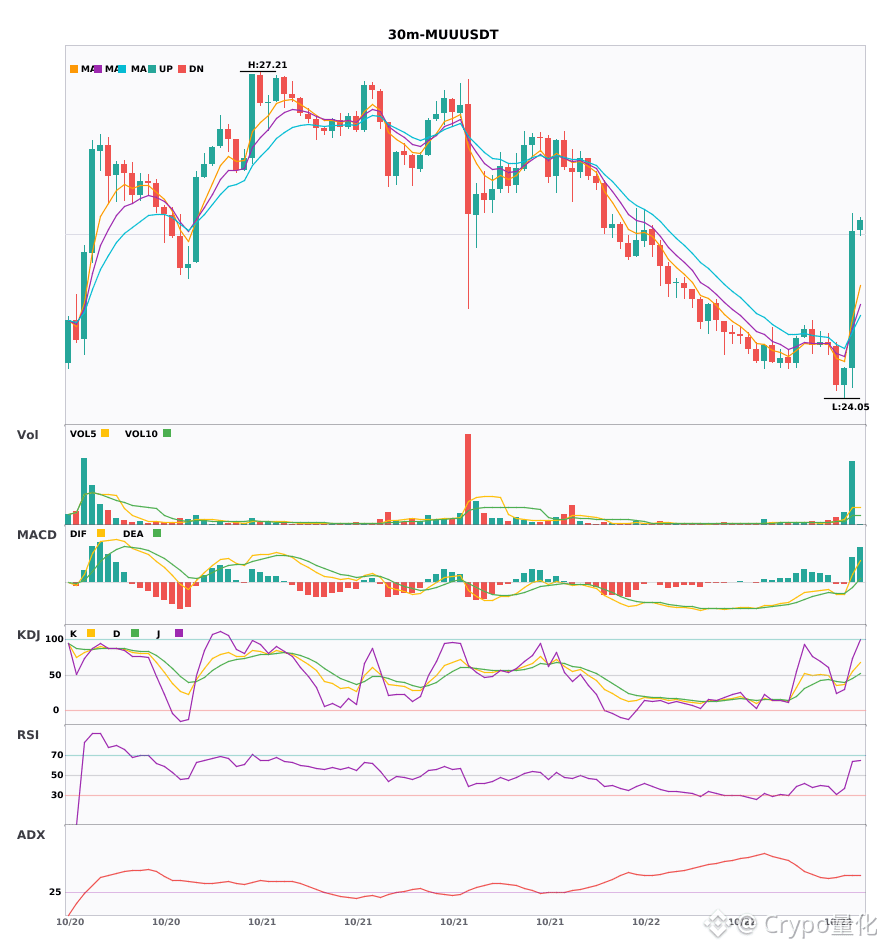
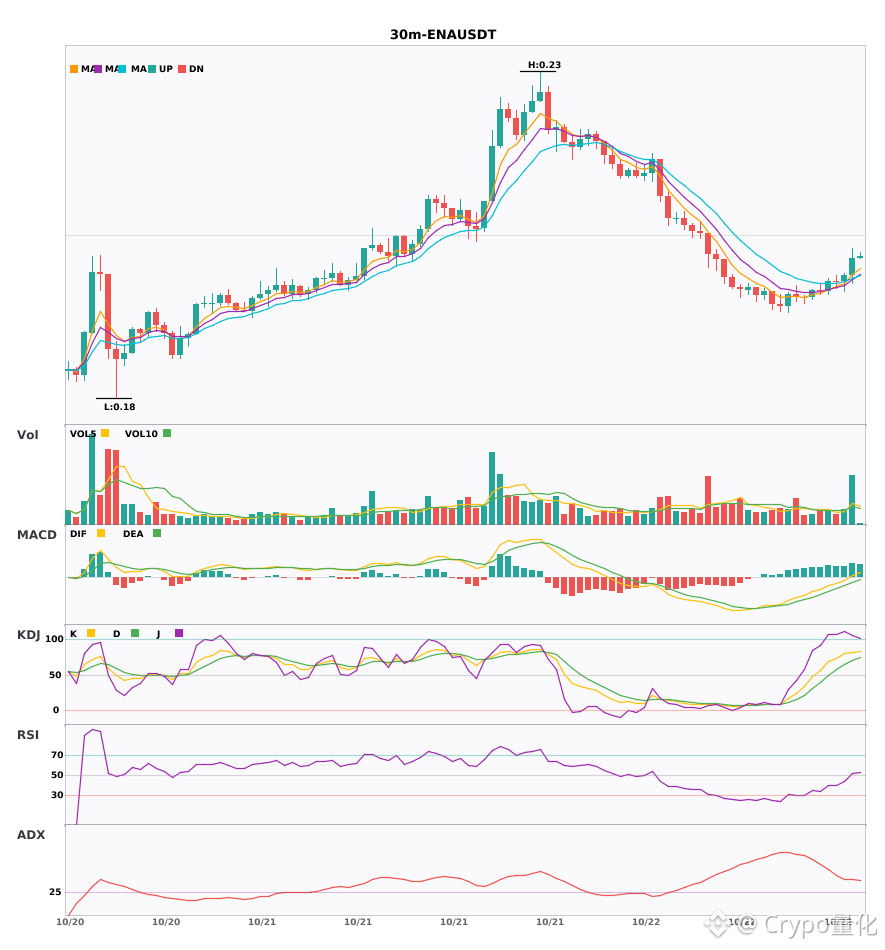
$HK0700 / $MUU / $ENA 30-minute technical indicators are strengthening in sync. Which one has the greatest breakout potential? 🔥
════════════════════
🔴 $HK0700 30-minute bullish signal
⚠️ Technicals: ADX(30): Trend is forming; entry may be considered | MACD DIF breaks above the zero line, turning the trend bullish | Moving averages are converging, building momentum and about to choose a direction | KDJ is trending strongly, with bulls in control (K: 71.0, D: 68.3) | Volume surge (6.8x)
════════════════════
🔴 $MUU 30-minute bullish signal
⚠️ Technicals: ADX(43): Clear trending market | MACD bullish crossover above zero, releasing bullish momentum | EMA5 crosses above EMA8, turning bullish in the short term | KDJ bullish crossover, short-term outlook is bullish (K: 54.3, D: 44.6) | Volume surge (6.4x)
════════════════════
🔴 $ENA 30-minute bullish signal
⚠️ Technicals: ADX(38): Clear trending market | MACD DIF breaks above the zero line, turning the trend bullish | Moving averages are converging, building momentum and about to choose a direction | KDJ is trending strongly, with bulls in control (K: 82.1, D: 70.6) | Volume surge (2.7x)
════════════════════
🔔 Follow for first-hand market moves 🔔
#技术分析 #HK0700 #MUU #ENA
📌 When trading, pay attention to whether the candlestick pattern confirms the signal
$HK0700 / $MUU / $ENA 30-minute technical indicators are strengthening in sync. Which one has the greatest breakout potential? 🔥
════════════════════
🔴 $HK0700 30-minute bullish signal
⚠️ Technicals: ADX(30): Trend is forming; entry may be considered | MACD DIF breaks above the zero line, turning the trend bullish | Moving averages are converging, building momentum and about to choose a direction | KDJ is trending strongly, with bulls in control (K: 71.0, D: 68.3) | Volume surge (6.8x)
════════════════════
🔴 $MUU 30-minute bullish signal
⚠️ Technicals: ADX(43): Clear trending market | MACD bullish crossover above zero, releasing bullish momentum | EMA5 crosses above EMA8, turning bullish in the short term | KDJ bullish crossover, short-term outlook is bullish (K: 54.3, D: 44.6) | Volume surge (6.4x)
════════════════════
🔴 $ENA 30-minute bullish signal
⚠️ Technicals: ADX(38): Clear trending market | MACD DIF breaks above the zero line, turning the trend bullish | Moving averages are converging, building momentum and about to choose a direction | KDJ is trending strongly, with bulls in control (K: 82.1, D: 70.6) | Volume surge (2.7x)
════════════════════
🔔 Follow for first-hand market moves 🔔
#技术分析 #HK0700 #MUU #ENA
📌 When trading, pay attention to whether the candlestick pattern confirms the signal
════════════════════
🔴 $HK0700 30-minute bullish signal
⚠️ Technicals: ADX(30): Trend is forming; entry may be considered | MACD DIF breaks above the zero line, turning the trend bullish | Moving averages are converging, building momentum and about to choose a direction | KDJ is trending strongly, with bulls in control (K: 71.0, D: 68.3) | Volume surge (6.8x)
════════════════════
🔴 $MUU 30-minute bullish signal
⚠️ Technicals: ADX(43): Clear trending market | MACD bullish crossover above zero, releasing bullish momentum | EMA5 crosses above EMA8, turning bullish in the short term | KDJ bullish crossover, short-term outlook is bullish (K: 54.3, D: 44.6) | Volume surge (6.4x)
════════════════════
🔴 $ENA 30-minute bullish signal
⚠️ Technicals: ADX(38): Clear trending market | MACD DIF breaks above the zero line, turning the trend bullish | Moving averages are converging, building momentum and about to choose a direction | KDJ is trending strongly, with bulls in control (K: 82.1, D: 70.6) | Volume surge (2.7x)
════════════════════
🔔 Follow for first-hand market moves 🔔
#技术分析 #HK0700 #MUU #ENA
📌 When trading, pay attention to whether the candlestick pattern confirms the signal
15
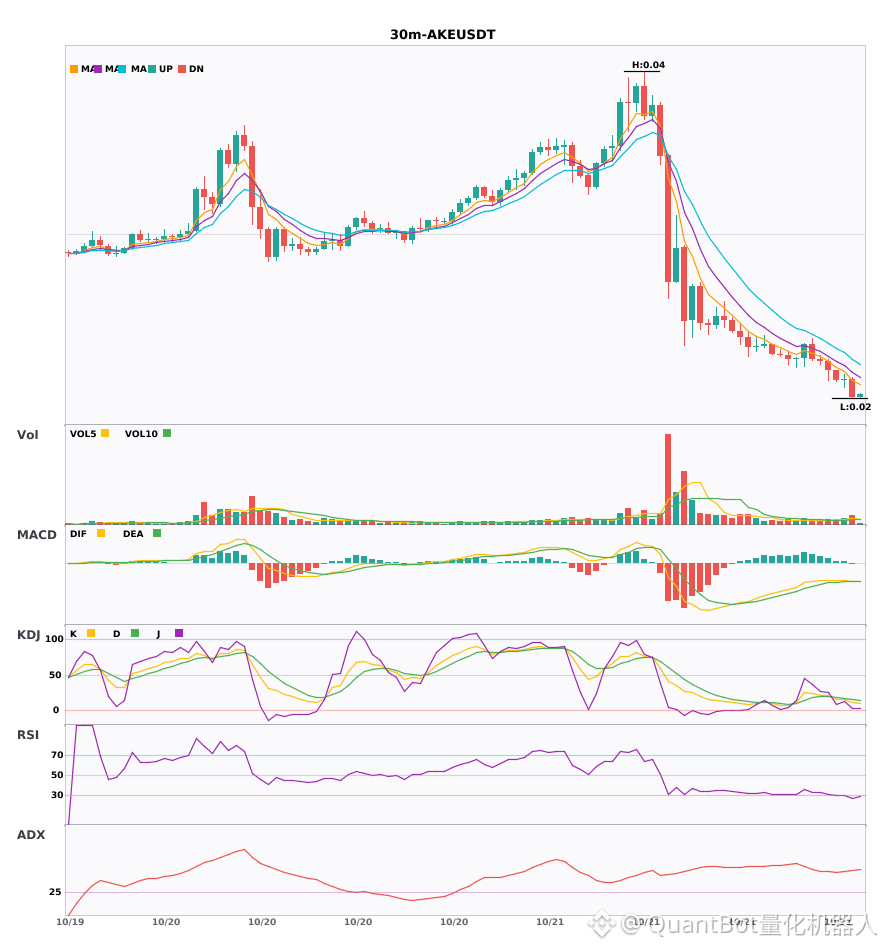
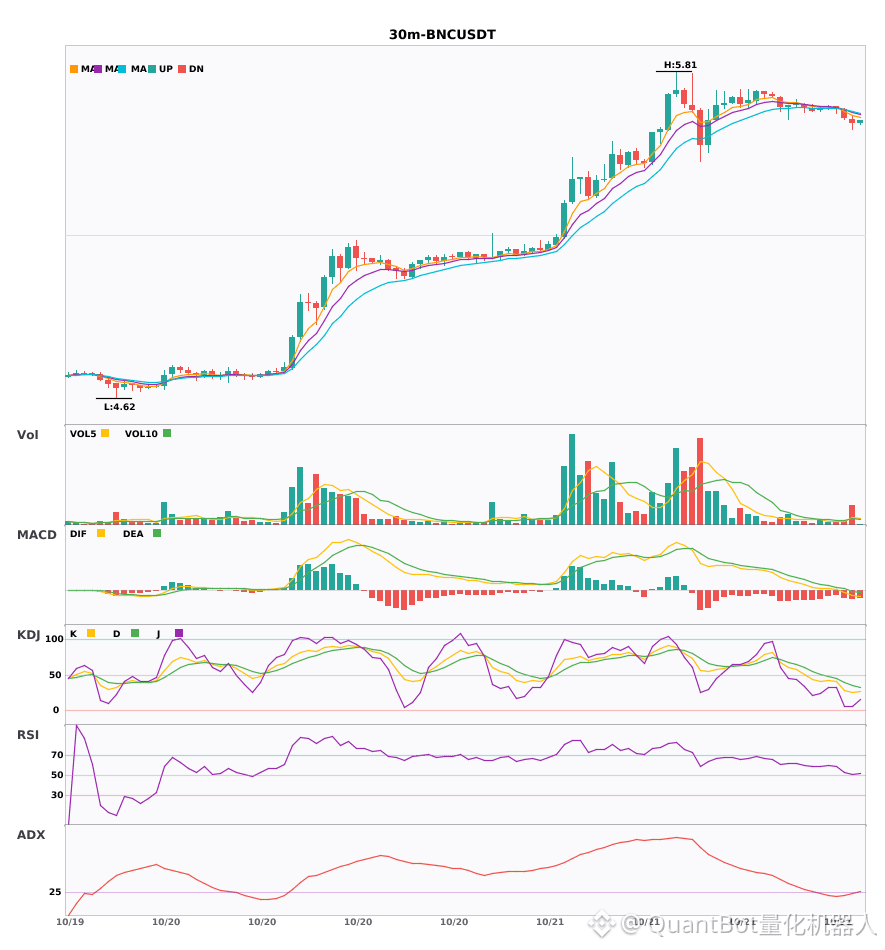
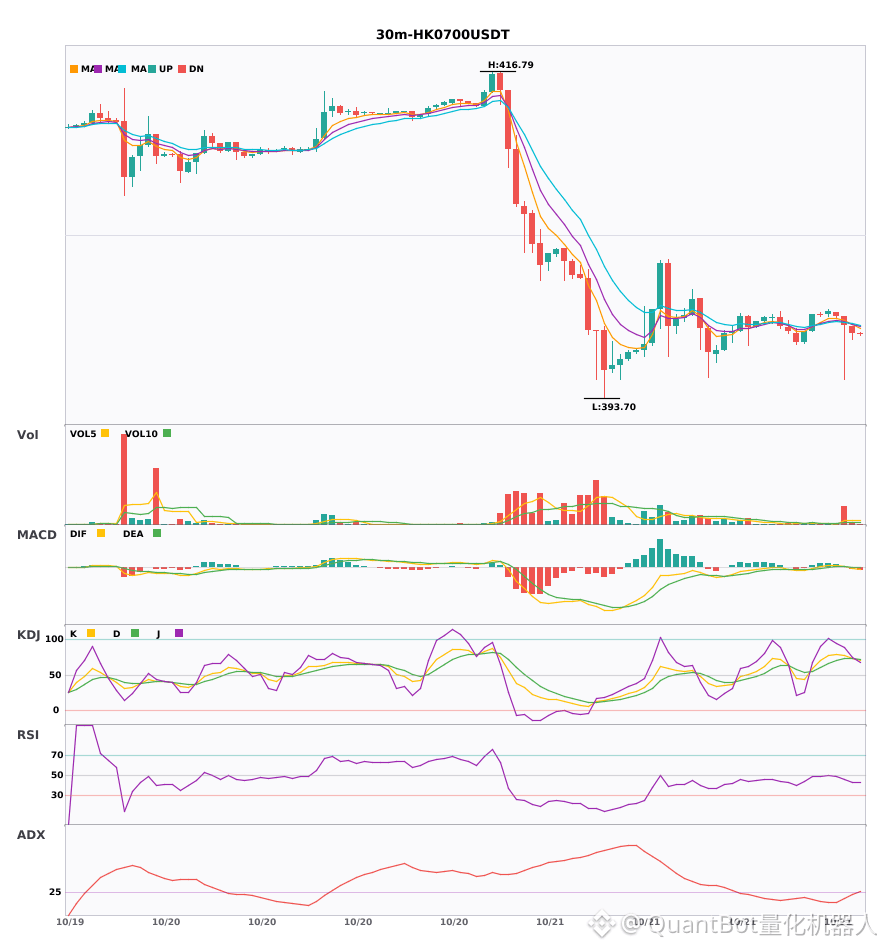
$AKE / $BNC / $HK0700 30-minute confluence turns bearish; bearish signals appear simultaneously
📉 $AKE | 30-minute bearish signal
━━━━━━━━━━━━━━━━━━
Technical analysis: ADX (49): very strong trend (watch for overbought pullbacks) | MACD bearish crossover below zero, bearish momentum accelerating | EMA5 < EMA8 < EMA13, bearish alignment | KDJ in oversold territory; watch for a potential rebound (K: 11.6, D: 15.6) | Volume increased (1.8x)
Price change: -3.0700%
📉 $BNC | 30-minute bearish signal
━━━━━━━━━━━━━━━━━━
Technical analysis: ADX (28): trend is forming; potential entry | MACD bearish, trend is weak, momentum strengthening | EMA5 < EMA8 < EMA13, bearish alignment | KDJ showing weakness, bears in control (K: 25.6, D: 35.1) | Volume surged (3.1x)
Price change: -0.3000%
📉 $HK0700 | 30-minute bearish signal
━━━━━━━━━━━━━━━━━━
Technical analysis: ADX (25): trend is forming; potential entry | MACD bearish crossover below zero, bearish momentum accelerating | EMA5 crossed below EMA8, short-term outlook turns bearish | KDJ showing strength, bulls in control (K: 73.7, D: 72.9) | Volume surged (6.3x)
Price change: -0.1400%
━━━━━━━━━━━━━━━━━━
#技术分析 #AKE #BNC #HK0700
📌 The above is for reference only and does not constitute investment advice
$AKE / $BNC / $HK0700 30-minute confluence turns bearish; bearish signals appear simultaneously
📉 $AKE | 30-minute bearish signal
━━━━━━━━━━━━━━━━━━
Technical analysis: ADX (49): very strong trend (watch for overbought pullbacks) | MACD bearish crossover below zero, bearish momentum accelerating | EMA5 < EMA8 < EMA13, bearish alignment | KDJ in oversold territory; watch for a potential rebound (K: 11.6, D: 15.6) | Volume increased (1.8x)
Price change: -3.0700%
📉 $BNC | 30-minute bearish signal
━━━━━━━━━━━━━━━━━━
Technical analysis: ADX (28): trend is forming; potential entry | MACD bearish, trend is weak, momentum strengthening | EMA5 < EMA8 < EMA13, bearish alignment | KDJ showing weakness, bears in control (K: 25.6, D: 35.1) | Volume surged (3.1x)
Price change: -0.3000%
📉 $HK0700 | 30-minute bearish signal
━━━━━━━━━━━━━━━━━━
Technical analysis: ADX (25): trend is forming; potential entry | MACD bearish crossover below zero, bearish momentum accelerating | EMA5 crossed below EMA8, short-term outlook turns bearish | KDJ showing strength, bulls in control (K: 73.7, D: 72.9) | Volume surged (6.3x)
Price change: -0.1400%
━━━━━━━━━━━━━━━━━━
#技术分析 #AKE #BNC #HK0700
📌 The above is for reference only and does not constitute investment advice
📉 $AKE | 30-minute bearish signal
━━━━━━━━━━━━━━━━━━
Technical analysis: ADX (49): very strong trend (watch for overbought pullbacks) | MACD bearish crossover below zero, bearish momentum accelerating | EMA5 < EMA8 < EMA13, bearish alignment | KDJ in oversold territory; watch for a potential rebound (K: 11.6, D: 15.6) | Volume increased (1.8x)
Price change: -3.0700%
📉 $BNC | 30-minute bearish signal
━━━━━━━━━━━━━━━━━━
Technical analysis: ADX (28): trend is forming; potential entry | MACD bearish, trend is weak, momentum strengthening | EMA5 < EMA8 < EMA13, bearish alignment | KDJ showing weakness, bears in control (K: 25.6, D: 35.1) | Volume surged (3.1x)
Price change: -0.3000%
📉 $HK0700 | 30-minute bearish signal
━━━━━━━━━━━━━━━━━━
Technical analysis: ADX (25): trend is forming; potential entry | MACD bearish crossover below zero, bearish momentum accelerating | EMA5 crossed below EMA8, short-term outlook turns bearish | KDJ showing strength, bulls in control (K: 73.7, D: 72.9) | Volume surged (6.3x)
Price change: -0.1400%
━━━━━━━━━━━━━━━━━━
#技术分析 #AKE #BNC #HK0700
📌 The above is for reference only and does not constitute investment advice
11
·
--
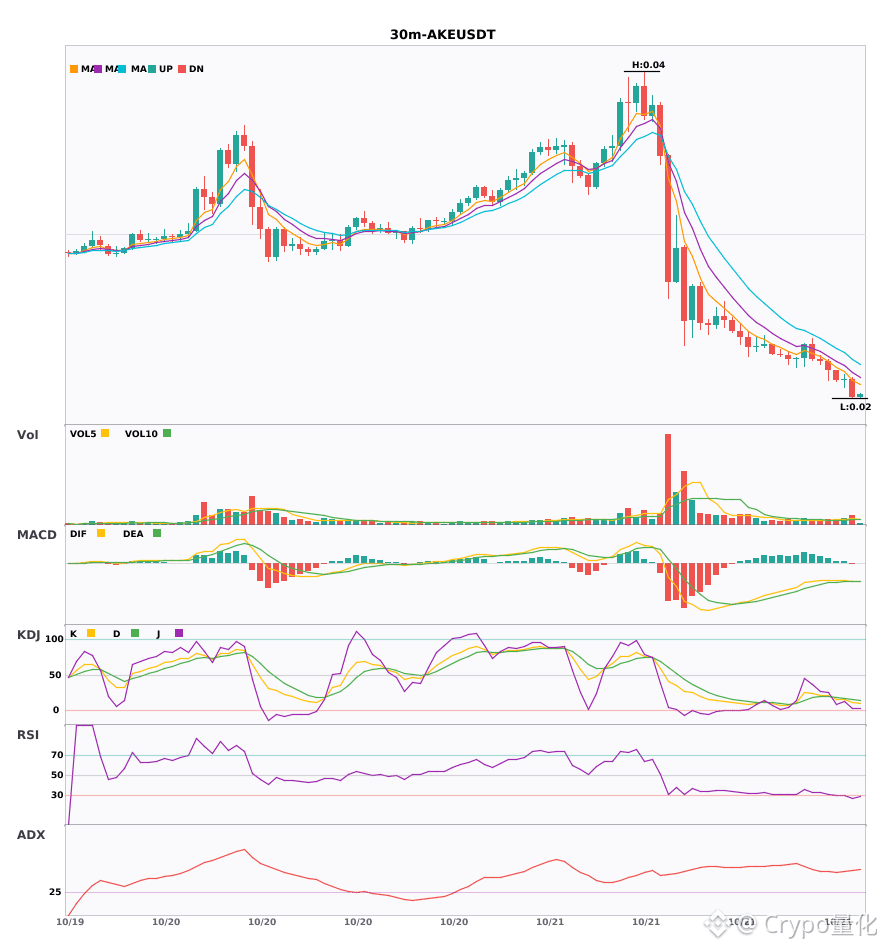
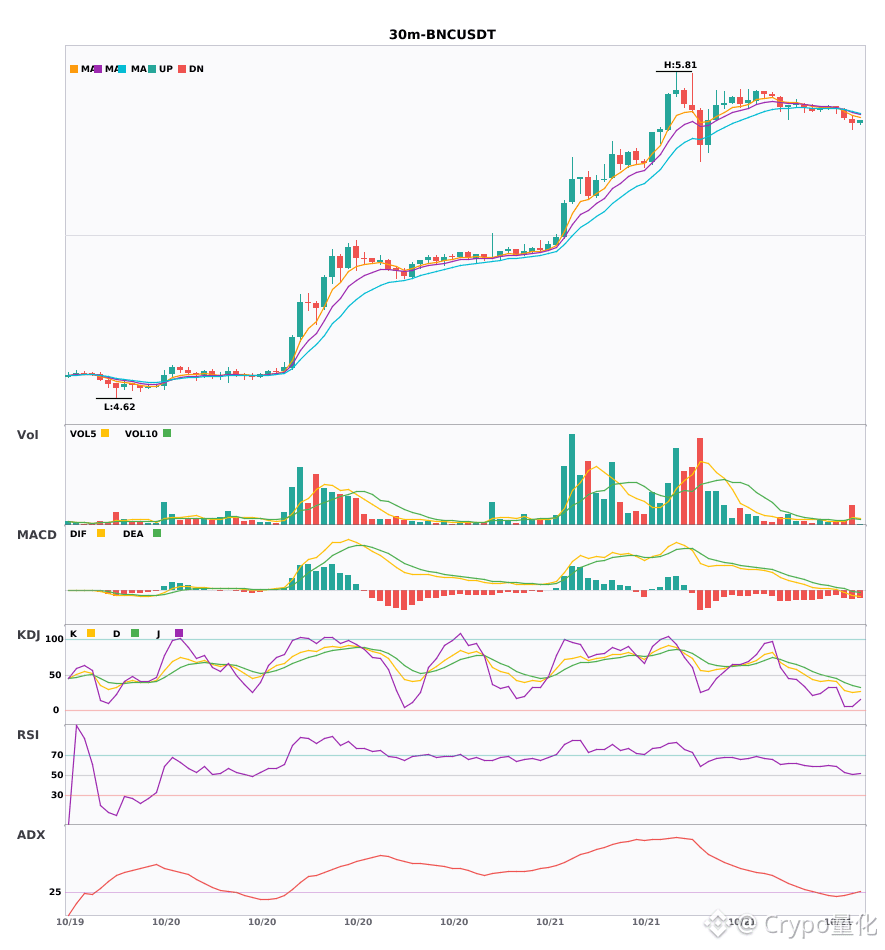
3 bearish alerts on the 30-minute timeframe: $AKE / $BNC / $HK0700🔥
════════════════════
🟢 $AKE 30-minute bearish signal
⚠️Technical analysis: ADX(49) Very strong trend (beware of an overheated pullback) | MACD bearish crossover below zero, bearish momentum accelerating | EMA5 < EMA8 < EMA13, bearish alignment | KDJ in oversold territory; watch for rebound opportunities (K: 11.6, D: 15.6) | Volume increased (1.8x)
════════════════════
🟢 $BNC 30-minute bearish signal
⚠️Technical analysis: ADX(28) Trend is forming; entry is possible | MACD bearish, trend is weak, momentum is strengthening | EMA5 < EMA8 < EMA13, bearish alignment | KDJ trending weakly, bears in control (K: 25.6, D: 35.1) | Volume surged (3.1x)
════════════════════
🟢 $HK0700 30-minute bearish signal
⚠️Technical analysis: ADX(25) Trend is forming; entry is possible | MACD bearish crossover below zero, bearish momentum accelerating | EMA5 crossed below EMA8, short-term outlook has turned bearish | KDJ trending strongly, bulls in control (K: 73.7, D: 72.9) | Volume surged (6.3x)
════════════════════
🔔 Follow for real-time market movement alerts 🔔
#技术分析 #AKE #BNC #HK0700
📌 When trading, pay attention to whether the candlestick pattern confirms the signal
3 bearish alerts on the 30-minute timeframe: $AKE / $BNC / $HK0700 🔥
════════════════════
🟢 $AKE 30-minute bearish signal
⚠️Technical analysis: ADX(49) Very strong trend (beware of an overheated pullback) | MACD bearish crossover below zero, bearish momentum accelerating | EMA5 < EMA8 < EMA13, bearish alignment | KDJ in oversold territory; watch for rebound opportunities (K: 11.6, D: 15.6) | Volume increased (1.8x)
════════════════════
🟢 $BNC 30-minute bearish signal
⚠️Technical analysis: ADX(28) Trend is forming; entry is possible | MACD bearish, trend is weak, momentum is strengthening | EMA5 < EMA8 < EMA13, bearish alignment | KDJ trending weakly, bears in control (K: 25.6, D: 35.1) | Volume surged (3.1x)
════════════════════
🟢 $HK0700 30-minute bearish signal
⚠️Technical analysis: ADX(25) Trend is forming; entry is possible | MACD bearish crossover below zero, bearish momentum accelerating | EMA5 crossed below EMA8, short-term outlook has turned bearish | KDJ trending strongly, bulls in control (K: 73.7, D: 72.9) | Volume surged (6.3x)
════════════════════
🔔 Follow for real-time market movement alerts 🔔
#技术分析 #AKE #BNC #HK0700
📌 When trading, pay attention to whether the candlestick pattern confirms the signal
════════════════════
🟢 $AKE 30-minute bearish signal
⚠️Technical analysis: ADX(49) Very strong trend (beware of an overheated pullback) | MACD bearish crossover below zero, bearish momentum accelerating | EMA5 < EMA8 < EMA13, bearish alignment | KDJ in oversold territory; watch for rebound opportunities (K: 11.6, D: 15.6) | Volume increased (1.8x)
════════════════════
🟢 $BNC 30-minute bearish signal
⚠️Technical analysis: ADX(28) Trend is forming; entry is possible | MACD bearish, trend is weak, momentum is strengthening | EMA5 < EMA8 < EMA13, bearish alignment | KDJ trending weakly, bears in control (K: 25.6, D: 35.1) | Volume surged (3.1x)
════════════════════
🟢 $HK0700 30-minute bearish signal
⚠️Technical analysis: ADX(25) Trend is forming; entry is possible | MACD bearish crossover below zero, bearish momentum accelerating | EMA5 crossed below EMA8, short-term outlook has turned bearish | KDJ trending strongly, bulls in control (K: 73.7, D: 72.9) | Volume surged (6.3x)
════════════════════
🔔 Follow for real-time market movement alerts 🔔
#技术分析 #AKE #BNC #HK0700
📌 When trading, pay attention to whether the candlestick pattern confirms the signal
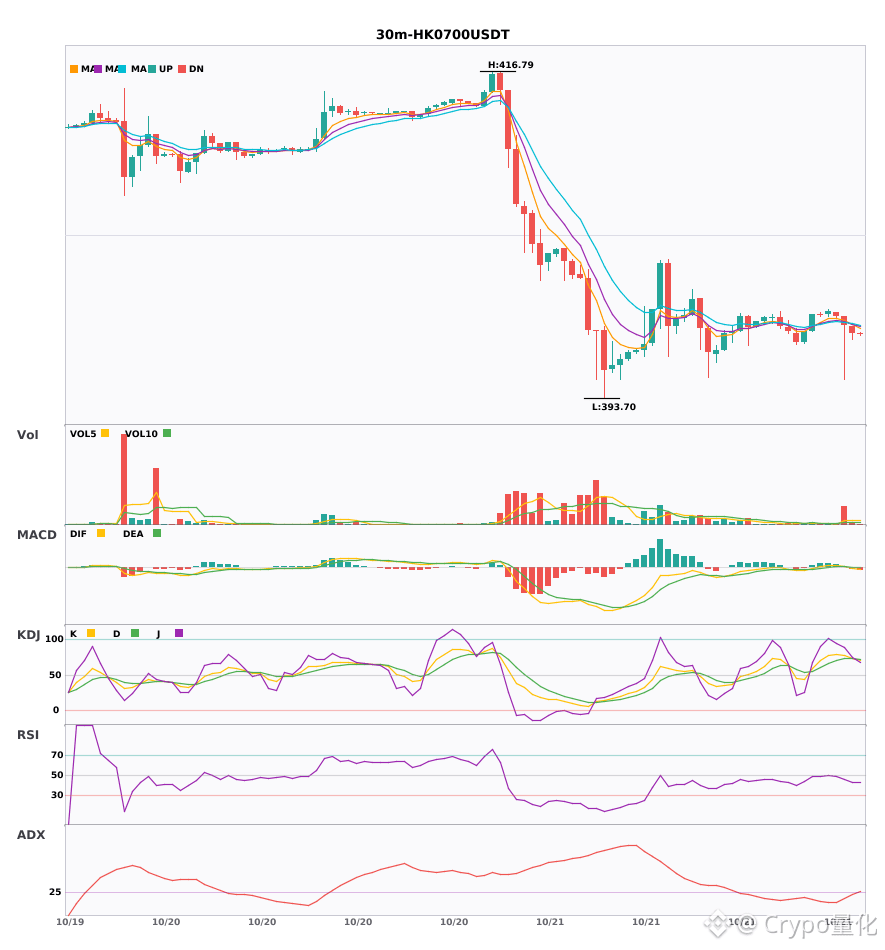
5

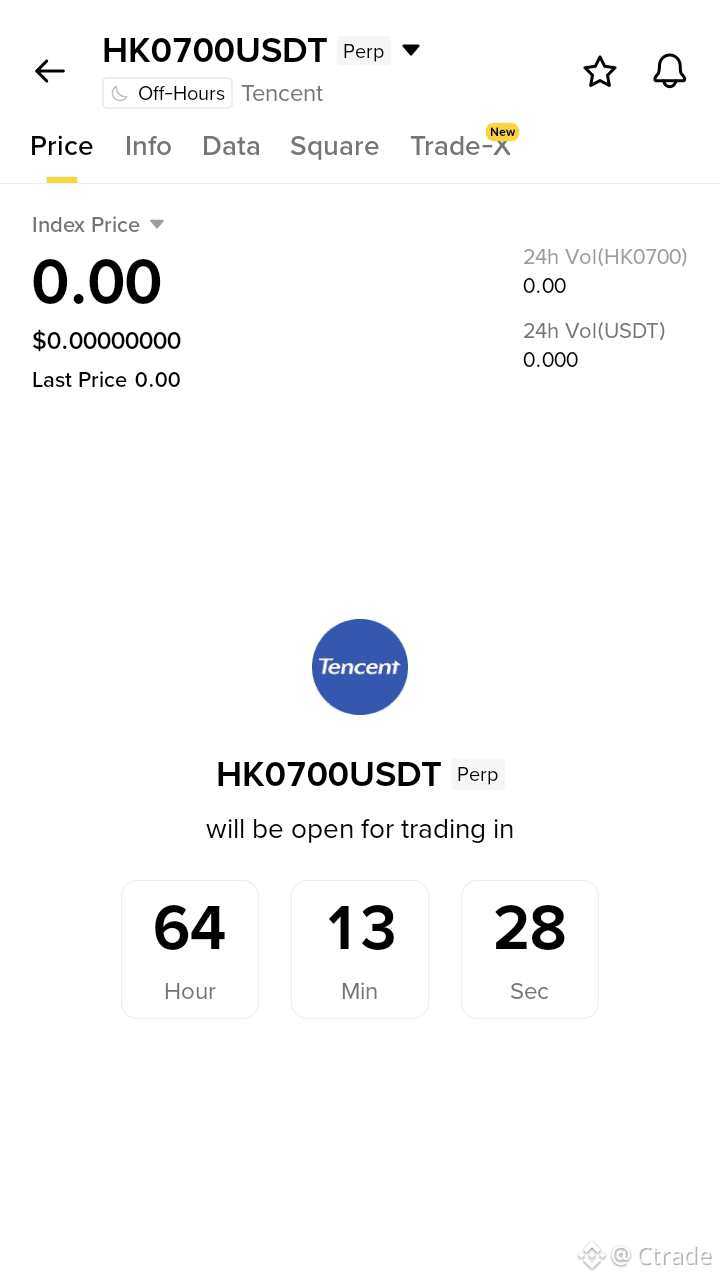

·
--
[点击找组织](https://app.binance.com/uni-qr/YZCDeEje)
The strength accumulated over time will eventually be unleashed. After the base stabilizes, the upward trend will gradually open up.
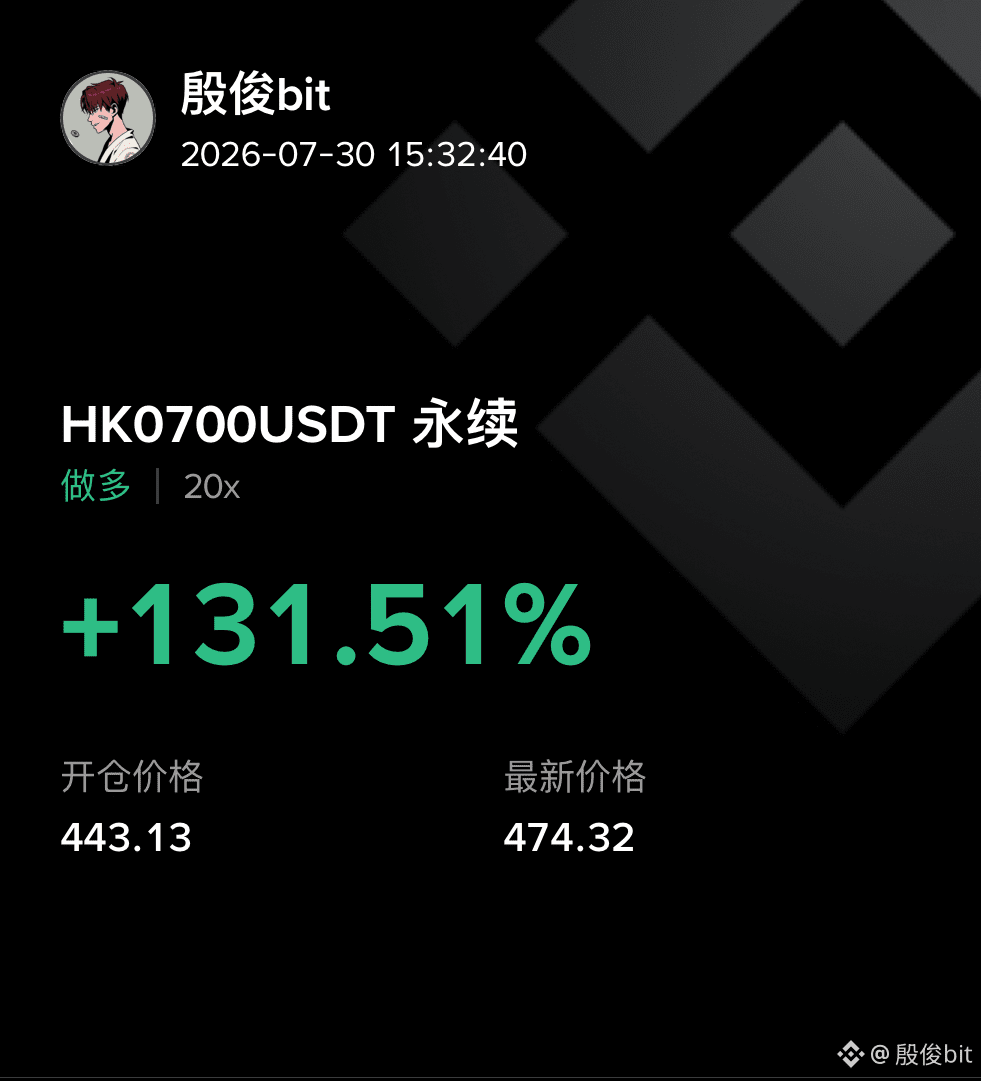
$HK0700 USDT, as planned, has broken into an uptrend.
At the 443.13 level, it can be seen that the support below is solid, with buy orders continuously flowing in.
We are simultaneously setting up a 20x long position in the main base.
Current price is 474.32, with a return of 131.51%.
To keep pace, you may first take profit on 70% of the position to lock in gains.
Hold the remaining position, and focus on the 476 resistance level.
Set a defensive stop-loss at 440, and wait patiently for the next round of setup opportunities.
$BTC $ETH #HK0700
点击找组织
The strength accumulated over time will eventually be unleashed. After the base stabilizes, the upward trend will gradually open up.
$HK0700 USDT, as planned, has broken into an uptrend.
At the 443.13 level, it can be seen that the support below is solid, with buy orders continuously flowing in.
We are simultaneously setting up a 20x long position in the main base.
Current price is 474.32, with a return of 131.51%.
To keep pace, you may first take profit on 70% of the position to lock in gains.
Hold the remaining position, and focus on the 476 resistance level.
Set a defensive stop-loss at 440, and wait patiently for the next round of setup opportunities.
$BTC $ETH #HK0700
The strength accumulated over time will eventually be unleashed. After the base stabilizes, the upward trend will gradually open up.
$HK0700 USDT, as planned, has broken into an uptrend.
At the 443.13 level, it can be seen that the support below is solid, with buy orders continuously flowing in.
We are simultaneously setting up a 20x long position in the main base.
Current price is 474.32, with a return of 131.51%.
To keep pace, you may first take profit on 70% of the position to lock in gains.
Hold the remaining position, and focus on the 476 resistance level.
Set a defensive stop-loss at 440, and wait patiently for the next round of setup opportunities.
$BTC $ETH #HK0700
7
1.1k

·
--
Two signals. The $ETHFI 4-hour RSI surged to 90.3, overbought. The $HK0700 4-hour RSI crashed to 13.6, oversold.
$ETHFI 4-hour RSI at 90.3. Extremely overbought. Current price 0.4435. Up 18.58% in 24h.
Support 0.427, 0.400. Resistance 0.4508, 0.48.
Fee +0.005%. Not high, but the FOMO sentiment is obvious. After a two-day rally of nearly 20%, the short-term supply is all sitting above.
Current price 0.4435
Slightly bearish. RSI 90 rarely holds. Wait to short in the 0.445–0.450 range. Stop-loss 0.455. Targets 0.415–0.400. Risk/reward about 2.2:1.
$HK0700 4-hour RSI 13.6. Extremely oversold. Current price 440.68. Down 2.29% in 24h.
Support 430, 440. Resistance 448, 453.
Fee 0. No disagreement between bulls and bears. It has been sold down for more than a week—from 485 all the way, and volume is still expanding.
Current price 440.68
Slightly bullish. It fell for 16% in a row; the 4-hour RSI is down to 13.6 and the daily RSI is only 15.5. 430 held twice. Enter longs around 438–442. Stop-loss 428. Targets 450–453. Risk/reward about 3:1.
I’ve seen moves like this in ETHFI plenty of times—after the spike, it always has to come back. HK0700 was dumped hard enough; as long as 430 doesn’t break, it’s an opportunity.
I’m watching.
#ETHFI #HK0700
Two signals. The $ETHFI 4-hour RSI surged to 90.3, overbought. The $HK0700 4-hour RSI crashed to 13.6, oversold.
$ETHFI 4-hour RSI at 90.3. Extremely overbought. Current price 0.4435. Up 18.58% in 24h.
Support 0.427, 0.400. Resistance 0.4508, 0.48.
Fee +0.005%. Not high, but the FOMO sentiment is obvious. After a two-day rally of nearly 20%, the short-term supply is all sitting above.
Current price 0.4435
Slightly bearish. RSI 90 rarely holds. Wait to short in the 0.445–0.450 range. Stop-loss 0.455. Targets 0.415–0.400. Risk/reward about 2.2:1.
$HK0700 4-hour RSI 13.6. Extremely oversold. Current price 440.68. Down 2.29% in 24h.
Support 430, 440. Resistance 448, 453.
Fee 0. No disagreement between bulls and bears. It has been sold down for more than a week—from 485 all the way, and volume is still expanding.
Current price 440.68
Slightly bullish. It fell for 16% in a row; the 4-hour RSI is down to 13.6 and the daily RSI is only 15.5. 430 held twice. Enter longs around 438–442. Stop-loss 428. Targets 450–453. Risk/reward about 3:1.
I’ve seen moves like this in ETHFI plenty of times—after the spike, it always has to come back. HK0700 was dumped hard enough; as long as 430 doesn’t break, it’s an opportunity.
I’m watching.
#ETHFI #HK0700
$ETHFI 4-hour RSI at 90.3. Extremely overbought. Current price 0.4435. Up 18.58% in 24h.
Support 0.427, 0.400. Resistance 0.4508, 0.48.
Fee +0.005%. Not high, but the FOMO sentiment is obvious. After a two-day rally of nearly 20%, the short-term supply is all sitting above.
Current price 0.4435
Slightly bearish. RSI 90 rarely holds. Wait to short in the 0.445–0.450 range. Stop-loss 0.455. Targets 0.415–0.400. Risk/reward about 2.2:1.
$HK0700 4-hour RSI 13.6. Extremely oversold. Current price 440.68. Down 2.29% in 24h.
Support 430, 440. Resistance 448, 453.
Fee 0. No disagreement between bulls and bears. It has been sold down for more than a week—from 485 all the way, and volume is still expanding.
Current price 440.68
Slightly bullish. It fell for 16% in a row; the 4-hour RSI is down to 13.6 and the daily RSI is only 15.5. 430 held twice. Enter longs around 438–442. Stop-loss 428. Targets 450–453. Risk/reward about 3:1.
I’ve seen moves like this in ETHFI plenty of times—after the spike, it always has to come back. HK0700 was dumped hard enough; as long as 430 doesn’t break, it’s an opportunity.
I’m watching.
#ETHFI #HK0700
225

·
--
Bearish
HK0700 saw $10.391K in longs cleared at $444.24866.
That is a meaningful downside liquidation print.
$HK0700
{future}(HK0700USDT)
🔴 LIQUIDITY ZONE HIT 🔴
Long liquidation spotted 🧨
$10.391K cleared at $444.24866
Downside liquidity swept — watch reaction 👀
🎯 TP Targets:
TP1: ~$442.03
TP2: ~$439.81
TP3: ~$437.58
#HK0700
HK0700 saw $10.391K in longs cleared at $444.24866.
That is a meaningful downside liquidation print.
$HK0700
🔴 LIQUIDITY ZONE HIT 🔴
Long liquidation spotted 🧨
$10.391K cleared at $444.24866
Downside liquidity swept — watch reaction 👀
🎯 TP Targets:
TP1: ~$442.03
TP2: ~$439.81
TP3: ~$437.58
#HK0700
That is a meaningful downside liquidation print.
$HK0700
🔴 LIQUIDITY ZONE HIT 🔴
Long liquidation spotted 🧨
$10.391K cleared at $444.24866
Downside liquidity swept — watch reaction 👀
🎯 TP Targets:
TP1: ~$442.03
TP2: ~$439.81
TP3: ~$437.58
#HK0700
116

·
--
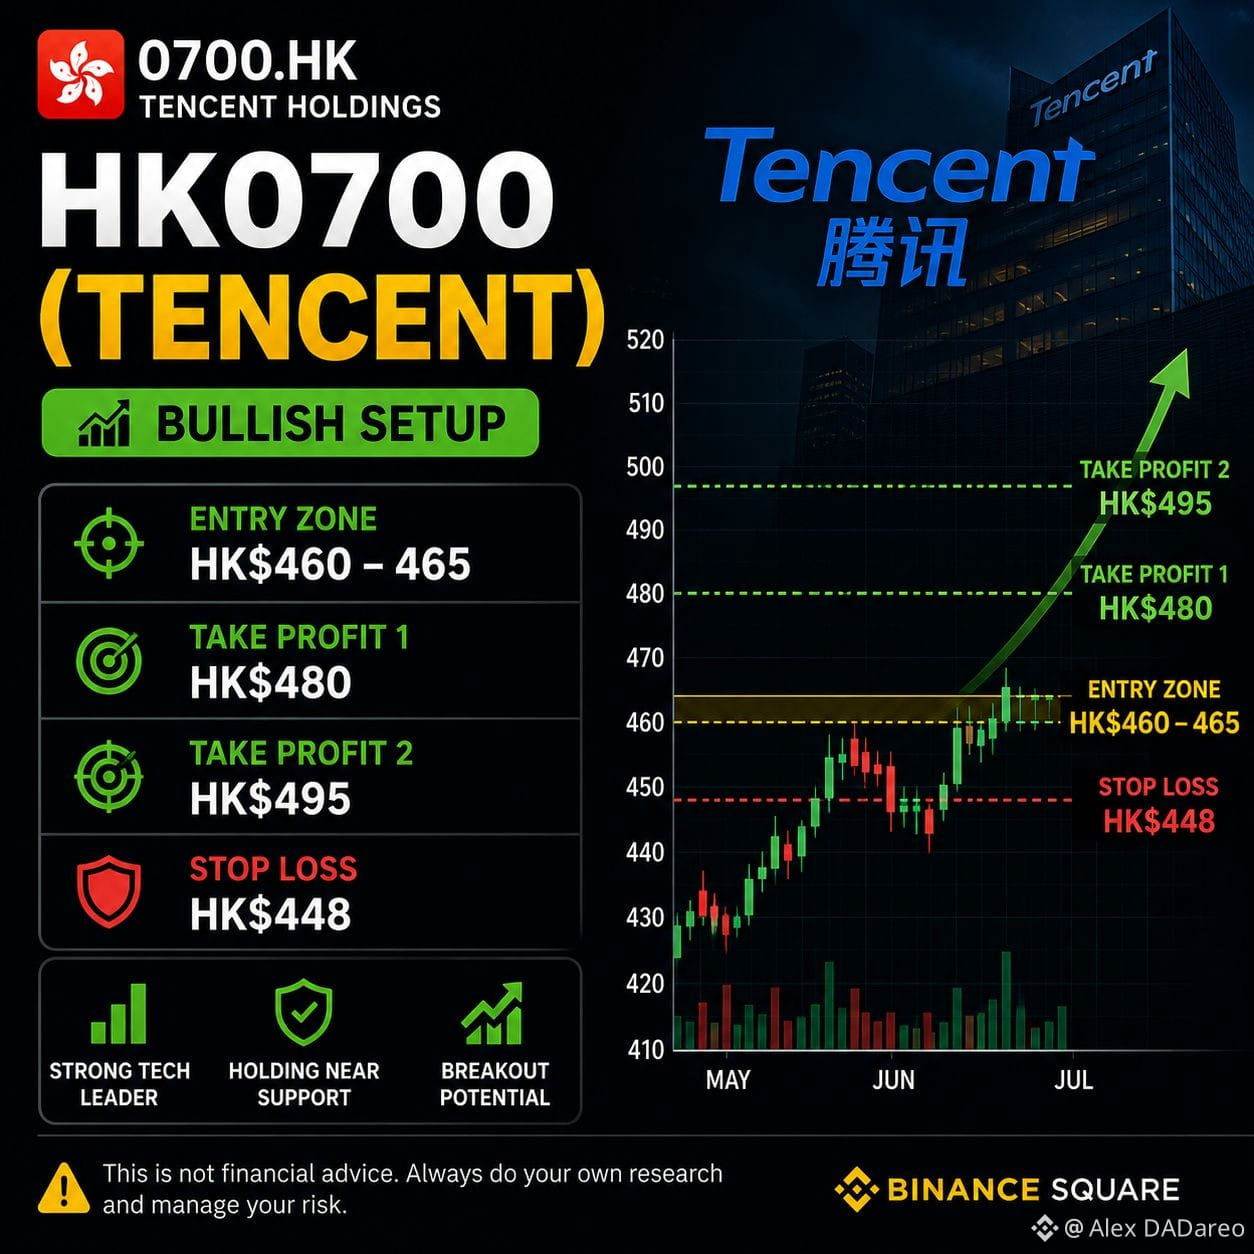
📊 Trade Idea: $HK0700 (Tencent)
Bias: Bullish above support
📍 Entry: HK$460–465
🎯 Take Profit 1: HK$480
🎯 Take Profit 2: HK$495
🛑 Stop Loss: HK$448
Why I'm watching it: ✅ Strong tech leader in China
✅ Holding near an important support zone
✅ A breakout above resistance could improve momentum
⚠️ This is a personal market view, not financial advice. Always wait for confirmation and manage your risk.
Are you bullish or bearish on HK0700? 👇#HK0700 #Write2Earn #RiskManagement
{future}(HK0700USDT)
📊 Trade Idea: $HK0700 (Tencent)
Bias: Bullish above support
📍 Entry: HK$460–465
🎯 Take Profit 1: HK$480
🎯 Take Profit 2: HK$495
🛑 Stop Loss: HK$448
Why I'm watching it: ✅ Strong tech leader in China
✅ Holding near an important support zone
✅ A breakout above resistance could improve momentum
⚠️ This is a personal market view, not financial advice. Always wait for confirmation and manage your risk.
Are you bullish or bearish on HK0700? 👇#HK0700 #Write2Earn #RiskManagement
Bias: Bullish above support
📍 Entry: HK$460–465
🎯 Take Profit 1: HK$480
🎯 Take Profit 2: HK$495
🛑 Stop Loss: HK$448
Why I'm watching it: ✅ Strong tech leader in China
✅ Holding near an important support zone
✅ A breakout above resistance could improve momentum
⚠️ This is a personal market view, not financial advice. Always wait for confirmation and manage your risk.
Are you bullish or bearish on HK0700? 👇#HK0700 #Write2Earn #RiskManagement
3
597

·
--
$HK0700 FUTURES GO LIVE - MAJOR VOLATILITY AHEAD 🔥
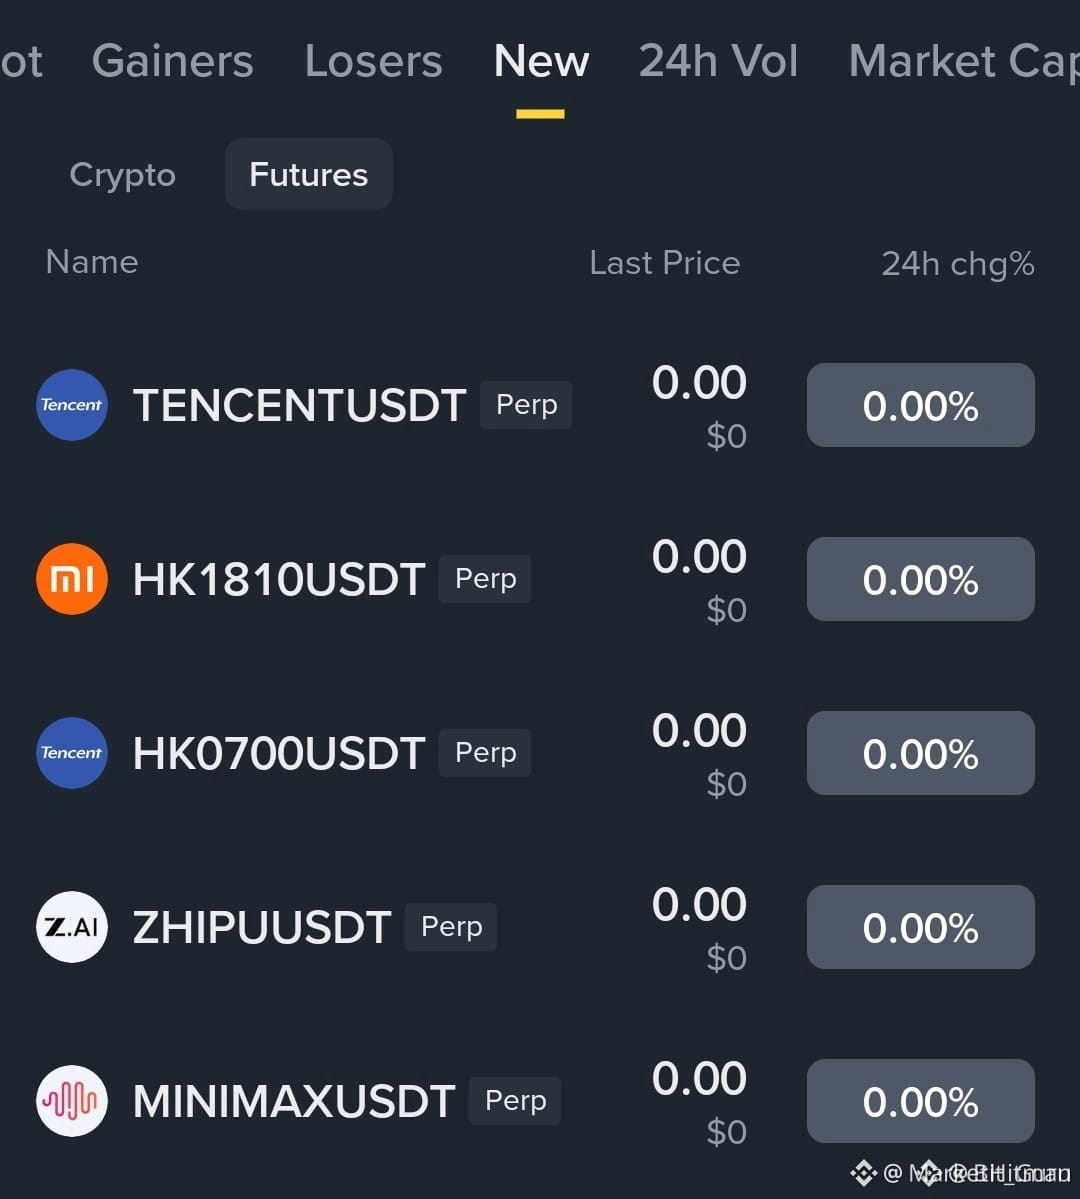
A top-tier exchange has just expanded its futures lineup with several new listings including $TENCENT and $HK0700 . New pairs historically attract significant volume but the first candle often traps latecomers.
Data shows that roughly 70% of these listings see an initial spike above the launch price before retracing within the first few hours. Wait for a confirmed structure sweep or order block entry instead of fading the open.
Are you planning to trade the initial breakout or the retest?
Not financial advice. Always manage your risk.
#HK0700 #Futures #NewListing #TradingSetup #Volatility
🔥
$HK0700 FUTURES GO LIVE - MAJOR VOLATILITY AHEAD 🔥
A top-tier exchange has just expanded its futures lineup with several new listings including $TENCENT and $HK0700 . New pairs historically attract significant volume but the first candle often traps latecomers.
Data shows that roughly 70% of these listings see an initial spike above the launch price before retracing within the first few hours. Wait for a confirmed structure sweep or order block entry instead of fading the open.
Are you planning to trade the initial breakout or the retest?
Not financial advice. Always manage your risk.
#HK0700 #Futures #NewListing #TradingSetup #Volatility
🔥
A top-tier exchange has just expanded its futures lineup with several new listings including $TENCENT and $HK0700 . New pairs historically attract significant volume but the first candle often traps latecomers.
Data shows that roughly 70% of these listings see an initial spike above the launch price before retracing within the first few hours. Wait for a confirmed structure sweep or order block entry instead of fading the open.
Are you planning to trade the initial breakout or the retest?
Not financial advice. Always manage your risk.
#HK0700 #Futures #NewListing #TradingSetup #Volatility
🔥
1.4k

NEW PERPETUAL CONTRACTS GOING LIVE ON A TOP-TIER EXCHANGE - $HK0700 $HK1810 🚀
New perpetual listings almost always bring early volatility. These go live tomorrow morning starting 11:00 UTC+8, with staggered rollouts every 5 minutes. The HK0700 and HK1810 quanto contracts are particularly interesting — they're tied to Hong Kong stock indexes and could see heavy initial flow.
I've seen similar launches produce quick 10-15% moves in the first hour when the market catches liquidity. Volume spikes early, and the first traders to lock in positions often get the best fills. Which one are you watching first?
Not financial advice. Always manage your risk.
#HK0700 #HK1810 #NewListing #Perpetuals #Crypto
🔥
NEW PERPETUAL CONTRACTS GOING LIVE ON A TOP-TIER EXCHANGE - $HK0700 $HK1810 🚀
New perpetual listings almost always bring early volatility. These go live tomorrow morning starting 11:00 UTC+8, with staggered rollouts every 5 minutes. The HK0700 and HK1810 quanto contracts are particularly interesting — they're tied to Hong Kong stock indexes and could see heavy initial flow.
I've seen similar launches produce quick 10-15% moves in the first hour when the market catches liquidity. Volume spikes early, and the first traders to lock in positions often get the best fills. Which one are you watching first?
Not financial advice. Always manage your risk.
#HK0700 #HK1810 #NewListing #Perpetuals #Crypto
🔥
New perpetual listings almost always bring early volatility. These go live tomorrow morning starting 11:00 UTC+8, with staggered rollouts every 5 minutes. The HK0700 and HK1810 quanto contracts are particularly interesting — they're tied to Hong Kong stock indexes and could see heavy initial flow.
I've seen similar launches produce quick 10-15% moves in the first hour when the market catches liquidity. Volume spikes early, and the first traders to lock in positions often get the best fills. Which one are you watching first?
Not financial advice. Always manage your risk.
#HK0700 #HK1810 #NewListing #Perpetuals #Crypto
🔥
51
Log in to explore more content
Join global crypto users on Binance Square
⚡️ Get latest and useful information about crypto.
💬 Trusted by the world’s largest crypto exchange.
👍 Discover real insights from verified creators.
Email / Phone number
Trending Topics
1
#USPPIMissMayEaseBTCPressure
89,491 views
1,133 Discussing
2
#MANTRAPausesUnstakingFor7DaysAfterKeplrSecurityIncident
255 views
11 Discussing
3
#BitcoinCoreDisclosesTorTrafficVulnerability
40,961 views
638 Discussing
4
#WhatWillDriveCryptoandStocks’NextRebound?
222,195 views
1,856 Discussing
5
#BitcoinBreaksBelow200WeekMovingAverage
86,769 views
695 Discussing
6
#SpaceXTeslaMergerTalksWouldCombine30220BTC
27,628 views
393 Discussing
7
#Anthropic’s6xIPODemandSignalsPotentialRecordRaise
82,763 views
842 Discussing
8
#USCryptoETFsLose$1.48BInFiveDays
3,682 views
59 Discussing
9
#KoreaDigitalAssetBasicActFinalDraftExpectedEarlyJanuary
4,679 views
32 Discussing
10
#RippleRLUSDMarketCapSurpassesPayPalPYUSD
17,756 views
204 Discussing