
#kstr
kstr
10,595 views
193 Discussing
Hot
Latest


·
--
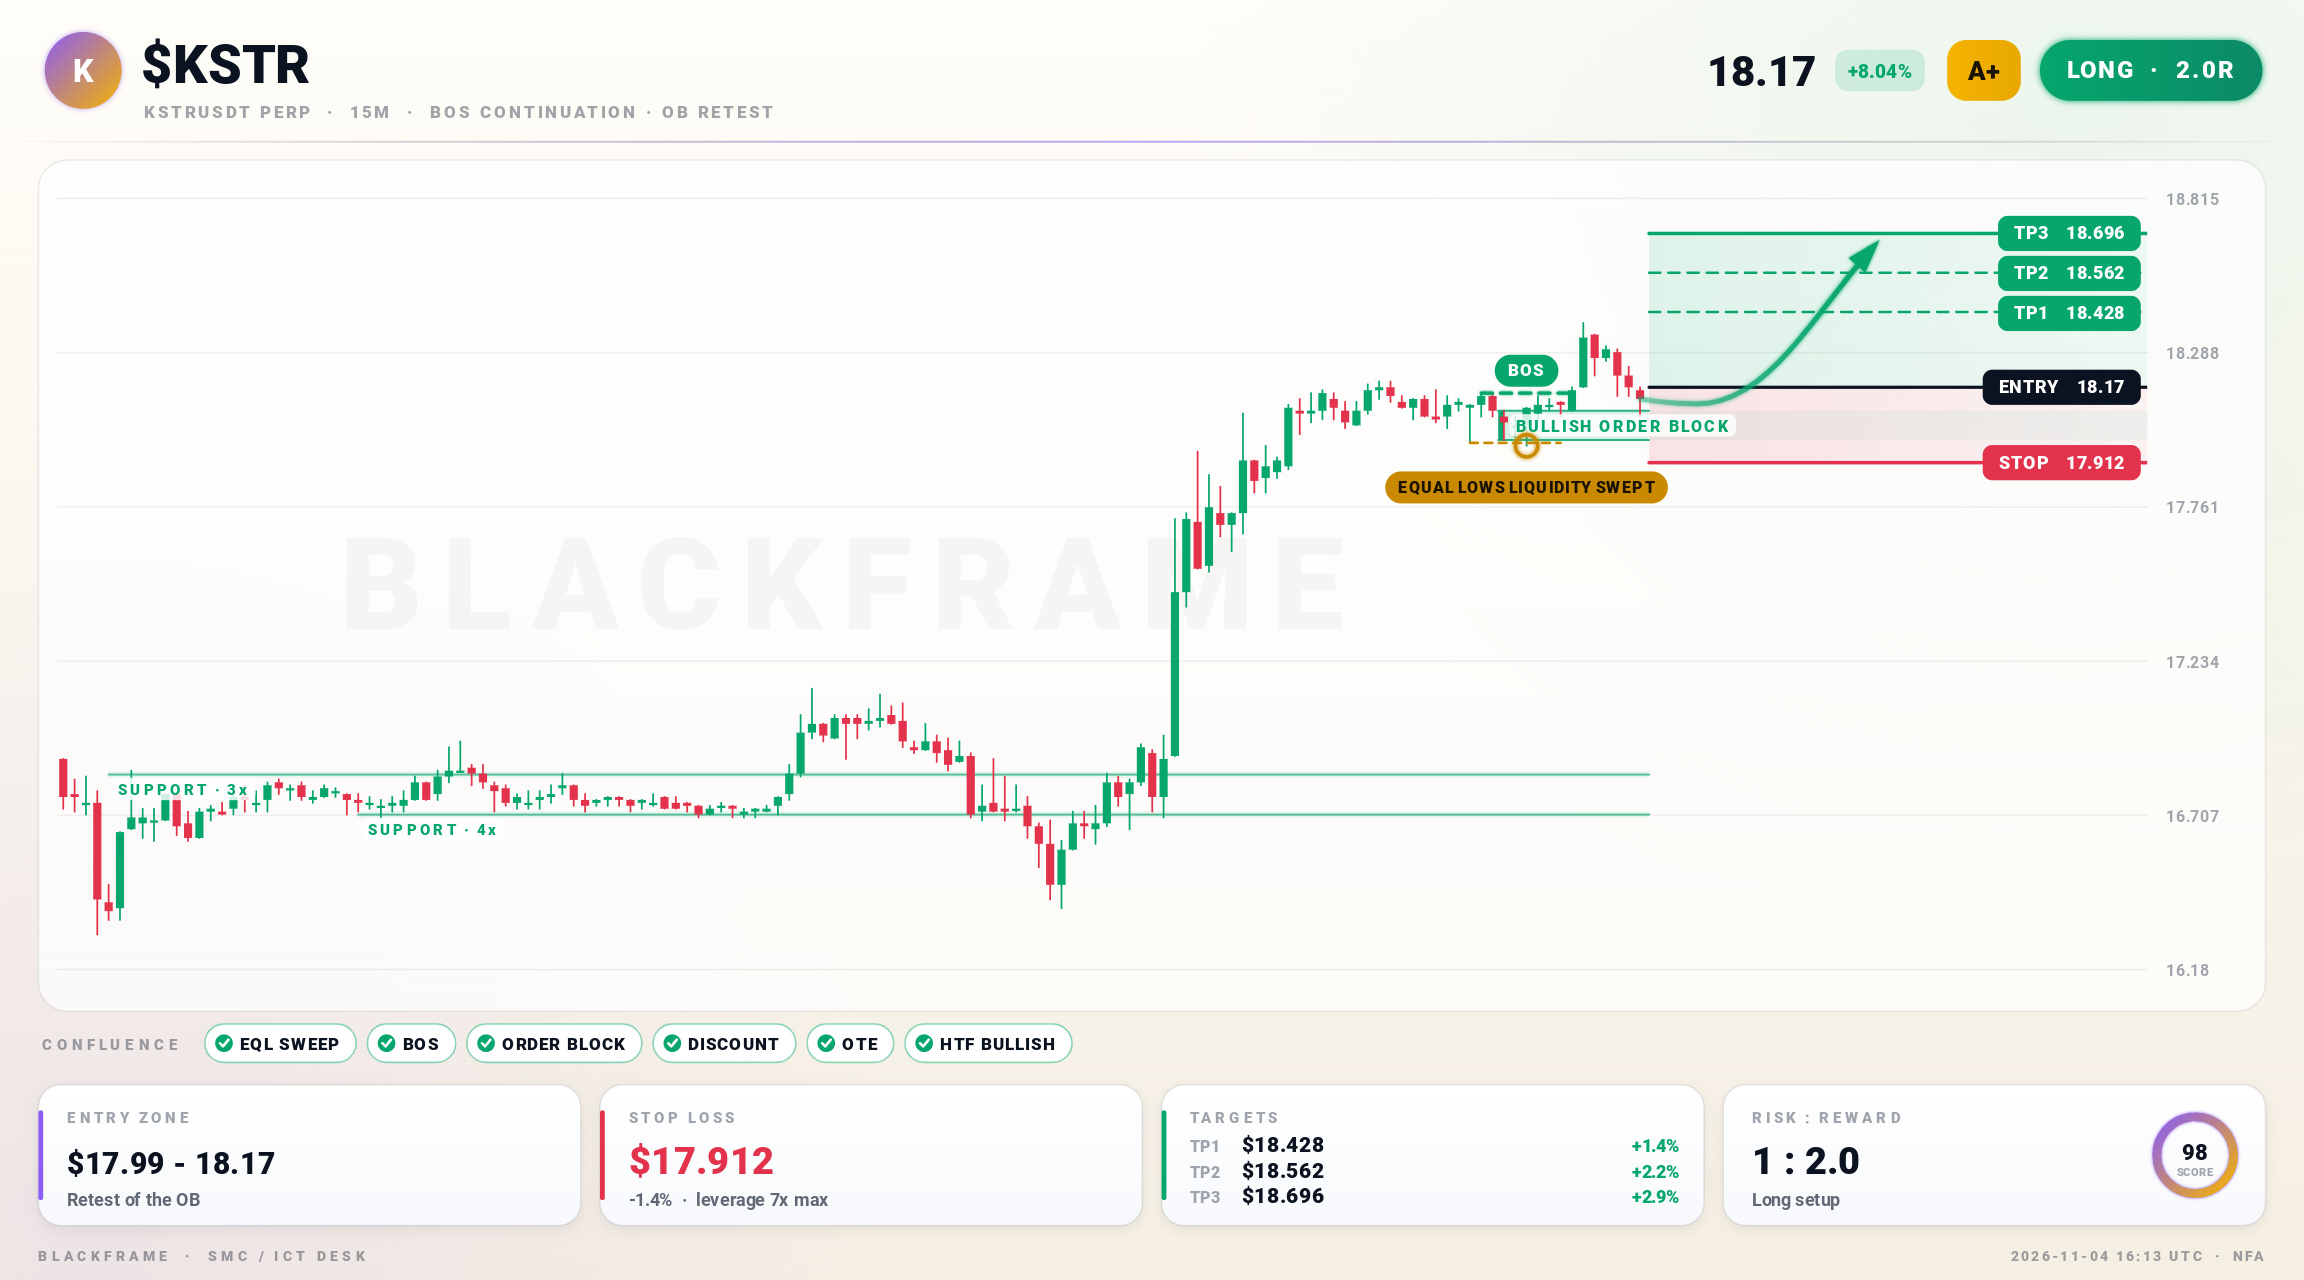
📈 $KSTR broke structure higher, continuation long
LONG · 15M
Entry: $18.09 - $18.17
TP1: $18.428
TP2: $18.562
TP3: $18.696
SL: $17.912
Sell-side liquidity below the equal lows was swept and price closed back inside. Structure continues higher with a fresh BOS on the 15M. Entry is the first retest of the fresh bullish order block in discount, targeting buy-side liquidity above.
#KSTR #PriceAction · NFA
📈 $KSTR broke structure higher, continuation long
LONG · 15M
Entry: $18.09 - $18.17
TP1: $18.428
TP2: $18.562
TP3: $18.696
SL: $17.912
Sell-side liquidity below the equal lows was swept and price closed back inside. Structure continues higher with a fresh BOS on the 15M. Entry is the first retest of the fresh bullish order block in discount, targeting buy-side liquidity above.
#KSTR #PriceAction · NFA
LONG · 15M
Entry: $18.09 - $18.17
TP1: $18.428
TP2: $18.562
TP3: $18.696
SL: $17.912
Sell-side liquidity below the equal lows was swept and price closed back inside. Structure continues higher with a fresh BOS on the 15M. Entry is the first retest of the fresh bullish order block in discount, targeting buy-side liquidity above.
#KSTR #PriceAction · NFA
333

·
--
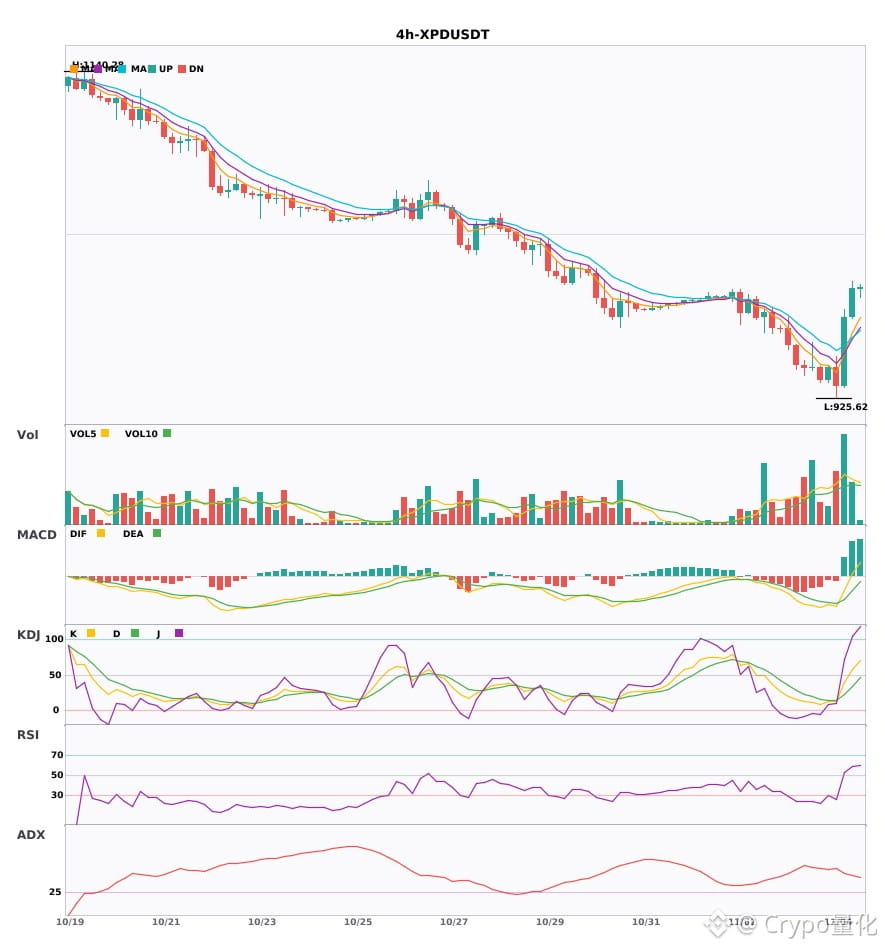
$KSTR / $ZAMA / $XPD 4-hour confluence turns bullish; bullish signals appear simultaneously🔥
════════════════════
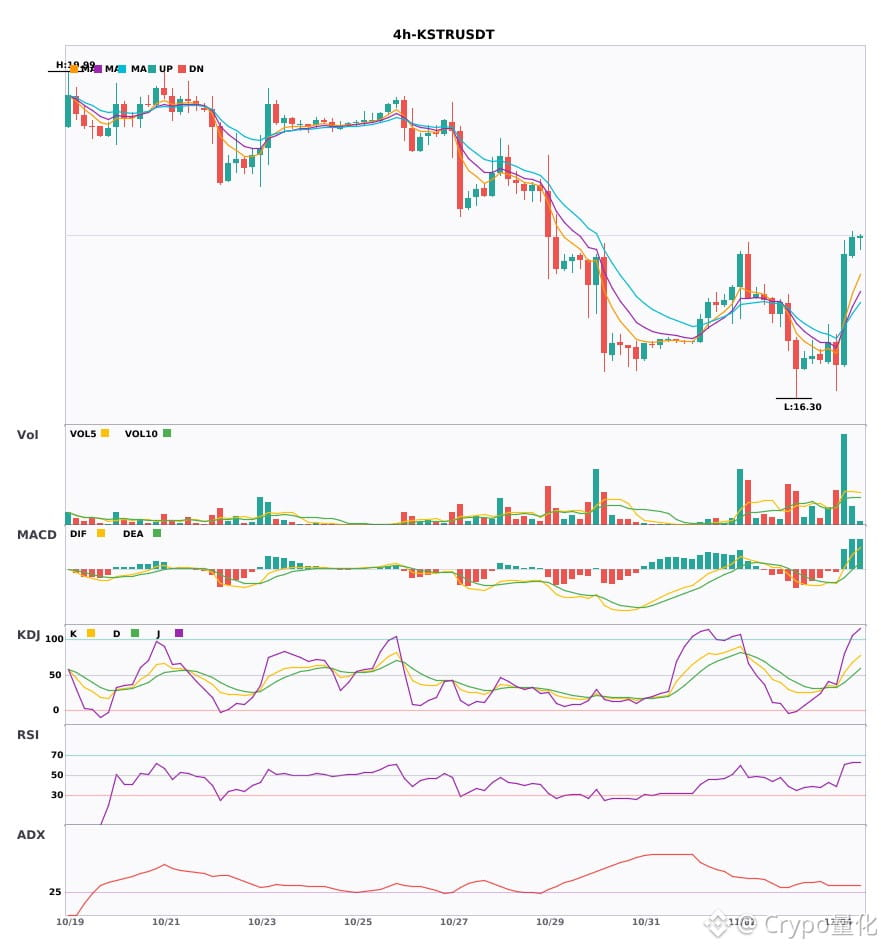
🔴 $KSTR 4-hour bullish signal
⚠️Technical analysis: ADX(34) indicates a clear trending market | MACD golden cross above zero, bullish momentum released | EMA5 crosses above EMA8, short-term outlook turns bullish | Volume surge (3.5x)
════════════════════
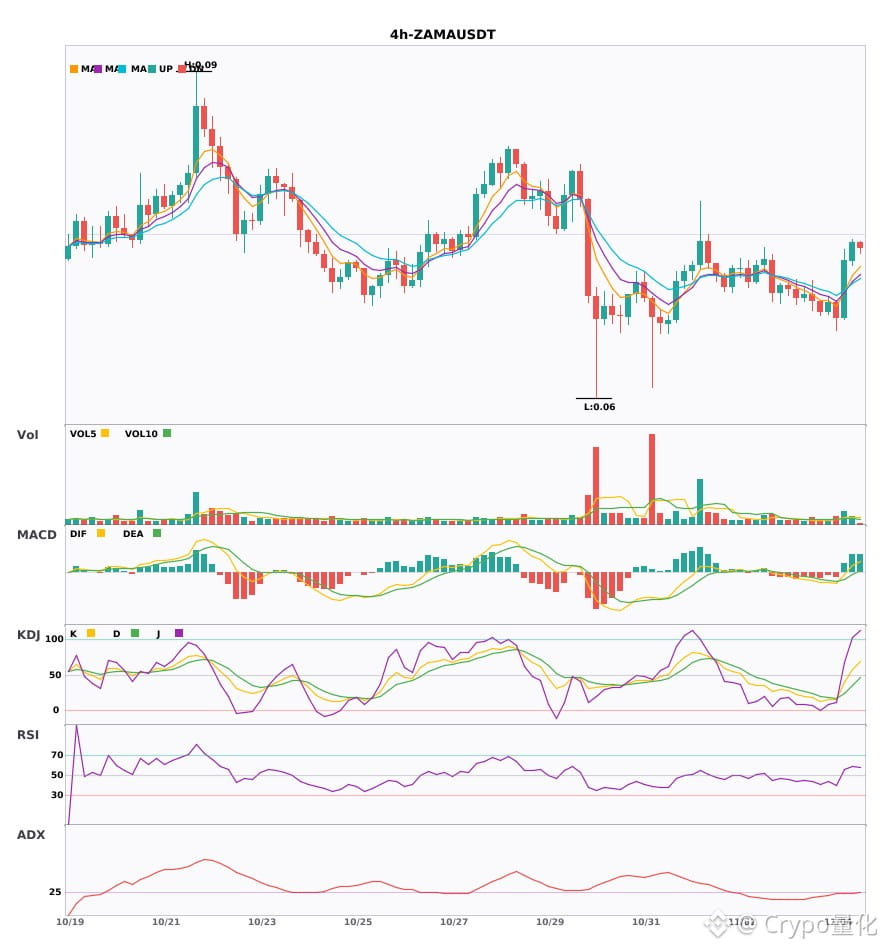
🔴 $ZAMA 4-hour bullish signal
⚠️Technical analysis: ADX(28) trend is forming, potential entry | MACD DIF breaks above the zero line, trend turns bullish | EMA5 > EMA8 > EMA13, bullish alignment | Volume increases (2.1x)
════════════════════
🔴 $XPD 4-hour bullish signal
⚠️Technical analysis: ADX(45) indicates a clear trending market | MACD DIF breaks above the zero line, trend turns bullish | EMA5 crosses above EMA8, short-term outlook turns bullish | Volume increases (2.4x)
════════════════════
🔔 Follow for the latest market movements 🔔
#技术分析 #KSTR #ZAMA #XPD
📌 When trading, pay attention to whether the candlestick pattern confirms the signal
$KSTR / $ZAMA / $XPD 4-hour confluence turns bullish; bullish signals appear simultaneously🔥
════════════════════
🔴 $KSTR 4-hour bullish signal
⚠️Technical analysis: ADX(34) indicates a clear trending market | MACD golden cross above zero, bullish momentum released | EMA5 crosses above EMA8, short-term outlook turns bullish | Volume surge (3.5x)
════════════════════
🔴 $ZAMA 4-hour bullish signal
⚠️Technical analysis: ADX(28) trend is forming, potential entry | MACD DIF breaks above the zero line, trend turns bullish | EMA5 > EMA8 > EMA13, bullish alignment | Volume increases (2.1x)
════════════════════
🔴 $XPD 4-hour bullish signal
⚠️Technical analysis: ADX(45) indicates a clear trending market | MACD DIF breaks above the zero line, trend turns bullish | EMA5 crosses above EMA8, short-term outlook turns bullish | Volume increases (2.4x)
════════════════════
🔔 Follow for the latest market movements 🔔
#技术分析 #KSTR #ZAMA #XPD
📌 When trading, pay attention to whether the candlestick pattern confirms the signal
════════════════════
🔴 $KSTR 4-hour bullish signal
⚠️Technical analysis: ADX(34) indicates a clear trending market | MACD golden cross above zero, bullish momentum released | EMA5 crosses above EMA8, short-term outlook turns bullish | Volume surge (3.5x)
════════════════════
🔴 $ZAMA 4-hour bullish signal
⚠️Technical analysis: ADX(28) trend is forming, potential entry | MACD DIF breaks above the zero line, trend turns bullish | EMA5 > EMA8 > EMA13, bullish alignment | Volume increases (2.1x)
════════════════════
🔴 $XPD 4-hour bullish signal
⚠️Technical analysis: ADX(45) indicates a clear trending market | MACD DIF breaks above the zero line, trend turns bullish | EMA5 crosses above EMA8, short-term outlook turns bullish | Volume increases (2.4x)
════════════════════
🔔 Follow for the latest market movements 🔔
#技术分析 #KSTR #ZAMA #XPD
📌 When trading, pay attention to whether the candlestick pattern confirms the signal
19

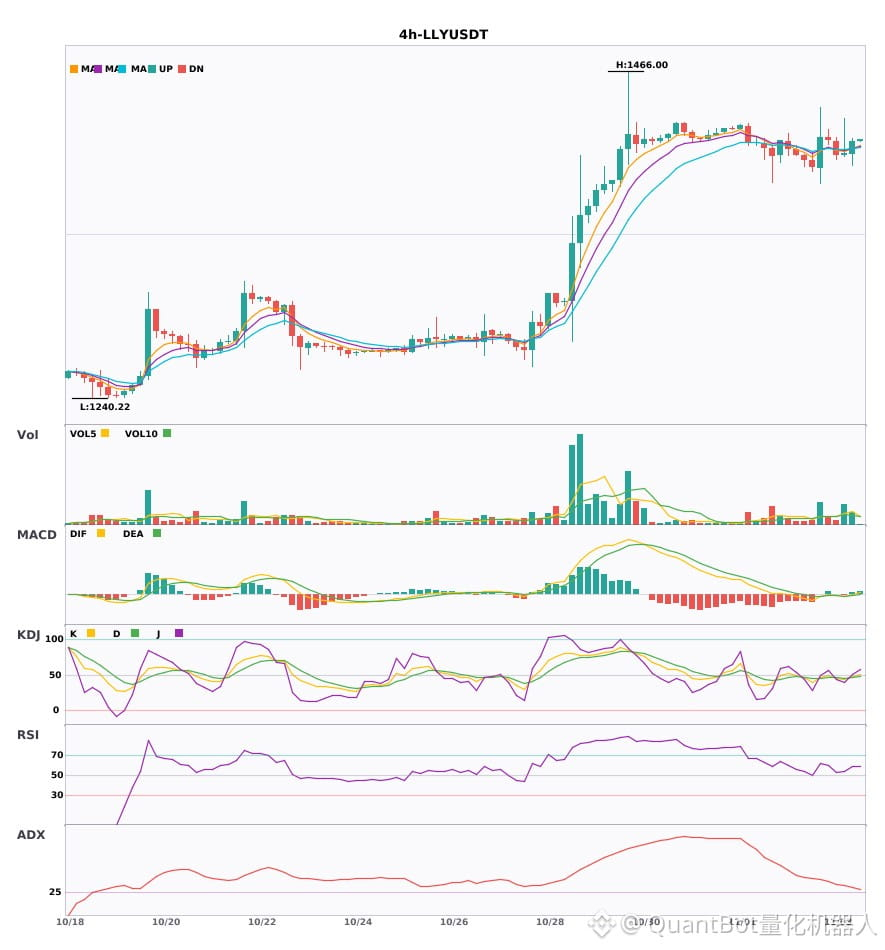
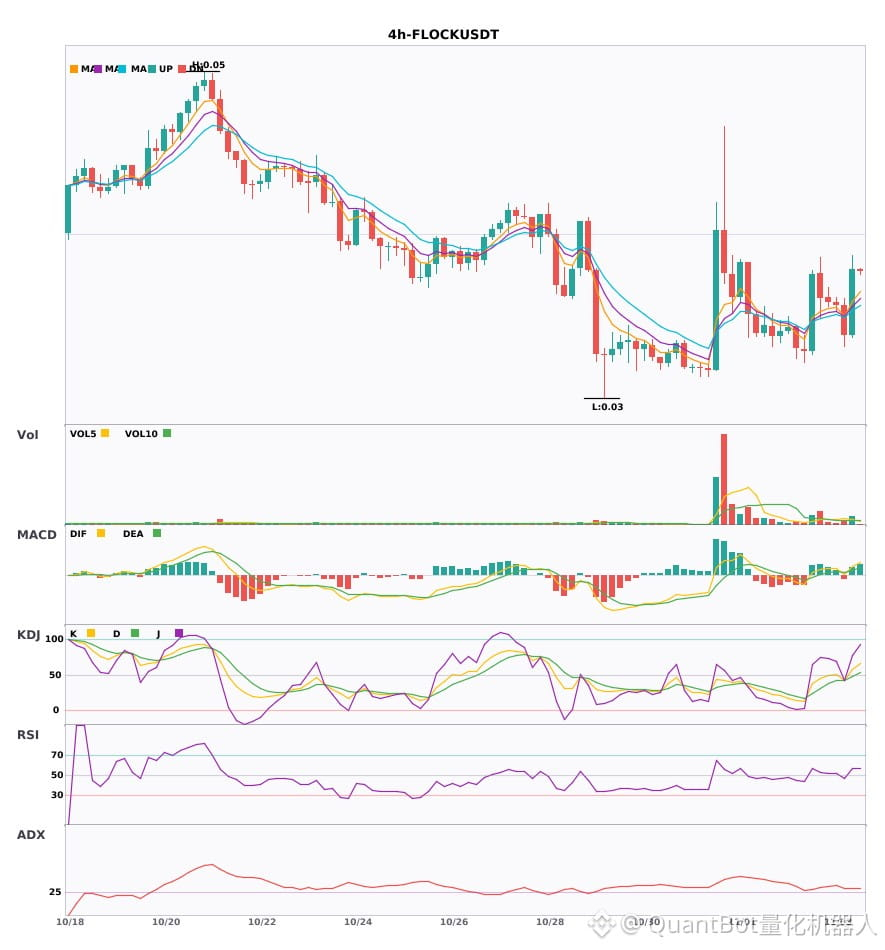
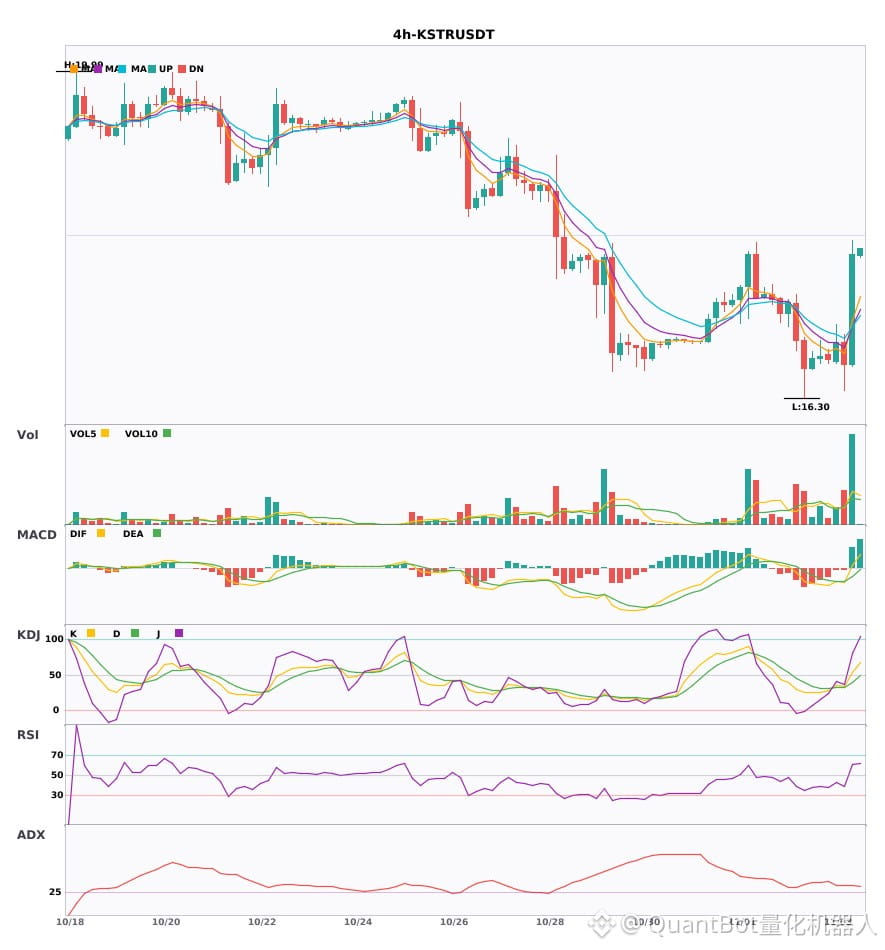
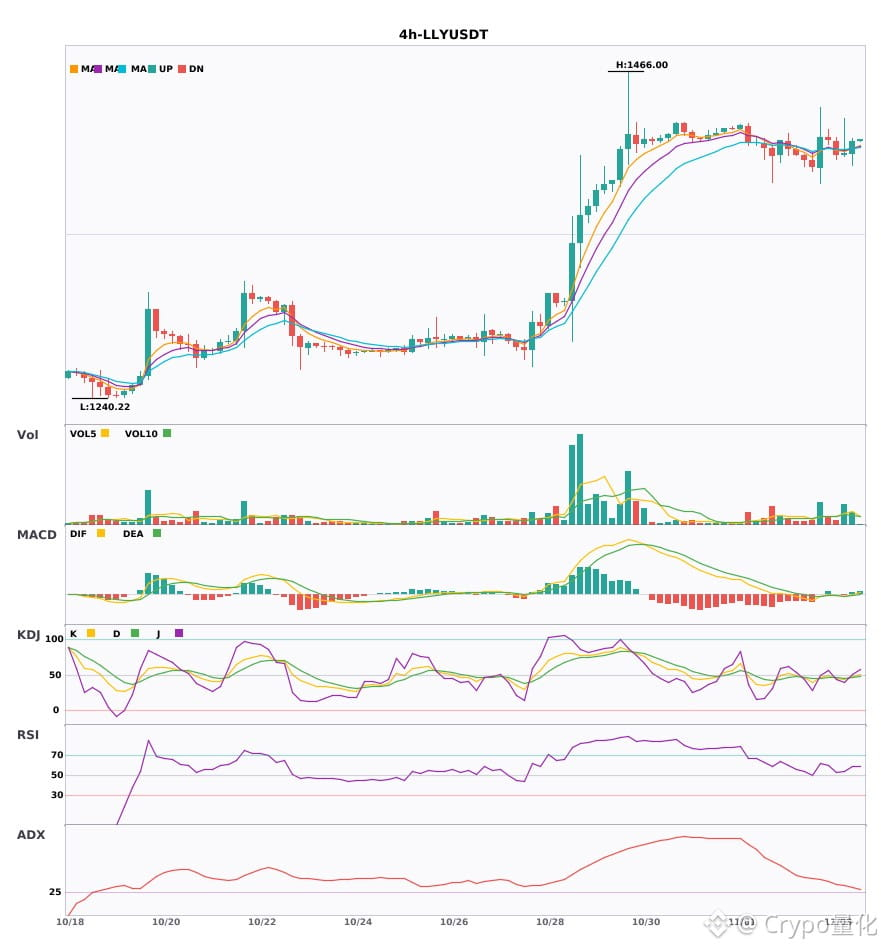
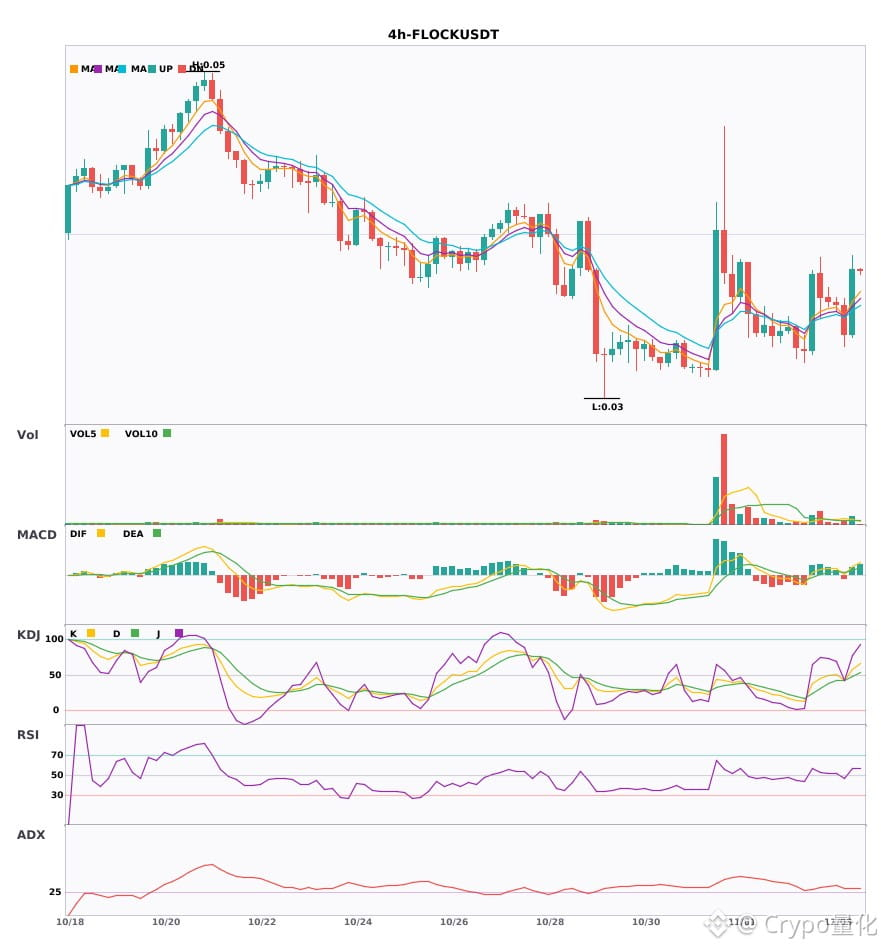
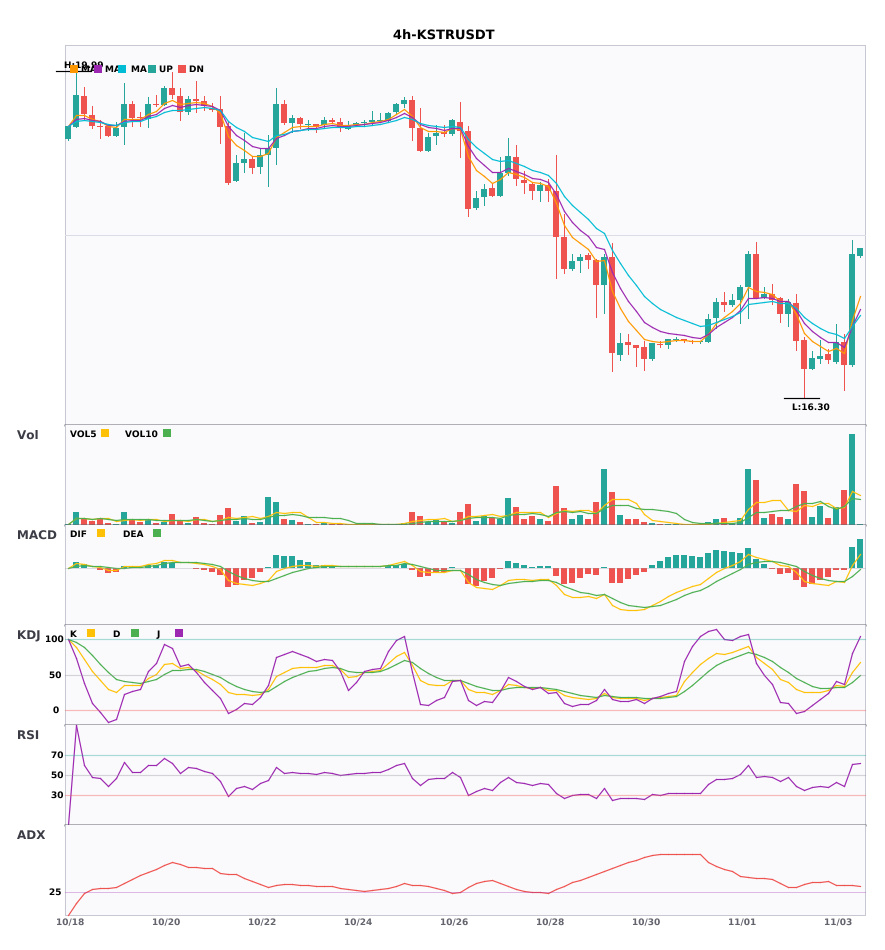
$LLY / $FLOCK / $KSTR 4-hour technicals are strengthening simultaneously—which has greater breakout potential?
📈 $LLY | 4-hour bullish signal
━━━━━━━━━━━━━━━━━━
Technical analysis: ADX(30) Trend is forming; potential entry | MACD bullish crossover above zero, bullish momentum emerging | EMA5 crosses above EMA8, short-term outlook turns bullish | KDJ bullish crossover, bullish short-term outlook (K is 47.3, D is 45.9) | Volume increases (2.0x)
Price change: 0.6000%
📈 $FLOCK | 4-hour bullish signal
━━━━━━━━━━━━━━━━━━
Technical analysis: ADX(28) Trend is forming; potential entry | MACD bullish crossover above zero, bullish momentum emerging | EMA5 crosses above EMA8, short-term outlook turns bullish | Volume increases (1.8x)
Price change: 7.7700%
📈 $KSTR | 4-hour bullish signal
━━━━━━━━━━━━━━━━━━
Technical analysis: ADX(34) Clear trending market | MACD bullish crossover above zero, bullish momentum emerging | EMA5 crosses above EMA8, short-term outlook turns bullish | Volume surges (3.5x)
Price change: 7.4300%
━━━━━━━━━━━━━━━━━━
#技术分析 #LLY #FLOCK #KSTR
📌 The above content is for reference only and does not constitute investment advice
$LLY / $FLOCK / $KSTR 4-hour technicals are strengthening simultaneously—which has greater breakout potential?
📈 $LLY | 4-hour bullish signal
━━━━━━━━━━━━━━━━━━
Technical analysis: ADX(30) Trend is forming; potential entry | MACD bullish crossover above zero, bullish momentum emerging | EMA5 crosses above EMA8, short-term outlook turns bullish | KDJ bullish crossover, bullish short-term outlook (K is 47.3, D is 45.9) | Volume increases (2.0x)
Price change: 0.6000%
📈 $FLOCK | 4-hour bullish signal
━━━━━━━━━━━━━━━━━━
Technical analysis: ADX(28) Trend is forming; potential entry | MACD bullish crossover above zero, bullish momentum emerging | EMA5 crosses above EMA8, short-term outlook turns bullish | Volume increases (1.8x)
Price change: 7.7700%
📈 $KSTR | 4-hour bullish signal
━━━━━━━━━━━━━━━━━━
Technical analysis: ADX(34) Clear trending market | MACD bullish crossover above zero, bullish momentum emerging | EMA5 crosses above EMA8, short-term outlook turns bullish | Volume surges (3.5x)
Price change: 7.4300%
━━━━━━━━━━━━━━━━━━
#技术分析 #LLY #FLOCK #KSTR
📌 The above content is for reference only and does not constitute investment advice
📈 $LLY | 4-hour bullish signal
━━━━━━━━━━━━━━━━━━
Technical analysis: ADX(30) Trend is forming; potential entry | MACD bullish crossover above zero, bullish momentum emerging | EMA5 crosses above EMA8, short-term outlook turns bullish | KDJ bullish crossover, bullish short-term outlook (K is 47.3, D is 45.9) | Volume increases (2.0x)
Price change: 0.6000%
📈 $FLOCK | 4-hour bullish signal
━━━━━━━━━━━━━━━━━━
Technical analysis: ADX(28) Trend is forming; potential entry | MACD bullish crossover above zero, bullish momentum emerging | EMA5 crosses above EMA8, short-term outlook turns bullish | Volume increases (1.8x)
Price change: 7.7700%
📈 $KSTR | 4-hour bullish signal
━━━━━━━━━━━━━━━━━━
Technical analysis: ADX(34) Clear trending market | MACD bullish crossover above zero, bullish momentum emerging | EMA5 crosses above EMA8, short-term outlook turns bullish | Volume surges (3.5x)
Price change: 7.4300%
━━━━━━━━━━━━━━━━━━
#技术分析 #LLY #FLOCK #KSTR
📌 The above content is for reference only and does not constitute investment advice
10
·
--
Three 4-hour bullish signals appearing simultaneously: $LLY / $FLOCK / $KSTR🔥
════════════════════
🔴 $LLY 4-hour bullish signal
⚠️Technical analysis: ADX(30): Trend is forming; entry possible | MACD bullish crossover above zero, bullish momentum is building | EMA5 crossed above EMA8, short-term trend turns bullish | KDJ bullish crossover, short-term outlook bullish (K is 47.3, D is 45.9) | Volume increased (2.0x)
════════════════════
🔴 $FLOCK 4-hour bullish signal
⚠️Technical analysis: ADX(28): Trend is forming; entry possible | MACD bullish crossover above zero, bullish momentum is building | EMA5 crossed above EMA8, short-term trend turns bullish | Volume increased (1.8x)
════════════════════
🔴 $KSTR 4-hour bullish signal
⚠️Technical analysis: ADX(34): Clear trending market | MACD bullish crossover above zero, bullish momentum is building | EMA5 crossed above EMA8, short-term trend turns bullish | Volume surged (3.5x)
════════════════════
🔔 Follow for first-hand market updates 🔔
#技术分析 #LLY #FLOCK #KSTR
📌 When trading, pay attention to whether the candlestick pattern confirms the signal
Three 4-hour bullish signals appearing simultaneously: $LLY / $FLOCK / $KSTR 🔥
════════════════════
🔴 $LLY 4-hour bullish signal
⚠️Technical analysis: ADX(30): Trend is forming; entry possible | MACD bullish crossover above zero, bullish momentum is building | EMA5 crossed above EMA8, short-term trend turns bullish | KDJ bullish crossover, short-term outlook bullish (K is 47.3, D is 45.9) | Volume increased (2.0x)
════════════════════
🔴 $FLOCK 4-hour bullish signal
⚠️Technical analysis: ADX(28): Trend is forming; entry possible | MACD bullish crossover above zero, bullish momentum is building | EMA5 crossed above EMA8, short-term trend turns bullish | Volume increased (1.8x)
════════════════════
🔴 $KSTR 4-hour bullish signal
⚠️Technical analysis: ADX(34): Clear trending market | MACD bullish crossover above zero, bullish momentum is building | EMA5 crossed above EMA8, short-term trend turns bullish | Volume surged (3.5x)
════════════════════
🔔 Follow for first-hand market updates 🔔
#技术分析 #LLY #FLOCK #KSTR
📌 When trading, pay attention to whether the candlestick pattern confirms the signal
════════════════════
🔴 $LLY 4-hour bullish signal
⚠️Technical analysis: ADX(30): Trend is forming; entry possible | MACD bullish crossover above zero, bullish momentum is building | EMA5 crossed above EMA8, short-term trend turns bullish | KDJ bullish crossover, short-term outlook bullish (K is 47.3, D is 45.9) | Volume increased (2.0x)
════════════════════
🔴 $FLOCK 4-hour bullish signal
⚠️Technical analysis: ADX(28): Trend is forming; entry possible | MACD bullish crossover above zero, bullish momentum is building | EMA5 crossed above EMA8, short-term trend turns bullish | Volume increased (1.8x)
════════════════════
🔴 $KSTR 4-hour bullish signal
⚠️Technical analysis: ADX(34): Clear trending market | MACD bullish crossover above zero, bullish momentum is building | EMA5 crossed above EMA8, short-term trend turns bullish | Volume surged (3.5x)
════════════════════
🔔 Follow for first-hand market updates 🔔
#技术分析 #LLY #FLOCK #KSTR
📌 When trading, pay attention to whether the candlestick pattern confirms the signal
8


·
--
Bullish
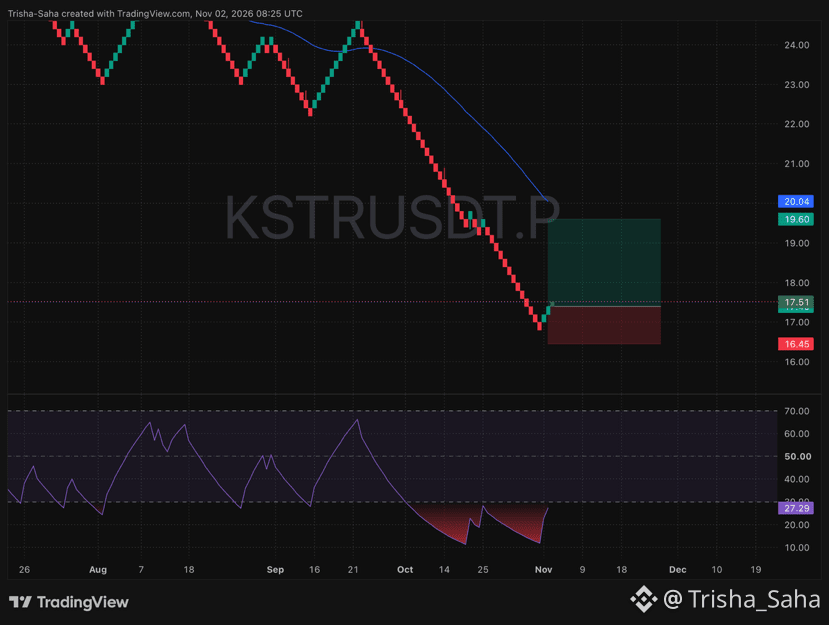
☄️ $KSTR DUMP HAS HIT ROCK BOTTOM! MASSIVE SNAP-BACK STARTING! 📈💥
📍 Trade Setup:
• Entry Zone: $17.20 – $17.51
• Stop Loss: $16.45
• Target: $19.60
📌 Chart Analysis:
• The non-stop bleeding finally hit a brick wall right around $16.80 as sellers completely ran out of coins to dump.
• Three straight green candles are firing off the floor right now, proving aggressive buyers have stepped in to flip the trend upward.
• The lower strength indicator just formed a clean double-bottom in the red bargain zone and hooked sharply up to 27.29, signaling a fast run toward the blue line.
🔐 Lock in a 100% risk-free ride by sliding your Stop Loss straight to your entry price once we hit +3% to +4% profit!
My bags are packed and my order is live. Who is banking this bounce to $19.60 with me? Drop a 🚀 below! 👇
#KSTR #KSTRUSDT #CryptoTrading #BinanceSquare
{future}(KSTRUSDT)
☄️ $KSTR DUMP HAS HIT ROCK BOTTOM! MASSIVE SNAP-BACK STARTING! 📈💥
📍 Trade Setup:
• Entry Zone: $17.20 – $17.51
• Stop Loss: $16.45
• Target: $19.60
📌 Chart Analysis:
• The non-stop bleeding finally hit a brick wall right around $16.80 as sellers completely ran out of coins to dump.
• Three straight green candles are firing off the floor right now, proving aggressive buyers have stepped in to flip the trend upward.
• The lower strength indicator just formed a clean double-bottom in the red bargain zone and hooked sharply up to 27.29, signaling a fast run toward the blue line.
🔐 Lock in a 100% risk-free ride by sliding your Stop Loss straight to your entry price once we hit +3% to +4% profit!
My bags are packed and my order is live. Who is banking this bounce to $19.60 with me? Drop a 🚀 below! 👇
#KSTR #KSTRUSDT #CryptoTrading #BinanceSquare
📍 Trade Setup:
• Entry Zone: $17.20 – $17.51
• Stop Loss: $16.45
• Target: $19.60
📌 Chart Analysis:
• The non-stop bleeding finally hit a brick wall right around $16.80 as sellers completely ran out of coins to dump.
• Three straight green candles are firing off the floor right now, proving aggressive buyers have stepped in to flip the trend upward.
• The lower strength indicator just formed a clean double-bottom in the red bargain zone and hooked sharply up to 27.29, signaling a fast run toward the blue line.
🔐 Lock in a 100% risk-free ride by sliding your Stop Loss straight to your entry price once we hit +3% to +4% profit!
My bags are packed and my order is live. Who is banking this bounce to $19.60 with me? Drop a 🚀 below! 👇
#KSTR #KSTRUSDT #CryptoTrading #BinanceSquare
188

·
--
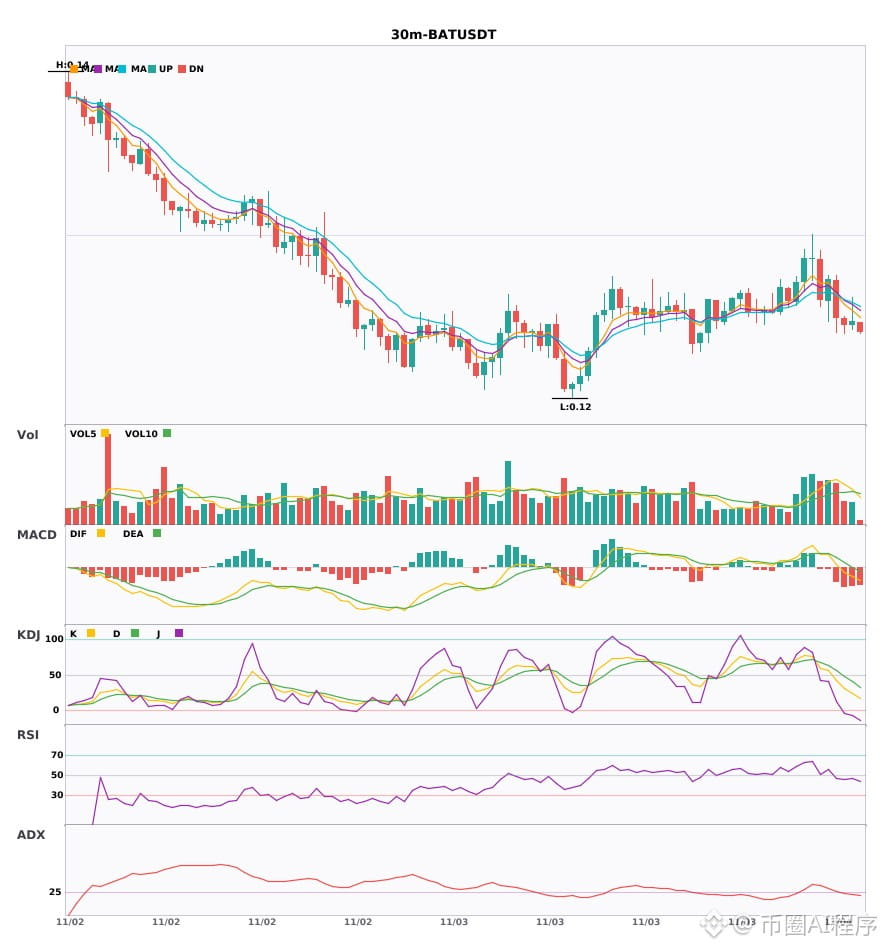
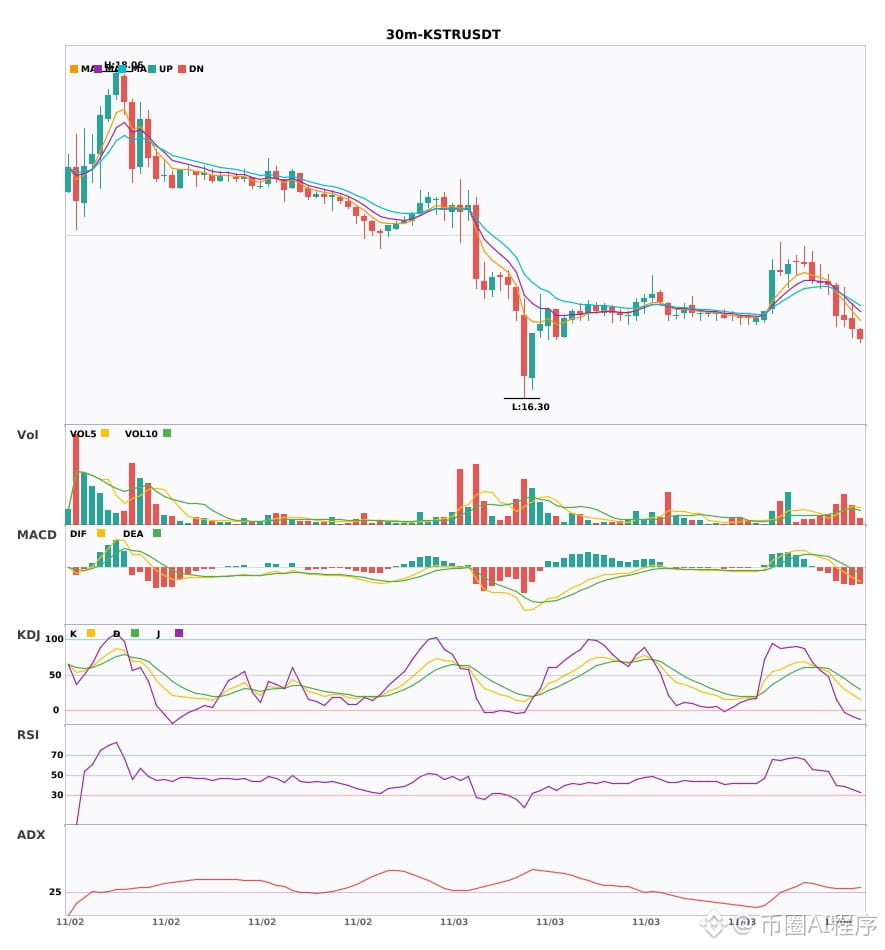
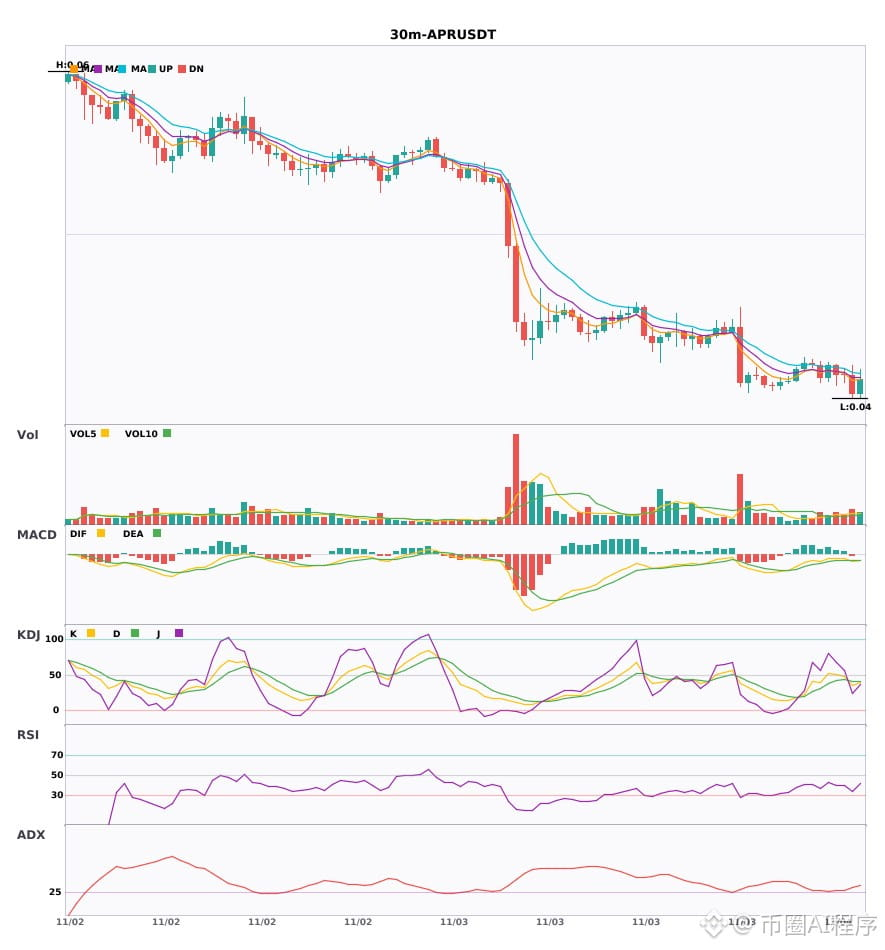
$BAT / $KSTR / $APR 30-minute bearish signal, 4-hour bearish trend confirmed🔥
════════════════════
🟢 $BAT 30-minute bearish signal
⚠️Technical analysis: 4-hour bearish convergence confirmed | 30-minute entry: MACD DIF falls below the zero line, trend turns bearish | EMA5 < EMA8 < EMA13, bearish alignment | KDJ is weak, bears have the upper hand (K: 31.0, D: 48.1) | Normal volume (1.3x)
════════════════════
🟢 $KSTR 30-minute bearish signal
⚠️Technical analysis: 4-hour bearish convergence confirmed | 30-minute entry: MACD DIF falls below the zero line, trend turns bearish | EMA5 < EMA8 < EMA13, bearish alignment | KDJ is weak, bears have the upper hand (K: 29.0, D: 44.6) | Increased trading volume (2.0x)
════════════════════
🟢 $APR 30-minute bearish signal
⚠️Technical analysis: 4-hour bearish convergence confirmed | 30-minute entry: MACD bearish crossover below zero, bearish momentum accelerating | EMA5 < EMA8 < EMA13, bearish alignment | KDJ bearish crossover, short-term outlook is bearish (K: 35.7, D: 41.5) | Increased trading volume (1.7x)
📢Market update: Binance Earn Yield Arena: Earn Up to 35% APR With This Week’s New Limited-Time Offers! (2026-10-28)
════════════════════
🔔 Follow for first-hand market alerts 🔔
#多周期共振 #BAT #KSTR #APR
📌 When trading, pay attention to whether the candlestick pattern matches
$BAT / $KSTR / $APR 30-minute bearish signal, 4-hour bearish trend confirmed🔥
════════════════════
🟢 $BAT 30-minute bearish signal
⚠️Technical analysis: 4-hour bearish convergence confirmed | 30-minute entry: MACD DIF falls below the zero line, trend turns bearish | EMA5 < EMA8 < EMA13, bearish alignment | KDJ is weak, bears have the upper hand (K: 31.0, D: 48.1) | Normal volume (1.3x)
════════════════════
🟢 $KSTR 30-minute bearish signal
⚠️Technical analysis: 4-hour bearish convergence confirmed | 30-minute entry: MACD DIF falls below the zero line, trend turns bearish | EMA5 < EMA8 < EMA13, bearish alignment | KDJ is weak, bears have the upper hand (K: 29.0, D: 44.6) | Increased trading volume (2.0x)
════════════════════
🟢 $APR 30-minute bearish signal
⚠️Technical analysis: 4-hour bearish convergence confirmed | 30-minute entry: MACD bearish crossover below zero, bearish momentum accelerating | EMA5 < EMA8 < EMA13, bearish alignment | KDJ bearish crossover, short-term outlook is bearish (K: 35.7, D: 41.5) | Increased trading volume (1.7x)
📢Market update: Binance Earn Yield Arena: Earn Up to 35% APR With This Week’s New Limited-Time Offers! (2026-10-28)
════════════════════
🔔 Follow for first-hand market alerts 🔔
#多周期共振 #BAT #KSTR #APR
📌 When trading, pay attention to whether the candlestick pattern matches
════════════════════
🟢 $BAT 30-minute bearish signal
⚠️Technical analysis: 4-hour bearish convergence confirmed | 30-minute entry: MACD DIF falls below the zero line, trend turns bearish | EMA5 < EMA8 < EMA13, bearish alignment | KDJ is weak, bears have the upper hand (K: 31.0, D: 48.1) | Normal volume (1.3x)
════════════════════
🟢 $KSTR 30-minute bearish signal
⚠️Technical analysis: 4-hour bearish convergence confirmed | 30-minute entry: MACD DIF falls below the zero line, trend turns bearish | EMA5 < EMA8 < EMA13, bearish alignment | KDJ is weak, bears have the upper hand (K: 29.0, D: 44.6) | Increased trading volume (2.0x)
════════════════════
🟢 $APR 30-minute bearish signal
⚠️Technical analysis: 4-hour bearish convergence confirmed | 30-minute entry: MACD bearish crossover below zero, bearish momentum accelerating | EMA5 < EMA8 < EMA13, bearish alignment | KDJ bearish crossover, short-term outlook is bearish (K: 35.7, D: 41.5) | Increased trading volume (1.7x)
📢Market update: Binance Earn Yield Arena: Earn Up to 35% APR With This Week’s New Limited-Time Offers! (2026-10-28)
════════════════════
🔔 Follow for first-hand market alerts 🔔
#多周期共振 #BAT #KSTR #APR
📌 When trading, pay attention to whether the candlestick pattern matches
10
·
--
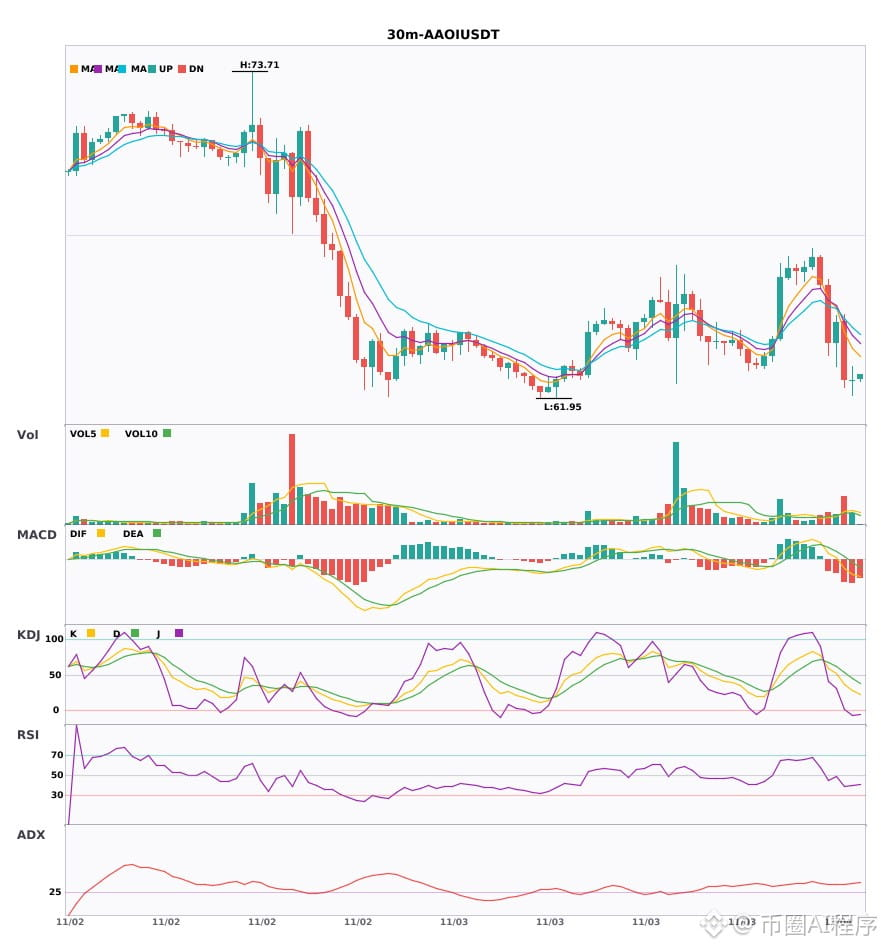
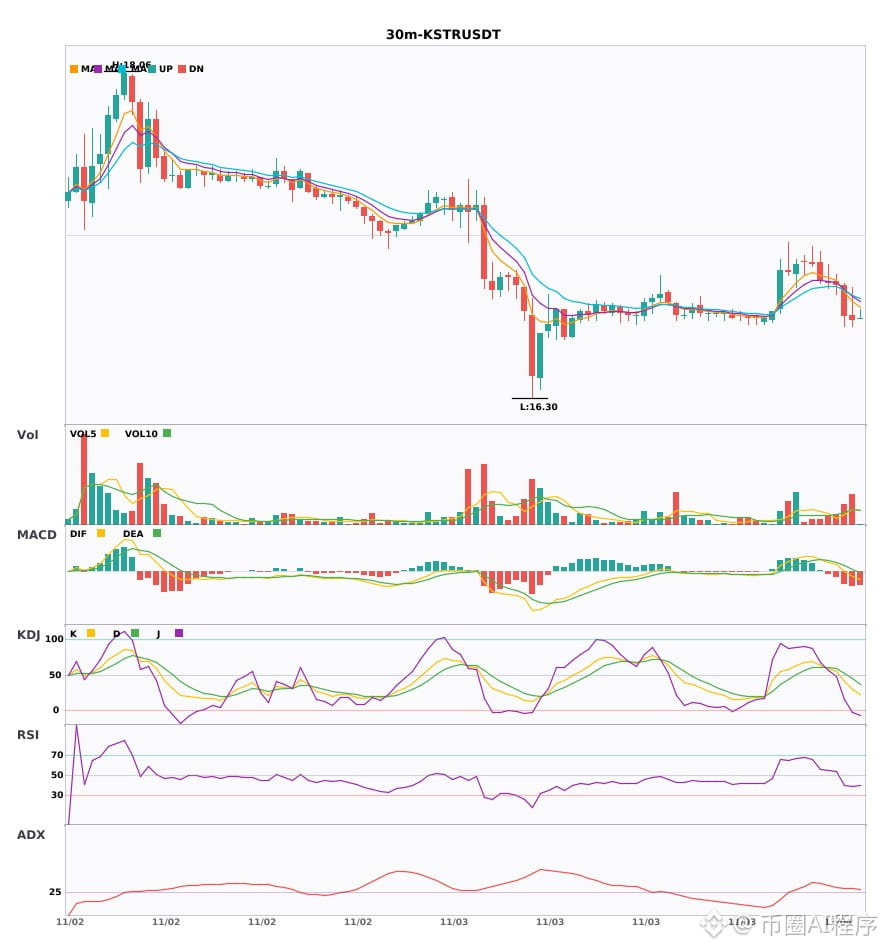
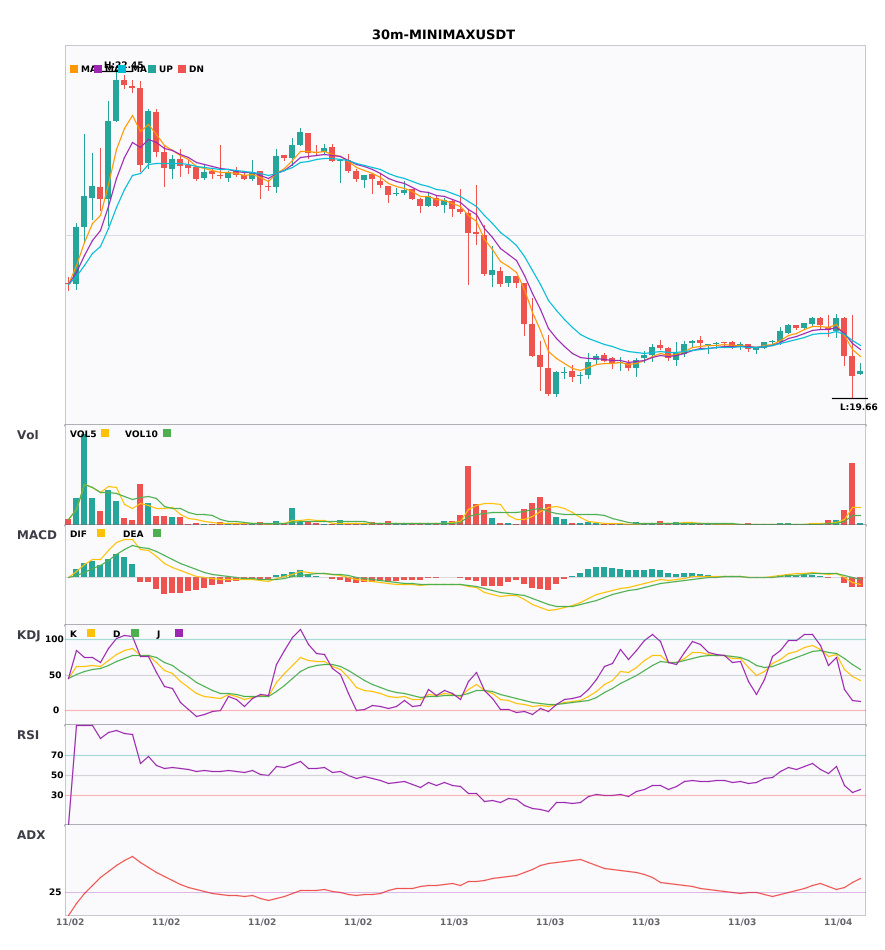
$AAOI / $KSTR / $MINIMAX 30-minute bearish + 4-hour bearish alignment, multi-timeframe confluence turns bearish 🔥
════════════════════
🟢 $AAOI 30-minute bearish signal
⚠️Technical analysis: 4-hour bearish confluence confirmed | 30-minute entry: MACD DIF falls below the zero line, trend turns bearish | EMA5 < EMA8 < EMA13, bearish alignment | Volume increase (2.4x)
════════════════════
🟢 $KSTR 30-minute bearish signal
⚠️Technical analysis: 4-hour bearish confluence confirmed | 30-minute entry: MACD DIF falls below the zero line, trend turns bearish | EMA5 < EMA8 < EMA13, bearish alignment | KDJ is trending weakly, with bears in control (K: 29.0, D: 44.6) | Volume increase (2.0x)
════════════════════
🟢 $MINIMAX 30-minute bearish signal
⚠️Technical analysis: 4-hour bearish confluence confirmed | 30-minute entry: MACD DIF falls below the zero line, trend turns bearish | EMA5 < EMA8 < EMA13, bearish alignment | Volume surge (6.6x)
════════════════════
🔔 Follow for real-time market alerts 🔔
#多周期共振 #AAOI #KSTR #MINIMAX
📌 When trading, pay attention to whether the candlestick pattern is favorable
$AAOI / $KSTR / $MINIMAX 30-minute bearish + 4-hour bearish alignment, multi-timeframe confluence turns bearish 🔥
════════════════════
🟢 $AAOI 30-minute bearish signal
⚠️Technical analysis: 4-hour bearish confluence confirmed | 30-minute entry: MACD DIF falls below the zero line, trend turns bearish | EMA5 < EMA8 < EMA13, bearish alignment | Volume increase (2.4x)
════════════════════
🟢 $KSTR 30-minute bearish signal
⚠️Technical analysis: 4-hour bearish confluence confirmed | 30-minute entry: MACD DIF falls below the zero line, trend turns bearish | EMA5 < EMA8 < EMA13, bearish alignment | KDJ is trending weakly, with bears in control (K: 29.0, D: 44.6) | Volume increase (2.0x)
════════════════════
🟢 $MINIMAX 30-minute bearish signal
⚠️Technical analysis: 4-hour bearish confluence confirmed | 30-minute entry: MACD DIF falls below the zero line, trend turns bearish | EMA5 < EMA8 < EMA13, bearish alignment | Volume surge (6.6x)
════════════════════
🔔 Follow for real-time market alerts 🔔
#多周期共振 #AAOI #KSTR #MINIMAX
📌 When trading, pay attention to whether the candlestick pattern is favorable
════════════════════
🟢 $AAOI 30-minute bearish signal
⚠️Technical analysis: 4-hour bearish confluence confirmed | 30-minute entry: MACD DIF falls below the zero line, trend turns bearish | EMA5 < EMA8 < EMA13, bearish alignment | Volume increase (2.4x)
════════════════════
🟢 $KSTR 30-minute bearish signal
⚠️Technical analysis: 4-hour bearish confluence confirmed | 30-minute entry: MACD DIF falls below the zero line, trend turns bearish | EMA5 < EMA8 < EMA13, bearish alignment | KDJ is trending weakly, with bears in control (K: 29.0, D: 44.6) | Volume increase (2.0x)
════════════════════
🟢 $MINIMAX 30-minute bearish signal
⚠️Technical analysis: 4-hour bearish confluence confirmed | 30-minute entry: MACD DIF falls below the zero line, trend turns bearish | EMA5 < EMA8 < EMA13, bearish alignment | Volume surge (6.6x)
════════════════════
🔔 Follow for real-time market alerts 🔔
#多周期共振 #AAOI #KSTR #MINIMAX
📌 When trading, pay attention to whether the candlestick pattern is favorable
8

·
--
$KSTR is falling in price, but longs are still paying.
It fell 3.3% in a day, with a funding rate of 0.21% paid by longs, while open interest rose 0.90%.
The longer the paying side holds on, the bigger the move that may follow. Share your take in the comments.
#KSTR #资金费率 #crypto
Just my personal observation, not investment advice.
$KSTR is falling in price, but longs are still paying.
It fell 3.3% in a day, with a funding rate of 0.21% paid by longs, while open interest rose 0.90%.
The longer the paying side holds on, the bigger the move that may follow. Share your take in the comments.
#KSTR #资金费率 #crypto
Just my personal observation, not investment advice.
It fell 3.3% in a day, with a funding rate of 0.21% paid by longs, while open interest rose 0.90%.
The longer the paying side holds on, the bigger the move that may follow. Share your take in the comments.
#KSTR #资金费率 #crypto
Just my personal observation, not investment advice.
432

·
--
🚀 $KSTR LONG 🚀
Entry: 17.7366 – 17.8434
SL: 17.4870
TP1: 18.0497
TP2: 18.2229
TP3: 18.4393
📈 Technical Outlook:
$KSTR is showing strong bullish momentum after confirming strength near a key technical zone. The setup is supported by price is breaking above recent resistance, RSI supports bullish momentum, volume is expanding. As long as price holds above the entry area, buyers may continue pushing toward the listed targets.
#KSTR #Crypto #BinanceSquare #Trading
🚀 $KSTR LONG 🚀
Entry: 17.7366 – 17.8434
SL: 17.4870
TP1: 18.0497
TP2: 18.2229
TP3: 18.4393
📈 Technical Outlook:
$KSTR is showing strong bullish momentum after confirming strength near a key technical zone. The setup is supported by price is breaking above recent resistance, RSI supports bullish momentum, volume is expanding. As long as price holds above the entry area, buyers may continue pushing toward the listed targets.
#KSTR #Crypto #BinanceSquare #Trading
Entry: 17.7366 – 17.8434
SL: 17.4870
TP1: 18.0497
TP2: 18.2229
TP3: 18.4393
📈 Technical Outlook:
$KSTR is showing strong bullish momentum after confirming strength near a key technical zone. The setup is supported by price is breaking above recent resistance, RSI supports bullish momentum, volume is expanding. As long as price holds above the entry area, buyers may continue pushing toward the listed targets.
#KSTR #Crypto #BinanceSquare #Trading

6

·
--
💥 $KSTR SPRINGS OFF CRITICAL SUPPORT AS BUYERS TARGET THE $24.7 RESISTANCE FLIP! 🟢
Entry: 24.00 - 24.50 ⚡
Target: 25.50 - 29.00 🚀
Stop Loss: 23.20 ⚠️
Smart money defended the $22.5–$23.0 demand floor after a persistent drawdown, printing clear higher lows on the daily chart. Order flow is shifting decisively as price presses right into the $24.7 supply barrier. 📊
A clean daily close above $24.7 opens up clear room toward higher liquidity pools near $29.0. 💡 The risk profile is sharply asymmetric here with defined invalidation right under support.
💬 Are you bidding this breakout consolidation early or waiting for the daily level flip? 👇
⚠️ Not financial advice. Always manage your risk. 🛡️
🏷️ #KSTR #Crypto #Breakout #LongSetup
🔥 💎
💥 $KSTR SPRINGS OFF CRITICAL SUPPORT AS BUYERS TARGET THE $24.7 RESISTANCE FLIP! 🟢
Entry: 24.00 - 24.50 ⚡
Target: 25.50 - 29.00 🚀
Stop Loss: 23.20 ⚠️
Smart money defended the $22.5–$23.0 demand floor after a persistent drawdown, printing clear higher lows on the daily chart. Order flow is shifting decisively as price presses right into the $24.7 supply barrier. 📊
A clean daily close above $24.7 opens up clear room toward higher liquidity pools near $29.0. 💡 The risk profile is sharply asymmetric here with defined invalidation right under support.
💬 Are you bidding this breakout consolidation early or waiting for the daily level flip? 👇
⚠️ Not financial advice. Always manage your risk. 🛡️
🏷️ #KSTR #Crypto #Breakout #LongSetup
🔥 💎
Entry: 24.00 - 24.50 ⚡
Target: 25.50 - 29.00 🚀
Stop Loss: 23.20 ⚠️
Smart money defended the $22.5–$23.0 demand floor after a persistent drawdown, printing clear higher lows on the daily chart. Order flow is shifting decisively as price presses right into the $24.7 supply barrier. 📊
A clean daily close above $24.7 opens up clear room toward higher liquidity pools near $29.0. 💡 The risk profile is sharply asymmetric here with defined invalidation right under support.
💬 Are you bidding this breakout consolidation early or waiting for the daily level flip? 👇
⚠️ Not financial advice. Always manage your risk. 🛡️
🏷️ #KSTR #Crypto #Breakout #LongSetup
🔥 💎
7
·
--
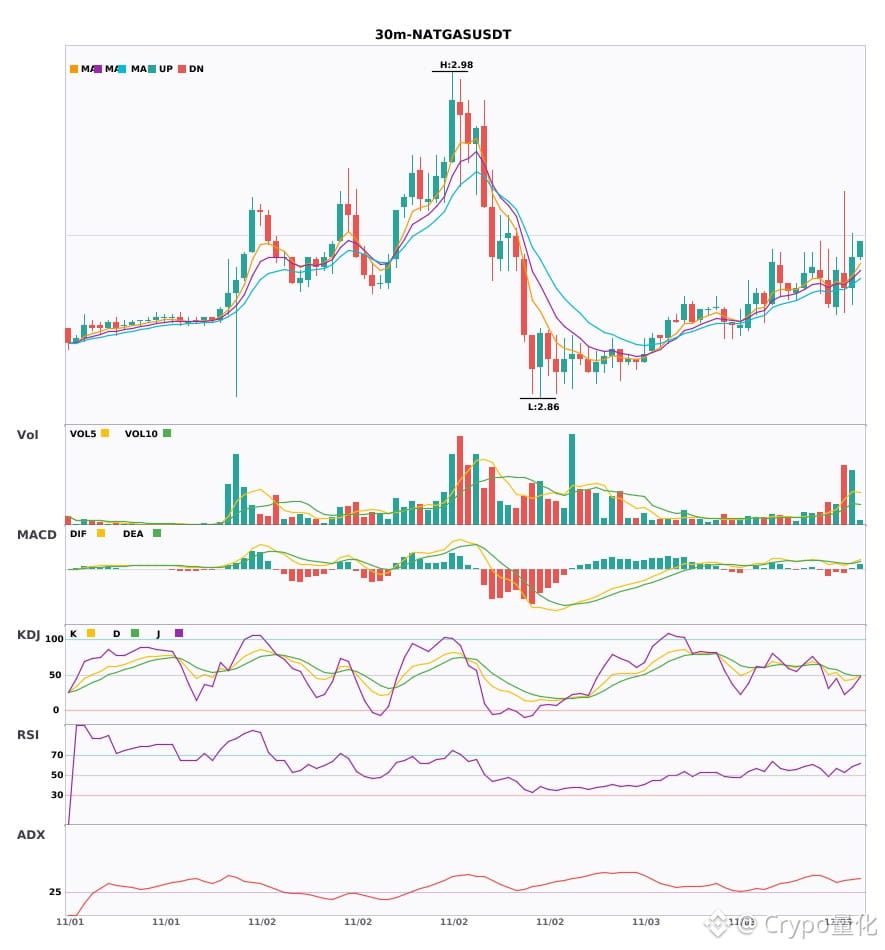
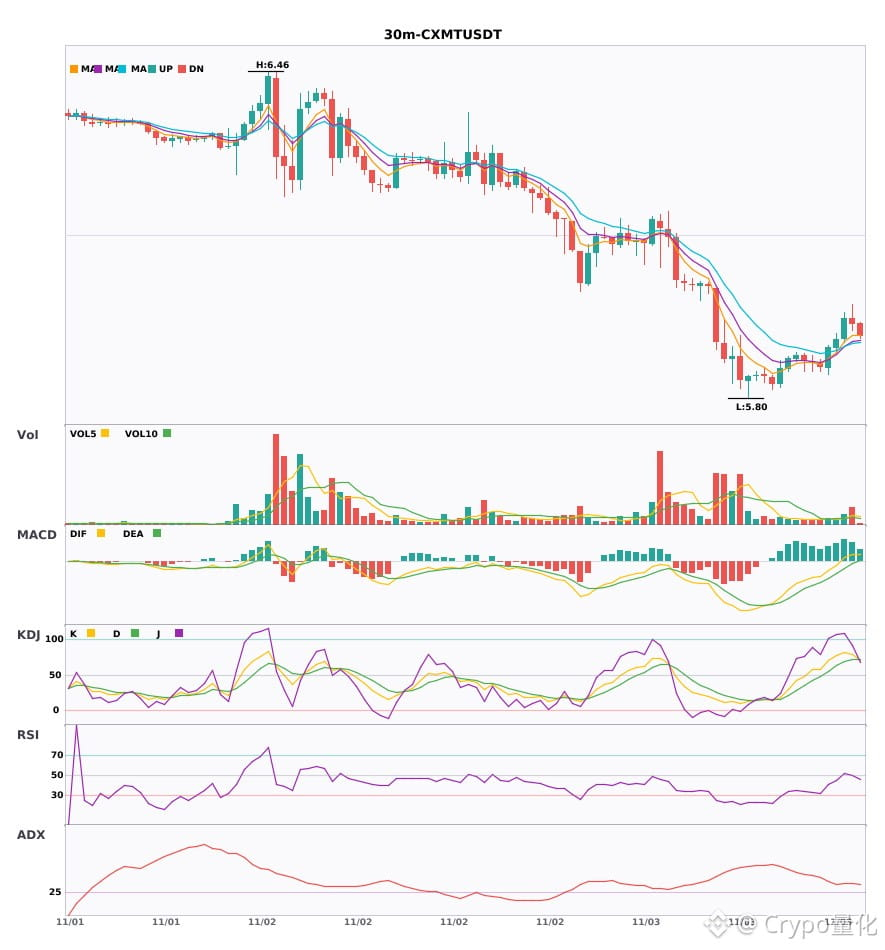
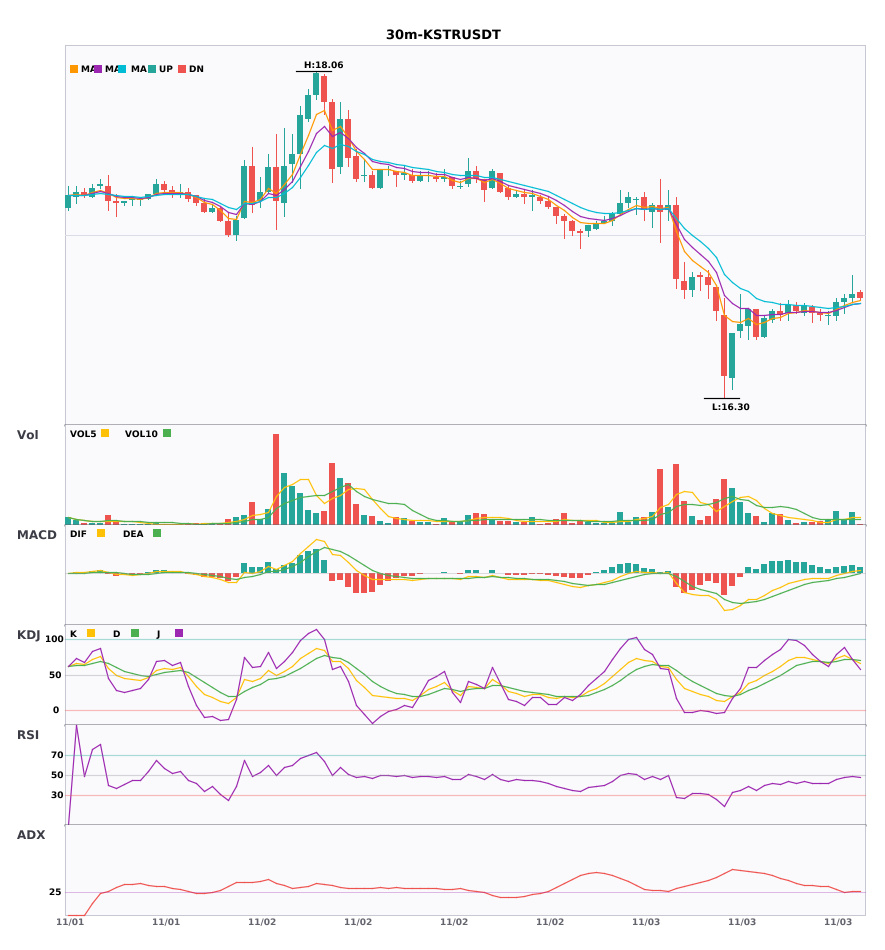
Three 30-minute bullish signals appeared simultaneously: $NATGAS / $CXMT / $KSTR🔥
════════════════════
🔴 $NATGAS 30-minute bullish signal
⚠️Technical analysis: ADX(40): clear trending market | MACD golden cross above zero, bullish momentum released | EMA5 > EMA8 > EMA13: bullish alignment | KDJ moving weakly, bears in control (K: 44.2, D: 49.9) | Volume surge (3.5x)
════════════════════
🔴 $CXMT 30-minute bullish signal
⚠️Technical analysis: ADX(36): clear trending market | MACD trending bullish, strong trend, momentum weakening | EMA5 > EMA8 > EMA13: bullish alignment | KDJ moving strongly, bulls in control (K: 78.4, D: 72.2) | Volume increase (2.4x)
════════════════════
🔴 $KSTR 30-minute bullish signal
⚠️Technical analysis: ADX(25): trend is forming; opportunity to participate | MACD DIF breaks above the zero line, trend turns bullish | Moving averages converging and building momentum, direction about to be chosen | KDJ moving strongly, bulls in control (K: 72.2, D: 72.0) | Volume increase (2.2x)
════════════════════
🔔 Follow for first-hand market updates 🔔
#技术分析 #NATGAS #CXMT #KSTR
📌 When trading, check whether the candlestick pattern confirms the setup
Three 30-minute bullish signals appeared simultaneously: $NATGAS / $CXMT / $KSTR 🔥
════════════════════
🔴 $NATGAS 30-minute bullish signal
⚠️Technical analysis: ADX(40): clear trending market | MACD golden cross above zero, bullish momentum released | EMA5 > EMA8 > EMA13: bullish alignment | KDJ moving weakly, bears in control (K: 44.2, D: 49.9) | Volume surge (3.5x)
════════════════════
🔴 $CXMT 30-minute bullish signal
⚠️Technical analysis: ADX(36): clear trending market | MACD trending bullish, strong trend, momentum weakening | EMA5 > EMA8 > EMA13: bullish alignment | KDJ moving strongly, bulls in control (K: 78.4, D: 72.2) | Volume increase (2.4x)
════════════════════
🔴 $KSTR 30-minute bullish signal
⚠️Technical analysis: ADX(25): trend is forming; opportunity to participate | MACD DIF breaks above the zero line, trend turns bullish | Moving averages converging and building momentum, direction about to be chosen | KDJ moving strongly, bulls in control (K: 72.2, D: 72.0) | Volume increase (2.2x)
════════════════════
🔔 Follow for first-hand market updates 🔔
#技术分析 #NATGAS #CXMT #KSTR
📌 When trading, check whether the candlestick pattern confirms the setup
════════════════════
🔴 $NATGAS 30-minute bullish signal
⚠️Technical analysis: ADX(40): clear trending market | MACD golden cross above zero, bullish momentum released | EMA5 > EMA8 > EMA13: bullish alignment | KDJ moving weakly, bears in control (K: 44.2, D: 49.9) | Volume surge (3.5x)
════════════════════
🔴 $CXMT 30-minute bullish signal
⚠️Technical analysis: ADX(36): clear trending market | MACD trending bullish, strong trend, momentum weakening | EMA5 > EMA8 > EMA13: bullish alignment | KDJ moving strongly, bulls in control (K: 78.4, D: 72.2) | Volume increase (2.4x)
════════════════════
🔴 $KSTR 30-minute bullish signal
⚠️Technical analysis: ADX(25): trend is forming; opportunity to participate | MACD DIF breaks above the zero line, trend turns bullish | Moving averages converging and building momentum, direction about to be chosen | KDJ moving strongly, bulls in control (K: 72.2, D: 72.0) | Volume increase (2.2x)
════════════════════
🔔 Follow for first-hand market updates 🔔
#技术分析 #NATGAS #CXMT #KSTR
📌 When trading, check whether the candlestick pattern confirms the setup
3
·
--
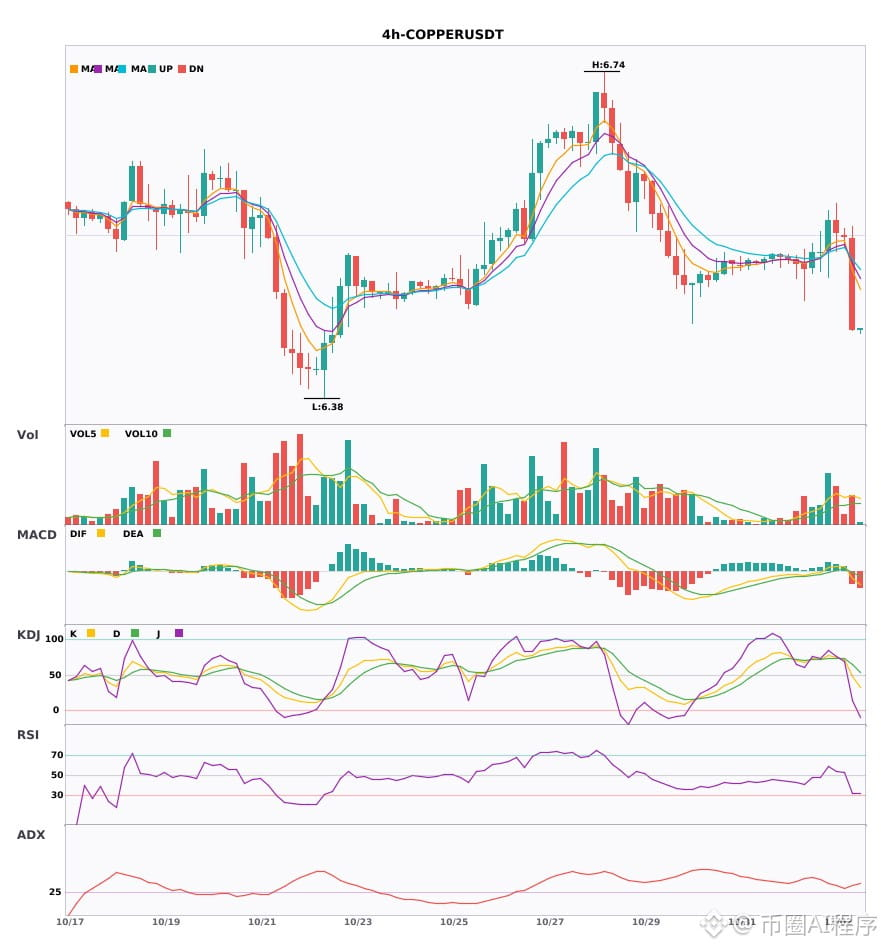
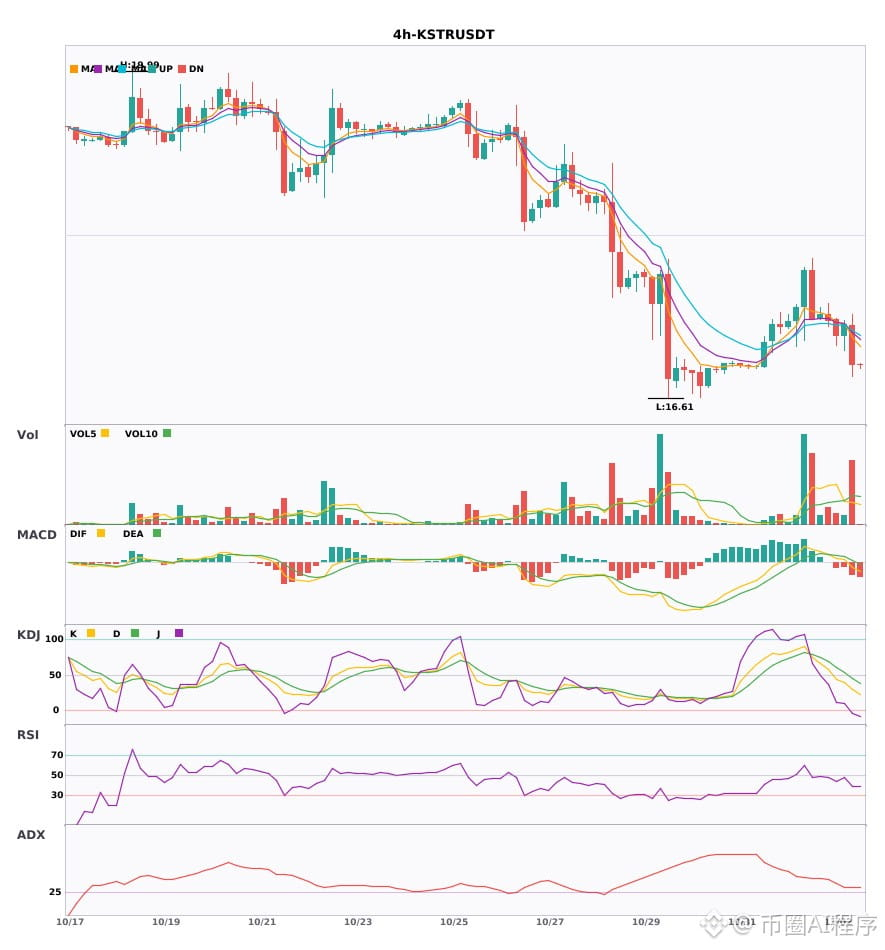
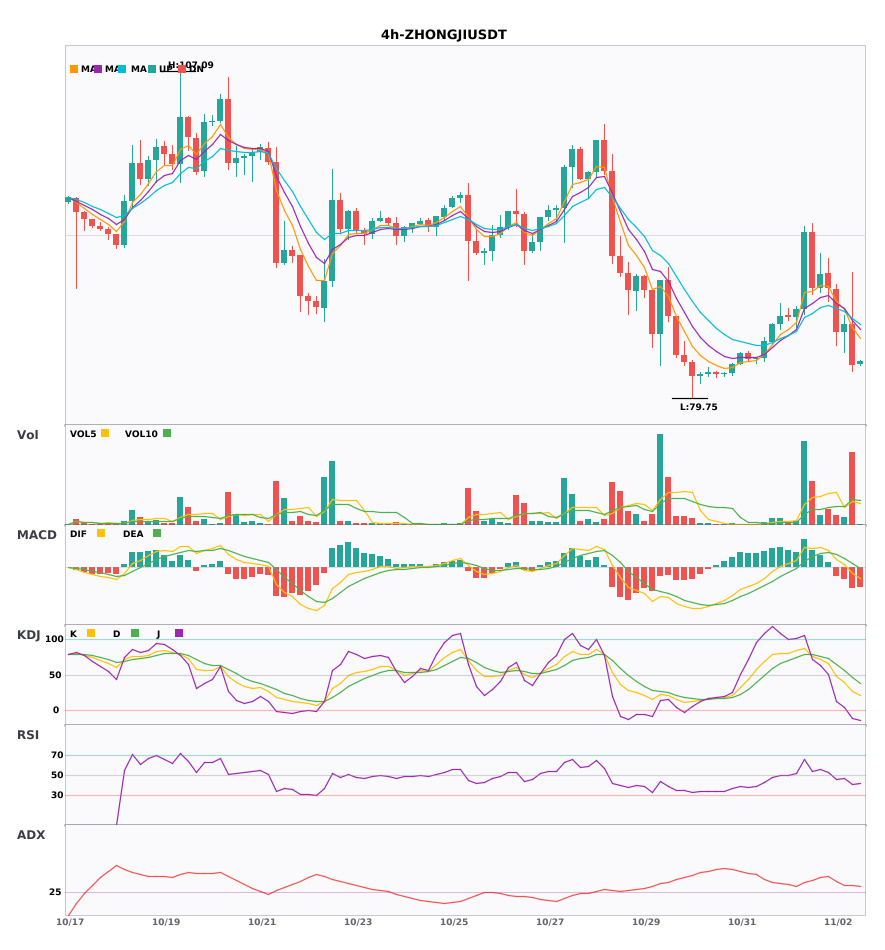
$COPPER / $KSTR / $ZHONGJI 4-hour bearish + daily bearish alignment, multi-timeframe convergence turns bearish 🔥
════════════════════
🟢 $COPPER 4-hour bearish signal
⚠️Technical analysis: Daily bearish convergence confirmed | 4-hour entry: MACD bearish cross below zero, bearish momentum accelerating | EMA5 crosses below EMA8, short-term outlook turns bearish | Volume normal (1.4x)
════════════════════
🟢 $KSTR 4-hour bearish signal
⚠️Technical analysis: Daily bearish convergence confirmed | 4-hour entry: MACD DIF falls below the zero line, trend turns bearish | EMA5 crosses below EMA8, short-term outlook turns bearish | KDJ is weak, bears have the upper hand (K: 29.0, D: 45.4) | Trading volume increases (2.2x)
════════════════════
🟢 $ZHONGJI 4-hour bearish signal
⚠️Technical analysis: Daily bearish convergence confirmed | 4-hour entry: MACD DIF falls below the zero line, trend turns bearish | EMA5 < EMA8 < EMA13, bearish alignment | KDJ is weak, bears have the upper hand (K: 27.4, D: 46.3) | Trading volume surges (2.9x)
════════════════════
🔔 Follow for first-hand market updates 🔔
#多周期共振 #COPPER #KSTR #ZHONGJI
📌 When trading, pay attention to whether the candlestick pattern confirms the signal
$COPPER / $KSTR / $ZHONGJI 4-hour bearish + daily bearish alignment, multi-timeframe convergence turns bearish 🔥
════════════════════
🟢 $COPPER 4-hour bearish signal
⚠️Technical analysis: Daily bearish convergence confirmed | 4-hour entry: MACD bearish cross below zero, bearish momentum accelerating | EMA5 crosses below EMA8, short-term outlook turns bearish | Volume normal (1.4x)
════════════════════
🟢 $KSTR 4-hour bearish signal
⚠️Technical analysis: Daily bearish convergence confirmed | 4-hour entry: MACD DIF falls below the zero line, trend turns bearish | EMA5 crosses below EMA8, short-term outlook turns bearish | KDJ is weak, bears have the upper hand (K: 29.0, D: 45.4) | Trading volume increases (2.2x)
════════════════════
🟢 $ZHONGJI 4-hour bearish signal
⚠️Technical analysis: Daily bearish convergence confirmed | 4-hour entry: MACD DIF falls below the zero line, trend turns bearish | EMA5 < EMA8 < EMA13, bearish alignment | KDJ is weak, bears have the upper hand (K: 27.4, D: 46.3) | Trading volume surges (2.9x)
════════════════════
🔔 Follow for first-hand market updates 🔔
#多周期共振 #COPPER #KSTR #ZHONGJI
📌 When trading, pay attention to whether the candlestick pattern confirms the signal
════════════════════
🟢 $COPPER 4-hour bearish signal
⚠️Technical analysis: Daily bearish convergence confirmed | 4-hour entry: MACD bearish cross below zero, bearish momentum accelerating | EMA5 crosses below EMA8, short-term outlook turns bearish | Volume normal (1.4x)
════════════════════
🟢 $KSTR 4-hour bearish signal
⚠️Technical analysis: Daily bearish convergence confirmed | 4-hour entry: MACD DIF falls below the zero line, trend turns bearish | EMA5 crosses below EMA8, short-term outlook turns bearish | KDJ is weak, bears have the upper hand (K: 29.0, D: 45.4) | Trading volume increases (2.2x)
════════════════════
🟢 $ZHONGJI 4-hour bearish signal
⚠️Technical analysis: Daily bearish convergence confirmed | 4-hour entry: MACD DIF falls below the zero line, trend turns bearish | EMA5 < EMA8 < EMA13, bearish alignment | KDJ is weak, bears have the upper hand (K: 27.4, D: 46.3) | Trading volume surges (2.9x)
════════════════════
🔔 Follow for first-hand market updates 🔔
#多周期共振 #COPPER #KSTR #ZHONGJI
📌 When trading, pay attention to whether the candlestick pattern confirms the signal
17
·
--
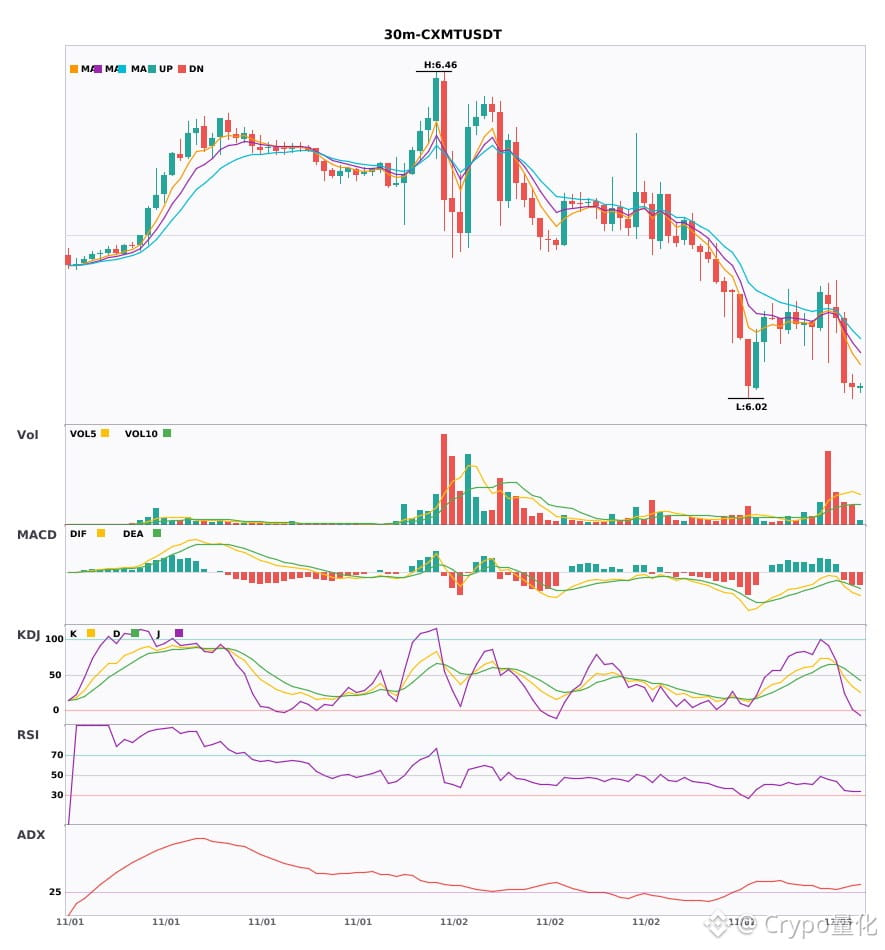
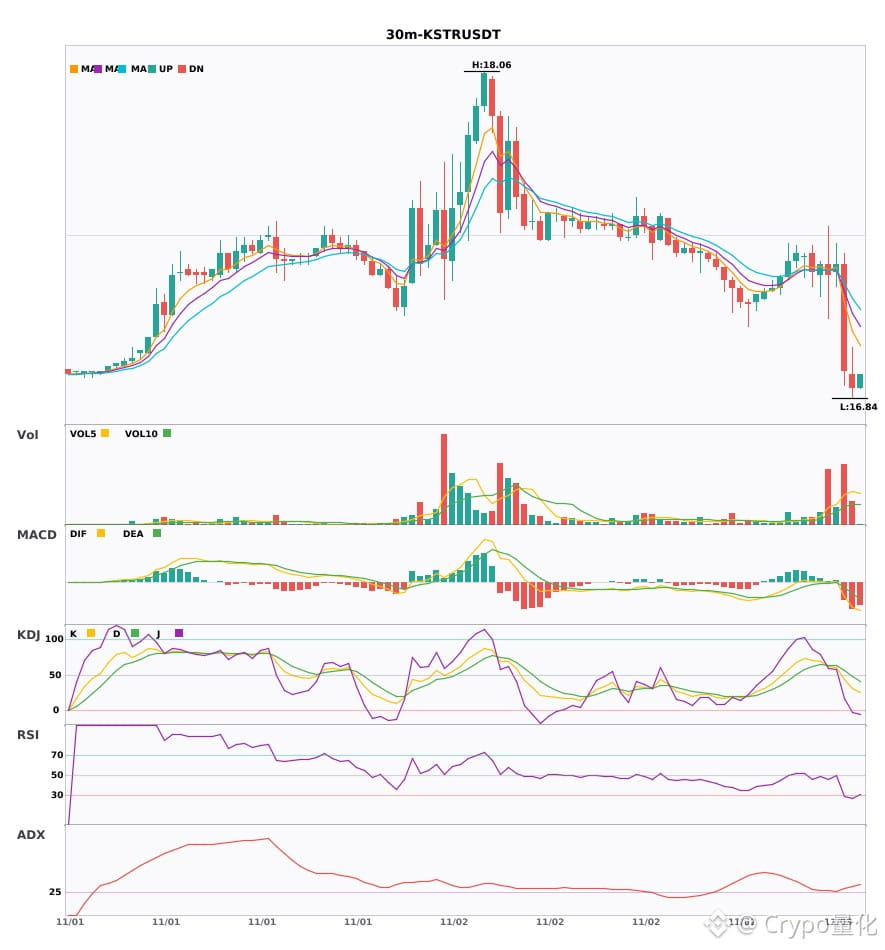
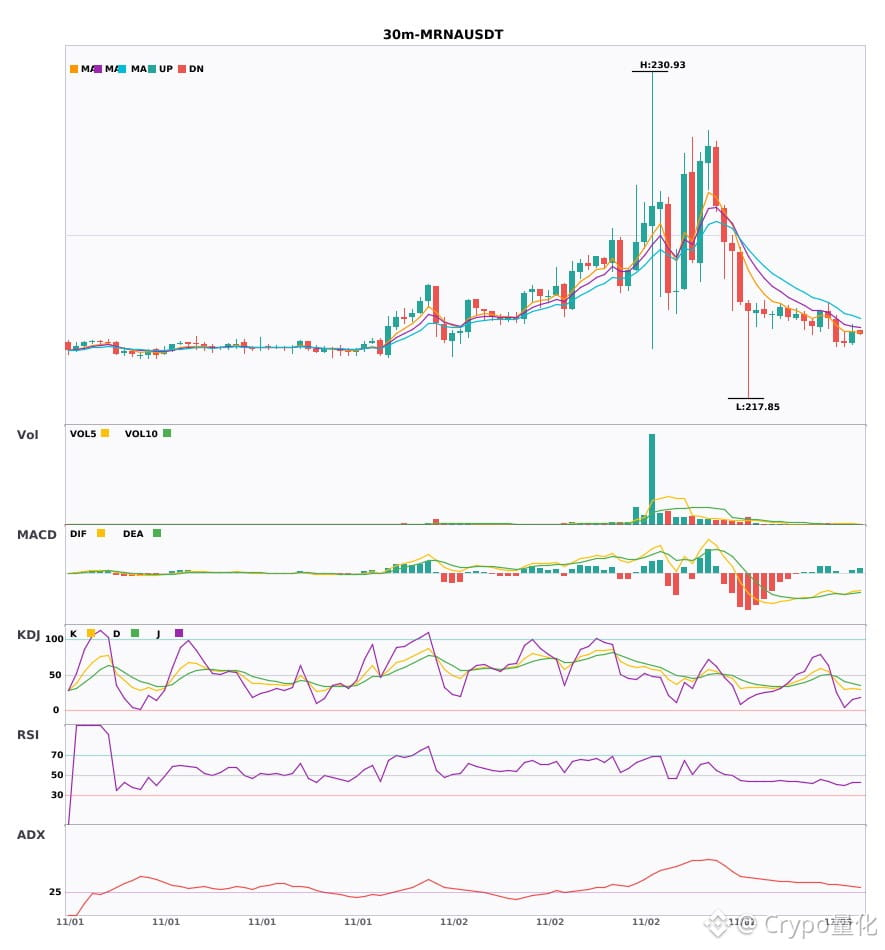
3 30-minute bearish alerts: $CXMT / $KSTR / $MRNA🔥
════════════════════
🟢 $CXMT 30-minute bearish signal
⚠️Technical analysis: ADX(30) Trend is forming; opportunity to participate | MACD bearish crossover below zero; bearish momentum accelerating | EMA5 crossed below EMA8; short-term outlook turns bearish | KDJ bearish crossover; short-term outlook is bearish (K: 47.2, D: 59.1) | Volume increased (1.9x)
════════════════════
🟢 $KSTR 30-minute bearish signal
⚠️Technical analysis: ADX(31) Clear trending market | MACD bearish crossover below zero; bearish momentum accelerating | EMA5 crossed below EMA8; short-term outlook turns bearish | Volume surged (3.3x)
════════════════════
🟢 $MRNA 30-minute bearish signal
⚠️Technical analysis: ADX(36) Clear trending market | MACD bearish crossover below zero; bearish momentum accelerating | EMA5 < EMA8 < EMA13; bearish alignment | KDJ moving in weak territory, with bears in control (K: 29.1, D: 41.4) | Volume increased (1.5x)
════════════════════
🔔 Follow to get firsthand market alerts 🔔
#技术分析 #CXMT #KSTR #MRNA
📌 When trading, pay attention to whether the candlestick pattern confirms the setup
3 30-minute bearish alerts: $CXMT / $KSTR / $MRNA 🔥
════════════════════
🟢 $CXMT 30-minute bearish signal
⚠️Technical analysis: ADX(30) Trend is forming; opportunity to participate | MACD bearish crossover below zero; bearish momentum accelerating | EMA5 crossed below EMA8; short-term outlook turns bearish | KDJ bearish crossover; short-term outlook is bearish (K: 47.2, D: 59.1) | Volume increased (1.9x)
════════════════════
🟢 $KSTR 30-minute bearish signal
⚠️Technical analysis: ADX(31) Clear trending market | MACD bearish crossover below zero; bearish momentum accelerating | EMA5 crossed below EMA8; short-term outlook turns bearish | Volume surged (3.3x)
════════════════════
🟢 $MRNA 30-minute bearish signal
⚠️Technical analysis: ADX(36) Clear trending market | MACD bearish crossover below zero; bearish momentum accelerating | EMA5 < EMA8 < EMA13; bearish alignment | KDJ moving in weak territory, with bears in control (K: 29.1, D: 41.4) | Volume increased (1.5x)
════════════════════
🔔 Follow to get firsthand market alerts 🔔
#技术分析 #CXMT #KSTR #MRNA
📌 When trading, pay attention to whether the candlestick pattern confirms the setup
════════════════════
🟢 $CXMT 30-minute bearish signal
⚠️Technical analysis: ADX(30) Trend is forming; opportunity to participate | MACD bearish crossover below zero; bearish momentum accelerating | EMA5 crossed below EMA8; short-term outlook turns bearish | KDJ bearish crossover; short-term outlook is bearish (K: 47.2, D: 59.1) | Volume increased (1.9x)
════════════════════
🟢 $KSTR 30-minute bearish signal
⚠️Technical analysis: ADX(31) Clear trending market | MACD bearish crossover below zero; bearish momentum accelerating | EMA5 crossed below EMA8; short-term outlook turns bearish | Volume surged (3.3x)
════════════════════
🟢 $MRNA 30-minute bearish signal
⚠️Technical analysis: ADX(36) Clear trending market | MACD bearish crossover below zero; bearish momentum accelerating | EMA5 < EMA8 < EMA13; bearish alignment | KDJ moving in weak territory, with bears in control (K: 29.1, D: 41.4) | Volume increased (1.5x)
════════════════════
🔔 Follow to get firsthand market alerts 🔔
#技术分析 #CXMT #KSTR #MRNA
📌 When trading, pay attention to whether the candlestick pattern confirms the setup
5
·
--
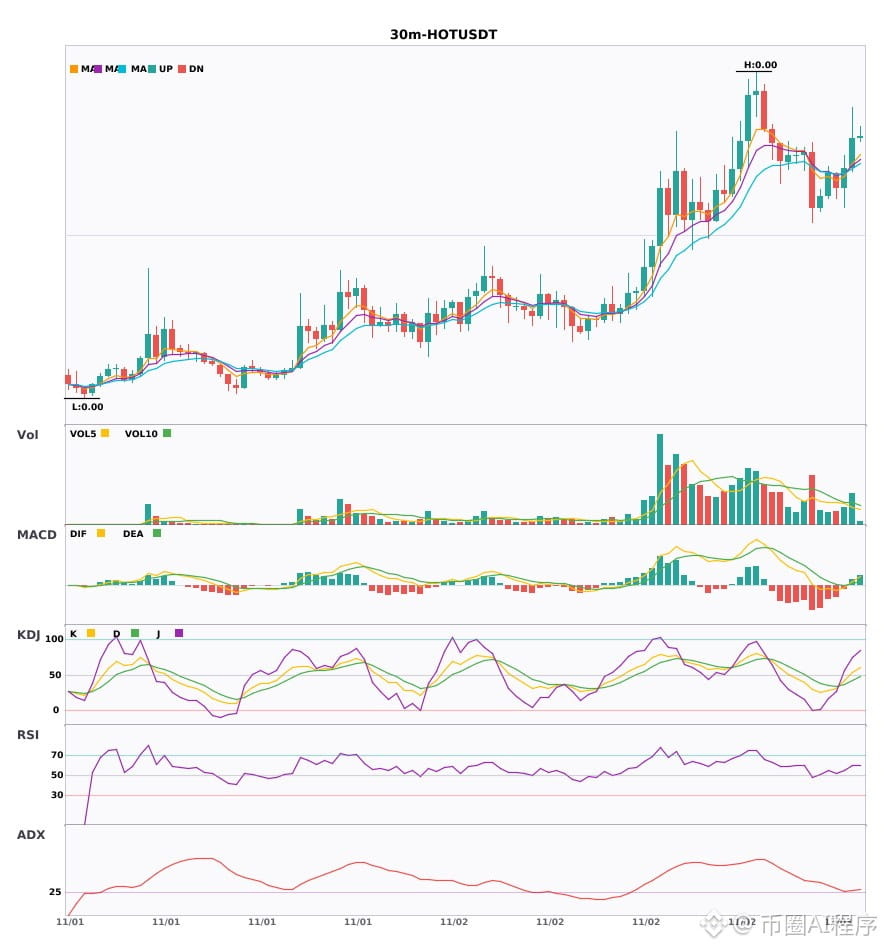
Multi-timeframe confluence: 2 coins bullish on the 30-minute chart + 4-hour bullish trend confirmation 🔥
════════════════════
🔴 $HOT 30-minute bullish signal
⚠️ Technicals: 4-hour bullish confluence confirmed | 30-minute entry: MACD bullish crossover above zero, bullish momentum emerging | EMA5 crosses above EMA8, short-term trend turns bullish | Volume normal (1.4x)
════════════════════
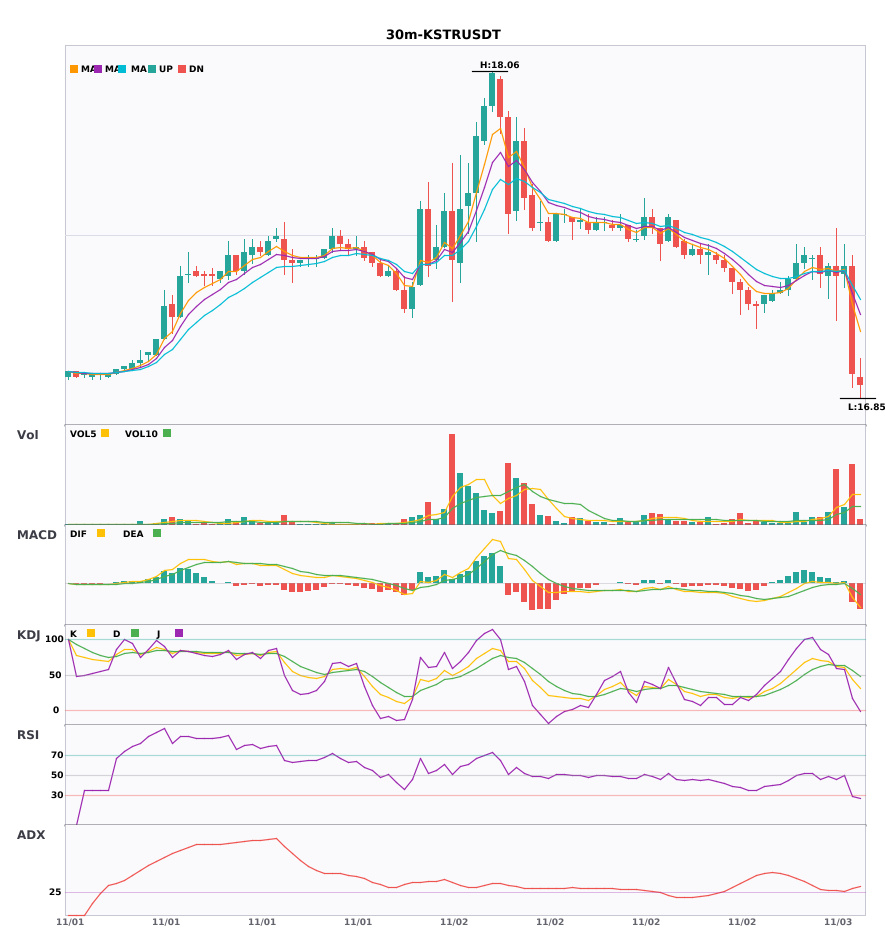
🔴 $KSTR 30-minute bullish signal
⚠️ Technicals: 4-hour bullish confluence confirmed | 30-minute entry: MACD trending bullish, trend strength improving, momentum increasing | EMA5 > EMA8 > EMA13, bullish alignment | KDJ trending strongly, bulls in control (K: 60.9, D: 62.8) | Volume surge (5.2x)
════════════════════
🔔 Follow for first-hand market alerts 🔔
#多周期共振 #HOT #KSTR
📌 When trading, check whether the candlestick pattern aligns
Multi-timeframe confluence: 2 coins bullish on the 30-minute chart + 4-hour bullish trend confirmation 🔥
════════════════════
🔴 $HOT 30-minute bullish signal
⚠️ Technicals: 4-hour bullish confluence confirmed | 30-minute entry: MACD bullish crossover above zero, bullish momentum emerging | EMA5 crosses above EMA8, short-term trend turns bullish | Volume normal (1.4x)
════════════════════
🔴 $KSTR 30-minute bullish signal
⚠️ Technicals: 4-hour bullish confluence confirmed | 30-minute entry: MACD trending bullish, trend strength improving, momentum increasing | EMA5 > EMA8 > EMA13, bullish alignment | KDJ trending strongly, bulls in control (K: 60.9, D: 62.8) | Volume surge (5.2x)
════════════════════
🔔 Follow for first-hand market alerts 🔔
#多周期共振 #HOT #KSTR
📌 When trading, check whether the candlestick pattern aligns
════════════════════
🔴 $HOT 30-minute bullish signal
⚠️ Technicals: 4-hour bullish confluence confirmed | 30-minute entry: MACD bullish crossover above zero, bullish momentum emerging | EMA5 crosses above EMA8, short-term trend turns bullish | Volume normal (1.4x)
════════════════════
🔴 $KSTR 30-minute bullish signal
⚠️ Technicals: 4-hour bullish confluence confirmed | 30-minute entry: MACD trending bullish, trend strength improving, momentum increasing | EMA5 > EMA8 > EMA13, bullish alignment | KDJ trending strongly, bulls in control (K: 60.9, D: 62.8) | Volume surge (5.2x)
════════════════════
🔔 Follow for first-hand market alerts 🔔
#多周期共振 #HOT #KSTR
📌 When trading, check whether the candlestick pattern aligns
6
·
--
🔻 $KSTR SHORT 🔻
Entry: 16.9291 – 17.0309
SL: 17.4260
TP1: 16.5977
TP2: 16.3429
TP3: 16.0243
📈 Technical Outlook:
$KSTR is showing bearish pressure after losing strength near a key technical zone. The setup is supported by EMA trend is bearish, price is breaking below recent support, RSI supports bearish momentum. As long as price stays below the entry area, sellers may continue pushing toward the listed downside targets.
#KSTR #Crypto #BinanceSquare #Trading
🔻 $KSTR SHORT 🔻
Entry: 16.9291 – 17.0309
SL: 17.4260
TP1: 16.5977
TP2: 16.3429
TP3: 16.0243
📈 Technical Outlook:
$KSTR is showing bearish pressure after losing strength near a key technical zone. The setup is supported by EMA trend is bearish, price is breaking below recent support, RSI supports bearish momentum. As long as price stays below the entry area, sellers may continue pushing toward the listed downside targets.
#KSTR #Crypto #BinanceSquare #Trading
Entry: 16.9291 – 17.0309
SL: 17.4260
TP1: 16.5977
TP2: 16.3429
TP3: 16.0243
📈 Technical Outlook:
$KSTR is showing bearish pressure after losing strength near a key technical zone. The setup is supported by EMA trend is bearish, price is breaking below recent support, RSI supports bearish momentum. As long as price stays below the entry area, sellers may continue pushing toward the listed downside targets.
#KSTR #Crypto #BinanceSquare #Trading

16
·
--
$TUT / $KSTR 30-minute short + 4-hour short in the same direction; multi-timeframe confluence turns bearish 🔥
════════════════════
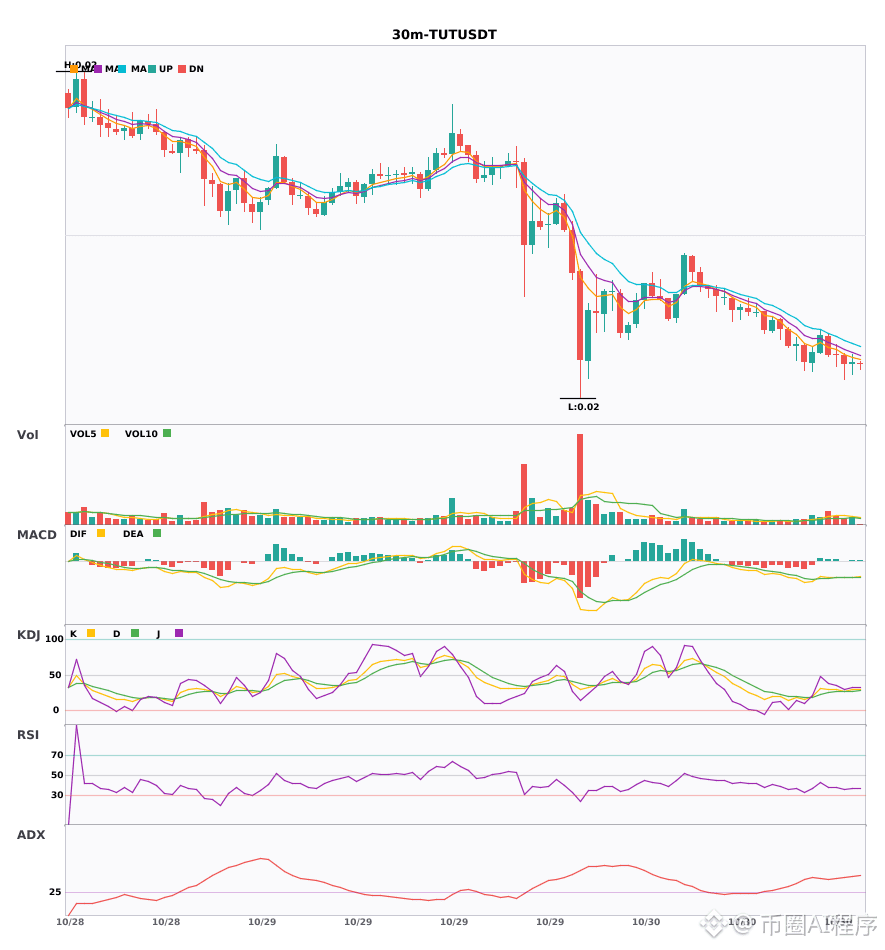
🟢 $TUT 30-minute short signal
⚠️Technical analysis: 4-hour bearish confluence confirmed | 30-minute entry: MACD bearish crossover below zero, bearish momentum accelerating | EMA5 < EMA8 < EMA13, bearish alignment | KDJ showing weakness, bears in control (K: 27.6, D: 26.8) | Volume normal (1.3x)
════════════════════
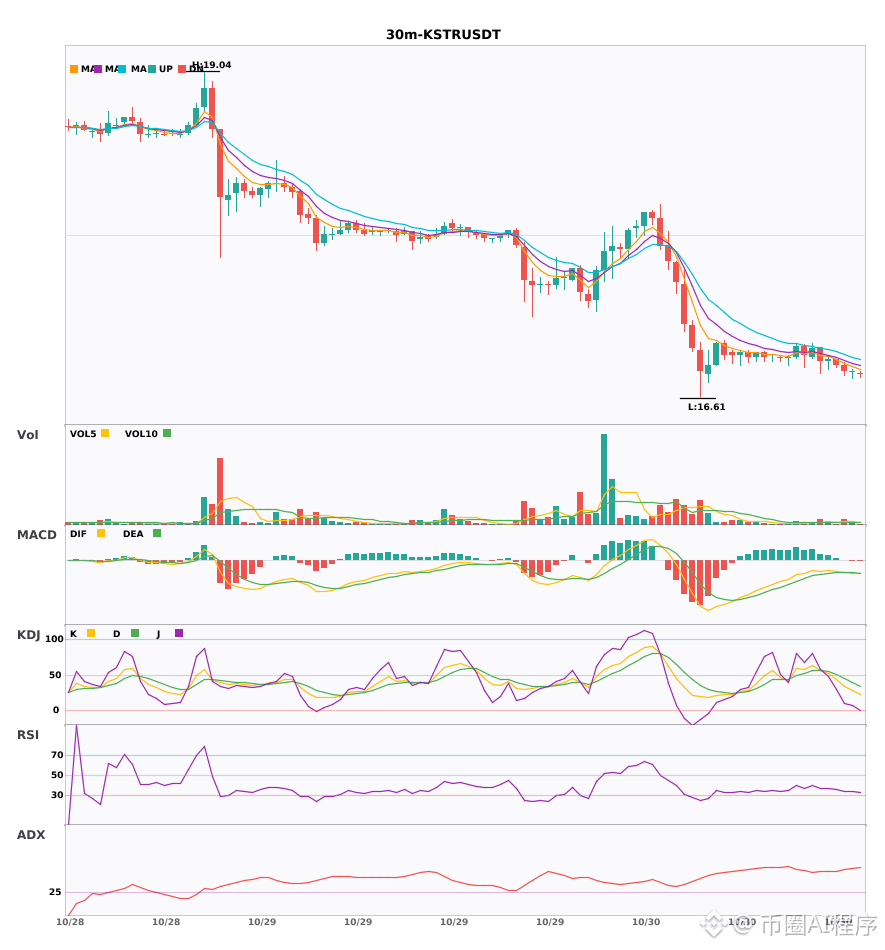
🟢 $KSTR 30-minute short signal
⚠️Technical analysis: 4-hour bearish confluence confirmed | 30-minute entry: MACD bearish crossover below zero, bearish momentum accelerating | EMA5 < EMA8 < EMA13, bearish alignment | KDJ showing weakness, bears in control (K: 33.6, D: 45.4) | Trading volume increased (2.0x)
════════════════════
🔔 Follow for real-time market updates 🔔
#多周期共振 #TUT #KSTR
📌 When trading, pay attention to whether the candlestick pattern confirms the setup
$TUT / $KSTR 30-minute short + 4-hour short in the same direction; multi-timeframe confluence turns bearish 🔥
════════════════════
🟢 $TUT 30-minute short signal
⚠️Technical analysis: 4-hour bearish confluence confirmed | 30-minute entry: MACD bearish crossover below zero, bearish momentum accelerating | EMA5 < EMA8 < EMA13, bearish alignment | KDJ showing weakness, bears in control (K: 27.6, D: 26.8) | Volume normal (1.3x)
════════════════════
🟢 $KSTR 30-minute short signal
⚠️Technical analysis: 4-hour bearish confluence confirmed | 30-minute entry: MACD bearish crossover below zero, bearish momentum accelerating | EMA5 < EMA8 < EMA13, bearish alignment | KDJ showing weakness, bears in control (K: 33.6, D: 45.4) | Trading volume increased (2.0x)
════════════════════
🔔 Follow for real-time market updates 🔔
#多周期共振 #TUT #KSTR
📌 When trading, pay attention to whether the candlestick pattern confirms the setup
════════════════════
🟢 $TUT 30-minute short signal
⚠️Technical analysis: 4-hour bearish confluence confirmed | 30-minute entry: MACD bearish crossover below zero, bearish momentum accelerating | EMA5 < EMA8 < EMA13, bearish alignment | KDJ showing weakness, bears in control (K: 27.6, D: 26.8) | Volume normal (1.3x)
════════════════════
🟢 $KSTR 30-minute short signal
⚠️Technical analysis: 4-hour bearish confluence confirmed | 30-minute entry: MACD bearish crossover below zero, bearish momentum accelerating | EMA5 < EMA8 < EMA13, bearish alignment | KDJ showing weakness, bears in control (K: 33.6, D: 45.4) | Trading volume increased (2.0x)
════════════════════
🔔 Follow for real-time market updates 🔔
#多周期共振 #TUT #KSTR
📌 When trading, pay attention to whether the candlestick pattern confirms the setup
19
·
--
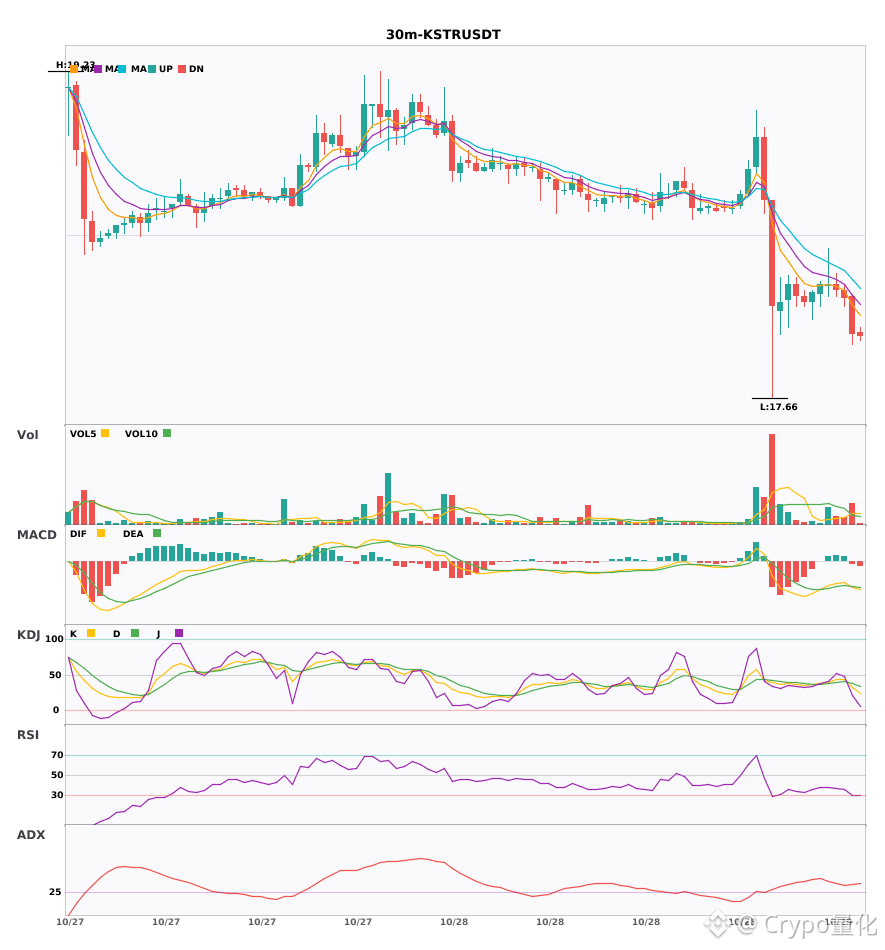
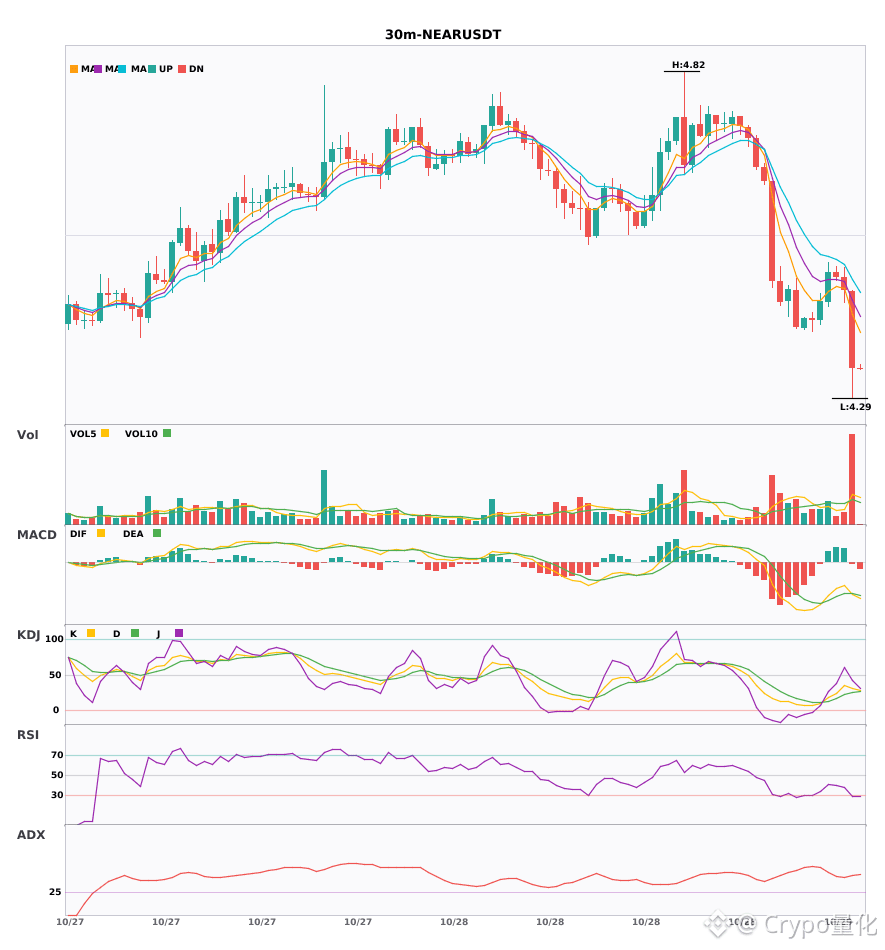
3 bearish alerts on the 30-minute timeframe: $STRK / $KSTR / $NEAR🔥
════════════════════
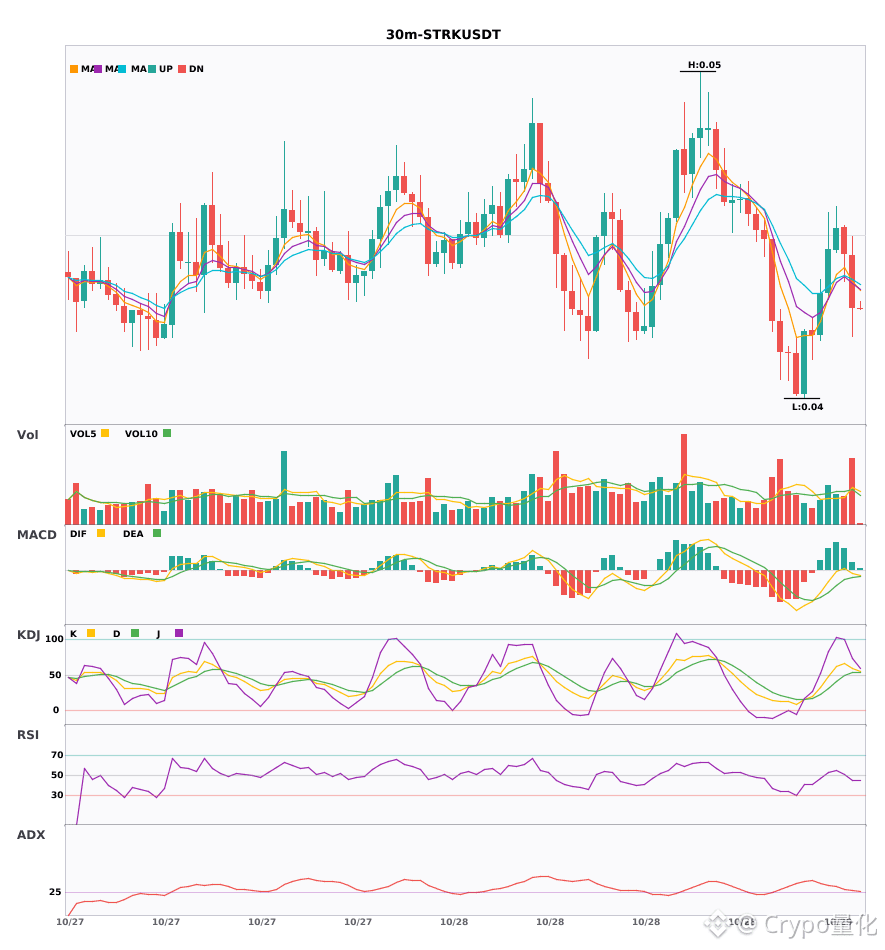
🟢 $STRK 30-minute bearish signal
⚠️Technical analysis: ADX(29): Trend is forming; opportunity to participate | MACD DIF has fallen below zero; trend turning bearish | Moving averages are converging, building momentum; a direction is about to be chosen | KDJ is strong, with bulls in control (K: 59.8, D: 52.9) | Volume increased (1.9x)
════════════════════
🟢 $KSTR 30-minute bearish signal
⚠️Technical analysis: ADX(35): Clear trending market | MACD bearish crossover below zero; bearish momentum accelerating | EMA5 < EMA8 < EMA13: bearish alignment | KDJ bearish crossover; short-term outlook is bearish (K: 32.5, D: 38.3) | Volume increased (2.2x)
════════════════════
🟢 $NEAR 30-minute bearish signal
⚠️Technical analysis: ADX(44): Clear trending market | MACD bearish crossover below zero; bearish momentum accelerating | EMA5 < EMA8 < EMA13: bearish alignment | KDJ is weak, with bears in control (K: 31.2, D: 25.8) | Volume surged (3.5x)
════════════════════
🔔 Follow for first-hand updates on market activity 🔔
#技术分析 #STRK #KSTR #NEAR
📌 When trading, pay attention to whether the candlestick pattern confirms the signal
3 bearish alerts on the 30-minute timeframe: $STRK / $KSTR / $NEAR 🔥
════════════════════
🟢 $STRK 30-minute bearish signal
⚠️Technical analysis: ADX(29): Trend is forming; opportunity to participate | MACD DIF has fallen below zero; trend turning bearish | Moving averages are converging, building momentum; a direction is about to be chosen | KDJ is strong, with bulls in control (K: 59.8, D: 52.9) | Volume increased (1.9x)
════════════════════
🟢 $KSTR 30-minute bearish signal
⚠️Technical analysis: ADX(35): Clear trending market | MACD bearish crossover below zero; bearish momentum accelerating | EMA5 < EMA8 < EMA13: bearish alignment | KDJ bearish crossover; short-term outlook is bearish (K: 32.5, D: 38.3) | Volume increased (2.2x)
════════════════════
🟢 $NEAR 30-minute bearish signal
⚠️Technical analysis: ADX(44): Clear trending market | MACD bearish crossover below zero; bearish momentum accelerating | EMA5 < EMA8 < EMA13: bearish alignment | KDJ is weak, with bears in control (K: 31.2, D: 25.8) | Volume surged (3.5x)
════════════════════
🔔 Follow for first-hand updates on market activity 🔔
#技术分析 #STRK #KSTR #NEAR
📌 When trading, pay attention to whether the candlestick pattern confirms the signal
════════════════════
🟢 $STRK 30-minute bearish signal
⚠️Technical analysis: ADX(29): Trend is forming; opportunity to participate | MACD DIF has fallen below zero; trend turning bearish | Moving averages are converging, building momentum; a direction is about to be chosen | KDJ is strong, with bulls in control (K: 59.8, D: 52.9) | Volume increased (1.9x)
════════════════════
🟢 $KSTR 30-minute bearish signal
⚠️Technical analysis: ADX(35): Clear trending market | MACD bearish crossover below zero; bearish momentum accelerating | EMA5 < EMA8 < EMA13: bearish alignment | KDJ bearish crossover; short-term outlook is bearish (K: 32.5, D: 38.3) | Volume increased (2.2x)
════════════════════
🟢 $NEAR 30-minute bearish signal
⚠️Technical analysis: ADX(44): Clear trending market | MACD bearish crossover below zero; bearish momentum accelerating | EMA5 < EMA8 < EMA13: bearish alignment | KDJ is weak, with bears in control (K: 31.2, D: 25.8) | Volume surged (3.5x)
════════════════════
🔔 Follow for first-hand updates on market activity 🔔
#技术分析 #STRK #KSTR #NEAR
📌 When trading, pay attention to whether the candlestick pattern confirms the signal
29
·
--
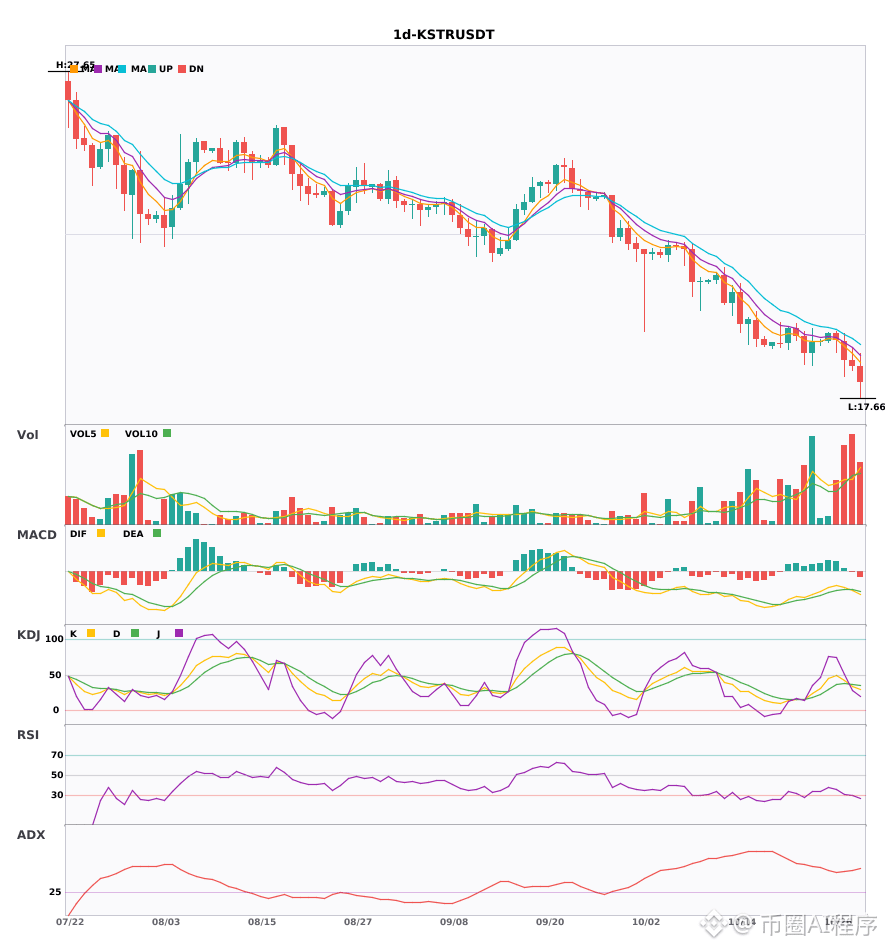
$KSTR Daily bearish + weekly bearish alignment; multi-timeframe resonance—follow the trend 🔥
════════════════════
🟢 $KSTR daily bearish signal
⚠️Technical analysis: Weekly bearish resonance confirmed | Daily entry: MACD bearish crossover below zero, bearish momentum accelerating | EMA5 < EMA8 < EMA13, bearish alignment | KDJ bearish crossover, short-term outlook bearish (K is 34.5, D is 37.2) | Volume increased (1.9x)
════════════════════
🔔 Follow for first-hand market updates 🔔
#多周期共振 #KSTR
📌 When trading, check whether the candlestick pattern matches.
$KSTR Daily bearish + weekly bearish alignment; multi-timeframe resonance—follow the trend 🔥
════════════════════
🟢 $KSTR daily bearish signal
⚠️Technical analysis: Weekly bearish resonance confirmed | Daily entry: MACD bearish crossover below zero, bearish momentum accelerating | EMA5 < EMA8 < EMA13, bearish alignment | KDJ bearish crossover, short-term outlook bearish (K is 34.5, D is 37.2) | Volume increased (1.9x)
════════════════════
🔔 Follow for first-hand market updates 🔔
#多周期共振 #KSTR
📌 When trading, check whether the candlestick pattern matches.
════════════════════
🟢 $KSTR daily bearish signal
⚠️Technical analysis: Weekly bearish resonance confirmed | Daily entry: MACD bearish crossover below zero, bearish momentum accelerating | EMA5 < EMA8 < EMA13, bearish alignment | KDJ bearish crossover, short-term outlook bearish (K is 34.5, D is 37.2) | Volume increased (1.9x)
════════════════════
🔔 Follow for first-hand market updates 🔔
#多周期共振 #KSTR
📌 When trading, check whether the candlestick pattern matches.
17
·
--
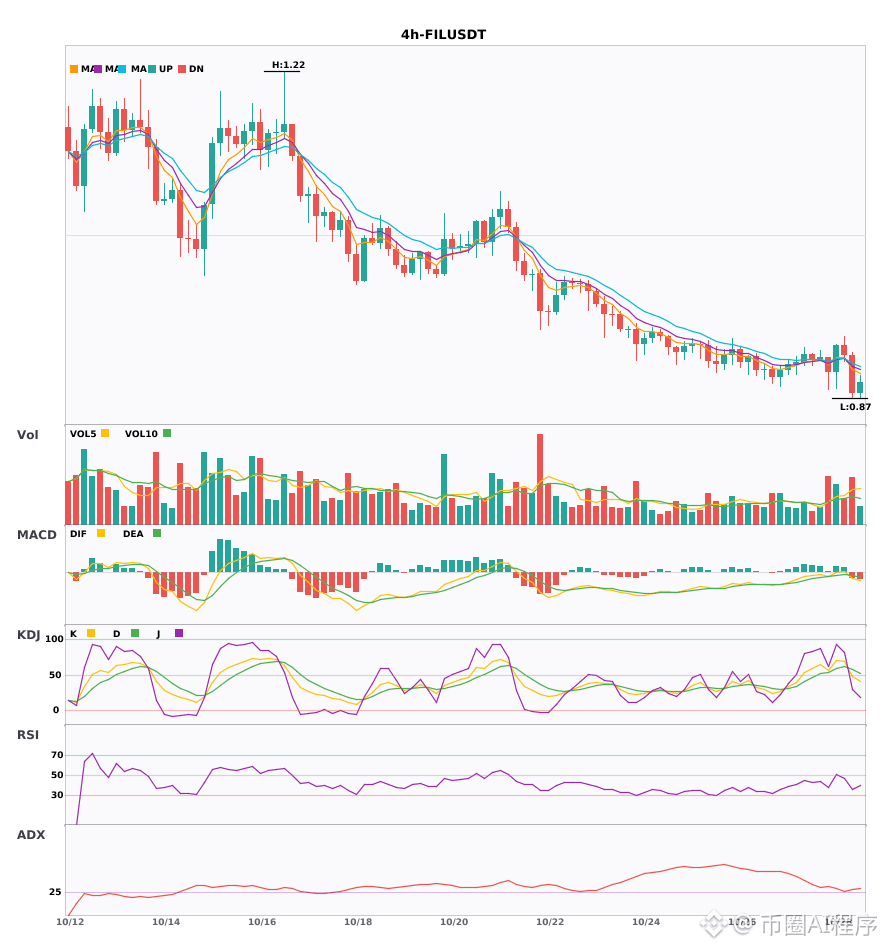
Multi-timeframe confluence: $S / $FIL / $KSTR weakening on the 4-hour timeframe; daily bearish trend confirmed 🔥
════════════════════
🟢 $S 4-hour bearish signal
⚠️ Technical analysis: Daily bearish confluence confirmed | 4-hour entry: MACD bearish crossover below zero, bearish momentum accelerating | EMA5 < EMA8 < EMA13, bearish alignment | KDJ bearish crossover, short-term outlook bearish (K: 44.1, D: 47.0) | Volume increased (1.7x)
════════════════════
🟢 $FIL 4-hour bearish signal
⚠️ Technical analysis: Daily bearish confluence confirmed | 4-hour entry: MACD bearish crossover below zero, bearish momentum accelerating | EMA5 crossed below EMA8, short-term outlook turns bearish | KDJ bearish crossover, short-term outlook bearish (K: 48.6, D: 57.8) | Volume increased (1.7x)
📢 Market update: Binance Will Support the Filecoin (FIL) Network Upgrade & Hard Fork - 2026-10-19
════════════════════
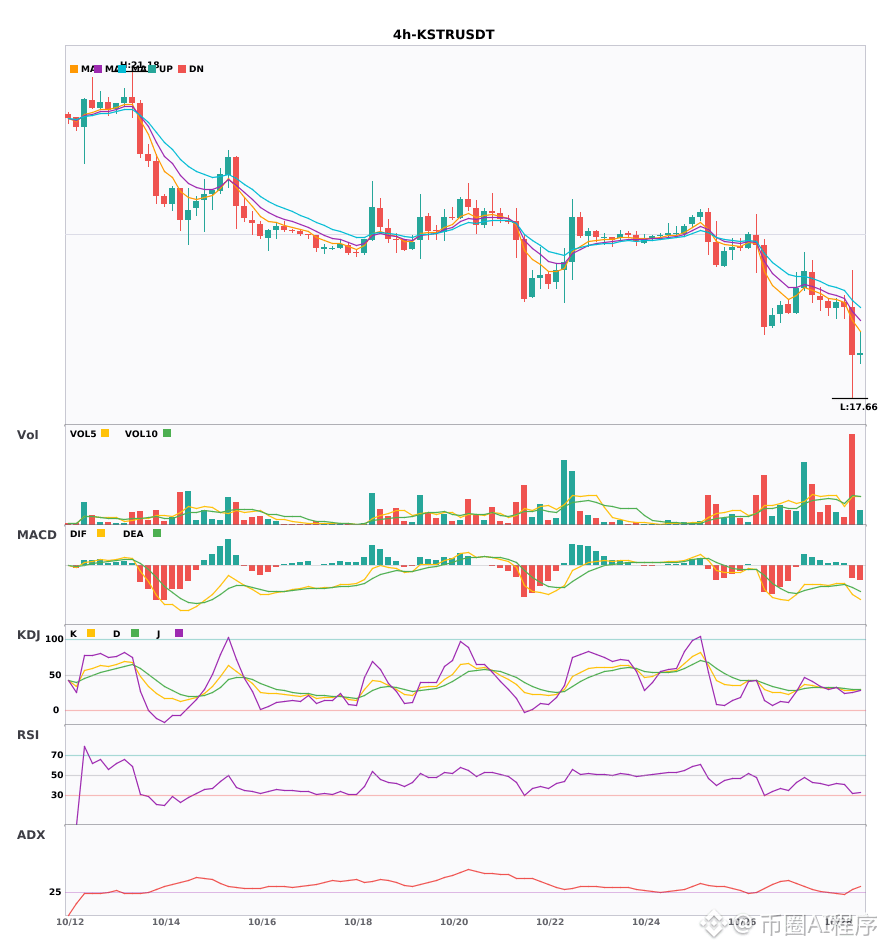
🟢 $KSTR 4-hour bearish signal
⚠️ Technical analysis: Daily bearish confluence confirmed | 4-hour entry: MACD bearish crossover below zero, bearish momentum accelerating | EMA5 < EMA8 < EMA13, bearish alignment | KDJ in weak territory, bears in control (K: 28.7, D: 30.0) | Volume surged (3.1x)
════════════════════
🔔 Follow for real-time market alerts 🔔
#多周期共振 #S #FIL #KSTR
📌 When trading, pay attention to whether the candlestick pattern confirms the setup
Multi-timeframe confluence: $S / $FIL / $KSTR weakening on the 4-hour timeframe; daily bearish trend confirmed 🔥
════════════════════
🟢 $S 4-hour bearish signal
⚠️ Technical analysis: Daily bearish confluence confirmed | 4-hour entry: MACD bearish crossover below zero, bearish momentum accelerating | EMA5 < EMA8 < EMA13, bearish alignment | KDJ bearish crossover, short-term outlook bearish (K: 44.1, D: 47.0) | Volume increased (1.7x)
════════════════════
🟢 $FIL 4-hour bearish signal
⚠️ Technical analysis: Daily bearish confluence confirmed | 4-hour entry: MACD bearish crossover below zero, bearish momentum accelerating | EMA5 crossed below EMA8, short-term outlook turns bearish | KDJ bearish crossover, short-term outlook bearish (K: 48.6, D: 57.8) | Volume increased (1.7x)
📢 Market update: Binance Will Support the Filecoin (FIL) Network Upgrade & Hard Fork - 2026-10-19
════════════════════
🟢 $KSTR 4-hour bearish signal
⚠️ Technical analysis: Daily bearish confluence confirmed | 4-hour entry: MACD bearish crossover below zero, bearish momentum accelerating | EMA5 < EMA8 < EMA13, bearish alignment | KDJ in weak territory, bears in control (K: 28.7, D: 30.0) | Volume surged (3.1x)
════════════════════
🔔 Follow for real-time market alerts 🔔
#多周期共振 #S #FIL #KSTR
📌 When trading, pay attention to whether the candlestick pattern confirms the setup
════════════════════
🟢 $S 4-hour bearish signal
⚠️ Technical analysis: Daily bearish confluence confirmed | 4-hour entry: MACD bearish crossover below zero, bearish momentum accelerating | EMA5 < EMA8 < EMA13, bearish alignment | KDJ bearish crossover, short-term outlook bearish (K: 44.1, D: 47.0) | Volume increased (1.7x)
════════════════════
🟢 $FIL 4-hour bearish signal
⚠️ Technical analysis: Daily bearish confluence confirmed | 4-hour entry: MACD bearish crossover below zero, bearish momentum accelerating | EMA5 crossed below EMA8, short-term outlook turns bearish | KDJ bearish crossover, short-term outlook bearish (K: 48.6, D: 57.8) | Volume increased (1.7x)
📢 Market update: Binance Will Support the Filecoin (FIL) Network Upgrade & Hard Fork - 2026-10-19
════════════════════
🟢 $KSTR 4-hour bearish signal
⚠️ Technical analysis: Daily bearish confluence confirmed | 4-hour entry: MACD bearish crossover below zero, bearish momentum accelerating | EMA5 < EMA8 < EMA13, bearish alignment | KDJ in weak territory, bears in control (K: 28.7, D: 30.0) | Volume surged (3.1x)
════════════════════
🔔 Follow for real-time market alerts 🔔
#多周期共振 #S #FIL #KSTR
📌 When trading, pay attention to whether the candlestick pattern confirms the setup
7
Log in to explore more content
Join global crypto users on Binance Square
⚡️ Get latest and useful information about crypto.
💬 Trusted by the world’s largest crypto exchange.
👍 Discover real insights from verified creators.
Email / Phone number
Trending Topics
1
#BinanceReopensWithdrawalsForMoreAssets
868,598 views
4,627 Discussing
2
#Binance98PercentReplenished
199,714 views
1,886 Discussing
3
#USStocksSlipandCryptoMarketUnderBroadPressure
16,544 views
253 Discussing
4
#StrategySTRCResumesIssuanceAfterOver170Days
25,510 views
427 Discussing
5
#ADPUSPrivateEmployersAdd86000JobsInOctober
41,867 views
579 Discussing
6
#KazakhstanReportedlyInvests$100MInCryptoFunds
2,665 views
58 Discussing
7
#SouthKoreaSeeksCryptoTaxDelayUntil2029
25,279 views
264 Discussing
8
#USMidterms-WhatAreMarketsExpecting?
651,178 views
2,953 Discussing
9
#US10YearTreasuryYieldFallsTo4.845%
36,095 views
199 Discussing
10
#ZcashExpectsNU7ToMake$16MSproutZECInaccessible
1,960 views
24 Discussing