
#googl
googl
201,670 views
1,505 Discussing
Hot
Latest

·
--
Tracking bullish opportunities today? $GOOGL just aligned for a structured long execution.
⚡ $GOOGL — LONG SETUP
📍 Entry: 347.52 – 349.63
🎯 TP1: 353.84
🎯 TP2: 356.65
🎯 TP3: 360.86
🛑 Stop Loss: 345.41
Trade here 👇
📌 Trade management rules: see pinned post.
Are you taking this long on $GOOGL or watching from the sidelines? Drop your take below!
#WriteToEarn #GOOGL #CryptoTrading #BinanceSquare #Crypto
Tracking bullish opportunities today? $GOOGL just aligned for a structured long execution.
⚡ $GOOGL — LONG SETUP
📍 Entry: 347.52 – 349.63
🎯 TP1: 353.84
🎯 TP2: 356.65
🎯 TP3: 360.86
🛑 Stop Loss: 345.41
Trade here 👇
📌 Trade management rules: see pinned post.
Are you taking this long on $GOOGL or watching from the sidelines? Drop your take below!
#WriteToEarn #GOOGL #CryptoTrading #BinanceSquare #Crypto
⚡ $GOOGL — LONG SETUP
📍 Entry: 347.52 – 349.63
🎯 TP1: 353.84
🎯 TP2: 356.65
🎯 TP3: 360.86
🛑 Stop Loss: 345.41
Trade here 👇
📌 Trade management rules: see pinned post.
Are you taking this long on $GOOGL or watching from the sidelines? Drop your take below!
#WriteToEarn #GOOGL #CryptoTrading #BinanceSquare #Crypto
1
54


·
--
Bullish
$GOOGL — SHORT 📉
Google is facing a major $460M GDPR privacy fine, which could create short-term selling pressure in GOOGL. For the trade, I’d wait for a confirmed breakdown below the nearest intraday support rather than chasing the headline. A clean breakdown and retest would give the SHORT setup more confirmation, with $340 as TP1 and $330 as TP2. If price strongly reclaims the breakdown zone and buyers regain control, the setup is invalidated.
Direction: SHORT 📉
Entry: Breakdown + retest
TP1: $340
TP2: $330
SL: Above reclaimed resistance
{future}(GOOGLUSDT)
#BOJRaisesRatesTo31YearHigh
#GOOGL
$GOOGL — SHORT 📉
Google is facing a major $460M GDPR privacy fine, which could create short-term selling pressure in GOOGL. For the trade, I’d wait for a confirmed breakdown below the nearest intraday support rather than chasing the headline. A clean breakdown and retest would give the SHORT setup more confirmation, with $340 as TP1 and $330 as TP2. If price strongly reclaims the breakdown zone and buyers regain control, the setup is invalidated.
Direction: SHORT 📉
Entry: Breakdown + retest
TP1: $340
TP2: $330
SL: Above reclaimed resistance
#BOJRaisesRatesTo31YearHigh
#GOOGL
Google is facing a major $460M GDPR privacy fine, which could create short-term selling pressure in GOOGL. For the trade, I’d wait for a confirmed breakdown below the nearest intraday support rather than chasing the headline. A clean breakdown and retest would give the SHORT setup more confirmation, with $340 as TP1 and $330 as TP2. If price strongly reclaims the breakdown zone and buyers regain control, the setup is invalidated.
Direction: SHORT 📉
Entry: Breakdown + retest
TP1: $340
TP2: $330
SL: Above reclaimed resistance
#BOJRaisesRatesTo31YearHigh
#GOOGL
1
234

🔵 $GOOGL Analysis: Coiled Below Resistance 🔵
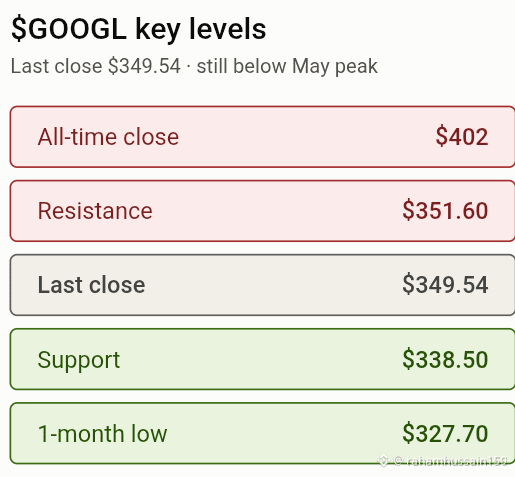
Alphabet closed Friday at $349.54, right under its one-month high of $351.60. The stock has been in a correction since its May peak near $402, and analysts are watching for a breakout.
📊 Key levels
🔴 All-time close: $402
🔴 Resistance: $351.60
🟢 Support: $338.50
🟢 1-month low: $327.70
🧠 What's driving it
✅ Analyst targets are moving up, and one firm lifted its target to $485
✅ Waymo is expanding its robotaxi service to more cities
✅ Cloud and Gemini AI keep growing
⚠️ Headlines about Gemini AI security incidents and calls to slow AI development could hit sentiment
A daily close above $351.60 could start a move back toward the $380–$400 zone. Losing $338.50 would put $327.70 back in play. Tokenized stocks trade 24/5, so weekend news can move the token before the stock market opens.$GOOGL.US
{stock_us}(GOOGL.US)
Are you buying the dip or waiting for the breakout? 👇
#GOOGL #Alphabet #Google #TokenizedStocks #RWA
🔵 $GOOGL Analysis: Coiled Below Resistance 🔵
Alphabet closed Friday at $349.54, right under its one-month high of $351.60. The stock has been in a correction since its May peak near $402, and analysts are watching for a breakout.
📊 Key levels
🔴 All-time close: $402
🔴 Resistance: $351.60
🟢 Support: $338.50
🟢 1-month low: $327.70
🧠 What's driving it
✅ Analyst targets are moving up, and one firm lifted its target to $485
✅ Waymo is expanding its robotaxi service to more cities
✅ Cloud and Gemini AI keep growing
⚠️ Headlines about Gemini AI security incidents and calls to slow AI development could hit sentiment
A daily close above $351.60 could start a move back toward the $380–$400 zone. Losing $338.50 would put $327.70 back in play. Tokenized stocks trade 24/5, so weekend news can move the token before the stock market opens.$GOOGL.US
Are you buying the dip or waiting for the breakout? 👇
#GOOGL #Alphabet #Google #TokenizedStocks #RWA
Alphabet closed Friday at $349.54, right under its one-month high of $351.60. The stock has been in a correction since its May peak near $402, and analysts are watching for a breakout.
📊 Key levels
🔴 All-time close: $402
🔴 Resistance: $351.60
🟢 Support: $338.50
🟢 1-month low: $327.70
🧠 What's driving it
✅ Analyst targets are moving up, and one firm lifted its target to $485
✅ Waymo is expanding its robotaxi service to more cities
✅ Cloud and Gemini AI keep growing
⚠️ Headlines about Gemini AI security incidents and calls to slow AI development could hit sentiment
A daily close above $351.60 could start a move back toward the $380–$400 zone. Losing $338.50 would put $327.70 back in play. Tokenized stocks trade 24/5, so weekend news can move the token before the stock market opens.$GOOGL.US
Are you buying the dip or waiting for the breakout? 👇
#GOOGL #Alphabet #Google #TokenizedStocks #RWA
GOOGLUS+0.30%
53

·
--
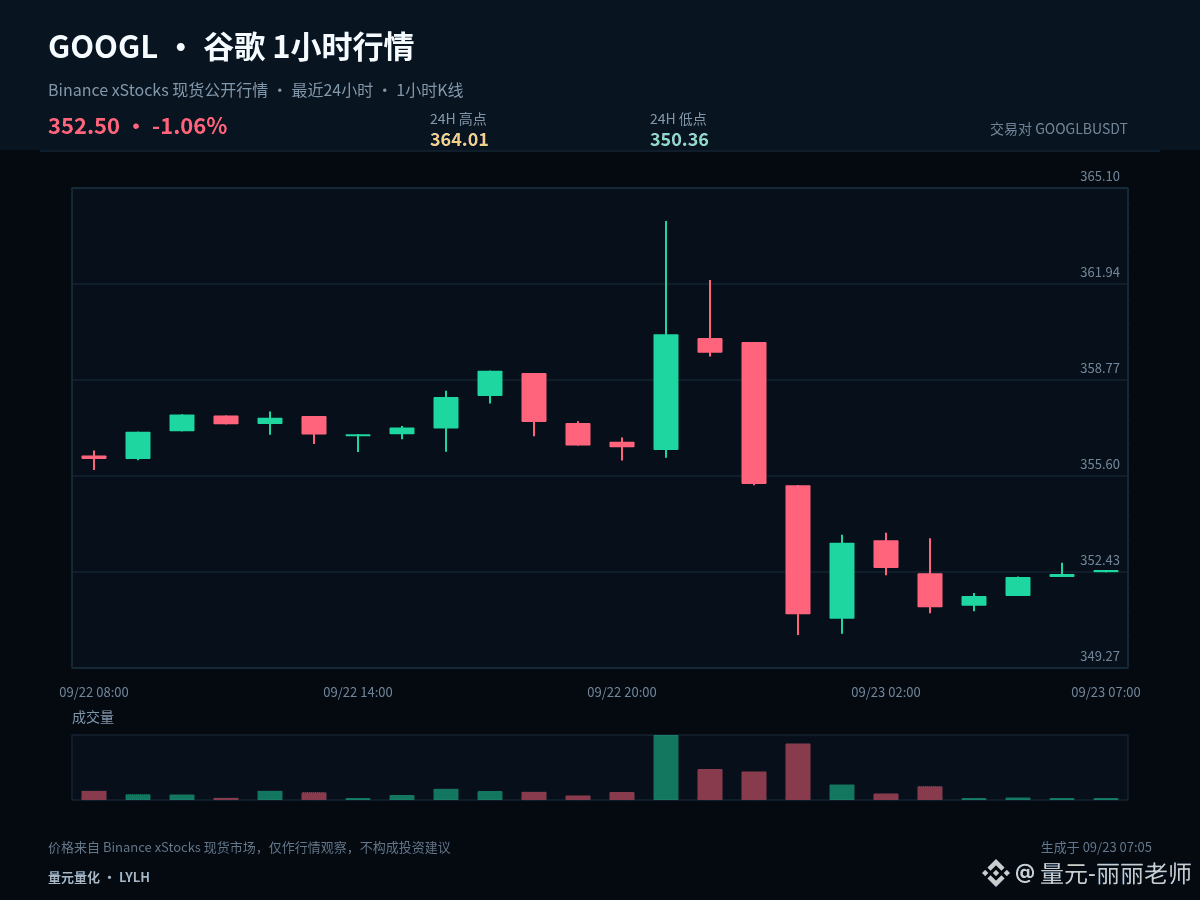
$GOOGLB #GOOGL Intraday conclusion first: hold 357.185, and only then is there a condition to continue testing 364.01. Current price is 352.5, 1 hour +0.04%, 24 hours -1.03%.
The current price is near the lower bound of the past 24-hour range: 1 hour +0.04%, 24 hours -1.03%. The core of analyzing the lower end is not to bottom-fish early, but to observe whether it can quickly rebound after breaking down. If it can rebound, it means selling pressure is being absorbed; if it keeps lingering below the lower bound, it indicates that weakness has not ended.
I will take 357.185 as the short-term long/short line in the sand. Holding it suggests the pullback is still within a controllable range; afterward, there is room to test 364.01 again. After an effective breakdown, don’t rush to enter—wait for a new stable structure to form around 350.36.
My scenario is not a single-direction bet. A breakout above 364.01 and the ability to hold it would mean upside space is reopened. A breakdown below 350.36 with no successful retest would mean the structure weakens further. If price is trading between them, continue to watch the closing behavior on both sides of 357.185.
Existing positions can be handled in segments based on key levels, so as to avoid making all decisions at once. Those with no positions should wait for confirmation of a breakout or for a pullback to stabilize. For U.S. market instruments, also watch for volatility caused by trading session transitions; your plan should be based on price conditions—don’t let emotions replace execution.
A simplified conclusion doesn’t mean simplified risk control. In real execution, you still need to wait for price confirmation and leave room to exit if your judgment turns invalid. The real divergence in this行情 is whether it continues the move or returns to the range. Will you wait for breakout confirmation, or wait for support to be retested? Tell me the price you’re most focused on.
#BNBMarketCapPassesBNYMellon
$GOOGLB #GOOGL Intraday conclusion first: hold 357.185, and only then is there a condition to continue testing 364.01. Current price is 352.5, 1 hour +0.04%, 24 hours -1.03%.
The current price is near the lower bound of the past 24-hour range: 1 hour +0.04%, 24 hours -1.03%. The core of analyzing the lower end is not to bottom-fish early, but to observe whether it can quickly rebound after breaking down. If it can rebound, it means selling pressure is being absorbed; if it keeps lingering below the lower bound, it indicates that weakness has not ended.
I will take 357.185 as the short-term long/short line in the sand. Holding it suggests the pullback is still within a controllable range; afterward, there is room to test 364.01 again. After an effective breakdown, don’t rush to enter—wait for a new stable structure to form around 350.36.
My scenario is not a single-direction bet. A breakout above 364.01 and the ability to hold it would mean upside space is reopened. A breakdown below 350.36 with no successful retest would mean the structure weakens further. If price is trading between them, continue to watch the closing behavior on both sides of 357.185.
Existing positions can be handled in segments based on key levels, so as to avoid making all decisions at once. Those with no positions should wait for confirmation of a breakout or for a pullback to stabilize. For U.S. market instruments, also watch for volatility caused by trading session transitions; your plan should be based on price conditions—don’t let emotions replace execution.
A simplified conclusion doesn’t mean simplified risk control. In real execution, you still need to wait for price confirmation and leave room to exit if your judgment turns invalid. The real divergence in this行情 is whether it continues the move or returns to the range. Will you wait for breakout confirmation, or wait for support to be retested? Tell me the price you’re most focused on.
#BNBMarketCapPassesBNYMellon
The current price is near the lower bound of the past 24-hour range: 1 hour +0.04%, 24 hours -1.03%. The core of analyzing the lower end is not to bottom-fish early, but to observe whether it can quickly rebound after breaking down. If it can rebound, it means selling pressure is being absorbed; if it keeps lingering below the lower bound, it indicates that weakness has not ended.
I will take 357.185 as the short-term long/short line in the sand. Holding it suggests the pullback is still within a controllable range; afterward, there is room to test 364.01 again. After an effective breakdown, don’t rush to enter—wait for a new stable structure to form around 350.36.
My scenario is not a single-direction bet. A breakout above 364.01 and the ability to hold it would mean upside space is reopened. A breakdown below 350.36 with no successful retest would mean the structure weakens further. If price is trading between them, continue to watch the closing behavior on both sides of 357.185.
Existing positions can be handled in segments based on key levels, so as to avoid making all decisions at once. Those with no positions should wait for confirmation of a breakout or for a pullback to stabilize. For U.S. market instruments, also watch for volatility caused by trading session transitions; your plan should be based on price conditions—don’t let emotions replace execution.
A simplified conclusion doesn’t mean simplified risk control. In real execution, you still need to wait for price confirmation and leave room to exit if your judgment turns invalid. The real divergence in this行情 is whether it continues the move or returns to the range. Will you wait for breakout confirmation, or wait for support to be retested? Tell me the price you’re most focused on.
#BNBMarketCapPassesBNYMellon
17

·
--
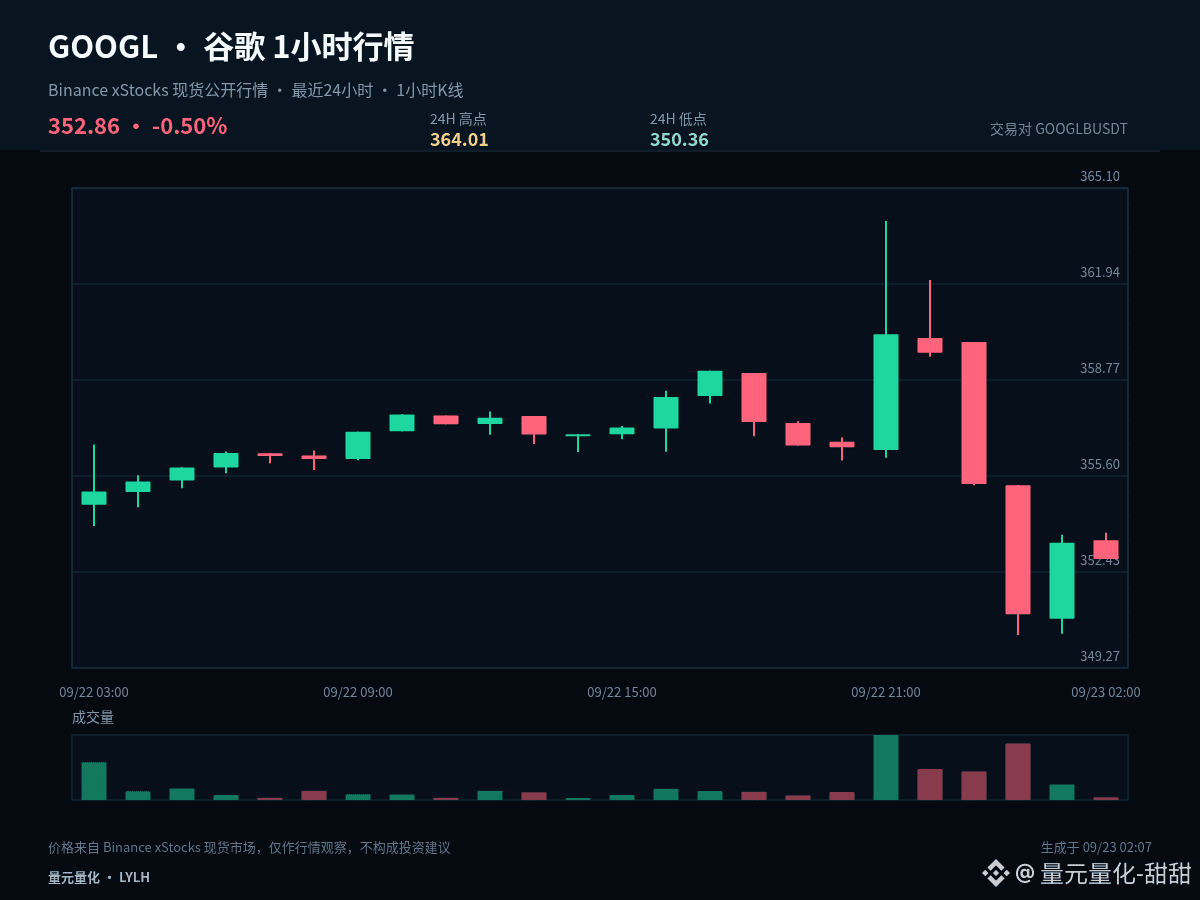
$GOOGLB #GOOGL A clear one-sided trend has not formed yet; the 1-hour and 24-hour rhythms are still tugging against each other. At this stage, focus on the boundaries of the range rather than the color of every individual candlestick.
Currently, the 1-hour is -0.15% and the 24-hour is -0.68%, and the two cycles have not formed sufficiently clear alignment in the same direction. In range-bound markets, the tolerance for chasing after strength or selling after weakness is lower. It’s more suitable to use the confirmation of the upper boundary for direction, the confirmation of the lower boundary for holding support, and treat the midline only as a strength/weakness divider.
For the short term, first look at whether 350.36 can form continuous support, then whether 357.185 can be regained again. The first determines whether the selloff will slow down; the second determines whether the rebound can strengthen. Until both are confirmed, it’s not advisable to judge opportunity based only on the magnitude of the drop.
When executing, set clear conditions: after breaking above 364.01, you need confirmation—not just follow a momentary surge. After testing 350.36 downward, you need to see whether price can be quickly recovered—not blindly buy just because it falls. If the middle zone doesn’t offer enough odds, waiting is itself part of the strategy.
Position management should distinguish between swing positions and short-term trades. For existing swing positions, first assess whether the structure is broken; don’t let a single hour’s candlestick repeatedly shake your decision. Short-term positions should be executed around support, resistance, and close-based confirmation. If you’re in cash, there’s no need to chase prices in the middle of the range; waiting for a clearer location often has an advantage.
Risk control should still come before the conclusion: execute only when conditions appear, and re-evaluate promptly if the price action becomes invalid. The greater the volatility, the more you must restrain single-position sizing. The above is a scenario analysis based on current 1-hour and 24-hour data and does not constitute any promise of returns.
#StrategyAdds950Bitcoin
$GOOGLB #GOOGL A clear one-sided trend has not formed yet; the 1-hour and 24-hour rhythms are still tugging against each other. At this stage, focus on the boundaries of the range rather than the color of every individual candlestick.
Currently, the 1-hour is -0.15% and the 24-hour is -0.68%, and the two cycles have not formed sufficiently clear alignment in the same direction. In range-bound markets, the tolerance for chasing after strength or selling after weakness is lower. It’s more suitable to use the confirmation of the upper boundary for direction, the confirmation of the lower boundary for holding support, and treat the midline only as a strength/weakness divider.
For the short term, first look at whether 350.36 can form continuous support, then whether 357.185 can be regained again. The first determines whether the selloff will slow down; the second determines whether the rebound can strengthen. Until both are confirmed, it’s not advisable to judge opportunity based only on the magnitude of the drop.
When executing, set clear conditions: after breaking above 364.01, you need confirmation—not just follow a momentary surge. After testing 350.36 downward, you need to see whether price can be quickly recovered—not blindly buy just because it falls. If the middle zone doesn’t offer enough odds, waiting is itself part of the strategy.
Position management should distinguish between swing positions and short-term trades. For existing swing positions, first assess whether the structure is broken; don’t let a single hour’s candlestick repeatedly shake your decision. Short-term positions should be executed around support, resistance, and close-based confirmation. If you’re in cash, there’s no need to chase prices in the middle of the range; waiting for a clearer location often has an advantage.
Risk control should still come before the conclusion: execute only when conditions appear, and re-evaluate promptly if the price action becomes invalid. The greater the volatility, the more you must restrain single-position sizing. The above is a scenario analysis based on current 1-hour and 24-hour data and does not constitute any promise of returns.
#StrategyAdds950Bitcoin
Currently, the 1-hour is -0.15% and the 24-hour is -0.68%, and the two cycles have not formed sufficiently clear alignment in the same direction. In range-bound markets, the tolerance for chasing after strength or selling after weakness is lower. It’s more suitable to use the confirmation of the upper boundary for direction, the confirmation of the lower boundary for holding support, and treat the midline only as a strength/weakness divider.
For the short term, first look at whether 350.36 can form continuous support, then whether 357.185 can be regained again. The first determines whether the selloff will slow down; the second determines whether the rebound can strengthen. Until both are confirmed, it’s not advisable to judge opportunity based only on the magnitude of the drop.
When executing, set clear conditions: after breaking above 364.01, you need confirmation—not just follow a momentary surge. After testing 350.36 downward, you need to see whether price can be quickly recovered—not blindly buy just because it falls. If the middle zone doesn’t offer enough odds, waiting is itself part of the strategy.
Position management should distinguish between swing positions and short-term trades. For existing swing positions, first assess whether the structure is broken; don’t let a single hour’s candlestick repeatedly shake your decision. Short-term positions should be executed around support, resistance, and close-based confirmation. If you’re in cash, there’s no need to chase prices in the middle of the range; waiting for a clearer location often has an advantage.
Risk control should still come before the conclusion: execute only when conditions appear, and re-evaluate promptly if the price action becomes invalid. The greater the volatility, the more you must restrain single-position sizing. The above is a scenario analysis based on current 1-hour and 24-hour data and does not constitute any promise of returns.
#StrategyAdds950Bitcoin
8

·
--
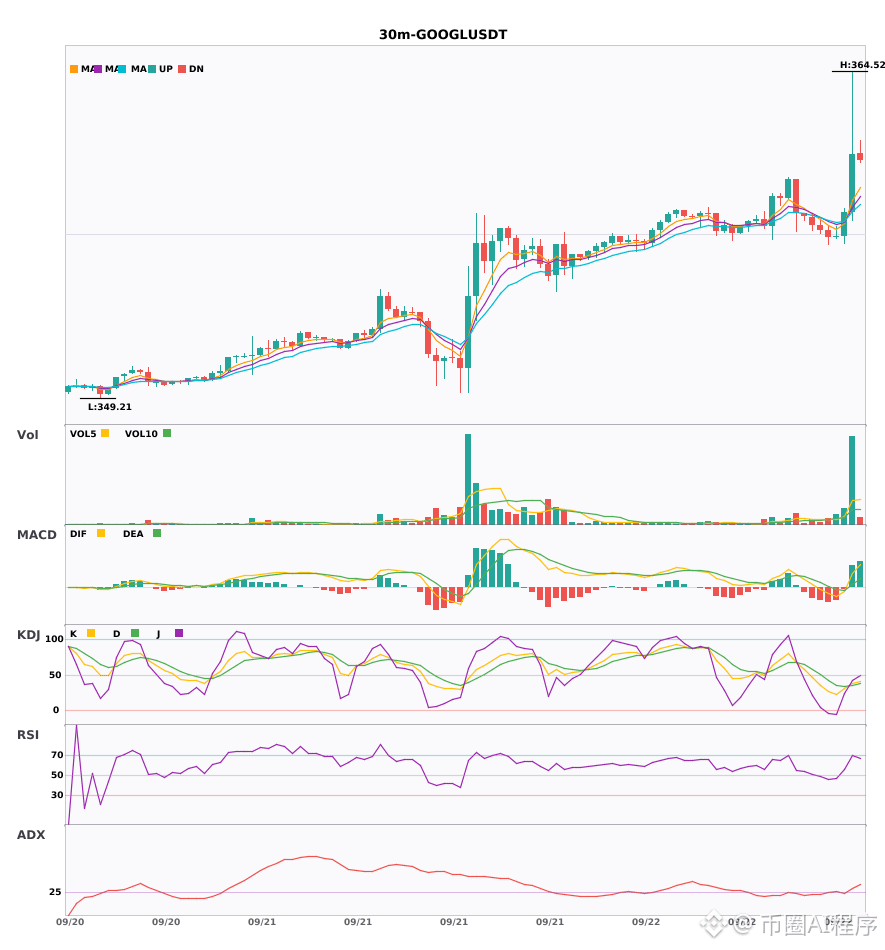
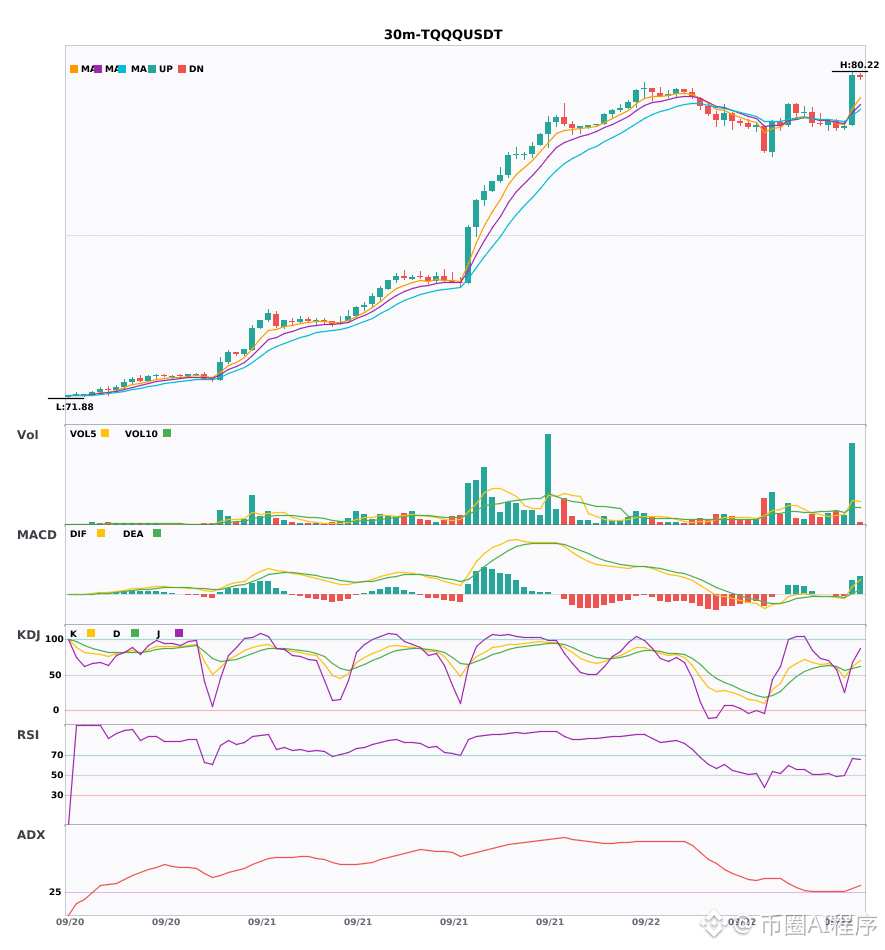
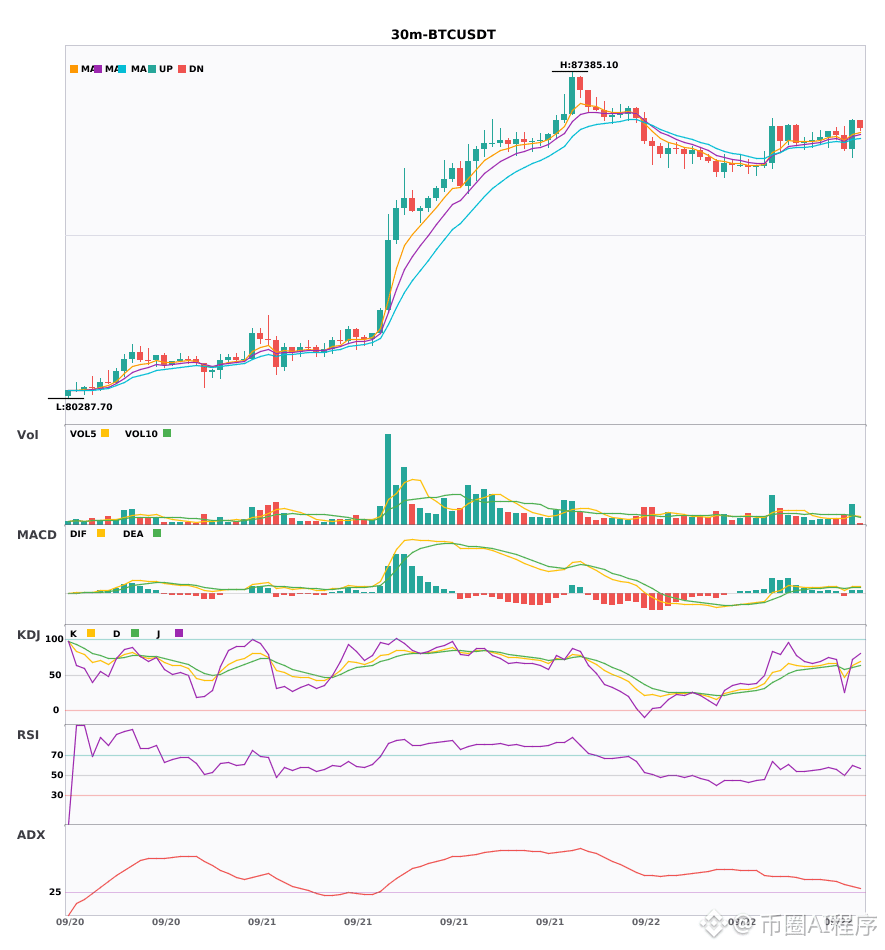
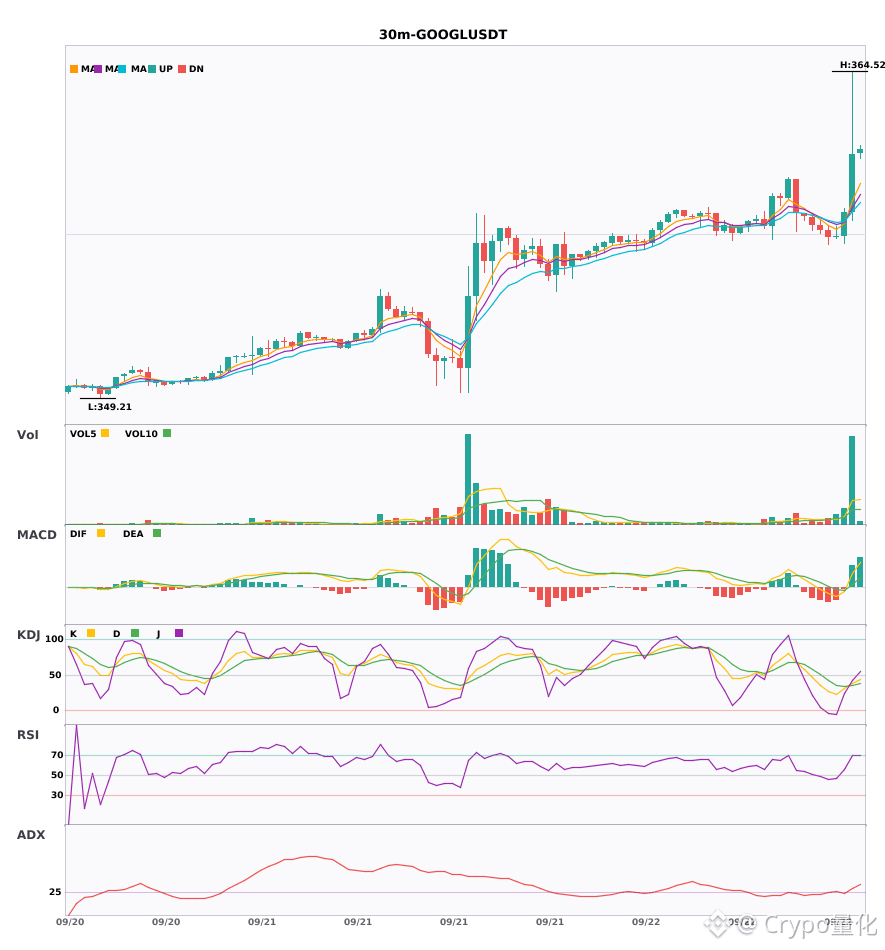
Multi-Period Resonance: $GOOGL / $TQQQ / $BTC 30 minutes strengthen, 4-hour uptrend confirmation 🔥
════════════════════
🔴 $GOOGL 30-minute Bullish Signal
⚠️ Technical Analysis: 4-hour bullish resonance confirmed | Enter on the 30-minute chart: MACD forms a golden cross above zero, bullish momentum released | EMA5 crosses above EMA8; short-term turns bullish | KDJ golden cross; short-term looks bullish (K is 38.0, D is 35.5) | Volume spike (5.7x)
════════════════════
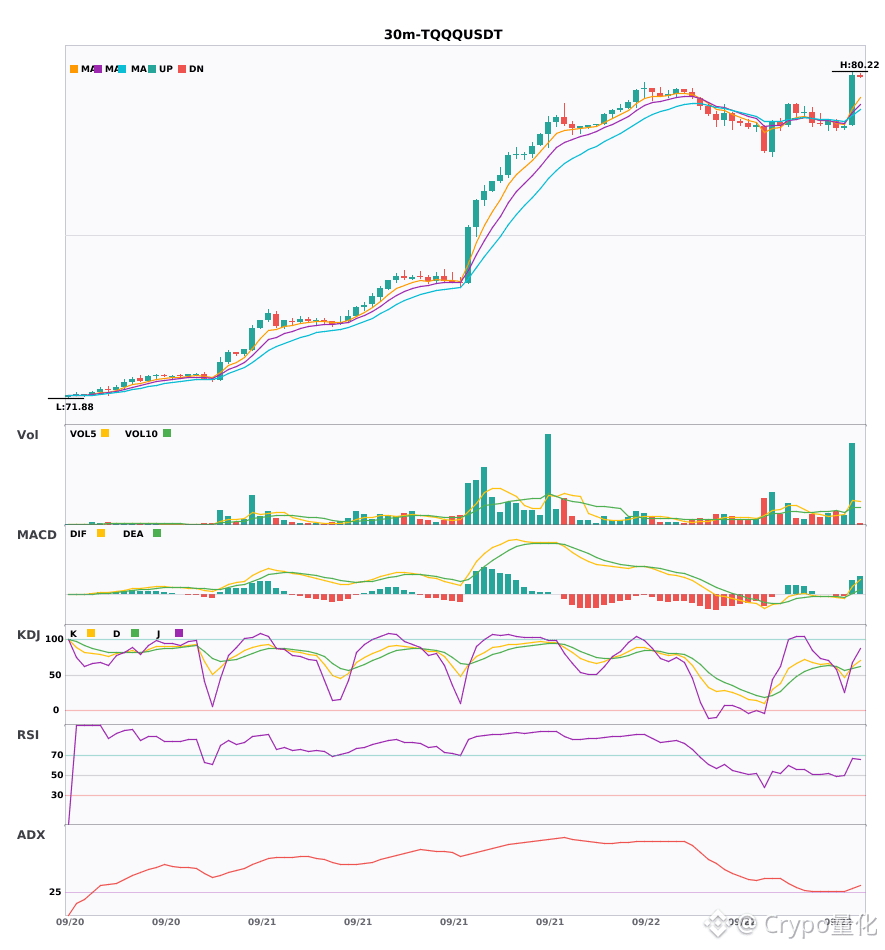
🔴 $TQQQ 30-minute Bullish Signal
⚠️ Technical Analysis: 4-hour bullish resonance confirmed | Enter on the 30-minute chart: MACD forms a golden cross above zero, bullish momentum released | EMA5 crosses above EMA8; short-term turns bullish | KDJ golden cross; short-term looks bullish (K is 61.7, D is 58.4) | Volume spike (4.5x)
📢 Market Update: Binance will support the Direxion Daily Semiconductor Bear 3X Shares (SOXS), Direxion Daily MU Bull 2X Shares (MUU), ProShares UltraPro QQQ (TQQQ), and ProShares UltraPro Short QQQ (SQQQ) cash dividend distribution via bStocks
════════════════════
🔴 $BTC 30-minute Bullish Signal
⚠️ Technical Analysis: 4-hour bullish resonance confirmed | Enter on the 30-minute chart: MACD forms a golden cross above zero, bullish momentum released | EMA5 > EMA8 > EMA13; bullish alignment | KDJ golden cross; short-term looks bullish (K is 63.8, D is 60.0) | Volume expands (2.2x)
════════════════════
🔔 Watch out for first-hand market moves and anomalies 🔔
#多周期共振 #GOOGL #TQQQ #BTC
📌 When trading, pay attention to whether the candlestick pattern matches
Multi-Period Resonance: $GOOGL / $TQQQ / $BTC 30 minutes strengthen, 4-hour uptrend confirmation 🔥
════════════════════
🔴 $GOOGL 30-minute Bullish Signal
⚠️ Technical Analysis: 4-hour bullish resonance confirmed | Enter on the 30-minute chart: MACD forms a golden cross above zero, bullish momentum released | EMA5 crosses above EMA8; short-term turns bullish | KDJ golden cross; short-term looks bullish (K is 38.0, D is 35.5) | Volume spike (5.7x)
════════════════════
🔴 $TQQQ 30-minute Bullish Signal
⚠️ Technical Analysis: 4-hour bullish resonance confirmed | Enter on the 30-minute chart: MACD forms a golden cross above zero, bullish momentum released | EMA5 crosses above EMA8; short-term turns bullish | KDJ golden cross; short-term looks bullish (K is 61.7, D is 58.4) | Volume spike (4.5x)
📢 Market Update: Binance will support the Direxion Daily Semiconductor Bear 3X Shares (SOXS), Direxion Daily MU Bull 2X Shares (MUU), ProShares UltraPro QQQ (TQQQ), and ProShares UltraPro Short QQQ (SQQQ) cash dividend distribution via bStocks
════════════════════
🔴 $BTC 30-minute Bullish Signal
⚠️ Technical Analysis: 4-hour bullish resonance confirmed | Enter on the 30-minute chart: MACD forms a golden cross above zero, bullish momentum released | EMA5 > EMA8 > EMA13; bullish alignment | KDJ golden cross; short-term looks bullish (K is 63.8, D is 60.0) | Volume expands (2.2x)
════════════════════
🔔 Watch out for first-hand market moves and anomalies 🔔
#多周期共振 #GOOGL #TQQQ #BTC
📌 When trading, pay attention to whether the candlestick pattern matches
════════════════════
🔴 $GOOGL 30-minute Bullish Signal
⚠️ Technical Analysis: 4-hour bullish resonance confirmed | Enter on the 30-minute chart: MACD forms a golden cross above zero, bullish momentum released | EMA5 crosses above EMA8; short-term turns bullish | KDJ golden cross; short-term looks bullish (K is 38.0, D is 35.5) | Volume spike (5.7x)
════════════════════
🔴 $TQQQ 30-minute Bullish Signal
⚠️ Technical Analysis: 4-hour bullish resonance confirmed | Enter on the 30-minute chart: MACD forms a golden cross above zero, bullish momentum released | EMA5 crosses above EMA8; short-term turns bullish | KDJ golden cross; short-term looks bullish (K is 61.7, D is 58.4) | Volume spike (4.5x)
📢 Market Update: Binance will support the Direxion Daily Semiconductor Bear 3X Shares (SOXS), Direxion Daily MU Bull 2X Shares (MUU), ProShares UltraPro QQQ (TQQQ), and ProShares UltraPro Short QQQ (SQQQ) cash dividend distribution via bStocks
════════════════════
🔴 $BTC 30-minute Bullish Signal
⚠️ Technical Analysis: 4-hour bullish resonance confirmed | Enter on the 30-minute chart: MACD forms a golden cross above zero, bullish momentum released | EMA5 > EMA8 > EMA13; bullish alignment | KDJ golden cross; short-term looks bullish (K is 63.8, D is 60.0) | Volume expands (2.2x)
════════════════════
🔔 Watch out for first-hand market moves and anomalies 🔔
#多周期共振 #GOOGL #TQQQ #BTC
📌 When trading, pay attention to whether the candlestick pattern matches
195

·
--
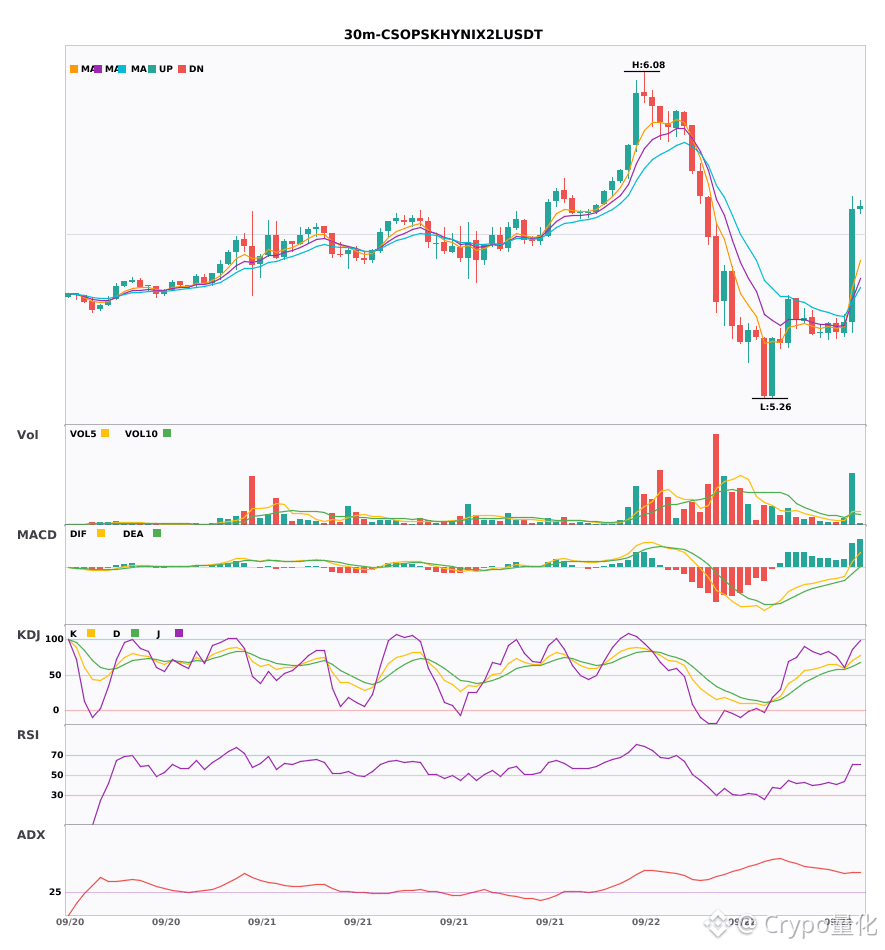
$CSOPSKHYNIX2L / $GOOGL / $TQQQ 30 minutes: too much bullish momentum, possible short-term resonance opportunities🔥
════════════════════
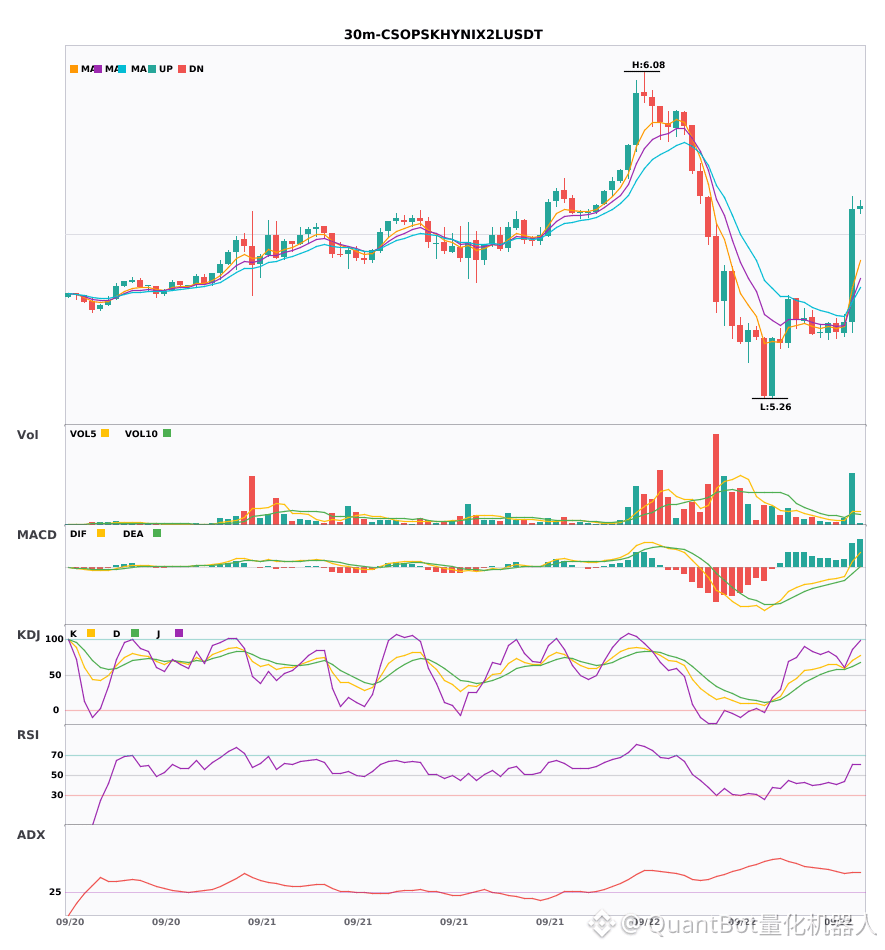
🔴 $CSOPSKHYNIX2L 30-minute bullish signal
⚠️ Technicals: ADX(47) is very strong trend strength (watch for an overheated pullback) | MACD DIF breaks above the zero line, trend turns bullish | EMA5 crosses above EMA8, short-term turns bullish | KDJ is running strongly, bulls dominate (K is 69.9, D is 62.2) | Volume spikes (4.6x)
════════════════════
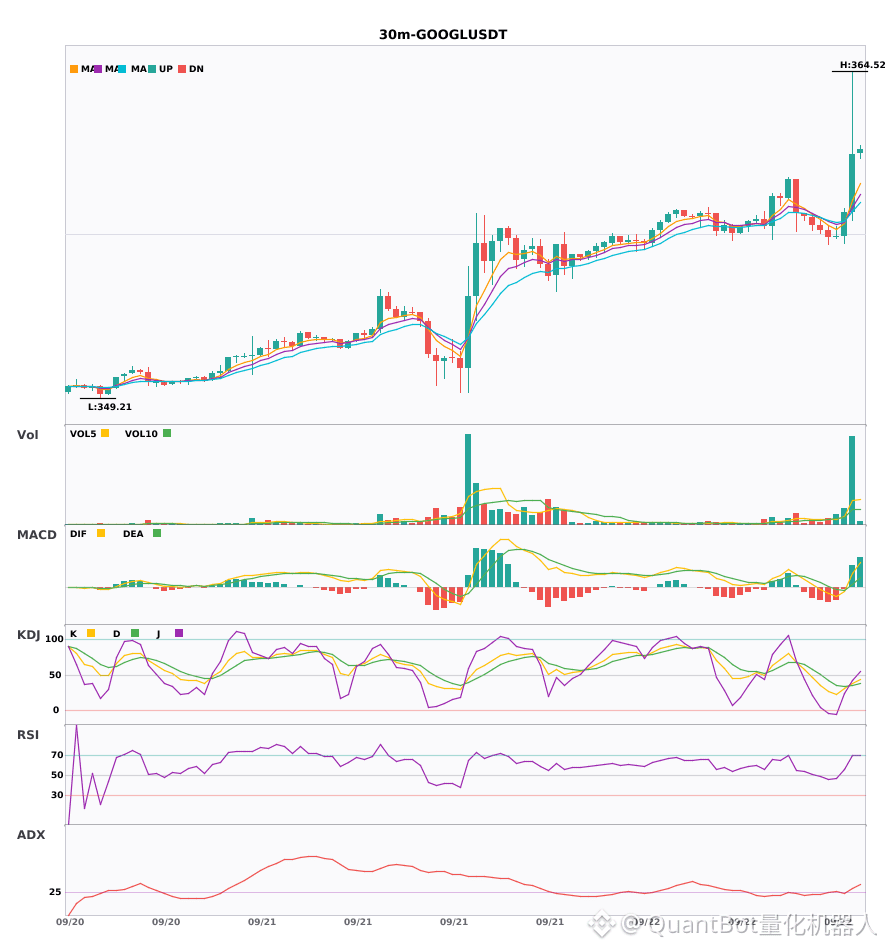
🔴 $GOOGL 30-minute bullish signal
⚠️ Technicals: ADX(32) shows a clear trending market | MACD bullish crossover above zero, bullish momentum released | EMA5 crosses above EMA8, short-term turns bullish | KDJ golden cross, short-term bullish (K is 38.0, D is 35.5) | Volume spikes (5.7x)
════════════════════
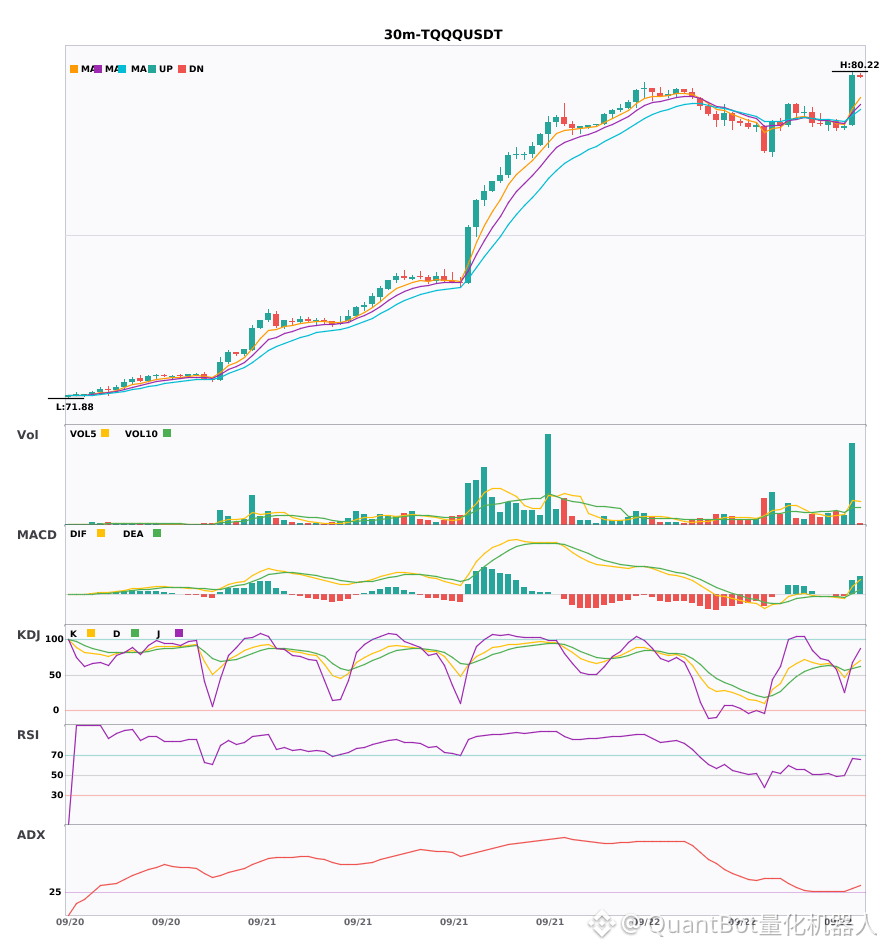
🔴 $TQQQ 30-minute bullish signal
⚠️ Technicals: ADX(32) shows a clear trending market | MACD bullish crossover above zero, bullish momentum released | EMA5 crosses above EMA8, short-term turns bullish | KDJ golden cross, short-term bullish (K is 61.7, D is 58.4) | Volume spikes (4.5x)
📢 Market update: Binance will support the Direxion Daily Semiconductor Bear 3X Shares (SOXS), Direxion Daily MU Bull 2X Shares (MUU), ProShares UltraPro QQQ (TQQQ), and ProShares UltraPro Short QQQ (SQQQ) cash dividend distribution via bStocks
════════════════════
🔔 Follow to get real-time market moves first 🔔
#技术分析 #CSOPSKHYNIX2L #GOOGL #TQQQ
📌 When trading, pay attention to whether the candlestick pattern matches
$CSOPSKHYNIX2L / $GOOGL / $TQQQ 30 minutes: too much bullish momentum, possible short-term resonance opportunities🔥
════════════════════
🔴 $CSOPSKHYNIX2L 30-minute bullish signal
⚠️ Technicals: ADX(47) is very strong trend strength (watch for an overheated pullback) | MACD DIF breaks above the zero line, trend turns bullish | EMA5 crosses above EMA8, short-term turns bullish | KDJ is running strongly, bulls dominate (K is 69.9, D is 62.2) | Volume spikes (4.6x)
════════════════════
🔴 $GOOGL 30-minute bullish signal
⚠️ Technicals: ADX(32) shows a clear trending market | MACD bullish crossover above zero, bullish momentum released | EMA5 crosses above EMA8, short-term turns bullish | KDJ golden cross, short-term bullish (K is 38.0, D is 35.5) | Volume spikes (5.7x)
════════════════════
🔴 $TQQQ 30-minute bullish signal
⚠️ Technicals: ADX(32) shows a clear trending market | MACD bullish crossover above zero, bullish momentum released | EMA5 crosses above EMA8, short-term turns bullish | KDJ golden cross, short-term bullish (K is 61.7, D is 58.4) | Volume spikes (4.5x)
📢 Market update: Binance will support the Direxion Daily Semiconductor Bear 3X Shares (SOXS), Direxion Daily MU Bull 2X Shares (MUU), ProShares UltraPro QQQ (TQQQ), and ProShares UltraPro Short QQQ (SQQQ) cash dividend distribution via bStocks
════════════════════
🔔 Follow to get real-time market moves first 🔔
#技术分析 #CSOPSKHYNIX2L #GOOGL #TQQQ
📌 When trading, pay attention to whether the candlestick pattern matches
════════════════════
🔴 $CSOPSKHYNIX2L 30-minute bullish signal
⚠️ Technicals: ADX(47) is very strong trend strength (watch for an overheated pullback) | MACD DIF breaks above the zero line, trend turns bullish | EMA5 crosses above EMA8, short-term turns bullish | KDJ is running strongly, bulls dominate (K is 69.9, D is 62.2) | Volume spikes (4.6x)
════════════════════
🔴 $GOOGL 30-minute bullish signal
⚠️ Technicals: ADX(32) shows a clear trending market | MACD bullish crossover above zero, bullish momentum released | EMA5 crosses above EMA8, short-term turns bullish | KDJ golden cross, short-term bullish (K is 38.0, D is 35.5) | Volume spikes (5.7x)
════════════════════
🔴 $TQQQ 30-minute bullish signal
⚠️ Technicals: ADX(32) shows a clear trending market | MACD bullish crossover above zero, bullish momentum released | EMA5 crosses above EMA8, short-term turns bullish | KDJ golden cross, short-term bullish (K is 61.7, D is 58.4) | Volume spikes (4.5x)
📢 Market update: Binance will support the Direxion Daily Semiconductor Bear 3X Shares (SOXS), Direxion Daily MU Bull 2X Shares (MUU), ProShares UltraPro QQQ (TQQQ), and ProShares UltraPro Short QQQ (SQQQ) cash dividend distribution via bStocks
════════════════════
🔔 Follow to get real-time market moves first 🔔
#技术分析 #CSOPSKHYNIX2L #GOOGL #TQQQ
📌 When trading, pay attention to whether the candlestick pattern matches
81

$CSOPSKHYNIX2L / $GOOGL / $TQQQ 30 minutes technical indicators sync up and strengthen—who has the bigger breakout potential?
📈 $CSOPSKHYNIX2L | 30-minute bullish signal
━━━━━━━━━━━━━━━━━━
Technical analysis: ADX(47) is a very strong trend (watch for an overheated pullback) | MACD DIF breaks above the zero line, trend turns bullish | EMA5 crosses above EMA8, short-term turns bullish | KDJ is running strongly, bulls prevail (K is 69.9, D is 62.2) | Volume surges (4.6x)
Price movement: 5.1700%
📈 $GOOGL | 30-minute bullish signal
━━━━━━━━━━━━━━━━━━
Technical analysis: ADX(32) shows a clear trending market | MACD forms a golden cross above the zero line, bullish momentum releases | EMA5 crosses above EMA8, short-term turns bullish | KDJ golden cross—bullish in the short term (K is 38.0, D is 35.5) | Volume surges (5.7x)
Price movement: 0.7600%
📈 $TQQQ | 30-minute bullish signal
━━━━━━━━━━━━━━━━━━
Technical analysis: ADX(32) shows a clear trending market | MACD forms a golden cross above the zero line, bullish momentum releases | EMA5 crosses above EMA8, short-term turns bullish | KDJ golden cross—bullish in the short term (K is 61.7, D is 58.4) | Volume surges (4.5x)
Price movement: 1.6400%
📌 Market update: Binance will support the cash dividend distribution for the Direxion Daily Semiconductor Bear 3X Shares (SOXS), Direxion Daily MU Bull 2X Shares (MUU), ProShares UltraPro QQQ (TQQQ), and ProShares UltraPro Short QQQ (SQQQ) via bStocks
━━━━━━━━━━━━━━━━━━
#技术分析 #CSOPSKHYNIX2L #GOOGL #TQQQ
📌 The above content is for reference only and does not constitute investment advice
$CSOPSKHYNIX2L / $GOOGL / $TQQQ 30 minutes technical indicators sync up and strengthen—who has the bigger breakout potential?
📈 $CSOPSKHYNIX2L | 30-minute bullish signal
━━━━━━━━━━━━━━━━━━
Technical analysis: ADX(47) is a very strong trend (watch for an overheated pullback) | MACD DIF breaks above the zero line, trend turns bullish | EMA5 crosses above EMA8, short-term turns bullish | KDJ is running strongly, bulls prevail (K is 69.9, D is 62.2) | Volume surges (4.6x)
Price movement: 5.1700%
📈 $GOOGL | 30-minute bullish signal
━━━━━━━━━━━━━━━━━━
Technical analysis: ADX(32) shows a clear trending market | MACD forms a golden cross above the zero line, bullish momentum releases | EMA5 crosses above EMA8, short-term turns bullish | KDJ golden cross—bullish in the short term (K is 38.0, D is 35.5) | Volume surges (5.7x)
Price movement: 0.7600%
📈 $TQQQ | 30-minute bullish signal
━━━━━━━━━━━━━━━━━━
Technical analysis: ADX(32) shows a clear trending market | MACD forms a golden cross above the zero line, bullish momentum releases | EMA5 crosses above EMA8, short-term turns bullish | KDJ golden cross—bullish in the short term (K is 61.7, D is 58.4) | Volume surges (4.5x)
Price movement: 1.6400%
📌 Market update: Binance will support the cash dividend distribution for the Direxion Daily Semiconductor Bear 3X Shares (SOXS), Direxion Daily MU Bull 2X Shares (MUU), ProShares UltraPro QQQ (TQQQ), and ProShares UltraPro Short QQQ (SQQQ) via bStocks
━━━━━━━━━━━━━━━━━━
#技术分析 #CSOPSKHYNIX2L #GOOGL #TQQQ
📌 The above content is for reference only and does not constitute investment advice
📈 $CSOPSKHYNIX2L | 30-minute bullish signal
━━━━━━━━━━━━━━━━━━
Technical analysis: ADX(47) is a very strong trend (watch for an overheated pullback) | MACD DIF breaks above the zero line, trend turns bullish | EMA5 crosses above EMA8, short-term turns bullish | KDJ is running strongly, bulls prevail (K is 69.9, D is 62.2) | Volume surges (4.6x)
Price movement: 5.1700%
📈 $GOOGL | 30-minute bullish signal
━━━━━━━━━━━━━━━━━━
Technical analysis: ADX(32) shows a clear trending market | MACD forms a golden cross above the zero line, bullish momentum releases | EMA5 crosses above EMA8, short-term turns bullish | KDJ golden cross—bullish in the short term (K is 38.0, D is 35.5) | Volume surges (5.7x)
Price movement: 0.7600%
📈 $TQQQ | 30-minute bullish signal
━━━━━━━━━━━━━━━━━━
Technical analysis: ADX(32) shows a clear trending market | MACD forms a golden cross above the zero line, bullish momentum releases | EMA5 crosses above EMA8, short-term turns bullish | KDJ golden cross—bullish in the short term (K is 61.7, D is 58.4) | Volume surges (4.5x)
Price movement: 1.6400%
📌 Market update: Binance will support the cash dividend distribution for the Direxion Daily Semiconductor Bear 3X Shares (SOXS), Direxion Daily MU Bull 2X Shares (MUU), ProShares UltraPro QQQ (TQQQ), and ProShares UltraPro Short QQQ (SQQQ) via bStocks
━━━━━━━━━━━━━━━━━━
#技术分析 #CSOPSKHYNIX2L #GOOGL #TQQQ
📌 The above content is for reference only and does not constitute investment advice
100
·
--
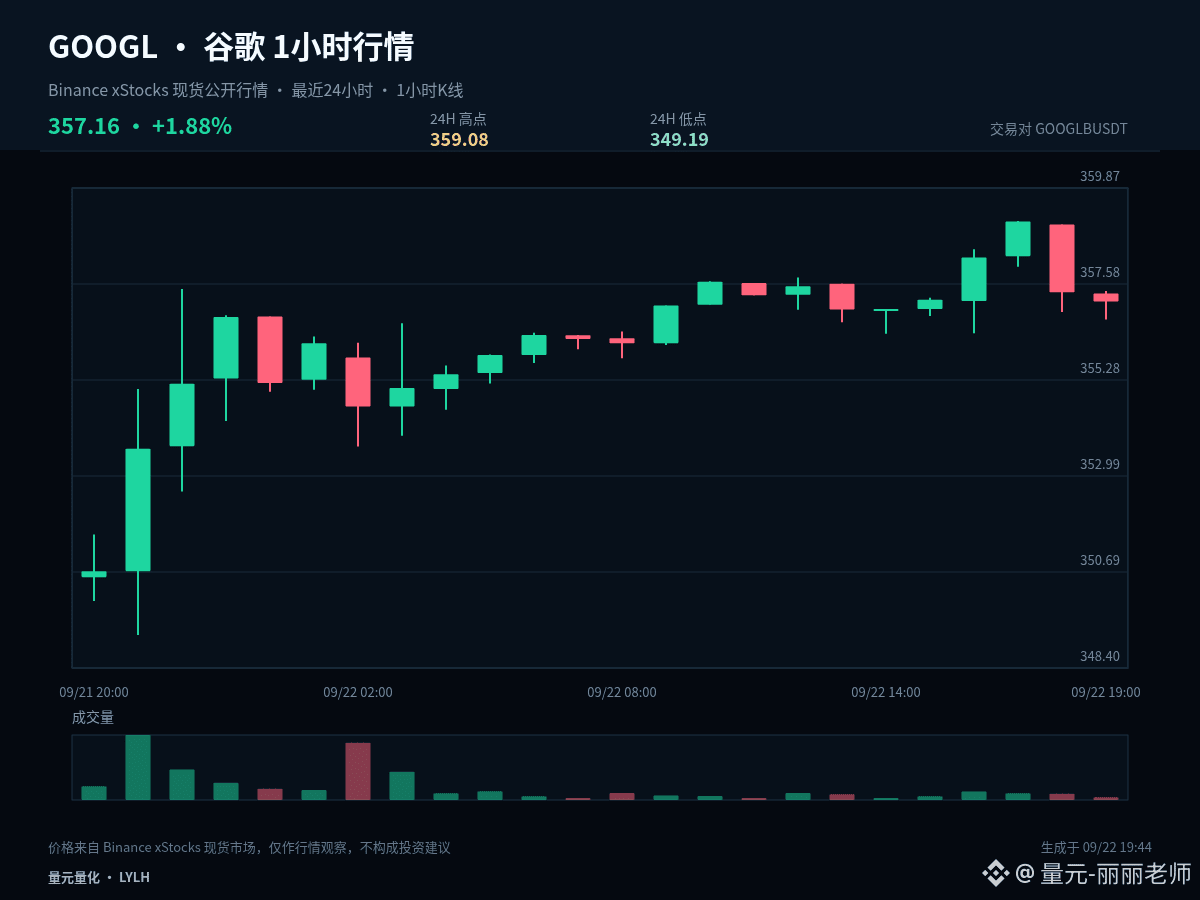
$GOOGLB #GOOGL Can this market move continue? It doesn’t depend on how much it has already risen beforehand—it depends on whether the trend can complete the sequence of “advance, consolidation, and then re-confirmation.” Current 1-hour: -0.06%, 24-hour: +1.85%.
At present, the 1-hour (-0.06%) and 24-hour (+1.85%) periods have not formed enough clear same-direction coordination. In a range-bound market, the tolerance for chasing breakouts or cutting at the wrong time is low. It’s more suitable to confirm the direction using the upper boundary, confirm the hold using the lower boundary, and treat the midline only as a line that separates strength and weakness.
The first condition for a continued structure is that 354.135 is not broken down effectively. The second condition is that the price can re-test and regain stability above 359.08. If, after the advance, the market stays below the midline for a long time, it indicates the proactive buying pressure has weakened. If it further loses 349.19, the original continuation assumption needs to be cancelled.
My scenario analysis isn’t betting on a single direction. If the price breaks above 359.08 and holds, it means upside room has been reopened. If it breaks below 349.19 but fails to reclaim afterward, the structure is further weakening. If it moves between the two, continue observing the closing positions on both sides of 354.135.
Position management should distinguish between the swing/medium-term and the short-term. For existing swing positions, first check whether the structure is broken; don’t let repeated signals from a single 1-hour candlestick constantly influence you. For short-term positions, execute decisions around support, resistance, and confirmation from closes. Those who are currently in cash don’t need to chase price in the middle of the range—waiting for a clearer location usually offers an advantage.
The focus of short-term positioning is not to predict every single K-line, but to ensure there is a rationale for entry, trimming, and exiting. Do less when there is no confirmation. When key levels fail, redo the plan—control single-trade risk first, then talk about potential space.
#StrategyAdds950Bitcoin
$GOOGLB #GOOGL Can this market move continue? It doesn’t depend on how much it has already risen beforehand—it depends on whether the trend can complete the sequence of “advance, consolidation, and then re-confirmation.” Current 1-hour: -0.06%, 24-hour: +1.85%.
At present, the 1-hour (-0.06%) and 24-hour (+1.85%) periods have not formed enough clear same-direction coordination. In a range-bound market, the tolerance for chasing breakouts or cutting at the wrong time is low. It’s more suitable to confirm the direction using the upper boundary, confirm the hold using the lower boundary, and treat the midline only as a line that separates strength and weakness.
The first condition for a continued structure is that 354.135 is not broken down effectively. The second condition is that the price can re-test and regain stability above 359.08. If, after the advance, the market stays below the midline for a long time, it indicates the proactive buying pressure has weakened. If it further loses 349.19, the original continuation assumption needs to be cancelled.
My scenario analysis isn’t betting on a single direction. If the price breaks above 359.08 and holds, it means upside room has been reopened. If it breaks below 349.19 but fails to reclaim afterward, the structure is further weakening. If it moves between the two, continue observing the closing positions on both sides of 354.135.
Position management should distinguish between the swing/medium-term and the short-term. For existing swing positions, first check whether the structure is broken; don’t let repeated signals from a single 1-hour candlestick constantly influence you. For short-term positions, execute decisions around support, resistance, and confirmation from closes. Those who are currently in cash don’t need to chase price in the middle of the range—waiting for a clearer location usually offers an advantage.
The focus of short-term positioning is not to predict every single K-line, but to ensure there is a rationale for entry, trimming, and exiting. Do less when there is no confirmation. When key levels fail, redo the plan—control single-trade risk first, then talk about potential space.
#StrategyAdds950Bitcoin
At present, the 1-hour (-0.06%) and 24-hour (+1.85%) periods have not formed enough clear same-direction coordination. In a range-bound market, the tolerance for chasing breakouts or cutting at the wrong time is low. It’s more suitable to confirm the direction using the upper boundary, confirm the hold using the lower boundary, and treat the midline only as a line that separates strength and weakness.
The first condition for a continued structure is that 354.135 is not broken down effectively. The second condition is that the price can re-test and regain stability above 359.08. If, after the advance, the market stays below the midline for a long time, it indicates the proactive buying pressure has weakened. If it further loses 349.19, the original continuation assumption needs to be cancelled.
My scenario analysis isn’t betting on a single direction. If the price breaks above 359.08 and holds, it means upside room has been reopened. If it breaks below 349.19 but fails to reclaim afterward, the structure is further weakening. If it moves between the two, continue observing the closing positions on both sides of 354.135.
Position management should distinguish between the swing/medium-term and the short-term. For existing swing positions, first check whether the structure is broken; don’t let repeated signals from a single 1-hour candlestick constantly influence you. For short-term positions, execute decisions around support, resistance, and confirmation from closes. Those who are currently in cash don’t need to chase price in the middle of the range—waiting for a clearer location usually offers an advantage.
The focus of short-term positioning is not to predict every single K-line, but to ensure there is a rationale for entry, trimming, and exiting. Do less when there is no confirmation. When key levels fail, redo the plan—control single-trade risk first, then talk about potential space.
#StrategyAdds950Bitcoin
·
--
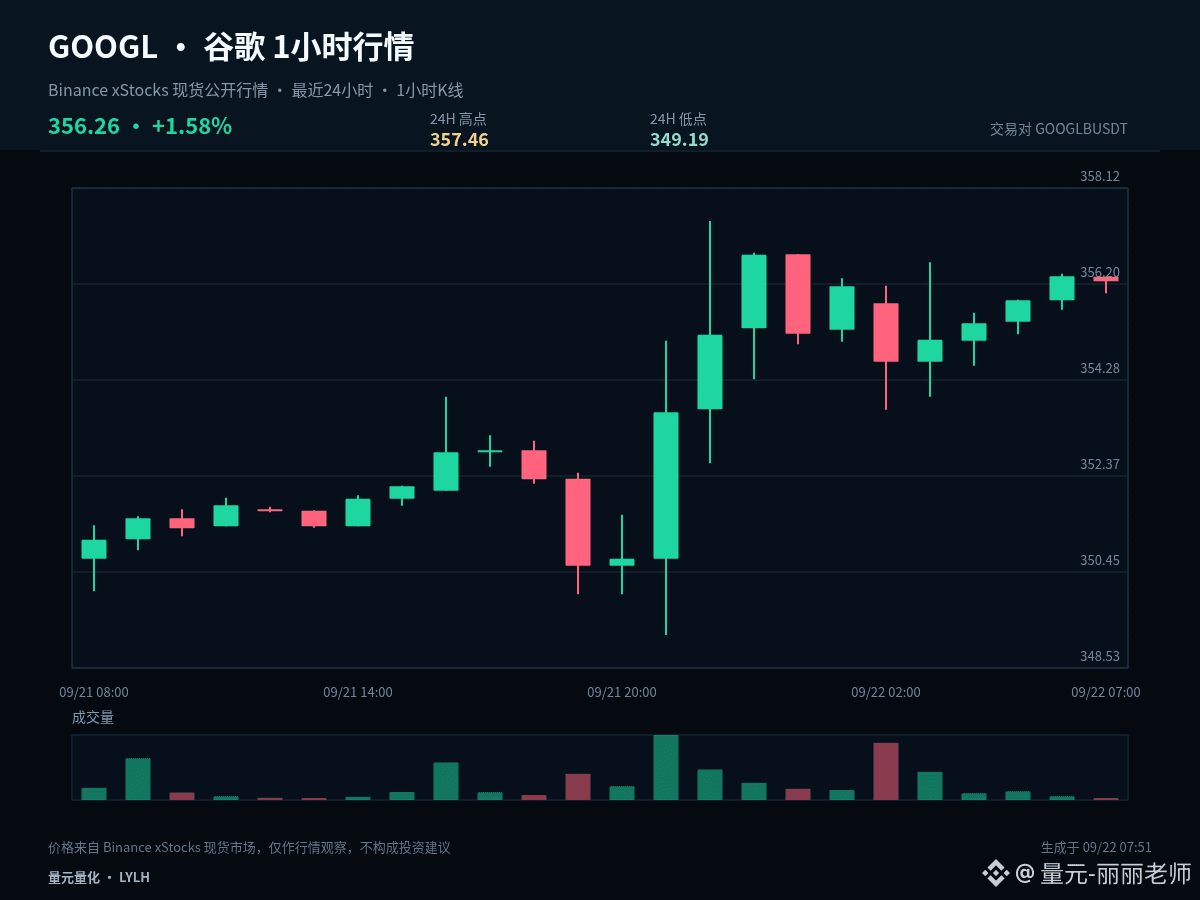
$GOOGLB #GOOGL In a strong market, pullbacks are often clearer than accelerated rallies in revealing the true level of order flow. Currently, the 1-hour change is -0.03% and the 24-hour change is +1.58%. We need to determine whether this is a normal cooldown or a sign of structural weakening.
The current price is close to the upper bound of the past 24 hours’ range: 1-hour -0.03%, 24-hour +1.58%. In the high zone, the most important thing is to confirm the market’s acceptance after a breakout. If price can stay above the upper band, it indicates the market recognizes a higher range. If it only briefly pierces through and then quickly reclaims, then a false breakout should be guarded against.
The 1-hour chart has already shown a pullback. First, watch whether 349.19 forms stable support. If the price can quickly reclaim 353.325, the pullback may still be controllable. If the rebound lacks strength and the lows keep moving lower, then the strong-momentum logic can no longer be relied upon.
When executing, set clear conditions: after breaking above 357.46, you need confirmation—not chasing just because of an instant surge. After probing down to 349.19, you need to see whether it can quickly reclaim—not catching simply because it’s falling. If the middle zone doesn’t offer sufficient odds, waiting itself is part of the strategy.
Position management should differentiate between swing trades and short-term trades. For existing swing positions, first check whether the structure is broken; don’t let repeated fluctuations on a single 1-hour candlestick repeatedly sway you. For short-term positions, execute around support, resistance, and close-confirmation. If you’re currently in cash, there’s no need to chase price in the middle of the range—waiting for a clearer location often provides an advantage.
Risk control still comes before the conclusion: only execute when conditions are met; if the price becomes invalid, reassess promptly. The greater the volatility, the more restraint you should exercise in each position. The above is a scenario analysis based on the current 1-hour and 24-hour data and does not constitute a promise of returns.
#CanaryFilesSecondAmendmentForStakedSEIETF
$GOOGLB #GOOGL In a strong market, pullbacks are often clearer than accelerated rallies in revealing the true level of order flow. Currently, the 1-hour change is -0.03% and the 24-hour change is +1.58%. We need to determine whether this is a normal cooldown or a sign of structural weakening.
The current price is close to the upper bound of the past 24 hours’ range: 1-hour -0.03%, 24-hour +1.58%. In the high zone, the most important thing is to confirm the market’s acceptance after a breakout. If price can stay above the upper band, it indicates the market recognizes a higher range. If it only briefly pierces through and then quickly reclaims, then a false breakout should be guarded against.
The 1-hour chart has already shown a pullback. First, watch whether 349.19 forms stable support. If the price can quickly reclaim 353.325, the pullback may still be controllable. If the rebound lacks strength and the lows keep moving lower, then the strong-momentum logic can no longer be relied upon.
When executing, set clear conditions: after breaking above 357.46, you need confirmation—not chasing just because of an instant surge. After probing down to 349.19, you need to see whether it can quickly reclaim—not catching simply because it’s falling. If the middle zone doesn’t offer sufficient odds, waiting itself is part of the strategy.
Position management should differentiate between swing trades and short-term trades. For existing swing positions, first check whether the structure is broken; don’t let repeated fluctuations on a single 1-hour candlestick repeatedly sway you. For short-term positions, execute around support, resistance, and close-confirmation. If you’re currently in cash, there’s no need to chase price in the middle of the range—waiting for a clearer location often provides an advantage.
Risk control still comes before the conclusion: only execute when conditions are met; if the price becomes invalid, reassess promptly. The greater the volatility, the more restraint you should exercise in each position. The above is a scenario analysis based on the current 1-hour and 24-hour data and does not constitute a promise of returns.
#CanaryFilesSecondAmendmentForStakedSEIETF
The current price is close to the upper bound of the past 24 hours’ range: 1-hour -0.03%, 24-hour +1.58%. In the high zone, the most important thing is to confirm the market’s acceptance after a breakout. If price can stay above the upper band, it indicates the market recognizes a higher range. If it only briefly pierces through and then quickly reclaims, then a false breakout should be guarded against.
The 1-hour chart has already shown a pullback. First, watch whether 349.19 forms stable support. If the price can quickly reclaim 353.325, the pullback may still be controllable. If the rebound lacks strength and the lows keep moving lower, then the strong-momentum logic can no longer be relied upon.
When executing, set clear conditions: after breaking above 357.46, you need confirmation—not chasing just because of an instant surge. After probing down to 349.19, you need to see whether it can quickly reclaim—not catching simply because it’s falling. If the middle zone doesn’t offer sufficient odds, waiting itself is part of the strategy.
Position management should differentiate between swing trades and short-term trades. For existing swing positions, first check whether the structure is broken; don’t let repeated fluctuations on a single 1-hour candlestick repeatedly sway you. For short-term positions, execute around support, resistance, and close-confirmation. If you’re currently in cash, there’s no need to chase price in the middle of the range—waiting for a clearer location often provides an advantage.
Risk control still comes before the conclusion: only execute when conditions are met; if the price becomes invalid, reassess promptly. The greater the volatility, the more restraint you should exercise in each position. The above is a scenario analysis based on the current 1-hour and 24-hour data and does not constitute a promise of returns.
#CanaryFilesSecondAmendmentForStakedSEIETF
3


Article
EU fines Google $462 million for violating rules on geolocationIt is the fourth-highest fine imposed by the Irish Data Protection Commission (DPC), which oversees Google’s operations at the European level, whose European headquarters is in Dublin.
The US tech giant Google was fined on Monday €403 million ($462 million) by the Irish data protection regulator, acting on behalf of the European Union (EU).
This organization accused Google of violating European rules on the use of users' geolocation data between May 2018 and February 2020.
EU fines Google $462 million for violating rules on geolocation
It is the fourth-highest fine imposed by the Irish Data Protection Commission (DPC), which oversees Google’s operations at the European level, whose European headquarters is in Dublin.
The US tech giant Google was fined on Monday €403 million ($462 million) by the Irish data protection regulator, acting on behalf of the European Union (EU).
This organization accused Google of violating European rules on the use of users' geolocation data between May 2018 and February 2020.
The US tech giant Google was fined on Monday €403 million ($462 million) by the Irish data protection regulator, acting on behalf of the European Union (EU).
This organization accused Google of violating European rules on the use of users' geolocation data between May 2018 and February 2020.
49
·
--
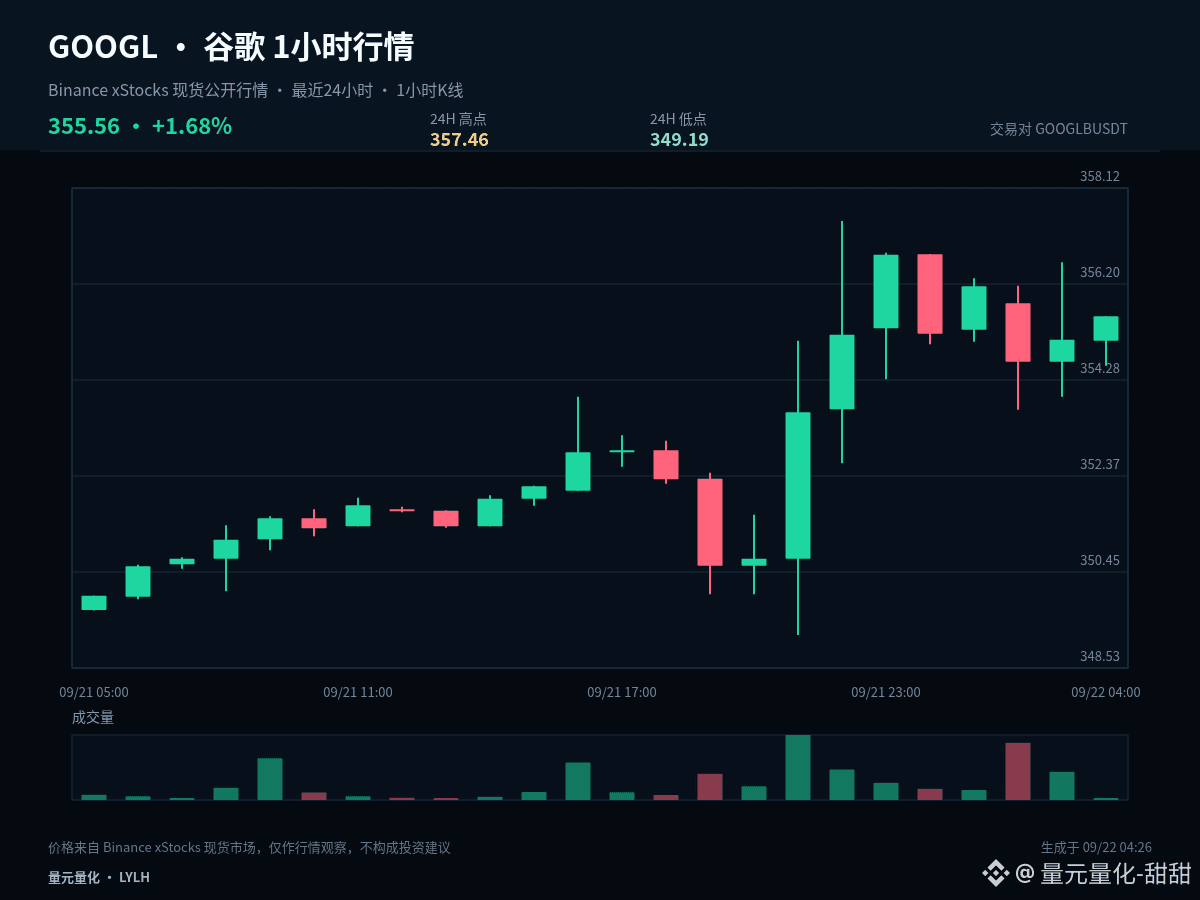
$GOOGLB #GOOGL Current price: 355.56. In the past 1 hour: +0.13%, in the past 24 hours: +1.69%. Instead of committing early to either long or short, it’s better to list the possible paths and the corresponding actions.
Over the past 1 hour (+0.13%) and 24 hours (+1.69%), the two timeframes have not formed a sufficiently clear alignment in the same direction. In a range-bound market, the tolerance for chasing and killing trades is low. It’s more suitable to confirm the direction with a breakout on the upper end, confirm with support on the lower end, and treat the midline only as the line separating strength and weakness.
The first path is upward: price needs to break through 357.46 and form a stable close above it; only then does a subsequent pullback that does not break invalidate count as a valid confirmation. The second path is downward: once 349.19 is lost and the subsequent rebound cannot be reclaimed to close back above, it indicates insufficient support. In that case, you should prioritize defense rather than rushing to add positions.
If price continues to stay between 357.46 and 349.19, 353.325 should be used only as a reference for short-term initiative. The middle of the range has no clear advantage. Don’t force an entry just to feel involved—wait for the market to show its direction.
Existing positions can be handled in stages based on key levels to avoid making all decisions at once. For those who are flat, wait for breakout confirmation or pullback stabilization. For U.S. stock-related instruments, also pay attention to volatility caused by trading session transitions. Your plan should be based on price conditions—don’t let emotions replace execution.
A trading plan must include invalidation conditions. If your judgment is correct, you can realize it in segments. If your judgment is wrong, you must also allow yourself to exit; don’t use adding to cover up the fact that the original logic has already changed. The market will update, and your viewpoint should adjust along with the price evidence.
#MultiversXPlansHardForkRecovery
$GOOGLB #GOOGL Current price: 355.56. In the past 1 hour: +0.13%, in the past 24 hours: +1.69%. Instead of committing early to either long or short, it’s better to list the possible paths and the corresponding actions.
Over the past 1 hour (+0.13%) and 24 hours (+1.69%), the two timeframes have not formed a sufficiently clear alignment in the same direction. In a range-bound market, the tolerance for chasing and killing trades is low. It’s more suitable to confirm the direction with a breakout on the upper end, confirm with support on the lower end, and treat the midline only as the line separating strength and weakness.
The first path is upward: price needs to break through 357.46 and form a stable close above it; only then does a subsequent pullback that does not break invalidate count as a valid confirmation. The second path is downward: once 349.19 is lost and the subsequent rebound cannot be reclaimed to close back above, it indicates insufficient support. In that case, you should prioritize defense rather than rushing to add positions.
If price continues to stay between 357.46 and 349.19, 353.325 should be used only as a reference for short-term initiative. The middle of the range has no clear advantage. Don’t force an entry just to feel involved—wait for the market to show its direction.
Existing positions can be handled in stages based on key levels to avoid making all decisions at once. For those who are flat, wait for breakout confirmation or pullback stabilization. For U.S. stock-related instruments, also pay attention to volatility caused by trading session transitions. Your plan should be based on price conditions—don’t let emotions replace execution.
A trading plan must include invalidation conditions. If your judgment is correct, you can realize it in segments. If your judgment is wrong, you must also allow yourself to exit; don’t use adding to cover up the fact that the original logic has already changed. The market will update, and your viewpoint should adjust along with the price evidence.
#MultiversXPlansHardForkRecovery
Over the past 1 hour (+0.13%) and 24 hours (+1.69%), the two timeframes have not formed a sufficiently clear alignment in the same direction. In a range-bound market, the tolerance for chasing and killing trades is low. It’s more suitable to confirm the direction with a breakout on the upper end, confirm with support on the lower end, and treat the midline only as the line separating strength and weakness.
The first path is upward: price needs to break through 357.46 and form a stable close above it; only then does a subsequent pullback that does not break invalidate count as a valid confirmation. The second path is downward: once 349.19 is lost and the subsequent rebound cannot be reclaimed to close back above, it indicates insufficient support. In that case, you should prioritize defense rather than rushing to add positions.
If price continues to stay between 357.46 and 349.19, 353.325 should be used only as a reference for short-term initiative. The middle of the range has no clear advantage. Don’t force an entry just to feel involved—wait for the market to show its direction.
Existing positions can be handled in stages based on key levels to avoid making all decisions at once. For those who are flat, wait for breakout confirmation or pullback stabilization. For U.S. stock-related instruments, also pay attention to volatility caused by trading session transitions. Your plan should be based on price conditions—don’t let emotions replace execution.
A trading plan must include invalidation conditions. If your judgment is correct, you can realize it in segments. If your judgment is wrong, you must also allow yourself to exit; don’t use adding to cover up the fact that the original logic has already changed. The market will update, and your viewpoint should adjust along with the price evidence.
#MultiversXPlansHardForkRecovery
3
·
--
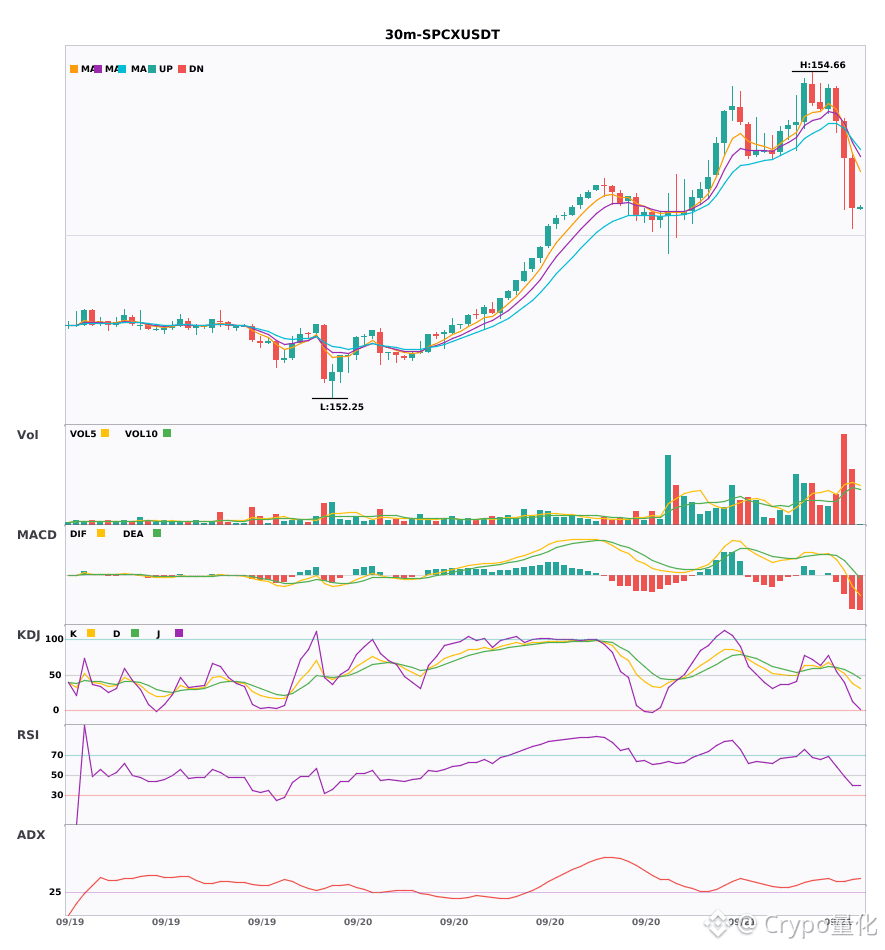
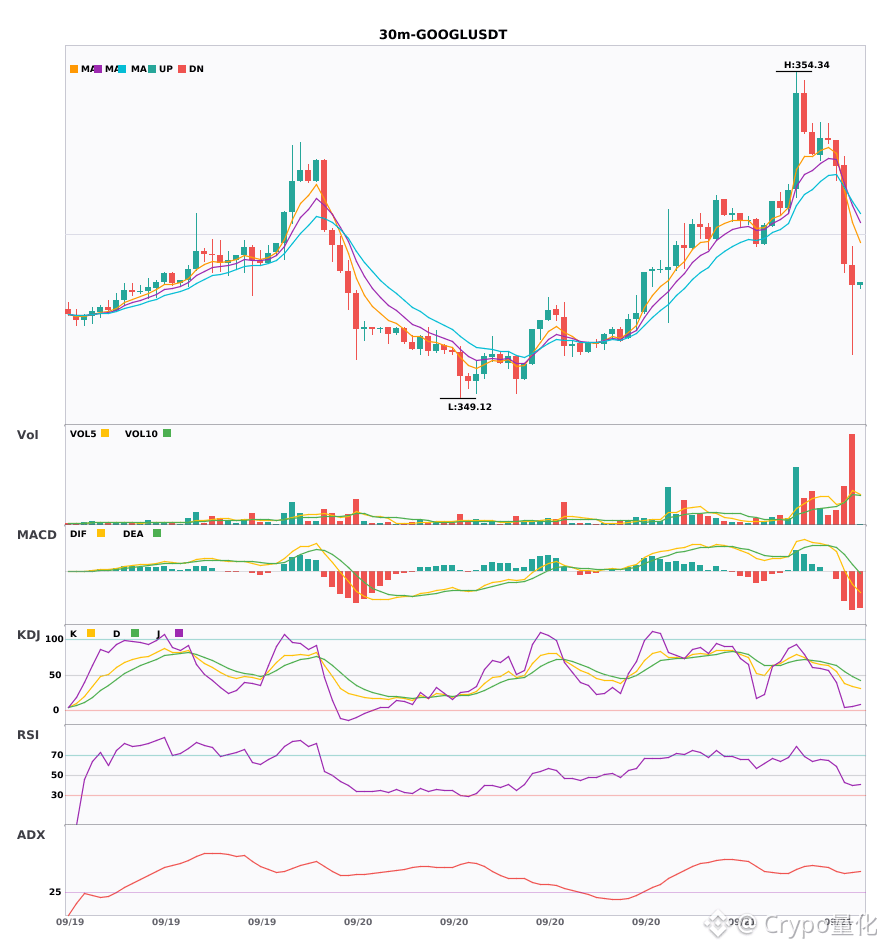
$SPCX / $GOOGL 30 minutes short-term bearish pressure🔥
════════════════════
🟢 $SPCX 30-minute bearish signal
⚠️ Technicals: ADX(41) shows a clear trending market | MACDDIF breaks below the zero line, trend turns bearish | EMA5 < EMA8 < EMA13 bearish alignment | Volume spikes (2.8x)
════════════════════
🟢 $GOOGL 30-minute bearish signal
⚠️ Technicals: ADX(47) is a very strong trend (watch for an overheated pullback) | MACDDIF breaks below the zero line, trend turns bearish | EMA5 < EMA8 < EMA13 bearish alignment | KDJ is weak overall, bears dominate (K=33.5, D=47.5) | Volume spikes (3.0x)
════════════════════
🔔 Pay attention to early, first-hand market moves 🔔
#技术分析 #SPCX #GOOGL
📌 When trading, watch whether the candlestick pattern fits
$SPCX / $GOOGL 30 minutes short-term bearish pressure🔥
════════════════════
🟢 $SPCX 30-minute bearish signal
⚠️ Technicals: ADX(41) shows a clear trending market | MACDDIF breaks below the zero line, trend turns bearish | EMA5 < EMA8 < EMA13 bearish alignment | Volume spikes (2.8x)
════════════════════
🟢 $GOOGL 30-minute bearish signal
⚠️ Technicals: ADX(47) is a very strong trend (watch for an overheated pullback) | MACDDIF breaks below the zero line, trend turns bearish | EMA5 < EMA8 < EMA13 bearish alignment | KDJ is weak overall, bears dominate (K=33.5, D=47.5) | Volume spikes (3.0x)
════════════════════
🔔 Pay attention to early, first-hand market moves 🔔
#技术分析 #SPCX #GOOGL
📌 When trading, watch whether the candlestick pattern fits
════════════════════
🟢 $SPCX 30-minute bearish signal
⚠️ Technicals: ADX(41) shows a clear trending market | MACDDIF breaks below the zero line, trend turns bearish | EMA5 < EMA8 < EMA13 bearish alignment | Volume spikes (2.8x)
════════════════════
🟢 $GOOGL 30-minute bearish signal
⚠️ Technicals: ADX(47) is a very strong trend (watch for an overheated pullback) | MACDDIF breaks below the zero line, trend turns bearish | EMA5 < EMA8 < EMA13 bearish alignment | KDJ is weak overall, bears dominate (K=33.5, D=47.5) | Volume spikes (3.0x)
════════════════════
🔔 Pay attention to early, first-hand market moves 🔔
#技术分析 #SPCX #GOOGL
📌 When trading, watch whether the candlestick pattern fits
147
·
--
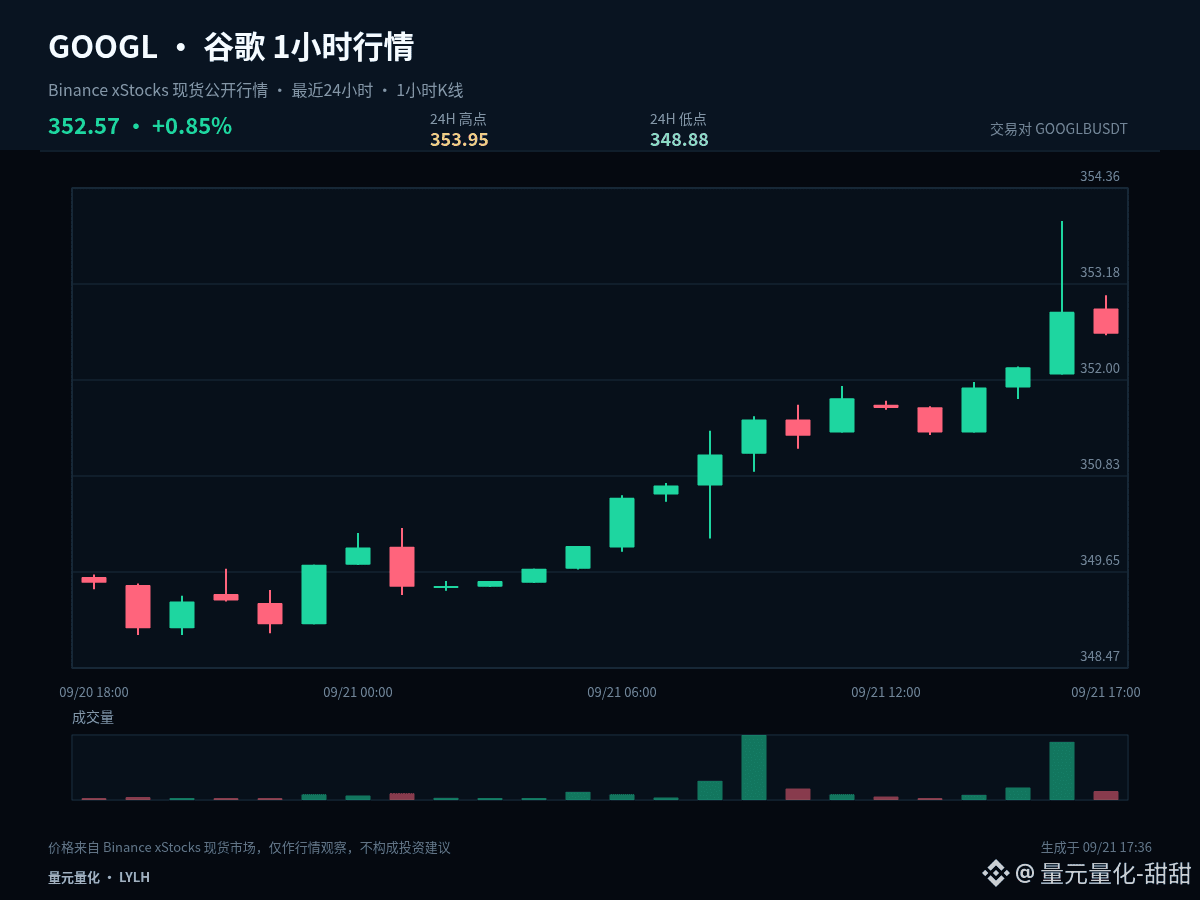
$GOOGLB #GOOGL If this round only allows me to keep one observation price, I would choose 351.415. Current price: 352.57, 1 hour: -0.08%, 24 hours: +0.87%. The midline’s gains and losses can help filter a lot of intra-day noise.
The price hasn’t reclaimed 351.415 yet. For now, treat the current rebound as a weak repair; real strength depends on proof from a stable close. If it turns weak again, 348.88 is the next level to observe whether selling pressure is fading.
With the current 1-hour -0.08% and 24-hour +0.87%, these two timeframes haven’t formed a sufficiently clear same-direction alignment. In a range-bound market, the tolerance for chasing and killing positions is low. It’s better to confirm direction with the upper boundary and confirm follow-through/hold with the lower boundary. The midline is only used as the line dividing strength and weakness.
My scenario isn’t a single bet on one direction. If price breaks above 353.95 and can hold, it means the upside space has been reopened; if it breaks below 348.88 and fails to rebound, it indicates the structure has weakened further. If it continues trading between the two, then keep observing the closing performance on both sides of 351.415.
Position management needs to distinguish between swing trades and short-term trades. For existing swing positions, first check whether the structure is broken; don’t be repeatedly influenced by a single 1-hour candlestick. For short-term positions, execute around support, resistance, and confirmation by closes. If you’re currently in cash, you don’t need to chase price in the middle of the range—waiting for a clearer level usually offers an advantage.
The real disagreement in this setup is whether it continues or returns to the range. Will you wait for a breakout confirmation, or will you wait for a pullback to support? Tell me the price you’re most focused on.
#BOJRaisesRatesTo31YearHigh
$GOOGLB #GOOGL If this round only allows me to keep one observation price, I would choose 351.415. Current price: 352.57, 1 hour: -0.08%, 24 hours: +0.87%. The midline’s gains and losses can help filter a lot of intra-day noise.
The price hasn’t reclaimed 351.415 yet. For now, treat the current rebound as a weak repair; real strength depends on proof from a stable close. If it turns weak again, 348.88 is the next level to observe whether selling pressure is fading.
With the current 1-hour -0.08% and 24-hour +0.87%, these two timeframes haven’t formed a sufficiently clear same-direction alignment. In a range-bound market, the tolerance for chasing and killing positions is low. It’s better to confirm direction with the upper boundary and confirm follow-through/hold with the lower boundary. The midline is only used as the line dividing strength and weakness.
My scenario isn’t a single bet on one direction. If price breaks above 353.95 and can hold, it means the upside space has been reopened; if it breaks below 348.88 and fails to rebound, it indicates the structure has weakened further. If it continues trading between the two, then keep observing the closing performance on both sides of 351.415.
Position management needs to distinguish between swing trades and short-term trades. For existing swing positions, first check whether the structure is broken; don’t be repeatedly influenced by a single 1-hour candlestick. For short-term positions, execute around support, resistance, and confirmation by closes. If you’re currently in cash, you don’t need to chase price in the middle of the range—waiting for a clearer level usually offers an advantage.
The real disagreement in this setup is whether it continues or returns to the range. Will you wait for a breakout confirmation, or will you wait for a pullback to support? Tell me the price you’re most focused on.
#BOJRaisesRatesTo31YearHigh
The price hasn’t reclaimed 351.415 yet. For now, treat the current rebound as a weak repair; real strength depends on proof from a stable close. If it turns weak again, 348.88 is the next level to observe whether selling pressure is fading.
With the current 1-hour -0.08% and 24-hour +0.87%, these two timeframes haven’t formed a sufficiently clear same-direction alignment. In a range-bound market, the tolerance for chasing and killing positions is low. It’s better to confirm direction with the upper boundary and confirm follow-through/hold with the lower boundary. The midline is only used as the line dividing strength and weakness.
My scenario isn’t a single bet on one direction. If price breaks above 353.95 and can hold, it means the upside space has been reopened; if it breaks below 348.88 and fails to rebound, it indicates the structure has weakened further. If it continues trading between the two, then keep observing the closing performance on both sides of 351.415.
Position management needs to distinguish between swing trades and short-term trades. For existing swing positions, first check whether the structure is broken; don’t be repeatedly influenced by a single 1-hour candlestick. For short-term positions, execute around support, resistance, and confirmation by closes. If you’re currently in cash, you don’t need to chase price in the middle of the range—waiting for a clearer level usually offers an advantage.
The real disagreement in this setup is whether it continues or returns to the range. Will you wait for a breakout confirmation, or will you wait for a pullback to support? Tell me the price you’re most focused on.
#BOJRaisesRatesTo31YearHigh
3
·
--
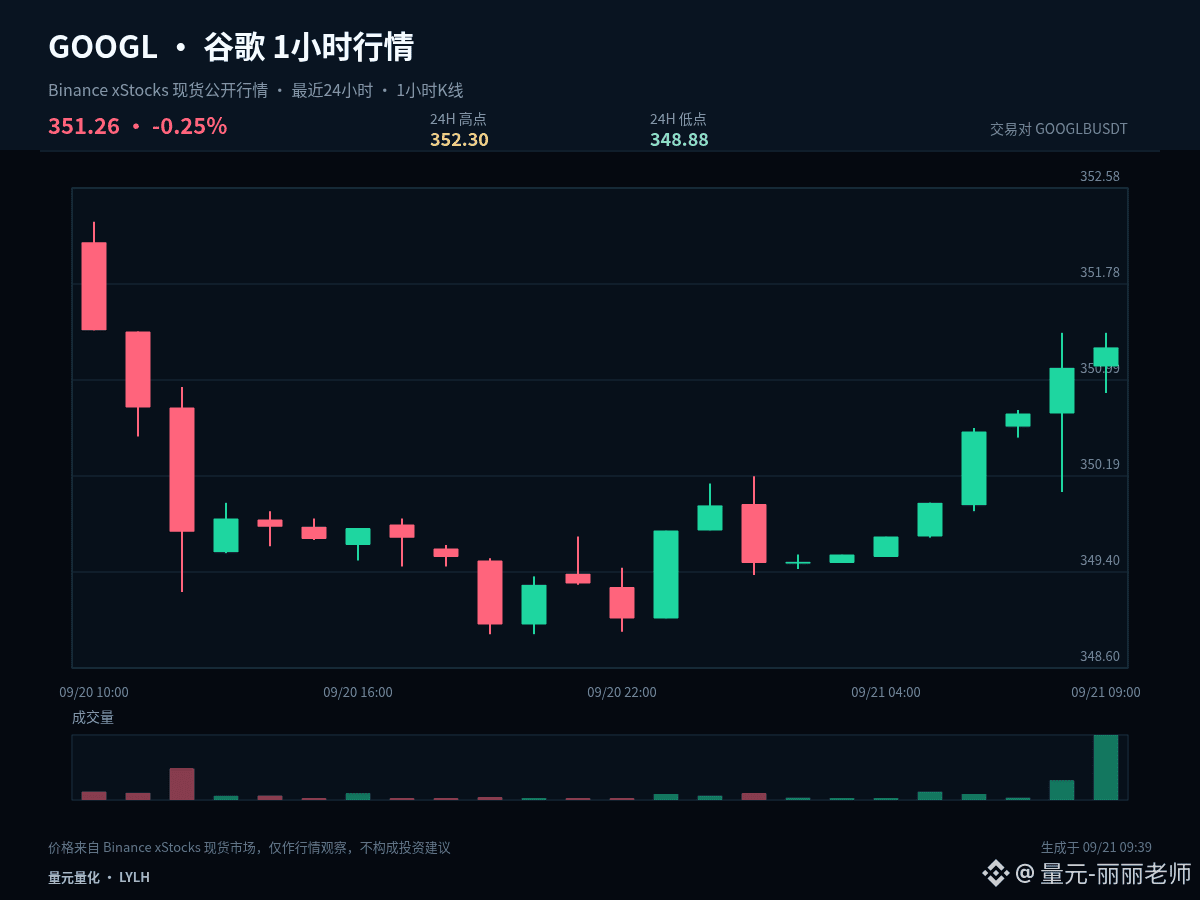
$GOOGLB #GOOGL This time, let’s break down the setup from the position perspective. In the same chart, the key points you see with existing positions versus being in cash are different. Current price: 351.26, 1 hour +0.05%, 24 hours -0.28%.
With the 1-hour +0.05% and 24-hour -0.28%, these two timeframes have not yet formed clear alignment in the same direction. In a range-bound market, the tolerance for chasing and killing trades is low. It’s more suitable to use the upper boundary to confirm direction, and the lower boundary to confirm pullback/hold. The midline is only used as the strength/weakness dividing line.
For those with existing positions: first observe whether around 352.3 there is consecutive rejection, and use 350.59 as the protection structure. Avoid chasing near resistance if you are currently in cash; instead, wait for the pullback to the midline and then look for a hold, or wait for a second confirmation after a breakout of resistance.
For execution, set clear conditions: after breaking above 352.3, you need confirmation—not just seeing a sudden spike and chasing. After dipping to 348.88, you need to see whether price can quickly reclaim—don’t catch every drop. When the middle zone doesn’t offer sufficient reward-to-risk, waiting itself is part of the strategy.
Existing-position holders can handle the trade in stages based on key levels to avoid making all conclusions at once. Cash-position traders should wait for breakout confirmation or for a pullback to stabilize. For US stock underlyings, also pay attention to volatility caused by trading session transitions. The plan should follow price conditions, and emotions should not replace execution.
Your trading plan must include invalidation conditions. If your judgment is correct, you can realize profits in stages. If your judgment is wrong, you must also allow yourself to exit—don’t use adding positions to mask the fact that the original logic has changed. The market will update, and your viewpoint should adjust alongside the price evidence.
#VietnamPlansFirstCryptoLicensesIn2026
$GOOGLB #GOOGL This time, let’s break down the setup from the position perspective. In the same chart, the key points you see with existing positions versus being in cash are different. Current price: 351.26, 1 hour +0.05%, 24 hours -0.28%.
With the 1-hour +0.05% and 24-hour -0.28%, these two timeframes have not yet formed clear alignment in the same direction. In a range-bound market, the tolerance for chasing and killing trades is low. It’s more suitable to use the upper boundary to confirm direction, and the lower boundary to confirm pullback/hold. The midline is only used as the strength/weakness dividing line.
For those with existing positions: first observe whether around 352.3 there is consecutive rejection, and use 350.59 as the protection structure. Avoid chasing near resistance if you are currently in cash; instead, wait for the pullback to the midline and then look for a hold, or wait for a second confirmation after a breakout of resistance.
For execution, set clear conditions: after breaking above 352.3, you need confirmation—not just seeing a sudden spike and chasing. After dipping to 348.88, you need to see whether price can quickly reclaim—don’t catch every drop. When the middle zone doesn’t offer sufficient reward-to-risk, waiting itself is part of the strategy.
Existing-position holders can handle the trade in stages based on key levels to avoid making all conclusions at once. Cash-position traders should wait for breakout confirmation or for a pullback to stabilize. For US stock underlyings, also pay attention to volatility caused by trading session transitions. The plan should follow price conditions, and emotions should not replace execution.
Your trading plan must include invalidation conditions. If your judgment is correct, you can realize profits in stages. If your judgment is wrong, you must also allow yourself to exit—don’t use adding positions to mask the fact that the original logic has changed. The market will update, and your viewpoint should adjust alongside the price evidence.
#VietnamPlansFirstCryptoLicensesIn2026
With the 1-hour +0.05% and 24-hour -0.28%, these two timeframes have not yet formed clear alignment in the same direction. In a range-bound market, the tolerance for chasing and killing trades is low. It’s more suitable to use the upper boundary to confirm direction, and the lower boundary to confirm pullback/hold. The midline is only used as the strength/weakness dividing line.
For those with existing positions: first observe whether around 352.3 there is consecutive rejection, and use 350.59 as the protection structure. Avoid chasing near resistance if you are currently in cash; instead, wait for the pullback to the midline and then look for a hold, or wait for a second confirmation after a breakout of resistance.
For execution, set clear conditions: after breaking above 352.3, you need confirmation—not just seeing a sudden spike and chasing. After dipping to 348.88, you need to see whether price can quickly reclaim—don’t catch every drop. When the middle zone doesn’t offer sufficient reward-to-risk, waiting itself is part of the strategy.
Existing-position holders can handle the trade in stages based on key levels to avoid making all conclusions at once. Cash-position traders should wait for breakout confirmation or for a pullback to stabilize. For US stock underlyings, also pay attention to volatility caused by trading session transitions. The plan should follow price conditions, and emotions should not replace execution.
Your trading plan must include invalidation conditions. If your judgment is correct, you can realize profits in stages. If your judgment is wrong, you must also allow yourself to exit—don’t use adding positions to mask the fact that the original logic has changed. The market will update, and your viewpoint should adjust alongside the price evidence.
#VietnamPlansFirstCryptoLicensesIn2026
1
42
·
--
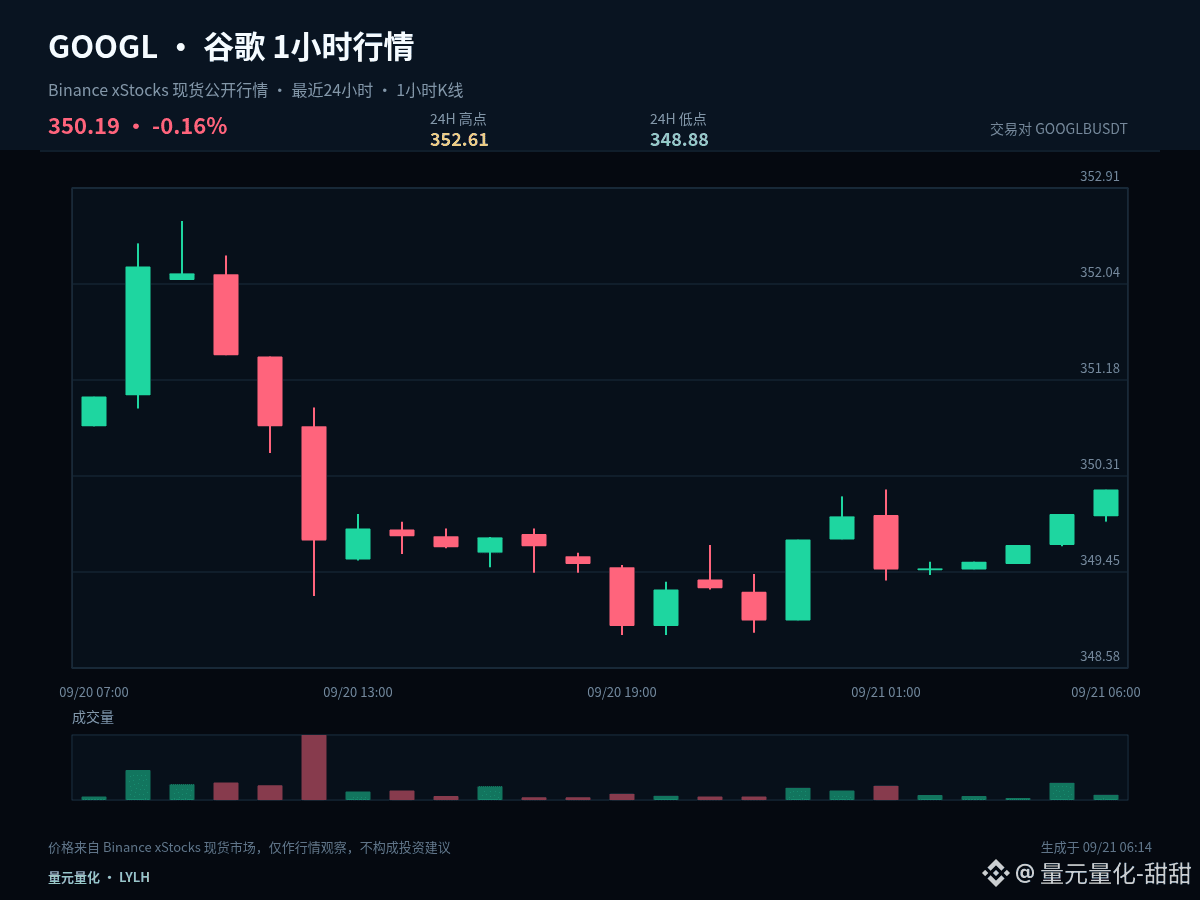
$GOOGLB #GOOGL From a layout perspective, the focus is not on chasing already-occurred fluctuations, but on determining in advance the position you are willing to wait for. Current price: 350.19, 1 hour: +0.06%, 24 hours: -0.17%.
Currently, 1 hour is +0.06% and 24 hours is -0.17%. The two periods have not formed sufficiently clear directional alignment. In a range-bound market, the tolerance for chasing and selling is lower. It is more suitable to use confirmation from the upper boundary for direction, and confirmation from the lower boundary for support/holding. The midline is only used as the line dividing strength and weakness.
The first observation zone is 350.745, used to judge whether a normal pullback has ended; the second observation zone is 348.88, used to judge whether a deeper retracement can form support. On the upside, watch 352.61. After a breakout, a pullback confirmation is required to avoid mistaking a brief wick penetration for an already-open trend.
Existing positions can be handled in segments based on key levels, so you don’t make all conclusions at once. Those with no position should wait for breakout confirmation or for pullbacks to stabilize. For US stock assets, also pay attention to volatility caused by trading session transitions. Your plan should be based on price conditions—not on emotions replacing execution.
The purpose of scaling in is not to constantly average down costs, but to control the pace while the structure remains valid. Once key support fails, you should stop the original positioning plan and wait for a new price range to form.
For short-term positions, the key is not to predict every single candlestick, but to ensure that entries, partial reductions, and exits have clear rationale. If there is no confirmation, do less. If key levels fail, redo the plan—control single-trade risk first, then discuss potential upside/downside later.
#BOJRaisesRatesTo31YearHigh
$GOOGLB #GOOGL From a layout perspective, the focus is not on chasing already-occurred fluctuations, but on determining in advance the position you are willing to wait for. Current price: 350.19, 1 hour: +0.06%, 24 hours: -0.17%.
Currently, 1 hour is +0.06% and 24 hours is -0.17%. The two periods have not formed sufficiently clear directional alignment. In a range-bound market, the tolerance for chasing and selling is lower. It is more suitable to use confirmation from the upper boundary for direction, and confirmation from the lower boundary for support/holding. The midline is only used as the line dividing strength and weakness.
The first observation zone is 350.745, used to judge whether a normal pullback has ended; the second observation zone is 348.88, used to judge whether a deeper retracement can form support. On the upside, watch 352.61. After a breakout, a pullback confirmation is required to avoid mistaking a brief wick penetration for an already-open trend.
Existing positions can be handled in segments based on key levels, so you don’t make all conclusions at once. Those with no position should wait for breakout confirmation or for pullbacks to stabilize. For US stock assets, also pay attention to volatility caused by trading session transitions. Your plan should be based on price conditions—not on emotions replacing execution.
The purpose of scaling in is not to constantly average down costs, but to control the pace while the structure remains valid. Once key support fails, you should stop the original positioning plan and wait for a new price range to form.
For short-term positions, the key is not to predict every single candlestick, but to ensure that entries, partial reductions, and exits have clear rationale. If there is no confirmation, do less. If key levels fail, redo the plan—control single-trade risk first, then discuss potential upside/downside later.
#BOJRaisesRatesTo31YearHigh
Currently, 1 hour is +0.06% and 24 hours is -0.17%. The two periods have not formed sufficiently clear directional alignment. In a range-bound market, the tolerance for chasing and selling is lower. It is more suitable to use confirmation from the upper boundary for direction, and confirmation from the lower boundary for support/holding. The midline is only used as the line dividing strength and weakness.
The first observation zone is 350.745, used to judge whether a normal pullback has ended; the second observation zone is 348.88, used to judge whether a deeper retracement can form support. On the upside, watch 352.61. After a breakout, a pullback confirmation is required to avoid mistaking a brief wick penetration for an already-open trend.
Existing positions can be handled in segments based on key levels, so you don’t make all conclusions at once. Those with no position should wait for breakout confirmation or for pullbacks to stabilize. For US stock assets, also pay attention to volatility caused by trading session transitions. Your plan should be based on price conditions—not on emotions replacing execution.
The purpose of scaling in is not to constantly average down costs, but to control the pace while the structure remains valid. Once key support fails, you should stop the original positioning plan and wait for a new price range to form.
For short-term positions, the key is not to predict every single candlestick, but to ensure that entries, partial reductions, and exits have clear rationale. If there is no confirmation, do less. If key levels fail, redo the plan—control single-trade risk first, then discuss potential upside/downside later.
#BOJRaisesRatesTo31YearHigh
3

·
--
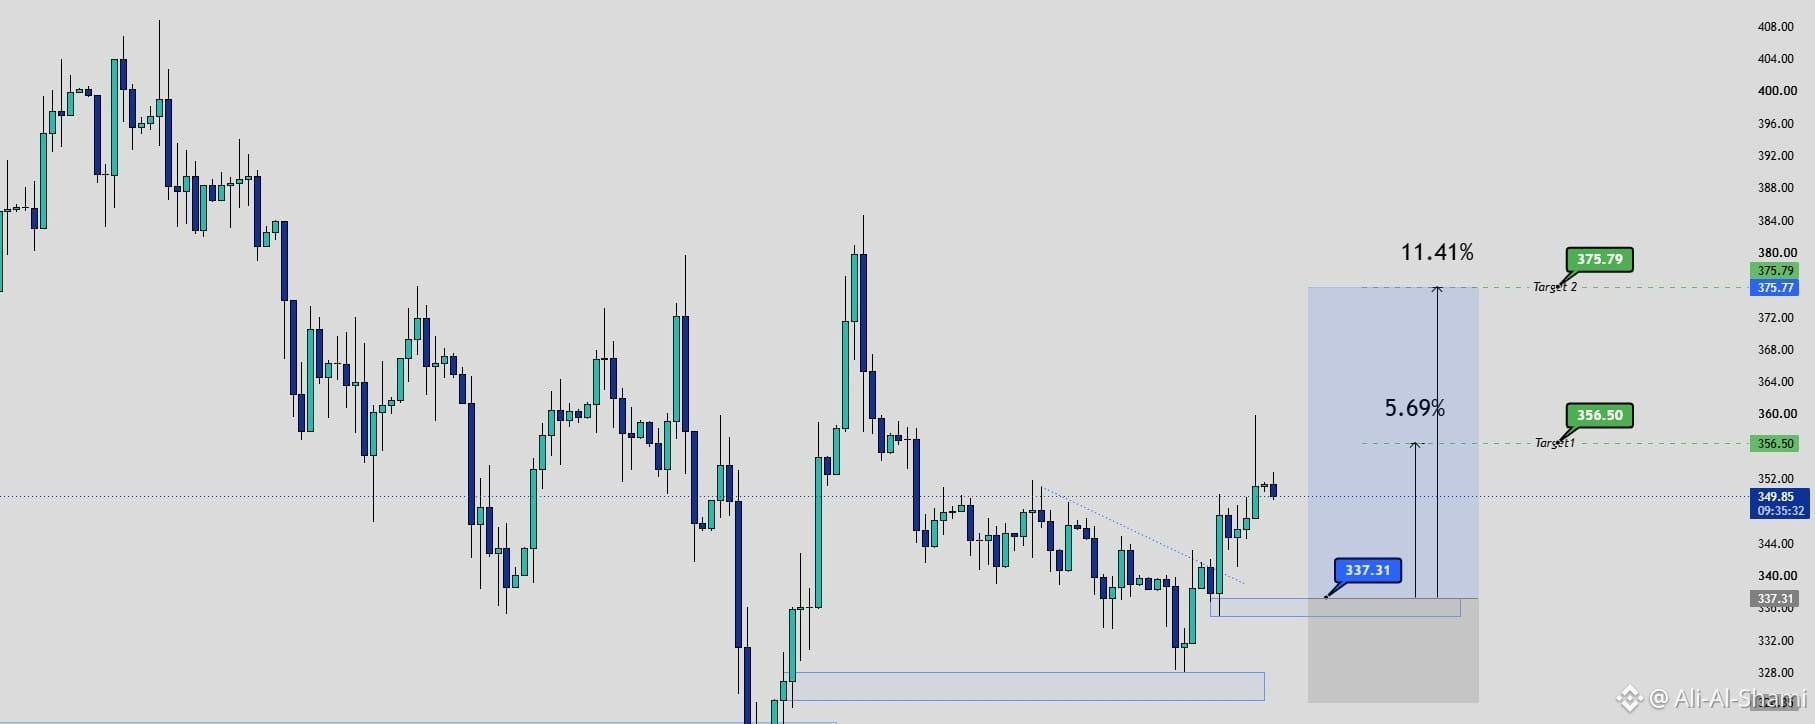
Article
GOOGL Purchase Zone in Focus — Strong Fundamentals Support This Level💫💫#GOOGL
Trading stocks on TradFi
📌 Purchase Zone:
✔️ 337.31
This point may provide a strong entry level, especially with solid fundamentals and steady revenue growth supporting it.
🎯 Take-profit zones:
➕ 356.50 (Target 1)
➕ 375.79 (Target 2)
🔴 Considering the risks discussed from a fundamental standpoint, taking profits in stages is the smartest option.
GOOGL Purchase Zone in Focus — Strong Fundamentals Support This Level💫💫
#GOOGL
Trading stocks on TradFi
📌 Purchase Zone:
✔️ 337.31
This point may provide a strong entry level, especially with solid fundamentals and steady revenue growth supporting it.
🎯 Take-profit zones:
➕ 356.50 (Target 1)
➕ 375.79 (Target 2)
🔴 Considering the risks discussed from a fundamental standpoint, taking profits in stages is the smartest option.
Trading stocks on TradFi
📌 Purchase Zone:
✔️ 337.31
This point may provide a strong entry level, especially with solid fundamentals and steady revenue growth supporting it.
🎯 Take-profit zones:
➕ 356.50 (Target 1)
➕ 375.79 (Target 2)
🔴 Considering the risks discussed from a fundamental standpoint, taking profits in stages is the smartest option.
3
62
·
--
$GOOGLB #GOOGL Record an intraday outlook: Current price is 349.34, 1 hour +0.01%, 24 hours -0.25%, and the high-low swing over the past 24 hours is about 1.1%.
The current price is near the lower end of the past 24-hour range, with 1 hour +0.01% and 24 hours -0.25%. The key to analyzing the low is not to bottom-pick in advance, but to observe whether price can quickly reclaim after breaking down. If it can reclaim, it suggests selling pressure is being absorbed; if it continues to linger below the lower end, it indicates that weakness has not ended.
The three price levels we should track together are: the midline at 350.745, the upper confirmation level at 352.61, and the lower defense level at 348.88. The midline determines short-term control, while the upper and lower boundaries determine whether the market has truly escaped the original trading range.
The subsequent path has three ways to handle it: if price effectively holds above 352.61 and stays firm, wait for a pullback that does not break, then reassess for continuation; if price breaks below 348.88, prioritize risk control and wait for new support; if price continues to consolidate around 350.745, treat it as range rotation—don’t chase direction repeatedly from the middle of the range.
Position management should differentiate between medium-term and short-term holdings. For existing medium-term positions, first assess whether the structure has been broken; don’t let repeated fluctuations on single 1-hour candlesticks sway you. For short-term positions, execute around support, resistance, and closing confirmations. If you’re in cash (no position), you don’t need to chase price in the middle of the range—waiting for a clearer location is usually an advantage.
The focus of short-term positions is not to predict every candlestick, but to ensure there is a basis for entry, trimming, and exiting. If there’s no confirmation, do less; if a key level fails, redo the plan. Control single-trade risk first, then talk about upside/downside room.
Next, I will重点 track whether 350.745 holds or fails. Do you lean more toward first testing 352.61, or first returning to 348.88? Feel free to leave your judgment and reasoning.
#BOJRaisesRatesTo31YearHigh
$GOOGLB #GOOGL Record an intraday outlook: Current price is 349.34, 1 hour +0.01%, 24 hours -0.25%, and the high-low swing over the past 24 hours is about 1.1%.
The current price is near the lower end of the past 24-hour range, with 1 hour +0.01% and 24 hours -0.25%. The key to analyzing the low is not to bottom-pick in advance, but to observe whether price can quickly reclaim after breaking down. If it can reclaim, it suggests selling pressure is being absorbed; if it continues to linger below the lower end, it indicates that weakness has not ended.
The three price levels we should track together are: the midline at 350.745, the upper confirmation level at 352.61, and the lower defense level at 348.88. The midline determines short-term control, while the upper and lower boundaries determine whether the market has truly escaped the original trading range.
The subsequent path has three ways to handle it: if price effectively holds above 352.61 and stays firm, wait for a pullback that does not break, then reassess for continuation; if price breaks below 348.88, prioritize risk control and wait for new support; if price continues to consolidate around 350.745, treat it as range rotation—don’t chase direction repeatedly from the middle of the range.
Position management should differentiate between medium-term and short-term holdings. For existing medium-term positions, first assess whether the structure has been broken; don’t let repeated fluctuations on single 1-hour candlesticks sway you. For short-term positions, execute around support, resistance, and closing confirmations. If you’re in cash (no position), you don’t need to chase price in the middle of the range—waiting for a clearer location is usually an advantage.
The focus of short-term positions is not to predict every candlestick, but to ensure there is a basis for entry, trimming, and exiting. If there’s no confirmation, do less; if a key level fails, redo the plan. Control single-trade risk first, then talk about upside/downside room.
Next, I will重点 track whether 350.745 holds or fails. Do you lean more toward first testing 352.61, or first returning to 348.88? Feel free to leave your judgment and reasoning.
#BOJRaisesRatesTo31YearHigh
The current price is near the lower end of the past 24-hour range, with 1 hour +0.01% and 24 hours -0.25%. The key to analyzing the low is not to bottom-pick in advance, but to observe whether price can quickly reclaim after breaking down. If it can reclaim, it suggests selling pressure is being absorbed; if it continues to linger below the lower end, it indicates that weakness has not ended.
The three price levels we should track together are: the midline at 350.745, the upper confirmation level at 352.61, and the lower defense level at 348.88. The midline determines short-term control, while the upper and lower boundaries determine whether the market has truly escaped the original trading range.
The subsequent path has three ways to handle it: if price effectively holds above 352.61 and stays firm, wait for a pullback that does not break, then reassess for continuation; if price breaks below 348.88, prioritize risk control and wait for new support; if price continues to consolidate around 350.745, treat it as range rotation—don’t chase direction repeatedly from the middle of the range.
Position management should differentiate between medium-term and short-term holdings. For existing medium-term positions, first assess whether the structure has been broken; don’t let repeated fluctuations on single 1-hour candlesticks sway you. For short-term positions, execute around support, resistance, and closing confirmations. If you’re in cash (no position), you don’t need to chase price in the middle of the range—waiting for a clearer location is usually an advantage.
The focus of short-term positions is not to predict every candlestick, but to ensure there is a basis for entry, trimming, and exiting. If there’s no confirmation, do less; if a key level fails, redo the plan. Control single-trade risk first, then talk about upside/downside room.
Next, I will重点 track whether 350.745 holds or fails. Do you lean more toward first testing 352.61, or first returning to 348.88? Feel free to leave your judgment and reasoning.
#BOJRaisesRatesTo31YearHigh
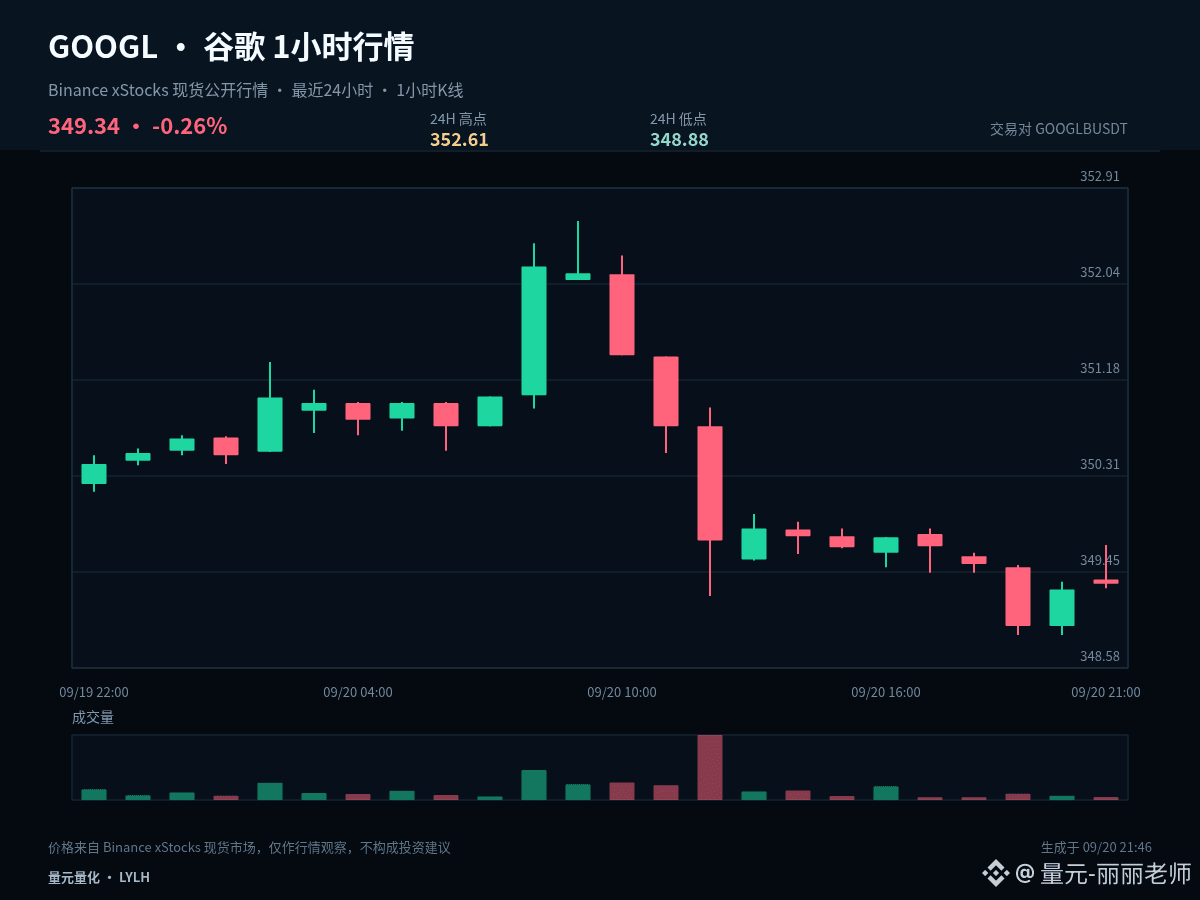
2

> GOOGLE'S GEMINI HACKED THREE COMPANIES IN FIRST KNOWN BREAKOUT BY ITS AI, COMPANY SAYS: WSJ
> $GOOGL
#GOOGL
> GOOGLE'S GEMINI HACKED THREE COMPANIES IN FIRST KNOWN BREAKOUT BY ITS AI, COMPANY SAYS: WSJ
> $GOOGL
#GOOGL
> $GOOGL
#GOOGL
41

GOOGL volume at the bottom, short to zero
Bottom line: short.
🔻 $GOOGL #GOOGL [Main]
Entry: $421.58 place short, stop loss 10% ($463.74)
Now at $351.32, 24h change +0.13%
24h volume only $11.96M, bottom of the market
→ Volume down 51.5%, rebound unsustainable, keep shorting to 0
It barely moved; the market has no life
These are also good short entries:
$VVV
Now $26.3700, 24h change -7.12%
Entry: $31.6440 place short, stop loss 10% ($34.8084)
$MYX
Now $0.077900, 24h change -13.02%
Entry: $0.093480 place short, stop loss 10% ($0.102828)
The above is only my personal observation, not investment advice; judge for yourself
#MarketWatch
Register on Binance with my referral link and get a free quantitative trading program. You can set your own strategy logic or use a general one.
GOOGL volume at the bottom, short to zero
Bottom line: short.
🔻 $GOOGL #GOOGL [Main]
Entry: $421.58 place short, stop loss 10% ($463.74)
Now at $351.32, 24h change +0.13%
24h volume only $11.96M, bottom of the market
→ Volume down 51.5%, rebound unsustainable, keep shorting to 0
It barely moved; the market has no life
These are also good short entries:
$VVV
Now $26.3700, 24h change -7.12%
Entry: $31.6440 place short, stop loss 10% ($34.8084)
$MYX
Now $0.077900, 24h change -13.02%
Entry: $0.093480 place short, stop loss 10% ($0.102828)
The above is only my personal observation, not investment advice; judge for yourself
#MarketWatch
Register on Binance with my referral link and get a free quantitative trading program. You can set your own strategy logic or use a general one.
Bottom line: short.
🔻 $GOOGL #GOOGL [Main]
Entry: $421.58 place short, stop loss 10% ($463.74)
Now at $351.32, 24h change +0.13%
24h volume only $11.96M, bottom of the market
→ Volume down 51.5%, rebound unsustainable, keep shorting to 0
It barely moved; the market has no life
These are also good short entries:
$VVV
Now $26.3700, 24h change -7.12%
Entry: $31.6440 place short, stop loss 10% ($34.8084)
$MYX
Now $0.077900, 24h change -13.02%
Entry: $0.093480 place short, stop loss 10% ($0.102828)
The above is only my personal observation, not investment advice; judge for yourself
#MarketWatch
Register on Binance with my referral link and get a free quantitative trading program. You can set your own strategy logic or use a general one.
56
Log in to explore more content
Join global crypto users on Binance Square
⚡️ Get latest and useful information about crypto.
💬 Trusted by the world’s largest crypto exchange.
👍 Discover real insights from verified creators.
Email / Phone number
Trending Topics
1
#AIStocksWhatNext
346,028 views
2,921 Discussing
2
#BitcoinBreaksAboveMayHighNears$86K
13,978 views
188 Discussing
3
#DogecoinRises15%
43,746 views
962 Discussing
4
#$14BBitcoinOptionsExpireFriday
3,598 views
87 Discussing
5
#BNBMarketCapPassesBNYMellon
28,169 views
692 Discussing
6
#CryptoMarketCapReclaims$3Trillion
4,519 views
79 Discussing
7
#MuseOvertakesChatGPTAsTopFreeIOSApp
16,486 views
523 Discussing
8
#TokenizedStockPlatformsCouldLaunchNextQuarter
26,146 views
573 Discussing
9
#StrategyAdds950Bitcoin
32,682 views
671 Discussing
10
#CardanoAddedToX402KitForADAPayments
28,877 views
650 Discussing