
#fwdi
fwdi
14,422 views
291 Discussing
Hot
Latest

·
--
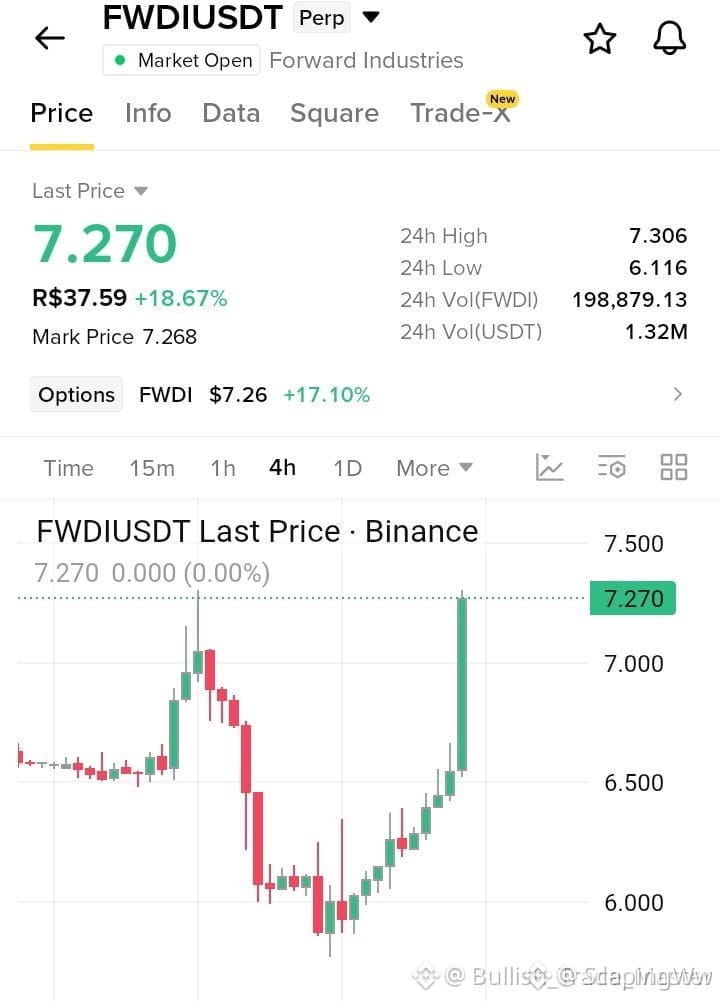
⚡ $FWDI PREPARES TO EXPAND AS BUYERS ACCUMULATE THE LOWER BOUNDARY! 💥
Order flow is quietly shifting into $FWDI as downside momentum dries up near key structural demand. Smart capital appears to be building positions ahead of a potential expansion move while volatility compresses. 📊
With seller exhaustion setting in and buyers repeatedly defending this range, the setup leans heavily toward a clean upward push. ⚡ Keep a close eye on $G and $F for broader sector rotation signals as momentum unfolds. 💡
💬 Are you stacking your bids inside this demand block or waiting for confirmed breakout volume? 👇
⚠️ Not financial advice. Always manage your risk. 🛡️
🏷️ #FWDI #LongSetup #Crypto #Altcoins #Trading
⚡ 🐂
⚡ $FWDI PREPARES TO EXPAND AS BUYERS ACCUMULATE THE LOWER BOUNDARY! 💥
Order flow is quietly shifting into $FWDI as downside momentum dries up near key structural demand. Smart capital appears to be building positions ahead of a potential expansion move while volatility compresses. 📊
With seller exhaustion setting in and buyers repeatedly defending this range, the setup leans heavily toward a clean upward push. ⚡ Keep a close eye on $G and $F for broader sector rotation signals as momentum unfolds. 💡
💬 Are you stacking your bids inside this demand block or waiting for confirmed breakout volume? 👇
⚠️ Not financial advice. Always manage your risk. 🛡️
🏷️ #FWDI #LongSetup #Crypto #Altcoins #Trading
⚡ 🐂
Order flow is quietly shifting into $FWDI as downside momentum dries up near key structural demand. Smart capital appears to be building positions ahead of a potential expansion move while volatility compresses. 📊
With seller exhaustion setting in and buyers repeatedly defending this range, the setup leans heavily toward a clean upward push. ⚡ Keep a close eye on $G and $F for broader sector rotation signals as momentum unfolds. 💡
💬 Are you stacking your bids inside this demand block or waiting for confirmed breakout volume? 👇
⚠️ Not financial advice. Always manage your risk. 🛡️
🏷️ #FWDI #LongSetup #Crypto #Altcoins #Trading
⚡ 🐂
44

·
--
[M1_mag7]
The old dog checked the funding rate of $FWDI—it's -0.00013263. This means the shorts are paying the longs. The funding rate is below zero, and paired with a 24-hour drop of 4.766%, the price is hanging around 8.192—this is a classic kind of dump, and the order-book structure shows shorts are overcrowded.
Following the M1_mag7 anchoring logic, the beta of on-chain US stock derivatives ultimately depends on how tightly it tracks SPY/QQQ. In the current data there’s no direct correlation coefficient, but changes in funding rates and position sizes are more immediate signals. OI is 54,367.34; combined with the negative funding rate, it indicates shorts are piling up. Once the broader market stabilizes or a rebound expectation emerges, the short-squeeze elasticity of this kind of asset is often at its highest. Right now the market categorizes it under other sectors, and the narrative isn’t clear—so instead it becomes a pure vehicle for trading/positioning based on funding rates.
My take is that the current order book has a high level of short crowding; the bet is on a short-term rebound rather than long-term value. The trigger is very clear: if the price repeatedly tests above 8.00 and then pulls back above 8.20, I’ll go long with a small position, betting on a squeeze driven by the negative funding rate. The anti-consensus is that while most people who are bearish focus on the 4.766% drop, I’m watching the accumulating shorting cost under negative funding.
Trading tag: #BinanceFutures #TradFi #USDⓈM #FWDI #FWDIUSDT $FWDI
[M1_mag7]
The old dog checked the funding rate of $FWDI —it's -0.00013263. This means the shorts are paying the longs. The funding rate is below zero, and paired with a 24-hour drop of 4.766%, the price is hanging around 8.192—this is a classic kind of dump, and the order-book structure shows shorts are overcrowded.
Following the M1_mag7 anchoring logic, the beta of on-chain US stock derivatives ultimately depends on how tightly it tracks SPY/QQQ. In the current data there’s no direct correlation coefficient, but changes in funding rates and position sizes are more immediate signals. OI is 54,367.34; combined with the negative funding rate, it indicates shorts are piling up. Once the broader market stabilizes or a rebound expectation emerges, the short-squeeze elasticity of this kind of asset is often at its highest. Right now the market categorizes it under other sectors, and the narrative isn’t clear—so instead it becomes a pure vehicle for trading/positioning based on funding rates.
My take is that the current order book has a high level of short crowding; the bet is on a short-term rebound rather than long-term value. The trigger is very clear: if the price repeatedly tests above 8.00 and then pulls back above 8.20, I’ll go long with a small position, betting on a squeeze driven by the negative funding rate. The anti-consensus is that while most people who are bearish focus on the 4.766% drop, I’m watching the accumulating shorting cost under negative funding.
Trading tag: #BinanceFutures #TradFi #USDⓈM #FWDI #FWDIUSDT $FWDI
The old dog checked the funding rate of $FWDI —it's -0.00013263. This means the shorts are paying the longs. The funding rate is below zero, and paired with a 24-hour drop of 4.766%, the price is hanging around 8.192—this is a classic kind of dump, and the order-book structure shows shorts are overcrowded.
Following the M1_mag7 anchoring logic, the beta of on-chain US stock derivatives ultimately depends on how tightly it tracks SPY/QQQ. In the current data there’s no direct correlation coefficient, but changes in funding rates and position sizes are more immediate signals. OI is 54,367.34; combined with the negative funding rate, it indicates shorts are piling up. Once the broader market stabilizes or a rebound expectation emerges, the short-squeeze elasticity of this kind of asset is often at its highest. Right now the market categorizes it under other sectors, and the narrative isn’t clear—so instead it becomes a pure vehicle for trading/positioning based on funding rates.
My take is that the current order book has a high level of short crowding; the bet is on a short-term rebound rather than long-term value. The trigger is very clear: if the price repeatedly tests above 8.00 and then pulls back above 8.20, I’ll go long with a small position, betting on a squeeze driven by the negative funding rate. The anti-consensus is that while most people who are bearish focus on the 4.766% drop, I’m watching the accumulating shorting cost under negative funding.
Trading tag: #BinanceFutures #TradFi #USDⓈM #FWDI #FWDIUSDT $FWDI
1

·
--
$FWDI In the past 24 hours, it has risen 4.34%; the current price is 8.656, but on-chain there has been no capture of any relevant news release. This is a key signal: price fluctuations are disconnected from the public information flow.
My view is that this rally is purely driven by sentiment and positioning, with no support from fundamentals or the news cycle. The conclusion is based on two facts: the price is up 4.34%, while the funding rate remains at 0.00015989. A positive funding rate means long traders must pay short traders. With upward price action layered on a positive funding rate, this is a typical structure of longs chasing higher prices, accumulating costs. Open interest is 59,644.47; combined with the price, the position value is about $516,000—relatively small in size, but the fee structure already shows signs of being crowded.
The strongest counterevidence is this: if Binance had recently released a major positive news announcement related to the company behind the $FWDI underlying asset, or if the U.S. stock market showed a targeted sector rotation that could provide real buying demand for this TradFi perpetual contract, we would have evidence of that. There is none right now.
The chasing longs are accumulating their position costs. If the price stalls at this level or pulls back, they will face the double pressure of paying funding fees and realizing floating losses. At that point, they may be forced to liquidate, which could trigger a price correction.
My plan is: don’t chase. The current price of 8.656 and the funding rate of 0.00015989 are the key observation metrics. If the price can break above this level with volume and the funding rate declines, it may indicate new long force is entering to absorb sell pressure, and I would reassess. Conversely, if the price starts to trade sideways while the funding rate stays positive or even rises, I would treat it as a dangerous signal.
Three-scenario action summary:
Aggressive traders may consider a light long position when there is a volume breakout above 8.7 and the funding rate falls below 0.0001.
Conservative traders should wait and watch, looking for a pullback to reassess or for real news-driven catalysts.
Avoiders should not participate at the current level, so as not to buy into someone else’s cost.
Trading tag: #TradFi #链上美股 #FWDI
Where do you think this thesis is most likely to be wrong?
$FWDI In the past 24 hours, it has risen 4.34%; the current price is 8.656, but on-chain there has been no capture of any relevant news release. This is a key signal: price fluctuations are disconnected from the public information flow.
My view is that this rally is purely driven by sentiment and positioning, with no support from fundamentals or the news cycle. The conclusion is based on two facts: the price is up 4.34%, while the funding rate remains at 0.00015989. A positive funding rate means long traders must pay short traders. With upward price action layered on a positive funding rate, this is a typical structure of longs chasing higher prices, accumulating costs. Open interest is 59,644.47; combined with the price, the position value is about $516,000—relatively small in size, but the fee structure already shows signs of being crowded.
The strongest counterevidence is this: if Binance had recently released a major positive news announcement related to the company behind the $FWDI underlying asset, or if the U.S. stock market showed a targeted sector rotation that could provide real buying demand for this TradFi perpetual contract, we would have evidence of that. There is none right now.
The chasing longs are accumulating their position costs. If the price stalls at this level or pulls back, they will face the double pressure of paying funding fees and realizing floating losses. At that point, they may be forced to liquidate, which could trigger a price correction.
My plan is: don’t chase. The current price of 8.656 and the funding rate of 0.00015989 are the key observation metrics. If the price can break above this level with volume and the funding rate declines, it may indicate new long force is entering to absorb sell pressure, and I would reassess. Conversely, if the price starts to trade sideways while the funding rate stays positive or even rises, I would treat it as a dangerous signal.
Three-scenario action summary:
Aggressive traders may consider a light long position when there is a volume breakout above 8.7 and the funding rate falls below 0.0001.
Conservative traders should wait and watch, looking for a pullback to reassess or for real news-driven catalysts.
Avoiders should not participate at the current level, so as not to buy into someone else’s cost.
Trading tag: #TradFi #链上美股 #FWDI
Where do you think this thesis is most likely to be wrong?
My view is that this rally is purely driven by sentiment and positioning, with no support from fundamentals or the news cycle. The conclusion is based on two facts: the price is up 4.34%, while the funding rate remains at 0.00015989. A positive funding rate means long traders must pay short traders. With upward price action layered on a positive funding rate, this is a typical structure of longs chasing higher prices, accumulating costs. Open interest is 59,644.47; combined with the price, the position value is about $516,000—relatively small in size, but the fee structure already shows signs of being crowded.
The strongest counterevidence is this: if Binance had recently released a major positive news announcement related to the company behind the $FWDI underlying asset, or if the U.S. stock market showed a targeted sector rotation that could provide real buying demand for this TradFi perpetual contract, we would have evidence of that. There is none right now.
The chasing longs are accumulating their position costs. If the price stalls at this level or pulls back, they will face the double pressure of paying funding fees and realizing floating losses. At that point, they may be forced to liquidate, which could trigger a price correction.
My plan is: don’t chase. The current price of 8.656 and the funding rate of 0.00015989 are the key observation metrics. If the price can break above this level with volume and the funding rate declines, it may indicate new long force is entering to absorb sell pressure, and I would reassess. Conversely, if the price starts to trade sideways while the funding rate stays positive or even rises, I would treat it as a dangerous signal.
Three-scenario action summary:
Aggressive traders may consider a light long position when there is a volume breakout above 8.7 and the funding rate falls below 0.0001.
Conservative traders should wait and watch, looking for a pullback to reassess or for real news-driven catalysts.
Avoiders should not participate at the current level, so as not to buy into someone else’s cost.
Trading tag: #TradFi #链上美股 #FWDI
Where do you think this thesis is most likely to be wrong?
61
·
--
[M1_mag7]
$FWDI Yesterday it rose 1.662%, but when you look at the funding rate, it’s been hanging steadily at zero. This tells the story: the price moved, yet in the leveraged market, neither the longs nor the shorts paid any premium for direction—both sides feel like they haven’t lost.
Old dog took a look at this dataset—its angle is that the Mag7 on-chain is the anchor. To be frank, the input doesn’t include the specific correlation coefficients between $FWDI and SPY or QQQ, nor does it provide comparison data for other coins in the same sector. So I can’t use numbers to confirm whether it’s leading, or whether its beta is high or low. What I can be sure about are two things. First, its 24-hour funding rate is 0, which means that in the current perpetual contract market, the longs and the shorts have the same holding costs—so the market is in a standoff, or at least shows no clear tilt.
Second, its open interest (OI) is 67,500 coins. Compared with 619,000 coins of 24-hour trading volume, the turnover isn’t low—but the funding rate didn’t turn positive along with the price. That suggests this rally may not have attracted a large influx of new leveraged long capital. It looks more like spot buying pressure or the push from existing positions.
My read is that a structure where price is up but funding is flat usually points to the early stage of a trend, or hesitation during a rebound. Either smart money is still watching from the sidelines and only testing with small size; or the shorts haven’t admitted defeat yet, waiting to snipe at higher levels. $FWDI is currently at 7.95. If next the price can hold above 7.8, and the 24-hour trading volume keeps expanding, while the funding rate slowly turns positive, then I’ll consider that the trend has received leveraged-market confirmation. I’ll wait for signals and add positions. On the other hand, if price sells off on shrinking volume—breaking below the integer level of 7.6 directly—and at the same time open interest drops quickly, then this rally is most likely a one-off; I’ll dump my holdings and retreat.
The strongest counter-evidence is that the market may be ignoring the fragility of a zero-funding-rate rally. It lacks participation and confirmation from leveraged capital. Once any selling pressure hits, price could fall faster than it would under positive funding support, because there’s no steady stream of long-side payments to maintain positions. The second-order effect is that if $FWDI drops back for this reason, it could further damage confidence in the entire on-chain TradFi derivatives contract sector. Funds would then flow even faster into other targets with stronger funding support or stronger narratives, creating a negative feedback loop.
Trading tag: #BinanceFutures #TradFi #USDⓈM #FWDI #FWDIUSDT $FWDI
[M1_mag7]
$FWDI Yesterday it rose 1.662%, but when you look at the funding rate, it’s been hanging steadily at zero. This tells the story: the price moved, yet in the leveraged market, neither the longs nor the shorts paid any premium for direction—both sides feel like they haven’t lost.
Old dog took a look at this dataset—its angle is that the Mag7 on-chain is the anchor. To be frank, the input doesn’t include the specific correlation coefficients between $FWDI and SPY or QQQ, nor does it provide comparison data for other coins in the same sector. So I can’t use numbers to confirm whether it’s leading, or whether its beta is high or low. What I can be sure about are two things. First, its 24-hour funding rate is 0, which means that in the current perpetual contract market, the longs and the shorts have the same holding costs—so the market is in a standoff, or at least shows no clear tilt.
Second, its open interest (OI) is 67,500 coins. Compared with 619,000 coins of 24-hour trading volume, the turnover isn’t low—but the funding rate didn’t turn positive along with the price. That suggests this rally may not have attracted a large influx of new leveraged long capital. It looks more like spot buying pressure or the push from existing positions.
My read is that a structure where price is up but funding is flat usually points to the early stage of a trend, or hesitation during a rebound. Either smart money is still watching from the sidelines and only testing with small size; or the shorts haven’t admitted defeat yet, waiting to snipe at higher levels. $FWDI is currently at 7.95. If next the price can hold above 7.8, and the 24-hour trading volume keeps expanding, while the funding rate slowly turns positive, then I’ll consider that the trend has received leveraged-market confirmation. I’ll wait for signals and add positions. On the other hand, if price sells off on shrinking volume—breaking below the integer level of 7.6 directly—and at the same time open interest drops quickly, then this rally is most likely a one-off; I’ll dump my holdings and retreat.
The strongest counter-evidence is that the market may be ignoring the fragility of a zero-funding-rate rally. It lacks participation and confirmation from leveraged capital. Once any selling pressure hits, price could fall faster than it would under positive funding support, because there’s no steady stream of long-side payments to maintain positions. The second-order effect is that if $FWDI drops back for this reason, it could further damage confidence in the entire on-chain TradFi derivatives contract sector. Funds would then flow even faster into other targets with stronger funding support or stronger narratives, creating a negative feedback loop.
Trading tag: #BinanceFutures #TradFi #USDⓈM #FWDI #FWDIUSDT $FWDI
$FWDI Yesterday it rose 1.662%, but when you look at the funding rate, it’s been hanging steadily at zero. This tells the story: the price moved, yet in the leveraged market, neither the longs nor the shorts paid any premium for direction—both sides feel like they haven’t lost.
Old dog took a look at this dataset—its angle is that the Mag7 on-chain is the anchor. To be frank, the input doesn’t include the specific correlation coefficients between $FWDI and SPY or QQQ, nor does it provide comparison data for other coins in the same sector. So I can’t use numbers to confirm whether it’s leading, or whether its beta is high or low. What I can be sure about are two things. First, its 24-hour funding rate is 0, which means that in the current perpetual contract market, the longs and the shorts have the same holding costs—so the market is in a standoff, or at least shows no clear tilt.
Second, its open interest (OI) is 67,500 coins. Compared with 619,000 coins of 24-hour trading volume, the turnover isn’t low—but the funding rate didn’t turn positive along with the price. That suggests this rally may not have attracted a large influx of new leveraged long capital. It looks more like spot buying pressure or the push from existing positions.
My read is that a structure where price is up but funding is flat usually points to the early stage of a trend, or hesitation during a rebound. Either smart money is still watching from the sidelines and only testing with small size; or the shorts haven’t admitted defeat yet, waiting to snipe at higher levels. $FWDI is currently at 7.95. If next the price can hold above 7.8, and the 24-hour trading volume keeps expanding, while the funding rate slowly turns positive, then I’ll consider that the trend has received leveraged-market confirmation. I’ll wait for signals and add positions. On the other hand, if price sells off on shrinking volume—breaking below the integer level of 7.6 directly—and at the same time open interest drops quickly, then this rally is most likely a one-off; I’ll dump my holdings and retreat.
The strongest counter-evidence is that the market may be ignoring the fragility of a zero-funding-rate rally. It lacks participation and confirmation from leveraged capital. Once any selling pressure hits, price could fall faster than it would under positive funding support, because there’s no steady stream of long-side payments to maintain positions. The second-order effect is that if $FWDI drops back for this reason, it could further damage confidence in the entire on-chain TradFi derivatives contract sector. Funds would then flow even faster into other targets with stronger funding support or stronger narratives, creating a negative feedback loop.
Trading tag: #BinanceFutures #TradFi #USDⓈM #FWDI #FWDIUSDT $FWDI
100

·
--
Bullish
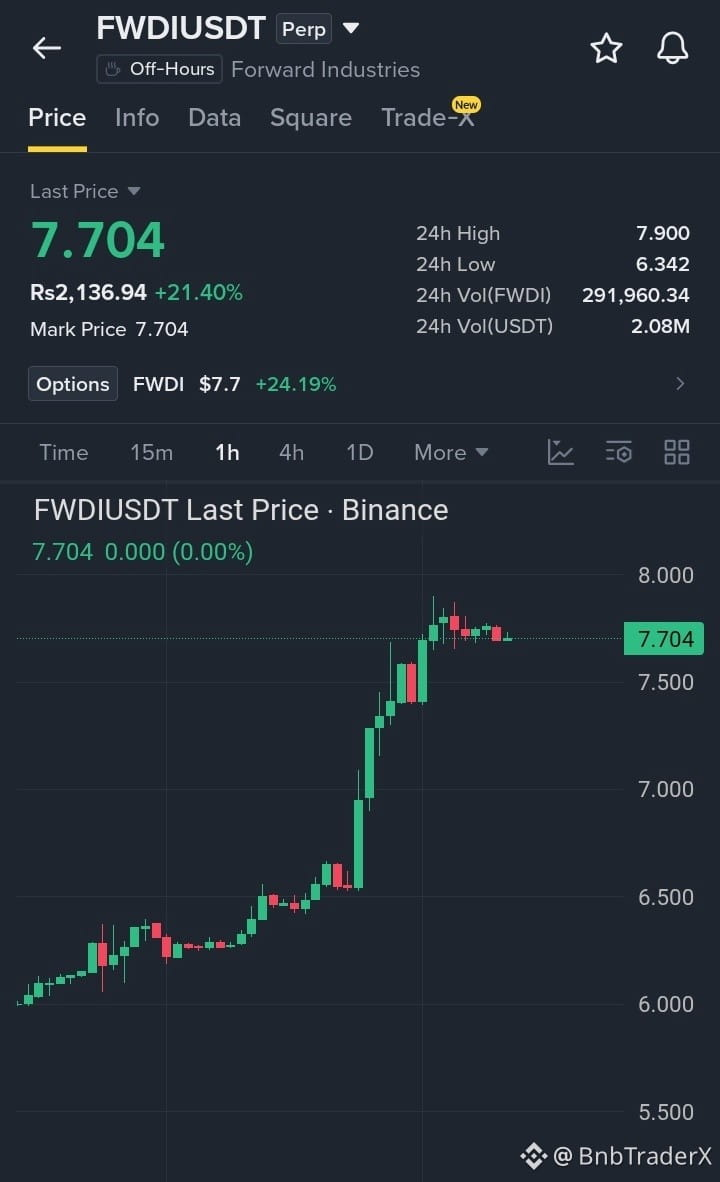
$FWDI is demonstrating strong bullish momentum following a steady upward rally, gaining over 21% from its 24-hour low of 6.342 to reach a high near 7.900. After a sharp vertical rise on the 1-hour chart, price action is currently consolidating sideways around the 7.700 zone as buyers hold firm control. Maintaining support above the 7.500 level keeps the bullish structure well-intact for continuation toward higher zones.
Target 1: 8.100
Target 2: 8.600
Target 3: 9.200
#FWDI #Crypto #Binance
{future}(FWDIUSDT)
$ONE
{spot}(ONEUSDT)
$AKE
{future}(AKEUSDT)
$FWDI is demonstrating strong bullish momentum following a steady upward rally, gaining over 21% from its 24-hour low of 6.342 to reach a high near 7.900. After a sharp vertical rise on the 1-hour chart, price action is currently consolidating sideways around the 7.700 zone as buyers hold firm control. Maintaining support above the 7.500 level keeps the bullish structure well-intact for continuation toward higher zones.
Target 1: 8.100
Target 2: 8.600
Target 3: 9.200
#FWDI #Crypto #Binance
$ONE
$AKE
Target 1: 8.100
Target 2: 8.600
Target 3: 9.200
#FWDI #Crypto #Binance
$ONE
$AKE
1
350
·
--
$FWDI 24 hours up 1.535% to 7.872; funding rate is zero, open interest is 66,491.
Price is rising but the funding rate is unchanged, suggesting the rally isn’t being forced up by longs adding leverage. Spot buyers may be driving the move. With zero funding, neither bulls nor bears pay; carrying costs are low, but it hasn’t triggered any squeeze.
If next the funding rate turns positive and OI rises, then it would be the real bull entry signal. This setup is suitable for a small position to test the waters. Stop loss: watch 7.7. If it breaks below 7.7 and OI expands, the shorts may counterattack—I’ll exit.
Trading tag: #TradFi #链上美股 #FWDI
Where do you think this analysis is most likely to be wrong?
$FWDI 24 hours up 1.535% to 7.872; funding rate is zero, open interest is 66,491.
Price is rising but the funding rate is unchanged, suggesting the rally isn’t being forced up by longs adding leverage. Spot buyers may be driving the move. With zero funding, neither bulls nor bears pay; carrying costs are low, but it hasn’t triggered any squeeze.
If next the funding rate turns positive and OI rises, then it would be the real bull entry signal. This setup is suitable for a small position to test the waters. Stop loss: watch 7.7. If it breaks below 7.7 and OI expands, the shorts may counterattack—I’ll exit.
Trading tag: #TradFi #链上美股 #FWDI
Where do you think this analysis is most likely to be wrong?
Price is rising but the funding rate is unchanged, suggesting the rally isn’t being forced up by longs adding leverage. Spot buyers may be driving the move. With zero funding, neither bulls nor bears pay; carrying costs are low, but it hasn’t triggered any squeeze.
If next the funding rate turns positive and OI rises, then it would be the real bull entry signal. This setup is suitable for a small position to test the waters. Stop loss: watch 7.7. If it breaks below 7.7 and OI expands, the shorts may counterattack—I’ll exit.
Trading tag: #TradFi #链上美股 #FWDI
Where do you think this analysis is most likely to be wrong?
174

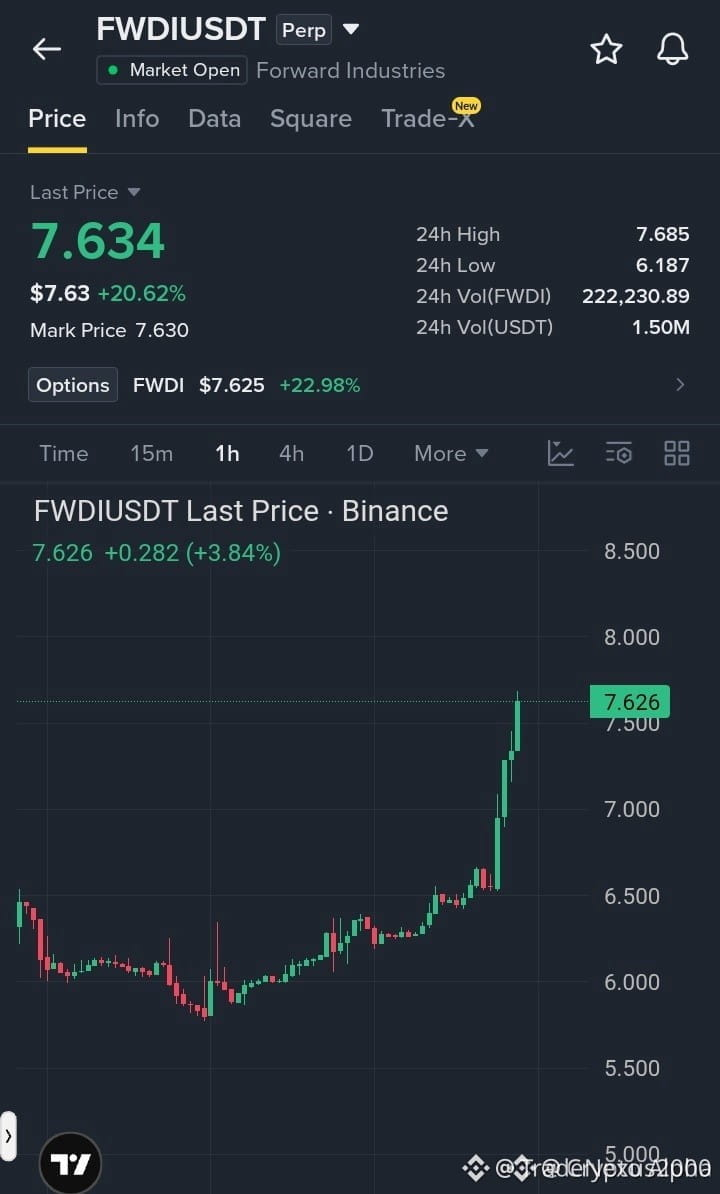
⚡ $FWDI EXPANDS ABOVE CONSOLIDATION RANGE WITH STRONG INSTITUTIONAL BUYING PRESSURE! 💥
Entry: $7.55 - $7.65 ⚡
Target: $7.85 - $8.35 🚀
Stop Loss: $7.25 ⚠️
📌 Price action on $FWDI shows a decisive structural expansion above the prior accumulation range, confirming buyer dominance across higher timeframes. 📊 Market participants are rapidly absorbing sell-side liquidity, setting up a high-probability trend continuation structure while order flow remains heavily skewed to the upside.
💡 As long as price holds above the former resistance turned support, smart money positioning favors systematic target expansion toward higher liquidity pools. 🔍 Key structural alignment in $BR and $ZEC also reinforces broader sector strength across active charts. 💬 Are you riding this structural breakout or waiting for a shallow retest of the demand zone? 👇
⚠️ Not financial advice. Always manage your risk. 🛡️
🏷️ #FWDI #Breakout #SmartMoney #Crypto #Trading
🎯 🦈
⚡ $FWDI EXPANDS ABOVE CONSOLIDATION RANGE WITH STRONG INSTITUTIONAL BUYING PRESSURE! 💥
Entry: $7.55 - $7.65 ⚡
Target: $7.85 - $8.35 🚀
Stop Loss: $7.25 ⚠️
📌 Price action on $FWDI shows a decisive structural expansion above the prior accumulation range, confirming buyer dominance across higher timeframes. 📊 Market participants are rapidly absorbing sell-side liquidity, setting up a high-probability trend continuation structure while order flow remains heavily skewed to the upside.
💡 As long as price holds above the former resistance turned support, smart money positioning favors systematic target expansion toward higher liquidity pools. 🔍 Key structural alignment in $BR and $ZEC also reinforces broader sector strength across active charts. 💬 Are you riding this structural breakout or waiting for a shallow retest of the demand zone? 👇
⚠️ Not financial advice. Always manage your risk. 🛡️
🏷️ #FWDI #Breakout #SmartMoney #Crypto #Trading
🎯 🦈
Entry: $7.55 - $7.65 ⚡
Target: $7.85 - $8.35 🚀
Stop Loss: $7.25 ⚠️
📌 Price action on $FWDI shows a decisive structural expansion above the prior accumulation range, confirming buyer dominance across higher timeframes. 📊 Market participants are rapidly absorbing sell-side liquidity, setting up a high-probability trend continuation structure while order flow remains heavily skewed to the upside.
💡 As long as price holds above the former resistance turned support, smart money positioning favors systematic target expansion toward higher liquidity pools. 🔍 Key structural alignment in $BR and $ZEC also reinforces broader sector strength across active charts. 💬 Are you riding this structural breakout or waiting for a shallow retest of the demand zone? 👇
⚠️ Not financial advice. Always manage your risk. 🛡️
🏷️ #FWDI #Breakout #SmartMoney #Crypto #Trading
🎯 🦈
83
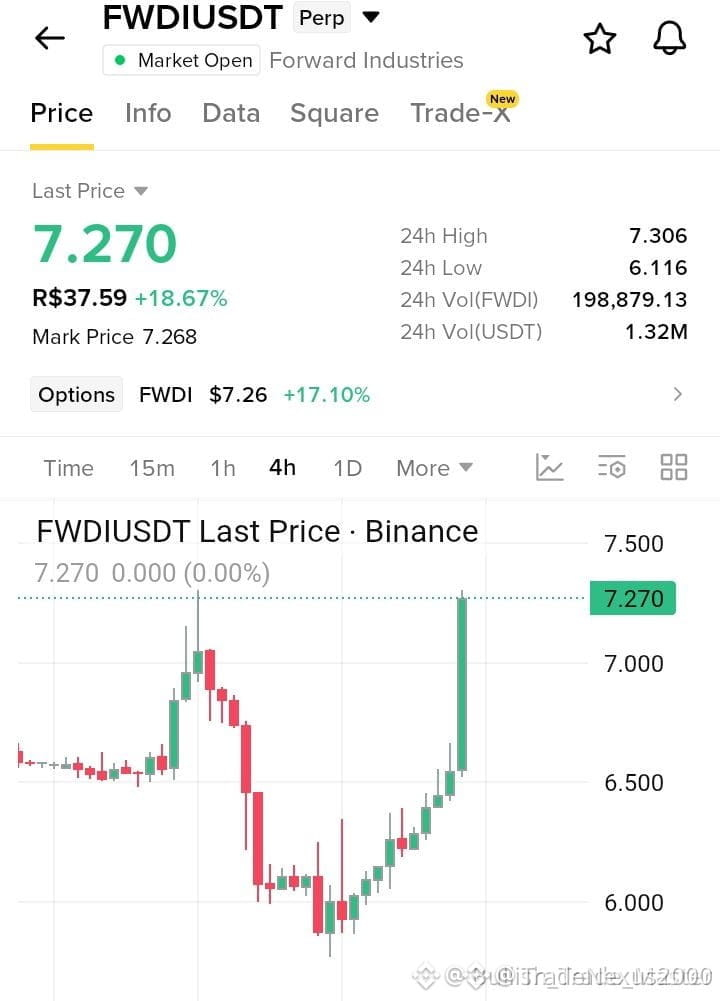
🚨 $FWDI CONSOLIDATING AT KEY DEMAND WITH INSANE RISK-REWARD FOR LONG SETUPS! 📈
Smart money order flow on $FWDI signals a textbook structural pivot as supply gets systematically absorbed at key structural demand. 🌊 Both $G and $F are showing correlated volume shifts, confirming institutional interest across the pair rotation. 📊
Inefficiency fills lower on the chart have cleared out late short positions, setting up a prime high-confluence entry window before expansion. 💡 When institutional order blocks hold while sell volume dries up, patient traders get rewarded with asymmetric setups.
Are you taking positioning inside this demand block or waiting for structural confirmation above resistance? 👇
⚠️ Not financial advice. Always manage your risk. 🛡️
🏷️ #FWDI #LongSetup #MarketStructure #Trading
🎯 🦈
🚨 $FWDI CONSOLIDATING AT KEY DEMAND WITH INSANE RISK-REWARD FOR LONG SETUPS! 📈
Smart money order flow on $FWDI signals a textbook structural pivot as supply gets systematically absorbed at key structural demand. 🌊 Both $G and $F are showing correlated volume shifts, confirming institutional interest across the pair rotation. 📊
Inefficiency fills lower on the chart have cleared out late short positions, setting up a prime high-confluence entry window before expansion. 💡 When institutional order blocks hold while sell volume dries up, patient traders get rewarded with asymmetric setups.
Are you taking positioning inside this demand block or waiting for structural confirmation above resistance? 👇
⚠️ Not financial advice. Always manage your risk. 🛡️
🏷️ #FWDI #LongSetup #MarketStructure #Trading
🎯 🦈
Smart money order flow on $FWDI signals a textbook structural pivot as supply gets systematically absorbed at key structural demand. 🌊 Both $G and $F are showing correlated volume shifts, confirming institutional interest across the pair rotation. 📊
Inefficiency fills lower on the chart have cleared out late short positions, setting up a prime high-confluence entry window before expansion. 💡 When institutional order blocks hold while sell volume dries up, patient traders get rewarded with asymmetric setups.
Are you taking positioning inside this demand block or waiting for structural confirmation above resistance? 👇
⚠️ Not financial advice. Always manage your risk. 🛡️
🏷️ #FWDI #LongSetup #MarketStructure #Trading
🎯 🦈
39
·
--
Gained 20.57% in a single day; the price went straight from some level yesterday to 7.778. $FWDI, as an underlying asset, has had some action today within the US stock perp sector on-chain. But when I checked the funding rate, it’s 0. That’s interesting: with such a sharp move, the perpetual funding rate is still neutral, suggesting that the force behind this rally likely doesn’t come from crowded long positions in the perpetual market.
My take is: this upswing looks more like it’s driven by demand in the spot market (or a comparable underlying asset). When reflected onto the perpetual contracts, the price rises along with it, but open interest holders aren’t疯狂地加杠杆做多, so the funding rate doesn’t pick up. This is a single-signal judgment, mainly based on the combination of a big price jump and the funding rate dropping to zero. Typically, a big rally paired with a positive funding rate is a sign that long sentiment is running hot. Now the funding rate is 0, meaning the speculative heat on the contract side isn’t matching the volatility of the price.
A possible reason is that spot buyers mainly want to hold the asset itself, or that arbitrage funds quickly brought spot and perp markets into balance.
On the flip side, this actually reduces the short-term pullback pressure caused by an excessively high funding rate. The longs don’t have to pay the shorts, so their position cost hasn’t increased. But the weakness is also clear: if this kind of spot-driven rally lacks sustained buy pressure, the price could drop quickly. If spot bids retreat, and longs in the contract market stay on the sidelines, then price support becomes thin.
Old dog’s next step is: observe. If the price can hold steady around 7.778, and OI (open interest) starts to grow gradually, while the funding rate stays near zero, then I’ll consider entering with a small position, because spot backing + the contracts gradually catching up could mean the trend continues. But I will never chase at the current level. The invalidation conditions are clear: if the price falls back below today’s opening level near 7.778, and OI shows a clear decline, then it means today’s surge lacks follow-through support. In that case, I’ll completely abandon this asset until a new bullish signal appears. In plain terms, this is only a one-day aberration—there’s no funding-rate and OI “resonance” from the secondary market. I choose to wait for it to prove itself.
Trading tag: #BinanceFutures #TradFi #USDⓈM #FWDI #FWDIUSDT $FWDI
Gained 20.57% in a single day; the price went straight from some level yesterday to 7.778. $FWDI , as an underlying asset, has had some action today within the US stock perp sector on-chain. But when I checked the funding rate, it’s 0. That’s interesting: with such a sharp move, the perpetual funding rate is still neutral, suggesting that the force behind this rally likely doesn’t come from crowded long positions in the perpetual market.
My take is: this upswing looks more like it’s driven by demand in the spot market (or a comparable underlying asset). When reflected onto the perpetual contracts, the price rises along with it, but open interest holders aren’t疯狂地加杠杆做多, so the funding rate doesn’t pick up. This is a single-signal judgment, mainly based on the combination of a big price jump and the funding rate dropping to zero. Typically, a big rally paired with a positive funding rate is a sign that long sentiment is running hot. Now the funding rate is 0, meaning the speculative heat on the contract side isn’t matching the volatility of the price.
A possible reason is that spot buyers mainly want to hold the asset itself, or that arbitrage funds quickly brought spot and perp markets into balance.
On the flip side, this actually reduces the short-term pullback pressure caused by an excessively high funding rate. The longs don’t have to pay the shorts, so their position cost hasn’t increased. But the weakness is also clear: if this kind of spot-driven rally lacks sustained buy pressure, the price could drop quickly. If spot bids retreat, and longs in the contract market stay on the sidelines, then price support becomes thin.
Old dog’s next step is: observe. If the price can hold steady around 7.778, and OI (open interest) starts to grow gradually, while the funding rate stays near zero, then I’ll consider entering with a small position, because spot backing + the contracts gradually catching up could mean the trend continues. But I will never chase at the current level. The invalidation conditions are clear: if the price falls back below today’s opening level near 7.778, and OI shows a clear decline, then it means today’s surge lacks follow-through support. In that case, I’ll completely abandon this asset until a new bullish signal appears. In plain terms, this is only a one-day aberration—there’s no funding-rate and OI “resonance” from the secondary market. I choose to wait for it to prove itself.
Trading tag: #BinanceFutures #TradFi #USDⓈM #FWDI #FWDIUSDT $FWDI
My take is: this upswing looks more like it’s driven by demand in the spot market (or a comparable underlying asset). When reflected onto the perpetual contracts, the price rises along with it, but open interest holders aren’t疯狂地加杠杆做多, so the funding rate doesn’t pick up. This is a single-signal judgment, mainly based on the combination of a big price jump and the funding rate dropping to zero. Typically, a big rally paired with a positive funding rate is a sign that long sentiment is running hot. Now the funding rate is 0, meaning the speculative heat on the contract side isn’t matching the volatility of the price.
A possible reason is that spot buyers mainly want to hold the asset itself, or that arbitrage funds quickly brought spot and perp markets into balance.
On the flip side, this actually reduces the short-term pullback pressure caused by an excessively high funding rate. The longs don’t have to pay the shorts, so their position cost hasn’t increased. But the weakness is also clear: if this kind of spot-driven rally lacks sustained buy pressure, the price could drop quickly. If spot bids retreat, and longs in the contract market stay on the sidelines, then price support becomes thin.
Old dog’s next step is: observe. If the price can hold steady around 7.778, and OI (open interest) starts to grow gradually, while the funding rate stays near zero, then I’ll consider entering with a small position, because spot backing + the contracts gradually catching up could mean the trend continues. But I will never chase at the current level. The invalidation conditions are clear: if the price falls back below today’s opening level near 7.778, and OI shows a clear decline, then it means today’s surge lacks follow-through support. In that case, I’ll completely abandon this asset until a new bullish signal appears. In plain terms, this is only a one-day aberration—there’s no funding-rate and OI “resonance” from the secondary market. I choose to wait for it to prove itself.
Trading tag: #BinanceFutures #TradFi #USDⓈM #FWDI #FWDIUSDT $FWDI
45

·
--
$FWDI 24 hours, it surged by 23.4%, but the funding rate is 0—this doesn’t seem right. Prices were pushed up with a + zero funding rate, which suggests the rally isn’t backed by sustained long-side capital with a premium; it’s purely an emotion-driven pulse.
Risk appetite from political factors may drive things in the short term, but there’s no real-money follow-through. People chasing longs think the trend will continue, and a funding rate of 0 shows there hasn’t been new long capital stepping in to lift the market. When emotional funds pull out, the higher-priced chasers end up paying the full cost.
If the funding rate keeps staying flat or turns negative, then this move is a fake breakout. Wait until the funding rate turns positive and OI catches up before considering going long; for now, just watch.
Trading tag: #TradFi #链上美股 #FWDI
Where do you think this judgment is most likely to be wrong?
$FWDI 24 hours, it surged by 23.4%, but the funding rate is 0—this doesn’t seem right. Prices were pushed up with a + zero funding rate, which suggests the rally isn’t backed by sustained long-side capital with a premium; it’s purely an emotion-driven pulse.
Risk appetite from political factors may drive things in the short term, but there’s no real-money follow-through. People chasing longs think the trend will continue, and a funding rate of 0 shows there hasn’t been new long capital stepping in to lift the market. When emotional funds pull out, the higher-priced chasers end up paying the full cost.
If the funding rate keeps staying flat or turns negative, then this move is a fake breakout. Wait until the funding rate turns positive and OI catches up before considering going long; for now, just watch.
Trading tag: #TradFi #链上美股 #FWDI
Where do you think this judgment is most likely to be wrong?
Risk appetite from political factors may drive things in the short term, but there’s no real-money follow-through. People chasing longs think the trend will continue, and a funding rate of 0 shows there hasn’t been new long capital stepping in to lift the market. When emotional funds pull out, the higher-priced chasers end up paying the full cost.
If the funding rate keeps staying flat or turns negative, then this move is a fake breakout. Wait until the funding rate turns positive and OI catches up before considering going long; for now, just watch.
Trading tag: #TradFi #链上美股 #FWDI
Where do you think this judgment is most likely to be wrong?
76

·
--
📉 Ness strategy share
━━━━━━━━━━━━━━━━
💰 Pair: FWDIUSDT
🔴 Direction: Short
📊 Signal: Sell
⭐ Confidence: 70%
📈 Trend: Downtrend
━━━━━━━━━━━━━━━━
💎 Current price: 7.717
🔴 Resistance level: [7.476282, 7.9]
🟢 Support level: [5.77, 5.264818]
━━━━━━━━━━━━━━━━
📝 Analysis: The rise was 23.1%+; RSI is overbought; near the upper Bollinger Band; and the overbought move is 23.1%+. The probability of a short-term pullback is high
━━━━━━━━━━━━━━━━
📅 2026.09.19 07:36 | For reference only and does not constitute investment advice
#FWDI #加密货币 #合约交易 #奈斯哥 #quantitative trading
📉 Ness strategy share
━━━━━━━━━━━━━━━━
💰 Pair: FWDIUSDT
🔴 Direction: Short
📊 Signal: Sell
⭐ Confidence: 70%
📈 Trend: Downtrend
━━━━━━━━━━━━━━━━
💎 Current price: 7.717
🔴 Resistance level: [7.476282, 7.9]
🟢 Support level: [5.77, 5.264818]
━━━━━━━━━━━━━━━━
📝 Analysis: The rise was 23.1%+; RSI is overbought; near the upper Bollinger Band; and the overbought move is 23.1%+. The probability of a short-term pullback is high
━━━━━━━━━━━━━━━━
📅 2026.09.19 07:36 | For reference only and does not constitute investment advice
#FWDI #加密货币 #合约交易 #奈斯哥 #quantitative trading
━━━━━━━━━━━━━━━━
💰 Pair: FWDIUSDT
🔴 Direction: Short
📊 Signal: Sell
⭐ Confidence: 70%
📈 Trend: Downtrend
━━━━━━━━━━━━━━━━
💎 Current price: 7.717
🔴 Resistance level: [7.476282, 7.9]
🟢 Support level: [5.77, 5.264818]
━━━━━━━━━━━━━━━━
📝 Analysis: The rise was 23.1%+; RSI is overbought; near the upper Bollinger Band; and the overbought move is 23.1%+. The probability of a short-term pullback is high
━━━━━━━━━━━━━━━━
📅 2026.09.19 07:36 | For reference only and does not constitute investment advice
#FWDI #加密货币 #合约交易 #奈斯哥 #quantitative trading
7
·
--
The old dog glanced at it: over the past 24 hours, $FWDI has risen 19.554%, but in the same period the contract funding rate is 0. Prices are going up, but the funding rate isn’t—this kind of divergence isn’t very common in on-chain U.S. stock index futures contracts. A zero funding rate means neither long nor short positions need to pay the other right now, so at the leverage level the market hasn’t formed a clear one-sided crowding.
Logically, the rationale behind this move is more aligned with the Crypto–TradFi convergence viewpoint from M3. If BTC breaks out with independent strength, traditional crypto users’ sentiment toward tickers like COIN and MSTR could spill over, thereby drawing attention to equity contracts like $FWDI. But the secondary market hasn’t provided a direct comparable signal for similar tickers, so this looks more like beta returns driven by broader market sentiment rather than sector-level alpha outperforming. The fact that the funding rate is zero also supports this: there’s a lack of strong contract-side competition, and it’s more like external spot capital is testing the waters rather than triggering an internal leverage arms race.
The old dog’s take is that this kind of impulse lacks support from contract depth, so its staying power is questionable. I plan to watch with a small position. If the price retests 7.50800 (today’s quoted price) and holds without breaking, I’ll consider adding to probe. Conversely, the market right now might be only seeing the percentage gain number while ignoring the reality that there’s no leverage consensus behind the zero funding rate.
Trading tag: #BinanceFutures #TradFi #USDⓈM #FWDI #FWDIUSDT $FWDI
The old dog glanced at it: over the past 24 hours, $FWDI has risen 19.554%, but in the same period the contract funding rate is 0. Prices are going up, but the funding rate isn’t—this kind of divergence isn’t very common in on-chain U.S. stock index futures contracts. A zero funding rate means neither long nor short positions need to pay the other right now, so at the leverage level the market hasn’t formed a clear one-sided crowding.
Logically, the rationale behind this move is more aligned with the Crypto–TradFi convergence viewpoint from M3. If BTC breaks out with independent strength, traditional crypto users’ sentiment toward tickers like COIN and MSTR could spill over, thereby drawing attention to equity contracts like $FWDI . But the secondary market hasn’t provided a direct comparable signal for similar tickers, so this looks more like beta returns driven by broader market sentiment rather than sector-level alpha outperforming. The fact that the funding rate is zero also supports this: there’s a lack of strong contract-side competition, and it’s more like external spot capital is testing the waters rather than triggering an internal leverage arms race.
The old dog’s take is that this kind of impulse lacks support from contract depth, so its staying power is questionable. I plan to watch with a small position. If the price retests 7.50800 (today’s quoted price) and holds without breaking, I’ll consider adding to probe. Conversely, the market right now might be only seeing the percentage gain number while ignoring the reality that there’s no leverage consensus behind the zero funding rate.
Trading tag: #BinanceFutures #TradFi #USDⓈM #FWDI #FWDIUSDT $FWDI
Logically, the rationale behind this move is more aligned with the Crypto–TradFi convergence viewpoint from M3. If BTC breaks out with independent strength, traditional crypto users’ sentiment toward tickers like COIN and MSTR could spill over, thereby drawing attention to equity contracts like $FWDI . But the secondary market hasn’t provided a direct comparable signal for similar tickers, so this looks more like beta returns driven by broader market sentiment rather than sector-level alpha outperforming. The fact that the funding rate is zero also supports this: there’s a lack of strong contract-side competition, and it’s more like external spot capital is testing the waters rather than triggering an internal leverage arms race.
The old dog’s take is that this kind of impulse lacks support from contract depth, so its staying power is questionable. I plan to watch with a small position. If the price retests 7.50800 (today’s quoted price) and holds without breaking, I’ll consider adding to probe. Conversely, the market right now might be only seeing the percentage gain number while ignoring the reality that there’s no leverage consensus behind the zero funding rate.
Trading tag: #BinanceFutures #TradFi #USDⓈM #FWDI #FWDIUSDT $FWDI
254

·
--
$FWDI 24 hours down 9.2%, price at 6.084. This is the core data I can access right now.
My take: the selling momentum comes from the accumulation of short positions, but the negative funding rate means shorts are paying to maintain their positions—so the risk of a short-term rebound is building.
The evidence is a single signal, derived from the combination of the funding rate and price. Funding rate -0.00052543: shorts are paying longs, which suggests bearish sentiment is overheated and short positions are crowded. The price is down 9%; shorts are currently sitting on unrealized gains, but persistent negative funding will raise their holding costs.
Trading tag: #TradFi #链上美股 #FWDI
Where do you think this assessment is most likely to be wrong?
$FWDI 24 hours down 9.2%, price at 6.084. This is the core data I can access right now.
My take: the selling momentum comes from the accumulation of short positions, but the negative funding rate means shorts are paying to maintain their positions—so the risk of a short-term rebound is building.
The evidence is a single signal, derived from the combination of the funding rate and price. Funding rate -0.00052543: shorts are paying longs, which suggests bearish sentiment is overheated and short positions are crowded. The price is down 9%; shorts are currently sitting on unrealized gains, but persistent negative funding will raise their holding costs.
Trading tag: #TradFi #链上美股 #FWDI
Where do you think this assessment is most likely to be wrong?
My take: the selling momentum comes from the accumulation of short positions, but the negative funding rate means shorts are paying to maintain their positions—so the risk of a short-term rebound is building.
The evidence is a single signal, derived from the combination of the funding rate and price. Funding rate -0.00052543: shorts are paying longs, which suggests bearish sentiment is overheated and short positions are crowded. The price is down 9%; shorts are currently sitting on unrealized gains, but persistent negative funding will raise their holding costs.
Trading tag: #TradFi #链上美股 #FWDI
Where do you think this assessment is most likely to be wrong?
8
·
--
FWDI 24-hour price drop of 9.2%, funding rate -0.000525. As the price falls, shorts are paying fees to longs.
This is a typical short-crowded setup. Shorts have a strong willingness to hold positions; they’d rather pay to maintain their short exposure, suppressing any attempts at a rebound. The price is struggling around 6.08, and the negative funding rate means the cost of short positions is accumulating.
The strongest counter-argument is that if the price can keep rebounding above the current level, the ongoing negative funding rate could become a noose for shorts and potentially trigger a short squeeze.
Trading tag: #TradFi #链上美股 #FWDI
Where do you think this thesis is most likely to be wrong?
FWDI 24-hour price drop of 9.2%, funding rate -0.000525. As the price falls, shorts are paying fees to longs.
This is a typical short-crowded setup. Shorts have a strong willingness to hold positions; they’d rather pay to maintain their short exposure, suppressing any attempts at a rebound. The price is struggling around 6.08, and the negative funding rate means the cost of short positions is accumulating.
The strongest counter-argument is that if the price can keep rebounding above the current level, the ongoing negative funding rate could become a noose for shorts and potentially trigger a short squeeze.
Trading tag: #TradFi #链上美股 #FWDI
Where do you think this thesis is most likely to be wrong?
This is a typical short-crowded setup. Shorts have a strong willingness to hold positions; they’d rather pay to maintain their short exposure, suppressing any attempts at a rebound. The price is struggling around 6.08, and the negative funding rate means the cost of short positions is accumulating.
The strongest counter-argument is that if the price can keep rebounding above the current level, the ongoing negative funding rate could become a noose for shorts and potentially trigger a short squeeze.
Trading tag: #TradFi #链上美股 #FWDI
Where do you think this thesis is most likely to be wrong?
140

·
--
🚨 $FWDI 50% PREMIUM BID FOR $SKYAI : LIQUIDITY EVENT LIVE 🦈
Entry: 1.42 ⚡
Target: 2.13 🚀
📌 The updated bid reframes $SKYAI as a liquidity event, not just a chart pattern. A 50% premium to the last print creates a clear institutional reference point, while the 0.306 exchange ratio adds optionality for holders choosing cash or stock. 📊
⚡ The non-binding nature means the market may still test the gap before the September 25 response deadline. That is where smart money often separates narrative noise from real deal conviction. 💬 Are you chasing the premium, or waiting for confirmation before sizing in?
⚠️ Not financial advice. Always manage your risk. 🛡️
🏷️ #FWDI #SKYAI #Merger #Liquidity #Crypto
🦈 📊
🚨 $FWDI 50% PREMIUM BID FOR $SKYAI : LIQUIDITY EVENT LIVE 🦈
Entry: 1.42 ⚡
Target: 2.13 🚀
📌 The updated bid reframes $SKYAI as a liquidity event, not just a chart pattern. A 50% premium to the last print creates a clear institutional reference point, while the 0.306 exchange ratio adds optionality for holders choosing cash or stock. 📊
⚡ The non-binding nature means the market may still test the gap before the September 25 response deadline. That is where smart money often separates narrative noise from real deal conviction. 💬 Are you chasing the premium, or waiting for confirmation before sizing in?
⚠️ Not financial advice. Always manage your risk. 🛡️
🏷️ #FWDI #SKYAI #Merger #Liquidity #Crypto
🦈 📊
Entry: 1.42 ⚡
Target: 2.13 🚀
📌 The updated bid reframes $SKYAI as a liquidity event, not just a chart pattern. A 50% premium to the last print creates a clear institutional reference point, while the 0.306 exchange ratio adds optionality for holders choosing cash or stock. 📊
⚡ The non-binding nature means the market may still test the gap before the September 25 response deadline. That is where smart money often separates narrative noise from real deal conviction. 💬 Are you chasing the premium, or waiting for confirmation before sizing in?
⚠️ Not financial advice. Always manage your risk. 🛡️
🏷️ #FWDI #SKYAI #Merger #Liquidity #Crypto
🦈 📊
134
·
--
The old dog glanced at FWDI’s chart. After 24 hours, it laid down an all-time low candle straight down by 10.717%, and the current price is sitting around 6.115. This drop isn’t small for on-chain perpetuals, but what’s more interesting is the structure behind it.
While the price is falling, the funding rate is still positive—0.00048330. This “iron rule” is crystal clear: a positive funding rate means longs are paying shorts. That suggests there are still more people piling into longs than into shorts in this venue—basically, the longs haven’t given up yet; they’re still propping things up with money. This usually isn’t a bottoming signal. Instead, it feels like a congested lane: there’s a traffic jam ahead, and everyone behind has to slam the brakes.
The trading volume is over one million, and open interest is still about 45,800. This indicates positions haven’t been quickly wiped out despite the big drop—the trapped capital is still stacked in there.
The market’s common take might be: it’s dropped so much, it should bounce; or that this is a normal pullback linked to BTC. I look at it differently. The old dog thinks that when the funding rate is still positive, a volume-backed selloff like this looks more like the beginning of a squeeze/forced unwinding—not the end.
When longs are trapped and the funding rate keeps charging them, liquidity will get tighter and tighter. The most forced to act are the leveraged longs: either they cut their losses and exit, or they wait to be liquidated by the system. Their departure becomes yet another force pushing the price down.
Next, if the price continues bleeding lower—or we get a sudden quick spike—more longs will be forced to close. Liquidity may then move from the perpetuals/futures market into spot, or people may simply exit and watch from the sidelines. This will further suppress FWDI’s short-term upside elasticity.
My view: any rebound from here is likely an opportunity to reduce exposure, not a chance to bottom-fish. The old dog’s stance is to stay put—unless one of two signals appears: either the funding rate quickly flips to negative, meaning shorts are getting crowded and there’s a foundation for a bounce; or the price can gain volume and hold above the current level, with the funding rate dropping in sync. Until then, long crowding is just a knife hanging over their heads.
Trading tags: #BinanceFutures #TradFi #USDⓈM #FWDI #FWDIUSDT $FWDI
The old dog glanced at FWDI’s chart. After 24 hours, it laid down an all-time low candle straight down by 10.717%, and the current price is sitting around 6.115. This drop isn’t small for on-chain perpetuals, but what’s more interesting is the structure behind it.
While the price is falling, the funding rate is still positive—0.00048330. This “iron rule” is crystal clear: a positive funding rate means longs are paying shorts. That suggests there are still more people piling into longs than into shorts in this venue—basically, the longs haven’t given up yet; they’re still propping things up with money. This usually isn’t a bottoming signal. Instead, it feels like a congested lane: there’s a traffic jam ahead, and everyone behind has to slam the brakes.
The trading volume is over one million, and open interest is still about 45,800. This indicates positions haven’t been quickly wiped out despite the big drop—the trapped capital is still stacked in there.
The market’s common take might be: it’s dropped so much, it should bounce; or that this is a normal pullback linked to BTC. I look at it differently. The old dog thinks that when the funding rate is still positive, a volume-backed selloff like this looks more like the beginning of a squeeze/forced unwinding—not the end.
When longs are trapped and the funding rate keeps charging them, liquidity will get tighter and tighter. The most forced to act are the leveraged longs: either they cut their losses and exit, or they wait to be liquidated by the system. Their departure becomes yet another force pushing the price down.
Next, if the price continues bleeding lower—or we get a sudden quick spike—more longs will be forced to close. Liquidity may then move from the perpetuals/futures market into spot, or people may simply exit and watch from the sidelines. This will further suppress FWDI’s short-term upside elasticity.
My view: any rebound from here is likely an opportunity to reduce exposure, not a chance to bottom-fish. The old dog’s stance is to stay put—unless one of two signals appears: either the funding rate quickly flips to negative, meaning shorts are getting crowded and there’s a foundation for a bounce; or the price can gain volume and hold above the current level, with the funding rate dropping in sync. Until then, long crowding is just a knife hanging over their heads.
Trading tags: #BinanceFutures #TradFi #USDⓈM #FWDI #FWDIUSDT $FWDI
While the price is falling, the funding rate is still positive—0.00048330. This “iron rule” is crystal clear: a positive funding rate means longs are paying shorts. That suggests there are still more people piling into longs than into shorts in this venue—basically, the longs haven’t given up yet; they’re still propping things up with money. This usually isn’t a bottoming signal. Instead, it feels like a congested lane: there’s a traffic jam ahead, and everyone behind has to slam the brakes.
The trading volume is over one million, and open interest is still about 45,800. This indicates positions haven’t been quickly wiped out despite the big drop—the trapped capital is still stacked in there.
The market’s common take might be: it’s dropped so much, it should bounce; or that this is a normal pullback linked to BTC. I look at it differently. The old dog thinks that when the funding rate is still positive, a volume-backed selloff like this looks more like the beginning of a squeeze/forced unwinding—not the end.
When longs are trapped and the funding rate keeps charging them, liquidity will get tighter and tighter. The most forced to act are the leveraged longs: either they cut their losses and exit, or they wait to be liquidated by the system. Their departure becomes yet another force pushing the price down.
Next, if the price continues bleeding lower—or we get a sudden quick spike—more longs will be forced to close. Liquidity may then move from the perpetuals/futures market into spot, or people may simply exit and watch from the sidelines. This will further suppress FWDI’s short-term upside elasticity.
My view: any rebound from here is likely an opportunity to reduce exposure, not a chance to bottom-fish. The old dog’s stance is to stay put—unless one of two signals appears: either the funding rate quickly flips to negative, meaning shorts are getting crowded and there’s a foundation for a bounce; or the price can gain volume and hold above the current level, with the funding rate dropping in sync. Until then, long crowding is just a knife hanging over their heads.
Trading tags: #BinanceFutures #TradFi #USDⓈM #FWDI #FWDIUSDT $FWDI
41

$FWDI LONG
Can buyers build an upward momentum from the current positions? The bulls are trying to take the initiative and maintain control over the asset’s movement. A constructive outlook creates good conditions for a steady advance upward, provided that buying demand doesn’t weaken.
➡️Entry point: 7.032
💰Target 1: 7.14876808 (+1.66%)
💰Target 2: 7.30253615 (+3.85%)
💰Target 3: 7.53318827 (+7.13%)
⛔️Stop: 6.76434789 (-3.81%)
⚠️ This is not financial advice. Trade at your own risk. DYOR.
#FWDI #SenateReadiesSeptemberCLARITYActVote #BerkshireMakes19.8BNetStockPurchases 📈
$FWDI
$FWDI LONG
Can buyers build an upward momentum from the current positions? The bulls are trying to take the initiative and maintain control over the asset’s movement. A constructive outlook creates good conditions for a steady advance upward, provided that buying demand doesn’t weaken.
➡️Entry point: 7.032
💰Target 1: 7.14876808 (+1.66%)
💰Target 2: 7.30253615 (+3.85%)
💰Target 3: 7.53318827 (+7.13%)
⛔️Stop: 6.76434789 (-3.81%)
⚠️ This is not financial advice. Trade at your own risk. DYOR.
#FWDI #SenateReadiesSeptemberCLARITYActVote #BerkshireMakes19.8BNetStockPurchases 📈
$FWDI
Can buyers build an upward momentum from the current positions? The bulls are trying to take the initiative and maintain control over the asset’s movement. A constructive outlook creates good conditions for a steady advance upward, provided that buying demand doesn’t weaken.
➡️Entry point: 7.032
💰Target 1: 7.14876808 (+1.66%)
💰Target 2: 7.30253615 (+3.85%)
💰Target 3: 7.53318827 (+7.13%)
⛔️Stop: 6.76434789 (-3.81%)
⚠️ This is not financial advice. Trade at your own risk. DYOR.
#FWDI #SenateReadiesSeptemberCLARITYActVote #BerkshireMakes19.8BNetStockPurchases 📈
$FWDI
31
·
--
The old dog swept past <0>FWDI</0> in the past 24 hours and it dropped 13.753%, with a quoted price of 6.064. Meanwhile, the funding rate is negative, at -0.00038627. The price crashing on top of the short-fee setup—this combination isn’t common.
Put plainly, this is a typical precondition for a short squeeze. A negative funding rate means the short positions are paying fees to the long side, indicating that the short positioning is already crowded. If the price gets smashed lower again, the shorts’ unrealized profit increases, but their interest cost also rises. Then, if any rebound or buy-side momentum appears, these shorts are likely to be forced to close (buy to cover) to stop the loss, which can quickly push the price up.
The open interest is 45466; on its own, the old dog can’t judge whether it’s heavy or light, but combined with the negative funding rate and the rapid selloff, it points to shorts building positions and holding on.
Based on a single set of signals (price + funding rate), this doesn’t look like a straightforward drop in value. It looks more like leveraged shorts are accumulating risk. There’s no second reference coin to verify the overall sentiment in the sector, so my conclusion is entirely based on FWDI’s contract data. The market may simply see -13.7% and assume the trend turned bearish, but in a negative funding environment, a sharp drop is when the counter-force is building.
My view is that the probability of a short squeeze (a squeeze-driven surge as shorts get trampled) for FWDI in the short term is increasing. In terms of action, I won’t chase shorts right now; instead I’ll watch for rebound signals. If the price can hold above 6.06 and the funding rate turns positive or OI clearly declines, I’ll consider entering a small long position, with the initial target around today’s opening level. The counter-argument is: if this is just a continuation of a bigger downward move, then the negative funding rate itself is a reason to attract new shorts, and the downtrend could persist.
The easiest place this thesis could be wrong is if FWDI’s fundamentals or the broader market environment deteriorates in a substantial way that I didn’t notice, leaving no bid support from longs—then the negative funding rate would be merely a footnote to one-way selling. The invalidation signal is: if the price continues to break below the current level on expanding volume, and the funding rate remains negative while OI (open interest) starts to spike abnormally, it would indicate stronger short power adding fuel—at that point my short squeeze logic fails, and I should immediately exit and stand by.
Trading tag: #BinanceFutures #TradFi #USDⓈM #FWDI #FWDIUSDT $FWDI
The old dog swept past <0>FWDI</0> in the past 24 hours and it dropped 13.753%, with a quoted price of 6.064. Meanwhile, the funding rate is negative, at -0.00038627. The price crashing on top of the short-fee setup—this combination isn’t common.
Put plainly, this is a typical precondition for a short squeeze. A negative funding rate means the short positions are paying fees to the long side, indicating that the short positioning is already crowded. If the price gets smashed lower again, the shorts’ unrealized profit increases, but their interest cost also rises. Then, if any rebound or buy-side momentum appears, these shorts are likely to be forced to close (buy to cover) to stop the loss, which can quickly push the price up.
The open interest is 45466; on its own, the old dog can’t judge whether it’s heavy or light, but combined with the negative funding rate and the rapid selloff, it points to shorts building positions and holding on.
Based on a single set of signals (price + funding rate), this doesn’t look like a straightforward drop in value. It looks more like leveraged shorts are accumulating risk. There’s no second reference coin to verify the overall sentiment in the sector, so my conclusion is entirely based on FWDI’s contract data. The market may simply see -13.7% and assume the trend turned bearish, but in a negative funding environment, a sharp drop is when the counter-force is building.
My view is that the probability of a short squeeze (a squeeze-driven surge as shorts get trampled) for FWDI in the short term is increasing. In terms of action, I won’t chase shorts right now; instead I’ll watch for rebound signals. If the price can hold above 6.06 and the funding rate turns positive or OI clearly declines, I’ll consider entering a small long position, with the initial target around today’s opening level. The counter-argument is: if this is just a continuation of a bigger downward move, then the negative funding rate itself is a reason to attract new shorts, and the downtrend could persist.
The easiest place this thesis could be wrong is if FWDI’s fundamentals or the broader market environment deteriorates in a substantial way that I didn’t notice, leaving no bid support from longs—then the negative funding rate would be merely a footnote to one-way selling. The invalidation signal is: if the price continues to break below the current level on expanding volume, and the funding rate remains negative while OI (open interest) starts to spike abnormally, it would indicate stronger short power adding fuel—at that point my short squeeze logic fails, and I should immediately exit and stand by.
Trading tag: #BinanceFutures #TradFi #USDⓈM #FWDI #FWDIUSDT $FWDI
Put plainly, this is a typical precondition for a short squeeze. A negative funding rate means the short positions are paying fees to the long side, indicating that the short positioning is already crowded. If the price gets smashed lower again, the shorts’ unrealized profit increases, but their interest cost also rises. Then, if any rebound or buy-side momentum appears, these shorts are likely to be forced to close (buy to cover) to stop the loss, which can quickly push the price up.
The open interest is 45466; on its own, the old dog can’t judge whether it’s heavy or light, but combined with the negative funding rate and the rapid selloff, it points to shorts building positions and holding on.
Based on a single set of signals (price + funding rate), this doesn’t look like a straightforward drop in value. It looks more like leveraged shorts are accumulating risk. There’s no second reference coin to verify the overall sentiment in the sector, so my conclusion is entirely based on FWDI’s contract data. The market may simply see -13.7% and assume the trend turned bearish, but in a negative funding environment, a sharp drop is when the counter-force is building.
My view is that the probability of a short squeeze (a squeeze-driven surge as shorts get trampled) for FWDI in the short term is increasing. In terms of action, I won’t chase shorts right now; instead I’ll watch for rebound signals. If the price can hold above 6.06 and the funding rate turns positive or OI clearly declines, I’ll consider entering a small long position, with the initial target around today’s opening level. The counter-argument is: if this is just a continuation of a bigger downward move, then the negative funding rate itself is a reason to attract new shorts, and the downtrend could persist.
The easiest place this thesis could be wrong is if FWDI’s fundamentals or the broader market environment deteriorates in a substantial way that I didn’t notice, leaving no bid support from longs—then the negative funding rate would be merely a footnote to one-way selling. The invalidation signal is: if the price continues to break below the current level on expanding volume, and the funding rate remains negative while OI (open interest) starts to spike abnormally, it would indicate stronger short power adding fuel—at that point my short squeeze logic fails, and I should immediately exit and stand by.
Trading tag: #BinanceFutures #TradFi #USDⓈM #FWDI #FWDIUSDT $FWDI
75

$FWDI 24 hours dropped 14.88%, and the current price is 6.042. The funding rate is negative, -0.00022763. When the price falls and the funding rate is still negative, it means shorts are paying longs—short positions are extremely crowded.
I specialize in trading political events. This kind of TradFi perp underlying is highly sensitive to policy and geopolitical updates. The price has been falling continuously, yet the funding rate remains negative, which suggests that the market’s sentiment for shorting is very consistent—everyone is betting on further downside. This kind of structure often means that as long as there’s a bit of positive news or “bad news that has been fully priced in,” and the price doesn’t break the key level, short sellers can cover and pull the price up quickly. Right now, the cost is being borne by the shorts—they’re paying funding every day and waiting.
But the other way to look at it is: if a truly major negative shock happens—say, tougher regulation or an escalation in geopolitical conflict—then these crowded short positions likely won’t leave. Instead, they may drive the price even lower. From this 6.04 level downward, shorts will likely stack stop-loss orders even further below. Upward, in the 6.3 to 6.5 range, it could be the first target area for shorts covering.
What’s the strongest contrarian evidence? It’s when political risk actually materializes and becomes a real “black swan.” For example, if strict restrictions on cross-border capital flows are suddenly introduced, then this kind of underlying tied to traditional finance would bleed immediately. The negative funding rate could be overwhelmed by an even larger drawdown. The condition under which this thesis fails is: the price breaks below 5.9, the previous low. Once it breaks, it means short power is overpowering everything, and my long thesis would be wrong.
So my action is: try going long with a small position around 6.04. Direction: long. Leverage: 3x. Stop-loss: 5.9. Take-profit: first target 6.5. Position size: 10% of total capital. If the price directly breaks below 5.9, I’ll stop out and exit—I won’t hold through it.
The market may think the political risk is already priced in, but I think the short positions haven’t been fully cleared yet—they need a catalyst to close. That catalyst could be any piece of news that doesn’t further worsen the situation.
Trading tag: #TradFi #链上美股 #FWDI
Where do you think this thesis is most likely to be wrong?
$FWDI 24 hours dropped 14.88%, and the current price is 6.042. The funding rate is negative, -0.00022763. When the price falls and the funding rate is still negative, it means shorts are paying longs—short positions are extremely crowded.
I specialize in trading political events. This kind of TradFi perp underlying is highly sensitive to policy and geopolitical updates. The price has been falling continuously, yet the funding rate remains negative, which suggests that the market’s sentiment for shorting is very consistent—everyone is betting on further downside. This kind of structure often means that as long as there’s a bit of positive news or “bad news that has been fully priced in,” and the price doesn’t break the key level, short sellers can cover and pull the price up quickly. Right now, the cost is being borne by the shorts—they’re paying funding every day and waiting.
But the other way to look at it is: if a truly major negative shock happens—say, tougher regulation or an escalation in geopolitical conflict—then these crowded short positions likely won’t leave. Instead, they may drive the price even lower. From this 6.04 level downward, shorts will likely stack stop-loss orders even further below. Upward, in the 6.3 to 6.5 range, it could be the first target area for shorts covering.
What’s the strongest contrarian evidence? It’s when political risk actually materializes and becomes a real “black swan.” For example, if strict restrictions on cross-border capital flows are suddenly introduced, then this kind of underlying tied to traditional finance would bleed immediately. The negative funding rate could be overwhelmed by an even larger drawdown. The condition under which this thesis fails is: the price breaks below 5.9, the previous low. Once it breaks, it means short power is overpowering everything, and my long thesis would be wrong.
So my action is: try going long with a small position around 6.04. Direction: long. Leverage: 3x. Stop-loss: 5.9. Take-profit: first target 6.5. Position size: 10% of total capital. If the price directly breaks below 5.9, I’ll stop out and exit—I won’t hold through it.
The market may think the political risk is already priced in, but I think the short positions haven’t been fully cleared yet—they need a catalyst to close. That catalyst could be any piece of news that doesn’t further worsen the situation.
Trading tag: #TradFi #链上美股 #FWDI
Where do you think this thesis is most likely to be wrong?
I specialize in trading political events. This kind of TradFi perp underlying is highly sensitive to policy and geopolitical updates. The price has been falling continuously, yet the funding rate remains negative, which suggests that the market’s sentiment for shorting is very consistent—everyone is betting on further downside. This kind of structure often means that as long as there’s a bit of positive news or “bad news that has been fully priced in,” and the price doesn’t break the key level, short sellers can cover and pull the price up quickly. Right now, the cost is being borne by the shorts—they’re paying funding every day and waiting.
But the other way to look at it is: if a truly major negative shock happens—say, tougher regulation or an escalation in geopolitical conflict—then these crowded short positions likely won’t leave. Instead, they may drive the price even lower. From this 6.04 level downward, shorts will likely stack stop-loss orders even further below. Upward, in the 6.3 to 6.5 range, it could be the first target area for shorts covering.
What’s the strongest contrarian evidence? It’s when political risk actually materializes and becomes a real “black swan.” For example, if strict restrictions on cross-border capital flows are suddenly introduced, then this kind of underlying tied to traditional finance would bleed immediately. The negative funding rate could be overwhelmed by an even larger drawdown. The condition under which this thesis fails is: the price breaks below 5.9, the previous low. Once it breaks, it means short power is overpowering everything, and my long thesis would be wrong.
So my action is: try going long with a small position around 6.04. Direction: long. Leverage: 3x. Stop-loss: 5.9. Take-profit: first target 6.5. Position size: 10% of total capital. If the price directly breaks below 5.9, I’ll stop out and exit—I won’t hold through it.
The market may think the political risk is already priced in, but I think the short positions haven’t been fully cleared yet—they need a catalyst to close. That catalyst could be any piece of news that doesn’t further worsen the situation.
Trading tag: #TradFi #链上美股 #FWDI
Where do you think this thesis is most likely to be wrong?
39
In the past 1,$FWDI 24 hours, it fell 14.877%, the price is pinned at 6.042, and the funding rate is negative at -0.00022763. Looking only at this combination: the price is dropping and the funding rate is negative—shorts are paying longs. This means the bearish consensus is very crowded: shorts are heavily positioned, but maintaining a short position comes at a cost.
Why is it dropping so hard, yet shorts are still willing to pay to hold on? On-chain US stock contracts are tightly linked to traditional stock markets. A single-day liquidation of this magnitude is unlikely to be only a technical adjustment. More likely, it was triggered by a sudden shift in political policy expectations—such as potential regulatory tightening for relevant industries or changes to trade flows, including tariff adjustments—directly impacting the valuation of the target company’s future cash flows. Shorts are betting that worse news will materialize, so they’re paying a negative funding rate to hold their positions. But negative funding is reflexive: every 8 hours, shorts are skimmed a fee, and the patience of the position will eventually be worn down.
Right now, shorts are making money (the price is falling) while also bleeding (paying a negative funding rate). Next, either fresh bad news accelerates the sell-off so shorts’ profits can cover their funding costs, or the price stabilizes around the current level and shorts can’t bear the cost—leading them to cover, which could trigger a fast rebound. Open position volume is 47533.24; it’s not enormous, which suggests liquidity is average. Once either side starts a concentrated liquidation, price volatility will be amplified. If you’re a long, you’re catching a falling knife here—you’re betting that shorts will cover. If you’re short, you’ve made money, but the funding is negative, so you need to watch the news flow closely and react quickly.
My personal view is that with this kind of political-event-driven drop, the first wave of emotion-driven selloff usually isn’t the bottom. Shorts’ covering may cause a rebound, but as long as the underlying political-policy downside hasn’t been disproven or absorbed, the rebound will just provide shorts with better add-on levels. My plan is to wait to short after the rebound; I won’t chase shorts during the decline.
Specific parameters: Bearish direction, 3x leverage. Stop-loss at 6.5 (if price breaks above here, it means the strength of short covering is beyond expectation). Take-profit at 5.2. Position size: 10%. The invalidation condition is a strong bullish breakout above 6.5 and holding there. If that happens, I’ll concede and exit—meaning the political downside may have been reinterpreted by the market or already digested.
The strongest counter-evidence is if suddenly there’s good political news—for example tariff exemptions or stimulus policies—even if it’s only rumors. That could instantly ignite shorts’ covering and pull the price back quickly. Any potential good news that the market hasn’t priced in is the biggest risk for shorts.
Trading tag: #TradFi #链上美股 #FWDI
Where do you think this thesis is most likely to be wrong?
In the past 1,$FWDI 24 hours, it fell 14.877%, the price is pinned at 6.042, and the funding rate is negative at -0.00022763. Looking only at this combination: the price is dropping and the funding rate is negative—shorts are paying longs. This means the bearish consensus is very crowded: shorts are heavily positioned, but maintaining a short position comes at a cost.
Why is it dropping so hard, yet shorts are still willing to pay to hold on? On-chain US stock contracts are tightly linked to traditional stock markets. A single-day liquidation of this magnitude is unlikely to be only a technical adjustment. More likely, it was triggered by a sudden shift in political policy expectations—such as potential regulatory tightening for relevant industries or changes to trade flows, including tariff adjustments—directly impacting the valuation of the target company’s future cash flows. Shorts are betting that worse news will materialize, so they’re paying a negative funding rate to hold their positions. But negative funding is reflexive: every 8 hours, shorts are skimmed a fee, and the patience of the position will eventually be worn down.
Right now, shorts are making money (the price is falling) while also bleeding (paying a negative funding rate). Next, either fresh bad news accelerates the sell-off so shorts’ profits can cover their funding costs, or the price stabilizes around the current level and shorts can’t bear the cost—leading them to cover, which could trigger a fast rebound. Open position volume is 47533.24; it’s not enormous, which suggests liquidity is average. Once either side starts a concentrated liquidation, price volatility will be amplified. If you’re a long, you’re catching a falling knife here—you’re betting that shorts will cover. If you’re short, you’ve made money, but the funding is negative, so you need to watch the news flow closely and react quickly.
My personal view is that with this kind of political-event-driven drop, the first wave of emotion-driven selloff usually isn’t the bottom. Shorts’ covering may cause a rebound, but as long as the underlying political-policy downside hasn’t been disproven or absorbed, the rebound will just provide shorts with better add-on levels. My plan is to wait to short after the rebound; I won’t chase shorts during the decline.
Specific parameters: Bearish direction, 3x leverage. Stop-loss at 6.5 (if price breaks above here, it means the strength of short covering is beyond expectation). Take-profit at 5.2. Position size: 10%. The invalidation condition is a strong bullish breakout above 6.5 and holding there. If that happens, I’ll concede and exit—meaning the political downside may have been reinterpreted by the market or already digested.
The strongest counter-evidence is if suddenly there’s good political news—for example tariff exemptions or stimulus policies—even if it’s only rumors. That could instantly ignite shorts’ covering and pull the price back quickly. Any potential good news that the market hasn’t priced in is the biggest risk for shorts.
Trading tag: #TradFi #链上美股 #FWDI
Where do you think this thesis is most likely to be wrong?
Why is it dropping so hard, yet shorts are still willing to pay to hold on? On-chain US stock contracts are tightly linked to traditional stock markets. A single-day liquidation of this magnitude is unlikely to be only a technical adjustment. More likely, it was triggered by a sudden shift in political policy expectations—such as potential regulatory tightening for relevant industries or changes to trade flows, including tariff adjustments—directly impacting the valuation of the target company’s future cash flows. Shorts are betting that worse news will materialize, so they’re paying a negative funding rate to hold their positions. But negative funding is reflexive: every 8 hours, shorts are skimmed a fee, and the patience of the position will eventually be worn down.
Right now, shorts are making money (the price is falling) while also bleeding (paying a negative funding rate). Next, either fresh bad news accelerates the sell-off so shorts’ profits can cover their funding costs, or the price stabilizes around the current level and shorts can’t bear the cost—leading them to cover, which could trigger a fast rebound. Open position volume is 47533.24; it’s not enormous, which suggests liquidity is average. Once either side starts a concentrated liquidation, price volatility will be amplified. If you’re a long, you’re catching a falling knife here—you’re betting that shorts will cover. If you’re short, you’ve made money, but the funding is negative, so you need to watch the news flow closely and react quickly.
My personal view is that with this kind of political-event-driven drop, the first wave of emotion-driven selloff usually isn’t the bottom. Shorts’ covering may cause a rebound, but as long as the underlying political-policy downside hasn’t been disproven or absorbed, the rebound will just provide shorts with better add-on levels. My plan is to wait to short after the rebound; I won’t chase shorts during the decline.
Specific parameters: Bearish direction, 3x leverage. Stop-loss at 6.5 (if price breaks above here, it means the strength of short covering is beyond expectation). Take-profit at 5.2. Position size: 10%. The invalidation condition is a strong bullish breakout above 6.5 and holding there. If that happens, I’ll concede and exit—meaning the political downside may have been reinterpreted by the market or already digested.
The strongest counter-evidence is if suddenly there’s good political news—for example tariff exemptions or stimulus policies—even if it’s only rumors. That could instantly ignite shorts’ covering and pull the price back quickly. Any potential good news that the market hasn’t priced in is the biggest risk for shorts.
Trading tag: #TradFi #链上美股 #FWDI
Where do you think this thesis is most likely to be wrong?
24
Log in to explore more content
Join global crypto users on Binance Square
⚡️ Get latest and useful information about crypto.
💬 Trusted by the world’s largest crypto exchange.
👍 Discover real insights from verified creators.
Email / Phone number
Trending Topics
1
#AIStocksWhatNext
995,358 views
7,004 Discussing
2
#BitcoinRejectedAt$87,300Twice
0 views
0 Discussing
3
#BCHJumps28%OnCMEFuturesListing
22,513 views
655 Discussing
4
#WallStreetEarningsRevisionsTurnBearish
16,182 views
482 Discussing
5
#DollarIndexReclaims101
13,641 views
421 Discussing
6
#21SharesLaunchesEuropesFirstZcashETP
53,638 views
1,207 Discussing
7
#CardanoJoinsX402PaymentStandard
32,425 views
849 Discussing
8
#BitcoinTops$87KAtEightMonthHigh
14,151 views
135 Discussing
9
#ZECBreaksAbove$1600AtRecordHigh
9,926 views
108 Discussing
10
#BitwiseNEARStakingETPAssetsTop$100M
50,200 views
114 Discussing