
#aero
aero
870,859 views
6,388 Discussing
Hot
Latest

·
--
⚡ $AERO PUSHES $0.48 RESISTANCE AS BUYERS RECLAIM MOMENTUM FOR NEXT BREAKOUT! 💥
Entry: $0.470 - $0.480 ⚡
Target: $0.495 / $0.510 / $0.530 🚀
Stop Loss: $0.458 ⚠️
📌 After bouncing hard off the $0.44 demand zone, $AERO is knocking directly on the $0.48 resistance wall with increasing buy volume. 📊 The key trigger sits right at $0.485, where a clean structural reclaim shifts the local trend back into high gear.
💡 If buyers maintain control above this decision area, overhead liquidity up to $0.530 gets targeted rapidly. ⚡ Price action is coiling tight, setting up a sharp continuation window for alert traders. 💬 Are you front-running the $0.485 level or waiting for a confirmed breakout close? 👇
⚠️ Not financial advice. Always manage your risk. 🛡️
🏷️ #AERO #LongSetup #Breakout #Crypto #Altcoins
🔥 💎
⚡ $AERO PUSHES $0.48 RESISTANCE AS BUYERS RECLAIM MOMENTUM FOR NEXT BREAKOUT! 💥
Entry: $0.470 - $0.480 ⚡
Target: $0.495 / $0.510 / $0.530 🚀
Stop Loss: $0.458 ⚠️
📌 After bouncing hard off the $0.44 demand zone, $AERO is knocking directly on the $0.48 resistance wall with increasing buy volume. 📊 The key trigger sits right at $0.485, where a clean structural reclaim shifts the local trend back into high gear.
💡 If buyers maintain control above this decision area, overhead liquidity up to $0.530 gets targeted rapidly. ⚡ Price action is coiling tight, setting up a sharp continuation window for alert traders. 💬 Are you front-running the $0.485 level or waiting for a confirmed breakout close? 👇
⚠️ Not financial advice. Always manage your risk. 🛡️
🏷️ #AERO #LongSetup #Breakout #Crypto #Altcoins
🔥 💎
Entry: $0.470 - $0.480 ⚡
Target: $0.495 / $0.510 / $0.530 🚀
Stop Loss: $0.458 ⚠️
📌 After bouncing hard off the $0.44 demand zone, $AERO is knocking directly on the $0.48 resistance wall with increasing buy volume. 📊 The key trigger sits right at $0.485, where a clean structural reclaim shifts the local trend back into high gear.
💡 If buyers maintain control above this decision area, overhead liquidity up to $0.530 gets targeted rapidly. ⚡ Price action is coiling tight, setting up a sharp continuation window for alert traders. 💬 Are you front-running the $0.485 level or waiting for a confirmed breakout close? 👇
⚠️ Not financial advice. Always manage your risk. 🛡️
🏷️ #AERO #LongSetup #Breakout #Crypto #Altcoins
🔥 💎
16


$AERO: Liquidity Lessons from a Quiet Move
When a token trades inside its recent range and volume stays near baseline, the price action can feel uneventful, yet it offers a clear window into market liquidity. Imagine a bathtub with a faucet and a drain. The faucet represents buying pressure, the drain represents selling pressure, and the water level is the token price. If the drain is wide open (high liquidity), water can flow out quickly, keeping the level stable even when the faucet slows. Conversely, a narrow drain (low liquidity) means a small change in faucet flow can cause the water level to swing dramatically.
In the case of $AERO, the hourly direction is down while volume is not above baseline. This suggests that sellers are able to absorb buying interest without pushing price sharply upward, indicating a relatively deep order book on the downside. The spread between the best bid and ask may remain tight, allowing market orders to execute near the displayed price. Traders can test this by watching the spot turnover metric; a steady turnover despite low volume points to hidden liquidity that surfaces when price moves.
A practical way to reassess the situation is to place a small limit order just inside the current support level and observe how quickly it fills. If it disappears rapidly, the market possesses enough depth to support the move without large slippage. If it lingers, liquidity may be thin, and any larger order could cause a noticeable price shift.
Understanding this faucet‑drain analogy helps separate the token's price movement from its underlying market health, reminding traders that a calm candle can still reveal important liquidity dynamics. 🙂
Probabilistic market research, not a recommendation or guaranteed return.
Which crypto concept becomes clearer when you look at an actual chart?
#AERO #CryptoEducation #CryptoLearning
$AERO : Liquidity Lessons from a Quiet Move
When a token trades inside its recent range and volume stays near baseline, the price action can feel uneventful, yet it offers a clear window into market liquidity. Imagine a bathtub with a faucet and a drain. The faucet represents buying pressure, the drain represents selling pressure, and the water level is the token price. If the drain is wide open (high liquidity), water can flow out quickly, keeping the level stable even when the faucet slows. Conversely, a narrow drain (low liquidity) means a small change in faucet flow can cause the water level to swing dramatically.
In the case of $AERO , the hourly direction is down while volume is not above baseline. This suggests that sellers are able to absorb buying interest without pushing price sharply upward, indicating a relatively deep order book on the downside. The spread between the best bid and ask may remain tight, allowing market orders to execute near the displayed price. Traders can test this by watching the spot turnover metric; a steady turnover despite low volume points to hidden liquidity that surfaces when price moves.
A practical way to reassess the situation is to place a small limit order just inside the current support level and observe how quickly it fills. If it disappears rapidly, the market possesses enough depth to support the move without large slippage. If it lingers, liquidity may be thin, and any larger order could cause a noticeable price shift.
Understanding this faucet‑drain analogy helps separate the token's price movement from its underlying market health, reminding traders that a calm candle can still reveal important liquidity dynamics. 🙂
Probabilistic market research, not a recommendation or guaranteed return.
Which crypto concept becomes clearer when you look at an actual chart?
#AERO #CryptoEducation #CryptoLearning
When a token trades inside its recent range and volume stays near baseline, the price action can feel uneventful, yet it offers a clear window into market liquidity. Imagine a bathtub with a faucet and a drain. The faucet represents buying pressure, the drain represents selling pressure, and the water level is the token price. If the drain is wide open (high liquidity), water can flow out quickly, keeping the level stable even when the faucet slows. Conversely, a narrow drain (low liquidity) means a small change in faucet flow can cause the water level to swing dramatically.
In the case of $AERO , the hourly direction is down while volume is not above baseline. This suggests that sellers are able to absorb buying interest without pushing price sharply upward, indicating a relatively deep order book on the downside. The spread between the best bid and ask may remain tight, allowing market orders to execute near the displayed price. Traders can test this by watching the spot turnover metric; a steady turnover despite low volume points to hidden liquidity that surfaces when price moves.
A practical way to reassess the situation is to place a small limit order just inside the current support level and observe how quickly it fills. If it disappears rapidly, the market possesses enough depth to support the move without large slippage. If it lingers, liquidity may be thin, and any larger order could cause a noticeable price shift.
Understanding this faucet‑drain analogy helps separate the token's price movement from its underlying market health, reminding traders that a calm candle can still reveal important liquidity dynamics. 🙂
Probabilistic market research, not a recommendation or guaranteed return.
Which crypto concept becomes clearer when you look at an actual chart?
#AERO #CryptoEducation #CryptoLearning
26

🚨 $AERO PREPARES FOR AN EXPLOSIVE MOMENTUM FLIP AFTER COILING AT DEMAND! 💥
Entry: 0.470 - 0.482 ⚡
Target: 0.530 🚀
Stop Loss: 0.458 ⚠️
Buyers are aggressively defending the 0.470 demand zone, absorbing sell-side pressure while forming a tight consolidation base. 📊 Order flow points toward a classic liquidity trap, setting the stage for a swift push back into higher structural levels. ⚡
With risk strictly capped beneath the 0.458 support pivot, this setup delivers a high-conviction risk-to-reward window for momentum expansion. 💡 Are you taking the bid inside this accumulation zone or watching from the sidelines? 👇
⚠️ Not financial advice. Always manage your risk. 🛡️
🏷️ #AERO #LongSetup #Crypto #Breakout
🔥 💎
🚨 $AERO PREPARES FOR AN EXPLOSIVE MOMENTUM FLIP AFTER COILING AT DEMAND! 💥
Entry: 0.470 - 0.482 ⚡
Target: 0.530 🚀
Stop Loss: 0.458 ⚠️
Buyers are aggressively defending the 0.470 demand zone, absorbing sell-side pressure while forming a tight consolidation base. 📊 Order flow points toward a classic liquidity trap, setting the stage for a swift push back into higher structural levels. ⚡
With risk strictly capped beneath the 0.458 support pivot, this setup delivers a high-conviction risk-to-reward window for momentum expansion. 💡 Are you taking the bid inside this accumulation zone or watching from the sidelines? 👇
⚠️ Not financial advice. Always manage your risk. 🛡️
🏷️ #AERO #LongSetup #Crypto #Breakout
🔥 💎
Entry: 0.470 - 0.482 ⚡
Target: 0.530 🚀
Stop Loss: 0.458 ⚠️
Buyers are aggressively defending the 0.470 demand zone, absorbing sell-side pressure while forming a tight consolidation base. 📊 Order flow points toward a classic liquidity trap, setting the stage for a swift push back into higher structural levels. ⚡
With risk strictly capped beneath the 0.458 support pivot, this setup delivers a high-conviction risk-to-reward window for momentum expansion. 💡 Are you taking the bid inside this accumulation zone or watching from the sidelines? 👇
⚠️ Not financial advice. Always manage your risk. 🛡️
🏷️ #AERO #LongSetup #Crypto #Breakout
🔥 💎
5

·
--
🚀 $AERO : Is This the Next Big DeFi Opportunity?
Aerodrome is attracting attention, and I'm watching $AERO closely.
The big question is: Can AERO surprise the market with a strong comeback?
📊 Are buyers preparing for a new move, or is another correction coming?
🔥 BULLISH or BEARISH? What's your target for AERO?
Let's discuss!
#AERO #Aerodrome #DeFi #Crypto #BinanceSquare
{spot}(AEROUSDT)
🚀 $AERO : Is This the Next Big DeFi Opportunity?
Aerodrome is attracting attention, and I'm watching $AERO closely.
The big question is: Can AERO surprise the market with a strong comeback?
📊 Are buyers preparing for a new move, or is another correction coming?
🔥 BULLISH or BEARISH? What's your target for AERO?
Let's discuss!
#AERO #Aerodrome #DeFi #Crypto #BinanceSquare
Aerodrome is attracting attention, and I'm watching $AERO closely.
The big question is: Can AERO surprise the market with a strong comeback?
📊 Are buyers preparing for a new move, or is another correction coming?
🔥 BULLISH or BEARISH? What's your target for AERO?
Let's discuss!
#AERO #Aerodrome #DeFi #Crypto #BinanceSquare

1
1
112

·
--
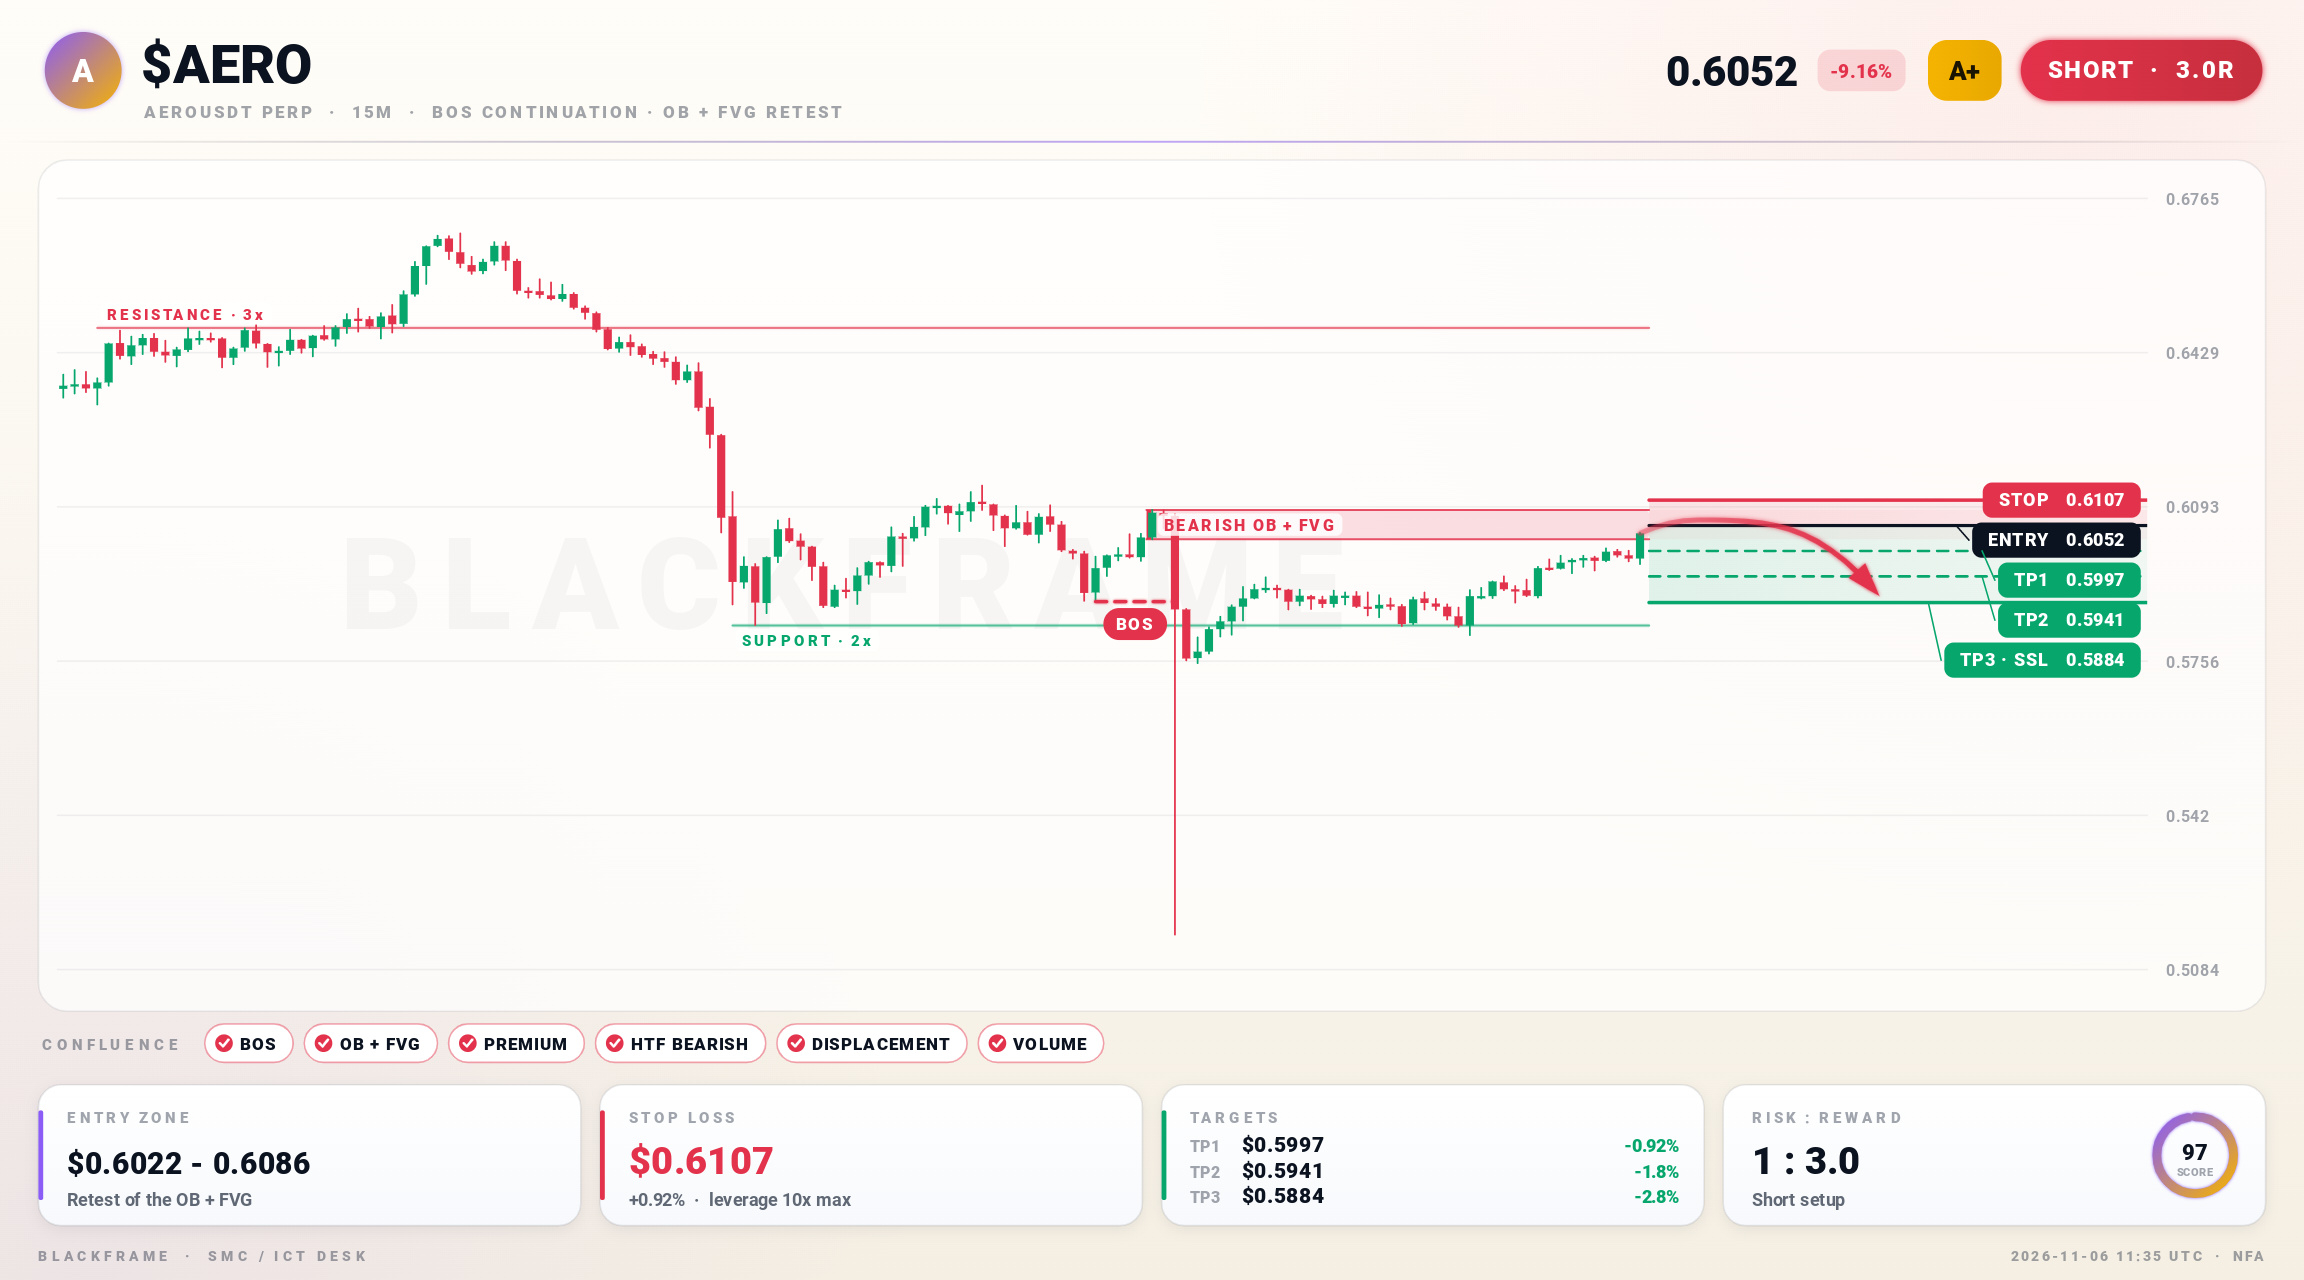
⚡ $AERO turns bearish on premium sell
SHORT · 15M
Entry: $0.6022 - $0.6052
TP1: $0.5997
TP2: $0.5941
TP3: $0.5884
SL: $0.6107
BOS on the 15M confirms downtrend, OB and FVG stack at $0.6022-0.6086. HTF bias aligns, volume expanded confirming strength. Target is sell-side liquidity at $0.5884; stop at $0.6107.
#AERO #ICT · NFA
⚡ $AERO turns bearish on premium sell
SHORT · 15M
Entry: $0.6022 - $0.6052
TP1: $0.5997
TP2: $0.5941
TP3: $0.5884
SL: $0.6107
BOS on the 15M confirms downtrend, OB and FVG stack at $0.6022-0.6086. HTF bias aligns, volume expanded confirming strength. Target is sell-side liquidity at $0.5884; stop at $0.6107.
#AERO #ICT · NFA
SHORT · 15M
Entry: $0.6022 - $0.6052
TP1: $0.5997
TP2: $0.5941
TP3: $0.5884
SL: $0.6107
BOS on the 15M confirms downtrend, OB and FVG stack at $0.6022-0.6086. HTF bias aligns, volume expanded confirming strength. Target is sell-side liquidity at $0.5884; stop at $0.6107.
#AERO #ICT · NFA
24

·
--
Ever notice how the DEX tokens bleed hardest on red days? $AERO is down 8.7% near $0.60 on $30M in volume, even though it's Base's biggest DEX and the name is back on the trending board. There's no fresh headline behind today's drop — it's the broad selloff doing the work, with $BTC down 5.3% near $75,990 and $ETH off 7.6% near $2,234. The merger hype from October has clearly cooled too: $AERO ran toward $0.94 then, and it's given back about a quarter since. The level I'm watching is $0.576, today's low — hold it and this starts to look like a washout worth watching; lose it and $0.50 is probably next. Are you treating $AERO as a Base bet on sale, or waiting for the tape to turn first?
#AERO #Base #BinanceSquare
Ever notice how the DEX tokens bleed hardest on red days? $AERO is down 8.7% near $0.60 on $30M in volume, even though it's Base's biggest DEX and the name is back on the trending board. There's no fresh headline behind today's drop — it's the broad selloff doing the work, with $BTC down 5.3% near $75,990 and $ETH off 7.6% near $2,234. The merger hype from October has clearly cooled too: $AERO ran toward $0.94 then, and it's given back about a quarter since. The level I'm watching is $0.576, today's low — hold it and this starts to look like a washout worth watching; lose it and $0.50 is probably next. Are you treating $AERO as a Base bet on sale, or waiting for the tape to turn first?
#AERO #Base #BinanceSquare
#AERO #Base #BinanceSquare
2

🚨 $AERO BUYERS PRESSURING KEY RESISTANCE AT 0.5127 FOR AN EXPLOSIVE MOMENTUM EXPANSION! 💥
Entry: 0.5000 - 0.5070 ⚡
Target: 0.5200 - 0.5650 🚀
Stop Loss: 0.4820 ⚠️
$AERO is hovering right below the critical $0.5127 breakout pivot while order flow shows steady bid accumulation at daily highs. 📌 The $0.5000 demand shelf continues to defend aggressively against every minor pullback, signaling sellers are running out of ammo.
📊 If buyers push cleanly through resistance, momentum velocity favors a swift expansion straight toward upper liquidity pools. 💡 Traders are watching this tight compression carefully as the risk-to-reward profile remains exceptionally clean. 💬 Are you positioning early before $0.5127 flips, or waiting for confirmed high-volume continuation? 👇
⚠️ Not financial advice. Always manage your risk. 🛡️
🏷️ #AERO #LongSetup #Crypto #Breakout #Altcoins
🔥 ⚡
🚨 $AERO BUYERS PRESSURING KEY RESISTANCE AT 0.5127 FOR AN EXPLOSIVE MOMENTUM EXPANSION! 💥
Entry: 0.5000 - 0.5070 ⚡
Target: 0.5200 - 0.5650 🚀
Stop Loss: 0.4820 ⚠️
$AERO is hovering right below the critical $0.5127 breakout pivot while order flow shows steady bid accumulation at daily highs. 📌 The $0.5000 demand shelf continues to defend aggressively against every minor pullback, signaling sellers are running out of ammo.
📊 If buyers push cleanly through resistance, momentum velocity favors a swift expansion straight toward upper liquidity pools. 💡 Traders are watching this tight compression carefully as the risk-to-reward profile remains exceptionally clean. 💬 Are you positioning early before $0.5127 flips, or waiting for confirmed high-volume continuation? 👇
⚠️ Not financial advice. Always manage your risk. 🛡️
🏷️ #AERO #LongSetup #Crypto #Breakout #Altcoins
🔥 ⚡
Entry: 0.5000 - 0.5070 ⚡
Target: 0.5200 - 0.5650 🚀
Stop Loss: 0.4820 ⚠️
$AERO is hovering right below the critical $0.5127 breakout pivot while order flow shows steady bid accumulation at daily highs. 📌 The $0.5000 demand shelf continues to defend aggressively against every minor pullback, signaling sellers are running out of ammo.
📊 If buyers push cleanly through resistance, momentum velocity favors a swift expansion straight toward upper liquidity pools. 💡 Traders are watching this tight compression carefully as the risk-to-reward profile remains exceptionally clean. 💬 Are you positioning early before $0.5127 flips, or waiting for confirmed high-volume continuation? 👇
⚠️ Not financial advice. Always manage your risk. 🛡️
🏷️ #AERO #LongSetup #Crypto #Breakout #Altcoins
🔥 ⚡
6

·
--
⚡ $AERO PREPARES FOR CONTINUATION AS BUYERS DEFEND CRITICAL RANGE SUPPORT! 🚀
Entry: 0.5206 ⚡
Target: 0.544714 🚀
Stop Loss: 0.511557 ⚠️
📌 Buyers continue to aggressively defend this localized demand pocket, signaling heavy absorption of seller pressure across recent dips. 📊 Patience pays here—letting the order flow confirm around our entry zone ensures high-conviction execution rather than recklessly chasing momentum into overhead supply.
💡 A clean structural reclaim across this range sets up a smooth runway toward higher price targets. 💬 Are you waiting for confirmation to print first, or bidding the support sweep early? 👇
⚠️ Not financial advice. Always manage your risk. 🛡️
🏷️ #AERO #LongSetup #Altcoins #Crypto
🔥 💎
⚡ $AERO PREPARES FOR CONTINUATION AS BUYERS DEFEND CRITICAL RANGE SUPPORT! 🚀
Entry: 0.5206 ⚡
Target: 0.544714 🚀
Stop Loss: 0.511557 ⚠️
📌 Buyers continue to aggressively defend this localized demand pocket, signaling heavy absorption of seller pressure across recent dips. 📊 Patience pays here—letting the order flow confirm around our entry zone ensures high-conviction execution rather than recklessly chasing momentum into overhead supply.
💡 A clean structural reclaim across this range sets up a smooth runway toward higher price targets. 💬 Are you waiting for confirmation to print first, or bidding the support sweep early? 👇
⚠️ Not financial advice. Always manage your risk. 🛡️
🏷️ #AERO #LongSetup #Altcoins #Crypto
🔥 💎
Entry: 0.5206 ⚡
Target: 0.544714 🚀
Stop Loss: 0.511557 ⚠️
📌 Buyers continue to aggressively defend this localized demand pocket, signaling heavy absorption of seller pressure across recent dips. 📊 Patience pays here—letting the order flow confirm around our entry zone ensures high-conviction execution rather than recklessly chasing momentum into overhead supply.
💡 A clean structural reclaim across this range sets up a smooth runway toward higher price targets. 💬 Are you waiting for confirmation to print first, or bidding the support sweep early? 👇
⚠️ Not financial advice. Always manage your risk. 🛡️
🏷️ #AERO #LongSetup #Altcoins #Crypto
🔥 💎
4
·
--
⚡ $AERO MOMENTUM ACCELERATING AS BULLS STEP UP TO DEFEND THE DEMAND RECLAIM! 💥
Entry: $0.510 - $0.518 ⚡
Target: $0.540 🚀
Stop Loss: $0.495 ⚠️
Buyers are aggressively absorbing sell pressure across the $0.510 demand pocket, laying the groundwork for a swift expansion leg upward. 📊 Lower timeframes display a clean market structure reclaim with steady buy-side volume stepping in.
Order flow points directly toward an immediate liquidity sweep targeting the $0.540 resistance block, keeping downside risk tightly capped right below $0.495. 🔍 The risk-to-reward ratio here offers exceptional alignment for momentum traders. 💬 Are you bidding this demand retest early or waiting for a clean breakout candle above resistance? 👇
⚠️ Not financial advice. Always manage your risk. 🛡️
🏷️ #AERO #LongSetup #Breakout #Crypto
🔥 ⚡
⚡ $AERO MOMENTUM ACCELERATING AS BULLS STEP UP TO DEFEND THE DEMAND RECLAIM! 💥
Entry: $0.510 - $0.518 ⚡
Target: $0.540 🚀
Stop Loss: $0.495 ⚠️
Buyers are aggressively absorbing sell pressure across the $0.510 demand pocket, laying the groundwork for a swift expansion leg upward. 📊 Lower timeframes display a clean market structure reclaim with steady buy-side volume stepping in.
Order flow points directly toward an immediate liquidity sweep targeting the $0.540 resistance block, keeping downside risk tightly capped right below $0.495. 🔍 The risk-to-reward ratio here offers exceptional alignment for momentum traders. 💬 Are you bidding this demand retest early or waiting for a clean breakout candle above resistance? 👇
⚠️ Not financial advice. Always manage your risk. 🛡️
🏷️ #AERO #LongSetup #Breakout #Crypto
🔥 ⚡
Entry: $0.510 - $0.518 ⚡
Target: $0.540 🚀
Stop Loss: $0.495 ⚠️
Buyers are aggressively absorbing sell pressure across the $0.510 demand pocket, laying the groundwork for a swift expansion leg upward. 📊 Lower timeframes display a clean market structure reclaim with steady buy-side volume stepping in.
Order flow points directly toward an immediate liquidity sweep targeting the $0.540 resistance block, keeping downside risk tightly capped right below $0.495. 🔍 The risk-to-reward ratio here offers exceptional alignment for momentum traders. 💬 Are you bidding this demand retest early or waiting for a clean breakout candle above resistance? 👇
⚠️ Not financial advice. Always manage your risk. 🛡️
🏷️ #AERO #LongSetup #Breakout #Crypto
🔥 ⚡
11
$AERO: Why the Volume Spike Ended Inside the Old Range
When $AERO prints an hourly candle that closes higher yet stays inside the prior recorded range, the obvious question is whether buyers have actually taken control or simply paused at resistance. The volume reading above baseline suggests real money showed up, but the price failed to break out. That combination is the clue: participation arrived, yet the ceiling held.
One reading is accumulation. Traders may be absorbing supply near the top of the range, preparing a cleaner break on a retest. In this view the close inside the range is not failure; it is a deliberate pause that lets late sellers exit before the next leg. The alternative is distribution. The same volume could mark profit-taking by earlier longs who use the liquidity to exit without crashing price. A close back inside the range would then be a failed breakout, not a base.
What would weaken the accumulation case? A second hourly candle that prints lower highs on declining volume, or a daily close below the range midpoint. What would weaken the distribution case? A tight consolidation just under resistance followed by a decisive close above it on expanding volume. Neither scenario is confirmed yet. The next session decides which story survives.
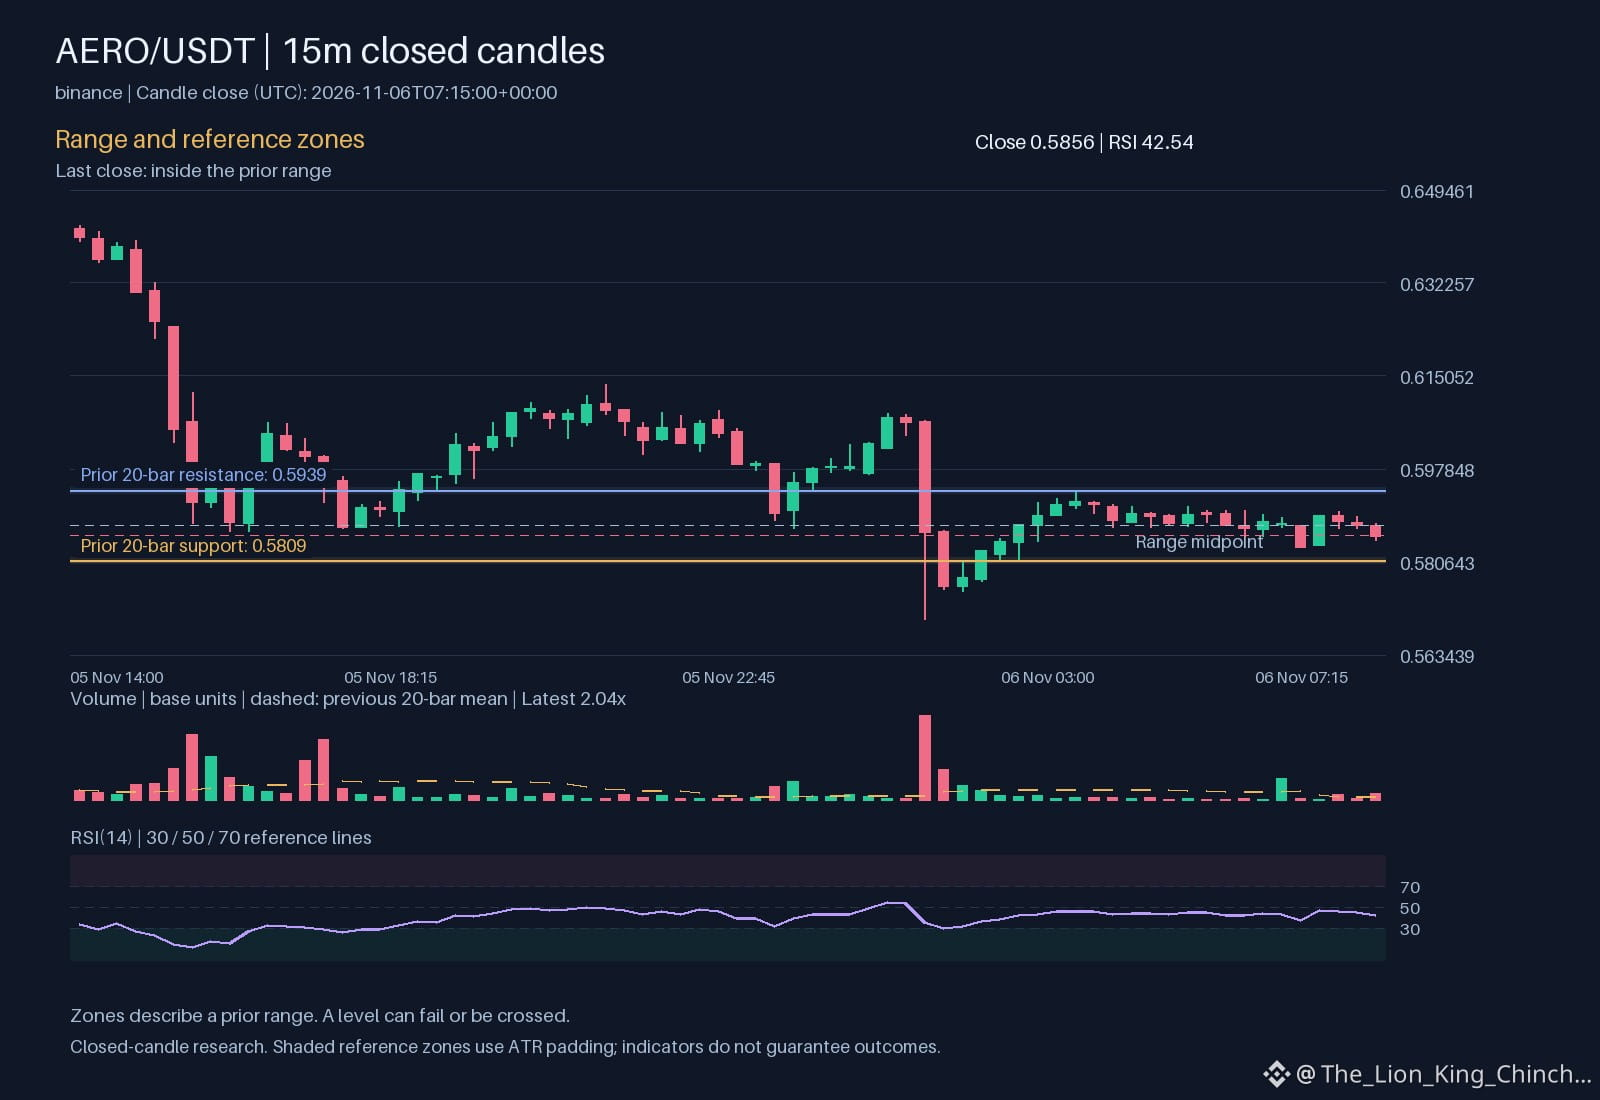
For now the only fact is a higher close with above-baseline volume trapped inside a known range. Watch the next candle’s close relative to 0.5939 and volume relative to the current spike. That single comparison tells more than any oscillator.
Probabilistic market research, not a recommendation or guaranteed return.
What would convince you: a clean close or a patient retest?
#AERO
Binance spot proof for $AERO: closed price 0.5856 USDT.
Source: binance. Closed candle: 2026-11-06T07:15:00+00:00.
$AERO : Why the Volume Spike Ended Inside the Old Range
When $AERO prints an hourly candle that closes higher yet stays inside the prior recorded range, the obvious question is whether buyers have actually taken control or simply paused at resistance. The volume reading above baseline suggests real money showed up, but the price failed to break out. That combination is the clue: participation arrived, yet the ceiling held.
One reading is accumulation. Traders may be absorbing supply near the top of the range, preparing a cleaner break on a retest. In this view the close inside the range is not failure; it is a deliberate pause that lets late sellers exit before the next leg. The alternative is distribution. The same volume could mark profit-taking by earlier longs who use the liquidity to exit without crashing price. A close back inside the range would then be a failed breakout, not a base.
What would weaken the accumulation case? A second hourly candle that prints lower highs on declining volume, or a daily close below the range midpoint. What would weaken the distribution case? A tight consolidation just under resistance followed by a decisive close above it on expanding volume. Neither scenario is confirmed yet. The next session decides which story survives.
For now the only fact is a higher close with above-baseline volume trapped inside a known range. Watch the next candle’s close relative to 0.5939 and volume relative to the current spike. That single comparison tells more than any oscillator.
Probabilistic market research, not a recommendation or guaranteed return.
What would convince you: a clean close or a patient retest?
#AERO
Binance spot proof for $AERO : closed price 0.5856 USDT.
Source: binance. Closed candle: 2026-11-06T07:15:00+00:00.
When $AERO prints an hourly candle that closes higher yet stays inside the prior recorded range, the obvious question is whether buyers have actually taken control or simply paused at resistance. The volume reading above baseline suggests real money showed up, but the price failed to break out. That combination is the clue: participation arrived, yet the ceiling held.
One reading is accumulation. Traders may be absorbing supply near the top of the range, preparing a cleaner break on a retest. In this view the close inside the range is not failure; it is a deliberate pause that lets late sellers exit before the next leg. The alternative is distribution. The same volume could mark profit-taking by earlier longs who use the liquidity to exit without crashing price. A close back inside the range would then be a failed breakout, not a base.
What would weaken the accumulation case? A second hourly candle that prints lower highs on declining volume, or a daily close below the range midpoint. What would weaken the distribution case? A tight consolidation just under resistance followed by a decisive close above it on expanding volume. Neither scenario is confirmed yet. The next session decides which story survives.
For now the only fact is a higher close with above-baseline volume trapped inside a known range. Watch the next candle’s close relative to 0.5939 and volume relative to the current spike. That single comparison tells more than any oscillator.
Probabilistic market research, not a recommendation or guaranteed return.
What would convince you: a clean close or a patient retest?
#AERO
Binance spot proof for $AERO : closed price 0.5856 USDT.
Source: binance. Closed candle: 2026-11-06T07:15:00+00:00.
27
⚡ $AERO BREAKS CONSOLIDATION AS BUYERS ACCELERATE TOWARD THE $0.55 BREAKOUT ZONE! 💥
Entry: 0.525 - 0.540 ⚡
Target: 0.550 - 0.600 🚀
Stop Loss: 0.505 ⚠️
📌 The 4H market structure on $AERO has turned aggressively bullish after buyers flipped the key $0.50 pivot into solid demand support. Order flow is accelerating near $0.538 as bids push aggressively toward the immediate $0.550 resistance ceiling. 📊
💡 A sustained clearance above $0.550 opens up clear skies for a swift upside expansion toward $0.600. The momentum engine is firing, favoring disciplined setups while the trend continues to build. 💬 Are you riding this 4H continuation move or waiting for a retest of support? 👇
⚠️ Not financial advice. Always manage your risk. 🛡️
🏷️ #AERO #Breakout #Altcoins #CryptoTrading #Momentum
🔥 💎
⚡ $AERO BREAKS CONSOLIDATION AS BUYERS ACCELERATE TOWARD THE $0.55 BREAKOUT ZONE! 💥
Entry: 0.525 - 0.540 ⚡
Target: 0.550 - 0.600 🚀
Stop Loss: 0.505 ⚠️
📌 The 4H market structure on $AERO has turned aggressively bullish after buyers flipped the key $0.50 pivot into solid demand support. Order flow is accelerating near $0.538 as bids push aggressively toward the immediate $0.550 resistance ceiling. 📊
💡 A sustained clearance above $0.550 opens up clear skies for a swift upside expansion toward $0.600. The momentum engine is firing, favoring disciplined setups while the trend continues to build. 💬 Are you riding this 4H continuation move or waiting for a retest of support? 👇
⚠️ Not financial advice. Always manage your risk. 🛡️
🏷️ #AERO #Breakout #Altcoins #CryptoTrading #Momentum
🔥 💎
Entry: 0.525 - 0.540 ⚡
Target: 0.550 - 0.600 🚀
Stop Loss: 0.505 ⚠️
📌 The 4H market structure on $AERO has turned aggressively bullish after buyers flipped the key $0.50 pivot into solid demand support. Order flow is accelerating near $0.538 as bids push aggressively toward the immediate $0.550 resistance ceiling. 📊
💡 A sustained clearance above $0.550 opens up clear skies for a swift upside expansion toward $0.600. The momentum engine is firing, favoring disciplined setups while the trend continues to build. 💬 Are you riding this 4H continuation move or waiting for a retest of support? 👇
⚠️ Not financial advice. Always manage your risk. 🛡️
🏷️ #AERO #Breakout #Altcoins #CryptoTrading #Momentum
🔥 💎
2

$AERO RECLAIMS CRITICAL BREAKOUT ZONE AS INSTITUTIONAL BUYBACKS SPARK EXPLOSIVE MOMENTUM! 🚀 💥
Entry: 0.515 - 0.535 ⚡
Target: 0.680 🚀
Stop Loss: 0.475 ⚠️
Bulls are forcefully pushing $AERO past the critical 0.533 pivot, turning previous resistance into a solid launching pad. 📊 The immediate demand is being accelerated by a 325K protocol buyback, creating a massive liquidity buffer that front-runs incoming retail momentum.
Momentum indicators are screaming strength as moving averages align in a textbook bullish stack. ⚡ As long as buyers defend the 0.515 floor, clearing the 0.560 threshold triggers a clear runway toward upper expansion targets. 💡 Are you riding this momentum wave or waiting for a pull-back retest to load up? 👇
⚠️ Not financial advice. Always manage your risk. 🛡️
🏷️ #AERO #Breakout #Crypto #BullishSetup #Altcoins
🔥 💎
$AERO RECLAIMS CRITICAL BREAKOUT ZONE AS INSTITUTIONAL BUYBACKS SPARK EXPLOSIVE MOMENTUM! 🚀 💥
Entry: 0.515 - 0.535 ⚡
Target: 0.680 🚀
Stop Loss: 0.475 ⚠️
Bulls are forcefully pushing $AERO past the critical 0.533 pivot, turning previous resistance into a solid launching pad. 📊 The immediate demand is being accelerated by a 325K protocol buyback, creating a massive liquidity buffer that front-runs incoming retail momentum.
Momentum indicators are screaming strength as moving averages align in a textbook bullish stack. ⚡ As long as buyers defend the 0.515 floor, clearing the 0.560 threshold triggers a clear runway toward upper expansion targets. 💡 Are you riding this momentum wave or waiting for a pull-back retest to load up? 👇
⚠️ Not financial advice. Always manage your risk. 🛡️
🏷️ #AERO #Breakout #Crypto #BullishSetup #Altcoins
🔥 💎
Entry: 0.515 - 0.535 ⚡
Target: 0.680 🚀
Stop Loss: 0.475 ⚠️
Bulls are forcefully pushing $AERO past the critical 0.533 pivot, turning previous resistance into a solid launching pad. 📊 The immediate demand is being accelerated by a 325K protocol buyback, creating a massive liquidity buffer that front-runs incoming retail momentum.
Momentum indicators are screaming strength as moving averages align in a textbook bullish stack. ⚡ As long as buyers defend the 0.515 floor, clearing the 0.560 threshold triggers a clear runway toward upper expansion targets. 💡 Are you riding this momentum wave or waiting for a pull-back retest to load up? 👇
⚠️ Not financial advice. Always manage your risk. 🛡️
🏷️ #AERO #Breakout #Crypto #BullishSetup #Altcoins
🔥 💎
5
🚨 $AERO COIL COMPRESSION BREAKOUT IS IGNITING WITH INSANE 4H VOLUME! 💥
Entry: $0.515 - $0.530 ⚡
Target: $0.543 - $0.575 - $0.610 🚀
Stop Loss: $0.495 ⚠️
📌 Smart money has been quietly absorbing supply during this tight squeeze, and the 4H candle structure just unleashed a massive volume expansion through key resistance. 📊 Market makers are positioning for a swift liquidity run as order flow violently flips upward.
⚡ Momentum is rapidly compounding while price coils tightly near local highs, leaving zero room for late bidders once velocity takes over. 💬 Are you bidding this reclaim early or chasing the breakout after momentum clears resistance? 👇
⚠️ Not financial advice. Always manage your risk. 🛡️
🏷️ #AERO #LongSetup #Breakout #Altcoins
🔥 ⚡
🚨 $AERO COIL COMPRESSION BREAKOUT IS IGNITING WITH INSANE 4H VOLUME! 💥
Entry: $0.515 - $0.530 ⚡
Target: $0.543 - $0.575 - $0.610 🚀
Stop Loss: $0.495 ⚠️
📌 Smart money has been quietly absorbing supply during this tight squeeze, and the 4H candle structure just unleashed a massive volume expansion through key resistance. 📊 Market makers are positioning for a swift liquidity run as order flow violently flips upward.
⚡ Momentum is rapidly compounding while price coils tightly near local highs, leaving zero room for late bidders once velocity takes over. 💬 Are you bidding this reclaim early or chasing the breakout after momentum clears resistance? 👇
⚠️ Not financial advice. Always manage your risk. 🛡️
🏷️ #AERO #LongSetup #Breakout #Altcoins
🔥 ⚡
Entry: $0.515 - $0.530 ⚡
Target: $0.543 - $0.575 - $0.610 🚀
Stop Loss: $0.495 ⚠️
📌 Smart money has been quietly absorbing supply during this tight squeeze, and the 4H candle structure just unleashed a massive volume expansion through key resistance. 📊 Market makers are positioning for a swift liquidity run as order flow violently flips upward.
⚡ Momentum is rapidly compounding while price coils tightly near local highs, leaving zero room for late bidders once velocity takes over. 💬 Are you bidding this reclaim early or chasing the breakout after momentum clears resistance? 👇
⚠️ Not financial advice. Always manage your risk. 🛡️
🏷️ #AERO #LongSetup #Breakout #Altcoins
🔥 ⚡
20
🔥 $AERO BREAKS OUT AS DEV BUYBACK TRIGGERS INSANE BUYING MOMENTUM! 🚀
Entry: 0.515 - 0.535 ⚡
Target: 0.560 - 0.680 🚀
Stop Loss: 0.475 ⚠️
Buy-side pressure on $AERO is surging following a crisp technical breakout and a textbook retest of the demand block. 🦈 Smart money catalysts are fully active here after dev deployed a 325k $AERO buyback directly into order books, driving volume into high gear.
📊 Momentum is shifting aggressively upward as buyers step in heavily to defend this newly flipped support zone. ⚡ With structural resistance reclaimed, the runway toward higher target liquidity looks exceptionally clean for this continuation expansion. 💬 Are you bidding this pristine retest or waiting for higher confirmation? 👇
⚠️ Not financial advice. Always manage your risk. 🛡️
🏷️ #AERO #LongSetup #Breakout #Crypto
🔥 💎
🔥 $AERO BREAKS OUT AS DEV BUYBACK TRIGGERS INSANE BUYING MOMENTUM! 🚀
Entry: 0.515 - 0.535 ⚡
Target: 0.560 - 0.680 🚀
Stop Loss: 0.475 ⚠️
Buy-side pressure on $AERO is surging following a crisp technical breakout and a textbook retest of the demand block. 🦈 Smart money catalysts are fully active here after dev deployed a 325k $AERO buyback directly into order books, driving volume into high gear.
📊 Momentum is shifting aggressively upward as buyers step in heavily to defend this newly flipped support zone. ⚡ With structural resistance reclaimed, the runway toward higher target liquidity looks exceptionally clean for this continuation expansion. 💬 Are you bidding this pristine retest or waiting for higher confirmation? 👇
⚠️ Not financial advice. Always manage your risk. 🛡️
🏷️ #AERO #LongSetup #Breakout #Crypto
🔥 💎
Entry: 0.515 - 0.535 ⚡
Target: 0.560 - 0.680 🚀
Stop Loss: 0.475 ⚠️
Buy-side pressure on $AERO is surging following a crisp technical breakout and a textbook retest of the demand block. 🦈 Smart money catalysts are fully active here after dev deployed a 325k $AERO buyback directly into order books, driving volume into high gear.
📊 Momentum is shifting aggressively upward as buyers step in heavily to defend this newly flipped support zone. ⚡ With structural resistance reclaimed, the runway toward higher target liquidity looks exceptionally clean for this continuation expansion. 💬 Are you bidding this pristine retest or waiting for higher confirmation? 👇
⚠️ Not financial advice. Always manage your risk. 🛡️
🏷️ #AERO #LongSetup #Breakout #Crypto
🔥 💎
6
·
--
🔥 $AERO BULLS PRESSURE $0.57 BREAKOUT ZONE AS INSTITUTIONAL VOLUME SPIKES! 🚀
Entry: 0.5500 - 0.5620 ⚡
Target: 0.5800 - 0.6500 🚀
Stop Loss: 0.5350 ⚠️
Buyers are stepping up aggressively at the 0.55 demand shelf, turning previous sell-side pressure into a springboard. 📊 High-conviction volume is pouring in, setting up a classic liquidity expansion phase.
A decisive reclaim and close above 0.5714 unlocks the runway toward 0.60 and beyond, leaving late short positions caught off guard. ⚡ Downside risk remains cleanly defined right below the consolidation pivot.
💡 Are you riding this momentum flip early, or waiting for the 0.5714 level to crack wide open? 👇
⚠️ Not financial advice. Always manage your risk. 🛡️
🏷️ #AERO #LongSetup #Breakout #Crypto
🔥 💎
🔥 $AERO BULLS PRESSURE $0.57 BREAKOUT ZONE AS INSTITUTIONAL VOLUME SPIKES! 🚀
Entry: 0.5500 - 0.5620 ⚡
Target: 0.5800 - 0.6500 🚀
Stop Loss: 0.5350 ⚠️
Buyers are stepping up aggressively at the 0.55 demand shelf, turning previous sell-side pressure into a springboard. 📊 High-conviction volume is pouring in, setting up a classic liquidity expansion phase.
A decisive reclaim and close above 0.5714 unlocks the runway toward 0.60 and beyond, leaving late short positions caught off guard. ⚡ Downside risk remains cleanly defined right below the consolidation pivot.
💡 Are you riding this momentum flip early, or waiting for the 0.5714 level to crack wide open? 👇
⚠️ Not financial advice. Always manage your risk. 🛡️
🏷️ #AERO #LongSetup #Breakout #Crypto
🔥 💎
Entry: 0.5500 - 0.5620 ⚡
Target: 0.5800 - 0.6500 🚀
Stop Loss: 0.5350 ⚠️
Buyers are stepping up aggressively at the 0.55 demand shelf, turning previous sell-side pressure into a springboard. 📊 High-conviction volume is pouring in, setting up a classic liquidity expansion phase.
A decisive reclaim and close above 0.5714 unlocks the runway toward 0.60 and beyond, leaving late short positions caught off guard. ⚡ Downside risk remains cleanly defined right below the consolidation pivot.
💡 Are you riding this momentum flip early, or waiting for the 0.5714 level to crack wide open? 👇
⚠️ Not financial advice. Always manage your risk. 🛡️
🏷️ #AERO #LongSetup #Breakout #Crypto
🔥 💎
4
·
--
🚨 $AERO PREPARES FOR EXPANSION BUT SMART MONEY WAITS FOR CONFIRMATION! 🦈
Entry: 0.5529 - 0.5557 ⚡
Target: 0.5829 - 0.6056 🚀
Stop Loss: 0.5297 ⚠️
Buyers are quietly building structural momentum on the 1H timeframe, keeping $AERO firmly anchored in a constructive bullish alignment. Price action is holding steady above local support as order flow shifts in favor of the bid side. 📊
However, disciplined execution demands waiting for proper confirmation. With statistical metrics sitting just under active execution thresholds, this remains strictly a high-priority watchlist play. 💡 Stalking clear volume expansion before entry ensures trading alongside institutional momentum rather than front-running incomplete setups. 🔍
Are you keeping $AERO on your radar for a confirmed breakout or building an early position? 👇
⚠️ Not financial advice. Always manage your risk. 🛡️
🏷️ #AERO #Altcoins #CryptoTrading #Watchlist
🎯 🦈
🚨 $AERO PREPARES FOR EXPANSION BUT SMART MONEY WAITS FOR CONFIRMATION! 🦈
Entry: 0.5529 - 0.5557 ⚡
Target: 0.5829 - 0.6056 🚀
Stop Loss: 0.5297 ⚠️
Buyers are quietly building structural momentum on the 1H timeframe, keeping $AERO firmly anchored in a constructive bullish alignment. Price action is holding steady above local support as order flow shifts in favor of the bid side. 📊
However, disciplined execution demands waiting for proper confirmation. With statistical metrics sitting just under active execution thresholds, this remains strictly a high-priority watchlist play. 💡 Stalking clear volume expansion before entry ensures trading alongside institutional momentum rather than front-running incomplete setups. 🔍
Are you keeping $AERO on your radar for a confirmed breakout or building an early position? 👇
⚠️ Not financial advice. Always manage your risk. 🛡️
🏷️ #AERO #Altcoins #CryptoTrading #Watchlist
🎯 🦈
Entry: 0.5529 - 0.5557 ⚡
Target: 0.5829 - 0.6056 🚀
Stop Loss: 0.5297 ⚠️
Buyers are quietly building structural momentum on the 1H timeframe, keeping $AERO firmly anchored in a constructive bullish alignment. Price action is holding steady above local support as order flow shifts in favor of the bid side. 📊
However, disciplined execution demands waiting for proper confirmation. With statistical metrics sitting just under active execution thresholds, this remains strictly a high-priority watchlist play. 💡 Stalking clear volume expansion before entry ensures trading alongside institutional momentum rather than front-running incomplete setups. 🔍
Are you keeping $AERO on your radar for a confirmed breakout or building an early position? 👇
⚠️ Not financial advice. Always manage your risk. 🛡️
🏷️ #AERO #Altcoins #CryptoTrading #Watchlist
🎯 🦈
2
THREE CONVERGING TECHNICAL SIGNALS ARE PINPOINTING A MAJOR $AERO BREAKOUT ZONE! 💥 ⚡
Entry: 0.549 - 0.555 ⚡
Target: 0.5716 - 0.5782 🚀
Stop Loss: 0.538 ⚠️
📌 A rare confluence of three distinct technical signals is clustering directly inside the 0.549-0.555 demand pocket. Sellers are losing momentum fast, but the real momentum activates once buyers secure a clean 1H level reclaim of 0.5633. 📊
💡 As long as 0.538 holds firm as our structural line in the sand, order flow points straight toward an expansion into upper resistance targets. 🎯
💬 Are you front-running this key demand zone or waiting for the reclaim confirmation first? 👇
⚠️ Not financial advice. Always manage your risk. 🛡️
🏷️ #AERO #LongSetup #Crypto #Altcoins #Trading
🔥 💎
THREE CONVERGING TECHNICAL SIGNALS ARE PINPOINTING A MAJOR $AERO BREAKOUT ZONE! 💥 ⚡
Entry: 0.549 - 0.555 ⚡
Target: 0.5716 - 0.5782 🚀
Stop Loss: 0.538 ⚠️
📌 A rare confluence of three distinct technical signals is clustering directly inside the 0.549-0.555 demand pocket. Sellers are losing momentum fast, but the real momentum activates once buyers secure a clean 1H level reclaim of 0.5633. 📊
💡 As long as 0.538 holds firm as our structural line in the sand, order flow points straight toward an expansion into upper resistance targets. 🎯
💬 Are you front-running this key demand zone or waiting for the reclaim confirmation first? 👇
⚠️ Not financial advice. Always manage your risk. 🛡️
🏷️ #AERO #LongSetup #Crypto #Altcoins #Trading
🔥 💎
Entry: 0.549 - 0.555 ⚡
Target: 0.5716 - 0.5782 🚀
Stop Loss: 0.538 ⚠️
📌 A rare confluence of three distinct technical signals is clustering directly inside the 0.549-0.555 demand pocket. Sellers are losing momentum fast, but the real momentum activates once buyers secure a clean 1H level reclaim of 0.5633. 📊
💡 As long as 0.538 holds firm as our structural line in the sand, order flow points straight toward an expansion into upper resistance targets. 🎯
💬 Are you front-running this key demand zone or waiting for the reclaim confirmation first? 👇
⚠️ Not financial advice. Always manage your risk. 🛡️
🏷️ #AERO #LongSetup #Crypto #Altcoins #Trading
🔥 💎
12

·
--
🔻 $AERO SHORT 🔻
Entry: 0.57726 – 0.58074
SL: 0.60782
TP1: 0.55430
TP2: 0.53783
TP3: 0.51724
📈 Technical Outlook:
$AERO is showing bearish pressure after losing strength near a key technical zone. The setup is supported by EMA trend is bearish, price is breaking below recent support, volume confirms stronger pressure. As long as price stays below the entry area, sellers may continue pushing toward the listed downside targets.
#AERO #Crypto #BinanceSquare #Trading
🔻 $AERO SHORT 🔻
Entry: 0.57726 – 0.58074
SL: 0.60782
TP1: 0.55430
TP2: 0.53783
TP3: 0.51724
📈 Technical Outlook:
$AERO is showing bearish pressure after losing strength near a key technical zone. The setup is supported by EMA trend is bearish, price is breaking below recent support, volume confirms stronger pressure. As long as price stays below the entry area, sellers may continue pushing toward the listed downside targets.
#AERO #Crypto #BinanceSquare #Trading
Entry: 0.57726 – 0.58074
SL: 0.60782
TP1: 0.55430
TP2: 0.53783
TP3: 0.51724
📈 Technical Outlook:
$AERO is showing bearish pressure after losing strength near a key technical zone. The setup is supported by EMA trend is bearish, price is breaking below recent support, volume confirms stronger pressure. As long as price stays below the entry area, sellers may continue pushing toward the listed downside targets.
#AERO #Crypto #BinanceSquare #Trading

29
🚨 $AERO REJECTS KEY OVERHEAD LIQUIDITY AS SELLERS PREPARE A DOWNWARD SWEEP! 📉
Entry: 0.5425 - 0.5453 ⚡
Target: 0.5095 🎯
Stop Loss: 0.5598 ⚠️
Sellers just slammed the door on $AERO near 0.5450, leaving aggressive buyers trapped after a clear upside rejection. Short-term order flow has rotated downward as supply continues to cap every recovery attempt. 📉
Losing this current entry zone confirms the lower-high market structure, opening a clean slide straight into the key demand target at 0.5095. 🔍 As long as resistance holds, bear momentum dominates this setup. 🐻
💬 Are you riding this short down to target or waiting for a bid at support? 👇
⚠️ Not financial advice. Always manage your risk. 🛡️
🏷️ #AERO #ShortSetup #Bearish #Altcoins #Crypto
🐻 🔻
🚨 $AERO REJECTS KEY OVERHEAD LIQUIDITY AS SELLERS PREPARE A DOWNWARD SWEEP! 📉
Entry: 0.5425 - 0.5453 ⚡
Target: 0.5095 🎯
Stop Loss: 0.5598 ⚠️
Sellers just slammed the door on $AERO near 0.5450, leaving aggressive buyers trapped after a clear upside rejection. Short-term order flow has rotated downward as supply continues to cap every recovery attempt. 📉
Losing this current entry zone confirms the lower-high market structure, opening a clean slide straight into the key demand target at 0.5095. 🔍 As long as resistance holds, bear momentum dominates this setup. 🐻
💬 Are you riding this short down to target or waiting for a bid at support? 👇
⚠️ Not financial advice. Always manage your risk. 🛡️
🏷️ #AERO #ShortSetup #Bearish #Altcoins #Crypto
🐻 🔻
Entry: 0.5425 - 0.5453 ⚡
Target: 0.5095 🎯
Stop Loss: 0.5598 ⚠️
Sellers just slammed the door on $AERO near 0.5450, leaving aggressive buyers trapped after a clear upside rejection. Short-term order flow has rotated downward as supply continues to cap every recovery attempt. 📉
Losing this current entry zone confirms the lower-high market structure, opening a clean slide straight into the key demand target at 0.5095. 🔍 As long as resistance holds, bear momentum dominates this setup. 🐻
💬 Are you riding this short down to target or waiting for a bid at support? 👇
⚠️ Not financial advice. Always manage your risk. 🛡️
🏷️ #AERO #ShortSetup #Bearish #Altcoins #Crypto
🐻 🔻
1
$AERO: Why Shared Moves Mislead
Look at $AERO. Current data places price 0.62381 below support 0.62968. The hourly direction is down, and volume is 2.23669. This setup creates a specific tension for traders watching the tape.
Now compare this to $ETH and $POL. Both show hourly direction down with volume above baseline. Seeing three assets move down together feels like a connected event. It is not necessarily. A shared direction on a watchlist does not prove capital rotation or common cause. It only confirms that all three are red at this moment.
The real question is how the move holds. Volume above baseline confirms participation, but it does not define the destination. If $AERO breaks resistance 0.66448, the volume signal strengthens. If it fails, the drop may continue. The RSI is 21.5641 and ATR is 0.00467204, showing volatility levels. These metrics help gauge speed, not direction.
Do not mistake a leaderboard for a cause. The peers are context, not a forecast. A valid reassessment requires waiting for price to accept a new level. Watch if $AERO closes above 0.646828. If it does not, the downward bias remains. The market provides clues, but it does not give answers. Your job is to test the hypothesis with small, realistic steps.
Probabilistic market research, not a recommendation or guaranteed return.
The comparison to keep in mind: $ETH has hourly direction down and volume above its baseline; $POL has hourly direction down and volume above its baseline. This alone does not establish correlation.
Which matters more in this comparison: direction or how the move holds?
#AERO #ETH #POL #CryptoWatchlist
$AERO : Why Shared Moves Mislead
Look at $AERO . Current data places price 0.62381 below support 0.62968. The hourly direction is down, and volume is 2.23669. This setup creates a specific tension for traders watching the tape.
Now compare this to $ETH and $POL . Both show hourly direction down with volume above baseline. Seeing three assets move down together feels like a connected event. It is not necessarily. A shared direction on a watchlist does not prove capital rotation or common cause. It only confirms that all three are red at this moment.
The real question is how the move holds. Volume above baseline confirms participation, but it does not define the destination. If $AERO breaks resistance 0.66448, the volume signal strengthens. If it fails, the drop may continue. The RSI is 21.5641 and ATR is 0.00467204, showing volatility levels. These metrics help gauge speed, not direction.
Do not mistake a leaderboard for a cause. The peers are context, not a forecast. A valid reassessment requires waiting for price to accept a new level. Watch if $AERO closes above 0.646828. If it does not, the downward bias remains. The market provides clues, but it does not give answers. Your job is to test the hypothesis with small, realistic steps.
Probabilistic market research, not a recommendation or guaranteed return.
The comparison to keep in mind: $ETH has hourly direction down and volume above its baseline; $POL has hourly direction down and volume above its baseline. This alone does not establish correlation.
Which matters more in this comparison: direction or how the move holds?
#AERO #ETH #POL #CryptoWatchlist
Look at $AERO . Current data places price 0.62381 below support 0.62968. The hourly direction is down, and volume is 2.23669. This setup creates a specific tension for traders watching the tape.
Now compare this to $ETH and $POL . Both show hourly direction down with volume above baseline. Seeing three assets move down together feels like a connected event. It is not necessarily. A shared direction on a watchlist does not prove capital rotation or common cause. It only confirms that all three are red at this moment.
The real question is how the move holds. Volume above baseline confirms participation, but it does not define the destination. If $AERO breaks resistance 0.66448, the volume signal strengthens. If it fails, the drop may continue. The RSI is 21.5641 and ATR is 0.00467204, showing volatility levels. These metrics help gauge speed, not direction.
Do not mistake a leaderboard for a cause. The peers are context, not a forecast. A valid reassessment requires waiting for price to accept a new level. Watch if $AERO closes above 0.646828. If it does not, the downward bias remains. The market provides clues, but it does not give answers. Your job is to test the hypothesis with small, realistic steps.
Probabilistic market research, not a recommendation or guaranteed return.
The comparison to keep in mind: $ETH has hourly direction down and volume above its baseline; $POL has hourly direction down and volume above its baseline. This alone does not establish correlation.
Which matters more in this comparison: direction or how the move holds?
#AERO #ETH #POL #CryptoWatchlist
28
Log in to explore more content
Join global crypto users on Binance Square
⚡️ Get latest and useful information about crypto.
💬 Trusted by the world’s largest crypto exchange.
👍 Discover real insights from verified creators.
Email / Phone number
Trending Topics
1
#BitcoinRebounds$75KAsChipsLead
889 views
35 Discussing
2
#JobsReportRaisesHikeOdds
37,226 views
593 Discussing
3
#US Data Center Rules May Constrain AI Expansion
5,415 views
65 Discussing
4
#$2TWipedOutHedgeFundsFaceLiquidation
8,891 views
77 Discussing
5
#WillAnthropicListOnTime
1,772 views
89 Discussing
6
#USNovemberMichiganExpectationsIndexPrelimAt50.9
7,211 views
197 Discussing
7
#OilPlungesBelow$100
8,870 views
31 Discussing
8
#TradFiForBeginners
2,761 views
103 Discussing
9
#USMidtermsCouldShakeUpUS-IranTies
22,085 views
371 Discussing
10
#RussianCentralBankNamesBTCETHUSDTForNonQualifiedInvestors
330 views
4 Discussing