
#djt
djt
244,359 views
491 Discussing
Hot
Latest

·
--
Bullish
🚨 $TRUMP MEDIA'S BTC MOVE SHAKES THE CRYPTO MARKET! ⚠️
Trump Media ($DJT ) reportedly moved 4,259 BTC worth hundreds of millions to Crypto.com
nearly 30% of its Bitcoin holdings!
👀 Is a massive sell-off coming, or just a wallet transfer?
With political pressure rising, traders are watching every move!
Is this another warning sign for Bitcoin? 📉
#BTC #Bitcoin #DJT
{future}(DJTUSDT)
{spot}(TRUMPUSDT)
🚨 $TRUMP MEDIA'S BTC MOVE SHAKES THE CRYPTO MARKET! ⚠️
Trump Media ($DJT ) reportedly moved 4,259 BTC worth hundreds of millions to Crypto.com
nearly 30% of its Bitcoin holdings!
👀 Is a massive sell-off coming, or just a wallet transfer?
With political pressure rising, traders are watching every move!
Is this another warning sign for Bitcoin? 📉
#BTC #Bitcoin #DJT
Trump Media ($DJT ) reportedly moved 4,259 BTC worth hundreds of millions to Crypto.com
nearly 30% of its Bitcoin holdings!
👀 Is a massive sell-off coming, or just a wallet transfer?
With political pressure rising, traders are watching every move!
Is this another warning sign for Bitcoin? 📉
#BTC #Bitcoin #DJT

CRUPTO DOCTOR:
He is richer day by day and we are poor day by day
1
1
365

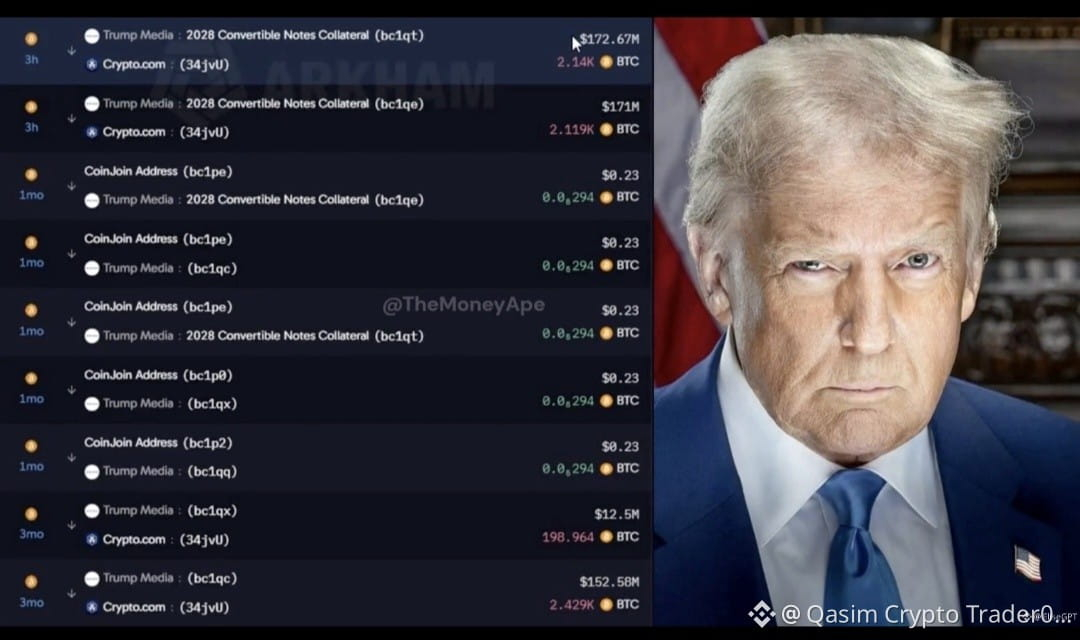
🧐 FACT CHECK: Did Trump Media $DJT Dump 4,259 BTC Because Democrats Won?
Transfer VERIFIED ✅ Nov 5 — 4,259 BTC (∼$343M) to Crypto.com in 2 txs: 2140.03 + 2119.31 BTC
That's ∼30% of their 14,139 BTC treasury
But here's the REAL context:
✔️ Funds labeled as "2028 Convertible Notes Collateral" — NOT sale
✔️ Nov 30 deadline: $1B convertible notes holders can demand cash back — Company may need to sell BTC if can't refinance
✔️ Same pattern in May & Aug — Previous moves to Crypto.com were called "custody/trading strategy" — not sales
✔️ This time coins moved to Crypto.com cold storage after 2 hrs — custody signal
Democrats DID win both House & Senate Nov 3-4, but no evidence this move is linked to investigation talk. Market actually surged after results: Dow +1100 points.
VERDICT: Custody move for financing, NOT confirmed market dump. Don't panic on exchange deposits.
What do you think — will they have to sell before Nov 30?
#TrumpMedia #BTC #DJT #CryptoNews #qasimcryptotrader007
$BTC $DJT
🧐 FACT CHECK: Did Trump Media $DJT Dump 4,259 BTC Because Democrats Won?
Transfer VERIFIED ✅ Nov 5 — 4,259 BTC (∼$343M) to Crypto.com in 2 txs: 2140.03 + 2119.31 BTC
That's ∼30% of their 14,139 BTC treasury
But here's the REAL context:
✔️ Funds labeled as "2028 Convertible Notes Collateral" — NOT sale
✔️ Nov 30 deadline: $1B convertible notes holders can demand cash back — Company may need to sell BTC if can't refinance
✔️ Same pattern in May & Aug — Previous moves to Crypto.com were called "custody/trading strategy" — not sales
✔️ This time coins moved to Crypto.com cold storage after 2 hrs — custody signal
Democrats DID win both House & Senate Nov 3-4, but no evidence this move is linked to investigation talk. Market actually surged after results: Dow +1100 points.
VERDICT: Custody move for financing, NOT confirmed market dump. Don't panic on exchange deposits.
What do you think — will they have to sell before Nov 30?
#TrumpMedia #BTC #DJT #CryptoNews #qasimcryptotrader007
$BTC $DJT
Transfer VERIFIED ✅ Nov 5 — 4,259 BTC (∼$343M) to Crypto.com in 2 txs: 2140.03 + 2119.31 BTC
That's ∼30% of their 14,139 BTC treasury
But here's the REAL context:
✔️ Funds labeled as "2028 Convertible Notes Collateral" — NOT sale
✔️ Nov 30 deadline: $1B convertible notes holders can demand cash back — Company may need to sell BTC if can't refinance
✔️ Same pattern in May & Aug — Previous moves to Crypto.com were called "custody/trading strategy" — not sales
✔️ This time coins moved to Crypto.com cold storage after 2 hrs — custody signal
Democrats DID win both House & Senate Nov 3-4, but no evidence this move is linked to investigation talk. Market actually surged after results: Dow +1100 points.
VERDICT: Custody move for financing, NOT confirmed market dump. Don't panic on exchange deposits.
What do you think — will they have to sell before Nov 30?
#TrumpMedia #BTC #DJT #CryptoNews #qasimcryptotrader007
$BTC $DJT
1
2
153

TRADFI MEETS 24/7 LEVERAGE AS $DJT AND $MRNA PERPETUAL CONTRACTS GO LIVE! 🚨 ⚡
The boundary between traditional markets and crypto liquidity just collapsed further. 🏦 Major equity plays like $DJT and $MRNA are stepping into the 24/7 arena with up to 20x leverage and USDT settlement.
Volatility traders get round-the-clock access to Wall Street narratives without waiting for market open bells. 📊 With max funding caps set at 2%, expect high-velocity positioning as crypto capital tests these traditional tickers. 💡
Will you be trading equity momentum on weekends or staying strictly on crypto native charts? 👇
⚠️ Not financial advice. Always manage your risk. 🛡️
🏷️ #DJT #TradFi #Perpetuals #Futures #Crypto
⚡ 🎯
TRADFI MEETS 24/7 LEVERAGE AS $DJT AND $MRNA PERPETUAL CONTRACTS GO LIVE! 🚨 ⚡
The boundary between traditional markets and crypto liquidity just collapsed further. 🏦 Major equity plays like $DJT and $MRNA are stepping into the 24/7 arena with up to 20x leverage and USDT settlement.
Volatility traders get round-the-clock access to Wall Street narratives without waiting for market open bells. 📊 With max funding caps set at 2%, expect high-velocity positioning as crypto capital tests these traditional tickers. 💡
Will you be trading equity momentum on weekends or staying strictly on crypto native charts? 👇
⚠️ Not financial advice. Always manage your risk. 🛡️
🏷️ #DJT #TradFi #Perpetuals #Futures #Crypto
⚡ 🎯
The boundary between traditional markets and crypto liquidity just collapsed further. 🏦 Major equity plays like $DJT and $MRNA are stepping into the 24/7 arena with up to 20x leverage and USDT settlement.
Volatility traders get round-the-clock access to Wall Street narratives without waiting for market open bells. 📊 With max funding caps set at 2%, expect high-velocity positioning as crypto capital tests these traditional tickers. 💡
Will you be trading equity momentum on weekends or staying strictly on crypto native charts? 👇
⚠️ Not financial advice. Always manage your risk. 🛡️
🏷️ #DJT #TradFi #Perpetuals #Futures #Crypto
⚡ 🎯
9

·
--
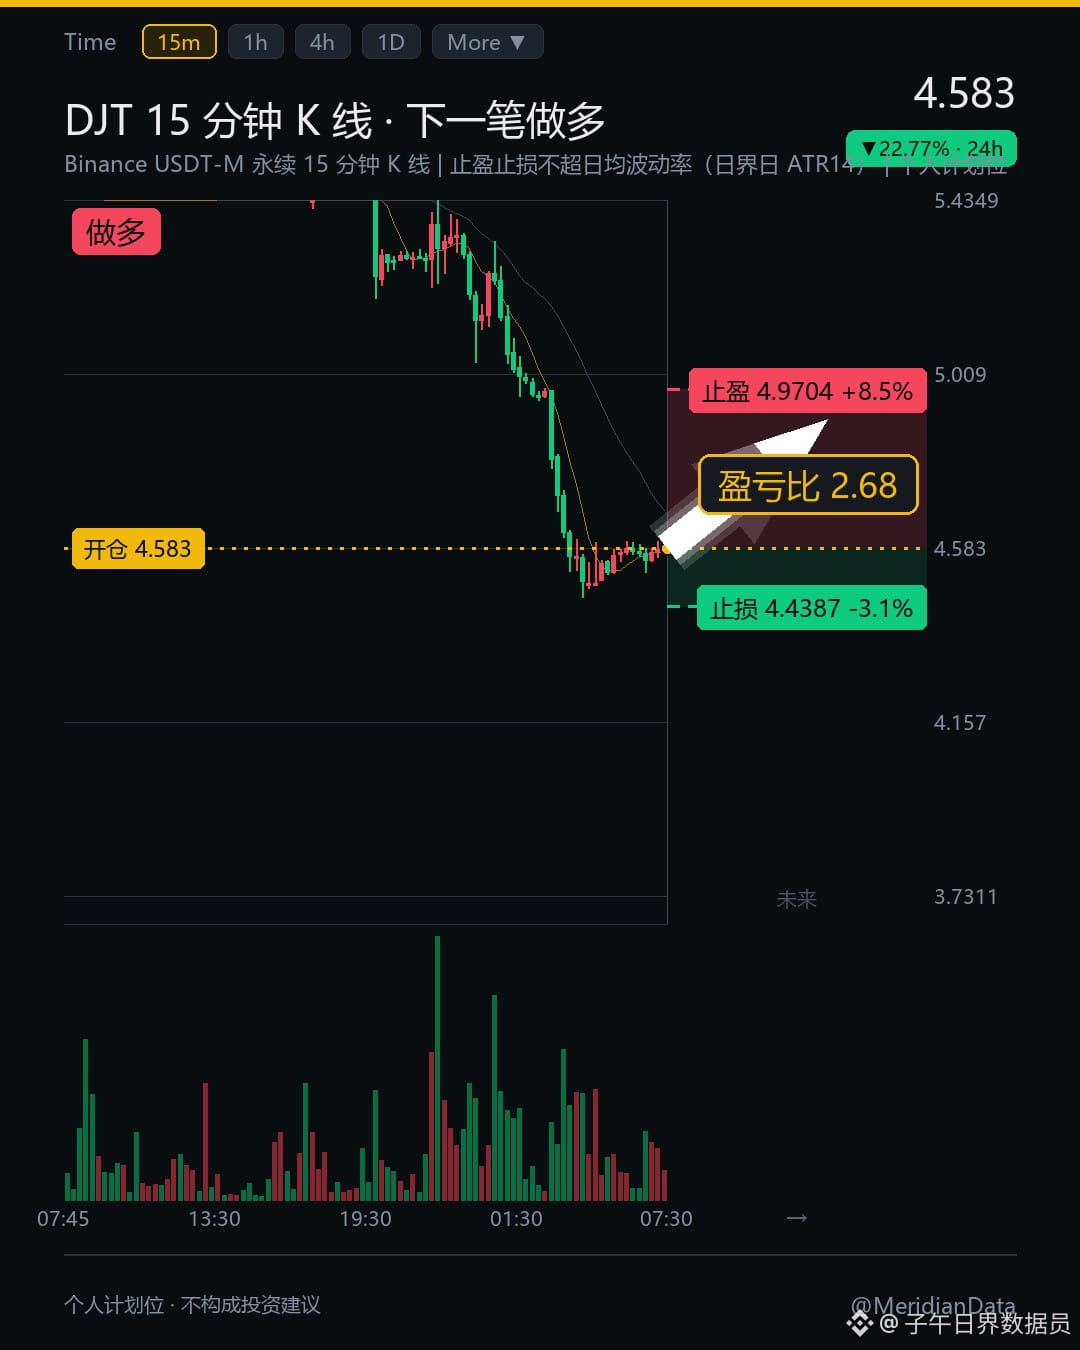
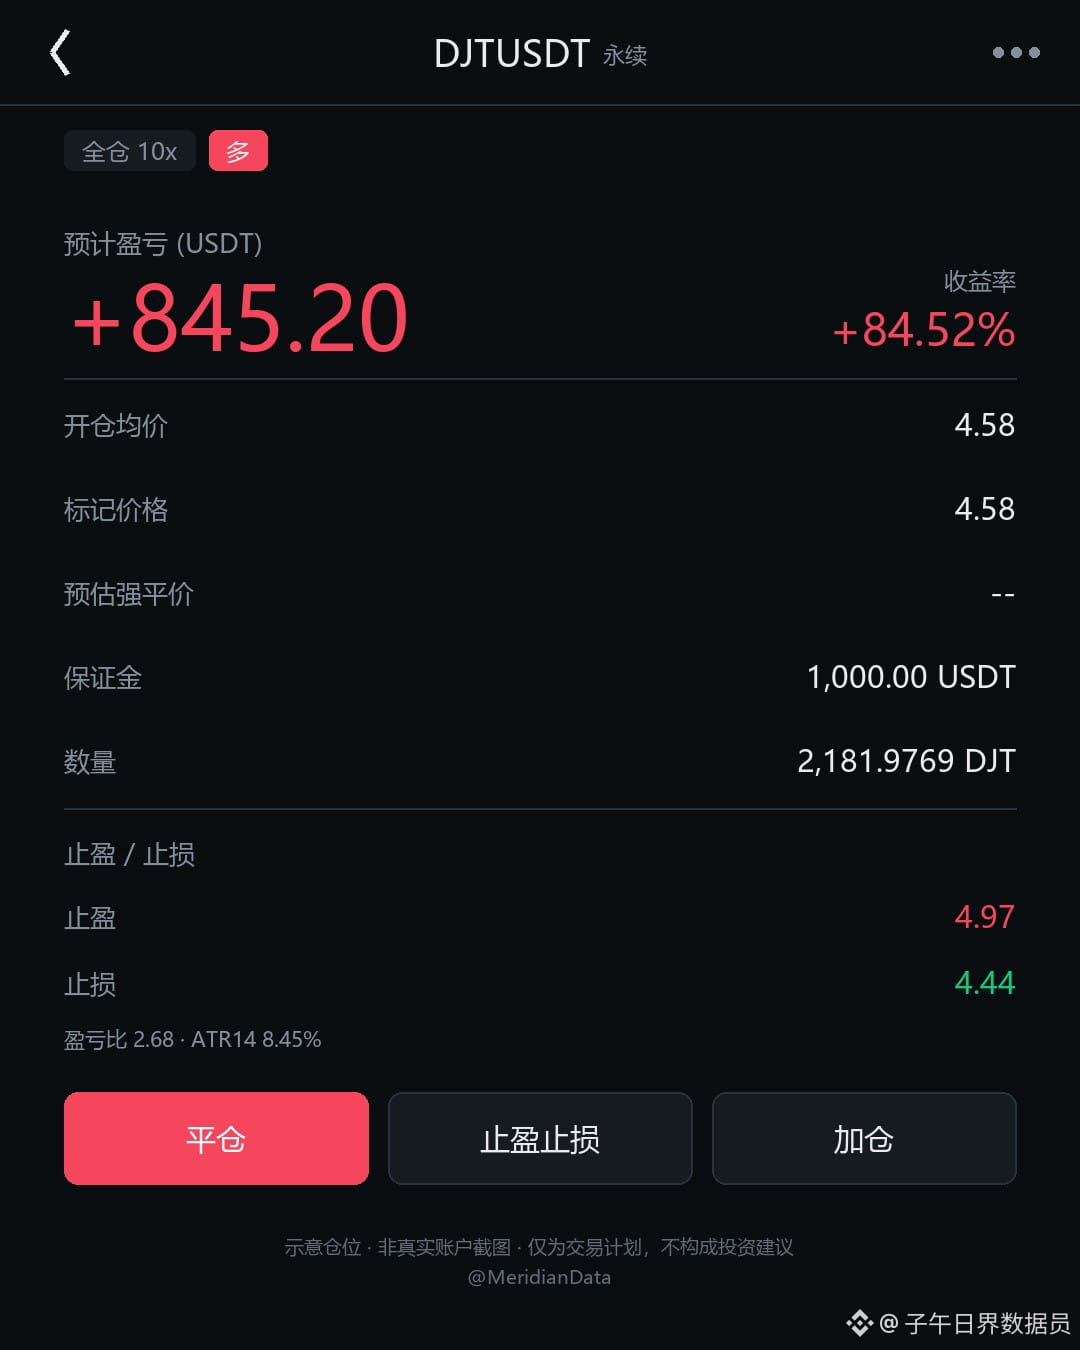
Everyone, I want to open a large long position on $DJT .
Take profit: 4.9704
Stop loss: 4.4387 👇
{future}(DJTUSDT)
You may be wondering the obvious question: why am I going long here?
First, let’s look at the setup. The latest 15-minute candle closed at 4.583. The take-profit is set at 4.9704, +8.45% from the current price; the stop-loss is set at 4.4387, -3.15% from the current price. That gives this trade a risk-reward ratio of about 2.68.
The average daily volatility is 8.45%. Both the take-profit and stop-loss are within that range—this is a hard rule I set for myself.
Now let’s look at how far it has fallen. The 20-day range is 4.461 to 7.125, and the current price is only at the 4.6th percentile. It has fallen 18.36% over the past seven days.
I had to check that drop twice before I believed it.
Falling from the high of 7.125 to 4.583 is like opening a reservoir gate: water flows out easily, but refilling it means waiting for rain upstream.
This isn’t confidence that a reversal is coming; it’s that the price is cheap enough.
The 4.461 line is the 20-day low. I’m waiting just above it. If the stop gets triggered, the loss is clear; if it holds, there’s room for a bounce.
The overhead supply hasn’t eased, and we’ll need to watch the support below for another couple of days. Those two things will determine how high it can bounce.
Liquidity in small-cap coins dries up at night, so the stop-loss needs to be relatively tight to make sure I can get out.
For the broader market, I’m only watching $BTC and $ETH, but the position size for this trade is based on its own 15-minute chart.
What do you think of the stop-loss distance?
#DJT #FOCO #Cryptocurrency
The above is a record of my personal trading system and data observations, and does not constitute investment advice.
Everyone, I want to open a large long position on $DJT .
Take profit: 4.9704
Stop loss: 4.4387 👇
You may be wondering the obvious question: why am I going long here?
First, let’s look at the setup. The latest 15-minute candle closed at 4.583. The take-profit is set at 4.9704, +8.45% from the current price; the stop-loss is set at 4.4387, -3.15% from the current price. That gives this trade a risk-reward ratio of about 2.68.
The average daily volatility is 8.45%. Both the take-profit and stop-loss are within that range—this is a hard rule I set for myself.
Now let’s look at how far it has fallen. The 20-day range is 4.461 to 7.125, and the current price is only at the 4.6th percentile. It has fallen 18.36% over the past seven days.
I had to check that drop twice before I believed it.
Falling from the high of 7.125 to 4.583 is like opening a reservoir gate: water flows out easily, but refilling it means waiting for rain upstream.
This isn’t confidence that a reversal is coming; it’s that the price is cheap enough.
The 4.461 line is the 20-day low. I’m waiting just above it. If the stop gets triggered, the loss is clear; if it holds, there’s room for a bounce.
The overhead supply hasn’t eased, and we’ll need to watch the support below for another couple of days. Those two things will determine how high it can bounce.
Liquidity in small-cap coins dries up at night, so the stop-loss needs to be relatively tight to make sure I can get out.
For the broader market, I’m only watching $BTC and $ETH , but the position size for this trade is based on its own 15-minute chart.
What do you think of the stop-loss distance?
#DJT #FOCO #Cryptocurrency
The above is a record of my personal trading system and data observations, and does not constitute investment advice.
Take profit: 4.9704
Stop loss: 4.4387 👇
You may be wondering the obvious question: why am I going long here?
First, let’s look at the setup. The latest 15-minute candle closed at 4.583. The take-profit is set at 4.9704, +8.45% from the current price; the stop-loss is set at 4.4387, -3.15% from the current price. That gives this trade a risk-reward ratio of about 2.68.
The average daily volatility is 8.45%. Both the take-profit and stop-loss are within that range—this is a hard rule I set for myself.
Now let’s look at how far it has fallen. The 20-day range is 4.461 to 7.125, and the current price is only at the 4.6th percentile. It has fallen 18.36% over the past seven days.
I had to check that drop twice before I believed it.
Falling from the high of 7.125 to 4.583 is like opening a reservoir gate: water flows out easily, but refilling it means waiting for rain upstream.
This isn’t confidence that a reversal is coming; it’s that the price is cheap enough.
The 4.461 line is the 20-day low. I’m waiting just above it. If the stop gets triggered, the loss is clear; if it holds, there’s room for a bounce.
The overhead supply hasn’t eased, and we’ll need to watch the support below for another couple of days. Those two things will determine how high it can bounce.
Liquidity in small-cap coins dries up at night, so the stop-loss needs to be relatively tight to make sure I can get out.
For the broader market, I’m only watching $BTC and $ETH , but the position size for this trade is based on its own 15-minute chart.
What do you think of the stop-loss distance?
#DJT #FOCO #Cryptocurrency
The above is a record of my personal trading system and data observations, and does not constitute investment advice.
1
240

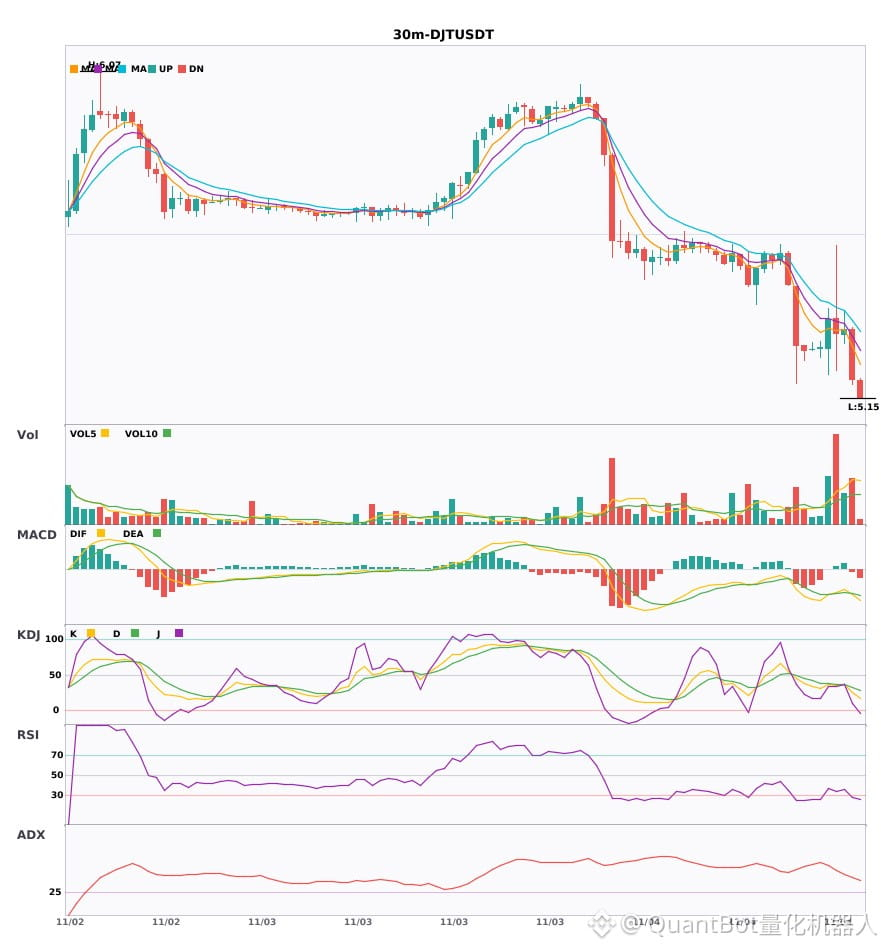
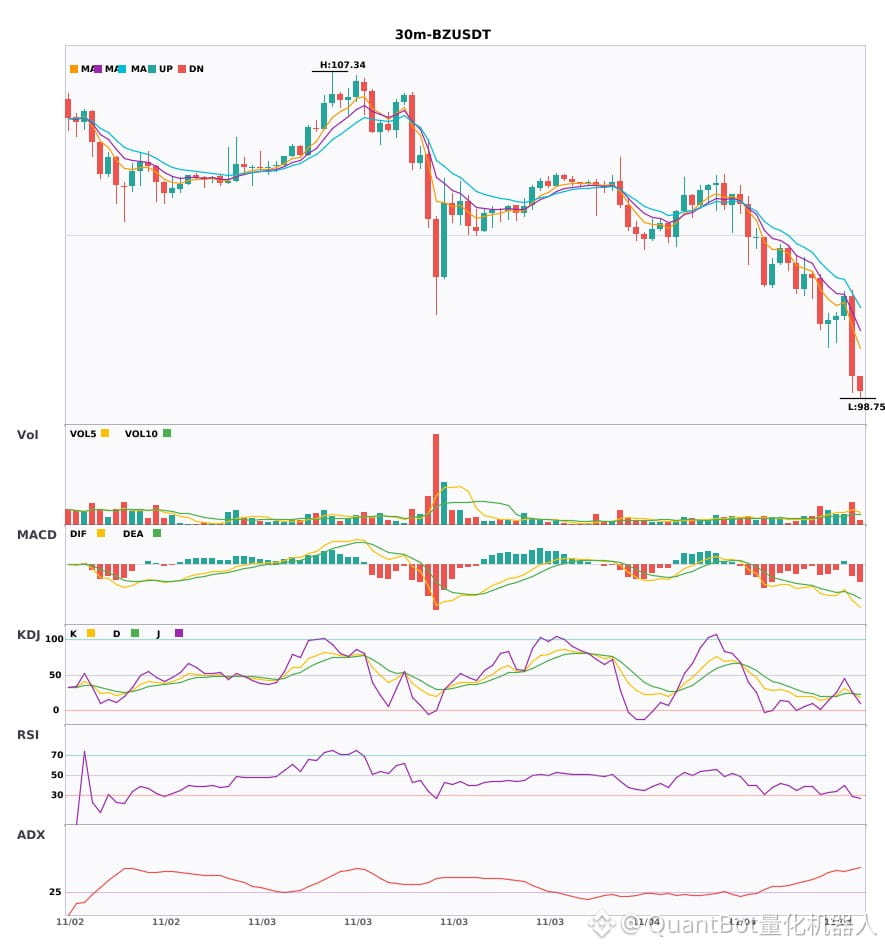
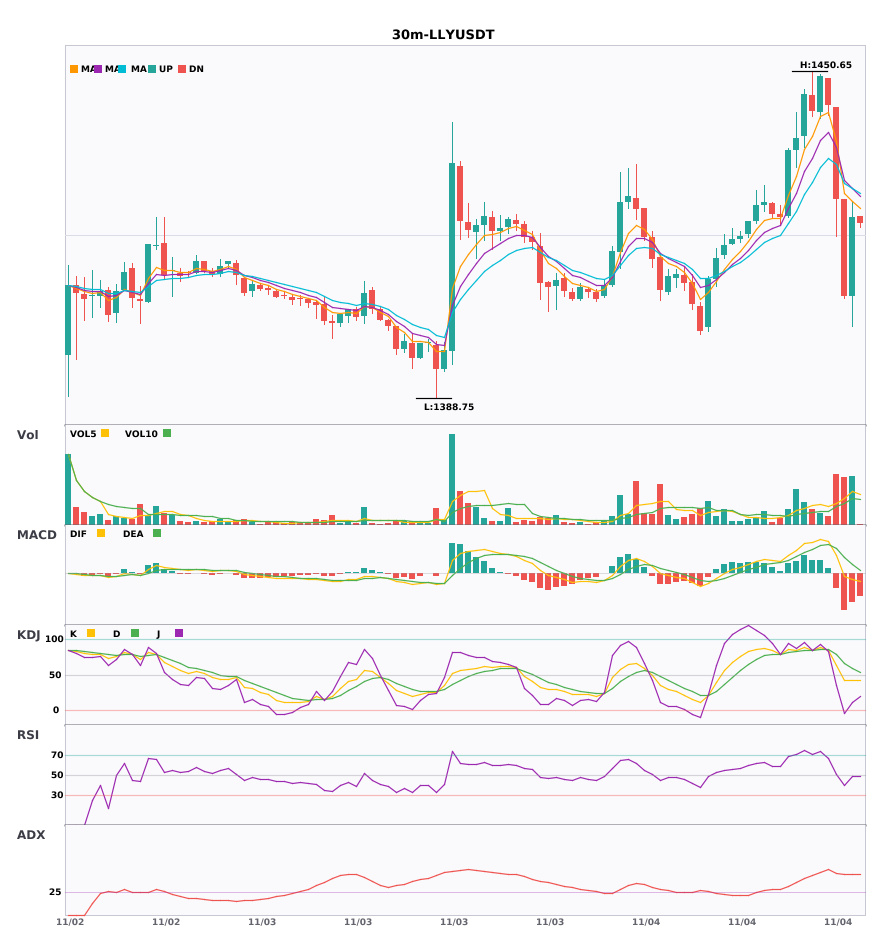
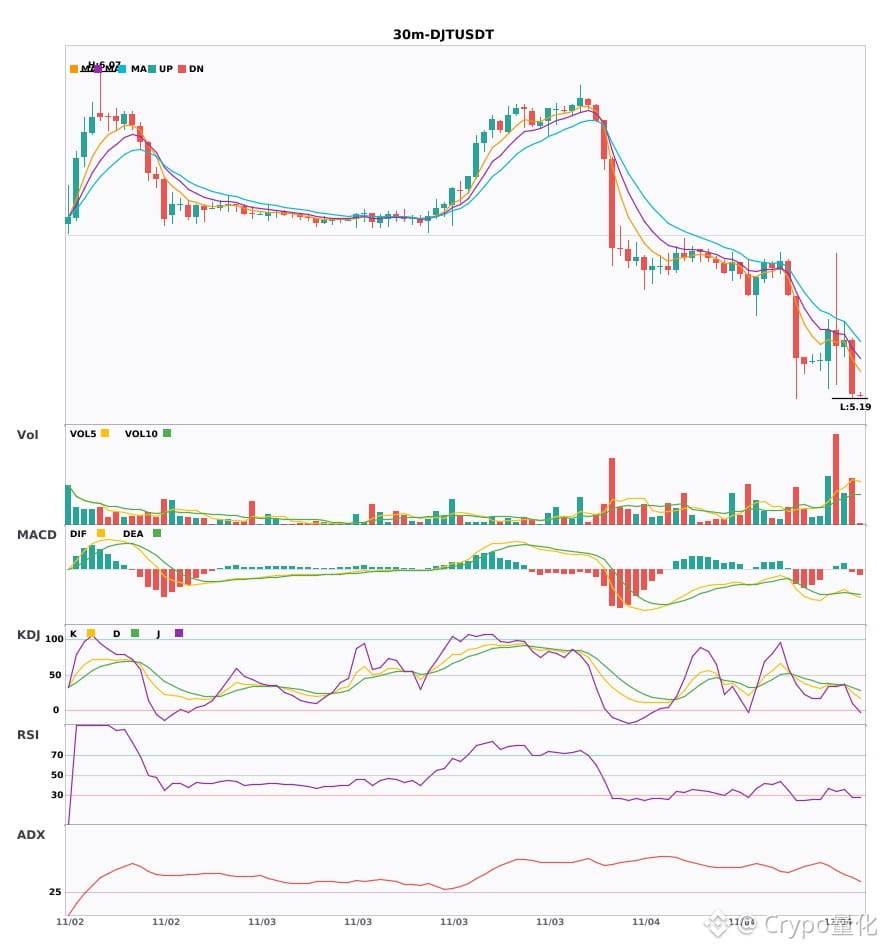
$DJT / $BZ / $LLY 30-minute timeframe bearish, under short-term pressure
📉 $DJT | 30-minute bearish signal
━━━━━━━━━━━━━━━━━━
Technical analysis: ADX(40), clear trending market | MACD bearish death cross below zero, bearish momentum accelerating | EMA5 < EMA8 < EMA13, bearish alignment | KDJ death cross, short-term outlook bearish (K: 25.6, D: 33.1) | Volume increased (1.5x)
Price change: -2.6900%
📉 $BZ | 30-minute bearish signal
━━━━━━━━━━━━━━━━━━
Technical analysis: ADX(54), very strong trend (watch for an overheated pullback) | MACD bearish death cross below zero, bearish momentum accelerating | EMA5 < EMA8 < EMA13, bearish alignment | KDJ showing weakness, bears in control (K: 24.4, D: 24.1) | Volume increased (2.1x)
Price change: -2.0800%
📉 $LLY | 30-minute bearish signal
━━━━━━━━━━━━━━━━━━
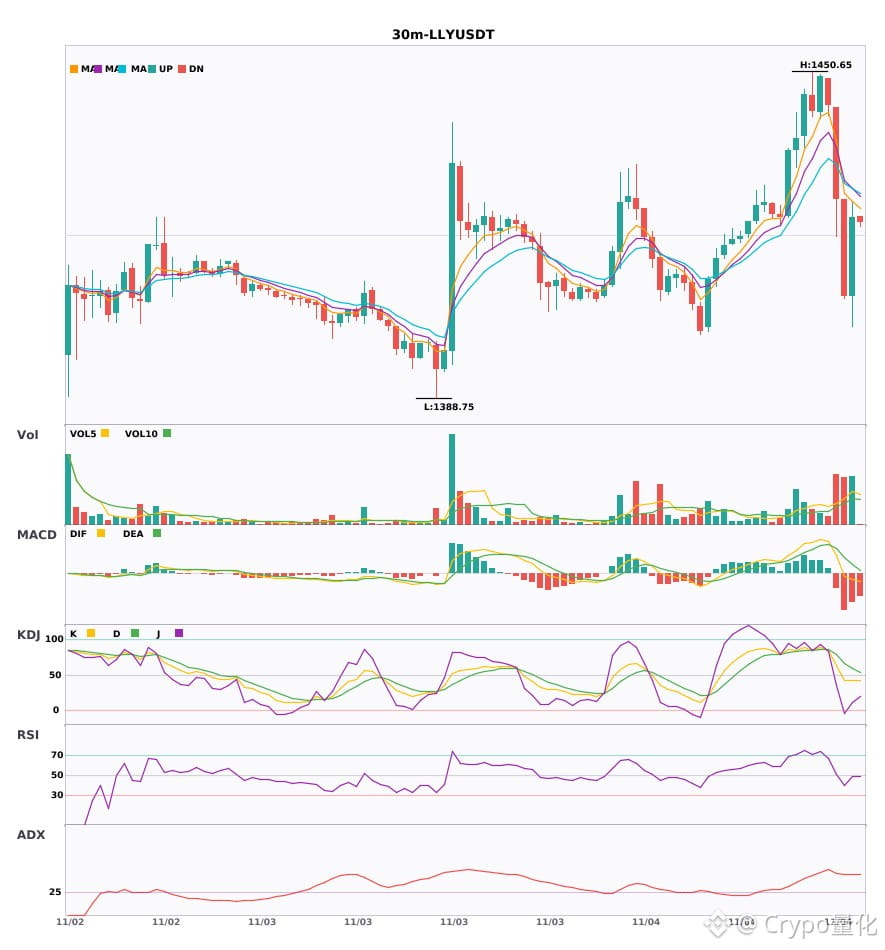
Technical analysis: ADX(50), very strong trend (watch for an overheated pullback) | MACD bearish, trend is weak and momentum is fading | EMA5 < EMA8 < EMA13, bearish alignment | Volume increased (2.2x)
Price change: 1.0600%
━━━━━━━━━━━━━━━━━━
#技术分析 #DJT #BZ #LLY
📌 The above is for reference only and does not constitute investment advice
$DJT / $BZ / $LLY 30-minute timeframe bearish, under short-term pressure
📉 $DJT | 30-minute bearish signal
━━━━━━━━━━━━━━━━━━
Technical analysis: ADX(40), clear trending market | MACD bearish death cross below zero, bearish momentum accelerating | EMA5 < EMA8 < EMA13, bearish alignment | KDJ death cross, short-term outlook bearish (K: 25.6, D: 33.1) | Volume increased (1.5x)
Price change: -2.6900%
📉 $BZ | 30-minute bearish signal
━━━━━━━━━━━━━━━━━━
Technical analysis: ADX(54), very strong trend (watch for an overheated pullback) | MACD bearish death cross below zero, bearish momentum accelerating | EMA5 < EMA8 < EMA13, bearish alignment | KDJ showing weakness, bears in control (K: 24.4, D: 24.1) | Volume increased (2.1x)
Price change: -2.0800%
📉 $LLY | 30-minute bearish signal
━━━━━━━━━━━━━━━━━━
Technical analysis: ADX(50), very strong trend (watch for an overheated pullback) | MACD bearish, trend is weak and momentum is fading | EMA5 < EMA8 < EMA13, bearish alignment | Volume increased (2.2x)
Price change: 1.0600%
━━━━━━━━━━━━━━━━━━
#技术分析 #DJT #BZ #LLY
📌 The above is for reference only and does not constitute investment advice
📉 $DJT | 30-minute bearish signal
━━━━━━━━━━━━━━━━━━
Technical analysis: ADX(40), clear trending market | MACD bearish death cross below zero, bearish momentum accelerating | EMA5 < EMA8 < EMA13, bearish alignment | KDJ death cross, short-term outlook bearish (K: 25.6, D: 33.1) | Volume increased (1.5x)
Price change: -2.6900%
📉 $BZ | 30-minute bearish signal
━━━━━━━━━━━━━━━━━━
Technical analysis: ADX(54), very strong trend (watch for an overheated pullback) | MACD bearish death cross below zero, bearish momentum accelerating | EMA5 < EMA8 < EMA13, bearish alignment | KDJ showing weakness, bears in control (K: 24.4, D: 24.1) | Volume increased (2.1x)
Price change: -2.0800%
📉 $LLY | 30-minute bearish signal
━━━━━━━━━━━━━━━━━━
Technical analysis: ADX(50), very strong trend (watch for an overheated pullback) | MACD bearish, trend is weak and momentum is fading | EMA5 < EMA8 < EMA13, bearish alignment | Volume increased (2.2x)
Price change: 1.0600%
━━━━━━━━━━━━━━━━━━
#技术分析 #DJT #BZ #LLY
📌 The above is for reference only and does not constitute investment advice
14

·
--
3 bearish alerts on the 30-minute timeframe: $DJT / $BZ / $LLY🔥
════════════════════
🟢 $DJT 30-minute bearish signal
⚠️Technical analysis: ADX(40) indicates a clear trending market | MACD bearish crossover below zero, bearish momentum accelerating | EMA5 < EMA8 < EMA13, bearish alignment | KDJ bearish crossover, short-term outlook bearish (K: 25.6, D: 33.1) | Volume increased (1.5x)
════════════════════
🟢 $BZ 30-minute bearish signal
⚠️Technical analysis: ADX(54) indicates a very strong trend (watch for an overbought pullback) | MACD bearish crossover below zero, bearish momentum accelerating | EMA5 < EMA8 < EMA13, bearish alignment | KDJ trending weakly, bears have the upper hand (K: 24.4, D: 24.1) | Volume increased (2.1x)
════════════════════
🟢 $LLY 30-minute bearish signal
⚠️Technical analysis: ADX(50) indicates a very strong trend (watch for an overbought pullback) | MACD trending bearishly, overall trend is weak and momentum is fading | EMA5 < EMA8 < EMA13, bearish alignment | Volume increased (2.2x)
════════════════════
🔔 Follow for real-time market alerts 🔔
#技术分析 #DJT #BZ #LLY
📌 When trading, pay attention to whether the candlestick pattern confirms the signal
3 bearish alerts on the 30-minute timeframe: $DJT / $BZ / $LLY 🔥
════════════════════
🟢 $DJT 30-minute bearish signal
⚠️Technical analysis: ADX(40) indicates a clear trending market | MACD bearish crossover below zero, bearish momentum accelerating | EMA5 < EMA8 < EMA13, bearish alignment | KDJ bearish crossover, short-term outlook bearish (K: 25.6, D: 33.1) | Volume increased (1.5x)
════════════════════
🟢 $BZ 30-minute bearish signal
⚠️Technical analysis: ADX(54) indicates a very strong trend (watch for an overbought pullback) | MACD bearish crossover below zero, bearish momentum accelerating | EMA5 < EMA8 < EMA13, bearish alignment | KDJ trending weakly, bears have the upper hand (K: 24.4, D: 24.1) | Volume increased (2.1x)
════════════════════
🟢 $LLY 30-minute bearish signal
⚠️Technical analysis: ADX(50) indicates a very strong trend (watch for an overbought pullback) | MACD trending bearishly, overall trend is weak and momentum is fading | EMA5 < EMA8 < EMA13, bearish alignment | Volume increased (2.2x)
════════════════════
🔔 Follow for real-time market alerts 🔔
#技术分析 #DJT #BZ #LLY
📌 When trading, pay attention to whether the candlestick pattern confirms the signal
════════════════════
🟢 $DJT 30-minute bearish signal
⚠️Technical analysis: ADX(40) indicates a clear trending market | MACD bearish crossover below zero, bearish momentum accelerating | EMA5 < EMA8 < EMA13, bearish alignment | KDJ bearish crossover, short-term outlook bearish (K: 25.6, D: 33.1) | Volume increased (1.5x)
════════════════════
🟢 $BZ 30-minute bearish signal
⚠️Technical analysis: ADX(54) indicates a very strong trend (watch for an overbought pullback) | MACD bearish crossover below zero, bearish momentum accelerating | EMA5 < EMA8 < EMA13, bearish alignment | KDJ trending weakly, bears have the upper hand (K: 24.4, D: 24.1) | Volume increased (2.1x)
════════════════════
🟢 $LLY 30-minute bearish signal
⚠️Technical analysis: ADX(50) indicates a very strong trend (watch for an overbought pullback) | MACD trending bearishly, overall trend is weak and momentum is fading | EMA5 < EMA8 < EMA13, bearish alignment | Volume increased (2.2x)
════════════════════
🔔 Follow for real-time market alerts 🔔
#技术分析 #DJT #BZ #LLY
📌 When trading, pay attention to whether the candlestick pattern confirms the signal
15

$DJT SHORT
Setup in lines.
Focus — an attempt to move lower.
Note: the first take-profit target is the nearest reference point.
➡️Entry point: 6.342
🎯Take-profit 1: 6.30730959 (+0.55%)
🎯Take-profit 2: 6.27161918 (+1.11%)
🎯Take-profit 3: 6.21808357 (+1.95%)
❌Stop-loss: 6.39653561 (-0.86%)
⚠️ This is not financial advice. Trade at your own risk. DYOR.
#DJT #SPCXB #WLD 📈
$DJT
$DJT SHORT
Setup in lines.
Focus — an attempt to move lower.
Note: the first take-profit target is the nearest reference point.
➡️Entry point: 6.342
🎯Take-profit 1: 6.30730959 (+0.55%)
🎯Take-profit 2: 6.27161918 (+1.11%)
🎯Take-profit 3: 6.21808357 (+1.95%)
❌Stop-loss: 6.39653561 (-0.86%)
⚠️ This is not financial advice. Trade at your own risk. DYOR.
#DJT #SPCXB #WLD 📈
$DJT
Setup in lines.
Focus — an attempt to move lower.
Note: the first take-profit target is the nearest reference point.
➡️Entry point: 6.342
🎯Take-profit 1: 6.30730959 (+0.55%)
🎯Take-profit 2: 6.27161918 (+1.11%)
🎯Take-profit 3: 6.21808357 (+1.95%)
❌Stop-loss: 6.39653561 (-0.86%)
⚠️ This is not financial advice. Trade at your own risk. DYOR.
#DJT #SPCXB #WLD 📈
$DJT
20
$DJT SHORT
Targeting a move down. Entry and exits are specified in the summary.
🏁Entry: 8.047
✅Take 1: 7.97062913 (+0.95%)
✅Take 2: 7.87525825 (+2.13%)
✅Take 3: 7.73220194 (+3.91%)
🛡Protection: 8.20905631 (-2.01%)
⚠️ This is not financial advice. Trade at your own risk. DYOR.
#DJT #Трейдинг #АнализКриптовалют 📈
$DJT
$DJT SHORT
Targeting a move down. Entry and exits are specified in the summary.
🏁Entry: 8.047
✅Take 1: 7.97062913 (+0.95%)
✅Take 2: 7.87525825 (+2.13%)
✅Take 3: 7.73220194 (+3.91%)
🛡Protection: 8.20905631 (-2.01%)
⚠️ This is not financial advice. Trade at your own risk. DYOR.
#DJT #Трейдинг #АнализКриптовалют 📈
$DJT
Targeting a move down. Entry and exits are specified in the summary.
🏁Entry: 8.047
✅Take 1: 7.97062913 (+0.95%)
✅Take 2: 7.87525825 (+2.13%)
✅Take 3: 7.73220194 (+3.91%)
🛡Protection: 8.20905631 (-2.01%)
⚠️ This is not financial advice. Trade at your own risk. DYOR.
#DJT #Трейдинг #АнализКриптовалют 📈
$DJT
13

·
--
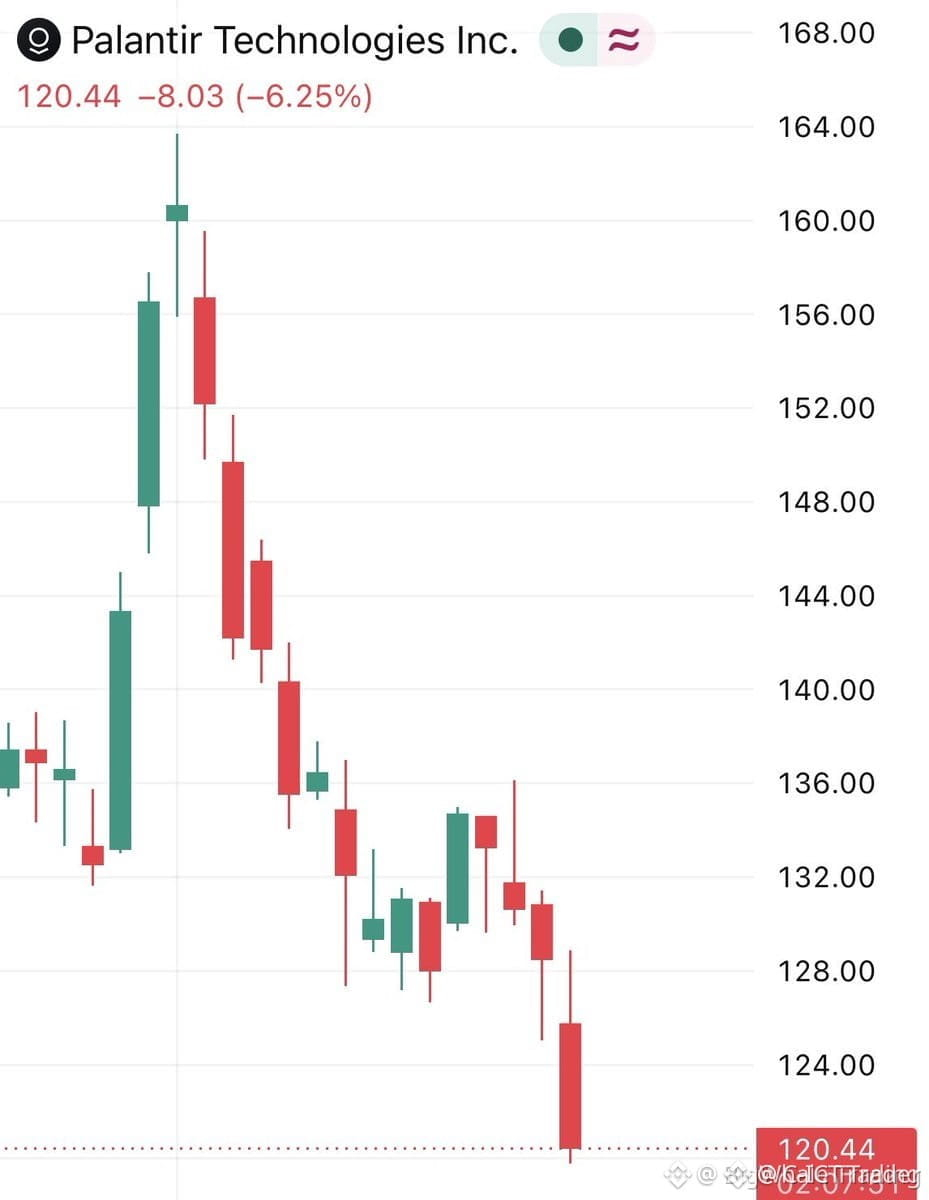
$DJT MARKET STRUCTURE BREAKDOWN AND LIQUIDITY SHIFT 📉
The recent price action in $DJT indicates a significant breakdown of the established support structure. We are currently observing a failure to hold the previous consolidation range, which suggests an acceleration in bearish order flow.
Volume profiles confirm that selling pressure is intensifying as the price deviates from the mean. A sustained move below current support levels would likely trigger a deeper liquidity sweep toward lower historical demand zones.
How are you positioning your portfolio in response to this volatility?
Not financial advice. Always manage your risk.
#DJT #MarketStructure #Volatility #Trading
🎯
$DJT MARKET STRUCTURE BREAKDOWN AND LIQUIDITY SHIFT 📉
The recent price action in $DJT indicates a significant breakdown of the established support structure. We are currently observing a failure to hold the previous consolidation range, which suggests an acceleration in bearish order flow.
Volume profiles confirm that selling pressure is intensifying as the price deviates from the mean. A sustained move below current support levels would likely trigger a deeper liquidity sweep toward lower historical demand zones.
How are you positioning your portfolio in response to this volatility?
Not financial advice. Always manage your risk.
#DJT #MarketStructure #Volatility #Trading
🎯
The recent price action in $DJT indicates a significant breakdown of the established support structure. We are currently observing a failure to hold the previous consolidation range, which suggests an acceleration in bearish order flow.
Volume profiles confirm that selling pressure is intensifying as the price deviates from the mean. A sustained move below current support levels would likely trigger a deeper liquidity sweep toward lower historical demand zones.
How are you positioning your portfolio in response to this volatility?
Not financial advice. Always manage your risk.
#DJT #MarketStructure #Volatility #Trading
🎯
72

·
--
DJT daily line drops again by nearly 5%, now at 9.32. Two political shocks: first, the market is skeptical about rumors that Trump Media will merge with TAE; second, tensions in the U.S.-Iran Hormuz Strait have pushed up oil prices and weighed on risk assets, and the Dow followed lower. The funding rate has fallen to zero; open interest is 11,600 contracts, suggesting existing capital is waiting on the sidelines and no new long buyers are willing to step in.
I’m going against the consensus and staying bearish. The biggest counter-evidence is that if the merger rumor suddenly gets regulatory approval or Trump publicly endorses it, there could be a violent rebound. A second-order effect is that long holders may be forced to cut losses, and funds may temporarily flow into defensive sectors.
Trading tag: #TradFi #链上美股 #DJT
Where do you think this set of judgments is most likely to be wrong?
DJT daily line drops again by nearly 5%, now at 9.32. Two political shocks: first, the market is skeptical about rumors that Trump Media will merge with TAE; second, tensions in the U.S.-Iran Hormuz Strait have pushed up oil prices and weighed on risk assets, and the Dow followed lower. The funding rate has fallen to zero; open interest is 11,600 contracts, suggesting existing capital is waiting on the sidelines and no new long buyers are willing to step in.
I’m going against the consensus and staying bearish. The biggest counter-evidence is that if the merger rumor suddenly gets regulatory approval or Trump publicly endorses it, there could be a violent rebound. A second-order effect is that long holders may be forced to cut losses, and funds may temporarily flow into defensive sectors.
Trading tag: #TradFi #链上美股 #DJT
Where do you think this set of judgments is most likely to be wrong?
I’m going against the consensus and staying bearish. The biggest counter-evidence is that if the merger rumor suddenly gets regulatory approval or Trump publicly endorses it, there could be a violent rebound. A second-order effect is that long holders may be forced to cut losses, and funds may temporarily flow into defensive sectors.
Trading tag: #TradFi #链上美股 #DJT
Where do you think this set of judgments is most likely to be wrong?
1
106

·
--
$DJT has fallen 5.58% over the past 24 hours, with the current price at 8.96. The funding rate is zero, and open interest is 28,343 contracts.
This combination points to a one-way downward trend. A funding rate of zero indicates that neither longs nor shorts are paying extra costs to maintain their positions. During the decline, there is no typical structure of longs stubbornly holding on or shorts becoming overcrowded. With prices falling and funding flat, the selling pressure may be coming from spot sales or directly closing long positions, rather than active short selling.
The counterargument would be a price rebound accompanied by a positive funding rate, which would mean that longs are starting to open positions against the trend and absorbing the decline.
Trading tag: #TradFi #链上美股 #DJT
Where do you think this judgment is most likely to be wrong?
$DJT has fallen 5.58% over the past 24 hours, with the current price at 8.96. The funding rate is zero, and open interest is 28,343 contracts.
This combination points to a one-way downward trend. A funding rate of zero indicates that neither longs nor shorts are paying extra costs to maintain their positions. During the decline, there is no typical structure of longs stubbornly holding on or shorts becoming overcrowded. With prices falling and funding flat, the selling pressure may be coming from spot sales or directly closing long positions, rather than active short selling.
The counterargument would be a price rebound accompanied by a positive funding rate, which would mean that longs are starting to open positions against the trend and absorbing the decline.
Trading tag: #TradFi #链上美股 #DJT
Where do you think this judgment is most likely to be wrong?
This combination points to a one-way downward trend. A funding rate of zero indicates that neither longs nor shorts are paying extra costs to maintain their positions. During the decline, there is no typical structure of longs stubbornly holding on or shorts becoming overcrowded. With prices falling and funding flat, the selling pressure may be coming from spot sales or directly closing long positions, rather than active short selling.
The counterargument would be a price rebound accompanied by a positive funding rate, which would mean that longs are starting to open positions against the trend and absorbing the decline.
Trading tag: #TradFi #链上美股 #DJT
Where do you think this judgment is most likely to be wrong?
117

·
--
$DJT 24 dropped 5.47% in 24 hours to 8.98, but the funding rate has gone to zero. A price decline accompanied by a neutral funding rate indicates that the current selling pressure is not being driven by derivatives short-arbitrage; it is more likely coming from spot selling or off-exchange dumping. The one-way decline without shorts actively opening positions means the market lacks clear directional consensus.
If the price continues to fall and the funding rate turns negative, that would be the signal that shorts are beginning to enter for arbitrage, and the decline could then accelerate. Under the current structure, shorts have not become crowded, so any rebound lacks the basis for a squeeze.
Do not chase shorts.
Trading tag: #TradFi #链上美股 #DJT
Where do you think this line of reasoning is most likely to be wrong?
$DJT 24 dropped 5.47% in 24 hours to 8.98, but the funding rate has gone to zero. A price decline accompanied by a neutral funding rate indicates that the current selling pressure is not being driven by derivatives short-arbitrage; it is more likely coming from spot selling or off-exchange dumping. The one-way decline without shorts actively opening positions means the market lacks clear directional consensus.
If the price continues to fall and the funding rate turns negative, that would be the signal that shorts are beginning to enter for arbitrage, and the decline could then accelerate. Under the current structure, shorts have not become crowded, so any rebound lacks the basis for a squeeze.
Do not chase shorts.
Trading tag: #TradFi #链上美股 #DJT
Where do you think this line of reasoning is most likely to be wrong?
If the price continues to fall and the funding rate turns negative, that would be the signal that shorts are beginning to enter for arbitrage, and the decline could then accelerate. Under the current structure, shorts have not become crowded, so any rebound lacks the basis for a squeeze.
Do not chase shorts.
Trading tag: #TradFi #链上美股 #DJT
Where do you think this line of reasoning is most likely to be wrong?
68
·
--
$DJT fell 5.58% to $8.96 over 24 hours on Binance TradFi futures. This decline is not severe in the traditional stock market, but after it was transmitted to on-chain contracts, I noticed that the funding rate remained at zero and open interest stayed at a relatively calm level of 28,343 units.
This suggests that traders in the futures market did not develop a strong one-sided bet due to the price drop, and the long and short forces are temporarily balanced. There is no panic selling, and no aggressive leveraged bottom-fishing.
Trading tag: #TradFi #链上美股 #DJT
Where do you think this line of reasoning is most likely to be wrong?
$DJT fell 5.58% to $8.96 over 24 hours on Binance TradFi futures. This decline is not severe in the traditional stock market, but after it was transmitted to on-chain contracts, I noticed that the funding rate remained at zero and open interest stayed at a relatively calm level of 28,343 units.
This suggests that traders in the futures market did not develop a strong one-sided bet due to the price drop, and the long and short forces are temporarily balanced. There is no panic selling, and no aggressive leveraged bottom-fishing.
Trading tag: #TradFi #链上美股 #DJT
Where do you think this line of reasoning is most likely to be wrong?
This suggests that traders in the futures market did not develop a strong one-sided bet due to the price drop, and the long and short forces are temporarily balanced. There is no panic selling, and no aggressive leveraged bottom-fishing.
Trading tag: #TradFi #链上美股 #DJT
Where do you think this line of reasoning is most likely to be wrong?
36


·
--
$DJT rose 5.986% over the past 24 hours; the current price is 9.03. The funding rate is zero, and the open interest remains around 63,978.62. Price is moving upward, but the derivatives market stance is neutral. This combination exposes the underlying reality of the current upward price action.
Short-term spikes in political assets are usually driven by news. If the price is pushed up while the funding rate is zero, it means longs are not paying a premium in the derivatives market. Open interest also shows no significant expansion. This is not an upswing driven by funding consensus; it looks more like short-term, speculative pricing on political news, with traditional capital not moving in at scale. With price rising, funding rate at zero, and positioning largely unchanged, all three signals point to the same conclusion: the current move is driven by retail sentiment rather than an institutional-led trend.
The strongest counter-evidence: if this were truly a political narrative that keeps developing, the funding rate should turn positive and longs should pay a premium to express a strong bullish stance. In reality, the funding rate is completely flat, suggesting the market doubts the news will persist. Leveraged longs are unwilling to add exposure.
Second-order impact: this structure with low holding costs makes longs more patient and willing to hold while waiting, since shorts have not taken the upper hand either. But if the price stalls, positions lacking funding-rate cost support may loosen quickly, potentially giving back the gains fast.
Trading tag: #TradFi #链上美股 #DJT
Where do you think this assessment is most likely to be wrong?
$DJT rose 5.986% over the past 24 hours; the current price is 9.03. The funding rate is zero, and the open interest remains around 63,978.62. Price is moving upward, but the derivatives market stance is neutral. This combination exposes the underlying reality of the current upward price action.
Short-term spikes in political assets are usually driven by news. If the price is pushed up while the funding rate is zero, it means longs are not paying a premium in the derivatives market. Open interest also shows no significant expansion. This is not an upswing driven by funding consensus; it looks more like short-term, speculative pricing on political news, with traditional capital not moving in at scale. With price rising, funding rate at zero, and positioning largely unchanged, all three signals point to the same conclusion: the current move is driven by retail sentiment rather than an institutional-led trend.
The strongest counter-evidence: if this were truly a political narrative that keeps developing, the funding rate should turn positive and longs should pay a premium to express a strong bullish stance. In reality, the funding rate is completely flat, suggesting the market doubts the news will persist. Leveraged longs are unwilling to add exposure.
Second-order impact: this structure with low holding costs makes longs more patient and willing to hold while waiting, since shorts have not taken the upper hand either. But if the price stalls, positions lacking funding-rate cost support may loosen quickly, potentially giving back the gains fast.
Trading tag: #TradFi #链上美股 #DJT
Where do you think this assessment is most likely to be wrong?
Short-term spikes in political assets are usually driven by news. If the price is pushed up while the funding rate is zero, it means longs are not paying a premium in the derivatives market. Open interest also shows no significant expansion. This is not an upswing driven by funding consensus; it looks more like short-term, speculative pricing on political news, with traditional capital not moving in at scale. With price rising, funding rate at zero, and positioning largely unchanged, all three signals point to the same conclusion: the current move is driven by retail sentiment rather than an institutional-led trend.
The strongest counter-evidence: if this were truly a political narrative that keeps developing, the funding rate should turn positive and longs should pay a premium to express a strong bullish stance. In reality, the funding rate is completely flat, suggesting the market doubts the news will persist. Leveraged longs are unwilling to add exposure.
Second-order impact: this structure with low holding costs makes longs more patient and willing to hold while waiting, since shorts have not taken the upper hand either. But if the price stalls, positions lacking funding-rate cost support may loosen quickly, potentially giving back the gains fast.
Trading tag: #TradFi #链上美股 #DJT
Where do you think this assessment is most likely to be wrong?
148

·
--
Bearish
🚨 $DJT IS MOVING AGAIN — BUT $10 IS THE REAL TEST 👀
{stock_us}(DJT.US)
DJT: ~$9.77
$DJT is back in focus after gaining around 15% over the past week.
And there’s a fresh catalyst behind the story:
⚡ TRUTH API
Trump Media says the new paid data service has already attracted 10+ customers, with contracts reportedly reaching $100K/month.
Now the chart matters:
🔑 $10.00 → key breakout
🟢 $9.50 → support
⚠️ $9.20 → downside level
📈 BREAK $10 + VOLUME
→ $10.50
→ $11.00
📉 REJECTION AT $10
→ $9.50
→ $9.20
⚡ CURRENT UPDATE
Truth API could become a new revenue stream for DJT, but the business is still under pressure — the company reported a $238M Q2 loss.
So this isn't a blind bullish call.
The story is interesting.
The chart must confirm it.
$10 + volume = confirmation.
No breakout = NO CHASE.
#DJT #TrumpMedia #TruthSocial #StockTrading #NASDAQ
🚨 $DJT IS MOVING AGAIN — BUT $10 IS THE REAL TEST 👀
DJT: ~$9.77
$DJT is back in focus after gaining around 15% over the past week.
And there’s a fresh catalyst behind the story:
⚡ TRUTH API
Trump Media says the new paid data service has already attracted 10+ customers, with contracts reportedly reaching $100K/month.
Now the chart matters:
🔑 $10.00 → key breakout
🟢 $9.50 → support
⚠️ $9.20 → downside level
📈 BREAK $10 + VOLUME
→ $10.50
→ $11.00
📉 REJECTION AT $10
→ $9.50
→ $9.20
⚡ CURRENT UPDATE
Truth API could become a new revenue stream for DJT, but the business is still under pressure — the company reported a $238M Q2 loss.
So this isn't a blind bullish call.
The story is interesting.
The chart must confirm it.
$10 + volume = confirmation.
No breakout = NO CHASE.
#DJT #TrumpMedia #TruthSocial #StockTrading #NASDAQ
DJT: ~$9.77
$DJT is back in focus after gaining around 15% over the past week.
And there’s a fresh catalyst behind the story:
⚡ TRUTH API
Trump Media says the new paid data service has already attracted 10+ customers, with contracts reportedly reaching $100K/month.
Now the chart matters:
🔑 $10.00 → key breakout
🟢 $9.50 → support
⚠️ $9.20 → downside level
📈 BREAK $10 + VOLUME
→ $10.50
→ $11.00
📉 REJECTION AT $10
→ $9.50
→ $9.20
⚡ CURRENT UPDATE
Truth API could become a new revenue stream for DJT, but the business is still under pressure — the company reported a $238M Q2 loss.
So this isn't a blind bullish call.
The story is interesting.
The chart must confirm it.
$10 + volume = confirmation.
No breakout = NO CHASE.
#DJT #TrumpMedia #TruthSocial #StockTrading #NASDAQ
DJTUS+0.24%
DJT-3.01%
1
459
·
--
$DJT TRUTH API LAUNCH SET TO DISRUPT DATA LICENSING ON AUGUST 1 🔥
The Trump Media and Technology Group is entering the data licensing business with the Truth API, providing real-time feeds from top accounts including Trump and the White House. High-frequency trading firms have already signed on, and the company is also in talks to license the data for AI training.
Last year the firm generated just $3.68 million in revenue while posting a $712 million net loss, largely from crypto investment write-downs. Speed is the key differentiator here — the API will be significantly faster than scraping.
Will this API give traders an information advantage that changes how they react to political signals?
Not financial advice. Always manage your risk.
#DJT #DataLicensing #TruthSocial #CryptoNews #HighFrequencyTrading
🔥
$DJT TRUTH API LAUNCH SET TO DISRUPT DATA LICENSING ON AUGUST 1 🔥
The Trump Media and Technology Group is entering the data licensing business with the Truth API, providing real-time feeds from top accounts including Trump and the White House. High-frequency trading firms have already signed on, and the company is also in talks to license the data for AI training.
Last year the firm generated just $3.68 million in revenue while posting a $712 million net loss, largely from crypto investment write-downs. Speed is the key differentiator here — the API will be significantly faster than scraping.
Will this API give traders an information advantage that changes how they react to political signals?
Not financial advice. Always manage your risk.
#DJT #DataLicensing #TruthSocial #CryptoNews #HighFrequencyTrading
🔥
The Trump Media and Technology Group is entering the data licensing business with the Truth API, providing real-time feeds from top accounts including Trump and the White House. High-frequency trading firms have already signed on, and the company is also in talks to license the data for AI training.
Last year the firm generated just $3.68 million in revenue while posting a $712 million net loss, largely from crypto investment write-downs. Speed is the key differentiator here — the API will be significantly faster than scraping.
Will this API give traders an information advantage that changes how they react to political signals?
Not financial advice. Always manage your risk.
#DJT #DataLicensing #TruthSocial #CryptoNews #HighFrequencyTrading
🔥
27
·
--
$DJT OFFERS REAL-TIME TRUTH SOCIAL FEED FOR $100K/MONTH 💰
Trump Media Group is pitching a subscription service that delivers instant presidential posts from Truth Social, priced at $100,000 per month. This data feed will open to institutional clients starting next month, specifically targeting high-frequency algorithmic trading firms.
The key here is speed — even a few seconds' head start on market-moving statements can create significant order flow imbalances. If early adopters are already lining up, this could shift liquidity dynamics around political headlines.
Will this data feed give algorithmic traders an edge over retail, or will the market already price in the lag?
Not financial advice. Always manage your risk.
#DJT #TruthSocial #AlgoTrading #InstitutionalAccess
💰
$DJT OFFERS REAL-TIME TRUTH SOCIAL FEED FOR $100K/MONTH 💰
Trump Media Group is pitching a subscription service that delivers instant presidential posts from Truth Social, priced at $100,000 per month. This data feed will open to institutional clients starting next month, specifically targeting high-frequency algorithmic trading firms.
The key here is speed — even a few seconds' head start on market-moving statements can create significant order flow imbalances. If early adopters are already lining up, this could shift liquidity dynamics around political headlines.
Will this data feed give algorithmic traders an edge over retail, or will the market already price in the lag?
Not financial advice. Always manage your risk.
#DJT #TruthSocial #AlgoTrading #InstitutionalAccess
💰
Trump Media Group is pitching a subscription service that delivers instant presidential posts from Truth Social, priced at $100,000 per month. This data feed will open to institutional clients starting next month, specifically targeting high-frequency algorithmic trading firms.
The key here is speed — even a few seconds' head start on market-moving statements can create significant order flow imbalances. If early adopters are already lining up, this could shift liquidity dynamics around political headlines.
Will this data feed give algorithmic traders an edge over retail, or will the market already price in the lag?
Not financial advice. Always manage your risk.
#DJT #TruthSocial #AlgoTrading #InstitutionalAccess
💰
33
·
--
$DJT 24 hours dropped 6.88%, current price 9.06. This pullback hasn’t come with increased volume. The key point is the funding rate is 0—neither longs nor shorts are paying. That suggests the position structure has become stuck: the long side is stubbornly holding, and the short side hasn’t added force to squeeze.
The “Trump” theme is positively correlated with the heat in U.S. stocks, but right now there isn’t any new incremental news to trigger more buying pressure. Although the price is falling, the OI (open interest) hasn’t dropped noticeably. This is a typical situation where longs are trapped and don’t cut their positions, while shorts are standing by. This kind of balance can be broken by a small negative catalyst. For example, if any negative Trump-related news comes out and there’s no funding-rate backstop below, once liquidity dries up, the selloff can hit quickly.
Trading tag: #TradFi #链上美股 #DJT
Where do you think this assessment is most likely to be wrong?
$DJT 24 hours dropped 6.88%, current price 9.06. This pullback hasn’t come with increased volume. The key point is the funding rate is 0—neither longs nor shorts are paying. That suggests the position structure has become stuck: the long side is stubbornly holding, and the short side hasn’t added force to squeeze.
The “Trump” theme is positively correlated with the heat in U.S. stocks, but right now there isn’t any new incremental news to trigger more buying pressure. Although the price is falling, the OI (open interest) hasn’t dropped noticeably. This is a typical situation where longs are trapped and don’t cut their positions, while shorts are standing by. This kind of balance can be broken by a small negative catalyst. For example, if any negative Trump-related news comes out and there’s no funding-rate backstop below, once liquidity dries up, the selloff can hit quickly.
Trading tag: #TradFi #链上美股 #DJT
Where do you think this assessment is most likely to be wrong?
The “Trump” theme is positively correlated with the heat in U.S. stocks, but right now there isn’t any new incremental news to trigger more buying pressure. Although the price is falling, the OI (open interest) hasn’t dropped noticeably. This is a typical situation where longs are trapped and don’t cut their positions, while shorts are standing by. This kind of balance can be broken by a small negative catalyst. For example, if any negative Trump-related news comes out and there’s no funding-rate backstop below, once liquidity dries up, the selloff can hit quickly.
Trading tag: #TradFi #链上美股 #DJT
Where do you think this assessment is most likely to be wrong?
10

·
--
🚀 $DJT UNVEILS $150M TRUTH SOCIAL ETF SWARM! 🦈
📊 The seven new ETFs, backed by Yorkville America, are a clear signal that institutional capital is rallying around the “America First” narrative. Smart‑money whales are loading positions fast, and the $150M asset pool hints at a liquidity surge that could ripple into related tech and defense stocks. ⚡
💡 With the ETF launch timed for a post‑election hype cycle, expect heightened volatility and a possible cross‑asset flow into crypto assets that echo patriotic themes. 👇 Are you watching the ETF order‑flow for early entry cues or waiting for the next liquidity sweep?
⚠️ Not financial advice. Always manage your risk. 🛡️
🏷️ #DJT #ETF #AmericaFirst #Investing #Crypto
🔥 💎
🚀 $DJT UNVEILS $150M TRUTH SOCIAL ETF SWARM! 🦈
📊 The seven new ETFs, backed by Yorkville America, are a clear signal that institutional capital is rallying around the “America First” narrative. Smart‑money whales are loading positions fast, and the $150M asset pool hints at a liquidity surge that could ripple into related tech and defense stocks. ⚡
💡 With the ETF launch timed for a post‑election hype cycle, expect heightened volatility and a possible cross‑asset flow into crypto assets that echo patriotic themes. 👇 Are you watching the ETF order‑flow for early entry cues or waiting for the next liquidity sweep?
⚠️ Not financial advice. Always manage your risk. 🛡️
🏷️ #DJT #ETF #AmericaFirst #Investing #Crypto
🔥 💎
📊 The seven new ETFs, backed by Yorkville America, are a clear signal that institutional capital is rallying around the “America First” narrative. Smart‑money whales are loading positions fast, and the $150M asset pool hints at a liquidity surge that could ripple into related tech and defense stocks. ⚡
💡 With the ETF launch timed for a post‑election hype cycle, expect heightened volatility and a possible cross‑asset flow into crypto assets that echo patriotic themes. 👇 Are you watching the ETF order‑flow for early entry cues or waiting for the next liquidity sweep?
⚠️ Not financial advice. Always manage your risk. 🛡️
🏷️ #DJT #ETF #AmericaFirst #Investing #Crypto
🔥 💎
88
Log in to explore more content
Join global crypto users on Binance Square
⚡️ Get latest and useful information about crypto.
💬 Trusted by the world’s largest crypto exchange.
👍 Discover real insights from verified creators.
Email / Phone number
Trending Topics
1
#JobsReportRaisesHikeOdds
254,497 views
2,025 Discussing
2
#CPITestsDecemberRateOutlook
20,543 views
305 Discussing
3
#BitcoinRebounds$75KAsChipsLead
21,353 views
223 Discussing
4
#US Data Center Rules May Constrain AI Expansion
39,307 views
156 Discussing
5
#ARKPlans14ThematicETFsCoveringAIAndTokenizedMarkets
227 views
10 Discussing
6
#WillAnthropicListOnTime
62,822 views
791 Discussing
7
#WillUS-IranTensionsBoostSafe-HavenDemand?
12,036 views
118 Discussing
8
#BitcoinETFsSee$412MNetOutflows
3,503 views
46 Discussing
9
#HKSFCPlansToRestrictCryptoAndExchangeTerms
13,315 views
236 Discussing
10
#TradFiForBeginners
39,828 views
601 Discussing