

#bitcoinfallsbelow
bitcoinfallsbelow
1,420 views
69 Discussing
Hot
Latest

·
--
$BTC's average daily range is $2,570 (3.1%). From $84,163, that puts a possible 24h band of $81,593–$86,733 on the table.
BTC is trending on Square after falling below $83,000, and it's among the most searched coins on Binance Square. Price has recovered since then and is roughly flat on the day.
On the 1h chart, price is below both the EMA20 ($84,295) and the EMA50 ($84,437). RSI is at 47.6, so momentum is soft but not stretched.
Derivatives positioning is calm. Funding is 0.0058%, open interest is down 1.2% to $8.14B, and 55.2% of accounts are long (ratio 1.23). That's no sign of an aggressive leverage build-up.
📊 Bullish case: if price gets back above $84,622, $86,378 could come into view.
Bearish case: if $83,948 gives way, $83,500 is the next level to watch, with the 72h low at $82,875 below that.
This is an outlook, not a prediction. Reclaiming the two EMAs is the first thing to watch.
Which level breaks first for BTC today: $84,622 or $83,948?
#BitcoinFallsBelow$83,000 #BTC #MarketUpdate
Not financial advice. DYOR.
$BTC 's average daily range is $2,570 (3.1%). From $84,163, that puts a possible 24h band of $81,593–$86,733 on the table.
BTC is trending on Square after falling below $83,000, and it's among the most searched coins on Binance Square. Price has recovered since then and is roughly flat on the day.
On the 1h chart, price is below both the EMA20 ($84,295) and the EMA50 ($84,437). RSI is at 47.6, so momentum is soft but not stretched.
Derivatives positioning is calm. Funding is 0.0058%, open interest is down 1.2% to $8.14B, and 55.2% of accounts are long (ratio 1.23). That's no sign of an aggressive leverage build-up.
📊 Bullish case: if price gets back above $84,622, $86,378 could come into view.
Bearish case: if $83,948 gives way, $83,500 is the next level to watch, with the 72h low at $82,875 below that.
This is an outlook, not a prediction. Reclaiming the two EMAs is the first thing to watch.
Which level breaks first for BTC today: $84,622 or $83,948?
#BitcoinFallsBelow$83,000 #BTC #MarketUpdate
Not financial advice. DYOR.
BTC is trending on Square after falling below $83,000, and it's among the most searched coins on Binance Square. Price has recovered since then and is roughly flat on the day.
On the 1h chart, price is below both the EMA20 ($84,295) and the EMA50 ($84,437). RSI is at 47.6, so momentum is soft but not stretched.
Derivatives positioning is calm. Funding is 0.0058%, open interest is down 1.2% to $8.14B, and 55.2% of accounts are long (ratio 1.23). That's no sign of an aggressive leverage build-up.
📊 Bullish case: if price gets back above $84,622, $86,378 could come into view.
Bearish case: if $83,948 gives way, $83,500 is the next level to watch, with the 72h low at $82,875 below that.
This is an outlook, not a prediction. Reclaiming the two EMAs is the first thing to watch.
Which level breaks first for BTC today: $84,622 or $83,948?
#BitcoinFallsBelow$83,000 #BTC #MarketUpdate
Not financial advice. DYOR.
1
53

·
--
Here's what happened when $BTC started rolling over last week and most traders still treated it like a gift.
The pain is not the red candle itself. It is not knowing when a dip stops being a dip and becomes a trend change, and the people who averaged down into every flush are the ones sitting on underwater positions right now.
This was not a random dump. Yields did the actual work. With the US 10-year at a 19-year high and the 30-year the highest since 2004, liquidity left risk assets while Fear and Greed sat at 73. That is greed sitting there while price was already falling. Most people watching the chart never connected those two things.
They were still hunting entries in $USDT pairs as if the backdrop had not shifted. Fed October hike odds at 69 percent is not a footnote. It is the kind of pressure that can keep $BTC bleeding even when every support line looks obvious.
The lesson from this stretch is uncomfortable. Markets do not wait for you to feel scared. They roll over while sentiment is still greedy, and that is when the real damage gets done.
Where do you think this goes from here?
#BitcoinFallsToAround #BitcoinFallsBelow #US10YTreasuryYieldHits19YearHigh
Here's what happened when $BTC started rolling over last week and most traders still treated it like a gift.
The pain is not the red candle itself. It is not knowing when a dip stops being a dip and becomes a trend change, and the people who averaged down into every flush are the ones sitting on underwater positions right now.
This was not a random dump. Yields did the actual work. With the US 10-year at a 19-year high and the 30-year the highest since 2004, liquidity left risk assets while Fear and Greed sat at 73. That is greed sitting there while price was already falling. Most people watching the chart never connected those two things.
They were still hunting entries in $USDT pairs as if the backdrop had not shifted. Fed October hike odds at 69 percent is not a footnote. It is the kind of pressure that can keep $BTC bleeding even when every support line looks obvious.
The lesson from this stretch is uncomfortable. Markets do not wait for you to feel scared. They roll over while sentiment is still greedy, and that is when the real damage gets done.
Where do you think this goes from here?
#BitcoinFallsToAround #BitcoinFallsBelow #US10YTreasuryYieldHits19YearHigh
The pain is not the red candle itself. It is not knowing when a dip stops being a dip and becomes a trend change, and the people who averaged down into every flush are the ones sitting on underwater positions right now.
This was not a random dump. Yields did the actual work. With the US 10-year at a 19-year high and the 30-year the highest since 2004, liquidity left risk assets while Fear and Greed sat at 73. That is greed sitting there while price was already falling. Most people watching the chart never connected those two things.
They were still hunting entries in $USDT pairs as if the backdrop had not shifted. Fed October hike odds at 69 percent is not a footnote. It is the kind of pressure that can keep $BTC bleeding even when every support line looks obvious.
The lesson from this stretch is uncomfortable. Markets do not wait for you to feel scared. They roll over while sentiment is still greedy, and that is when the real damage gets done.
Where do you think this goes from here?
#BitcoinFallsToAround #BitcoinFallsBelow #US10YTreasuryYieldHits19YearHigh

12

everyone thinks buying every $btc dip is free money but actually that's the fastest way to get chopped when greed is still sitting at 73.
the pain is real. you think you've found the bottom, you load up, then it dumps another 5% and you're underwater watching $usdt dominance climb while your portfolio bleeds.
ngl this drop is a textbook case of what happens when people refuse to wait for fear. we saw this exact movie last cycle when yields started ripping. traders kept calling bottoms on $btc every few thousand dollars down and got wrecked each time.
the real bounce only came after actual panic, not while everyone was still greed-posting and searching $fil like the party was still going. macro is not your friend here. 10 year yields at 19 year highs and fed hike odds climbing is not a buy the dip environment no matter how many times you've been rewarded for it before.
this isn't the time to be a hero catching knives. ser the market is still greedy and that's usually when the bleed isn't done.
where do you think this actually finds a floor from here?
#BitcoinFallsToAround #BitcoinFallsBelow #US10YTreasuryYieldHits19YearHigh
everyone thinks buying every $btc dip is free money but actually that's the fastest way to get chopped when greed is still sitting at 73.
the pain is real. you think you've found the bottom, you load up, then it dumps another 5% and you're underwater watching $usdt dominance climb while your portfolio bleeds.
ngl this drop is a textbook case of what happens when people refuse to wait for fear. we saw this exact movie last cycle when yields started ripping. traders kept calling bottoms on $btc every few thousand dollars down and got wrecked each time.
the real bounce only came after actual panic, not while everyone was still greed-posting and searching $fil like the party was still going. macro is not your friend here. 10 year yields at 19 year highs and fed hike odds climbing is not a buy the dip environment no matter how many times you've been rewarded for it before.
this isn't the time to be a hero catching knives. ser the market is still greedy and that's usually when the bleed isn't done.
where do you think this actually finds a floor from here?
#BitcoinFallsToAround #BitcoinFallsBelow #US10YTreasuryYieldHits19YearHigh
the pain is real. you think you've found the bottom, you load up, then it dumps another 5% and you're underwater watching $usdt dominance climb while your portfolio bleeds.
ngl this drop is a textbook case of what happens when people refuse to wait for fear. we saw this exact movie last cycle when yields started ripping. traders kept calling bottoms on $btc every few thousand dollars down and got wrecked each time.
the real bounce only came after actual panic, not while everyone was still greed-posting and searching $fil like the party was still going. macro is not your friend here. 10 year yields at 19 year highs and fed hike odds climbing is not a buy the dip environment no matter how many times you've been rewarded for it before.
this isn't the time to be a hero catching knives. ser the market is still greedy and that's usually when the bleed isn't done.
where do you think this actually finds a floor from here?
#BitcoinFallsToAround #BitcoinFallsBelow #US10YTreasuryYieldHits19YearHigh

19
·
--
If you are still panic selling your spot bags every time the market takes a sudden dip, stop now.
Watching green candles flip red overnight triggers instant anxiety, but dumping near major support usually means buying back higher later. Most retail traders lose capital simply because they let short-term volatility dictate their long-term strategy.
The bear camp is actively celebrating as $BTC slips under key psychological levels, arguing that broader macroeconomic headwinds will trigger a much deeper liquidity flush. From their viewpoint, holding $USDT and waiting on the sidelines is the only rational play right now.
Yet looking closely at order book depth, these aggressive pullbacks look more like routine shakeouts designed to clear overleveraged positions before the next leg up. Smart money consistently builds positions during peak market fear while impatient hands rush for the exit.
Are you treating this drop as a prime accumulation zone, or do you think the bleed continues?
#BitcoinFallsBelow #BitcoinFallsToAround
If you are still panic selling your spot bags every time the market takes a sudden dip, stop now.
Watching green candles flip red overnight triggers instant anxiety, but dumping near major support usually means buying back higher later. Most retail traders lose capital simply because they let short-term volatility dictate their long-term strategy.
The bear camp is actively celebrating as $BTC slips under key psychological levels, arguing that broader macroeconomic headwinds will trigger a much deeper liquidity flush. From their viewpoint, holding $USDT and waiting on the sidelines is the only rational play right now.
Yet looking closely at order book depth, these aggressive pullbacks look more like routine shakeouts designed to clear overleveraged positions before the next leg up. Smart money consistently builds positions during peak market fear while impatient hands rush for the exit.
Are you treating this drop as a prime accumulation zone, or do you think the bleed continues?
#BitcoinFallsBelow #BitcoinFallsToAround
Watching green candles flip red overnight triggers instant anxiety, but dumping near major support usually means buying back higher later. Most retail traders lose capital simply because they let short-term volatility dictate their long-term strategy.
The bear camp is actively celebrating as $BTC slips under key psychological levels, arguing that broader macroeconomic headwinds will trigger a much deeper liquidity flush. From their viewpoint, holding $USDT and waiting on the sidelines is the only rational play right now.
Yet looking closely at order book depth, these aggressive pullbacks look more like routine shakeouts designed to clear overleveraged positions before the next leg up. Smart money consistently builds positions during peak market fear while impatient hands rush for the exit.
Are you treating this drop as a prime accumulation zone, or do you think the bleed continues?
#BitcoinFallsBelow #BitcoinFallsToAround

8

·
--
Bitcoin dropping below 83k isn’t a crash it’s a filter.
It separates the emotional from the patient.
Traders who panic sell now are the ones who get shaken out before the next leg.
This isn’t about price. It’s about discipline.
I’m watching. Not adding. Not cutting.
Just waiting for volume to confirm if this is a pause or a pivot.
If it holds above 78k and starts climbing with real volume, I’m wrong.
You think it’s time to buy?
#BitcoinFallsBelow$83,000 #CryptoNews
Bitcoin dropping below 83k isn’t a crash it’s a filter.
It separates the emotional from the patient.
Traders who panic sell now are the ones who get shaken out before the next leg.
This isn’t about price. It’s about discipline.
I’m watching. Not adding. Not cutting.
Just waiting for volume to confirm if this is a pause or a pivot.
If it holds above 78k and starts climbing with real volume, I’m wrong.
You think it’s time to buy?
#BitcoinFallsBelow$83,000 #CryptoNews
It separates the emotional from the patient.
Traders who panic sell now are the ones who get shaken out before the next leg.
This isn’t about price. It’s about discipline.
I’m watching. Not adding. Not cutting.
Just waiting for volume to confirm if this is a pause or a pivot.
If it holds above 78k and starts climbing with real volume, I’m wrong.
You think it’s time to buy?
#BitcoinFallsBelow$83,000 #CryptoNews
13

Bitcoin has recently fallen below the significant psychological level of $83,000, sparking concern among investors. This price action indicates a potential shift in market sentiment, with sellers potentially gaining momentum. Traders will be closely watching to see if this level becomes resistance or if buyers step in to defend it. The broader market may experience increased volatility as a result of this move, with altcoins potentially following Bitcoin's lead.
This pullback could be a healthy correction in a larger uptrend, or it might signal the beginning of a more substantial downward movement. Key support levels to monitor will be crucial in determining the short-term trajectory of $BTC. Market participants should remain vigilant and consider risk management strategies during this period of uncertainty.
Disclaimer: This content is for informational purposes only and does not constitute investment advice.
#BitcoinFallsBelow$83,000
Bitcoin has recently fallen below the significant psychological level of $83,000, sparking concern among investors. This price action indicates a potential shift in market sentiment, with sellers potentially gaining momentum. Traders will be closely watching to see if this level becomes resistance or if buyers step in to defend it. The broader market may experience increased volatility as a result of this move, with altcoins potentially following Bitcoin's lead.
This pullback could be a healthy correction in a larger uptrend, or it might signal the beginning of a more substantial downward movement. Key support levels to monitor will be crucial in determining the short-term trajectory of $BTC . Market participants should remain vigilant and consider risk management strategies during this period of uncertainty.
Disclaimer: This content is for informational purposes only and does not constitute investment advice.
#BitcoinFallsBelow$83,000
This pullback could be a healthy correction in a larger uptrend, or it might signal the beginning of a more substantial downward movement. Key support levels to monitor will be crucial in determining the short-term trajectory of $BTC . Market participants should remain vigilant and consider risk management strategies during this period of uncertainty.
Disclaimer: This content is for informational purposes only and does not constitute investment advice.
#BitcoinFallsBelow$83,000
9

·
--
BTC falls below $83,000 and trends on hot lists|Price has already rebounded to around $84,400|I only look at whether the recovery can hold
My stance is cautious—I’m not chasing the first bounce from the lows in this leg. On Binance Square, the current accurate trending topic is #BitcoinFallsBelow$83,000, and the time point given by Binance News’ official account is 09:35 UTC on September 24. At that time, BTC was around 82,889.89 USDT and down 3.41% over 24 hours. That statement is about that moment—not the current situation still being below 83,000. Looking at KuCoin spot as well: at the time of writing, BTC is about $84,489; over the past 24 hours, the low was 82,868 and the high was 84,923—so it has recovered roughly $1,600 from the low. The two platforms use different figures, but both confirm that the “fall below 83,000” happened, and neither can prove that this rebound is firmly established. Treating an old “fell below” report as a real-time quote right now would amplify the risks of chasing shorts and trying to bottom.
This kind of volatility is heating up alongside the macro discussion about interest rates: the Square is still debating long-term bond yields and the probability of an October rate hike. But the Federal Reserve’s official decision on September 16 was about existing policy—not a promise from the central bank—so you can’t write it as “the rate hike has already been decided.” Mechanistically, if the risk-free yield rises, the opportunity cost of holding high-volatility assets may increase, and leveraged accounts are also more likely to be forced into passive deleveraging during sudden selloffs. Conversely, once BTC has been reclaimed from around 83,000, short-covering and spot bids may both participate. You can’t separate each contribution based on the price path alone. I don’t simply pin this dip on an unverified new policy, and I also won’t assume institutional funds have returned just because there was an intraday bounce.
More useful next is testing the quality of the recovery. 83,000 is the sentiment anchor for this topic; 82,868 is KuCoin’s verified low over the last 24 hours. Above that, 84,900 to 85,000 is the day’s high and the round-number level. If BTC manages to stay above 85,000 for two complete 15-minute candles, then pulls back to 84,600–85,000 without breaking it, that would be evidence that the short-term repair can continue. If it falls back below 83,000 again and keeps failing to reclaim it, my repair thesis would be invalidated—and “it just bounced” can’t replace risk control.
If this were my own trade, I would not participate. I would only keep a conditional small spot-long exposure. With all the above “hold and pullback” conditions satisfied, I would enter with at most 0.3% of total capital. I’d cut the position in half at 85,800, and close the remaining position near 86,500. After entry, if within 15 minutes price recovers to below 84,300, I’d cut another half; if it touches 83,900, I’d stop out and close the trade. If I haven’t entered yet and it breaks below 82,868 first, I’ll cancel the plan directly. Without confirmation, I’ll stay at zero position—no high leverage—and I won’t describe the plan as if the trade has already been executed.
Source: Binance News’ market quick report at the time, KuCoin BTC/USDT spot, and the Federal Reserve’s official statement from September 16. #BitcoinFallsBelow$83,000 #BTC
The above is only personal market observation and does not constitute investment advice.
BTC falls below $83,000 and trends on hot lists|Price has already rebounded to around $84,400|I only look at whether the recovery can hold
My stance is cautious—I’m not chasing the first bounce from the lows in this leg. On Binance Square, the current accurate trending topic is #BitcoinFallsBelow$83,000, and the time point given by Binance News’ official account is 09:35 UTC on September 24. At that time, BTC was around 82,889.89 USDT and down 3.41% over 24 hours. That statement is about that moment—not the current situation still being below 83,000. Looking at KuCoin spot as well: at the time of writing, BTC is about $84,489; over the past 24 hours, the low was 82,868 and the high was 84,923—so it has recovered roughly $1,600 from the low. The two platforms use different figures, but both confirm that the “fall below 83,000” happened, and neither can prove that this rebound is firmly established. Treating an old “fell below” report as a real-time quote right now would amplify the risks of chasing shorts and trying to bottom.
This kind of volatility is heating up alongside the macro discussion about interest rates: the Square is still debating long-term bond yields and the probability of an October rate hike. But the Federal Reserve’s official decision on September 16 was about existing policy—not a promise from the central bank—so you can’t write it as “the rate hike has already been decided.” Mechanistically, if the risk-free yield rises, the opportunity cost of holding high-volatility assets may increase, and leveraged accounts are also more likely to be forced into passive deleveraging during sudden selloffs. Conversely, once BTC has been reclaimed from around 83,000, short-covering and spot bids may both participate. You can’t separate each contribution based on the price path alone. I don’t simply pin this dip on an unverified new policy, and I also won’t assume institutional funds have returned just because there was an intraday bounce.
More useful next is testing the quality of the recovery. 83,000 is the sentiment anchor for this topic; 82,868 is KuCoin’s verified low over the last 24 hours. Above that, 84,900 to 85,000 is the day’s high and the round-number level. If BTC manages to stay above 85,000 for two complete 15-minute candles, then pulls back to 84,600–85,000 without breaking it, that would be evidence that the short-term repair can continue. If it falls back below 83,000 again and keeps failing to reclaim it, my repair thesis would be invalidated—and “it just bounced” can’t replace risk control.
If this were my own trade, I would not participate. I would only keep a conditional small spot-long exposure. With all the above “hold and pullback” conditions satisfied, I would enter with at most 0.3% of total capital. I’d cut the position in half at 85,800, and close the remaining position near 86,500. After entry, if within 15 minutes price recovers to below 84,300, I’d cut another half; if it touches 83,900, I’d stop out and close the trade. If I haven’t entered yet and it breaks below 82,868 first, I’ll cancel the plan directly. Without confirmation, I’ll stay at zero position—no high leverage—and I won’t describe the plan as if the trade has already been executed.
Source: Binance News’ market quick report at the time, KuCoin BTC/USDT spot, and the Federal Reserve’s official statement from September 16. #BitcoinFallsBelow$83,000 #BTC
The above is only personal market observation and does not constitute investment advice.
My stance is cautious—I’m not chasing the first bounce from the lows in this leg. On Binance Square, the current accurate trending topic is #BitcoinFallsBelow$83,000, and the time point given by Binance News’ official account is 09:35 UTC on September 24. At that time, BTC was around 82,889.89 USDT and down 3.41% over 24 hours. That statement is about that moment—not the current situation still being below 83,000. Looking at KuCoin spot as well: at the time of writing, BTC is about $84,489; over the past 24 hours, the low was 82,868 and the high was 84,923—so it has recovered roughly $1,600 from the low. The two platforms use different figures, but both confirm that the “fall below 83,000” happened, and neither can prove that this rebound is firmly established. Treating an old “fell below” report as a real-time quote right now would amplify the risks of chasing shorts and trying to bottom.
This kind of volatility is heating up alongside the macro discussion about interest rates: the Square is still debating long-term bond yields and the probability of an October rate hike. But the Federal Reserve’s official decision on September 16 was about existing policy—not a promise from the central bank—so you can’t write it as “the rate hike has already been decided.” Mechanistically, if the risk-free yield rises, the opportunity cost of holding high-volatility assets may increase, and leveraged accounts are also more likely to be forced into passive deleveraging during sudden selloffs. Conversely, once BTC has been reclaimed from around 83,000, short-covering and spot bids may both participate. You can’t separate each contribution based on the price path alone. I don’t simply pin this dip on an unverified new policy, and I also won’t assume institutional funds have returned just because there was an intraday bounce.
More useful next is testing the quality of the recovery. 83,000 is the sentiment anchor for this topic; 82,868 is KuCoin’s verified low over the last 24 hours. Above that, 84,900 to 85,000 is the day’s high and the round-number level. If BTC manages to stay above 85,000 for two complete 15-minute candles, then pulls back to 84,600–85,000 without breaking it, that would be evidence that the short-term repair can continue. If it falls back below 83,000 again and keeps failing to reclaim it, my repair thesis would be invalidated—and “it just bounced” can’t replace risk control.
If this were my own trade, I would not participate. I would only keep a conditional small spot-long exposure. With all the above “hold and pullback” conditions satisfied, I would enter with at most 0.3% of total capital. I’d cut the position in half at 85,800, and close the remaining position near 86,500. After entry, if within 15 minutes price recovers to below 84,300, I’d cut another half; if it touches 83,900, I’d stop out and close the trade. If I haven’t entered yet and it breaks below 82,868 first, I’ll cancel the plan directly. Without confirmation, I’ll stay at zero position—no high leverage—and I won’t describe the plan as if the trade has already been executed.
Source: Binance News’ market quick report at the time, KuCoin BTC/USDT spot, and the Federal Reserve’s official statement from September 16. #BitcoinFallsBelow$83,000 #BTC
The above is only personal market observation and does not constitute investment advice.

68
·
--
BTC falls below $83,000|Current price back near $84,100|Are the rebound claims true or false?
My stance is to be defensive first. I don’t automatically equate a return above an integer level with a genuine trend repair. Binance Square is discussing #BitcoinFallsBelow$83,000; Binance News cites Binance market data stating that at 09:35 UTC on September 24, Bitcoin briefly traded around $82,889.89, falling below $83,000. Also, based on the KuCoin BTC/USDT spot prices I checked while writing, the price is about $84,106; the 24-hour low is $82,868 and the high is $85,934, with a 24-hour change of roughly -1.84%.
These two quotes come from different exchanges and different timestamps. They indicate: after a break, a bounce can’t be used to deny the prior moment’s breakdown; likewise, earlier selloff magnitude can’t prove that price is still in an ongoing急跌 (rapid drop) right now.
What I care about more is the trading mechanism behind this hot-board activity. When the integer level gets breached, it triggers stop-losses, leverage adjustments, and short-term chasing. After that, the rebound could be passive short covering—or it could be real spot demand stepping in. You can’t distinguish these scenarios based on only an hour of price action.
On September 23, U.S. Treasury data showed the 10-year Treasury yield rose from 4.96% the previous day to 5.11%. This is the macro backdrop for risk assets—it’s not direct evidence that can be used to prove the immediate cause of this BTC drop. You shouldn’t mechanically stitch together a single “confirmed” causal chain using bond yields, ETF subscription activity, and liquidation rumor stories—especially liquidation amounts that haven’t been verified. I won’t write them as facts.
The key now is whether price can stay firmly above $84,000, not whether it briefly touches during intraday moves. $83,000 is the breakdown level reflected by the hot board; around $82,868 is KuCoin’s 24-hour low for this move. On the upside, I’m looking at the recovery zone of $84,500–$84,800, then the 24-hour high near $85,900. If price keeps trading above $84,500 and the subsequent pullback attracts buyers, then my cautious short-term view would be overturned. But if price falls back below $83,000 and approaches $82,868, then I’ll admit the rebound hasn’t completed a repair. If Treasury yields continue rising, you should lower confidence in any single rebound even further.
If I were trading this myself, I wouldn’t chase here—I’d stay flat (no position). I’d only use a spot long with no more than 0.3% of total capital and no leverage if BTC prints two consecutive full 15-minute candlesticks closing above $84,500, and then the pullback to $84,200–$84,500 holds.
My first target would be around $85,000 to cut half the position; the remaining position would be closed in batches around $85,800–$85,900. After entry, if a 15-minute candle closes back below $83,900, I’d cut the position in half first. If $83,000 is lost, I would fully stop out and close the trade. If price breaks first below $82,868, the long plan above would be canceled immediately. If after two hours price still can’t break above $85,000, I’d exit the remaining position—I won’t treat conditional orders as already filled, and I won’t count untriggered plans as profit.
Source: Binance Square’s accurate hot-board report and Binance News’引用 of Binance market data; KuCoin BTC/USDT publicly available spot quotes; U.S. Treasury daily yield curves for September 22–23. #BitcoinFallsBelow$83,000 #BTC
The above is only my personal market observation and does not constitute investment advice.
BTC falls below $83,000|Current price back near $84,100|Are the rebound claims true or false?
My stance is to be defensive first. I don’t automatically equate a return above an integer level with a genuine trend repair. Binance Square is discussing #BitcoinFallsBelow$83,000; Binance News cites Binance market data stating that at 09:35 UTC on September 24, Bitcoin briefly traded around $82,889.89, falling below $83,000. Also, based on the KuCoin BTC/USDT spot prices I checked while writing, the price is about $84,106; the 24-hour low is $82,868 and the high is $85,934, with a 24-hour change of roughly -1.84%.
These two quotes come from different exchanges and different timestamps. They indicate: after a break, a bounce can’t be used to deny the prior moment’s breakdown; likewise, earlier selloff magnitude can’t prove that price is still in an ongoing急跌 (rapid drop) right now.
What I care about more is the trading mechanism behind this hot-board activity. When the integer level gets breached, it triggers stop-losses, leverage adjustments, and short-term chasing. After that, the rebound could be passive short covering—or it could be real spot demand stepping in. You can’t distinguish these scenarios based on only an hour of price action.
On September 23, U.S. Treasury data showed the 10-year Treasury yield rose from 4.96% the previous day to 5.11%. This is the macro backdrop for risk assets—it’s not direct evidence that can be used to prove the immediate cause of this BTC drop. You shouldn’t mechanically stitch together a single “confirmed” causal chain using bond yields, ETF subscription activity, and liquidation rumor stories—especially liquidation amounts that haven’t been verified. I won’t write them as facts.
The key now is whether price can stay firmly above $84,000, not whether it briefly touches during intraday moves. $83,000 is the breakdown level reflected by the hot board; around $82,868 is KuCoin’s 24-hour low for this move. On the upside, I’m looking at the recovery zone of $84,500–$84,800, then the 24-hour high near $85,900. If price keeps trading above $84,500 and the subsequent pullback attracts buyers, then my cautious short-term view would be overturned. But if price falls back below $83,000 and approaches $82,868, then I’ll admit the rebound hasn’t completed a repair. If Treasury yields continue rising, you should lower confidence in any single rebound even further.
If I were trading this myself, I wouldn’t chase here—I’d stay flat (no position). I’d only use a spot long with no more than 0.3% of total capital and no leverage if BTC prints two consecutive full 15-minute candlesticks closing above $84,500, and then the pullback to $84,200–$84,500 holds.
My first target would be around $85,000 to cut half the position; the remaining position would be closed in batches around $85,800–$85,900. After entry, if a 15-minute candle closes back below $83,900, I’d cut the position in half first. If $83,000 is lost, I would fully stop out and close the trade. If price breaks first below $82,868, the long plan above would be canceled immediately. If after two hours price still can’t break above $85,000, I’d exit the remaining position—I won’t treat conditional orders as already filled, and I won’t count untriggered plans as profit.
Source: Binance Square’s accurate hot-board report and Binance News’引用 of Binance market data; KuCoin BTC/USDT publicly available spot quotes; U.S. Treasury daily yield curves for September 22–23. #BitcoinFallsBelow$83,000 #BTC
The above is only my personal market observation and does not constitute investment advice.
My stance is to be defensive first. I don’t automatically equate a return above an integer level with a genuine trend repair. Binance Square is discussing #BitcoinFallsBelow$83,000; Binance News cites Binance market data stating that at 09:35 UTC on September 24, Bitcoin briefly traded around $82,889.89, falling below $83,000. Also, based on the KuCoin BTC/USDT spot prices I checked while writing, the price is about $84,106; the 24-hour low is $82,868 and the high is $85,934, with a 24-hour change of roughly -1.84%.
These two quotes come from different exchanges and different timestamps. They indicate: after a break, a bounce can’t be used to deny the prior moment’s breakdown; likewise, earlier selloff magnitude can’t prove that price is still in an ongoing急跌 (rapid drop) right now.
What I care about more is the trading mechanism behind this hot-board activity. When the integer level gets breached, it triggers stop-losses, leverage adjustments, and short-term chasing. After that, the rebound could be passive short covering—or it could be real spot demand stepping in. You can’t distinguish these scenarios based on only an hour of price action.
On September 23, U.S. Treasury data showed the 10-year Treasury yield rose from 4.96% the previous day to 5.11%. This is the macro backdrop for risk assets—it’s not direct evidence that can be used to prove the immediate cause of this BTC drop. You shouldn’t mechanically stitch together a single “confirmed” causal chain using bond yields, ETF subscription activity, and liquidation rumor stories—especially liquidation amounts that haven’t been verified. I won’t write them as facts.
The key now is whether price can stay firmly above $84,000, not whether it briefly touches during intraday moves. $83,000 is the breakdown level reflected by the hot board; around $82,868 is KuCoin’s 24-hour low for this move. On the upside, I’m looking at the recovery zone of $84,500–$84,800, then the 24-hour high near $85,900. If price keeps trading above $84,500 and the subsequent pullback attracts buyers, then my cautious short-term view would be overturned. But if price falls back below $83,000 and approaches $82,868, then I’ll admit the rebound hasn’t completed a repair. If Treasury yields continue rising, you should lower confidence in any single rebound even further.
If I were trading this myself, I wouldn’t chase here—I’d stay flat (no position). I’d only use a spot long with no more than 0.3% of total capital and no leverage if BTC prints two consecutive full 15-minute candlesticks closing above $84,500, and then the pullback to $84,200–$84,500 holds.
My first target would be around $85,000 to cut half the position; the remaining position would be closed in batches around $85,800–$85,900. After entry, if a 15-minute candle closes back below $83,900, I’d cut the position in half first. If $83,000 is lost, I would fully stop out and close the trade. If price breaks first below $82,868, the long plan above would be canceled immediately. If after two hours price still can’t break above $85,000, I’d exit the remaining position—I won’t treat conditional orders as already filled, and I won’t count untriggered plans as profit.
Source: Binance Square’s accurate hot-board report and Binance News’引用 of Binance market data; KuCoin BTC/USDT publicly available spot quotes; U.S. Treasury daily yield curves for September 22–23. #BitcoinFallsBelow$83,000 #BTC
The above is only my personal market observation and does not constitute investment advice.

114

·
--
Bitcoin falls below $83,000, hitting a recent low. In the past 24 hours, the price is down by about 5%, and trading volume has surged to $15 billion. Analysts say the market is concerned about the Federal Reserve raising interest rates and a slowdown in the global economy. Data from Coinbase shows that among global Bitcoin holders, about 37% are currently at a loss. This round of decline is mainly driven by a stronger U.S. dollar and outflows of institutional capital. #BitcoinFallsBelow$83,000 $BTC
#000 #BTC
Bitcoin falls below $83,000, hitting a recent low. In the past 24 hours, the price is down by about 5%, and trading volume has surged to $15 billion. Analysts say the market is concerned about the Federal Reserve raising interest rates and a slowdown in the global economy. Data from Coinbase shows that among global Bitcoin holders, about 37% are currently at a loss. This round of decline is mainly driven by a stronger U.S. dollar and outflows of institutional capital. #BitcoinFallsBelow$83,000 $BTC
#000 #BTC
#000 #BTC

·
--
$BTC Day 9 grade: chop, not a miss.
Yesterday's call was constructive while 62.4K held on 1H closes. It did not. Binance 1H candles closed below it and swept to 61,306.84 before reclaiming 63K.
Lesson: a reclaim after invalidation is still chop until it accepts above the failed level.
Today's call: BTC stays range-first unless 1H closes hold above 63.8K; below 62.4K puts 61.3K back in play.
#BitcoinFallsBelow$62K #USTechStockFuturesRise #OilFalls
$BTC Day 9 grade: chop, not a miss.
Yesterday's call was constructive while 62.4K held on 1H closes. It did not. Binance 1H candles closed below it and swept to 61,306.84 before reclaiming 63K.
Lesson: a reclaim after invalidation is still chop until it accepts above the failed level.
Today's call: BTC stays range-first unless 1H closes hold above 63.8K; below 62.4K puts 61.3K back in play.
#BitcoinFallsBelow$62K #USTechStockFuturesRise #OilFalls
Yesterday's call was constructive while 62.4K held on 1H closes. It did not. Binance 1H candles closed below it and swept to 61,306.84 before reclaiming 63K.
Lesson: a reclaim after invalidation is still chop until it accepts above the failed level.
Today's call: BTC stays range-first unless 1H closes hold above 63.8K; below 62.4K puts 61.3K back in play.
#BitcoinFallsBelow$62K #USTechStockFuturesRise #OilFalls
99

·
--
Fear & Greed reads 72, yet $BTC is flat on the day: 0.0% in 24h at $84,184.
The mood is warm but no longer rising. The index slipped from 73 yesterday, and it was 73 last week too.
The Square crowd leans bullish, with 2,477 bullish votes against 1,741 bearish. Market breadth agrees: 39 of 67 tracked coins are up and 28 are down.
Derivatives look more careful. Average funding across tracked coins is -0.0043%, while BTC funding is slightly positive at 0.0058%.
On BTC, 55.2% of accounts are long and 44.8% are short (ratio 1.23). Open interest still fell 1.2%, so traders are leaning long without adding fresh leverage.
After the "Bitcoin falls below $83,000" headline, price is back near the top of its $82,875–$84,942 range.
A greedy index, a flat price and negative funding on alts. Where do you stand on BTC right now: bull, bear or waiting?
#BitcoinFallsBelow$83,000 #MarketSentiment #FearAndGreed
Not financial advice. DYOR.
Fear & Greed reads 72, yet $BTC is flat on the day: 0.0% in 24h at $84,184.
The mood is warm but no longer rising. The index slipped from 73 yesterday, and it was 73 last week too.
The Square crowd leans bullish, with 2,477 bullish votes against 1,741 bearish. Market breadth agrees: 39 of 67 tracked coins are up and 28 are down.
Derivatives look more careful. Average funding across tracked coins is -0.0043%, while BTC funding is slightly positive at 0.0058%.
On BTC, 55.2% of accounts are long and 44.8% are short (ratio 1.23). Open interest still fell 1.2%, so traders are leaning long without adding fresh leverage.
After the "Bitcoin falls below $83,000" headline, price is back near the top of its $82,875–$84,942 range.
A greedy index, a flat price and negative funding on alts. Where do you stand on BTC right now: bull, bear or waiting?
#BitcoinFallsBelow$83,000 #MarketSentiment #FearAndGreed
Not financial advice. DYOR.
The mood is warm but no longer rising. The index slipped from 73 yesterday, and it was 73 last week too.
The Square crowd leans bullish, with 2,477 bullish votes against 1,741 bearish. Market breadth agrees: 39 of 67 tracked coins are up and 28 are down.
Derivatives look more careful. Average funding across tracked coins is -0.0043%, while BTC funding is slightly positive at 0.0058%.
On BTC, 55.2% of accounts are long and 44.8% are short (ratio 1.23). Open interest still fell 1.2%, so traders are leaning long without adding fresh leverage.
After the "Bitcoin falls below $83,000" headline, price is back near the top of its $82,875–$84,942 range.
A greedy index, a flat price and negative funding on alts. Where do you stand on BTC right now: bull, bear or waiting?
#BitcoinFallsBelow$83,000 #MarketSentiment #FearAndGreed
Not financial advice. DYOR.
tinhvuc:
No
1
2
96
Hedging-style love
In the deep night of September, only one light remained on in the office towers of Lujiazui, Shanghai. Lin Wan stared at the bouncing K-line chart on her screen, her fingertips trembling slightly. Bitcoin had just broken below $83,000, and her long position was already sitting on an unrealized loss of over 20,000 U.
"Aren’t you going to close?" Lu Chen’s voice came through her headset—low, with a hint of helplessness.
"I don’t believe it will keep falling." She pressed her lips together.
"I do," he said. "My short position has doubled."
Lin Wan and Lu Chen met in a Binance futures trading group. Back then, Bitcoin was still trading in the $60,000 range, and the group would argue nonstop every day. The people going long and the people going short were like two camps—nobody could convince the other. Only the technical analysis posts Lin Wan shared always managed to quiet both sides for three minutes at a time.
Lu Chen was the first person to message her privately. He said, Your way of drawing moving averages is interesting, but there’s a blind spot. She refused to accept it. The two of them talked from technical indicators to on-chain data, from MACD to funding rates, for three straight days and three nights.
Later they added each other on WeChat. Then, eventually, they began calling out trades to each other.
Lu Chen was a natural bear. He could always smell danger in the market at its most feverish. Lin Wan was the exact opposite—she was a steadfast believer in longs, convinced that every dip was an opportunity to get in. Friends said they were natural enemies, but only they knew that within this opposition there was a strange kind of harmony.
"You go long, I go short. No matter which way it moves, one of us is always making money." The first time Lu Chen said this, Lin Wan laughed. She thought it was the most romantic confession she’d ever heard.
They really did it that way. Every time they opened a position, they always stood on opposite sides. When Lin Wan went long on BTC, Lu Chen was definitely short BTC. When Lin Wan added to her NOM position, Lu Chen stood by coldly saying, I’ve shorted this coin.
Today was no exception.
Bitcoin slid from 85,000 all the way down to 82,000, and the margin ratio of Lin Wan’s long position had already fallen to dangerous levels. Her hand hovered above the close-position button, but she kept not pressing it.
"Wan Wan, listen to me." Lu Chen’s voice suddenly turned gentle. "Close first. Wait until things stabilize before you re-enter. I won’t run, and my short won’t run either."
"Why don’t you try to talk me into holding on?"
"Because I don’t want to win your money." He said, "I want to win you."
Lin Wan’s eyes suddenly reddened. She pressed the close-position button, watching her floating loss turn into a realized loss—but somehow, her heart settled.
At 2 a.m., Lu Chen appeared downstairs at her company. In his hands were two cups of coffee: one Americano, one oat latte. He knew that when she stayed up late, she only drank Americano.
"How did you end up here?"
"You said you were going to work overtime. I wasn’t at ease." He handed her the coffee. "Also, your short’s counterparty wants to see you."
Lin Wan took the coffee, her fingertips brushing his hand. In that moment, she suddenly felt that in a world full of K-lines, funding rates, and liquidation notifications, there was someone willing to always stand on the other side of you—not to defeat you, but no matter whether you win or lose, they’ll be there.
This is hedging-style love.
You hold the world’s hope long; I short the world’s bubble. Between up and down, there’s always one of us making money—and there’s always one of us losing money. But the important thing is that no matter how the market moves, when you add our accounts together, it will always be positive.
Later, Lin Wan posted a status update on the Binance Plaza. She only wrote one sentence: Thank you to the person who will always be opposite me in direction—letting me know that the optimal solution to love isn’t moving together in the same direction, but that no matter how it rises or falls, there’s someone by your side.
Lu Chen commented below: Your long positions are closed, and my heart is still fully loaded.
That night, Bitcoin rebounded to 84,000. Lin Wan opened a long position again; Lu Chen remained short. They watched their own screens and smiled to themselves.
Outside the window, Shanghai’s skyline glittered in the night, just like an endless K-line chart. And in some corner of this city, two traders sat across from each other at the same table, drinking from the same pot of coffee, waiting for the next dawn that belonged to them.
#BinanceWillListHyperliquid(HYPE) #BitcoinFallsBelow$83,000 #FedOctoberRateHikeOddsRiseTo69.7%
Hedging-style love
In the deep night of September, only one light remained on in the office towers of Lujiazui, Shanghai. Lin Wan stared at the bouncing K-line chart on her screen, her fingertips trembling slightly. Bitcoin had just broken below $83,000, and her long position was already sitting on an unrealized loss of over 20,000 U.
"Aren’t you going to close?" Lu Chen’s voice came through her headset—low, with a hint of helplessness.
"I don’t believe it will keep falling." She pressed her lips together.
"I do," he said. "My short position has doubled."
Lin Wan and Lu Chen met in a Binance futures trading group. Back then, Bitcoin was still trading in the $60,000 range, and the group would argue nonstop every day. The people going long and the people going short were like two camps—nobody could convince the other. Only the technical analysis posts Lin Wan shared always managed to quiet both sides for three minutes at a time.
Lu Chen was the first person to message her privately. He said, Your way of drawing moving averages is interesting, but there’s a blind spot. She refused to accept it. The two of them talked from technical indicators to on-chain data, from MACD to funding rates, for three straight days and three nights.
Later they added each other on WeChat. Then, eventually, they began calling out trades to each other.
Lu Chen was a natural bear. He could always smell danger in the market at its most feverish. Lin Wan was the exact opposite—she was a steadfast believer in longs, convinced that every dip was an opportunity to get in. Friends said they were natural enemies, but only they knew that within this opposition there was a strange kind of harmony.
"You go long, I go short. No matter which way it moves, one of us is always making money." The first time Lu Chen said this, Lin Wan laughed. She thought it was the most romantic confession she’d ever heard.
They really did it that way. Every time they opened a position, they always stood on opposite sides. When Lin Wan went long on BTC, Lu Chen was definitely short BTC. When Lin Wan added to her NOM position, Lu Chen stood by coldly saying, I’ve shorted this coin.
Today was no exception.
Bitcoin slid from 85,000 all the way down to 82,000, and the margin ratio of Lin Wan’s long position had already fallen to dangerous levels. Her hand hovered above the close-position button, but she kept not pressing it.
"Wan Wan, listen to me." Lu Chen’s voice suddenly turned gentle. "Close first. Wait until things stabilize before you re-enter. I won’t run, and my short won’t run either."
"Why don’t you try to talk me into holding on?"
"Because I don’t want to win your money." He said, "I want to win you."
Lin Wan’s eyes suddenly reddened. She pressed the close-position button, watching her floating loss turn into a realized loss—but somehow, her heart settled.
At 2 a.m., Lu Chen appeared downstairs at her company. In his hands were two cups of coffee: one Americano, one oat latte. He knew that when she stayed up late, she only drank Americano.
"How did you end up here?"
"You said you were going to work overtime. I wasn’t at ease." He handed her the coffee. "Also, your short’s counterparty wants to see you."
Lin Wan took the coffee, her fingertips brushing his hand. In that moment, she suddenly felt that in a world full of K-lines, funding rates, and liquidation notifications, there was someone willing to always stand on the other side of you—not to defeat you, but no matter whether you win or lose, they’ll be there.
This is hedging-style love.
You hold the world’s hope long; I short the world’s bubble. Between up and down, there’s always one of us making money—and there’s always one of us losing money. But the important thing is that no matter how the market moves, when you add our accounts together, it will always be positive.
Later, Lin Wan posted a status update on the Binance Plaza. She only wrote one sentence: Thank you to the person who will always be opposite me in direction—letting me know that the optimal solution to love isn’t moving together in the same direction, but that no matter how it rises or falls, there’s someone by your side.
Lu Chen commented below: Your long positions are closed, and my heart is still fully loaded.
That night, Bitcoin rebounded to 84,000. Lin Wan opened a long position again; Lu Chen remained short. They watched their own screens and smiled to themselves.
Outside the window, Shanghai’s skyline glittered in the night, just like an endless K-line chart. And in some corner of this city, two traders sat across from each other at the same table, drinking from the same pot of coffee, waiting for the next dawn that belonged to them.
#BinanceWillListHyperliquid(HYPE) #BitcoinFallsBelow$83,000 #FedOctoberRateHikeOddsRiseTo69.7%
In the deep night of September, only one light remained on in the office towers of Lujiazui, Shanghai. Lin Wan stared at the bouncing K-line chart on her screen, her fingertips trembling slightly. Bitcoin had just broken below $83,000, and her long position was already sitting on an unrealized loss of over 20,000 U.
"Aren’t you going to close?" Lu Chen’s voice came through her headset—low, with a hint of helplessness.
"I don’t believe it will keep falling." She pressed her lips together.
"I do," he said. "My short position has doubled."
Lin Wan and Lu Chen met in a Binance futures trading group. Back then, Bitcoin was still trading in the $60,000 range, and the group would argue nonstop every day. The people going long and the people going short were like two camps—nobody could convince the other. Only the technical analysis posts Lin Wan shared always managed to quiet both sides for three minutes at a time.
Lu Chen was the first person to message her privately. He said, Your way of drawing moving averages is interesting, but there’s a blind spot. She refused to accept it. The two of them talked from technical indicators to on-chain data, from MACD to funding rates, for three straight days and three nights.
Later they added each other on WeChat. Then, eventually, they began calling out trades to each other.
Lu Chen was a natural bear. He could always smell danger in the market at its most feverish. Lin Wan was the exact opposite—she was a steadfast believer in longs, convinced that every dip was an opportunity to get in. Friends said they were natural enemies, but only they knew that within this opposition there was a strange kind of harmony.
"You go long, I go short. No matter which way it moves, one of us is always making money." The first time Lu Chen said this, Lin Wan laughed. She thought it was the most romantic confession she’d ever heard.
They really did it that way. Every time they opened a position, they always stood on opposite sides. When Lin Wan went long on BTC, Lu Chen was definitely short BTC. When Lin Wan added to her NOM position, Lu Chen stood by coldly saying, I’ve shorted this coin.
Today was no exception.
Bitcoin slid from 85,000 all the way down to 82,000, and the margin ratio of Lin Wan’s long position had already fallen to dangerous levels. Her hand hovered above the close-position button, but she kept not pressing it.
"Wan Wan, listen to me." Lu Chen’s voice suddenly turned gentle. "Close first. Wait until things stabilize before you re-enter. I won’t run, and my short won’t run either."
"Why don’t you try to talk me into holding on?"
"Because I don’t want to win your money." He said, "I want to win you."
Lin Wan’s eyes suddenly reddened. She pressed the close-position button, watching her floating loss turn into a realized loss—but somehow, her heart settled.
At 2 a.m., Lu Chen appeared downstairs at her company. In his hands were two cups of coffee: one Americano, one oat latte. He knew that when she stayed up late, she only drank Americano.
"How did you end up here?"
"You said you were going to work overtime. I wasn’t at ease." He handed her the coffee. "Also, your short’s counterparty wants to see you."
Lin Wan took the coffee, her fingertips brushing his hand. In that moment, she suddenly felt that in a world full of K-lines, funding rates, and liquidation notifications, there was someone willing to always stand on the other side of you—not to defeat you, but no matter whether you win or lose, they’ll be there.
This is hedging-style love.
You hold the world’s hope long; I short the world’s bubble. Between up and down, there’s always one of us making money—and there’s always one of us losing money. But the important thing is that no matter how the market moves, when you add our accounts together, it will always be positive.
Later, Lin Wan posted a status update on the Binance Plaza. She only wrote one sentence: Thank you to the person who will always be opposite me in direction—letting me know that the optimal solution to love isn’t moving together in the same direction, but that no matter how it rises or falls, there’s someone by your side.
Lu Chen commented below: Your long positions are closed, and my heart is still fully loaded.
That night, Bitcoin rebounded to 84,000. Lin Wan opened a long position again; Lu Chen remained short. They watched their own screens and smiled to themselves.
Outside the window, Shanghai’s skyline glittered in the night, just like an endless K-line chart. And in some corner of this city, two traders sat across from each other at the same table, drinking from the same pot of coffee, waiting for the next dawn that belonged to them.
#BinanceWillListHyperliquid(HYPE) #BitcoinFallsBelow$83,000 #FedOctoberRateHikeOddsRiseTo69.7%
166
When the 10-year Treasury yield spikes to multi-decade highs, risk assets almost never get a free pass, even when market sentiment sits firmly in greed territory.
Most traders get trapped buying breakout candles on leverage because they fixate on local chart patterns while completely ignoring the macro cost of capital. It feels like easy upside until liquidity quietly gets pulled from the order books.
Here is what is actually happening behind the scenes. When risk-free government paper offers attractive baseline returns, institutional capital stops chasing speculative upside and rotates back toward yield. That means less fresh liquidity flowing into $BTC, while borrowing costs for market makers and desk traders become significantly more expensive.
We often see capital retreat into defensive plays like $USDT well before the average retail trader realizes the market is running on fumes. If bond yields continue pushing higher, maintaining heavy risk exposure becomes harder to justify for larger funds, which historically sets the stage for sudden leverage flushes.
Are you de-risking your portfolio at these levels, or do you think crypto decouples this time around?
#US10YTreasuryYieldHits19YearHigh #US30YearYieldHighestSince2004 #BitcoinFallsBelow
When the 10-year Treasury yield spikes to multi-decade highs, risk assets almost never get a free pass, even when market sentiment sits firmly in greed territory.
Most traders get trapped buying breakout candles on leverage because they fixate on local chart patterns while completely ignoring the macro cost of capital. It feels like easy upside until liquidity quietly gets pulled from the order books.
Here is what is actually happening behind the scenes. When risk-free government paper offers attractive baseline returns, institutional capital stops chasing speculative upside and rotates back toward yield. That means less fresh liquidity flowing into $BTC , while borrowing costs for market makers and desk traders become significantly more expensive.
We often see capital retreat into defensive plays like $USDT well before the average retail trader realizes the market is running on fumes. If bond yields continue pushing higher, maintaining heavy risk exposure becomes harder to justify for larger funds, which historically sets the stage for sudden leverage flushes.
Are you de-risking your portfolio at these levels, or do you think crypto decouples this time around?
#US10YTreasuryYieldHits19YearHigh #US30YearYieldHighestSince2004 #BitcoinFallsBelow
Most traders get trapped buying breakout candles on leverage because they fixate on local chart patterns while completely ignoring the macro cost of capital. It feels like easy upside until liquidity quietly gets pulled from the order books.
Here is what is actually happening behind the scenes. When risk-free government paper offers attractive baseline returns, institutional capital stops chasing speculative upside and rotates back toward yield. That means less fresh liquidity flowing into $BTC , while borrowing costs for market makers and desk traders become significantly more expensive.
We often see capital retreat into defensive plays like $USDT well before the average retail trader realizes the market is running on fumes. If bond yields continue pushing higher, maintaining heavy risk exposure becomes harder to justify for larger funds, which historically sets the stage for sudden leverage flushes.
Are you de-risking your portfolio at these levels, or do you think crypto decouples this time around?
#US10YTreasuryYieldHits19YearHigh #US30YearYieldHighestSince2004 #BitcoinFallsBelow

19
·
--
everyone thinks the fed is pivoting hard to rate cuts but actually october hike odds just jumped to 69%.
ngl ser this is how bags get wrecked. people keep fomo buying every $btc dip thinking the bottom is in while the liquidity tap is about to get shut off.
look at 2022 as the case study here. hike probabilities spiked and $eth dumped from 4k all the way down while alts got absolutely demolished. anyone who didn't rotate into $usdt got left holding the bag for months.
the 10 year yield already hitting 19 year highs is the real tell. this isn't some distant macro event it's happening now and risk assets always feel it first.
where do you think this goes from here?
#FedOctoberRateHikeOddsRiseTo69 #US10YTreasuryYieldHits19YearHigh #BitcoinFallsBelow
everyone thinks the fed is pivoting hard to rate cuts but actually october hike odds just jumped to 69%.
ngl ser this is how bags get wrecked. people keep fomo buying every $btc dip thinking the bottom is in while the liquidity tap is about to get shut off.
look at 2022 as the case study here. hike probabilities spiked and $eth dumped from 4k all the way down while alts got absolutely demolished. anyone who didn't rotate into $usdt got left holding the bag for months.
the 10 year yield already hitting 19 year highs is the real tell. this isn't some distant macro event it's happening now and risk assets always feel it first.
where do you think this goes from here?
#FedOctoberRateHikeOddsRiseTo69 #US10YTreasuryYieldHits19YearHigh #BitcoinFallsBelow
ngl ser this is how bags get wrecked. people keep fomo buying every $btc dip thinking the bottom is in while the liquidity tap is about to get shut off.
look at 2022 as the case study here. hike probabilities spiked and $eth dumped from 4k all the way down while alts got absolutely demolished. anyone who didn't rotate into $usdt got left holding the bag for months.
the 10 year yield already hitting 19 year highs is the real tell. this isn't some distant macro event it's happening now and risk assets always feel it first.
where do you think this goes from here?
#FedOctoberRateHikeOddsRiseTo69 #US10YTreasuryYieldHits19YearHigh #BitcoinFallsBelow

135
·
--
📰 81% of Bitcoin is idle—bullish signal or a liquidity crisis?
Just a couple of days ago, I discussed some unusual on-chain holding data, and now there’s new development. River’s data shows that 81% of Bitcoin has been idle for 6 months—meaning a large amount of coins are effectively locked away by big whales, and market liquidity has shrunk sharply. What does this mean for prices? Is it a sign that institutions are accumulating, or a ticking time bomb of potential selling pressure?
Why is this news important?
Behind it is a fundamental shift in Bitcoin holders’ behavior. When 81% of the supply chooses long-term holding and no longer participates in short-term volatility, Bitcoin gradually evolves from a “trading asset” into a “quasi-monetary asset.” This implies: 1) price movements require stronger news catalysts; 2) whales could sell at any time due to funding needs (such as project spending or loan arbitrage), but it wouldn’t be short-term behavior. This clashes with the recent months’ pattern of frequent whale account activity, suggesting that a larger pool of capital may be calling the shots.
Impact on the market
In the short term, reduced liquidity tends to suppress volatility, which favors bulls and supports price control. If BTC holds above $84K, it would imply strong whale lock-in—an overall bullish signal. But if it breaks below $82K, this bullish thesis falls apart, and whales could trigger segmented distribution. Over the long run, if this trend continues, Bitcoin’s “store-of-value” characteristics—similar to gold—may strengthen, but upside room for speculation could be compressed.
💡 I think this 81% idle rate is a major positive. As long as BTC stays above $83K, even if there’s a short-term pullback, it could be an opportunity for institutional positioning. If the Fed suddenly hikes rates by 75 basis points, this view would be invalidated.
【Conditions under which this view is invalidated】If the Fed raises rates by 75 basis points at the December FOMC meeting, this view would be invalidated.
【Voluntary disclosure of stance】This article has no sponsorship from any project. The author does not hold any of the assets mentioned.
⚠️ This does not constitute investment advice; forecasts are for reference only
#BitcoinFallsBelow$83,000
#BTC $BTC
📰 81% of Bitcoin is idle—bullish signal or a liquidity crisis?
Just a couple of days ago, I discussed some unusual on-chain holding data, and now there’s new development. River’s data shows that 81% of Bitcoin has been idle for 6 months—meaning a large amount of coins are effectively locked away by big whales, and market liquidity has shrunk sharply. What does this mean for prices? Is it a sign that institutions are accumulating, or a ticking time bomb of potential selling pressure?
Why is this news important?
Behind it is a fundamental shift in Bitcoin holders’ behavior. When 81% of the supply chooses long-term holding and no longer participates in short-term volatility, Bitcoin gradually evolves from a “trading asset” into a “quasi-monetary asset.” This implies: 1) price movements require stronger news catalysts; 2) whales could sell at any time due to funding needs (such as project spending or loan arbitrage), but it wouldn’t be short-term behavior. This clashes with the recent months’ pattern of frequent whale account activity, suggesting that a larger pool of capital may be calling the shots.
Impact on the market
In the short term, reduced liquidity tends to suppress volatility, which favors bulls and supports price control. If BTC holds above $84K, it would imply strong whale lock-in—an overall bullish signal. But if it breaks below $82K, this bullish thesis falls apart, and whales could trigger segmented distribution. Over the long run, if this trend continues, Bitcoin’s “store-of-value” characteristics—similar to gold—may strengthen, but upside room for speculation could be compressed.
💡 I think this 81% idle rate is a major positive. As long as BTC stays above $83K, even if there’s a short-term pullback, it could be an opportunity for institutional positioning. If the Fed suddenly hikes rates by 75 basis points, this view would be invalidated.
【Conditions under which this view is invalidated】If the Fed raises rates by 75 basis points at the December FOMC meeting, this view would be invalidated.
【Voluntary disclosure of stance】This article has no sponsorship from any project. The author does not hold any of the assets mentioned.
⚠️ This does not constitute investment advice; forecasts are for reference only
#BitcoinFallsBelow$83,000
#BTC $BTC
Just a couple of days ago, I discussed some unusual on-chain holding data, and now there’s new development. River’s data shows that 81% of Bitcoin has been idle for 6 months—meaning a large amount of coins are effectively locked away by big whales, and market liquidity has shrunk sharply. What does this mean for prices? Is it a sign that institutions are accumulating, or a ticking time bomb of potential selling pressure?
Why is this news important?
Behind it is a fundamental shift in Bitcoin holders’ behavior. When 81% of the supply chooses long-term holding and no longer participates in short-term volatility, Bitcoin gradually evolves from a “trading asset” into a “quasi-monetary asset.” This implies: 1) price movements require stronger news catalysts; 2) whales could sell at any time due to funding needs (such as project spending or loan arbitrage), but it wouldn’t be short-term behavior. This clashes with the recent months’ pattern of frequent whale account activity, suggesting that a larger pool of capital may be calling the shots.
Impact on the market
In the short term, reduced liquidity tends to suppress volatility, which favors bulls and supports price control. If BTC holds above $84K, it would imply strong whale lock-in—an overall bullish signal. But if it breaks below $82K, this bullish thesis falls apart, and whales could trigger segmented distribution. Over the long run, if this trend continues, Bitcoin’s “store-of-value” characteristics—similar to gold—may strengthen, but upside room for speculation could be compressed.
💡 I think this 81% idle rate is a major positive. As long as BTC stays above $83K, even if there’s a short-term pullback, it could be an opportunity for institutional positioning. If the Fed suddenly hikes rates by 75 basis points, this view would be invalidated.
【Conditions under which this view is invalidated】If the Fed raises rates by 75 basis points at the December FOMC meeting, this view would be invalidated.
【Voluntary disclosure of stance】This article has no sponsorship from any project. The author does not hold any of the assets mentioned.
⚠️ This does not constitute investment advice; forecasts are for reference only
#BitcoinFallsBelow$83,000
#BTC $BTC

91
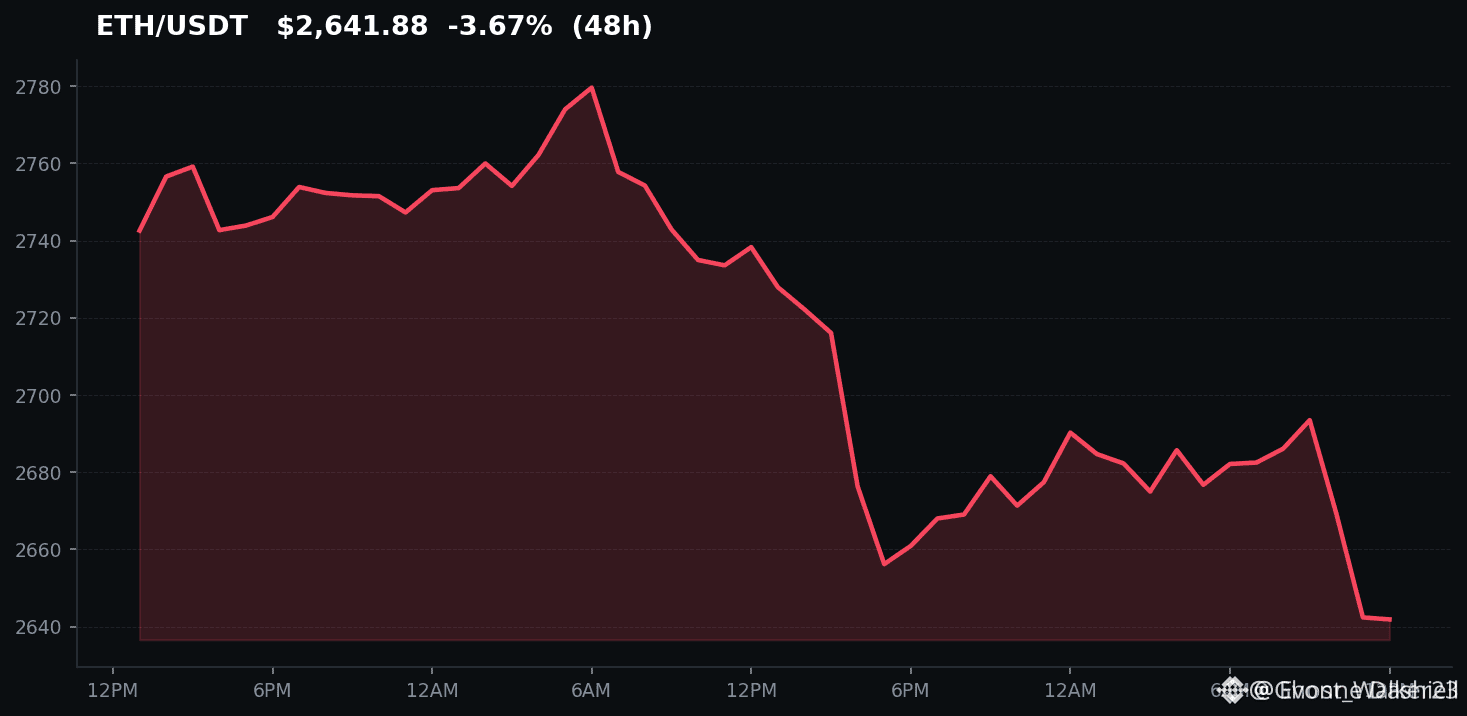
Have you noticed that $ETH breaking above resistance always gets framed as the start of a new leg higher, even when nothing else in the market is confirming it?
The real pain is buying that breakout and then freezing on the exit as it fails. Too many people either miss the move waiting for extra confirmation or chase it and get trapped with no plan.
This is a case study more than a celebration. The last few times Ethereum cleared a major level in a greed tape, the follow through lasted days, not weeks. Fear and Greed sitting at 73 already tells you the easy money is positioned. $BTC looking heavy underneath is the part most people are skipping. When Bitcoin cannot hold, these ETH pumps often rotate straight back into $USDT instead of turning into a real alt move. Rate hike odds climbing on top of that does not help the risk-on story. A breakout without breadth is just a headline.
Where do you think this goes from here?
#ETHBreaksAbove #BitcoinFallsBelow #FedOctoberRateHikeOddsRiseTo69
Have you noticed that $ETH breaking above resistance always gets framed as the start of a new leg higher, even when nothing else in the market is confirming it?
The real pain is buying that breakout and then freezing on the exit as it fails. Too many people either miss the move waiting for extra confirmation or chase it and get trapped with no plan.
This is a case study more than a celebration. The last few times Ethereum cleared a major level in a greed tape, the follow through lasted days, not weeks. Fear and Greed sitting at 73 already tells you the easy money is positioned. $BTC looking heavy underneath is the part most people are skipping. When Bitcoin cannot hold, these ETH pumps often rotate straight back into $USDT instead of turning into a real alt move. Rate hike odds climbing on top of that does not help the risk-on story. A breakout without breadth is just a headline.
Where do you think this goes from here?
#ETHBreaksAbove #BitcoinFallsBelow #FedOctoberRateHikeOddsRiseTo69
The real pain is buying that breakout and then freezing on the exit as it fails. Too many people either miss the move waiting for extra confirmation or chase it and get trapped with no plan.
This is a case study more than a celebration. The last few times Ethereum cleared a major level in a greed tape, the follow through lasted days, not weeks. Fear and Greed sitting at 73 already tells you the easy money is positioned. $BTC looking heavy underneath is the part most people are skipping. When Bitcoin cannot hold, these ETH pumps often rotate straight back into $USDT instead of turning into a real alt move. Rate hike odds climbing on top of that does not help the risk-on story. A breakout without breadth is just a headline.
Where do you think this goes from here?
#ETHBreaksAbove #BitcoinFallsBelow #FedOctoberRateHikeOddsRiseTo69
19
Why is nobody talking about how those daily Bitcoin ETF inflow headlines have turned into a retail trap?
Every time the numbers look strong, traders rush in expecting $BTC to explode, only to get chopped up when the market barely reacts. That FOMO has cost more people money this cycle than actual rugs.
The story everyone repeats is that institutional money flooding into spot ETFs is the ultimate bullish catalyst. I don't buy it at these levels. With greed sitting at 73, those inflows are being used as exit liquidity by smarter money that's been sitting on profits. Price action after the news is what matters, not the headline itself.
Instead of chasing, watch whether $BTC actually holds its range after the print. Keep a portion in $USDT so you can buy the dip that tends to show up a day or two later. $ETH is a decent tell too. If it isn't confirming the move, the whole thing is probably just noise.
Anyone else seeing these inflow numbers as a reason to stay patient rather than jump in?
#SpotBitcoinETFsInflow #BitcoinFallsBelow #ETHBreaksAbove
Why is nobody talking about how those daily Bitcoin ETF inflow headlines have turned into a retail trap?
Every time the numbers look strong, traders rush in expecting $BTC to explode, only to get chopped up when the market barely reacts. That FOMO has cost more people money this cycle than actual rugs.
The story everyone repeats is that institutional money flooding into spot ETFs is the ultimate bullish catalyst. I don't buy it at these levels. With greed sitting at 73, those inflows are being used as exit liquidity by smarter money that's been sitting on profits. Price action after the news is what matters, not the headline itself.
Instead of chasing, watch whether $BTC actually holds its range after the print. Keep a portion in $USDT so you can buy the dip that tends to show up a day or two later. $ETH is a decent tell too. If it isn't confirming the move, the whole thing is probably just noise.
Anyone else seeing these inflow numbers as a reason to stay patient rather than jump in?
#SpotBitcoinETFsInflow #BitcoinFallsBelow #ETHBreaksAbove
Every time the numbers look strong, traders rush in expecting $BTC to explode, only to get chopped up when the market barely reacts. That FOMO has cost more people money this cycle than actual rugs.
The story everyone repeats is that institutional money flooding into spot ETFs is the ultimate bullish catalyst. I don't buy it at these levels. With greed sitting at 73, those inflows are being used as exit liquidity by smarter money that's been sitting on profits. Price action after the news is what matters, not the headline itself.
Instead of chasing, watch whether $BTC actually holds its range after the print. Keep a portion in $USDT so you can buy the dip that tends to show up a day or two later. $ETH is a decent tell too. If it isn't confirming the move, the whole thing is probably just noise.
Anyone else seeing these inflow numbers as a reason to stay patient rather than jump in?
#SpotBitcoinETFsInflow #BitcoinFallsBelow #ETHBreaksAbove

7
Have you noticed how every single dip gets labeled as the start of a bear market the second sentiment gets slightly overheated?
Most traders keep panic-selling their positions at the exact bottom simply because they mistake local liquidity flushes for structural trend reversals. They buy high when euphoria takes over, then dump right into institutional bids the moment the chart prints a red candle.
Look at how $BTC behaves whenever leverage gets wiped out across major derivatives pairs. Spot volume stays remarkably resilient while late longs get liquidated, transferring supply directly from weak hands to patient accumulators. Even when pairs like $ETC or $FIL see correlated pullbacks, the underlying market structure rarely breaks on these rapid downward wicks.
Treating these pullbacks as catastrophic breakdowns rather than healthy resets is why retail consistently underperforms during sustained momentum phases. When open interest resets and funding rates normalize, the market simply creates a cleaner runway for the next leg up.
Where do you think this goes from here?
#BitcoinFallsBelow #BitcoinFallsToAround
Have you noticed how every single dip gets labeled as the start of a bear market the second sentiment gets slightly overheated?
Most traders keep panic-selling their positions at the exact bottom simply because they mistake local liquidity flushes for structural trend reversals. They buy high when euphoria takes over, then dump right into institutional bids the moment the chart prints a red candle.
Look at how $BTC behaves whenever leverage gets wiped out across major derivatives pairs. Spot volume stays remarkably resilient while late longs get liquidated, transferring supply directly from weak hands to patient accumulators. Even when pairs like $ETC or $FIL see correlated pullbacks, the underlying market structure rarely breaks on these rapid downward wicks.
Treating these pullbacks as catastrophic breakdowns rather than healthy resets is why retail consistently underperforms during sustained momentum phases. When open interest resets and funding rates normalize, the market simply creates a cleaner runway for the next leg up.
Where do you think this goes from here?
#BitcoinFallsBelow #BitcoinFallsToAround
Most traders keep panic-selling their positions at the exact bottom simply because they mistake local liquidity flushes for structural trend reversals. They buy high when euphoria takes over, then dump right into institutional bids the moment the chart prints a red candle.
Look at how $BTC behaves whenever leverage gets wiped out across major derivatives pairs. Spot volume stays remarkably resilient while late longs get liquidated, transferring supply directly from weak hands to patient accumulators. Even when pairs like $ETC or $FIL see correlated pullbacks, the underlying market structure rarely breaks on these rapid downward wicks.
Treating these pullbacks as catastrophic breakdowns rather than healthy resets is why retail consistently underperforms during sustained momentum phases. When open interest resets and funding rates normalize, the market simply creates a cleaner runway for the next leg up.
Where do you think this goes from here?
#BitcoinFallsBelow #BitcoinFallsToAround

31
Bitget CEO Points Finger at North Korea for $352M Hack
Bitget's CEO, Gracy Chen, has come forward with a strong suspicion that North Korea might be behind the massive $352 million hack. She's citing preliminary findings that link IP addresses used in the attack to VPNs commonly associated with North Korean hacking groups.
Honestly, this is pretty concerning stuff. When the big players start pointing fingers at state-sponsored actors, it really shakes your confidence in the security of these platforms. It's not just about the money lost; it's the implication that these groups are getting bolder and more sophisticated. I'm watching closely to see if there's more concrete evidence that comes out, but this initial link is definitely a red flag for the entire crypto space. It makes you think twice about where your assets are truly safe.
This is not financial advice.
#BinanceWillListHyperliquid(HYPE) #BitcoinFallsBelow$83,000
$BROCCOLI714
Bitget CEO Points Finger at North Korea for $352M Hack
Bitget's CEO, Gracy Chen, has come forward with a strong suspicion that North Korea might be behind the massive $352 million hack. She's citing preliminary findings that link IP addresses used in the attack to VPNs commonly associated with North Korean hacking groups.
Honestly, this is pretty concerning stuff. When the big players start pointing fingers at state-sponsored actors, it really shakes your confidence in the security of these platforms. It's not just about the money lost; it's the implication that these groups are getting bolder and more sophisticated. I'm watching closely to see if there's more concrete evidence that comes out, but this initial link is definitely a red flag for the entire crypto space. It makes you think twice about where your assets are truly safe.
This is not financial advice.
#BinanceWillListHyperliquid(HYPE) #BitcoinFallsBelow$83,000
$BROCCOLI714
Bitget's CEO, Gracy Chen, has come forward with a strong suspicion that North Korea might be behind the massive $352 million hack. She's citing preliminary findings that link IP addresses used in the attack to VPNs commonly associated with North Korean hacking groups.
Honestly, this is pretty concerning stuff. When the big players start pointing fingers at state-sponsored actors, it really shakes your confidence in the security of these platforms. It's not just about the money lost; it's the implication that these groups are getting bolder and more sophisticated. I'm watching closely to see if there's more concrete evidence that comes out, but this initial link is definitely a red flag for the entire crypto space. It makes you think twice about where your assets are truly safe.
This is not financial advice.
#BinanceWillListHyperliquid(HYPE) #BitcoinFallsBelow$83,000
$BROCCOLI714
2
49


📈 BIG LONG NOW - LINKUSDT
📍 KEY LEVELS
Entry: 12.9640
🛑 SL: 12.6749
🎯 TP1: 13.5422
🎯 TP2: 13.8313
The trend is clearly up with the EMAs, and momentum's strong with the MACD showing bullish signs. RSI is holding steady in a good zone, suggesting this uptrend has room to continue.
This signal was generated automatically from technical indicators. It does not guarantee profit and is not investment advice. Always manage your own risk and DYOR.
$LINK
#BinanceWillListHyperliquid(HYPE) #BitcoinFallsBelow$83,000
📈 BIG LONG NOW - LINKUSDT
📍 KEY LEVELS
Entry: 12.9640
🛑 SL: 12.6749
🎯 TP1: 13.5422
🎯 TP2: 13.8313
The trend is clearly up with the EMAs, and momentum's strong with the MACD showing bullish signs. RSI is holding steady in a good zone, suggesting this uptrend has room to continue.
This signal was generated automatically from technical indicators. It does not guarantee profit and is not investment advice. Always manage your own risk and DYOR.
$LINK
#BinanceWillListHyperliquid(HYPE) #BitcoinFallsBelow$83,000
📍 KEY LEVELS
Entry: 12.9640
🛑 SL: 12.6749
🎯 TP1: 13.5422
🎯 TP2: 13.8313
The trend is clearly up with the EMAs, and momentum's strong with the MACD showing bullish signs. RSI is holding steady in a good zone, suggesting this uptrend has room to continue.
This signal was generated automatically from technical indicators. It does not guarantee profit and is not investment advice. Always manage your own risk and DYOR.
$LINK
#BinanceWillListHyperliquid(HYPE) #BitcoinFallsBelow$83,000
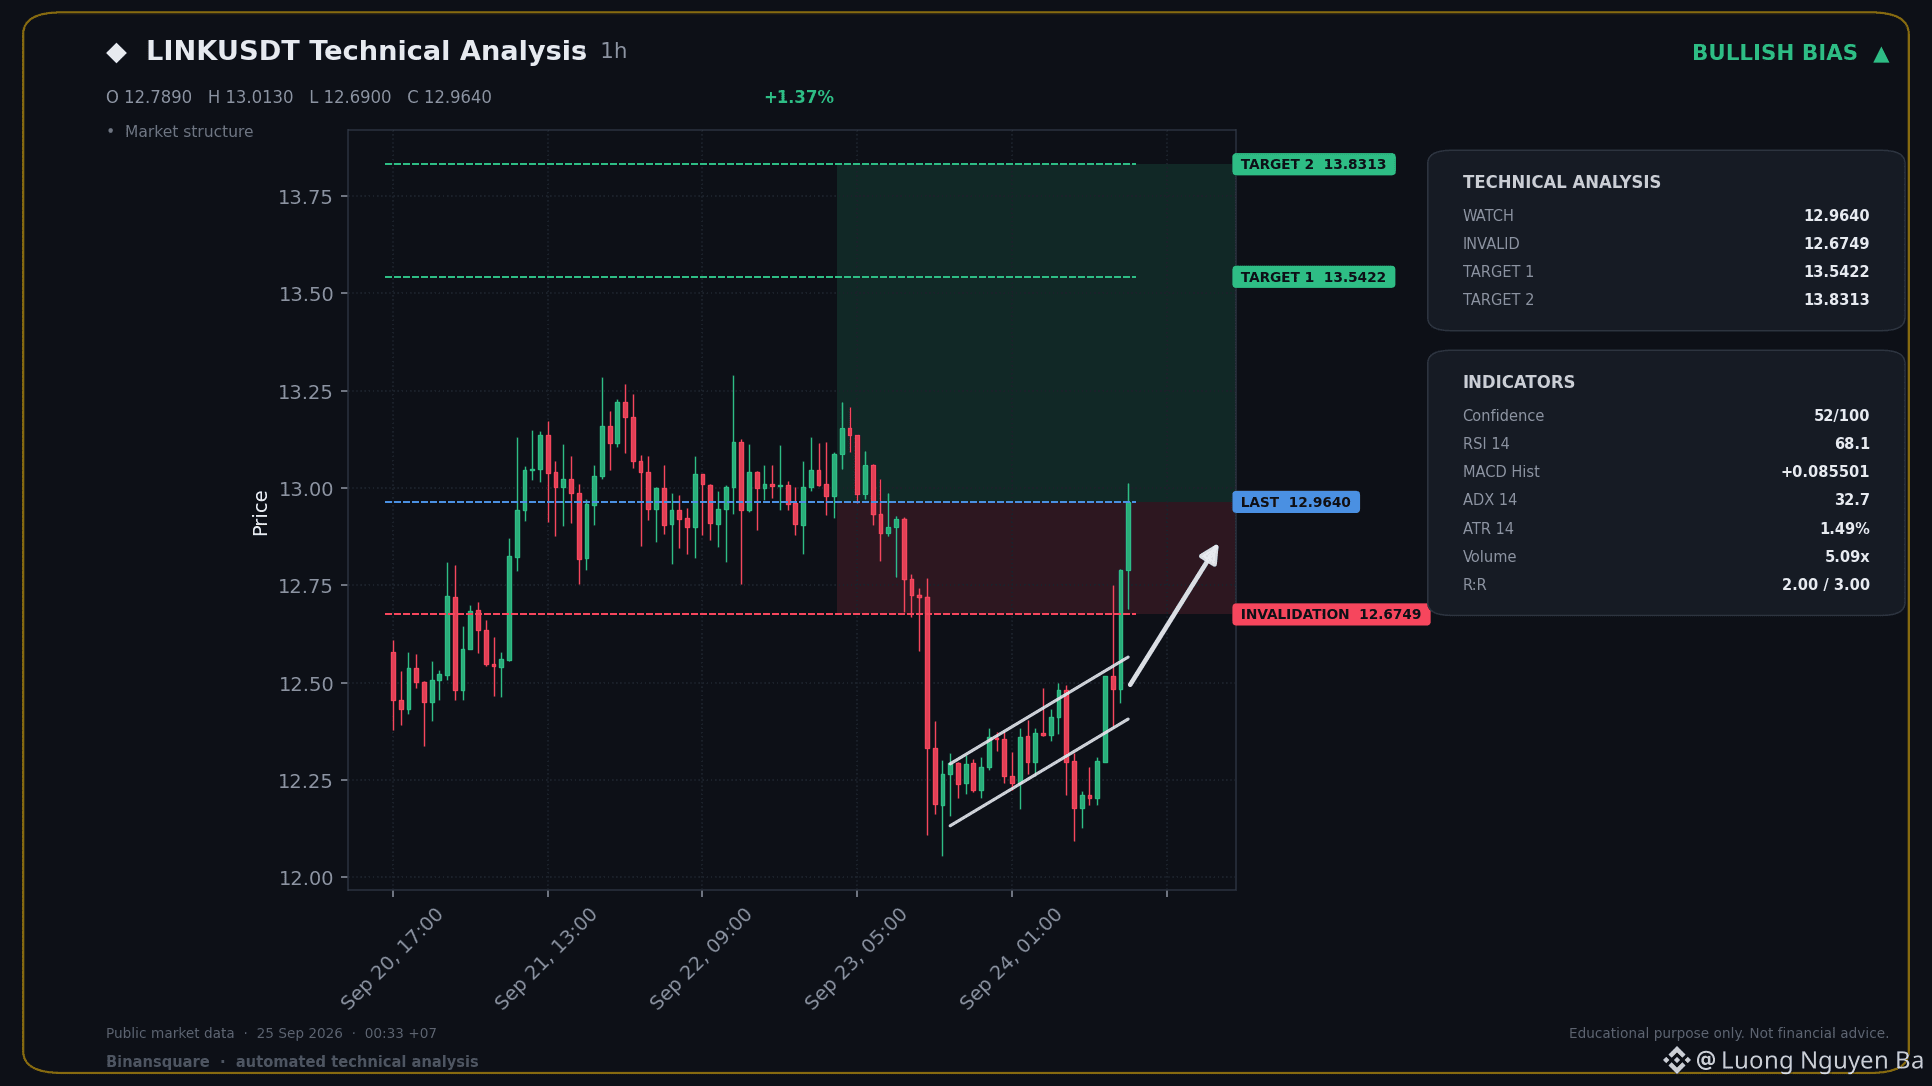
175
Log in to explore more content
Join global crypto users on Binance Square
⚡️ Get latest and useful information about crypto.
💬 Trusted by the world’s largest crypto exchange.
👍 Discover real insights from verified creators.
Email / Phone number
Trending Topics
1
#PolymarketBankFailureBetsDrawFDICConcern
4,212 views
187 Discussing
2
#BlackRockBuildsTokenizedPortfoliosForOndo
2,788 views
120 Discussing
3
#BitwiseFilesToListNEARETFOnNYSEArca
4,238 views
154 Discussing
4
#SECCommissionerPeirceToLeaveOct2
3,920 views
121 Discussing
5
#SECSaysBuybacksUpgradesDontMakeTokenSecurity
6,568 views
139 Discussing
6
#StrategyProposesDailyDividendsForPreferreds
1,066 views
35 Discussing
7
#CircleTetherFreezeBitgetHackerWallet
412 views
28 Discussing
8
#CoinMarketCapCompletesCoinglassAcquisition
2,154 views
50 Discussing
9
#QNTRises39%
70,415 views
1,300 Discussing
10
#EthereumBreaksAbove$2700
6,622 views
129 Discussing