
#bitcoinetfslose$1.6binnovember
bitcoinetfslose$1.6binnovember
Hot
Latest

·
--
Article
Bitcoin ETFs Lose $1.6 BILLION in November!#BitcoinETFsLose$1.6BInNovember
BITCOIN ETFs BLEED $1.6 BILLION IN NOVEMBER!
Wall Street is sending a serious warning to the crypto market.
US spot Bitcoin ETFs have suffered approximately $1.6 BILLION in net outflows this month.
📉 Here's What Investors Need to Know:
🔴 November outflows: $1.6B
🔴 Biggest daily loss: $430.2M
🔴 BlackRock IBIT: Major withdrawals
🟢 November 10 outflows slowed to $95M
🔥 Why Does This Matter?
Bitcoin ETFs have been a major source of institutional demand. When investors withdraw billions, it can weaken buying pressure and increase market uncertainty.
But there's an interesting twist: withdrawals are slowing down. Could institutional selling finally be losing momentum?
🐂 Bullish Recovery or Bearish Warning?
If ETF inflows return, Bitcoin could find fresh buying support. But continued withdrawals may create more downside pressure.
💬 Your Prediction:
Will Bitcoin ETFs see a major inflow reversal before December, or is institutional money leaving crypto?
BITCOIN ETFs FACE MASSIVE OUTFLOWS
#BitcoinETFs #blackRock #IBIT #BinanceSquare
Bitcoin ETFs Lose $1.6 BILLION in November!
#BitcoinETFsLose$1.6BInNovember
BITCOIN ETFs BLEED $1.6 BILLION IN NOVEMBER!
Wall Street is sending a serious warning to the crypto market.
US spot Bitcoin ETFs have suffered approximately $1.6 BILLION in net outflows this month.
📉 Here's What Investors Need to Know:
🔴 November outflows: $1.6B
🔴 Biggest daily loss: $430.2M
🔴 BlackRock IBIT: Major withdrawals
🟢 November 10 outflows slowed to $95M
🔥 Why Does This Matter?
Bitcoin ETFs have been a major source of institutional demand. When investors withdraw billions, it can weaken buying pressure and increase market uncertainty.
But there's an interesting twist: withdrawals are slowing down. Could institutional selling finally be losing momentum?
🐂 Bullish Recovery or Bearish Warning?
If ETF inflows return, Bitcoin could find fresh buying support. But continued withdrawals may create more downside pressure.
💬 Your Prediction:
Will Bitcoin ETFs see a major inflow reversal before December, or is institutional money leaving crypto?
BITCOIN ETFs FACE MASSIVE OUTFLOWS
#BitcoinETFs #blackRock #IBIT #BinanceSquare
BITCOIN ETFs BLEED $1.6 BILLION IN NOVEMBER!
Wall Street is sending a serious warning to the crypto market.
US spot Bitcoin ETFs have suffered approximately $1.6 BILLION in net outflows this month.
📉 Here's What Investors Need to Know:
🔴 November outflows: $1.6B
🔴 Biggest daily loss: $430.2M
🔴 BlackRock IBIT: Major withdrawals
🟢 November 10 outflows slowed to $95M
🔥 Why Does This Matter?
Bitcoin ETFs have been a major source of institutional demand. When investors withdraw billions, it can weaken buying pressure and increase market uncertainty.
But there's an interesting twist: withdrawals are slowing down. Could institutional selling finally be losing momentum?
🐂 Bullish Recovery or Bearish Warning?
If ETF inflows return, Bitcoin could find fresh buying support. But continued withdrawals may create more downside pressure.
💬 Your Prediction:
Will Bitcoin ETFs see a major inflow reversal before December, or is institutional money leaving crypto?
BITCOIN ETFs FACE MASSIVE OUTFLOWS
#BitcoinETFs #blackRock #IBIT #BinanceSquare
BTC+0.72%
BLKUS-0.18%
49

·
--
👀 Bitcoin ETFs: The $1.6 billion exodus hides a massive rotation...
#BitcoinETFsLose$1.6BInNovember
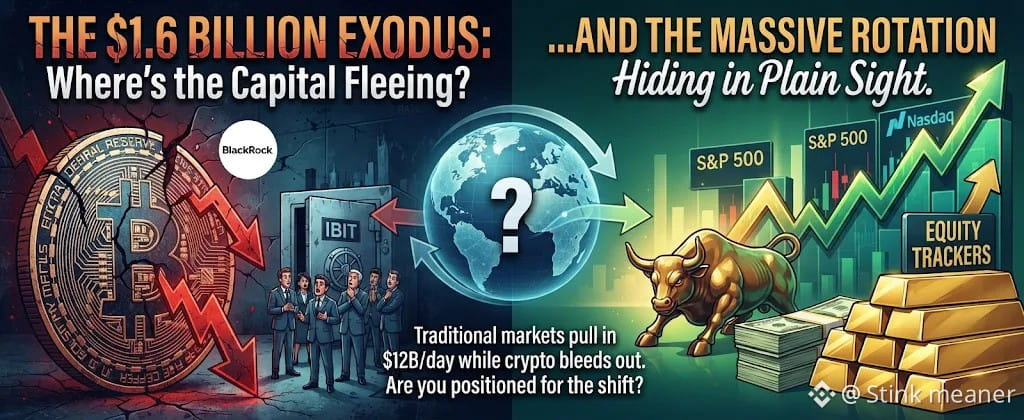
Between November 2 and November 10, U.S. spot Bitcoin ETFs shed roughly $1.58 billion in net outflows. But focusing strictly on that total headline number causes traders to miss the real story.
The liquidation pressure is heavily concentrated in just one fund: BlackRock's IBIT.
IBIT recently marked an unprecedented eighth consecutive session of redemptions, bleeding $1.73 billion over that streak alone. Because IBIT’s individual losses are larger than the net aggregate outflow across all 11 U.S. funds, it proves that other institutional desks are actively absorbing the selling pressure and offsetting the damage.
So, where is this institutional capital fleeing?
It is not leaving the financial system; it is rotating. While crypto investment vehicles bled out, traditional equity trackers pulled in a massive $12 billion per day. Large capital allocators are aggressively cutting crypto risk to pounce on traditional market momentum, moving funds into equity indices.
The near-term damage to crypto sentiment is clear on-chain. Bitcoin's 30-day MVRV momentum ratio has officially dipped below its 90-day moving average. This confirms that short-term holder demand has dried up, leaving price action dependent on organic spot buyers.
Ethereum ETFs have not escaped the pain either, booking $551 million in net outflows over the same multi-day window.
Market Implication:
This structural slowdown confirms that the immediate institutional bid is sidelined. Analysts are pointing to the $72,500 zone—the key short-term holder realized price—as the ultimate line in the sand that Bitcoin must maintain to prevent a deeper macro correction.
The Trader's Play:
Are you treating this $72,500 area as a major accumulation baseline, or do you expect the traditional equity rotation to drag crypto lower? Post your targets below.
Not financial advice.
$BTC $ETH
{future}(ETHUSDT)
{future}(BTCUSDT)
#HotCPIDecemberHikePriced #BitcoinETFs #ETHETFS #BinanceSquareTalks
👀 Bitcoin ETFs: The $1.6 billion exodus hides a massive rotation...
#BitcoinETFsLose$1.6BInNovember
Between November 2 and November 10, U.S. spot Bitcoin ETFs shed roughly $1.58 billion in net outflows. But focusing strictly on that total headline number causes traders to miss the real story.
The liquidation pressure is heavily concentrated in just one fund: BlackRock's IBIT.
IBIT recently marked an unprecedented eighth consecutive session of redemptions, bleeding $1.73 billion over that streak alone. Because IBIT’s individual losses are larger than the net aggregate outflow across all 11 U.S. funds, it proves that other institutional desks are actively absorbing the selling pressure and offsetting the damage.
So, where is this institutional capital fleeing?
It is not leaving the financial system; it is rotating. While crypto investment vehicles bled out, traditional equity trackers pulled in a massive $12 billion per day. Large capital allocators are aggressively cutting crypto risk to pounce on traditional market momentum, moving funds into equity indices.
The near-term damage to crypto sentiment is clear on-chain. Bitcoin's 30-day MVRV momentum ratio has officially dipped below its 90-day moving average. This confirms that short-term holder demand has dried up, leaving price action dependent on organic spot buyers.
Ethereum ETFs have not escaped the pain either, booking $551 million in net outflows over the same multi-day window.
Market Implication:
This structural slowdown confirms that the immediate institutional bid is sidelined. Analysts are pointing to the $72,500 zone—the key short-term holder realized price—as the ultimate line in the sand that Bitcoin must maintain to prevent a deeper macro correction.
The Trader's Play:
Are you treating this $72,500 area as a major accumulation baseline, or do you expect the traditional equity rotation to drag crypto lower? Post your targets below.
Not financial advice.
$BTC $ETH
#HotCPIDecemberHikePriced #BitcoinETFs #ETHETFS #BinanceSquareTalks
#BitcoinETFsLose$1.6BInNovember
Between November 2 and November 10, U.S. spot Bitcoin ETFs shed roughly $1.58 billion in net outflows. But focusing strictly on that total headline number causes traders to miss the real story.
The liquidation pressure is heavily concentrated in just one fund: BlackRock's IBIT.
IBIT recently marked an unprecedented eighth consecutive session of redemptions, bleeding $1.73 billion over that streak alone. Because IBIT’s individual losses are larger than the net aggregate outflow across all 11 U.S. funds, it proves that other institutional desks are actively absorbing the selling pressure and offsetting the damage.
So, where is this institutional capital fleeing?
It is not leaving the financial system; it is rotating. While crypto investment vehicles bled out, traditional equity trackers pulled in a massive $12 billion per day. Large capital allocators are aggressively cutting crypto risk to pounce on traditional market momentum, moving funds into equity indices.
The near-term damage to crypto sentiment is clear on-chain. Bitcoin's 30-day MVRV momentum ratio has officially dipped below its 90-day moving average. This confirms that short-term holder demand has dried up, leaving price action dependent on organic spot buyers.
Ethereum ETFs have not escaped the pain either, booking $551 million in net outflows over the same multi-day window.
Market Implication:
This structural slowdown confirms that the immediate institutional bid is sidelined. Analysts are pointing to the $72,500 zone—the key short-term holder realized price—as the ultimate line in the sand that Bitcoin must maintain to prevent a deeper macro correction.
The Trader's Play:
Are you treating this $72,500 area as a major accumulation baseline, or do you expect the traditional equity rotation to drag crypto lower? Post your targets below.
Not financial advice.
$BTC $ETH
#HotCPIDecemberHikePriced #BitcoinETFs #ETHETFS #BinanceSquareTalks
1
129

·
--
Bitcoin ETFs shed $1.6B in November — Tuesday's $95M outflow was day 4 in a row, easing from $201M Monday. $BTC $73,629 as equity funds devour the dip. Hold $73,100 and the bleed slows; lose it and outflows bite harder. Are ETFs done selling? #BitcoinETFsShed$1.6BInNovember #Bitcoin #Write2Earn
Bitcoin ETFs shed $1.6B in November — Tuesday's $95M outflow was day 4 in a row, easing from $201M Monday. $BTC $73,629 as equity funds devour the dip. Hold $73,100 and the bleed slows; lose it and outflows bite harder. Are ETFs done selling? #BitcoinETFsShed$1.6BInNovember #Bitcoin #Write2Earn
majspace:
Tuesday's number easing from $201M is a good sign. $73,100 is the level I'm watching too — holding it would calm things down a lot.
1
27

·
--
#BitcoinETFsLose$1.6BInNovember
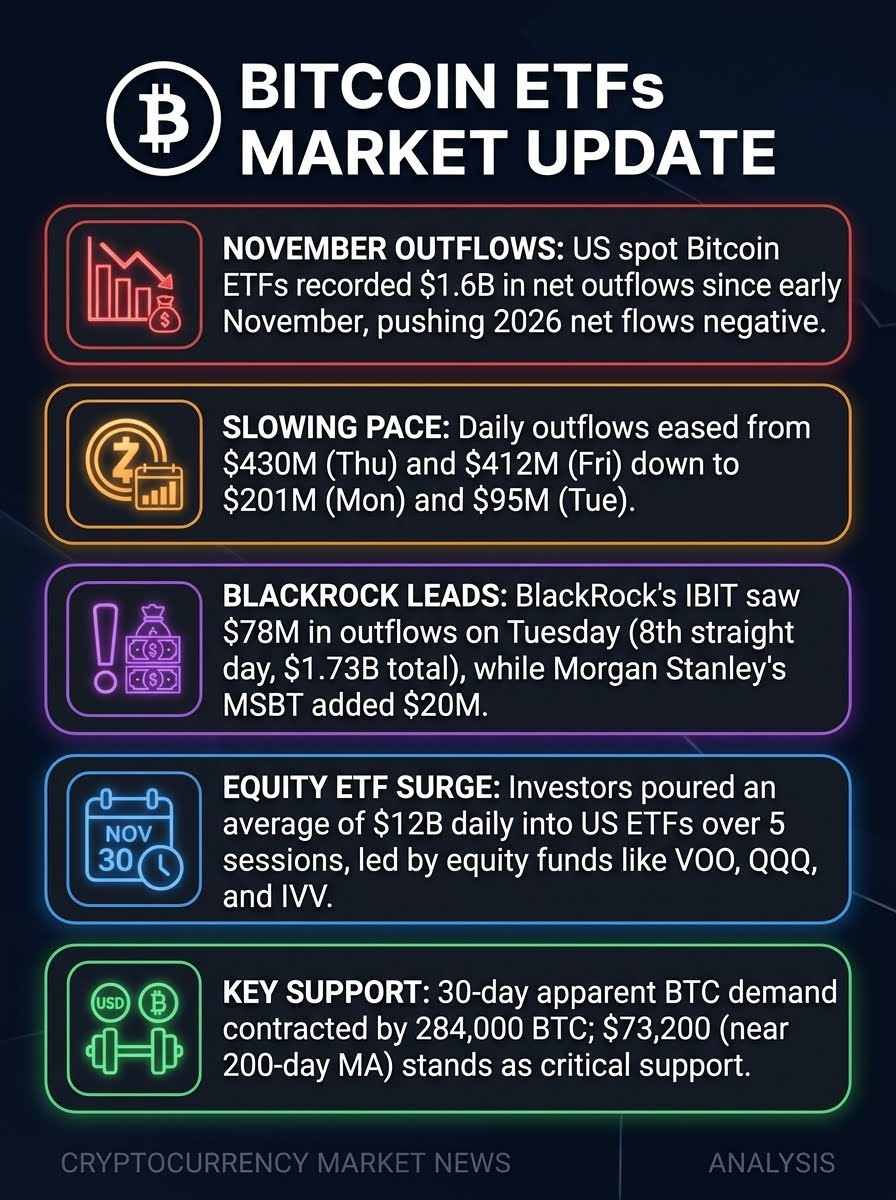
💸 November Balance Sheet: U.S. spot Bitcoin ETFs have recorded approximately $1.6 billion in net outflows since the beginning of November, pushing total net fund flows for 2026 into negative territory.📉 Outflow Pace Slowing: Daily net outflows stood at $430 million on Thursday and $412 million on Friday, then fell to $201 million on Monday and $95 million on Tuesday, reaching their lowest level in the past four sessions.🏦 Outflows Led by BlackRock: BlackRock's iShares Bitcoin Trust (IBIT) saw $78 million in outflows on Tuesday, losing money for the eighth consecutive day and bringing total outflows over that streak to $1.73 billion. By contrast, Morgan Stanley's Bitcoin Trust (MSBT) attracted $20 million in inflows on Tuesday.📈 Rush into Stock ETFs: According to data from Bloomberg ETF analyst Eric Balchunas, investors viewed the market downturn as a buying opportunity, investing an average of $12 billion per day in ETFs listed on U.S. exchanges over the past five trading days. All of the 17 funds with the largest inflows were stock funds, such as VOO, QQQ, and IVV.🛡️ Market Outlook and Critical Support: According to CryptoQuant data, visible Bitcoin demand over 30 days contracted by 284,000 BTC, marking its sharpest decline since March 2025. For Bitcoin, trading at around $73,998, $73,200 is being watched as critical support, near the 200-day moving average.
$BTC $SOL $OPG
{future}(OPGUSDT)
{future}(SOLUSDT)
{future}(BTCUSDT)
#BitcoinETFsLose$1.6BInNovember
💸 November Balance Sheet: U.S. spot Bitcoin ETFs have recorded approximately $1.6 billion in net outflows since the beginning of November, pushing total net fund flows for 2026 into negative territory.📉 Outflow Pace Slowing: Daily net outflows stood at $430 million on Thursday and $412 million on Friday, then fell to $201 million on Monday and $95 million on Tuesday, reaching their lowest level in the past four sessions.🏦 Outflows Led by BlackRock: BlackRock's iShares Bitcoin Trust (IBIT) saw $78 million in outflows on Tuesday, losing money for the eighth consecutive day and bringing total outflows over that streak to $1.73 billion. By contrast, Morgan Stanley's Bitcoin Trust (MSBT) attracted $20 million in inflows on Tuesday.📈 Rush into Stock ETFs: According to data from Bloomberg ETF analyst Eric Balchunas, investors viewed the market downturn as a buying opportunity, investing an average of $12 billion per day in ETFs listed on U.S. exchanges over the past five trading days. All of the 17 funds with the largest inflows were stock funds, such as VOO, QQQ, and IVV.🛡️ Market Outlook and Critical Support: According to CryptoQuant data, visible Bitcoin demand over 30 days contracted by 284,000 BTC, marking its sharpest decline since March 2025. For Bitcoin, trading at around $73,998, $73,200 is being watched as critical support, near the 200-day moving average.
$BTC $SOL $OPG
💸 November Balance Sheet: U.S. spot Bitcoin ETFs have recorded approximately $1.6 billion in net outflows since the beginning of November, pushing total net fund flows for 2026 into negative territory.📉 Outflow Pace Slowing: Daily net outflows stood at $430 million on Thursday and $412 million on Friday, then fell to $201 million on Monday and $95 million on Tuesday, reaching their lowest level in the past four sessions.🏦 Outflows Led by BlackRock: BlackRock's iShares Bitcoin Trust (IBIT) saw $78 million in outflows on Tuesday, losing money for the eighth consecutive day and bringing total outflows over that streak to $1.73 billion. By contrast, Morgan Stanley's Bitcoin Trust (MSBT) attracted $20 million in inflows on Tuesday.📈 Rush into Stock ETFs: According to data from Bloomberg ETF analyst Eric Balchunas, investors viewed the market downturn as a buying opportunity, investing an average of $12 billion per day in ETFs listed on U.S. exchanges over the past five trading days. All of the 17 funds with the largest inflows were stock funds, such as VOO, QQQ, and IVV.🛡️ Market Outlook and Critical Support: According to CryptoQuant data, visible Bitcoin demand over 30 days contracted by 284,000 BTC, marking its sharpest decline since March 2025. For Bitcoin, trading at around $73,998, $73,200 is being watched as critical support, near the 200-day moving average.
$BTC $SOL $OPG
168

·
--
Bearish
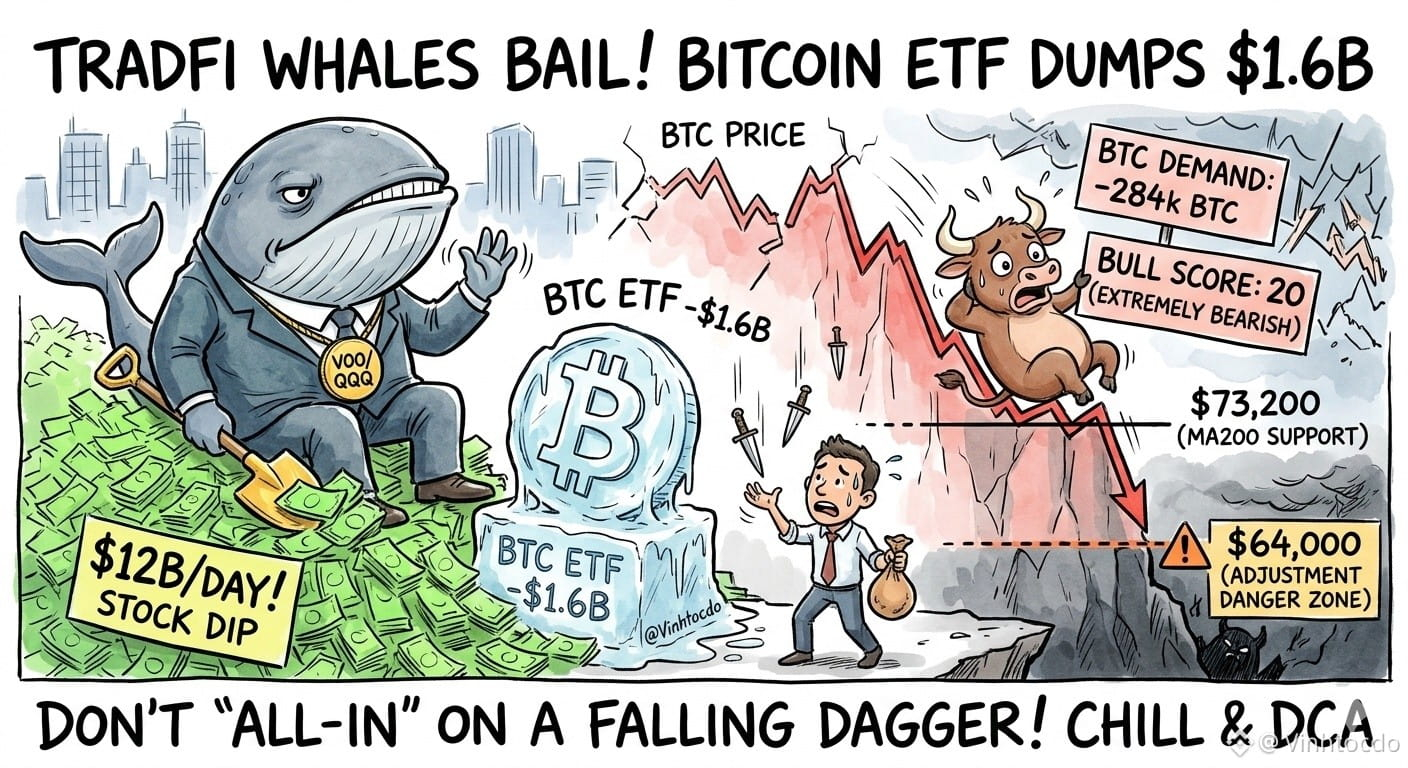
😱 Again? TradFi sharks are busy buying the dip in US stocks (pouring $12B/day into VOO, QQQ) while abandoning Bitcoin ETFs, which have seen net outflows of $1.6 billion since the start of November!
🔥 Detailed analysis & the 64k scenario:
• Bright spot: Outflows are gradually cooling (from $430M to just $95M), and Morgan Stanley is still adding a small $20M.
• However, the Bullish Sentiment Index has plunged from 90 to 20 (extremely bearish), with demand down by 284k BTC. If the solid support level at $73,200 (MA200) breaks, BTC falling to the $64,000 range, as I warned, is entirely possible!
💡 What should traders do? Don’t rush to “go all-in” and catch a falling knife! Hold your cash position and wait for price action around $73,200 before scaling in with DCA.
⚠️ This is not financial advice.
👉 Click Trade below to support me: $BTC
{spot}(BTCUSDT)
$ETH
{spot}(ETHUSDT)
$ARIA
{future}(ARIAUSDT)
#BitcoinETFsLose$1.6BInNovember #VINHTOCDO #BitcoinETFs #BTC #CryptoNews #MarketUpdate #Trading
😱 Again? TradFi sharks are busy buying the dip in US stocks (pouring $12B/day into VOO, QQQ) while abandoning Bitcoin ETFs, which have seen net outflows of $1.6 billion since the start of November!
🔥 Detailed analysis & the 64k scenario:
• Bright spot: Outflows are gradually cooling (from $430M to just $95M), and Morgan Stanley is still adding a small $20M.
• However, the Bullish Sentiment Index has plunged from 90 to 20 (extremely bearish), with demand down by 284k BTC. If the solid support level at $73,200 (MA200) breaks, BTC falling to the $64,000 range, as I warned, is entirely possible!
💡 What should traders do? Don’t rush to “go all-in” and catch a falling knife! Hold your cash position and wait for price action around $73,200 before scaling in with DCA.
⚠️ This is not financial advice.
👉 Click Trade below to support me: $BTC
$ETH
$ARIA
#BitcoinETFsLose$1.6BInNovember #VINHTOCDO #BitcoinETFs #BTC #CryptoNews #MarketUpdate #Trading
🔥 Detailed analysis & the 64k scenario:
• Bright spot: Outflows are gradually cooling (from $430M to just $95M), and Morgan Stanley is still adding a small $20M.
• However, the Bullish Sentiment Index has plunged from 90 to 20 (extremely bearish), with demand down by 284k BTC. If the solid support level at $73,200 (MA200) breaks, BTC falling to the $64,000 range, as I warned, is entirely possible!
💡 What should traders do? Don’t rush to “go all-in” and catch a falling knife! Hold your cash position and wait for price action around $73,200 before scaling in with DCA.
⚠️ This is not financial advice.
👉 Click Trade below to support me: $BTC
$ETH
$ARIA
#BitcoinETFsLose$1.6BInNovember #VINHTOCDO #BitcoinETFs #BTC #CryptoNews #MarketUpdate #Trading
2
291

·
--

Article
The 2030 Crypto Millionaire Playbook 🚀🔥Everyone is looking for the next life-changing play in crypto, but few are willing to look at the numbers. Let’s talk about a bold accumulation strategy for three of the most talked-about meme and community tokens in the space: PEPE, SHIB, and BONK.
If you were to accumulate and hold the following bags until the year 2030, could you be looking at billionaire status? Let’s break down the math:
1. 🐸 10,000 Million (10 Billion) $PEPE
Built on pure meme culture and unstoppable viral momentum, PEPE proved that community-driven tokens can capture billions in market cap almost overnight. Holding a 10-billion-token bag means you're heavily betting on future liquidity inflows and ecosystem expansion as meme coins mature into staple speculative assets.
2. 🐕 20,000 Million (20 Billion) $SHIB
Shiba Inu ($SHIB) isn’t just a meme anymore—it’s an entire ecosystem featuring Shibarium (its Layer-2 blockchain), decentralized exchanges, and a massive, fiercely loyal global army ("ShibArmy"). Securing 20 billion tokens positions you for massive upside if utility adoption scales exponentially over the next few years.
3. 🦴 30,000 Million (30 Billion) $BONK
As the premier dog-themed sensation of the Solana ecosystem, BONK revitalized retail energy on one of the fastest blockchains in existence. With deep integration across Solana DeFi, NFTs, and payment apps, holding 30 billion BONK means riding the wave of Solana’s long-term network growth.
💡 The Big Question: Vision or Fantasy?
Reaching billionaire status (whether in local fiat or token value) depends entirely on market cycles, tokenomics, circulating supply burns, and overall crypto adoption by 2030. While meme coins carry extreme volatility and high risk, history has shown that early believers who stomach the volatility often reap the greatest rewards.
Disclaimer: This is for entertainment and informational purposes only—always do your own research (DYOR) and never invest more than you can afford to lose!
#BitcoinETFsLose$1.6BInNovember #ZcashFallsBelow$1000ForFirstTimeSinceSeptember #Pepe #Shibalnu #Write2Earn
$PEPE
{spot}(PEPEUSDT)
$SHIB
{spot}(SHIBUSDT)
$BONK
{spot}(BONKUSDT)
The 2030 Crypto Millionaire Playbook 🚀🔥
Everyone is looking for the next life-changing play in crypto, but few are willing to look at the numbers. Let’s talk about a bold accumulation strategy for three of the most talked-about meme and community tokens in the space: PEPE, SHIB, and BONK.
If you were to accumulate and hold the following bags until the year 2030, could you be looking at billionaire status? Let’s break down the math:
1. 🐸 10,000 Million (10 Billion) $PEPE
Built on pure meme culture and unstoppable viral momentum, PEPE proved that community-driven tokens can capture billions in market cap almost overnight. Holding a 10-billion-token bag means you're heavily betting on future liquidity inflows and ecosystem expansion as meme coins mature into staple speculative assets.
2. 🐕 20,000 Million (20 Billion) $SHIB
Shiba Inu ($SHIB ) isn’t just a meme anymore—it’s an entire ecosystem featuring Shibarium (its Layer-2 blockchain), decentralized exchanges, and a massive, fiercely loyal global army ("ShibArmy"). Securing 20 billion tokens positions you for massive upside if utility adoption scales exponentially over the next few years.
3. 🦴 30,000 Million (30 Billion) $BONK
As the premier dog-themed sensation of the Solana ecosystem, BONK revitalized retail energy on one of the fastest blockchains in existence. With deep integration across Solana DeFi, NFTs, and payment apps, holding 30 billion BONK means riding the wave of Solana’s long-term network growth.
💡 The Big Question: Vision or Fantasy?
Reaching billionaire status (whether in local fiat or token value) depends entirely on market cycles, tokenomics, circulating supply burns, and overall crypto adoption by 2030. While meme coins carry extreme volatility and high risk, history has shown that early believers who stomach the volatility often reap the greatest rewards.
Disclaimer: This is for entertainment and informational purposes only—always do your own research (DYOR) and never invest more than you can afford to lose!
#BitcoinETFsLose$1.6BInNovember #ZcashFallsBelow$1000ForFirstTimeSinceSeptember #Pepe #Shibalnu #Write2Earn
$PEPE
$SHIB
$BONK
If you were to accumulate and hold the following bags until the year 2030, could you be looking at billionaire status? Let’s break down the math:
1. 🐸 10,000 Million (10 Billion) $PEPE
Built on pure meme culture and unstoppable viral momentum, PEPE proved that community-driven tokens can capture billions in market cap almost overnight. Holding a 10-billion-token bag means you're heavily betting on future liquidity inflows and ecosystem expansion as meme coins mature into staple speculative assets.
2. 🐕 20,000 Million (20 Billion) $SHIB
Shiba Inu ($SHIB ) isn’t just a meme anymore—it’s an entire ecosystem featuring Shibarium (its Layer-2 blockchain), decentralized exchanges, and a massive, fiercely loyal global army ("ShibArmy"). Securing 20 billion tokens positions you for massive upside if utility adoption scales exponentially over the next few years.
3. 🦴 30,000 Million (30 Billion) $BONK
As the premier dog-themed sensation of the Solana ecosystem, BONK revitalized retail energy on one of the fastest blockchains in existence. With deep integration across Solana DeFi, NFTs, and payment apps, holding 30 billion BONK means riding the wave of Solana’s long-term network growth.
💡 The Big Question: Vision or Fantasy?
Reaching billionaire status (whether in local fiat or token value) depends entirely on market cycles, tokenomics, circulating supply burns, and overall crypto adoption by 2030. While meme coins carry extreme volatility and high risk, history has shown that early believers who stomach the volatility often reap the greatest rewards.
Disclaimer: This is for entertainment and informational purposes only—always do your own research (DYOR) and never invest more than you can afford to lose!
#BitcoinETFsLose$1.6BInNovember #ZcashFallsBelow$1000ForFirstTimeSinceSeptember #Pepe #Shibalnu #Write2Earn
$PEPE
$SHIB
$BONK
User-c893a253:
дякую
2
3
1.4k


·
--
🚨 BREAKING: RUSSIA IS OPENING THE DOORS TO CRYPTO! 🇷🇺🔥
The Central Bank of #russia says exchanges could begin cryptocurrency trading starting November 22.
Russia is accelerating its push into the crypto market, potentially opening a new chapter for digital asset trading in the country!
RUSSIA IS GOING ALL-IN ON CRYPTO! 🚀
$EUR $BTC $BNB
#putin #ZcashFallsBelow$1000ForFirstTimeSinceSeptember #StrategyFaces$2.8BSelloffRiskFromMSCIRemoval #BitcoinETFsLose$1.6BInNovember
🚨 BREAKING: RUSSIA IS OPENING THE DOORS TO CRYPTO! 🇷🇺🔥
The Central Bank of #russia says exchanges could begin cryptocurrency trading starting November 22.
Russia is accelerating its push into the crypto market, potentially opening a new chapter for digital asset trading in the country!
RUSSIA IS GOING ALL-IN ON CRYPTO! 🚀
$EUR $BTC $BNB
#putin #ZcashFallsBelow$1000ForFirstTimeSinceSeptember #StrategyFaces$2.8BSelloffRiskFromMSCIRemoval #BitcoinETFsLose$1.6BInNovember
The Central Bank of #russia says exchanges could begin cryptocurrency trading starting November 22.
Russia is accelerating its push into the crypto market, potentially opening a new chapter for digital asset trading in the country!
RUSSIA IS GOING ALL-IN ON CRYPTO! 🚀
$EUR $BTC $BNB
#putin #ZcashFallsBelow$1000ForFirstTimeSinceSeptember #StrategyFaces$2.8BSelloffRiskFromMSCIRemoval #BitcoinETFsLose$1.6BInNovember
Lashaun Branstutter Aujf:
@BiBi Fact Check this content
10
1
17
9.7k
·
--
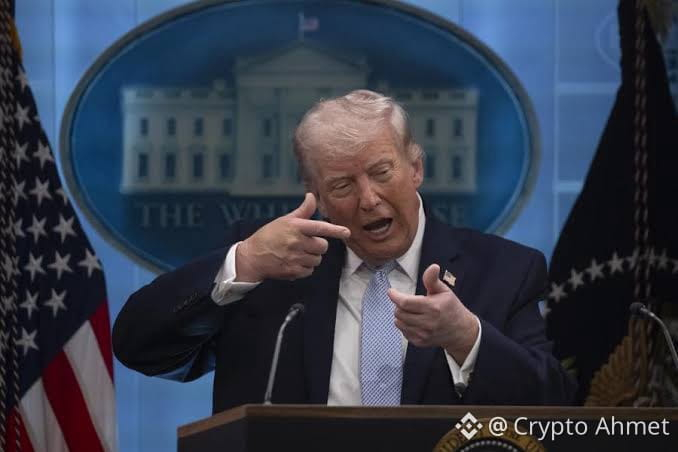
🚨 TRUMP FIRES BACK AT IRAN: “WE DIDN’T START THIS WAR THEY’VE BEEN WAGING WAR AGAINST AMERICA SINCE 1979!”
🇺🇸 #TRUMP on Iran:
“America did not start a war with Iran. Iran has been waging war against America since 1979.
This should have been dealt with a long time ago.”
Trump’s remarks put the decades-long conflict between Washington and Tehran back in the spotlight. 🔥
$TRUMP $XAG $XAU
#HotCPIDecemberHikePriced #StrategyFaces$2.8BSelloffRiskFromMSCIRemoval #BitcoinETFsLose$1.6BInNovember #iran
🚨 TRUMP FIRES BACK AT IRAN: “WE DIDN’T START THIS WAR THEY’VE BEEN WAGING WAR AGAINST AMERICA SINCE 1979!”
🇺🇸 #TRUMP on Iran:
“America did not start a war with Iran. Iran has been waging war against America since 1979.
This should have been dealt with a long time ago.”
Trump’s remarks put the decades-long conflict between Washington and Tehran back in the spotlight. 🔥
$TRUMP $XAG $XAU
#HotCPIDecemberHikePriced #StrategyFaces$2.8BSelloffRiskFromMSCIRemoval #BitcoinETFsLose$1.6BInNovember #iran
🇺🇸 #TRUMP on Iran:
“America did not start a war with Iran. Iran has been waging war against America since 1979.
This should have been dealt with a long time ago.”
Trump’s remarks put the decades-long conflict between Washington and Tehran back in the spotlight. 🔥
$TRUMP $XAG $XAU
#HotCPIDecemberHikePriced #StrategyFaces$2.8BSelloffRiskFromMSCIRemoval #BitcoinETFsLose$1.6BInNovember #iran

Pearline Bleicher uCZt:
why it wasn't started in previous presidency term , what is the reason everything being carried on to raise conflicts & volatility in this presidency , looks like everything being generated to give volatility as planned Play ground for Market suckers to play with money sucking
4
7
6k
·
--
🚨 CPI dropped, and the Fed just backed crypto traders into a corner. Here is the brutal reality. 👇
#hotcpidecemberhikepriced
The October CPI just came in hotter than expected, and the shockwaves are officially hitting our bags:
📈 Headline CPI: 0.4% (vs. 0.3% expected)
📈 Core CPI: 0.3% (vs. 0.2% expected)
Bitcoin has immediately felt the heat, breaking below $74,000 as over leveraged longs get wiped out.
But here is the bizarre data blind spot that amateur traders are completely missing:
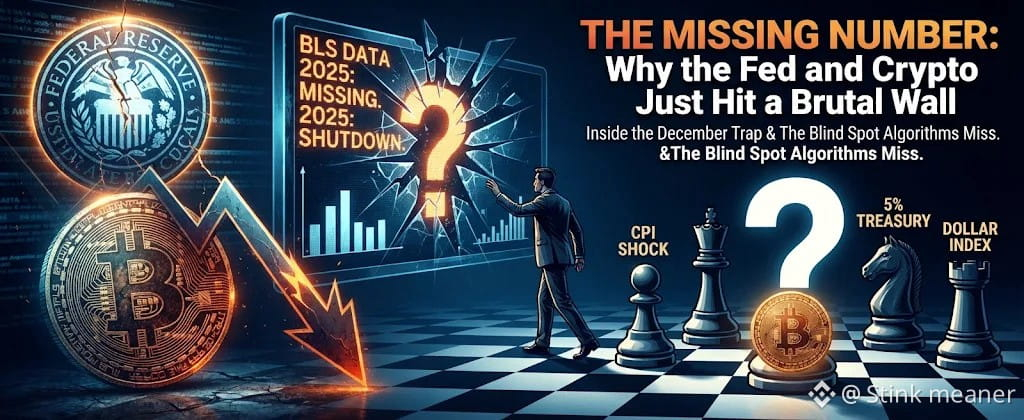
The Missing Number: The BLS could not publish the usual 12-month year-over-year (YoY) comparison because the 2025 government shutdown broke data collection for October last year. Trading algorithms relying on YoY feeds are flying completely blind right now.
The Fed Reality Check:
This stickiness means the Fed's current 3.75%–4.00% holding pattern is about to break. The market has violently repriced the upcoming December 9th FOMC meeting:
-📉 The chance of rates staying unchanged has dropped to 0%.
-⚠️ A standard 25-bps rate hike is heavily priced at 89%.
-🚨 Out of nowhere, the probability of a massive 50-bps mega-hike has spiked to 11% after Fed Governor Christopher Waller warned that persistent inflation would force aggressive policy tightening.
Market Implication:
The "higher-for-longer" narrative is back with a vengeance. With the U.S. 10-Year Treasury yield pushing past 5% and the Dollar Index hitting a 19-month high, capital is rotating out of risk assets. Expect continued downward pressure on BTC, ETH, and high-beta altcoins until we get the PCE data on November 25th.
What’s your play? With a December hike now a 100% mathematical certainty by the market, are you shorting this bounce, or are you buying the blood? Drop your $BTC targets below! 👇
Not financial advice.
$BTC $ETH
{future}(ETHUSDT)
{future}(BTCUSDT)
#HotCPIDecemberHikePriced #BitcoinETFsLose$1.6BInNovember #Fed #bitcoin
🚨 CPI dropped, and the Fed just backed crypto traders into a corner. Here is the brutal reality. 👇
#hotcpidecemberhikepriced
The October CPI just came in hotter than expected, and the shockwaves are officially hitting our bags:
📈 Headline CPI: 0.4% (vs. 0.3% expected)
📈 Core CPI: 0.3% (vs. 0.2% expected)
Bitcoin has immediately felt the heat, breaking below $74,000 as over leveraged longs get wiped out.
But here is the bizarre data blind spot that amateur traders are completely missing:
The Missing Number: The BLS could not publish the usual 12-month year-over-year (YoY) comparison because the 2025 government shutdown broke data collection for October last year. Trading algorithms relying on YoY feeds are flying completely blind right now.
The Fed Reality Check:
This stickiness means the Fed's current 3.75%–4.00% holding pattern is about to break. The market has violently repriced the upcoming December 9th FOMC meeting:
-📉 The chance of rates staying unchanged has dropped to 0%.
-⚠️ A standard 25-bps rate hike is heavily priced at 89%.
-🚨 Out of nowhere, the probability of a massive 50-bps mega-hike has spiked to 11% after Fed Governor Christopher Waller warned that persistent inflation would force aggressive policy tightening.
Market Implication:
The "higher-for-longer" narrative is back with a vengeance. With the U.S. 10-Year Treasury yield pushing past 5% and the Dollar Index hitting a 19-month high, capital is rotating out of risk assets. Expect continued downward pressure on BTC, ETH, and high-beta altcoins until we get the PCE data on November 25th.
What’s your play? With a December hike now a 100% mathematical certainty by the market, are you shorting this bounce, or are you buying the blood? Drop your $BTC targets below! 👇
Not financial advice.
$BTC $ETH
#HotCPIDecemberHikePriced #BitcoinETFsLose$1.6BInNovember #Fed #bitcoin
#hotcpidecemberhikepriced
The October CPI just came in hotter than expected, and the shockwaves are officially hitting our bags:
📈 Headline CPI: 0.4% (vs. 0.3% expected)
📈 Core CPI: 0.3% (vs. 0.2% expected)
Bitcoin has immediately felt the heat, breaking below $74,000 as over leveraged longs get wiped out.
But here is the bizarre data blind spot that amateur traders are completely missing:
The Missing Number: The BLS could not publish the usual 12-month year-over-year (YoY) comparison because the 2025 government shutdown broke data collection for October last year. Trading algorithms relying on YoY feeds are flying completely blind right now.
The Fed Reality Check:
This stickiness means the Fed's current 3.75%–4.00% holding pattern is about to break. The market has violently repriced the upcoming December 9th FOMC meeting:
-📉 The chance of rates staying unchanged has dropped to 0%.
-⚠️ A standard 25-bps rate hike is heavily priced at 89%.
-🚨 Out of nowhere, the probability of a massive 50-bps mega-hike has spiked to 11% after Fed Governor Christopher Waller warned that persistent inflation would force aggressive policy tightening.
Market Implication:
The "higher-for-longer" narrative is back with a vengeance. With the U.S. 10-Year Treasury yield pushing past 5% and the Dollar Index hitting a 19-month high, capital is rotating out of risk assets. Expect continued downward pressure on BTC, ETH, and high-beta altcoins until we get the PCE data on November 25th.
What’s your play? With a December hike now a 100% mathematical certainty by the market, are you shorting this bounce, or are you buying the blood? Drop your $BTC targets below! 👇
Not financial advice.
$BTC $ETH
#HotCPIDecemberHikePriced #BitcoinETFsLose$1.6BInNovember #Fed #bitcoin
2
2
2.2k

·
--

Article
Everyone is watching gold fall. But what if they're watching it the WRONG way?🚨 GOLD'S $4,000 BATTLE: THE SELLERS MAY NOT BE SEEING THE FULL PICTURE.
Everyone is watching the price of gold.
But I'm more interested in what's happening behind it.
Gold has come under pressure as markets reassess US inflation, interest rates and the Federal Reserve's next move.
At first glance, the bearish argument looks convincing.
But there's a contradiction worth examining. 👇
━━━━━━━━━━━━━━━━━━
🏦 THE BIG MONEY HASN'T COMPLETELY WALKED AWAY
Consider these figures from the World Gold Council's Q3 2026 report:
• Central banks purchased 321 tonnes of gold, a 42% increase year-on-year.
• Physically backed gold ETFs recorded 211 tonnes of inflows.
Think about that.
Short-term traders can change their positions quickly. Institutional and central-bank demand operates on a different investment horizon.
This doesn't guarantee higher prices, but it complicates the bearish argument.
━━━━━━━━━━━━━━━━━━
⚔️ TWO FORCES ARE FIGHTING OVER GOLD
🐻 THE BEARS:
• Inflation could keep interest rates elevated.
• Higher Treasury yields increase the opportunity cost of holding gold.
• Dollar strength could create additional selling pressure.
🐂 THE BULLS:
• Central-bank demand remains substantial.
• ETF inflows indicate continued investment interest.
• Geopolitical uncertainty could support safe-haven demand.
Neither side has an automatic victory.
━━━━━━━━━━━━━━━━━━
📊 MY $4,000 WATCHLIST
Here is what I'm monitoring:
🔸 $4,000 — Can buyers defend this psychological level?
🔸 $4,155 — Can gold reclaim nearby resistance?
🔸 US inflation — Will economic data reinforce the bearish interest-rate narrative?
A sustained recovery would challenge the bearish outlook.
Continued weakness below important support would strengthen it.
━━━━━━━━━━━━━━━━━━
🔮 MY ONE-MONTH FORECAST
Bias: NEUTRAL → BEARISH
Confidence: MODERATE
I currently lean towards further downside pressure, but I'm not convinced that the longer-term gold story is broken.
The market may be experiencing a disagreement between short-term macroeconomic pressure and longer-term institutional demand.
And that disagreement is exactly what makes this situation interesting.
━━━━━━━━━━━━━━━━━━
💬 LET'S HEAR YOUR THESIS.
If central banks are continuing to accumulate gold while short-term traders are selling...
WHO IS MORE LIKELY TO BE RIGHT OVER THE NEXT MONTH?
🐂 Bulls: Gold is preparing for another recovery.
🐻 Bears: The correction has further to go.
Comment down your guess below. If want to get in early, I recommend going for a 2x leveraged trade on $XAU .
{future}(XAUUSDT)
Neither answer is guaranteed. Let's see which thesis the market validates.
$XAUT
#BitcoinETFsLose$1.6BInNovember #XAU #GoldPrice #GoldCrash #XAUUSD #GoldMarket #Bearish #CryptoNews #Trading #MarketUpdate #InvestWisely #XAUUSD
Everyone is watching gold fall. But what if they're watching it the WRONG way?
🚨 GOLD'S $4,000 BATTLE: THE SELLERS MAY NOT BE SEEING THE FULL PICTURE.
Everyone is watching the price of gold.
But I'm more interested in what's happening behind it.
Gold has come under pressure as markets reassess US inflation, interest rates and the Federal Reserve's next move.
At first glance, the bearish argument looks convincing.
But there's a contradiction worth examining. 👇
━━━━━━━━━━━━━━━━━━
🏦 THE BIG MONEY HASN'T COMPLETELY WALKED AWAY
Consider these figures from the World Gold Council's Q3 2026 report:
• Central banks purchased 321 tonnes of gold, a 42% increase year-on-year.
• Physically backed gold ETFs recorded 211 tonnes of inflows.
Think about that.
Short-term traders can change their positions quickly. Institutional and central-bank demand operates on a different investment horizon.
This doesn't guarantee higher prices, but it complicates the bearish argument.
━━━━━━━━━━━━━━━━━━
⚔️ TWO FORCES ARE FIGHTING OVER GOLD
🐻 THE BEARS:
• Inflation could keep interest rates elevated.
• Higher Treasury yields increase the opportunity cost of holding gold.
• Dollar strength could create additional selling pressure.
🐂 THE BULLS:
• Central-bank demand remains substantial.
• ETF inflows indicate continued investment interest.
• Geopolitical uncertainty could support safe-haven demand.
Neither side has an automatic victory.
━━━━━━━━━━━━━━━━━━
📊 MY $4,000 WATCHLIST
Here is what I'm monitoring:
🔸 $4,000 — Can buyers defend this psychological level?
🔸 $4,155 — Can gold reclaim nearby resistance?
🔸 US inflation — Will economic data reinforce the bearish interest-rate narrative?
A sustained recovery would challenge the bearish outlook.
Continued weakness below important support would strengthen it.
━━━━━━━━━━━━━━━━━━
🔮 MY ONE-MONTH FORECAST
Bias: NEUTRAL → BEARISH
Confidence: MODERATE
I currently lean towards further downside pressure, but I'm not convinced that the longer-term gold story is broken.
The market may be experiencing a disagreement between short-term macroeconomic pressure and longer-term institutional demand.
And that disagreement is exactly what makes this situation interesting.
━━━━━━━━━━━━━━━━━━
💬 LET'S HEAR YOUR THESIS.
If central banks are continuing to accumulate gold while short-term traders are selling...
WHO IS MORE LIKELY TO BE RIGHT OVER THE NEXT MONTH?
🐂 Bulls: Gold is preparing for another recovery.
🐻 Bears: The correction has further to go.
Comment down your guess below. If want to get in early, I recommend going for a 2x leveraged trade on $XAU .
Neither answer is guaranteed. Let's see which thesis the market validates.
$XAUT
#BitcoinETFsLose$1.6BInNovember #XAUUSD #GoldMarket #Bearish #CryptoNews #Trading #MarketUpdate #InvestWisely " data-hashtag="#XAU #GoldPrice #GoldCrash #XAUUSD #GoldMarket #Bearish #CryptoNews #Trading #MarketUpdate #InvestWisely " class="tag">#XAU #GoldPrice #GoldCrash #XAUUSD #GoldMarket #Bearish #CryptoNews #Trading #MarketUpdate #InvestWisely #XAUUSD
Everyone is watching the price of gold.
But I'm more interested in what's happening behind it.
Gold has come under pressure as markets reassess US inflation, interest rates and the Federal Reserve's next move.
At first glance, the bearish argument looks convincing.
But there's a contradiction worth examining. 👇
━━━━━━━━━━━━━━━━━━
🏦 THE BIG MONEY HASN'T COMPLETELY WALKED AWAY
Consider these figures from the World Gold Council's Q3 2026 report:
• Central banks purchased 321 tonnes of gold, a 42% increase year-on-year.
• Physically backed gold ETFs recorded 211 tonnes of inflows.
Think about that.
Short-term traders can change their positions quickly. Institutional and central-bank demand operates on a different investment horizon.
This doesn't guarantee higher prices, but it complicates the bearish argument.
━━━━━━━━━━━━━━━━━━
⚔️ TWO FORCES ARE FIGHTING OVER GOLD
🐻 THE BEARS:
• Inflation could keep interest rates elevated.
• Higher Treasury yields increase the opportunity cost of holding gold.
• Dollar strength could create additional selling pressure.
🐂 THE BULLS:
• Central-bank demand remains substantial.
• ETF inflows indicate continued investment interest.
• Geopolitical uncertainty could support safe-haven demand.
Neither side has an automatic victory.
━━━━━━━━━━━━━━━━━━
📊 MY $4,000 WATCHLIST
Here is what I'm monitoring:
🔸 $4,000 — Can buyers defend this psychological level?
🔸 $4,155 — Can gold reclaim nearby resistance?
🔸 US inflation — Will economic data reinforce the bearish interest-rate narrative?
A sustained recovery would challenge the bearish outlook.
Continued weakness below important support would strengthen it.
━━━━━━━━━━━━━━━━━━
🔮 MY ONE-MONTH FORECAST
Bias: NEUTRAL → BEARISH
Confidence: MODERATE
I currently lean towards further downside pressure, but I'm not convinced that the longer-term gold story is broken.
The market may be experiencing a disagreement between short-term macroeconomic pressure and longer-term institutional demand.
And that disagreement is exactly what makes this situation interesting.
━━━━━━━━━━━━━━━━━━
💬 LET'S HEAR YOUR THESIS.
If central banks are continuing to accumulate gold while short-term traders are selling...
WHO IS MORE LIKELY TO BE RIGHT OVER THE NEXT MONTH?
🐂 Bulls: Gold is preparing for another recovery.
🐻 Bears: The correction has further to go.
Comment down your guess below. If want to get in early, I recommend going for a 2x leveraged trade on $XAU .
Neither answer is guaranteed. Let's see which thesis the market validates.
$XAUT
#BitcoinETFsLose$1.6BInNovember #XAUUSD #GoldMarket #Bearish #CryptoNews #Trading #MarketUpdate #InvestWisely " data-hashtag="#XAU #GoldPrice #GoldCrash #XAUUSD #GoldMarket #Bearish #CryptoNews #Trading #MarketUpdate #InvestWisely " class="tag">#XAU #GoldPrice #GoldCrash #XAUUSD #GoldMarket #Bearish #CryptoNews #Trading #MarketUpdate #InvestWisely #XAUUSD
327

·
--
Bullish
Verified
#ZcashFallsBelow$1000ForFirstTimeSinceSeptember
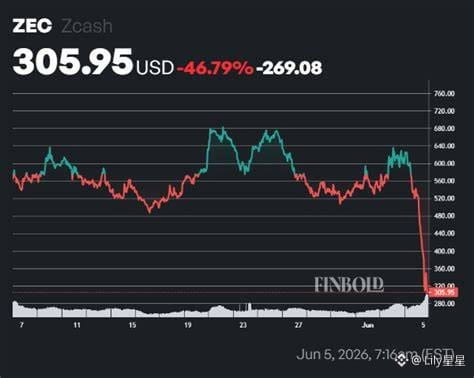
🚨 ZCASH FALLS BELOW $1,000 FOR THE FIRST TIME SINCE SEPTEMBER! 📉⚡
Privacy giant Zcash ($ZEC) has broken down below the psychological $1,000 support level, trading as low as $960.56 – $980 after a sharp ~14.8% 24-hour decline.
The selloff makes ZEC the biggest decliner among top cryptocurrencies over the last 24 hours, erasing significant momentum despite recent network developments and major institutional ecosystem backing.
📌 Core Key Drivers Behind the Breakdown
🏦 Persistent ETF Outflows: Despite Grayscale launching a front-page Wall Street Journal campaign and pledging a $1 Million ecosystem grant across Zcash organizations, the Grayscale Zcash ETF ($ZCSH) has bled over $15 Million in November following $46.25 Million in October net outflows.
🇺🇸 Hotter CPI & Macro De-Risking: Following yesterday's 0.4% U.S. CPI inflation print and rising odds of Fed rate tightening, broader market risk-off sentiment pressured Bitcoin ($73.5k) and altcoin liquidity across the board.
⚙️ Post-NU7 Upgrade "Sell the News": Zcash successfully activated its NU7 network upgrade on November 6—reducing target block intervals from 75s to 25s—yet strong profit-taking after $ZEC's massive multi-month run overrode technical upgrades.
$ZEC
{future}(ZECUSDT)
📉 Key Technical Levels to Watch
🚧 Immediate Resistance ($1,000 – $1,050): The broken psychological baseline has now flipped into overhead resistance. zec must reclaim $1,000 to neutralize immediate sell pressure.
$ETH
{future}(ETHUSDT)
🛡️ Critical Support ($870 – $900): If selling continues, the next major structural demand zone sits around the longer-term moving average ($870–$900), with secondary 200-day SMA support near $782–$850.
$BTC
{future}(BTCUSDT)
#BitcoinETFsLose$1.6BInNovember #AnthropicRejectsIPODelayValuationinQuestion #zcash #CryptoNews
#ZcashFallsBelow$1000ForFirstTimeSinceSeptember
🚨 ZCASH FALLS BELOW $1,000 FOR THE FIRST TIME SINCE SEPTEMBER! 📉⚡
Privacy giant Zcash ($ZEC ) has broken down below the psychological $1,000 support level, trading as low as $960.56 – $980 after a sharp ~14.8% 24-hour decline.
The selloff makes ZEC the biggest decliner among top cryptocurrencies over the last 24 hours, erasing significant momentum despite recent network developments and major institutional ecosystem backing.
📌 Core Key Drivers Behind the Breakdown
🏦 Persistent ETF Outflows: Despite Grayscale launching a front-page Wall Street Journal campaign and pledging a $1 Million ecosystem grant across Zcash organizations, the Grayscale Zcash ETF ($ZCSH) has bled over $15 Million in November following $46.25 Million in October net outflows.
🇺🇸 Hotter CPI & Macro De-Risking: Following yesterday's 0.4% U.S. CPI inflation print and rising odds of Fed rate tightening, broader market risk-off sentiment pressured Bitcoin ($73.5k) and altcoin liquidity across the board.
⚙️ Post-NU7 Upgrade "Sell the News": Zcash successfully activated its NU7 network upgrade on November 6—reducing target block intervals from 75s to 25s—yet strong profit-taking after $ZEC 's massive multi-month run overrode technical upgrades.
$ZEC
📉 Key Technical Levels to Watch
🚧 Immediate Resistance ($1,000 – $1,050): The broken psychological baseline has now flipped into overhead resistance. zec must reclaim $1,000 to neutralize immediate sell pressure.
$ETH
🛡️ Critical Support ($870 – $900): If selling continues, the next major structural demand zone sits around the longer-term moving average ($870–$900), with secondary 200-day SMA support near $782–$850.
$BTC
#BitcoinETFsLose$1.6BInNovember #AnthropicRejectsIPODelayValuationinQuestion #zcash #CryptoNews
🚨 ZCASH FALLS BELOW $1,000 FOR THE FIRST TIME SINCE SEPTEMBER! 📉⚡
Privacy giant Zcash ($ZEC ) has broken down below the psychological $1,000 support level, trading as low as $960.56 – $980 after a sharp ~14.8% 24-hour decline.
The selloff makes ZEC the biggest decliner among top cryptocurrencies over the last 24 hours, erasing significant momentum despite recent network developments and major institutional ecosystem backing.
📌 Core Key Drivers Behind the Breakdown
🏦 Persistent ETF Outflows: Despite Grayscale launching a front-page Wall Street Journal campaign and pledging a $1 Million ecosystem grant across Zcash organizations, the Grayscale Zcash ETF ($ZCSH) has bled over $15 Million in November following $46.25 Million in October net outflows.
🇺🇸 Hotter CPI & Macro De-Risking: Following yesterday's 0.4% U.S. CPI inflation print and rising odds of Fed rate tightening, broader market risk-off sentiment pressured Bitcoin ($73.5k) and altcoin liquidity across the board.
⚙️ Post-NU7 Upgrade "Sell the News": Zcash successfully activated its NU7 network upgrade on November 6—reducing target block intervals from 75s to 25s—yet strong profit-taking after $ZEC 's massive multi-month run overrode technical upgrades.
$ZEC
📉 Key Technical Levels to Watch
🚧 Immediate Resistance ($1,000 – $1,050): The broken psychological baseline has now flipped into overhead resistance. zec must reclaim $1,000 to neutralize immediate sell pressure.
$ETH
🛡️ Critical Support ($870 – $900): If selling continues, the next major structural demand zone sits around the longer-term moving average ($870–$900), with secondary 200-day SMA support near $782–$850.
$BTC
#BitcoinETFsLose$1.6BInNovember #AnthropicRejectsIPODelayValuationinQuestion #zcash #CryptoNews
1
161

·
--
Article
The markets are showing crazy signals today! While traditional investors stick to physical hedges, cThe markets are showing crazy signals today! While traditional investors stick to physical hedges, crypto traders are watching major breakout zones. Let's look at the current board:
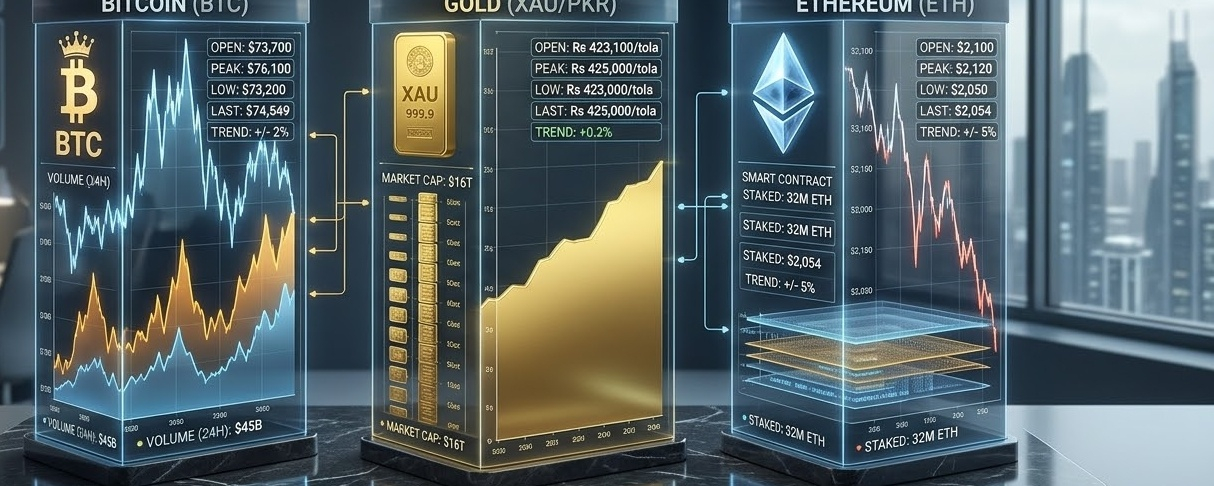
🟡 GOLD (XAU): Holding steady around $3,990 - $4,000/oz (Rs 425,000/tola in PKR). In times of macro volatility, Gold remains the defensive choice for capital preservation.
🟠 BITCOIN (BTC): Consolidating around $74,500. Is this the final accumulation phase before the next parabolic rally, or are we testing support first? 🚀
🔵 ETHEREUM (ETH): Hovering near $2,050 - $2,100. With network activity quietly ramping up, ETH could be offering one of the highest risk/reward ratios right now.
📊 THE BIG QUESTION FOR TODAY:
If you were handed $10,000 cash right now and forced to lock it away for 6 months, where does it go?
1️⃣ All-in Bitcoin (BTC) 🚀
2️⃣ All-in Ethereum (ETH) 💎
3️⃣ Safe-haven Gold (XAU) 🛡️
4️⃣ 50% BTC / 50% ETH Split 📈
👇 Drop your choice (1, 2, 3, or 4) in the comments and tell us WHY!
(I’ll be replying to everyone in the comment section!)
#Bitcoin #Ethereum #Gold #BinanceSquare #CryptoMarket #TradingStrategy
💡 Tips to Maximize Viral Potential on This Post:
Pin the first comment: As soon as you publish, comment on your own post: "I'm leaning towards Option 4! What about you guys?" to encourage others to start commenting.
Reply quickly: The moment someone leaves a number (1, 2, 3, or 4), reply with a short question like "Great pick! What's your end-of-year target for it?" This doubles your comment count instantly..#HotCPIDecemberHikePriced #BTC #AnthropicDisclosesOver$10BNewComputeDeals #BitcoinETFsLose$1.6BInNovember #HotCPIDecemberHikePriced !
The markets are showing crazy signals today! While traditional investors stick to physical hedges, c
The markets are showing crazy signals today! While traditional investors stick to physical hedges, crypto traders are watching major breakout zones. Let's look at the current board:
🟡 GOLD (XAU): Holding steady around $3,990 - $4,000/oz (Rs 425,000/tola in PKR). In times of macro volatility, Gold remains the defensive choice for capital preservation.
🟠 BITCOIN (BTC): Consolidating around $74,500. Is this the final accumulation phase before the next parabolic rally, or are we testing support first? 🚀
🔵 ETHEREUM (ETH): Hovering near $2,050 - $2,100. With network activity quietly ramping up, ETH could be offering one of the highest risk/reward ratios right now.
📊 THE BIG QUESTION FOR TODAY:
If you were handed $10,000 cash right now and forced to lock it away for 6 months, where does it go?
1️⃣ All-in Bitcoin (BTC) 🚀
2️⃣ All-in Ethereum (ETH) 💎
3️⃣ Safe-haven Gold (XAU) 🛡️
4️⃣ 50% BTC / 50% ETH Split 📈
👇 Drop your choice (1, 2, 3, or 4) in the comments and tell us WHY!
(I’ll be replying to everyone in the comment section!)
#Bitcoin #Ethereum #Gold #BinanceSquare #CryptoMarket #TradingStrategy
💡 Tips to Maximize Viral Potential on This Post:
Pin the first comment: As soon as you publish, comment on your own post: "I'm leaning towards Option 4! What about you guys?" to encourage others to start commenting.
Reply quickly: The moment someone leaves a number (1, 2, 3, or 4), reply with a short question like "Great pick! What's your end-of-year target for it?" This doubles your comment count instantly..#HotCPIDecemberHikePriced #BTC #AnthropicDisclosesOver$10BNewComputeDeals #BitcoinETFsLose$1.6BInNovember #HotCPIDecemberHikePriced !
🟡 GOLD (XAU): Holding steady around $3,990 - $4,000/oz (Rs 425,000/tola in PKR). In times of macro volatility, Gold remains the defensive choice for capital preservation.
🟠 BITCOIN (BTC): Consolidating around $74,500. Is this the final accumulation phase before the next parabolic rally, or are we testing support first? 🚀
🔵 ETHEREUM (ETH): Hovering near $2,050 - $2,100. With network activity quietly ramping up, ETH could be offering one of the highest risk/reward ratios right now.
📊 THE BIG QUESTION FOR TODAY:
If you were handed $10,000 cash right now and forced to lock it away for 6 months, where does it go?
1️⃣ All-in Bitcoin (BTC) 🚀
2️⃣ All-in Ethereum (ETH) 💎
3️⃣ Safe-haven Gold (XAU) 🛡️
4️⃣ 50% BTC / 50% ETH Split 📈
👇 Drop your choice (1, 2, 3, or 4) in the comments and tell us WHY!
(I’ll be replying to everyone in the comment section!)
#Bitcoin #Ethereum #Gold #BinanceSquare #CryptoMarket #TradingStrategy
💡 Tips to Maximize Viral Potential on This Post:
Pin the first comment: As soon as you publish, comment on your own post: "I'm leaning towards Option 4! What about you guys?" to encourage others to start commenting.
Reply quickly: The moment someone leaves a number (1, 2, 3, or 4), reply with a short question like "Great pick! What's your end-of-year target for it?" This doubles your comment count instantly..#HotCPIDecemberHikePriced #BTC #AnthropicDisclosesOver$10BNewComputeDeals #BitcoinETFsLose$1.6BInNovember #HotCPIDecemberHikePriced !
67

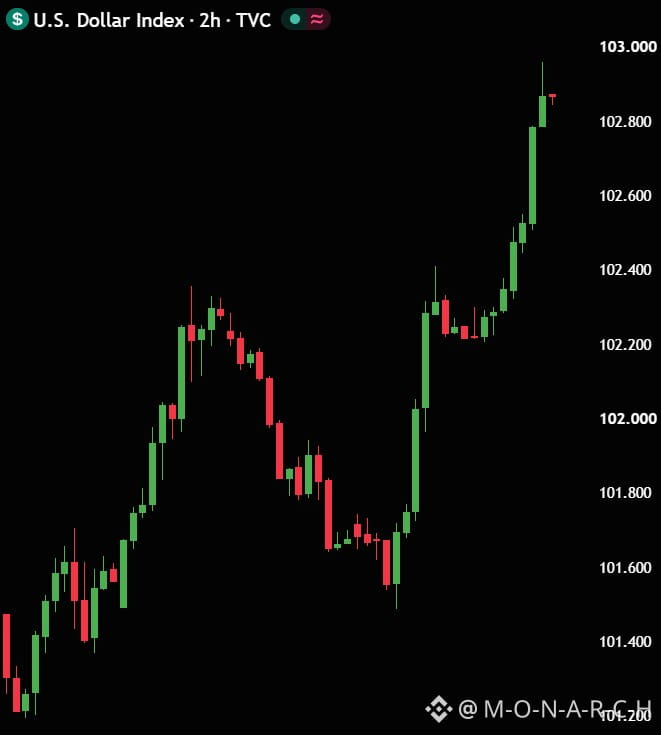
Bullish DXY. With 10Y Rebounding New Highs both are not Good Signs.
Trade Wisely, Not Emotionally or Bias.
#HotCPIDecemberHikePriced #ZcashFallsBelow$1000ForFirstTimeSinceSeptember #StrategyFaces$2.8BSelloffRiskFromMSCIRemoval #AnthropicRejectsIPODelayValuationinQuestion #BitcoinETFsLose$1.6BInNovember
Bullish DXY. With 10Y Rebounding New Highs both are not Good Signs.
Trade Wisely, Not Emotionally or Bias.
#HotCPIDecemberHikePriced #ZcashFallsBelow$1000ForFirstTimeSinceSeptember #StrategyFaces$2.8BSelloffRiskFromMSCIRemoval #AnthropicRejectsIPODelayValuationinQuestion #BitcoinETFsLose$1.6BInNovember
Trade Wisely, Not Emotionally or Bias.
#HotCPIDecemberHikePriced #ZcashFallsBelow$1000ForFirstTimeSinceSeptember #StrategyFaces$2.8BSelloffRiskFromMSCIRemoval #AnthropicRejectsIPODelayValuationinQuestion #BitcoinETFsLose$1.6BInNovember
23


Article
PepeGuys do you think that Pepe one day as memecoin will be massive. That it will hit the market suprise us .
Tell what are your thoughts 🤔 🤔
#PEPE #BitcoinETFsLose$1.6BInNovember $PEPE
Pepe
Guys do you think that Pepe one day as memecoin will be massive. That it will hit the market suprise us .
Tell what are your thoughts 🤔 🤔
#PEPE #BitcoinETFsLose$1.6BInNovember $PEPE
Tell what are your thoughts 🤔 🤔
#PEPE #BitcoinETFsLose$1.6BInNovember $PEPE
Dindin kriptopers:
Yes
1
183
·
--
👀 Bitmine: The $6.3B loss hides a massive accounting trap
#BitmineReports$6.3BFiscal2026Loss
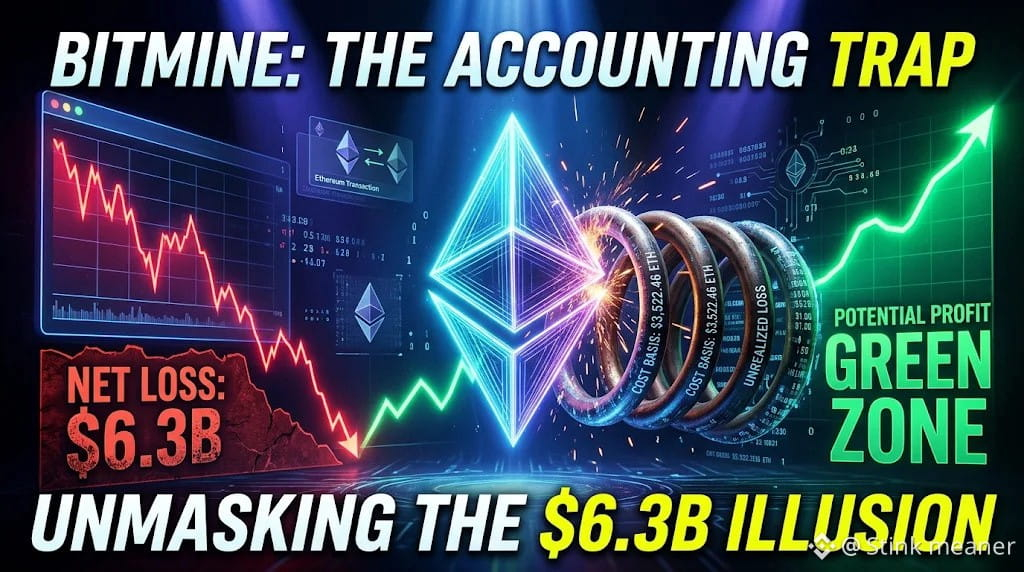
Bitmine’s fiscal 2026 report shocked the market with a $6.313 billion net loss. However, amateur headline traders are completely misinterpreting the company's financial health.
The real story: $6.229 billion of that loss consists entirely of unrealized paper losses on digital asset holdings due to FASB fair-value rules. Zero cash actually left the business.
As of August 31, Bitmine held a massive treasury of 5,901,837 ETH, controlling roughly 4.9% of Ethereum’s entire circulating supply.
By reverse-engineering their financial statements, we can extract their exact entry load. On August 31, their holdings were valued at $14.56 billion (about $2,467 per ETH). Adding back the $6.229 billion in paper losses reveals that Bitmine’s total cost basis for their treasury sits at $20.79 billion.
This puts Bitmine's average cost basis at exactly $3,522.46 per ETH.
Because of this exposure, Bitmine is essentially a highly leveraged Ethereum proxy. While ETH's recent underperformance has severely depressed the stock, it creates a powerful coiled spring. The moment Ethereum crosses the $3,522.46 mark, Bitmine's balance sheet flips entirely back into the green, recording a multi-billion dollar profit and likely triggering a massive equity short squeeze.
Market Implication:
Corporate treasuries holding nearly 5% of an asset's supply amplify equity-crypto correlations. Until ETH recovers toward their baseline, Bitmine's earnings-per-share (EPS) will face extreme volatility, keeping traditional investors cautious but offering a clear target for crypto traders.
The Trader's Play:
Are you accumulating Bitmine stock as a discount proxy to play an Ethereum breakout, or do you think their $3,522 average cost basis is too far out of reach? Drop your targets below.
Not financial advice.
$ETH
{future}(ETHUSDT)
#Ethereum #BitcoinETFsLose$1.6BInNovember #ZcashFallsBelow$1000ForFirstTimeSinceSeptember #HotCPIDecemberHikePriced
👀 Bitmine: The $6.3B loss hides a massive accounting trap
#BitmineReports$6.3BFiscal2026Loss
Bitmine’s fiscal 2026 report shocked the market with a $6.313 billion net loss. However, amateur headline traders are completely misinterpreting the company's financial health.
The real story: $6.229 billion of that loss consists entirely of unrealized paper losses on digital asset holdings due to FASB fair-value rules. Zero cash actually left the business.
As of August 31, Bitmine held a massive treasury of 5,901,837 ETH, controlling roughly 4.9% of Ethereum’s entire circulating supply.
By reverse-engineering their financial statements, we can extract their exact entry load. On August 31, their holdings were valued at $14.56 billion (about $2,467 per ETH). Adding back the $6.229 billion in paper losses reveals that Bitmine’s total cost basis for their treasury sits at $20.79 billion.
This puts Bitmine's average cost basis at exactly $3,522.46 per ETH.
Because of this exposure, Bitmine is essentially a highly leveraged Ethereum proxy. While ETH's recent underperformance has severely depressed the stock, it creates a powerful coiled spring. The moment Ethereum crosses the $3,522.46 mark, Bitmine's balance sheet flips entirely back into the green, recording a multi-billion dollar profit and likely triggering a massive equity short squeeze.
Market Implication:
Corporate treasuries holding nearly 5% of an asset's supply amplify equity-crypto correlations. Until ETH recovers toward their baseline, Bitmine's earnings-per-share (EPS) will face extreme volatility, keeping traditional investors cautious but offering a clear target for crypto traders.
The Trader's Play:
Are you accumulating Bitmine stock as a discount proxy to play an Ethereum breakout, or do you think their $3,522 average cost basis is too far out of reach? Drop your targets below.
Not financial advice.
$ETH
#Ethereum #BitcoinETFsLose$1.6BInNovember #ZcashFallsBelow$1000ForFirstTimeSinceSeptember #HotCPIDecemberHikePriced
#BitmineReports$6.3BFiscal2026Loss
Bitmine’s fiscal 2026 report shocked the market with a $6.313 billion net loss. However, amateur headline traders are completely misinterpreting the company's financial health.
The real story: $6.229 billion of that loss consists entirely of unrealized paper losses on digital asset holdings due to FASB fair-value rules. Zero cash actually left the business.
As of August 31, Bitmine held a massive treasury of 5,901,837 ETH, controlling roughly 4.9% of Ethereum’s entire circulating supply.
By reverse-engineering their financial statements, we can extract their exact entry load. On August 31, their holdings were valued at $14.56 billion (about $2,467 per ETH). Adding back the $6.229 billion in paper losses reveals that Bitmine’s total cost basis for their treasury sits at $20.79 billion.
This puts Bitmine's average cost basis at exactly $3,522.46 per ETH.
Because of this exposure, Bitmine is essentially a highly leveraged Ethereum proxy. While ETH's recent underperformance has severely depressed the stock, it creates a powerful coiled spring. The moment Ethereum crosses the $3,522.46 mark, Bitmine's balance sheet flips entirely back into the green, recording a multi-billion dollar profit and likely triggering a massive equity short squeeze.
Market Implication:
Corporate treasuries holding nearly 5% of an asset's supply amplify equity-crypto correlations. Until ETH recovers toward their baseline, Bitmine's earnings-per-share (EPS) will face extreme volatility, keeping traditional investors cautious but offering a clear target for crypto traders.
The Trader's Play:
Are you accumulating Bitmine stock as a discount proxy to play an Ethereum breakout, or do you think their $3,522 average cost basis is too far out of reach? Drop your targets below.
Not financial advice.
$ETH
#Ethereum #BitcoinETFsLose$1.6BInNovember #ZcashFallsBelow$1000ForFirstTimeSinceSeptember #HotCPIDecemberHikePriced
2
180
·
--
Bullish
Verified
#coreweavejumps10%on168%revenuegrowth
🚨 COREWEAVE JUMPS 10%+ ON 168% REVENUE GROWTH, RELIEVING AI & MINING STOCKS! 📈🚀
AI cloud infrastructure giant CoreWeave provided much-needed relief to technology equities after posting blowout third-quarter 2026 financial results.
CoreWeave shares jumped over 10% to 16% in pre-market trading on Wednesday, November 11, after reporting a 168% year-over-year revenue surge to $3.66 Billion and raising its full-year 2026 revenue guidance to $13.0 Billion – $13.3 Billion (with record backlog hitting $132.5 Billion).
$CRWV
{future}(CRWVUSDT)
📌 Key Earnings Metrics & Market Domino Effect
💰 Revenue Surge & Guidance Raise: Q3 revenue reached $3.66B (up 168% YoY), beating Wall Street estimates. Full-year 2026 revenue guidance was raised to $13.0B–$13.3B (above consensus of $12.86B).
📉 Net Loss & Interest Overhead: Net loss widened to $709 Million ($1.27/share) due to $846M in higher interest costs, though performance still beat analyst loss expectations of $1.53/share.
⚡ AI Infrastructure Sector Rally: CoreWeave’s strong GPU computing demand spilled over to Bitcoin miners-turned-HPC operators and AI stocks:
$ZEN
{future}(ZENUSDT)
IREN: Up 6% to 7.9%
Cipher Digital ($CIFR): Up 7%
Galaxy Digital ($GLXY): Up 5% to 8.8%
Nasdaq 100 Futures: Climbed over 1.5%
🤖 Anthropic ($ANT) IPO Valuation Push: Following CoreWeave's print, Anthropic's bankers are eyeing a debut valuation of $1.5 Trillion or more, up from Tuesday's $1.4 Trillion benchmark, backed by $26B in private placement commitments.
📊 Macro Realities: Bitcoin Holds $74K Amid 86% Fed Rate Hike Odds
Despite the rally in AI equities, macro headwinds remain firm:
🪙 Bitcoin Stable at $74K:$BTC traded flat near $74,000, squeezed between its 200-day SMA ($73.1k) and 50-week SMA ($75.6k).
$XRP
{future}(XRPUSDT)
🏦 Fed December Odds: Futures markets price an 86% probability of a 25 bps rate hike on December 9, with a 14% chance of a 50 bps move as inflation remains stubborn.
#BitcoinETFsLose$1.6BInNovember #HotCPIDecemberHikePriced #AI #BTC
#coreweavejumps10%on168%revenuegrowth
🚨 COREWEAVE JUMPS 10%+ ON 168% REVENUE GROWTH, RELIEVING AI & MINING STOCKS! 📈🚀
AI cloud infrastructure giant CoreWeave provided much-needed relief to technology equities after posting blowout third-quarter 2026 financial results.
CoreWeave shares jumped over 10% to 16% in pre-market trading on Wednesday, November 11, after reporting a 168% year-over-year revenue surge to $3.66 Billion and raising its full-year 2026 revenue guidance to $13.0 Billion – $13.3 Billion (with record backlog hitting $132.5 Billion).
$CRWV
📌 Key Earnings Metrics & Market Domino Effect
💰 Revenue Surge & Guidance Raise: Q3 revenue reached $3.66B (up 168% YoY), beating Wall Street estimates. Full-year 2026 revenue guidance was raised to $13.0B–$13.3B (above consensus of $12.86B).
📉 Net Loss & Interest Overhead: Net loss widened to $709 Million ($1.27/share) due to $846M in higher interest costs, though performance still beat analyst loss expectations of $1.53/share.
⚡ AI Infrastructure Sector Rally: CoreWeave’s strong GPU computing demand spilled over to Bitcoin miners-turned-HPC operators and AI stocks:
$ZEN
IREN: Up 6% to 7.9%
Cipher Digital ($CIFR): Up 7%
Galaxy Digital ($GLXY): Up 5% to 8.8%
Nasdaq 100 Futures: Climbed over 1.5%
🤖 Anthropic ($ANT) IPO Valuation Push: Following CoreWeave's print, Anthropic's bankers are eyeing a debut valuation of $1.5 Trillion or more, up from Tuesday's $1.4 Trillion benchmark, backed by $26B in private placement commitments.
📊 Macro Realities: Bitcoin Holds $74K Amid 86% Fed Rate Hike Odds
Despite the rally in AI equities, macro headwinds remain firm:
🪙 Bitcoin Stable at $74K:$BTC traded flat near $74,000, squeezed between its 200-day SMA ($73.1k) and 50-week SMA ($75.6k).
$XRP
🏦 Fed December Odds: Futures markets price an 86% probability of a 25 bps rate hike on December 9, with a 14% chance of a 50 bps move as inflation remains stubborn.
#BitcoinETFsLose$1.6BInNovember #HotCPIDecemberHikePriced #AI #BTC
🚨 COREWEAVE JUMPS 10%+ ON 168% REVENUE GROWTH, RELIEVING AI & MINING STOCKS! 📈🚀
AI cloud infrastructure giant CoreWeave provided much-needed relief to technology equities after posting blowout third-quarter 2026 financial results.
CoreWeave shares jumped over 10% to 16% in pre-market trading on Wednesday, November 11, after reporting a 168% year-over-year revenue surge to $3.66 Billion and raising its full-year 2026 revenue guidance to $13.0 Billion – $13.3 Billion (with record backlog hitting $132.5 Billion).
$CRWV
📌 Key Earnings Metrics & Market Domino Effect
💰 Revenue Surge & Guidance Raise: Q3 revenue reached $3.66B (up 168% YoY), beating Wall Street estimates. Full-year 2026 revenue guidance was raised to $13.0B–$13.3B (above consensus of $12.86B).
📉 Net Loss & Interest Overhead: Net loss widened to $709 Million ($1.27/share) due to $846M in higher interest costs, though performance still beat analyst loss expectations of $1.53/share.
⚡ AI Infrastructure Sector Rally: CoreWeave’s strong GPU computing demand spilled over to Bitcoin miners-turned-HPC operators and AI stocks:
$ZEN
IREN: Up 6% to 7.9%
Cipher Digital ($CIFR): Up 7%
Galaxy Digital ($GLXY): Up 5% to 8.8%
Nasdaq 100 Futures: Climbed over 1.5%
🤖 Anthropic ($ANT) IPO Valuation Push: Following CoreWeave's print, Anthropic's bankers are eyeing a debut valuation of $1.5 Trillion or more, up from Tuesday's $1.4 Trillion benchmark, backed by $26B in private placement commitments.
📊 Macro Realities: Bitcoin Holds $74K Amid 86% Fed Rate Hike Odds
Despite the rally in AI equities, macro headwinds remain firm:
🪙 Bitcoin Stable at $74K:$BTC traded flat near $74,000, squeezed between its 200-day SMA ($73.1k) and 50-week SMA ($75.6k).
$XRP
🏦 Fed December Odds: Futures markets price an 86% probability of a 25 bps rate hike on December 9, with a 14% chance of a 50 bps move as inflation remains stubborn.
#BitcoinETFsLose$1.6BInNovember #HotCPIDecemberHikePriced #AI #BTC

7
3.7k

$KAVA
{spot}(KAVAUSDT)
Market structure and price action
The chart shows:
Support: Buyers defended the $0.06780 area several times.
Bullish recovery: Strong green candles pushed price from approximately $0.06800 toward $0.06860.
Higher lows: The latest recovery suggests improving short-term buying pressure.
Resistance: Sellers previously appeared around $0.06870–$0.06890.
Current situation: Price is consolidating just below resistance.
showed a $0.06897 24-hour high and $0.06760 low, broadly consistent with these chart levels. Its order-flow snapshot showed selling pressure
WAIT FOR SHORT CONFIRMATION
My preferred trade plan:
Entry: 0.06865–0.06885
SL: 0.06915
TP1: 0.06830
TP2: 0.06800
TP3: 0.06770
#ZcashFallsBelow$1000ForFirstTimeSinceSeptember #BitmineReports$6.3BFiscal2026Loss #CoreWeaveJumps10%On168%RevenueGrowth #BitcoinETFsLose$1.6BInNovember #AnthropicRejectsIPODelayValuationinQuestion
$KAVA
Market structure and price action
The chart shows:
Support: Buyers defended the $0.06780 area several times.
Bullish recovery: Strong green candles pushed price from approximately $0.06800 toward $0.06860.
Higher lows: The latest recovery suggests improving short-term buying pressure.
Resistance: Sellers previously appeared around $0.06870–$0.06890.
Current situation: Price is consolidating just below resistance.
showed a $0.06897 24-hour high and $0.06760 low, broadly consistent with these chart levels. Its order-flow snapshot showed selling pressure
WAIT FOR SHORT CONFIRMATION
My preferred trade plan:
Entry: 0.06865–0.06885
SL: 0.06915
TP1: 0.06830
TP2: 0.06800
TP3: 0.06770
#ZcashFallsBelow$1000ForFirstTimeSinceSeptember #BitmineReports$6.3BFiscal2026Loss #CoreWeaveJumps10%On168%RevenueGrowth #BitcoinETFsLose$1.6BInNovember #AnthropicRejectsIPODelayValuationinQuestion
Market structure and price action
The chart shows:
Support: Buyers defended the $0.06780 area several times.
Bullish recovery: Strong green candles pushed price from approximately $0.06800 toward $0.06860.
Higher lows: The latest recovery suggests improving short-term buying pressure.
Resistance: Sellers previously appeared around $0.06870–$0.06890.
Current situation: Price is consolidating just below resistance.
showed a $0.06897 24-hour high and $0.06760 low, broadly consistent with these chart levels. Its order-flow snapshot showed selling pressure
WAIT FOR SHORT CONFIRMATION
My preferred trade plan:
Entry: 0.06865–0.06885
SL: 0.06915
TP1: 0.06830
TP2: 0.06800
TP3: 0.06770
#ZcashFallsBelow$1000ForFirstTimeSinceSeptember #BitmineReports$6.3BFiscal2026Loss #CoreWeaveJumps10%On168%RevenueGrowth #BitcoinETFsLose$1.6BInNovember #AnthropicRejectsIPODelayValuationinQuestion
Phoenix Crypto:
Waiting for clear confirmation near resistance is sensible. A disciplined entry matters more than forcing a trade.
1
1
59
$TRUMP
{spot}(TRUMPUSDT)
fresh long position at the current price without a confirmed bullish reversal.
Market structure and price action
The chart shows several bearish characteristics:
Lower highs: Buyers have repeatedly failed to push price above previous swing highs.
Lower lows: Price has fallen from approximately $1.75 toward $1.10.
Strong bearish candles: The large red candles around November 4–5 indicate strong selling pressure.
Weak consolidation: Recent candles around $1.12–$1.15 suggest indecision rather than a confirmed reversal.
Possible support formation: Buyers are attempting to defend the $1.10–$1.12 area.
Important support and resistance levels
Based on the chart and current market
Level
Price (USDT)
Importance
Resistance 3
1.28
Strong resistance
Resistance 2
1.21
Near-term resistance
Resistance 1
1.17–1.20
Short-entry zone
Current area
1.13–1.15
Market price
Support 1
1.11–1.09
Critical support
Support 2
1.05
Downside target
Support 3
1.00
Psychological support
What would change my opinion?
Below $1.09: A daily breakdown and failed retest would strengthen the bearish continuation setup.
Above $1.21: Bearish momentum may weaken.
Above $1.26: My proposed short setup is invalidated.
Above $1.28: A stronger bullish recovery becomes possible
#HotCPIDecemberHikePriced #ZcashFallsBelow$1000ForFirstTimeSinceSeptember #StrategyFaces$2.8BSelloffRiskFromMSCIRemoval #BitcoinETFsLose$1.6BInNovember #AnthropicRejectsIPODelayValuationinQuestion
$TRUMP
fresh long position at the current price without a confirmed bullish reversal.
Market structure and price action
The chart shows several bearish characteristics:
Lower highs: Buyers have repeatedly failed to push price above previous swing highs.
Lower lows: Price has fallen from approximately $1.75 toward $1.10.
Strong bearish candles: The large red candles around November 4–5 indicate strong selling pressure.
Weak consolidation: Recent candles around $1.12–$1.15 suggest indecision rather than a confirmed reversal.
Possible support formation: Buyers are attempting to defend the $1.10–$1.12 area.
Important support and resistance levels
Based on the chart and current market
Level
Price (USDT)
Importance
Resistance 3
1.28
Strong resistance
Resistance 2
1.21
Near-term resistance
Resistance 1
1.17–1.20
Short-entry zone
Current area
1.13–1.15
Market price
Support 1
1.11–1.09
Critical support
Support 2
1.05
Downside target
Support 3
1.00
Psychological support
What would change my opinion?
Below $1.09: A daily breakdown and failed retest would strengthen the bearish continuation setup.
Above $1.21: Bearish momentum may weaken.
Above $1.26: My proposed short setup is invalidated.
Above $1.28: A stronger bullish recovery becomes possible
#HotCPIDecemberHikePriced #ZcashFallsBelow$1000ForFirstTimeSinceSeptember #StrategyFaces$2.8BSelloffRiskFromMSCIRemoval #BitcoinETFsLose$1.6BInNovember #AnthropicRejectsIPODelayValuationinQuestion
fresh long position at the current price without a confirmed bullish reversal.
Market structure and price action
The chart shows several bearish characteristics:
Lower highs: Buyers have repeatedly failed to push price above previous swing highs.
Lower lows: Price has fallen from approximately $1.75 toward $1.10.
Strong bearish candles: The large red candles around November 4–5 indicate strong selling pressure.
Weak consolidation: Recent candles around $1.12–$1.15 suggest indecision rather than a confirmed reversal.
Possible support formation: Buyers are attempting to defend the $1.10–$1.12 area.
Important support and resistance levels
Based on the chart and current market
Level
Price (USDT)
Importance
Resistance 3
1.28
Strong resistance
Resistance 2
1.21
Near-term resistance
Resistance 1
1.17–1.20
Short-entry zone
Current area
1.13–1.15
Market price
Support 1
1.11–1.09
Critical support
Support 2
1.05
Downside target
Support 3
1.00
Psychological support
What would change my opinion?
Below $1.09: A daily breakdown and failed retest would strengthen the bearish continuation setup.
Above $1.21: Bearish momentum may weaken.
Above $1.26: My proposed short setup is invalidated.
Above $1.28: A stronger bullish recovery becomes possible
#HotCPIDecemberHikePriced #ZcashFallsBelow$1000ForFirstTimeSinceSeptember #StrategyFaces$2.8BSelloffRiskFromMSCIRemoval #BitcoinETFsLose$1.6BInNovember #AnthropicRejectsIPODelayValuationinQuestion
147



Log in to explore more content
Join global crypto users on Binance Square
⚡️ Get latest and useful information about crypto.
💬 Trusted by the world’s largest crypto exchange.
👍 Discover real insights from verified creators.
Email / Phone number
Trending Topics
1
#HotCPIDecemberHikePriced
363,298 views
3,412 Discussing
2
#ZcashFallsBelow$1000ForFirstTimeSinceSeptember
12,981 views
71 Discussing
3
#StrategyFaces$2.8BSelloffRiskFromMSCIRemoval
24,253 views
148 Discussing
4
#AnthropicRejectsIPODelayValuationinQuestion
379,807 views
3,294 Discussing
5
#BitcoinETFsLose$1.6BInNovember
10,924 views
55 Discussing
6
#AnthropicDisclosesOver$10BNewComputeDeals
2,217 views
32 Discussing
7
#CoreWeaveJumps10%On168%RevenueGrowth
27,749 views
519 Discussing
8
#CanNvidiaEarningsEaseMarketConcerns?
117,162 views
1,451 Discussing
9
#BarclaysRaisesBlackRockBitcoinETFStake48%
24,225 views
383 Discussing
10
#BitmineReports$6.3BFiscal2026Loss
8,311 views
26 Discussing