Binance Square
#bitcoincycles

bitcoincycles

532,639 views
105 Discussing
First Block
·
--
💥 BITCOIN CORRECTION BUT THE DATA STILL DOESN'T INDICATE A PEAK $BTC Every time Bitcoin takes a hard hit, the same narrative pops up: "The cycle is over." "A bear market begins." "The party is over." But some data tells a pretty different story. 📊 The NUPL (Net Unrealized Profit/Loss) indicator measures the unrealized gains and losses of Bitcoin investors. In other words: It helps us understand how much profit is sitting in the market. Historically, cycle peaks tend to appear when a large portion of participants is sitting on very high gains. Today, we're not seeing that. Currently, the NUPL is hovering around 16%. A zone known as "Hope." Far from the euphoria levels that historically accompanied Bitcoin's most significant highs. 📊 Additionally, the total market cap of crypto reached around $4 trillion. Today, it's sitting close to $2.18 trillion. In other words: We're far from the levels of expansion and exuberance that characterize the most speculative phases of the cycle. 📊 And there's another interesting data point. Global liquidity (M2) remains at elevated levels. Historically, Bitcoin has shown a strong correlation with liquidity expansion. That doesn't guarantee immediate price increases. But it does provide context. 🎯 Does this mean Bitcoin can't keep correcting? No. Can it sideways for months? Neither. But a price correction and an end of the cycle are not necessarily the same thing. While emotions are screaming fear... the NUPL is still far from euphoria. Global liquidity remains high. And the market cap is well below the levels where exuberance typically rears its head. 🛡️ The price shows what's happening. The data helps us understand where Bitcoin might stand within its cycle. #BitcoinCycles
💥 BITCOIN CORRECTION
BUT THE DATA STILL DOESN'T INDICATE A PEAK
$BTC

Every time Bitcoin takes a hard hit, the same narrative pops up:
"The cycle is over."
"A bear market begins."
"The party is over."

But some data tells a pretty different story.

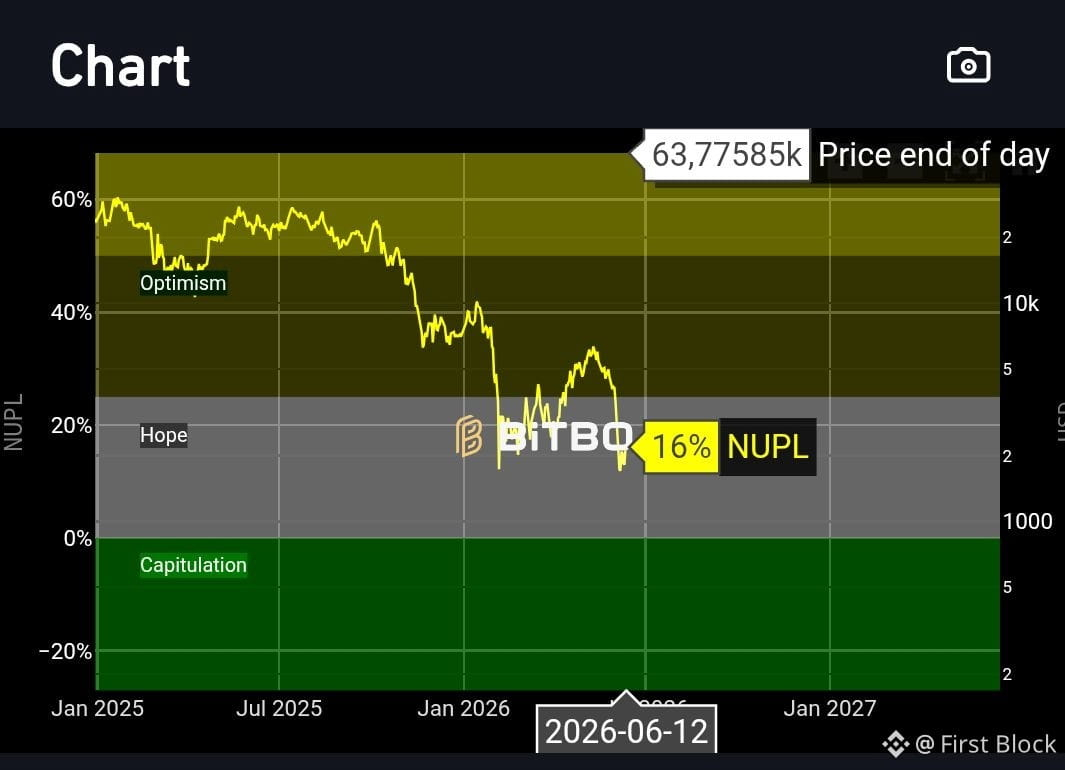
📊 The NUPL (Net Unrealized Profit/Loss) indicator measures the unrealized gains and losses of Bitcoin investors.

In other words:
It helps us understand how much profit is sitting in the market.

Historically, cycle peaks tend to appear when a large portion of participants is sitting on very high gains.

Today, we're not seeing that.
Currently, the NUPL is hovering around 16%.
A zone known as "Hope."

Far from the euphoria levels that historically accompanied Bitcoin's most significant highs.

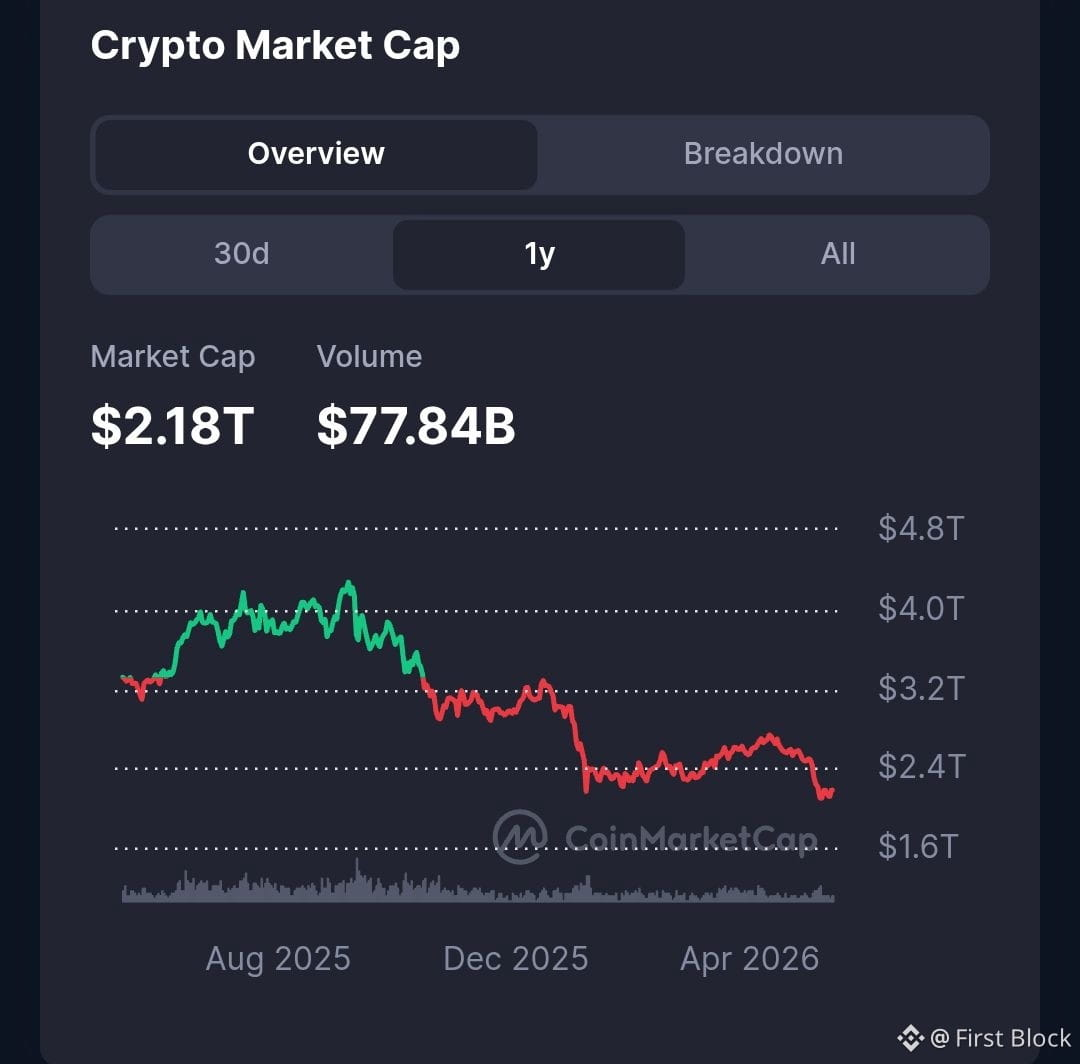
📊 Additionally, the total market cap of crypto reached around $4 trillion.

Today, it's sitting close to $2.18 trillion.

In other words:
We're far from the levels of expansion and exuberance that characterize the most speculative phases of the cycle.

📊 And there's another interesting data point.
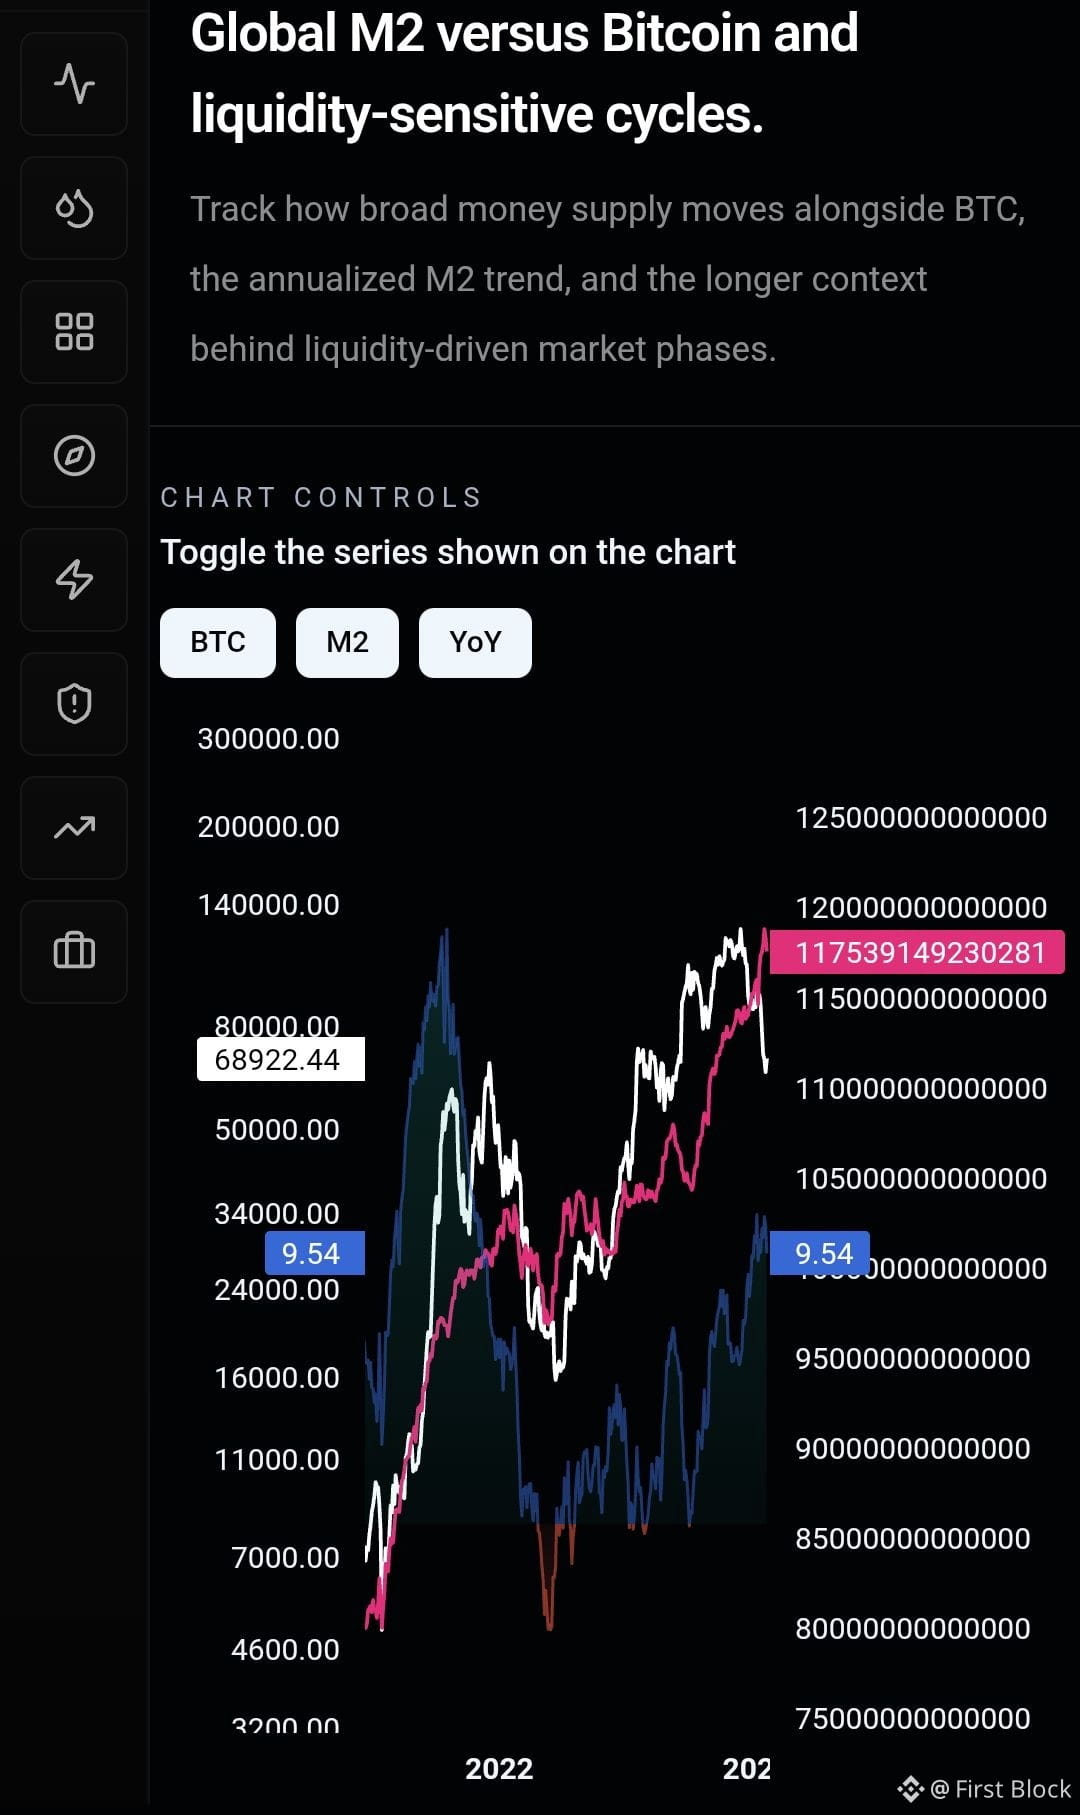
Global liquidity (M2) remains at elevated levels.
Historically, Bitcoin has shown a strong correlation with liquidity expansion.

That doesn't guarantee immediate price increases.
But it does provide context.

🎯 Does this mean Bitcoin can't keep correcting?
No.

Can it sideways for months?
Neither.

But a price correction and an end of the cycle are not necessarily the same thing.

While emotions are screaming fear...
the NUPL is still far from euphoria.

Global liquidity remains high.
And the market cap is well below the levels where exuberance typically rears its head.

🛡️ The price shows what's happening.
The data helps us understand where Bitcoin might stand within its cycle.

#BitcoinCycles

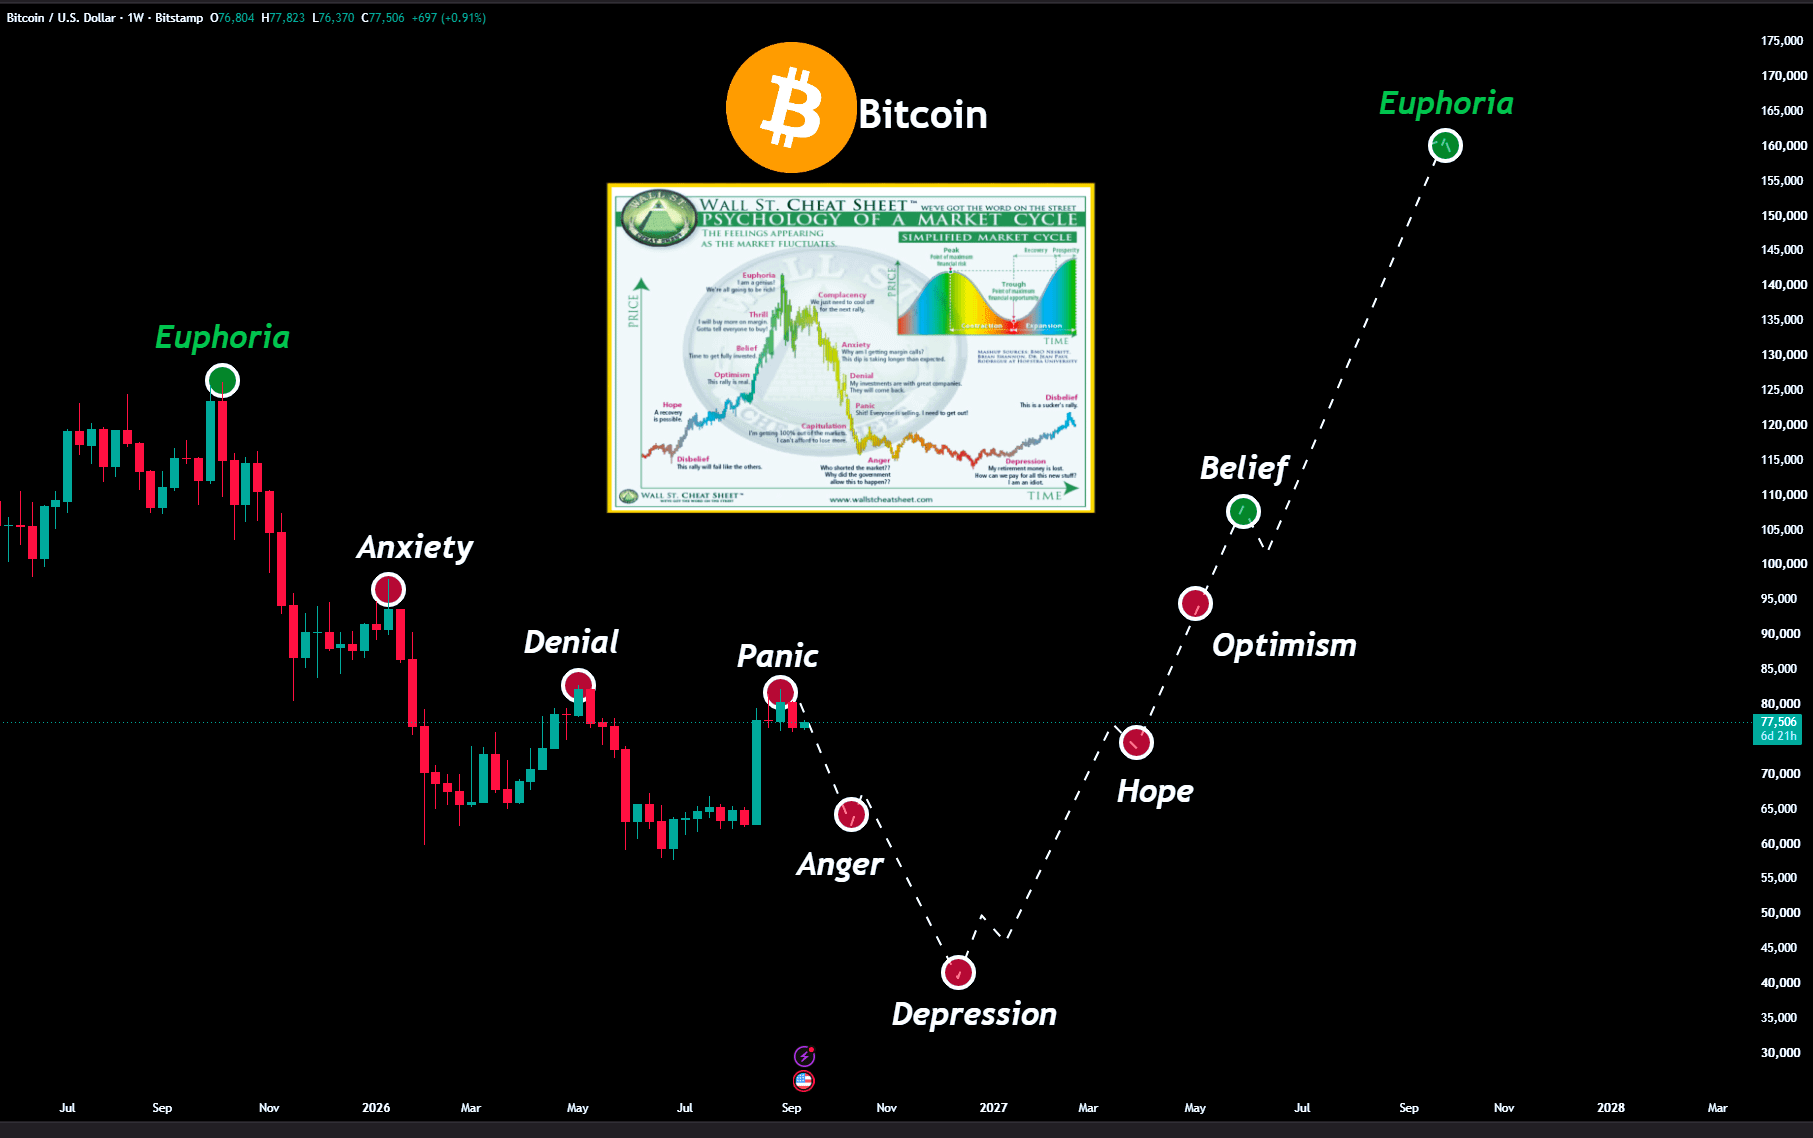
You know how they say history doesn't repeat itself exactly, but it certainly rhymes? Well, looking at $BTC right now, it feels like we're reading from a very familiar playbook, echoing patterns we saw play out in both 2017 and 2021. It's almost uncanny how closely things are lining up on the charts. That recent upward movement? For many of us who've been watching these cycles, it felt like a classic bull trap unfolding. The kind designed to lure people in before the real market correction or consolidation hits. If these historical blueprints hold true, we're facing a couple of distinct paths ahead for Bitcoin. One possibility sees us pushing rapidly towards the $48,000 mark in the very near future, perhaps even within days, as the initial impulse plays out. However, there's another, more cautious scenario that suggests we could be heading for a retest of the $28,000 level, potentially by August, before we truly kick off the next major bull run. This isn't just speculation; it's based on how these cycles have played out before for $BTC and even other majors like $ETH and $SOL. So, the big question isn't just which way it goes, but are you truly prepared for either of these significant moves? It's always crucial to have a strategy ready for either direction, especially when history seems to be giving us such clear signals. #BitcoinCycles #CryptoAnalysis #MarketOutlook #BTCPrice
You know how they say history doesn't repeat itself exactly, but it certainly rhymes? Well, looking at $BTC right now, it feels like we're reading from a very familiar playbook, echoing patterns we saw play out in both 2017 and 2021. It's almost uncanny how closely things are lining up on the charts.

That recent upward movement? For many of us who've been watching these cycles, it felt like a classic bull trap unfolding. The kind designed to lure people in before the real market correction or consolidation hits.

If these historical blueprints hold true, we're facing a couple of distinct paths ahead for Bitcoin. One possibility sees us pushing rapidly towards the $48,000 mark in the very near future, perhaps even within days, as the initial impulse plays out.

However, there's another, more cautious scenario that suggests we could be heading for a retest of the $28,000 level, potentially by August, before we truly kick off the next major bull run. This isn't just speculation; it's based on how these cycles have played out before for $BTC and even other majors like $ETH and $SOL .

So, the big question isn't just which way it goes, but are you truly prepared for either of these significant moves? It's always crucial to have a strategy ready for either direction, especially when history seems to be giving us such clear signals.

#BitcoinCycles #CryptoAnalysis #MarketOutlook #BTCPrice
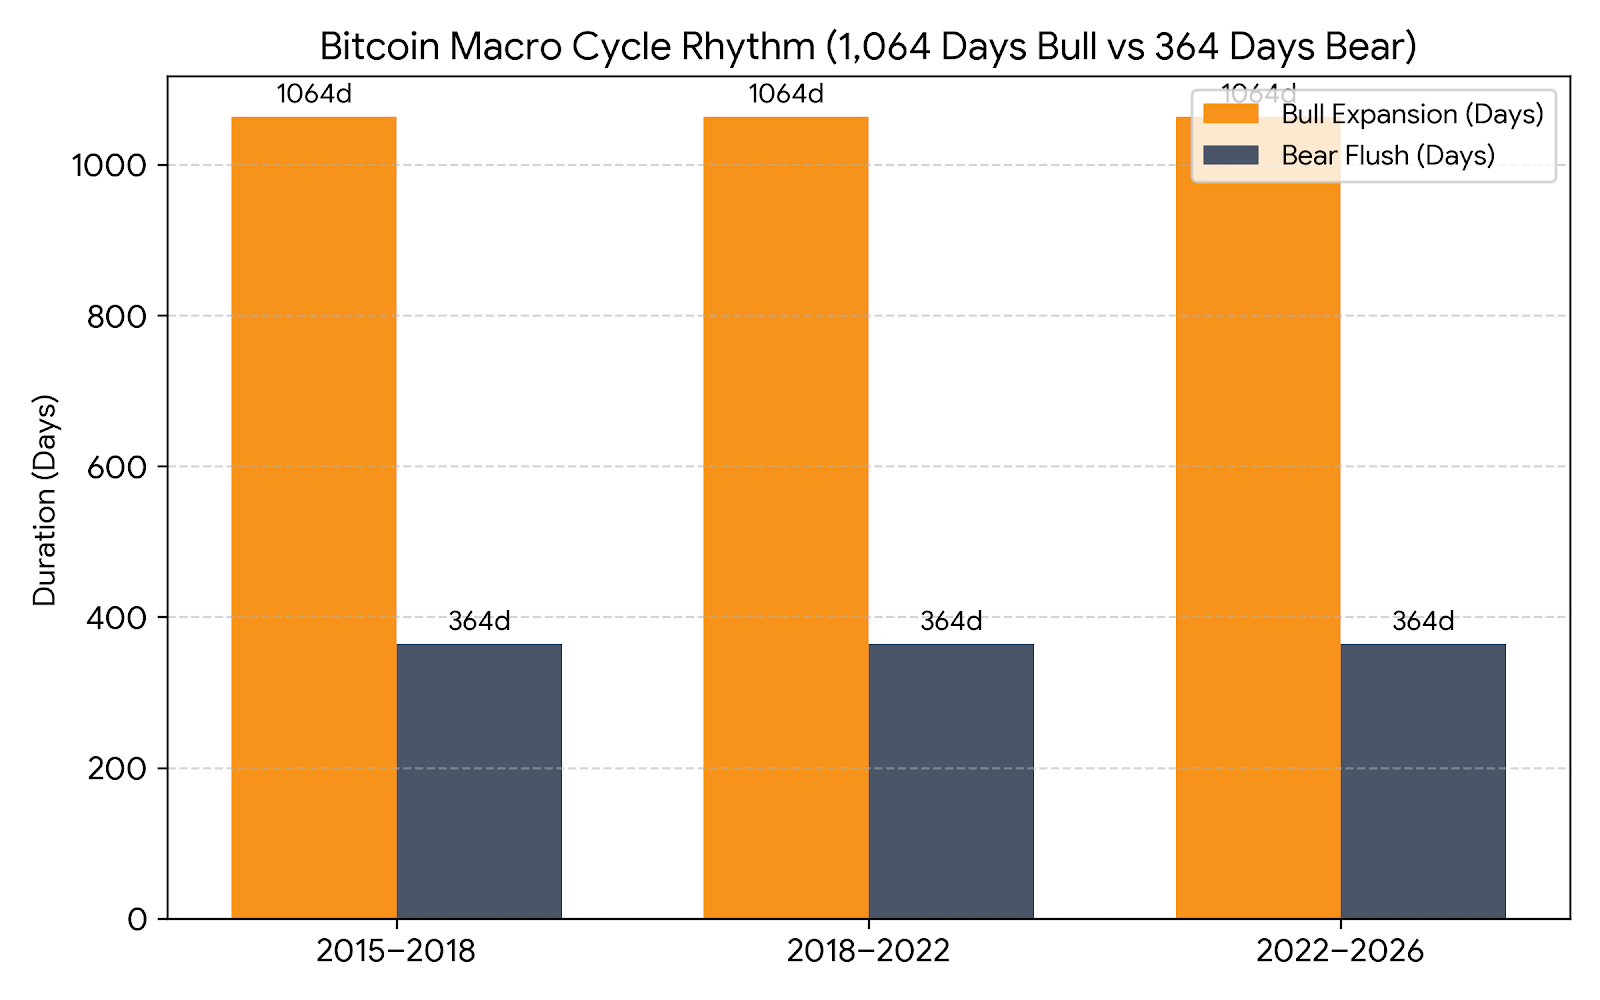
Is $53K Bitcoin's next major turning point? 🤯 This news highlights Bitcoin's historical 4-year cycle, suggesting we might be approaching a significant low before its next big run in 2028. Think of it like seasons: crypto markets often follow predictable patterns, with growth, correction, and then new growth. This cycle theory points to a price area around $53,000 as a potential "midpoint" or accumulation zone for many long-term investors. Understanding these cycles helps investors manage expectations and identify potential entry points. It's about looking beyond daily price swings and understanding the bigger picture of Bitcoin's development. For me, this suggests that patient investors might find opportunities as the cycle unfolds. It's not about jumping in blindly, but rather understanding historical trends to inform future decisions. While no guarantee, past cycles offer valuable insights. Today, we saw SENT jump over 16%, showing that even in uncertain times, individual tokens can make big moves. What are your thoughts on Bitcoin's cycles? #BitcoinCycles #CryptoEducation #LongTermHolding $BTC $SENT
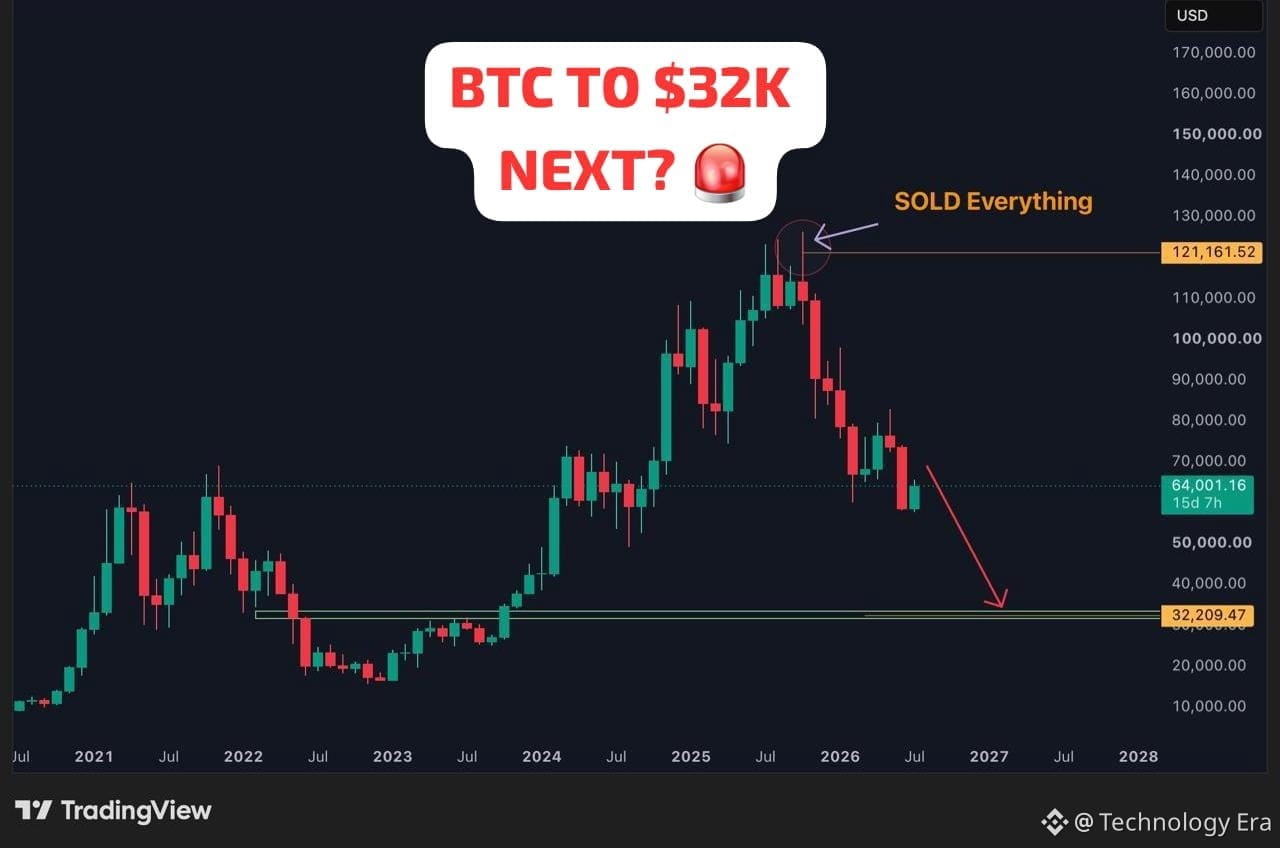
🚨 $BTC Multi-Year Macro Cycle: Ultimate Peak or a Deep Correction to $32K? 📉 The long-term macro chart for Bitcoin in presents an incredibly bold, high-horizon cyclical prediction. After mapping out a massive multi-year bull run from the 2022 lows, the chart outlines a structural peak and a projected path toward a major macro correction. 📊 The Cyclical Shift Formula: Macro Peak ($121,161) - Sustained Distribution = Macro Re-accumulation Floor ($32,209) 🔍 Key Technical Levels & Current 2026 Market Context: 1.The Cycle Top: The chart highlights a cycle peak labeled "SOLD Everything" right near the $121,161.52 level. This aligns closely with Bitcoin's historical high of $126,198.07 printed in late 2025. 2.The Projected Bear Target: A heavy red arrow points all the way down to a major macro support corridor at $32,209.47. 3.According to this cyclical analysis, failing to hold the current ranges could lead to a massive distribution phase, eventually seeking out this long-term accumulation block. Where We Stand Today: The chart shows the current candle resting at $64,001.16. In the live market today, Bitcoin is trading in a highly volatile range, fluctuating around $64,500 as market participants weigh institutional spot ETF demand against macro headwinds. While the macro projection in this chart is extremely bearish, the $64,000 range remains a major battlefield. A firm breakdown below $60,000 would validate the bears' strength, while reclaiming structural weekly support above $68,000 would heavily challenge this $32K target. Keep your leverage low and your time horizon wide inside these major macro turning points! 💬 Do you think this chart's warning is correct and we are heading to $32K, or are the bulls ready to send $BTC back to $100K? Share your strategy below! 👇 Disclaimer: This is for educational purposes only. Always do your own research (DYOR) before entering any trade. 📸 Image Source: TradingView #MacroAnalysis #CryptoTrading. #TechnicalAnalysis #BitcoinCycles #SpaceXClosesBelowIPOPriceFirstTime $BTC {future}(BTCUSDT)
🚨 $BTC Multi-Year Macro Cycle: Ultimate Peak or a Deep Correction to $32K? 📉

The long-term macro chart for Bitcoin in presents an incredibly bold, high-horizon cyclical prediction. After mapping out a massive multi-year bull run from the 2022 lows, the chart outlines a structural peak and a projected path toward a major macro correction.

📊 The Cyclical Shift Formula:

Macro Peak ($121,161) - Sustained Distribution = Macro Re-accumulation Floor ($32,209)

🔍 Key Technical Levels & Current 2026 Market Context:

1.The Cycle Top: The chart highlights a cycle peak labeled "SOLD Everything" right near the $121,161.52 level. This aligns closely with Bitcoin's historical high of $126,198.07 printed in late 2025.

2.The Projected Bear Target: A heavy red arrow points all the way down to a major macro support corridor at $32,209.47.

3.According to this cyclical analysis, failing to hold the current ranges could lead to a massive distribution phase, eventually seeking out this long-term accumulation block.

Where We Stand Today: The chart shows the current candle resting at $64,001.16. In the live market today, Bitcoin is trading in a highly volatile range, fluctuating around $64,500 as market participants weigh institutional spot ETF demand against macro headwinds.

While the macro projection in this chart is extremely bearish, the $64,000 range remains a major battlefield. A firm breakdown below $60,000 would validate the bears' strength, while reclaiming structural weekly support above $68,000 would heavily challenge this $32K target.
Keep your leverage low and your time horizon wide inside these major macro turning points!

💬 Do you think this chart's warning is correct and we are heading to $32K, or are the bulls ready to send $BTC back to $100K? Share your strategy below! 👇

Disclaimer: This is for educational purposes only. Always do your own research (DYOR) before entering any trade.

📸 Image Source: TradingView

#MacroAnalysis #CryptoTrading. #TechnicalAnalysis #BitcoinCycles #SpaceXClosesBelowIPOPriceFirstTime
$BTC
·
--
Bearish
Log in to explore more content
Join global crypto users on Binance Square
⚡️ Get latest and useful information about crypto.
💬 Trusted by the world’s largest crypto exchange.
👍 Discover real insights from verified creators.
Email / Phone number