
#asts
asts
30,204 views
522 Discussing
Hot
Latest

·
--
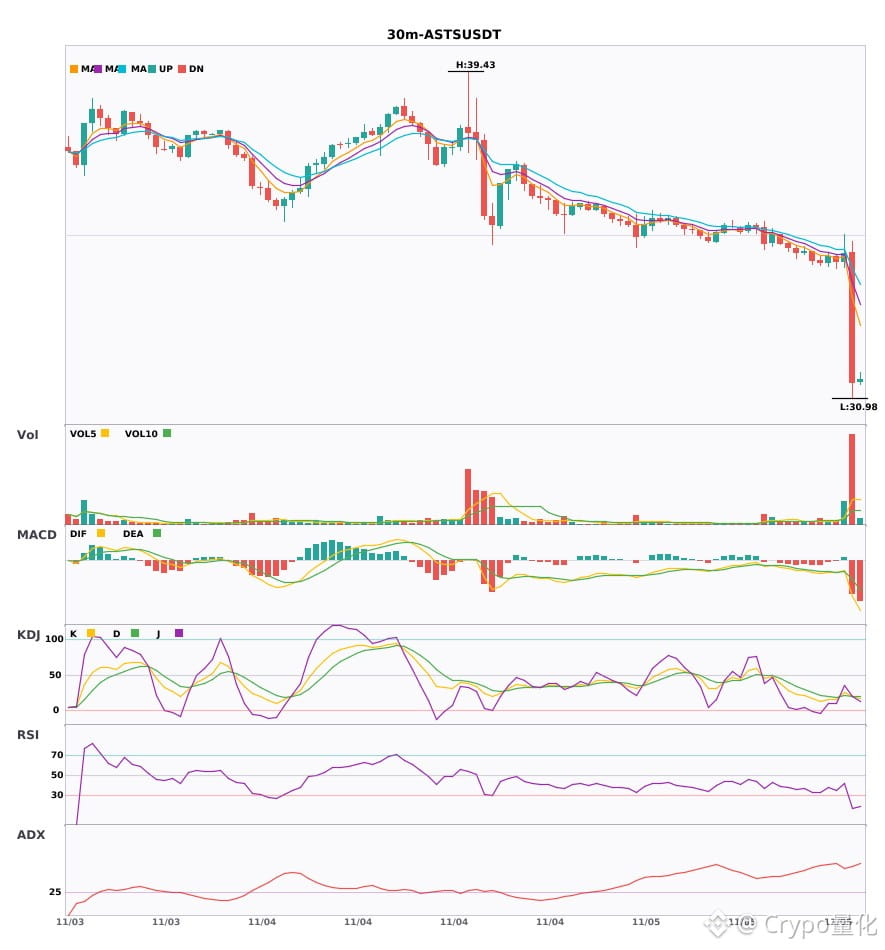
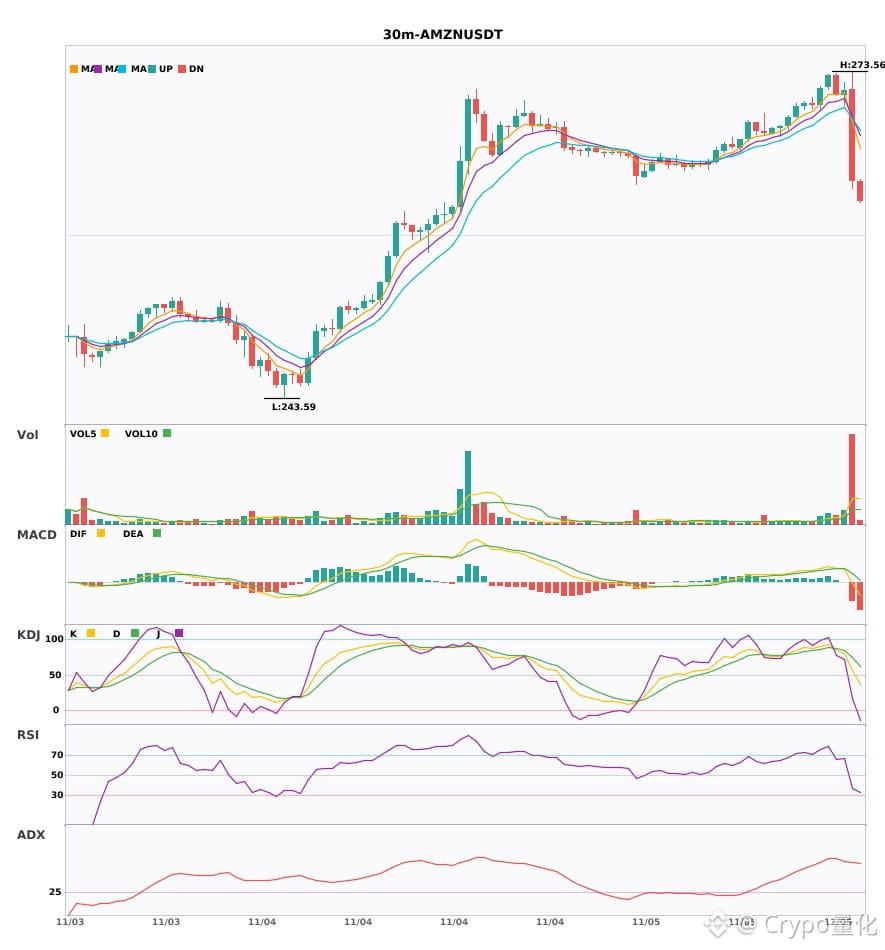
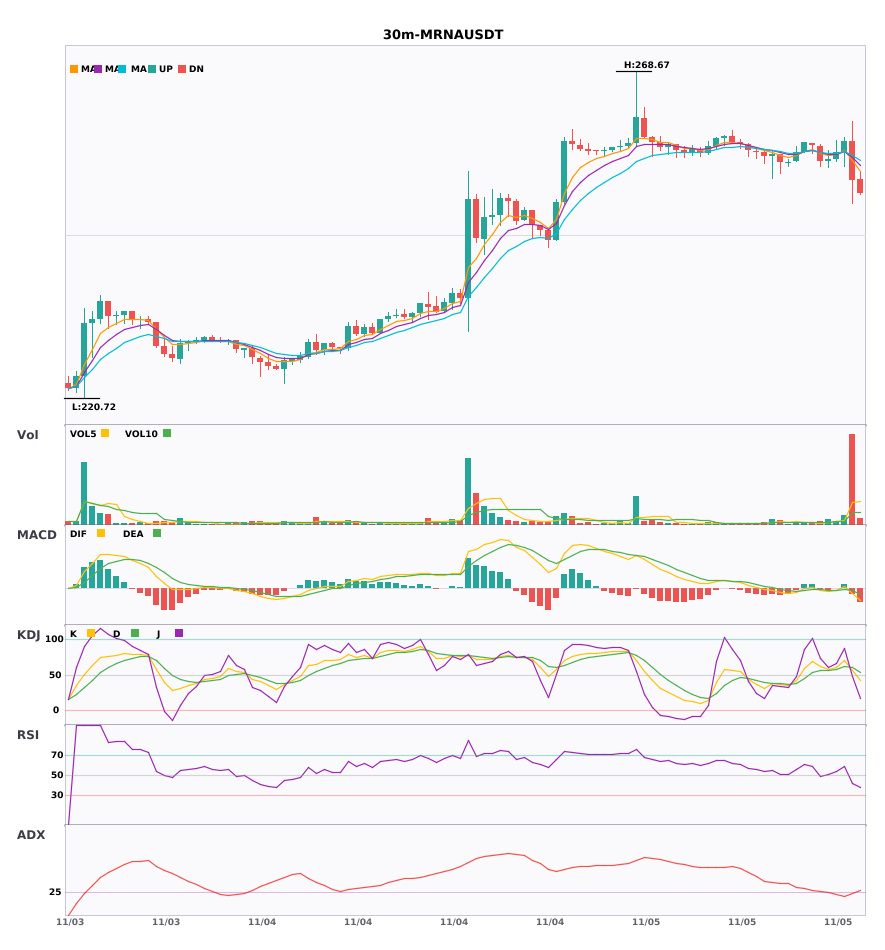
$ASTS / $AMZN / $MRNA 30-minute technical indicators have weakened simultaneously. Beware of risk 🔥
════════════════════
🟢 $ASTS 30-minute bearish signal
⚠️ Technical analysis: ADX(56) Very strong trend (beware of an overbought pullback) | MACD bearish crossover below zero, bearish momentum accelerating | EMA5 < EMA8 < EMA13, bearish alignment | KDJ bearish crossover, short-term outlook bearish (K: 20.1, D: 20.5) | Volume surge (6.4x)
════════════════════
🟢 $AMZN 30-minute bearish signal
⚠️ Technical analysis: ADX(62) Very strong trend (beware of an overbought pullback) | MACD DIF fell below the zero line, trend turning bearish | EMA5 crossed below EMA8, short-term outlook turning bearish | KDJ showing strong momentum, bulls have the upper hand (K: 55.7, D: 75.2) | Volume surge (6.0x)
════════════════════
🟢 $MRNA 30-minute bearish signal
⚠️ Technical analysis: ADX(25) Trend is forming; an entry may be considered | MACD bearish crossover below zero, bearish momentum accelerating | EMA5 crossed below EMA8, short-term outlook turning bearish | KDJ bearish crossover, short-term outlook bearish (K: 56.4, D: 60.3) | Volume surge (7.4x)
════════════════════
🔔 Follow to get first-hand market alerts 🔔
#技术分析 #ASTS #AMZN #MRNA
📌 When trading, check whether the candlestick pattern confirms the setup
$ASTS / $AMZN / $MRNA 30-minute technical indicators have weakened simultaneously. Beware of risk 🔥
════════════════════
🟢 $ASTS 30-minute bearish signal
⚠️ Technical analysis: ADX(56) Very strong trend (beware of an overbought pullback) | MACD bearish crossover below zero, bearish momentum accelerating | EMA5 < EMA8 < EMA13, bearish alignment | KDJ bearish crossover, short-term outlook bearish (K: 20.1, D: 20.5) | Volume surge (6.4x)
════════════════════
🟢 $AMZN 30-minute bearish signal
⚠️ Technical analysis: ADX(62) Very strong trend (beware of an overbought pullback) | MACD DIF fell below the zero line, trend turning bearish | EMA5 crossed below EMA8, short-term outlook turning bearish | KDJ showing strong momentum, bulls have the upper hand (K: 55.7, D: 75.2) | Volume surge (6.0x)
════════════════════
🟢 $MRNA 30-minute bearish signal
⚠️ Technical analysis: ADX(25) Trend is forming; an entry may be considered | MACD bearish crossover below zero, bearish momentum accelerating | EMA5 crossed below EMA8, short-term outlook turning bearish | KDJ bearish crossover, short-term outlook bearish (K: 56.4, D: 60.3) | Volume surge (7.4x)
════════════════════
🔔 Follow to get first-hand market alerts 🔔
#技术分析 #ASTS #AMZN #MRNA
📌 When trading, check whether the candlestick pattern confirms the setup
════════════════════
🟢 $ASTS 30-minute bearish signal
⚠️ Technical analysis: ADX(56) Very strong trend (beware of an overbought pullback) | MACD bearish crossover below zero, bearish momentum accelerating | EMA5 < EMA8 < EMA13, bearish alignment | KDJ bearish crossover, short-term outlook bearish (K: 20.1, D: 20.5) | Volume surge (6.4x)
════════════════════
🟢 $AMZN 30-minute bearish signal
⚠️ Technical analysis: ADX(62) Very strong trend (beware of an overbought pullback) | MACD DIF fell below the zero line, trend turning bearish | EMA5 crossed below EMA8, short-term outlook turning bearish | KDJ showing strong momentum, bulls have the upper hand (K: 55.7, D: 75.2) | Volume surge (6.0x)
════════════════════
🟢 $MRNA 30-minute bearish signal
⚠️ Technical analysis: ADX(25) Trend is forming; an entry may be considered | MACD bearish crossover below zero, bearish momentum accelerating | EMA5 crossed below EMA8, short-term outlook turning bearish | KDJ bearish crossover, short-term outlook bearish (K: 56.4, D: 60.3) | Volume surge (7.4x)
════════════════════
🔔 Follow to get first-hand market alerts 🔔
#技术分析 #ASTS #AMZN #MRNA
📌 When trading, check whether the candlestick pattern confirms the setup
2

·
--
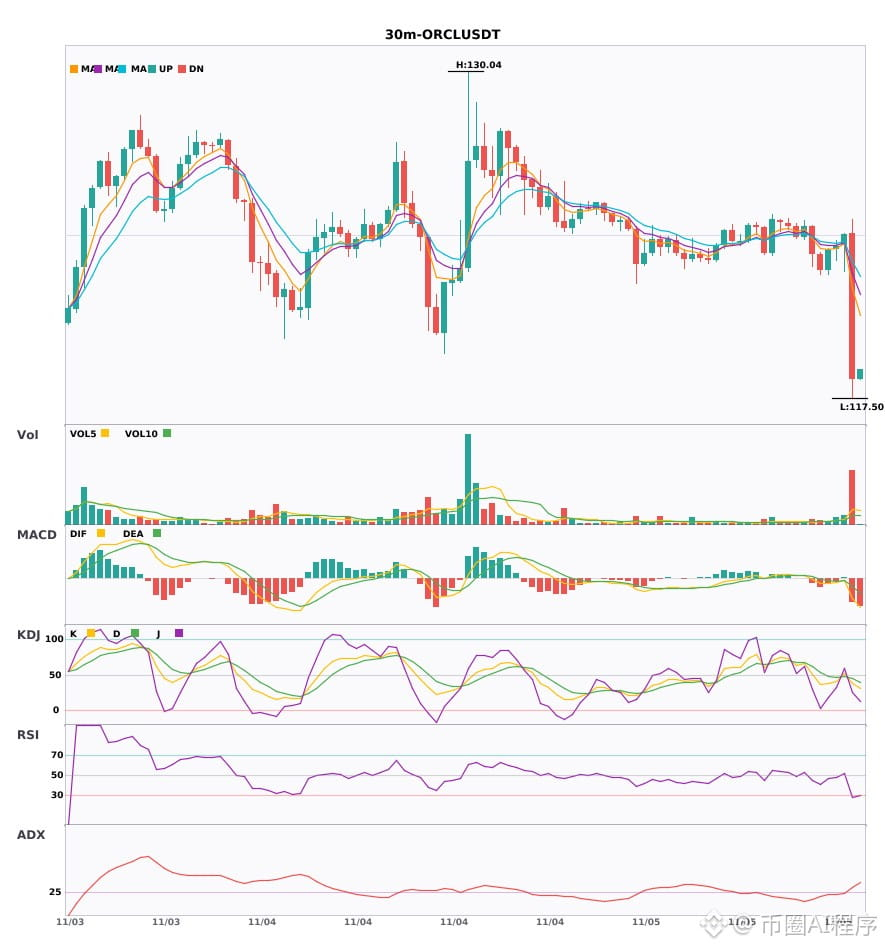
$ORCL / $CT / $ASTS 30-minute bearish + 4-hour bearish alignment; multi-timeframe confluence turns bearish 🔥
════════════════════
🟢 $ORCL 30-minute bearish signal
⚠️Technical analysis: 4-hour bearish confluence confirmed | 30-minute entry: MACD bearish cross below zero, bearish momentum accelerating | EMA5 < EMA8 < EMA13, bearish alignment | KDJ bearish cross, short-term outlook bearish (K = 38.0, D = 44.7) | Volume surge (5.8x)
════════════════════
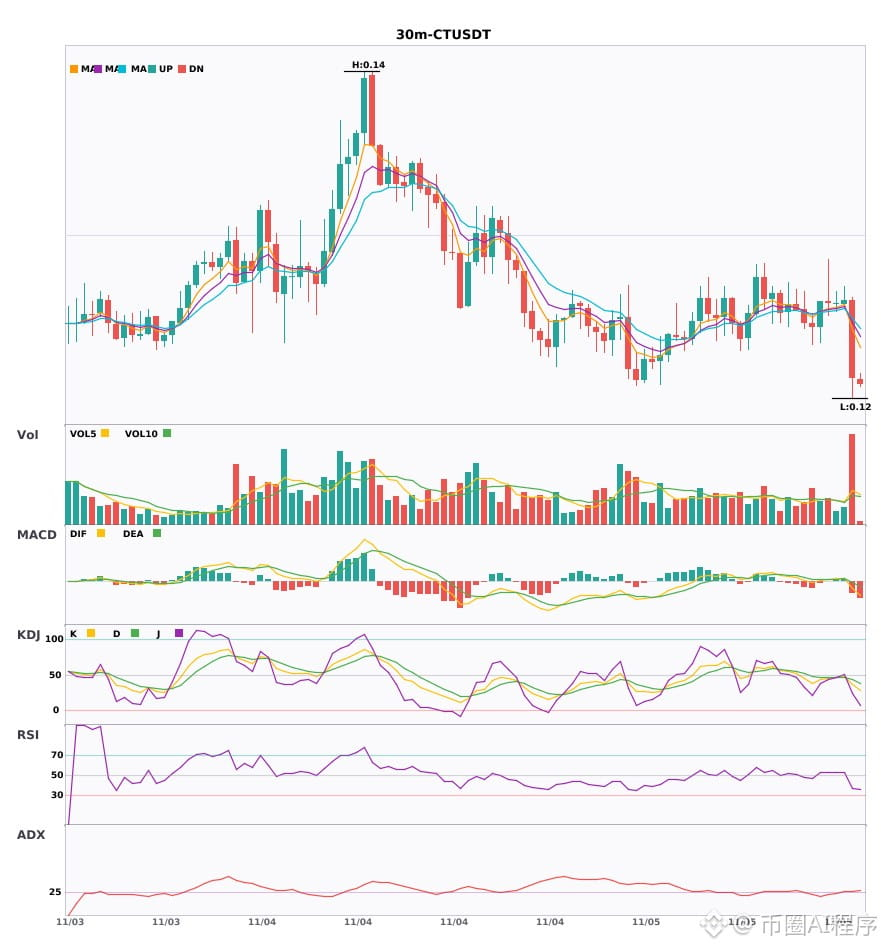
🟢 $CT 30-minute bearish signal
⚠️Technical analysis: 4-hour bearish confluence confirmed | 30-minute entry: MACD bearish cross below zero, bearish momentum accelerating | EMA5 crosses below EMA8, short-term outlook turns bearish | KDJ bearish cross, short-term outlook bearish (K = 37.1, D = 43.5) | Volume surge (3.1x)
════════════════════
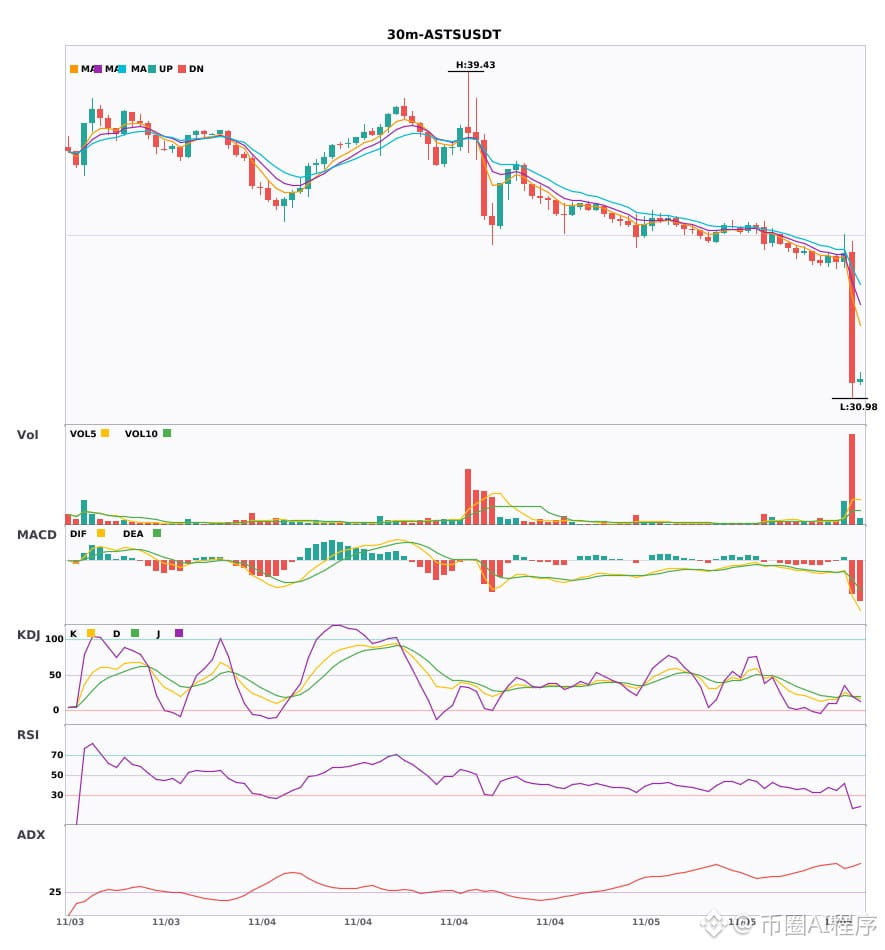
🟢 $ASTS 30-minute bearish signal
⚠️Technical analysis: 4-hour bearish confluence confirmed | 30-minute entry: MACD bearish cross below zero, bearish momentum accelerating | EMA5 < EMA8 < EMA13, bearish alignment | KDJ bearish cross, short-term outlook bearish (K = 20.1, D = 20.5) | Volume surge (6.4x)
════════════════════
🔔 Follow to get first-hand market alerts 🔔
#多周期共振 #ORCL #CT #ASTS
📌 When trading, watch for whether the candlestick pattern confirms the signal
$ORCL / $CT / $ASTS 30-minute bearish + 4-hour bearish alignment; multi-timeframe confluence turns bearish 🔥
════════════════════
🟢 $ORCL 30-minute bearish signal
⚠️Technical analysis: 4-hour bearish confluence confirmed | 30-minute entry: MACD bearish cross below zero, bearish momentum accelerating | EMA5 < EMA8 < EMA13, bearish alignment | KDJ bearish cross, short-term outlook bearish (K = 38.0, D = 44.7) | Volume surge (5.8x)
════════════════════
🟢 $CT 30-minute bearish signal
⚠️Technical analysis: 4-hour bearish confluence confirmed | 30-minute entry: MACD bearish cross below zero, bearish momentum accelerating | EMA5 crosses below EMA8, short-term outlook turns bearish | KDJ bearish cross, short-term outlook bearish (K = 37.1, D = 43.5) | Volume surge (3.1x)
════════════════════
🟢 $ASTS 30-minute bearish signal
⚠️Technical analysis: 4-hour bearish confluence confirmed | 30-minute entry: MACD bearish cross below zero, bearish momentum accelerating | EMA5 < EMA8 < EMA13, bearish alignment | KDJ bearish cross, short-term outlook bearish (K = 20.1, D = 20.5) | Volume surge (6.4x)
════════════════════
🔔 Follow to get first-hand market alerts 🔔
#多周期共振 #ORCL #CT #ASTS
📌 When trading, watch for whether the candlestick pattern confirms the signal
════════════════════
🟢 $ORCL 30-minute bearish signal
⚠️Technical analysis: 4-hour bearish confluence confirmed | 30-minute entry: MACD bearish cross below zero, bearish momentum accelerating | EMA5 < EMA8 < EMA13, bearish alignment | KDJ bearish cross, short-term outlook bearish (K = 38.0, D = 44.7) | Volume surge (5.8x)
════════════════════
🟢 $CT 30-minute bearish signal
⚠️Technical analysis: 4-hour bearish confluence confirmed | 30-minute entry: MACD bearish cross below zero, bearish momentum accelerating | EMA5 crosses below EMA8, short-term outlook turns bearish | KDJ bearish cross, short-term outlook bearish (K = 37.1, D = 43.5) | Volume surge (3.1x)
════════════════════
🟢 $ASTS 30-minute bearish signal
⚠️Technical analysis: 4-hour bearish confluence confirmed | 30-minute entry: MACD bearish cross below zero, bearish momentum accelerating | EMA5 < EMA8 < EMA13, bearish alignment | KDJ bearish cross, short-term outlook bearish (K = 20.1, D = 20.5) | Volume surge (6.4x)
════════════════════
🔔 Follow to get first-hand market alerts 🔔
#多周期共振 #ORCL #CT #ASTS
📌 When trading, watch for whether the candlestick pattern confirms the signal
10
·
--
$SNDK / $ASTS / $AKE 30-minute bearish signals, 4-hour bearish trend confirmed 🔥
════════════════════
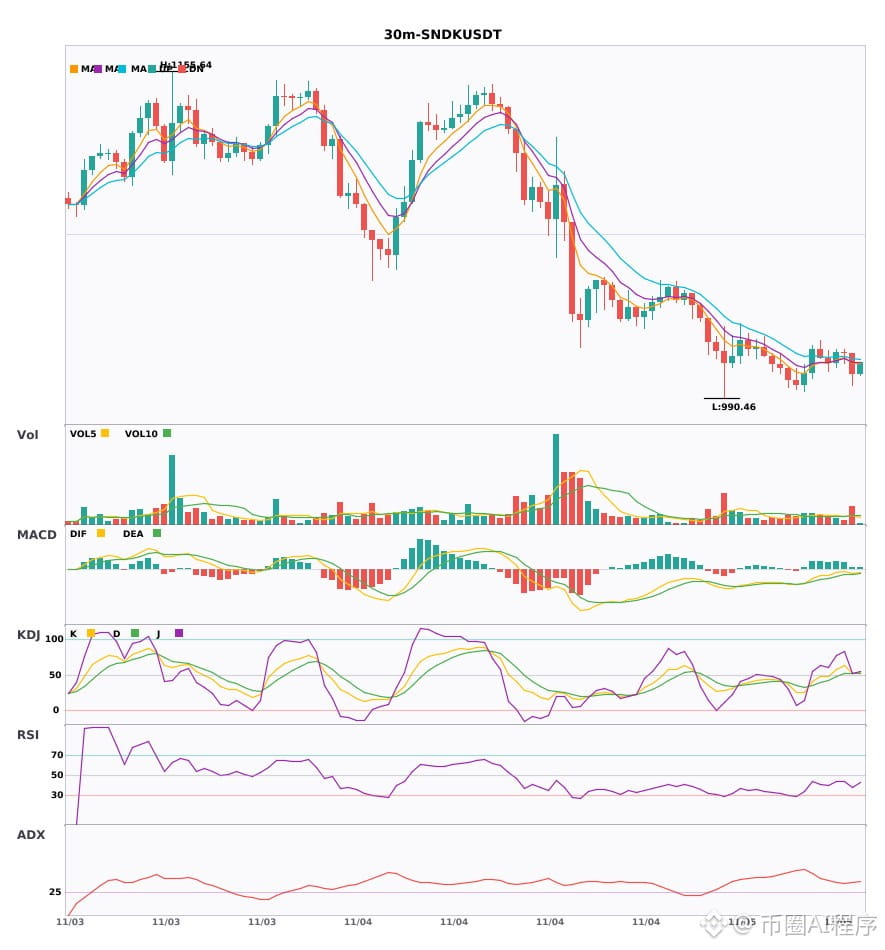
🟢 $SNDK 30-minute bearish signal
⚠️Technical analysis: 4-hour bearish confluence confirmed | 30-minute entry: EMA5 crossed below EMA8, short-term bearish | KDJ death cross, short-term bearish (K: 52.3, D: 52.3) | Increased volume (1.9x)
════════════════════
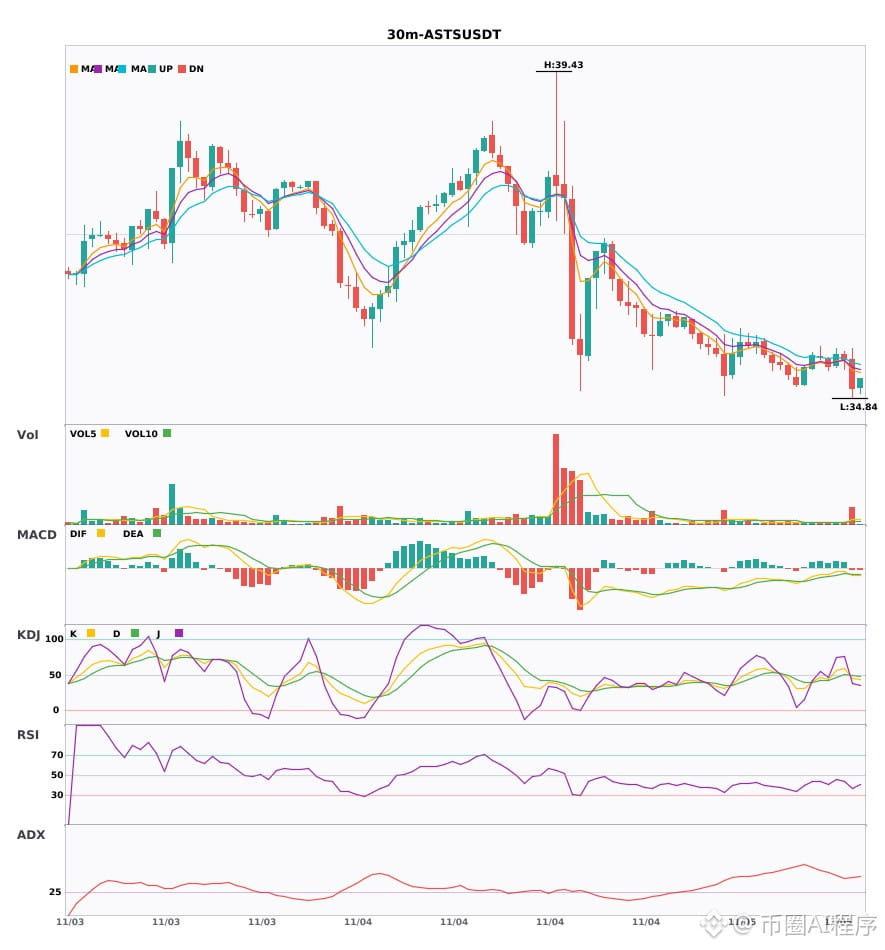
🟢 $ASTS 30-minute bearish signal
⚠️Technical analysis: 4-hour bearish confluence confirmed | 30-minute entry: MACD death cross below zero, bearish momentum accelerating | EMA5 crossed below EMA8, short-term bearish | KDJ death cross, short-term bearish (K: 45.6, D: 49.3) | Volume surge (4.4x)
════════════════════
🟢 $AKE 30-minute bearish signal
⚠️Technical analysis: 4-hour bearish confluence confirmed | 30-minute entry: MACD death cross below zero, bearish momentum accelerating | EMA5 crossed below EMA8, short-term bearish | KDJ death cross, short-term bearish (K: 41.4, D: 51.2) | Volume surge (2.8x)
════════════════════
🔔 Follow for the latest market movements 🔔
#多周期共振 #SNDK #ASTS #AKE
📌 When trading, watch whether the candlestick patterns align
$SNDK / $ASTS / $AKE 30-minute bearish signals, 4-hour bearish trend confirmed 🔥
════════════════════
🟢 $SNDK 30-minute bearish signal
⚠️Technical analysis: 4-hour bearish confluence confirmed | 30-minute entry: EMA5 crossed below EMA8, short-term bearish | KDJ death cross, short-term bearish (K: 52.3, D: 52.3) | Increased volume (1.9x)
════════════════════
🟢 $ASTS 30-minute bearish signal
⚠️Technical analysis: 4-hour bearish confluence confirmed | 30-minute entry: MACD death cross below zero, bearish momentum accelerating | EMA5 crossed below EMA8, short-term bearish | KDJ death cross, short-term bearish (K: 45.6, D: 49.3) | Volume surge (4.4x)
════════════════════
🟢 $AKE 30-minute bearish signal
⚠️Technical analysis: 4-hour bearish confluence confirmed | 30-minute entry: MACD death cross below zero, bearish momentum accelerating | EMA5 crossed below EMA8, short-term bearish | KDJ death cross, short-term bearish (K: 41.4, D: 51.2) | Volume surge (2.8x)
════════════════════
🔔 Follow for the latest market movements 🔔
#多周期共振 #SNDK #ASTS #AKE
📌 When trading, watch whether the candlestick patterns align
════════════════════
🟢 $SNDK 30-minute bearish signal
⚠️Technical analysis: 4-hour bearish confluence confirmed | 30-minute entry: EMA5 crossed below EMA8, short-term bearish | KDJ death cross, short-term bearish (K: 52.3, D: 52.3) | Increased volume (1.9x)
════════════════════
🟢 $ASTS 30-minute bearish signal
⚠️Technical analysis: 4-hour bearish confluence confirmed | 30-minute entry: MACD death cross below zero, bearish momentum accelerating | EMA5 crossed below EMA8, short-term bearish | KDJ death cross, short-term bearish (K: 45.6, D: 49.3) | Volume surge (4.4x)
════════════════════
🟢 $AKE 30-minute bearish signal
⚠️Technical analysis: 4-hour bearish confluence confirmed | 30-minute entry: MACD death cross below zero, bearish momentum accelerating | EMA5 crossed below EMA8, short-term bearish | KDJ death cross, short-term bearish (K: 41.4, D: 51.2) | Volume surge (2.8x)
════════════════════
🔔 Follow for the latest market movements 🔔
#多周期共振 #SNDK #ASTS #AKE
📌 When trading, watch whether the candlestick patterns align
9

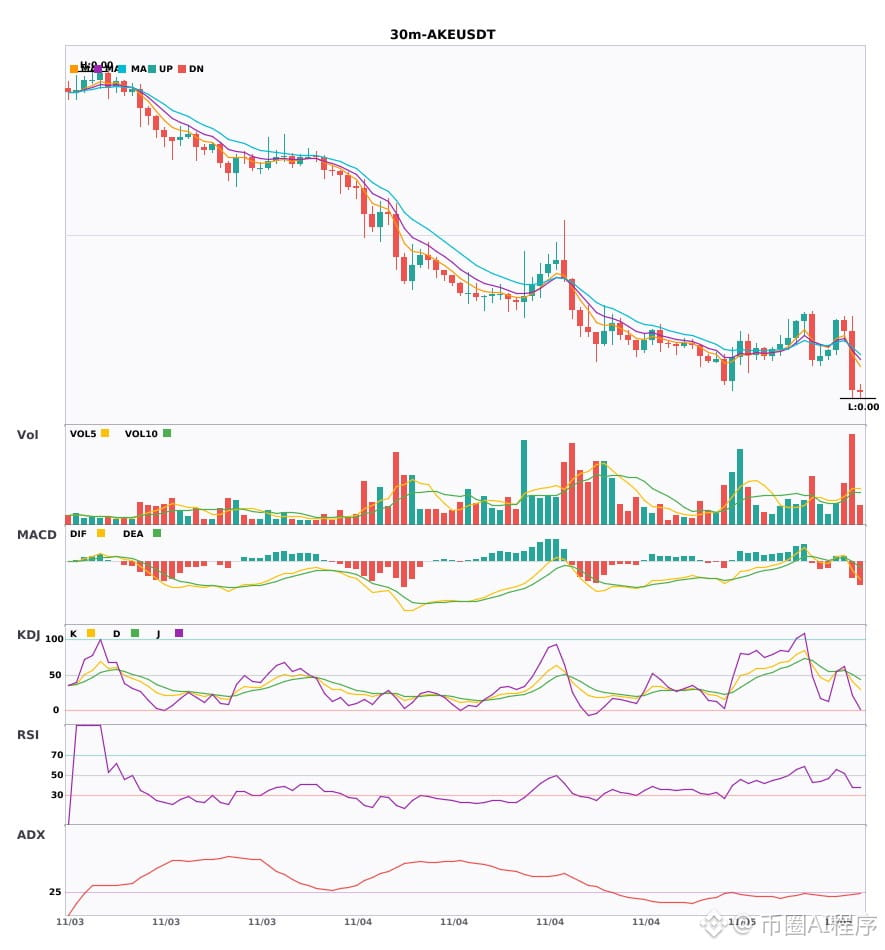
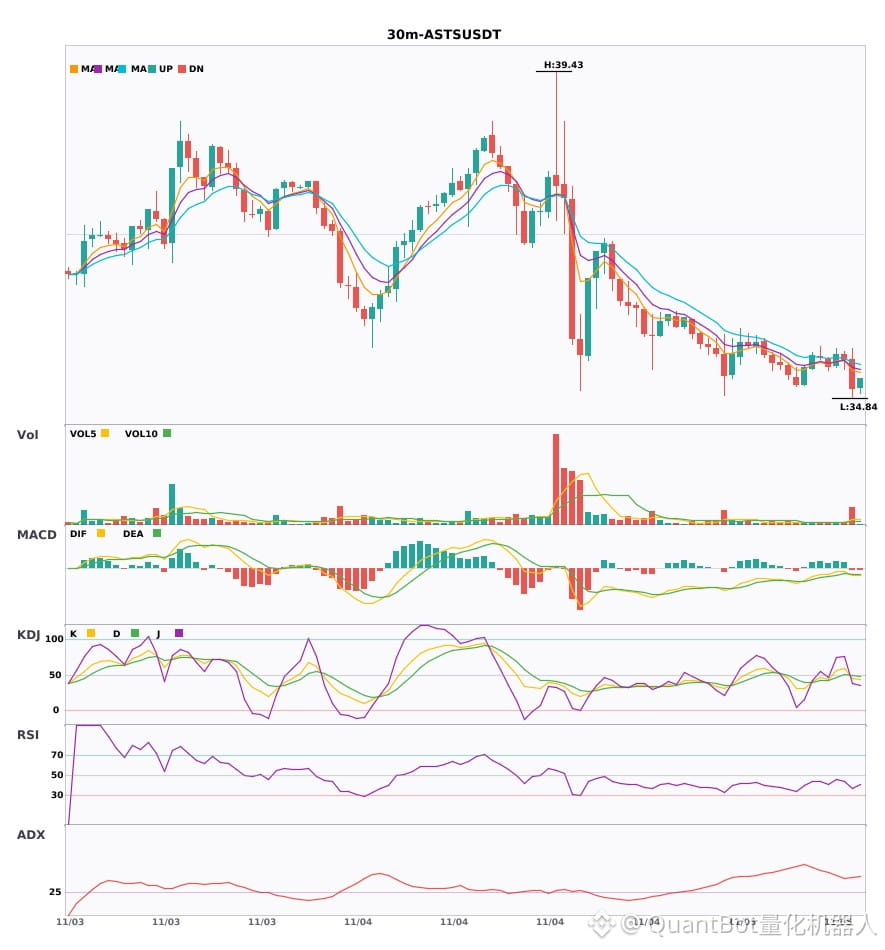
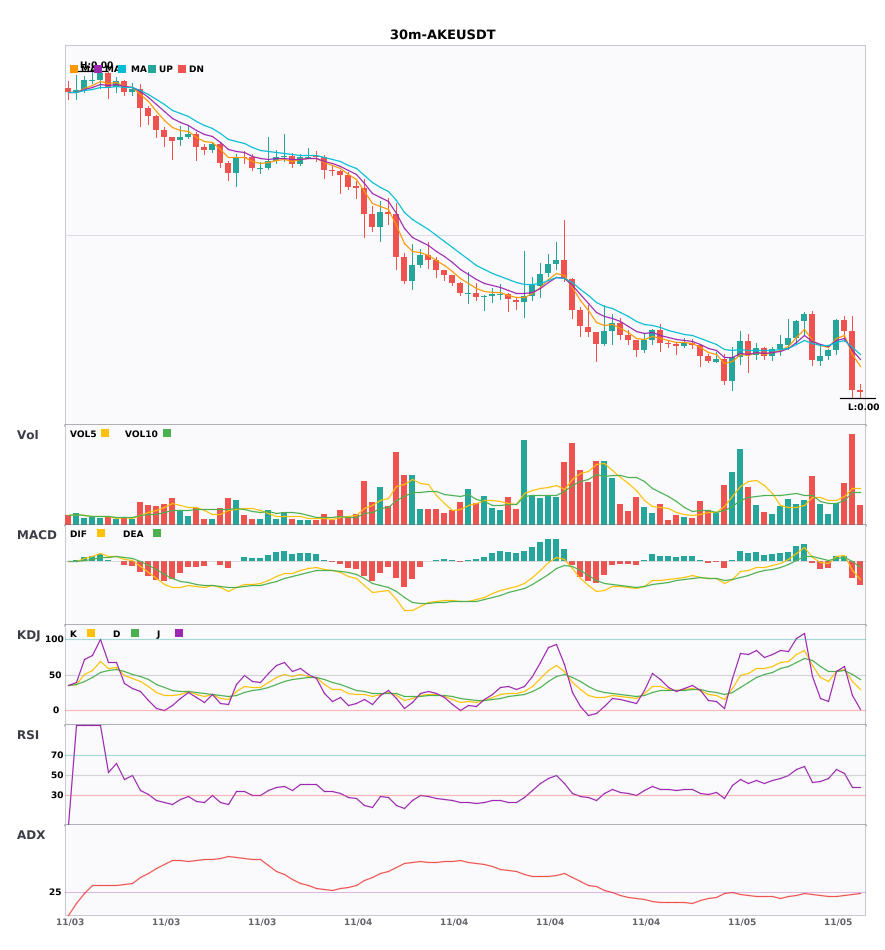
$ASTS / $AKE 30-minute timeframe bearish, short-term pressure
📉 $ASTS | 30-minute bearish signal
━━━━━━━━━━━━━━━━━━
Technical analysis: ADX(40) indicates a clear trending market | MACD bearish crossover below zero, bearish momentum accelerating | EMA5 crossed below EMA8, short-term outlook turns bearish | KDJ bearish crossover, bearish short-term outlook (K: 45.6, D: 49.3) | Volume surge (4.4x)
Price change: -1.1600%
📉 $AKE | 30-minute bearish signal
━━━━━━━━━━━━━━━━━━
Technical analysis: ADX(26) trend is forming, potential entry | MACD bearish crossover below zero, bearish momentum accelerating | EMA5 crossed below EMA8, short-term outlook turns bearish | KDJ bearish crossover, bearish short-term outlook (K: 41.4, D: 51.2) | Volume surge (2.8x)
Price change: -17.2100%
━━━━━━━━━━━━━━━━━━
#技术分析 #ASTS #AKE
📌 The above is for reference only and does not constitute investment advice
$ASTS / $AKE 30-minute timeframe bearish, short-term pressure
📉 $ASTS | 30-minute bearish signal
━━━━━━━━━━━━━━━━━━
Technical analysis: ADX(40) indicates a clear trending market | MACD bearish crossover below zero, bearish momentum accelerating | EMA5 crossed below EMA8, short-term outlook turns bearish | KDJ bearish crossover, bearish short-term outlook (K: 45.6, D: 49.3) | Volume surge (4.4x)
Price change: -1.1600%
📉 $AKE | 30-minute bearish signal
━━━━━━━━━━━━━━━━━━
Technical analysis: ADX(26) trend is forming, potential entry | MACD bearish crossover below zero, bearish momentum accelerating | EMA5 crossed below EMA8, short-term outlook turns bearish | KDJ bearish crossover, bearish short-term outlook (K: 41.4, D: 51.2) | Volume surge (2.8x)
Price change: -17.2100%
━━━━━━━━━━━━━━━━━━
#技术分析 #ASTS #AKE
📌 The above is for reference only and does not constitute investment advice
📉 $ASTS | 30-minute bearish signal
━━━━━━━━━━━━━━━━━━
Technical analysis: ADX(40) indicates a clear trending market | MACD bearish crossover below zero, bearish momentum accelerating | EMA5 crossed below EMA8, short-term outlook turns bearish | KDJ bearish crossover, bearish short-term outlook (K: 45.6, D: 49.3) | Volume surge (4.4x)
Price change: -1.1600%
📉 $AKE | 30-minute bearish signal
━━━━━━━━━━━━━━━━━━
Technical analysis: ADX(26) trend is forming, potential entry | MACD bearish crossover below zero, bearish momentum accelerating | EMA5 crossed below EMA8, short-term outlook turns bearish | KDJ bearish crossover, bearish short-term outlook (K: 41.4, D: 51.2) | Volume surge (2.8x)
Price change: -17.2100%
━━━━━━━━━━━━━━━━━━
#技术分析 #ASTS #AKE
📌 The above is for reference only and does not constitute investment advice
·
--
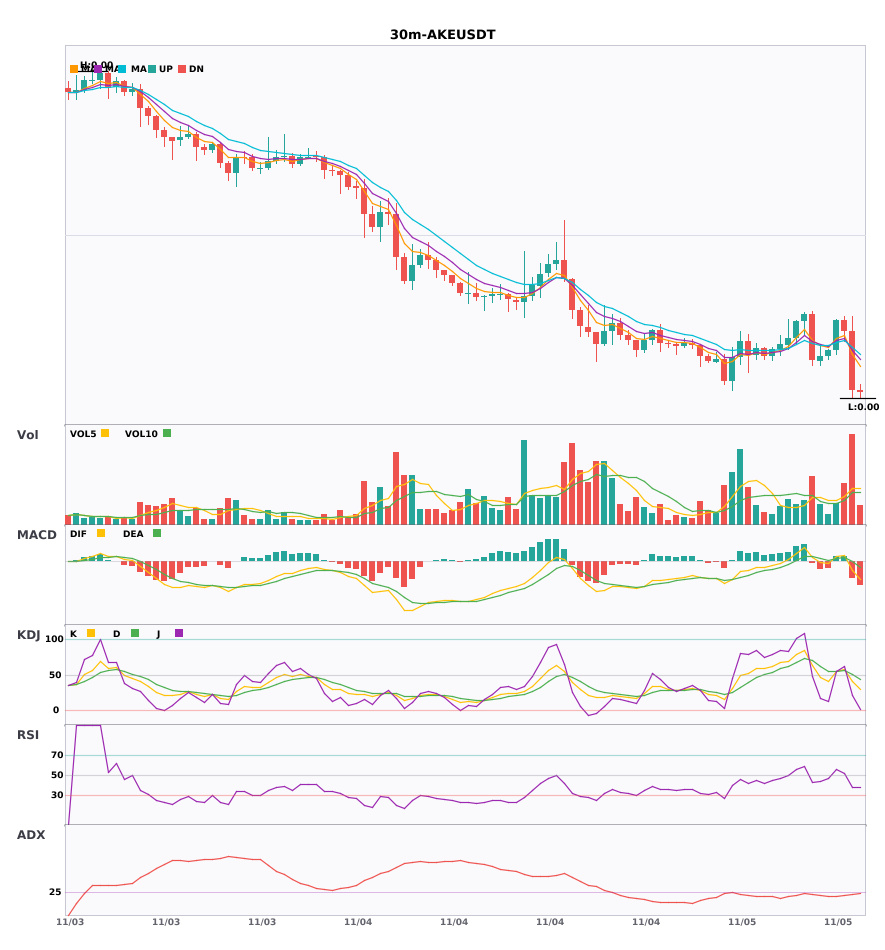
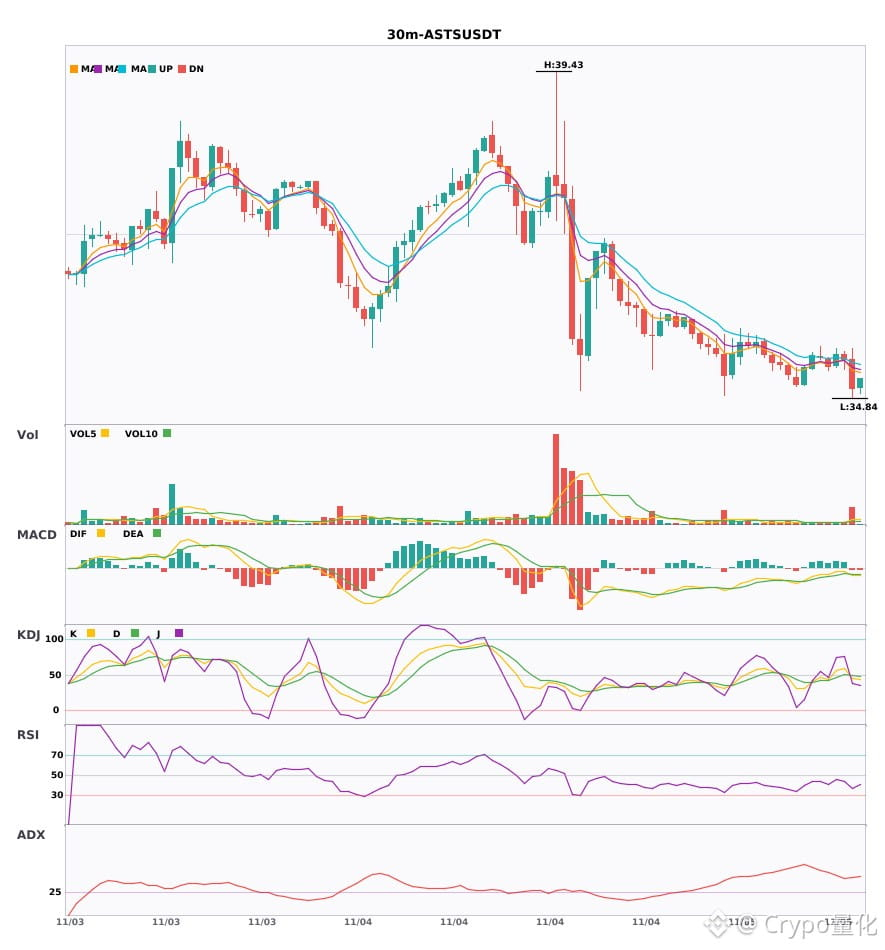
$ASTS / $AKE 30-minute bearish convergence, bearish signals appearing simultaneously 🔥
════════════════════
🟢 $ASTS 30-minute bearish signal
⚠️Technical analysis: ADX(40) indicates a clear trending market | MACD bearish crossover below zero, bearish momentum accelerating | EMA5 crossed below EMA8, short-term outlook turning bearish | KDJ bearish crossover, short-term outlook bearish (K: 45.6, D: 49.3) | Volume surge (4.4x)
════════════════════
🟢 $AKE 30-minute bearish signal
⚠️Technical analysis: ADX(26) indicates a trend is forming; an opportunity to participate | MACD bearish crossover below zero, bearish momentum accelerating | EMA5 crossed below EMA8, short-term outlook turning bearish | KDJ bearish crossover, short-term outlook bearish (K: 41.4, D: 51.2) | Volume surge (2.8x)
════════════════════
🔔 Follow for real-time market alerts 🔔
#技术分析 #ASTS #AKE
📌 When trading, watch for whether the candlestick patterns align
$ASTS / $AKE 30-minute bearish convergence, bearish signals appearing simultaneously 🔥
════════════════════
🟢 $ASTS 30-minute bearish signal
⚠️Technical analysis: ADX(40) indicates a clear trending market | MACD bearish crossover below zero, bearish momentum accelerating | EMA5 crossed below EMA8, short-term outlook turning bearish | KDJ bearish crossover, short-term outlook bearish (K: 45.6, D: 49.3) | Volume surge (4.4x)
════════════════════
🟢 $AKE 30-minute bearish signal
⚠️Technical analysis: ADX(26) indicates a trend is forming; an opportunity to participate | MACD bearish crossover below zero, bearish momentum accelerating | EMA5 crossed below EMA8, short-term outlook turning bearish | KDJ bearish crossover, short-term outlook bearish (K: 41.4, D: 51.2) | Volume surge (2.8x)
════════════════════
🔔 Follow for real-time market alerts 🔔
#技术分析 #ASTS #AKE
📌 When trading, watch for whether the candlestick patterns align
════════════════════
🟢 $ASTS 30-minute bearish signal
⚠️Technical analysis: ADX(40) indicates a clear trending market | MACD bearish crossover below zero, bearish momentum accelerating | EMA5 crossed below EMA8, short-term outlook turning bearish | KDJ bearish crossover, short-term outlook bearish (K: 45.6, D: 49.3) | Volume surge (4.4x)
════════════════════
🟢 $AKE 30-minute bearish signal
⚠️Technical analysis: ADX(26) indicates a trend is forming; an opportunity to participate | MACD bearish crossover below zero, bearish momentum accelerating | EMA5 crossed below EMA8, short-term outlook turning bearish | KDJ bearish crossover, short-term outlook bearish (K: 41.4, D: 51.2) | Volume surge (2.8x)
════════════════════
🔔 Follow for real-time market alerts 🔔
#技术分析 #ASTS #AKE
📌 When trading, watch for whether the candlestick patterns align
6
·
--
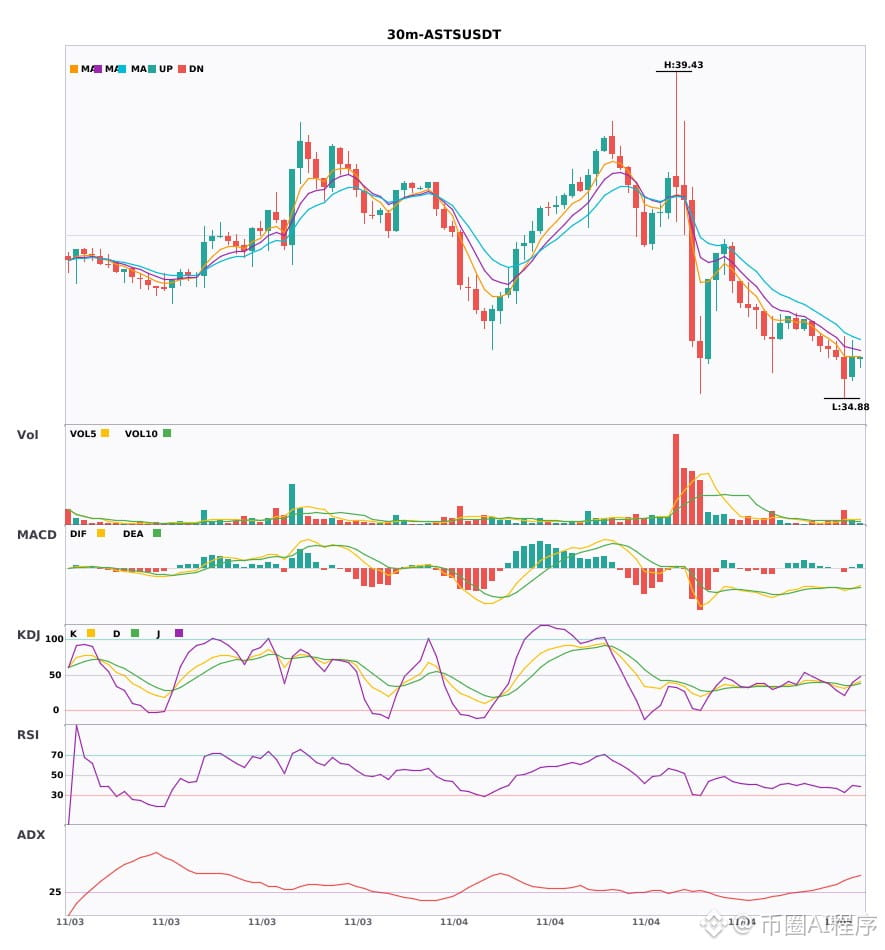
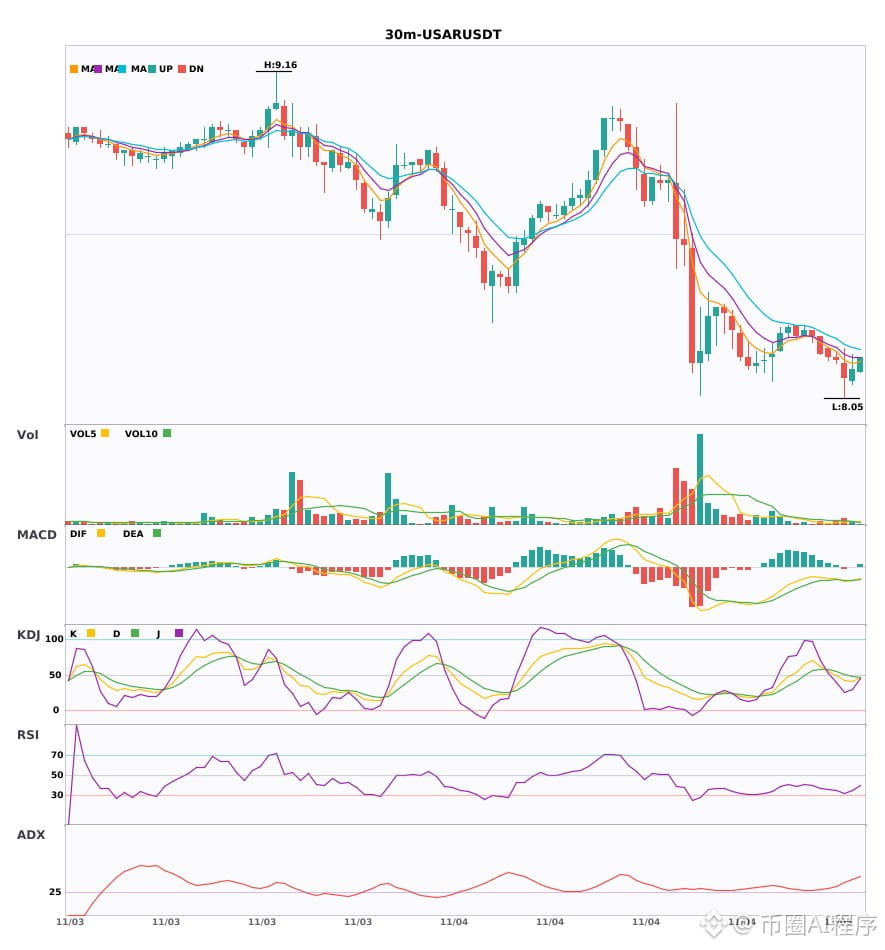
Multi-timeframe confluence: 2 coins with 30-minute bearish signals + 4-hour bearish trend confirmation🔥
════════════════════
🟢 $ASTS 30-minute bearish signal
⚠️Technical analysis: 4-hour bearish confluence confirmed | 30-minute entry: MACD bearish cross below zero, bearish momentum accelerating | EMA5 < EMA8 < EMA13, bearish alignment | KDJ showing weakness, bears in control (K: 30.6, D: 35.2) | Volume surge (3.1x)
════════════════════
🟢 $USAR 30-minute bearish signal
⚠️Technical analysis: 4-hour bearish confluence confirmed | 30-minute entry: MACD bearish cross below zero, bearish momentum accelerating | EMA5 < EMA8 < EMA13, bearish alignment | Normal volume (1.5x)
════════════════════
🔔 Follow for first-hand market alerts 🔔
#多周期共振 #ASTS #USAR
📌 When trading, pay attention to whether the candlestick pattern confirms the setup
Multi-timeframe confluence: 2 coins with 30-minute bearish signals + 4-hour bearish trend confirmation🔥
════════════════════
🟢 $ASTS 30-minute bearish signal
⚠️Technical analysis: 4-hour bearish confluence confirmed | 30-minute entry: MACD bearish cross below zero, bearish momentum accelerating | EMA5 < EMA8 < EMA13, bearish alignment | KDJ showing weakness, bears in control (K: 30.6, D: 35.2) | Volume surge (3.1x)
════════════════════
🟢 $USAR 30-minute bearish signal
⚠️Technical analysis: 4-hour bearish confluence confirmed | 30-minute entry: MACD bearish cross below zero, bearish momentum accelerating | EMA5 < EMA8 < EMA13, bearish alignment | Normal volume (1.5x)
════════════════════
🔔 Follow for first-hand market alerts 🔔
#多周期共振 #ASTS #USAR
📌 When trading, pay attention to whether the candlestick pattern confirms the setup
════════════════════
🟢 $ASTS 30-minute bearish signal
⚠️Technical analysis: 4-hour bearish confluence confirmed | 30-minute entry: MACD bearish cross below zero, bearish momentum accelerating | EMA5 < EMA8 < EMA13, bearish alignment | KDJ showing weakness, bears in control (K: 30.6, D: 35.2) | Volume surge (3.1x)
════════════════════
🟢 $USAR 30-minute bearish signal
⚠️Technical analysis: 4-hour bearish confluence confirmed | 30-minute entry: MACD bearish cross below zero, bearish momentum accelerating | EMA5 < EMA8 < EMA13, bearish alignment | Normal volume (1.5x)
════════════════════
🔔 Follow for first-hand market alerts 🔔
#多周期共振 #ASTS #USAR
📌 When trading, pay attention to whether the candlestick pattern confirms the setup
·
--
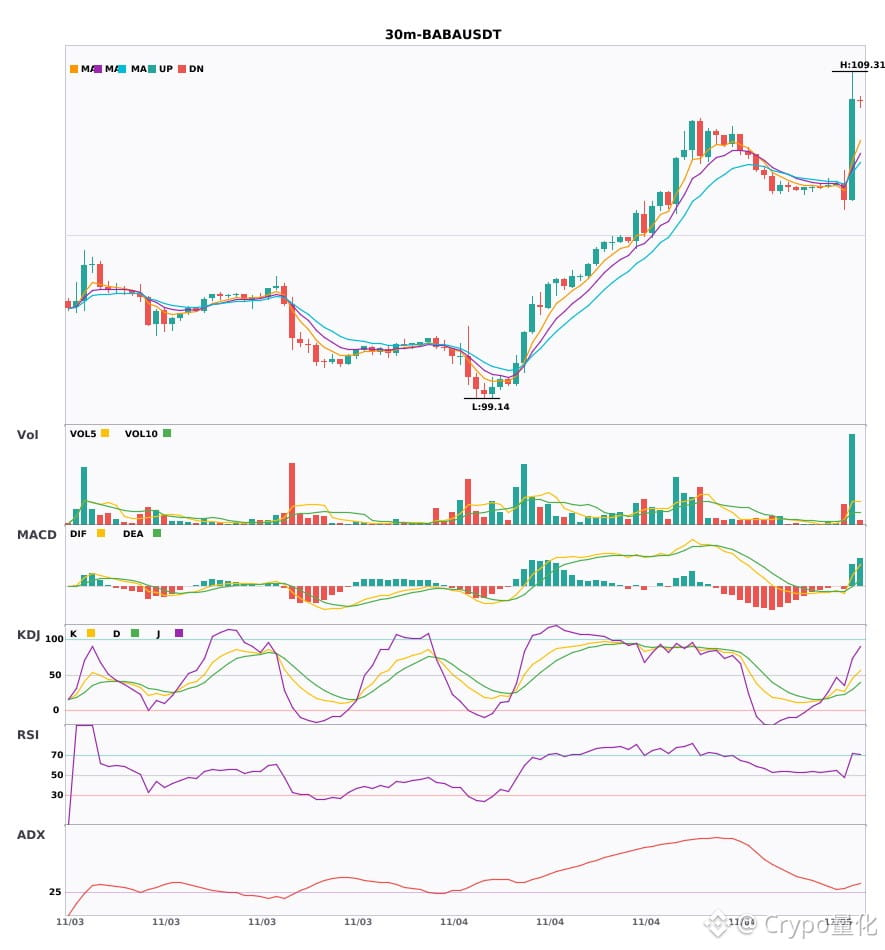
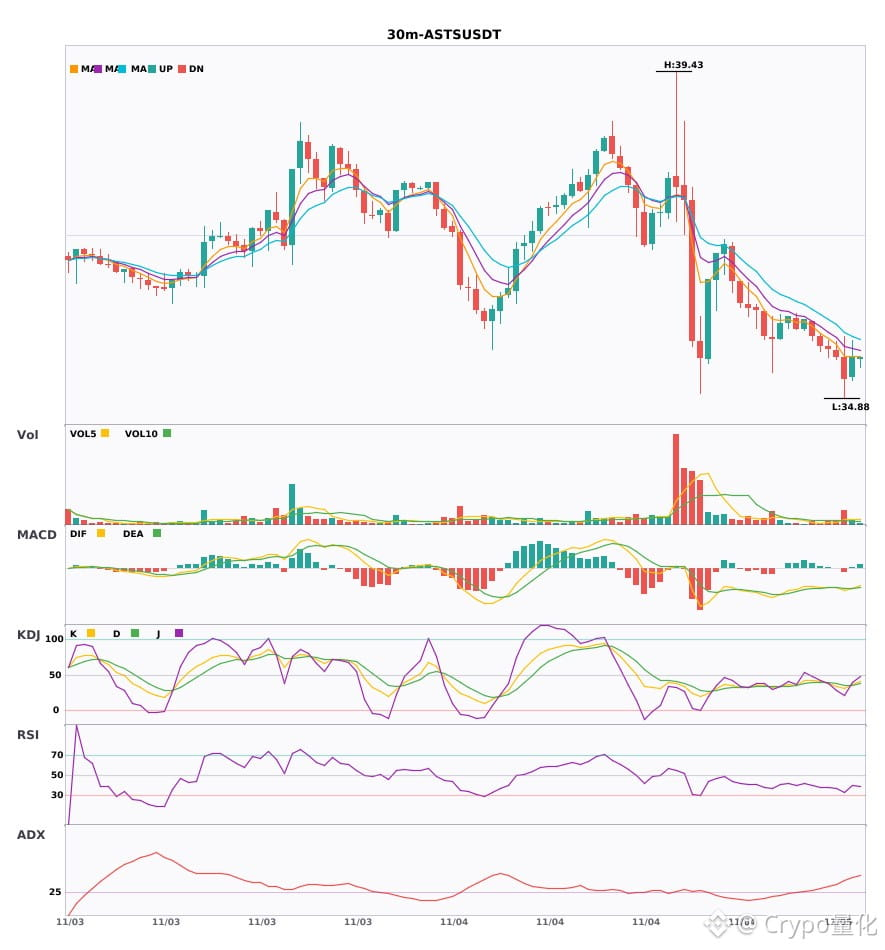
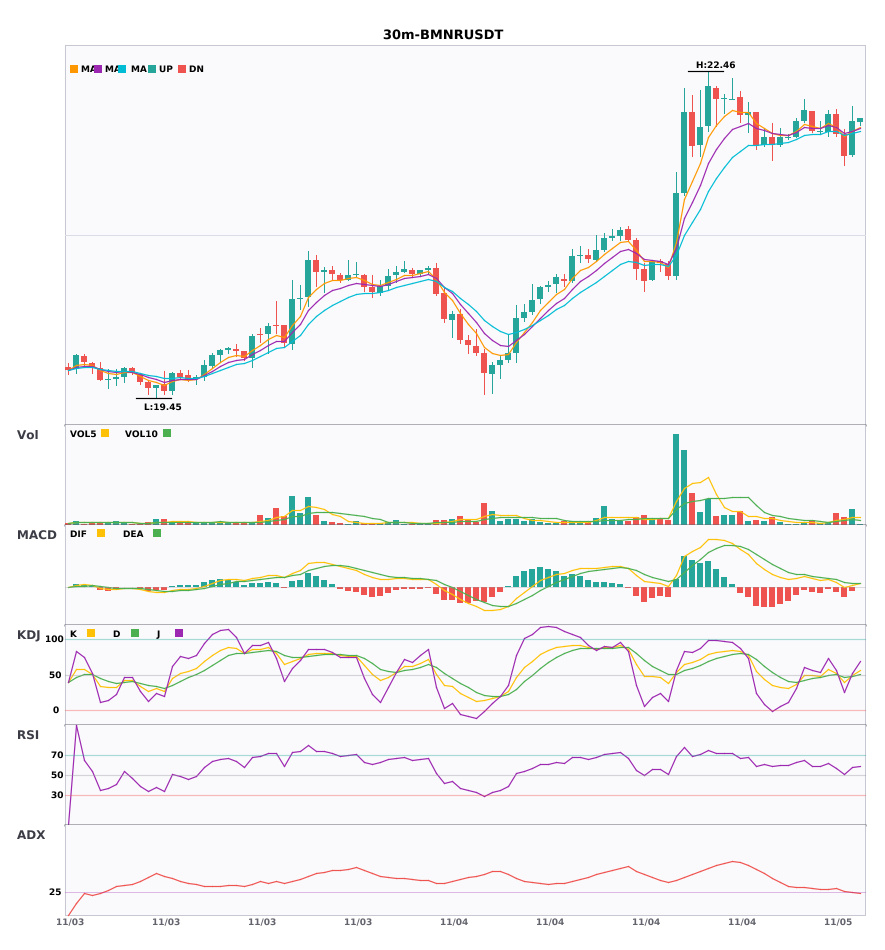
$BABA / $ASTS / $BMNR 30-minute technical indicators are weakening across the board; beware of risk🔥
════════════════════
🟢 $BABA 30-minute bearish signal
⚠️Technical analysis: ADX(31): clear trending market | MACD bearish crossover below zero, bearish momentum accelerating | EMA5 < EMA8 < EMA13, bearish alignment | KDJ moving weakly, bears in control (K: 27.3, D: 23.3) | Volume surge (4.6x)
════════════════════
🟢 $ASTS 30-minute bearish signal
⚠️Technical analysis: ADX(43): clear trending market | MACD bearish crossover below zero, bearish momentum accelerating | EMA5 < EMA8 < EMA13, bearish alignment | KDJ moving weakly, bears in control (K: 30.6, D: 35.2) | Volume surge (3.1x)
════════════════════
🟢 $BMNR 30-minute bearish signal
⚠️Technical analysis: ADX(25): trend is forming; opportunity to participate | MACD DIF has fallen below zero, trend turning bearish | EMA5 has crossed below EMA8, short-term outlook turning bearish | KDJ bearish crossover, short-term bearish outlook (K: 39.9, D: 47.1) | Volume surge (3.2x)
════════════════════
🔔 Follow for first-hand market alerts 🔔
#技术分析 #BABA #ASTS #BMNR
📌 When trading, check whether the candlestick pattern meets the criteria
$BABA / $ASTS / $BMNR 30-minute technical indicators are weakening across the board; beware of risk🔥
════════════════════
🟢 $BABA 30-minute bearish signal
⚠️Technical analysis: ADX(31): clear trending market | MACD bearish crossover below zero, bearish momentum accelerating | EMA5 < EMA8 < EMA13, bearish alignment | KDJ moving weakly, bears in control (K: 27.3, D: 23.3) | Volume surge (4.6x)
════════════════════
🟢 $ASTS 30-minute bearish signal
⚠️Technical analysis: ADX(43): clear trending market | MACD bearish crossover below zero, bearish momentum accelerating | EMA5 < EMA8 < EMA13, bearish alignment | KDJ moving weakly, bears in control (K: 30.6, D: 35.2) | Volume surge (3.1x)
════════════════════
🟢 $BMNR 30-minute bearish signal
⚠️Technical analysis: ADX(25): trend is forming; opportunity to participate | MACD DIF has fallen below zero, trend turning bearish | EMA5 has crossed below EMA8, short-term outlook turning bearish | KDJ bearish crossover, short-term bearish outlook (K: 39.9, D: 47.1) | Volume surge (3.2x)
════════════════════
🔔 Follow for first-hand market alerts 🔔
#技术分析 #BABA #ASTS #BMNR
📌 When trading, check whether the candlestick pattern meets the criteria
════════════════════
🟢 $BABA 30-minute bearish signal
⚠️Technical analysis: ADX(31): clear trending market | MACD bearish crossover below zero, bearish momentum accelerating | EMA5 < EMA8 < EMA13, bearish alignment | KDJ moving weakly, bears in control (K: 27.3, D: 23.3) | Volume surge (4.6x)
════════════════════
🟢 $ASTS 30-minute bearish signal
⚠️Technical analysis: ADX(43): clear trending market | MACD bearish crossover below zero, bearish momentum accelerating | EMA5 < EMA8 < EMA13, bearish alignment | KDJ moving weakly, bears in control (K: 30.6, D: 35.2) | Volume surge (3.1x)
════════════════════
🟢 $BMNR 30-minute bearish signal
⚠️Technical analysis: ADX(25): trend is forming; opportunity to participate | MACD DIF has fallen below zero, trend turning bearish | EMA5 has crossed below EMA8, short-term outlook turning bearish | KDJ bearish crossover, short-term bearish outlook (K: 39.9, D: 47.1) | Volume surge (3.2x)
════════════════════
🔔 Follow for first-hand market alerts 🔔
#技术分析 #BABA #ASTS #BMNR
📌 When trading, check whether the candlestick pattern meets the criteria
9
·
--
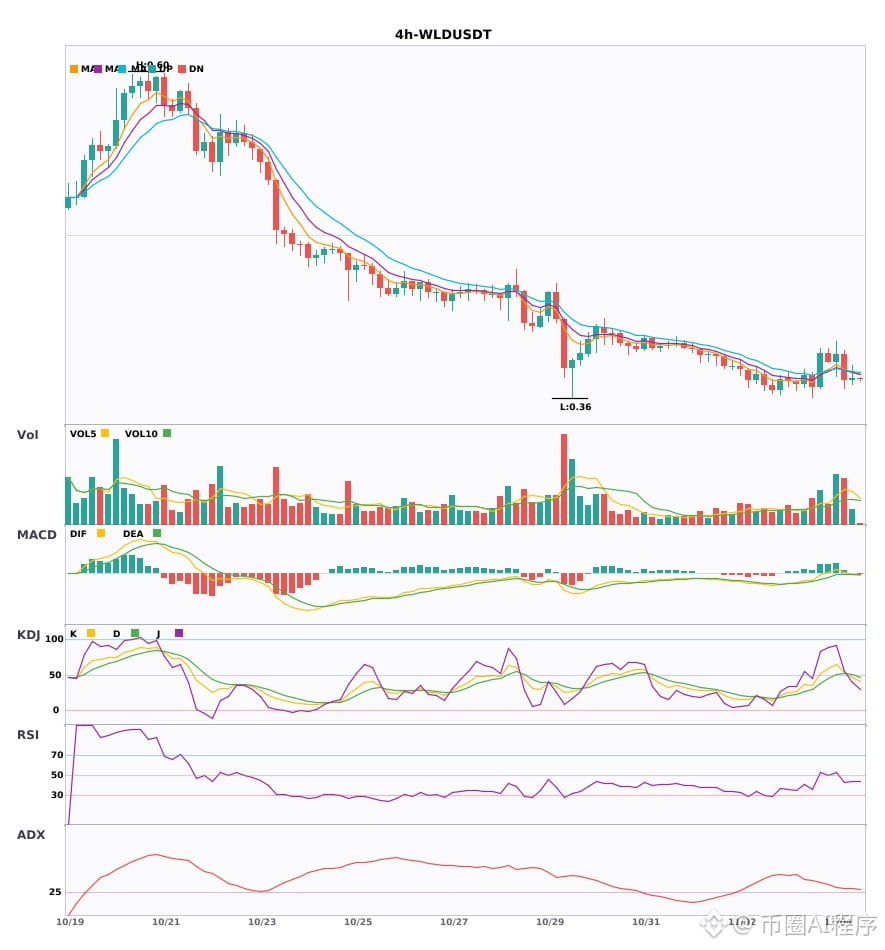
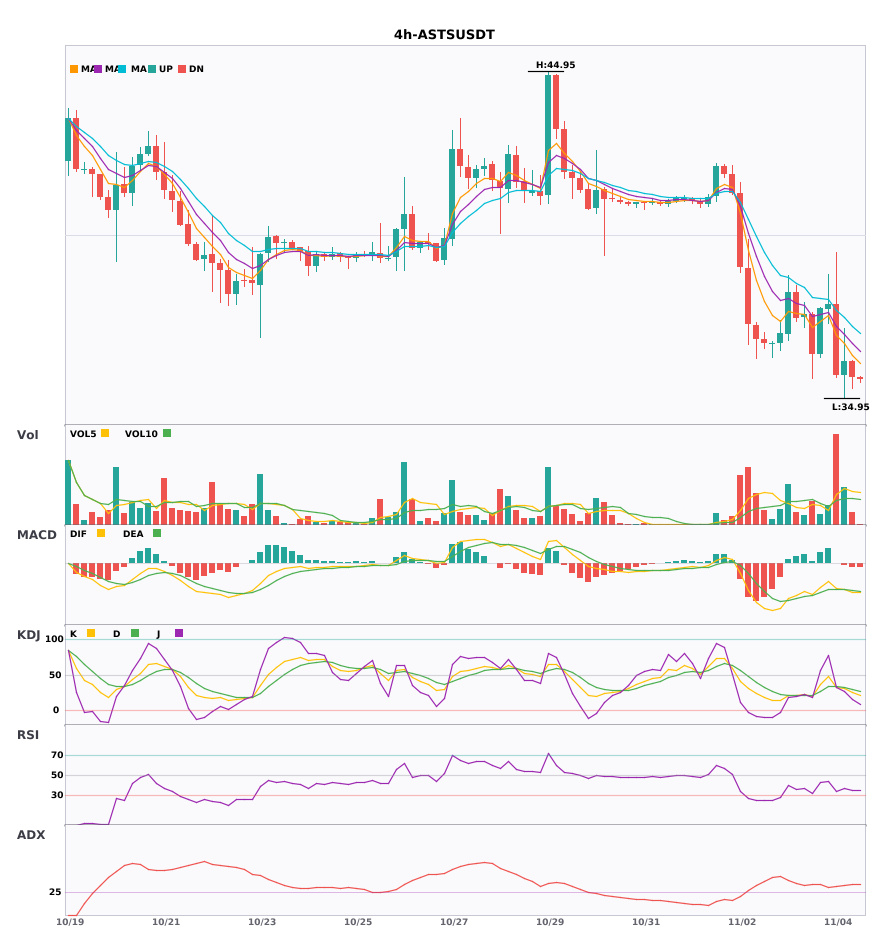
$WLD / $ASTS 4-hour bearish signal, daily bearish trend confirmed 🔥
════════════════════
🟢 $WLD 4-hour bearish signal
⚠️ Technical analysis: Daily bearish confluence confirmed | 4-hour entry: MACD bearish crossover below zero, bearish momentum accelerating | EMA5 crossed below EMA8, short-term outlook turns bearish | KDJ bearish crossover, short-term bearish outlook (K: 46.4, D: 50.1) | Volume increased (1.8x)
════════════════════
🟢 $ASTS 4-hour bearish signal
⚠️ Technical analysis: Daily bearish confluence confirmed | 4-hour entry: MACD bearish crossover below zero, bearish momentum accelerating | EMA5 < EMA8 < EMA13, bearish alignment | KDJ trending weakly, bears in control (K: 30.6, D: 32.5) | Volume surged (3.8x)
════════════════════
🔔 Follow for real-time market updates 🔔
#多周期共振 #WLD #ASTS
📌 When trading, pay attention to whether the candlestick pattern meets expectations
$WLD / $ASTS 4-hour bearish signal, daily bearish trend confirmed 🔥
════════════════════
🟢 $WLD 4-hour bearish signal
⚠️ Technical analysis: Daily bearish confluence confirmed | 4-hour entry: MACD bearish crossover below zero, bearish momentum accelerating | EMA5 crossed below EMA8, short-term outlook turns bearish | KDJ bearish crossover, short-term bearish outlook (K: 46.4, D: 50.1) | Volume increased (1.8x)
════════════════════
🟢 $ASTS 4-hour bearish signal
⚠️ Technical analysis: Daily bearish confluence confirmed | 4-hour entry: MACD bearish crossover below zero, bearish momentum accelerating | EMA5 < EMA8 < EMA13, bearish alignment | KDJ trending weakly, bears in control (K: 30.6, D: 32.5) | Volume surged (3.8x)
════════════════════
🔔 Follow for real-time market updates 🔔
#多周期共振 #WLD #ASTS
📌 When trading, pay attention to whether the candlestick pattern meets expectations
════════════════════
🟢 $WLD 4-hour bearish signal
⚠️ Technical analysis: Daily bearish confluence confirmed | 4-hour entry: MACD bearish crossover below zero, bearish momentum accelerating | EMA5 crossed below EMA8, short-term outlook turns bearish | KDJ bearish crossover, short-term bearish outlook (K: 46.4, D: 50.1) | Volume increased (1.8x)
════════════════════
🟢 $ASTS 4-hour bearish signal
⚠️ Technical analysis: Daily bearish confluence confirmed | 4-hour entry: MACD bearish crossover below zero, bearish momentum accelerating | EMA5 < EMA8 < EMA13, bearish alignment | KDJ trending weakly, bears in control (K: 30.6, D: 32.5) | Volume surged (3.8x)
════════════════════
🔔 Follow for real-time market updates 🔔
#多周期共振 #WLD #ASTS
📌 When trading, pay attention to whether the candlestick pattern meets expectations
54
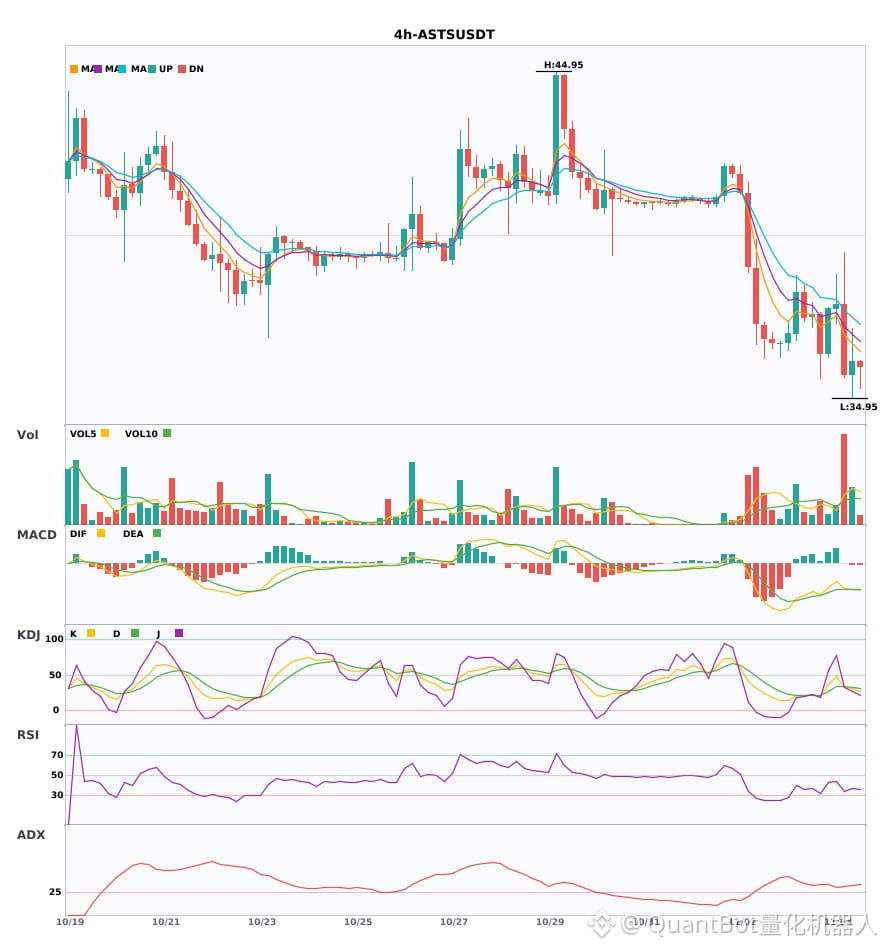
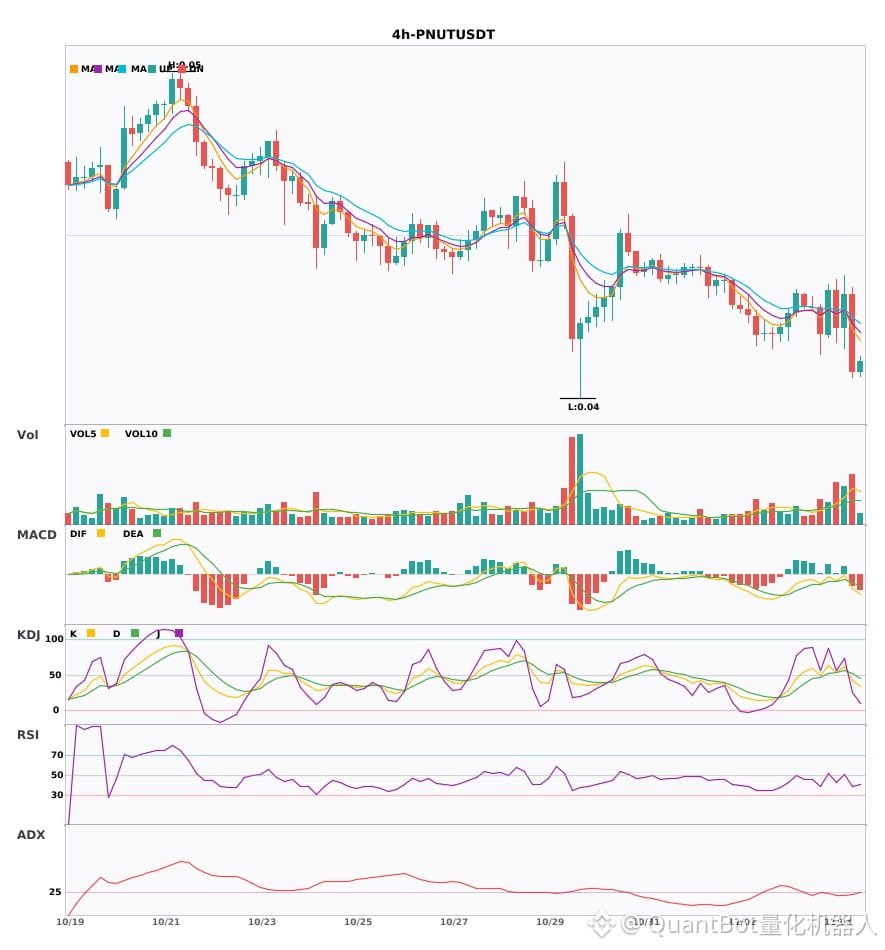
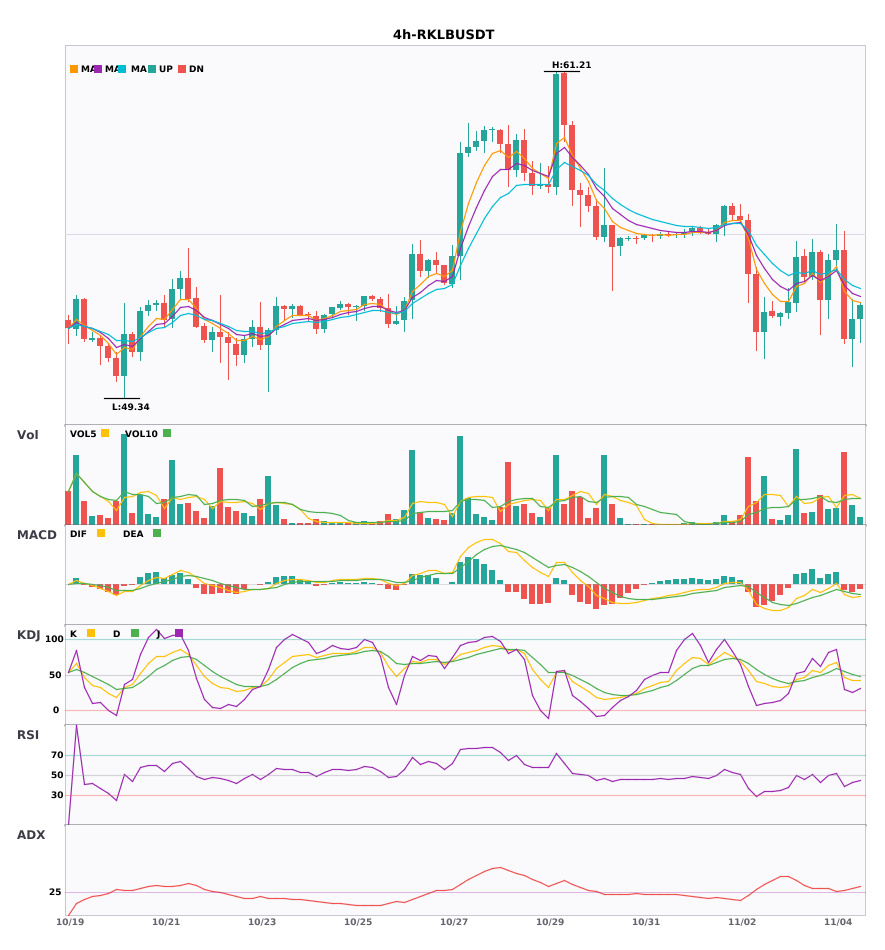
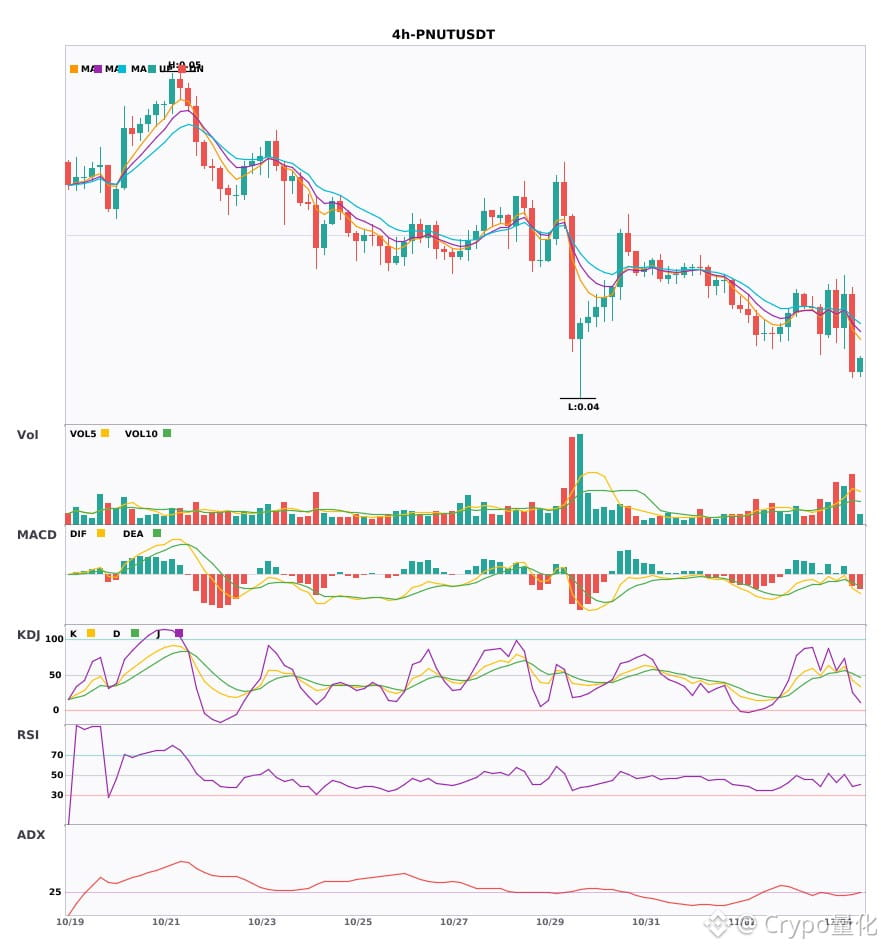
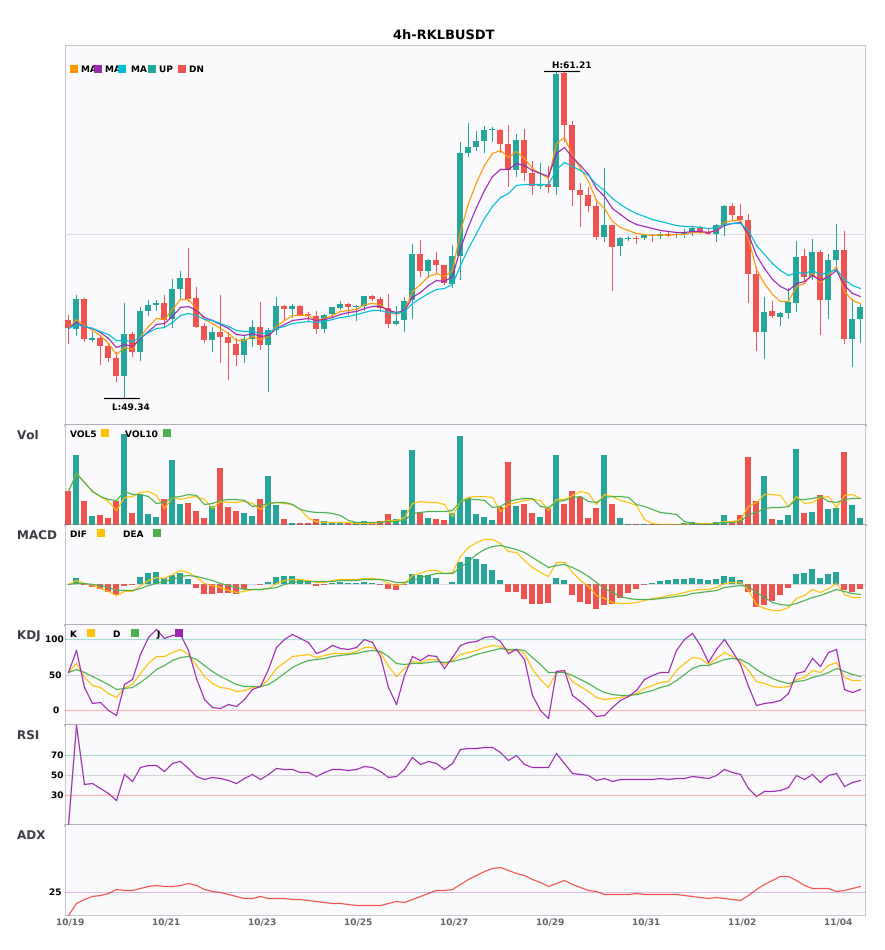
3 4-hour bearish alerts: $ASTS / $PNUT / $RKLB
📉 $ASTS | 4-hour bearish signal
━━━━━━━━━━━━━━━━━━
Technical analysis: ADX(32) clear trending market | MACD bearish crossover below zero, bearish momentum accelerating | EMA5 < EMA8 < EMA13, bearish alignment | KDJ in weak territory, bears in control (K: 30.6, D: 32.5) | Volume surge (3.8x)
Price change: 1.2100%
📉 $PNUT | 4-hour bearish signal
━━━━━━━━━━━━━━━━━━
Technical analysis: ADX(25) trend forming, opportunity to participate | MACD bearish crossover below zero, bearish momentum accelerating | EMA5 crossed below EMA8, short-term outlook turns bearish | KDJ bearish crossover, short-term bearish outlook (K: 42.7, D: 51.5) | Volume increase (2.1x)
Price change: -6.2100%
📉 $RKLB | 4-hour bearish signal
━━━━━━━━━━━━━━━━━━
Technical analysis: ADX(28) trend forming, opportunity to participate | MACD bearish crossover below zero, bearish momentum accelerating | EMA5 crossed below EMA8, short-term outlook turns bearish | KDJ bearish crossover, short-term bearish outlook (K: 46.1, D: 54.3) | Volume surge (2.9x)
Price change: -5.9400%
━━━━━━━━━━━━━━━━━━
#技术分析 #ASTS #PNUT #RKLB
📌 The above content is for reference only and does not constitute investment advice
3 4-hour bearish alerts: $ASTS / $PNUT / $RKLB
📉 $ASTS | 4-hour bearish signal
━━━━━━━━━━━━━━━━━━
Technical analysis: ADX(32) clear trending market | MACD bearish crossover below zero, bearish momentum accelerating | EMA5 < EMA8 < EMA13, bearish alignment | KDJ in weak territory, bears in control (K: 30.6, D: 32.5) | Volume surge (3.8x)
Price change: 1.2100%
📉 $PNUT | 4-hour bearish signal
━━━━━━━━━━━━━━━━━━
Technical analysis: ADX(25) trend forming, opportunity to participate | MACD bearish crossover below zero, bearish momentum accelerating | EMA5 crossed below EMA8, short-term outlook turns bearish | KDJ bearish crossover, short-term bearish outlook (K: 42.7, D: 51.5) | Volume increase (2.1x)
Price change: -6.2100%
📉 $RKLB | 4-hour bearish signal
━━━━━━━━━━━━━━━━━━
Technical analysis: ADX(28) trend forming, opportunity to participate | MACD bearish crossover below zero, bearish momentum accelerating | EMA5 crossed below EMA8, short-term outlook turns bearish | KDJ bearish crossover, short-term bearish outlook (K: 46.1, D: 54.3) | Volume surge (2.9x)
Price change: -5.9400%
━━━━━━━━━━━━━━━━━━
#技术分析 #ASTS #PNUT #RKLB
📌 The above content is for reference only and does not constitute investment advice
📉 $ASTS | 4-hour bearish signal
━━━━━━━━━━━━━━━━━━
Technical analysis: ADX(32) clear trending market | MACD bearish crossover below zero, bearish momentum accelerating | EMA5 < EMA8 < EMA13, bearish alignment | KDJ in weak territory, bears in control (K: 30.6, D: 32.5) | Volume surge (3.8x)
Price change: 1.2100%
📉 $PNUT | 4-hour bearish signal
━━━━━━━━━━━━━━━━━━
Technical analysis: ADX(25) trend forming, opportunity to participate | MACD bearish crossover below zero, bearish momentum accelerating | EMA5 crossed below EMA8, short-term outlook turns bearish | KDJ bearish crossover, short-term bearish outlook (K: 42.7, D: 51.5) | Volume increase (2.1x)
Price change: -6.2100%
📉 $RKLB | 4-hour bearish signal
━━━━━━━━━━━━━━━━━━
Technical analysis: ADX(28) trend forming, opportunity to participate | MACD bearish crossover below zero, bearish momentum accelerating | EMA5 crossed below EMA8, short-term outlook turns bearish | KDJ bearish crossover, short-term bearish outlook (K: 46.1, D: 54.3) | Volume surge (2.9x)
Price change: -5.9400%
━━━━━━━━━━━━━━━━━━
#技术分析 #ASTS #PNUT #RKLB
📌 The above content is for reference only and does not constitute investment advice
11
·
--
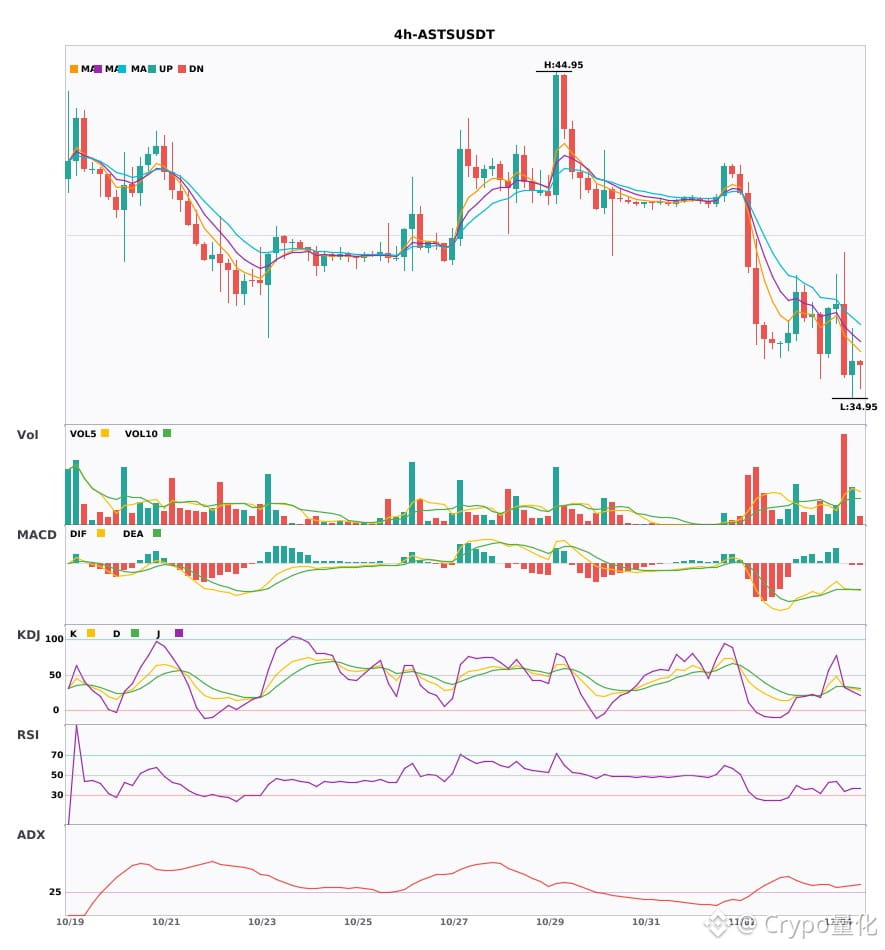
$ASTS / $PNUT / $RKLB 4-hour technical indicators are weakening in sync; watch out for risk 🔥
════════════════════
🟢 $ASTS 4-hour bearish signal
⚠️Technical analysis: ADX(32) Strong trending market | MACD bearish cross below zero, bearish momentum accelerating | EMA5 < EMA8 < EMA13, bearish alignment | KDJ trending weakly, bears in control (K=30.6, D=32.5) | Volume surge (3.8x)
════════════════════
🟢 $PNUT 4-hour bearish signal
⚠️Technical analysis: ADX(25) Trend forming, potential entry | MACD bearish cross below zero, bearish momentum accelerating | EMA5 crossed below EMA8, short-term outlook turns bearish | KDJ bearish cross, short-term bearish outlook (K=42.7, D=51.5) | Volume increased (2.1x)
════════════════════
🟢 $RKLB 4-hour bearish signal
⚠️Technical analysis: ADX(28) Trend forming, potential entry | MACD bearish cross below zero, bearish momentum accelerating | EMA5 crossed below EMA8, short-term outlook turns bearish | KDJ bearish cross, short-term bearish outlook (K=46.1, D=54.3) | Volume surge (2.9x)
════════════════════
🔔 Follow for first-hand updates on unusual market movements 🔔
#技术分析 #ASTS #PNUT #RKLB
📌 When trading, check whether the candlestick pattern aligns
$ASTS / $PNUT / $RKLB 4-hour technical indicators are weakening in sync; watch out for risk 🔥
════════════════════
🟢 $ASTS 4-hour bearish signal
⚠️Technical analysis: ADX(32) Strong trending market | MACD bearish cross below zero, bearish momentum accelerating | EMA5 < EMA8 < EMA13, bearish alignment | KDJ trending weakly, bears in control (K=30.6, D=32.5) | Volume surge (3.8x)
════════════════════
🟢 $PNUT 4-hour bearish signal
⚠️Technical analysis: ADX(25) Trend forming, potential entry | MACD bearish cross below zero, bearish momentum accelerating | EMA5 crossed below EMA8, short-term outlook turns bearish | KDJ bearish cross, short-term bearish outlook (K=42.7, D=51.5) | Volume increased (2.1x)
════════════════════
🟢 $RKLB 4-hour bearish signal
⚠️Technical analysis: ADX(28) Trend forming, potential entry | MACD bearish cross below zero, bearish momentum accelerating | EMA5 crossed below EMA8, short-term outlook turns bearish | KDJ bearish cross, short-term bearish outlook (K=46.1, D=54.3) | Volume surge (2.9x)
════════════════════
🔔 Follow for first-hand updates on unusual market movements 🔔
#技术分析 #ASTS #PNUT #RKLB
📌 When trading, check whether the candlestick pattern aligns
════════════════════
🟢 $ASTS 4-hour bearish signal
⚠️Technical analysis: ADX(32) Strong trending market | MACD bearish cross below zero, bearish momentum accelerating | EMA5 < EMA8 < EMA13, bearish alignment | KDJ trending weakly, bears in control (K=30.6, D=32.5) | Volume surge (3.8x)
════════════════════
🟢 $PNUT 4-hour bearish signal
⚠️Technical analysis: ADX(25) Trend forming, potential entry | MACD bearish cross below zero, bearish momentum accelerating | EMA5 crossed below EMA8, short-term outlook turns bearish | KDJ bearish cross, short-term bearish outlook (K=42.7, D=51.5) | Volume increased (2.1x)
════════════════════
🟢 $RKLB 4-hour bearish signal
⚠️Technical analysis: ADX(28) Trend forming, potential entry | MACD bearish cross below zero, bearish momentum accelerating | EMA5 crossed below EMA8, short-term outlook turns bearish | KDJ bearish cross, short-term bearish outlook (K=46.1, D=54.3) | Volume surge (2.9x)
════════════════════
🔔 Follow for first-hand updates on unusual market movements 🔔
#技术分析 #ASTS #PNUT #RKLB
📌 When trading, check whether the candlestick pattern aligns
26
·
--
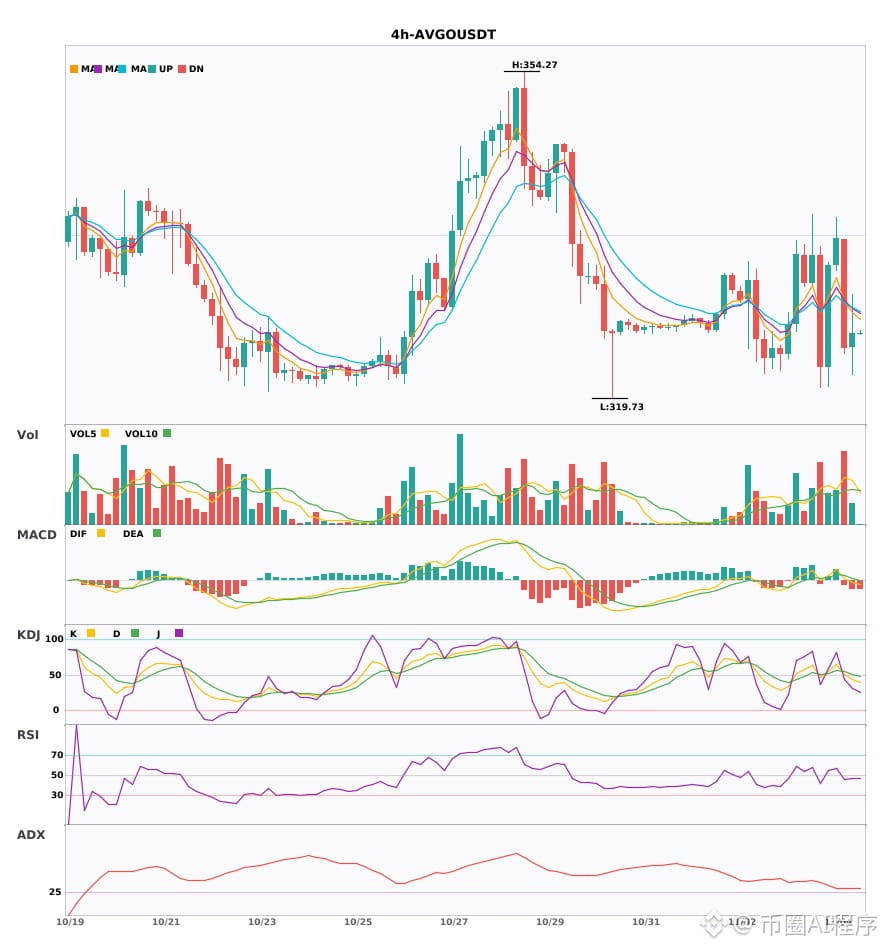
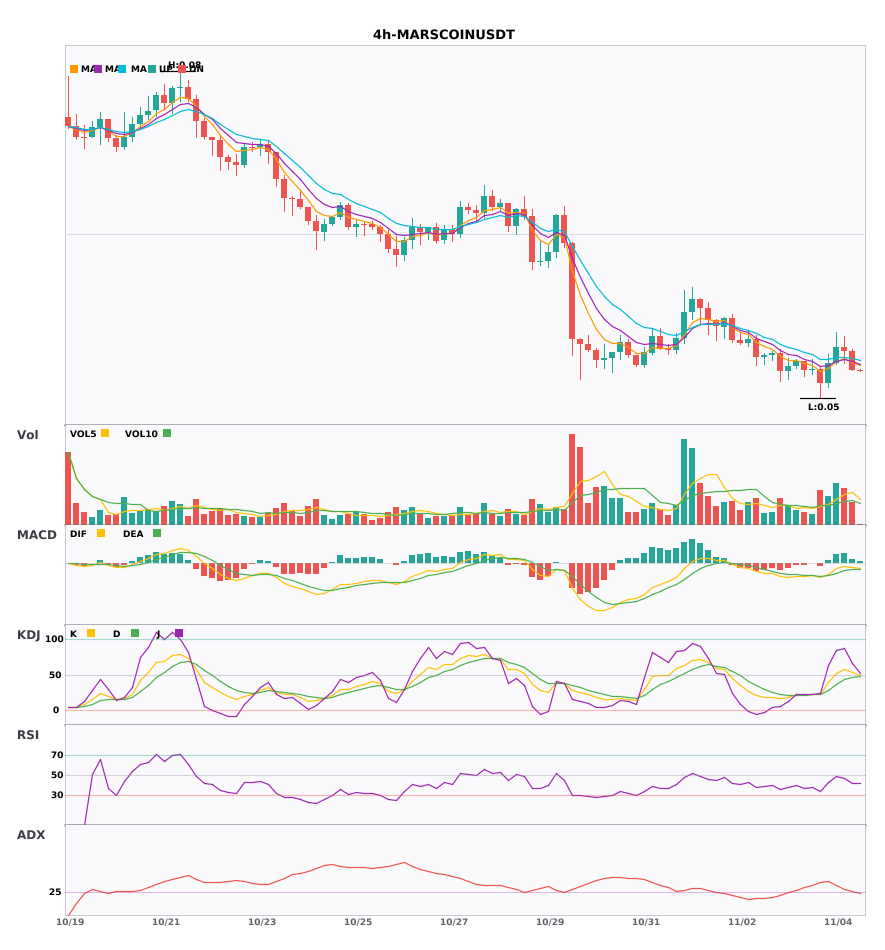
$AVGO / $MARSCOIN / $ASTS 4-hour bearish signals, daily bearish trend confirmed 🔥
════════════════════
🟢 $AVGO 4-hour bearish signal
⚠️ Technicals: Daily bearish confluence confirmed | 4-hour entry: MACD DIF breaks below zero, trend turns bearish | EMA5 < EMA8 < EMA13, bearish alignment | Volume expands (2.1x)
════════════════════
🟢 $MARSCOIN 4-hour bearish signal
⚠️ Technicals: Daily bearish confluence confirmed | 4-hour entry: EMA5 crosses below EMA8, short-term trend turns bearish | Volume expands (1.5x)
════════════════════
🟢 $ASTS 4-hour bearish signal
⚠️ Technicals: Daily bearish confluence confirmed | 4-hour entry: MACD bearish crossover below zero, bearish momentum accelerates | EMA5 < EMA8 < EMA13, bearish alignment | KDJ remains weak, bears have the upper hand (K: 30.6, D: 32.5) | Volume surges (3.8x)
════════════════════
🔔 Follow for the latest market alerts 🔔
#多周期共振 #AVGO #MARSCOIN #ASTS
📌 When trading, check whether the candlestick pattern meets the criteria
$AVGO / $MARSCOIN / $ASTS 4-hour bearish signals, daily bearish trend confirmed 🔥
════════════════════
🟢 $AVGO 4-hour bearish signal
⚠️ Technicals: Daily bearish confluence confirmed | 4-hour entry: MACD DIF breaks below zero, trend turns bearish | EMA5 < EMA8 < EMA13, bearish alignment | Volume expands (2.1x)
════════════════════
🟢 $MARSCOIN 4-hour bearish signal
⚠️ Technicals: Daily bearish confluence confirmed | 4-hour entry: EMA5 crosses below EMA8, short-term trend turns bearish | Volume expands (1.5x)
════════════════════
🟢 $ASTS 4-hour bearish signal
⚠️ Technicals: Daily bearish confluence confirmed | 4-hour entry: MACD bearish crossover below zero, bearish momentum accelerates | EMA5 < EMA8 < EMA13, bearish alignment | KDJ remains weak, bears have the upper hand (K: 30.6, D: 32.5) | Volume surges (3.8x)
════════════════════
🔔 Follow for the latest market alerts 🔔
#多周期共振 #AVGO #MARSCOIN #ASTS
📌 When trading, check whether the candlestick pattern meets the criteria
════════════════════
🟢 $AVGO 4-hour bearish signal
⚠️ Technicals: Daily bearish confluence confirmed | 4-hour entry: MACD DIF breaks below zero, trend turns bearish | EMA5 < EMA8 < EMA13, bearish alignment | Volume expands (2.1x)
════════════════════
🟢 $MARSCOIN 4-hour bearish signal
⚠️ Technicals: Daily bearish confluence confirmed | 4-hour entry: EMA5 crosses below EMA8, short-term trend turns bearish | Volume expands (1.5x)
════════════════════
🟢 $ASTS 4-hour bearish signal
⚠️ Technicals: Daily bearish confluence confirmed | 4-hour entry: MACD bearish crossover below zero, bearish momentum accelerates | EMA5 < EMA8 < EMA13, bearish alignment | KDJ remains weak, bears have the upper hand (K: 30.6, D: 32.5) | Volume surges (3.8x)
════════════════════
🔔 Follow for the latest market alerts 🔔
#多周期共振 #AVGO #MARSCOIN #ASTS
📌 When trading, check whether the candlestick pattern meets the criteria
27

🦈 INVERSE SIGNALS FLASHING AS $ASTS AND $IREN FACE RETAIL SKEPTICISM! ⚡
Public dismissals from mainstream financial media often mark macro sentiment extremes, providing smart money with the counterparty liquidity required to engineer accumulation. 🌊
While retail sentiment recoils from $ASTS and $IREN following dismissive headlines, institutional order flow typically seeks discounted efficiency fills in these exact zones of public disinterest. 📊
Tracking high-timeframe market structure reveals whether genuine institutional sponsorship is quietly absorbing supply beneath the noise. 🤔 Are you fading the mainstream narrative to bid the discount, or waiting for structural confirmation? 👇
⚠️ Not financial advice. Always manage your risk. 🛡️
🏷️ #ASTS #IREN #SmartMoney #MarketStructure #Trading
🎯 🦈
🦈 INVERSE SIGNALS FLASHING AS $ASTS AND $IREN FACE RETAIL SKEPTICISM! ⚡
Public dismissals from mainstream financial media often mark macro sentiment extremes, providing smart money with the counterparty liquidity required to engineer accumulation. 🌊
While retail sentiment recoils from $ASTS and $IREN following dismissive headlines, institutional order flow typically seeks discounted efficiency fills in these exact zones of public disinterest. 📊
Tracking high-timeframe market structure reveals whether genuine institutional sponsorship is quietly absorbing supply beneath the noise. 🤔 Are you fading the mainstream narrative to bid the discount, or waiting for structural confirmation? 👇
⚠️ Not financial advice. Always manage your risk. 🛡️
🏷️ #ASTS #IREN #SmartMoney #MarketStructure #Trading
🎯 🦈
Public dismissals from mainstream financial media often mark macro sentiment extremes, providing smart money with the counterparty liquidity required to engineer accumulation. 🌊
While retail sentiment recoils from $ASTS and $IREN following dismissive headlines, institutional order flow typically seeks discounted efficiency fills in these exact zones of public disinterest. 📊
Tracking high-timeframe market structure reveals whether genuine institutional sponsorship is quietly absorbing supply beneath the noise. 🤔 Are you fading the mainstream narrative to bid the discount, or waiting for structural confirmation? 👇
⚠️ Not financial advice. Always manage your risk. 🛡️
🏷️ #ASTS #IREN #SmartMoney #MarketStructure #Trading
🎯 🦈


9
·
--
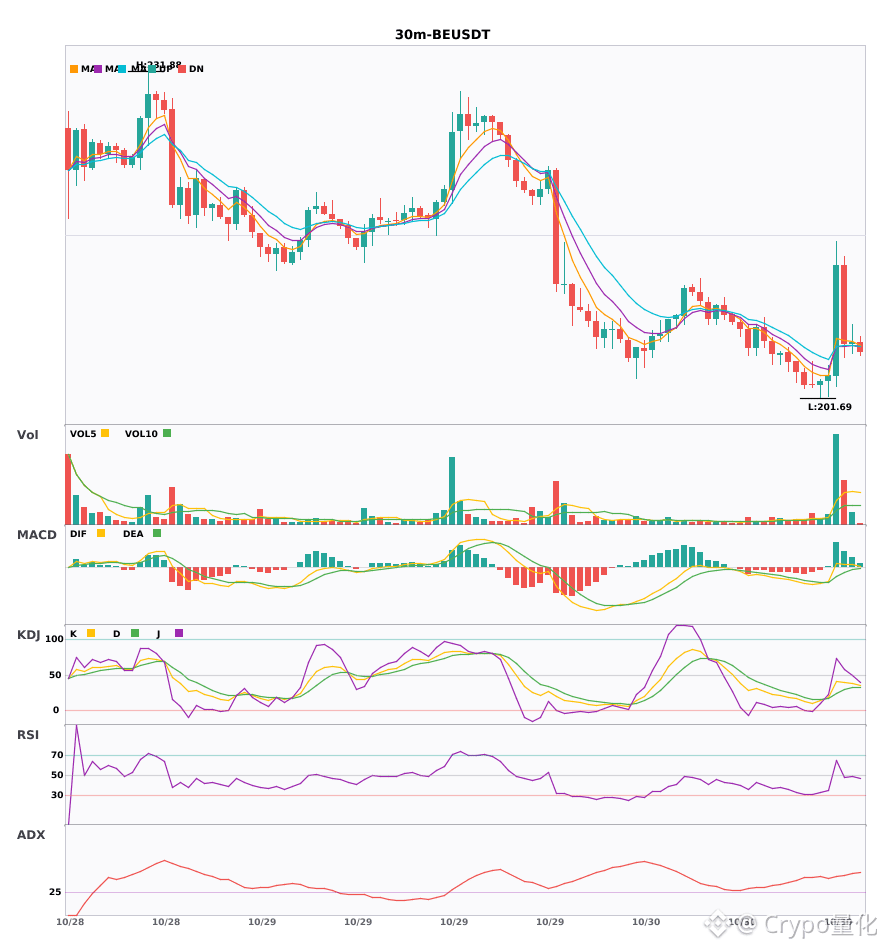
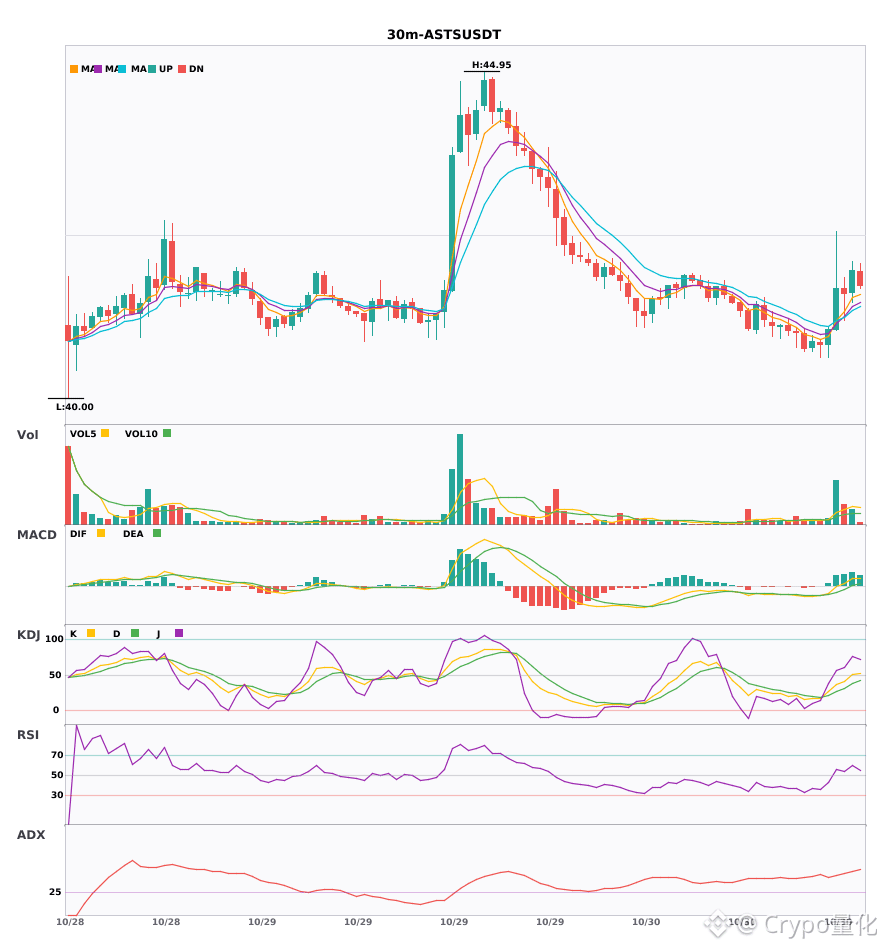
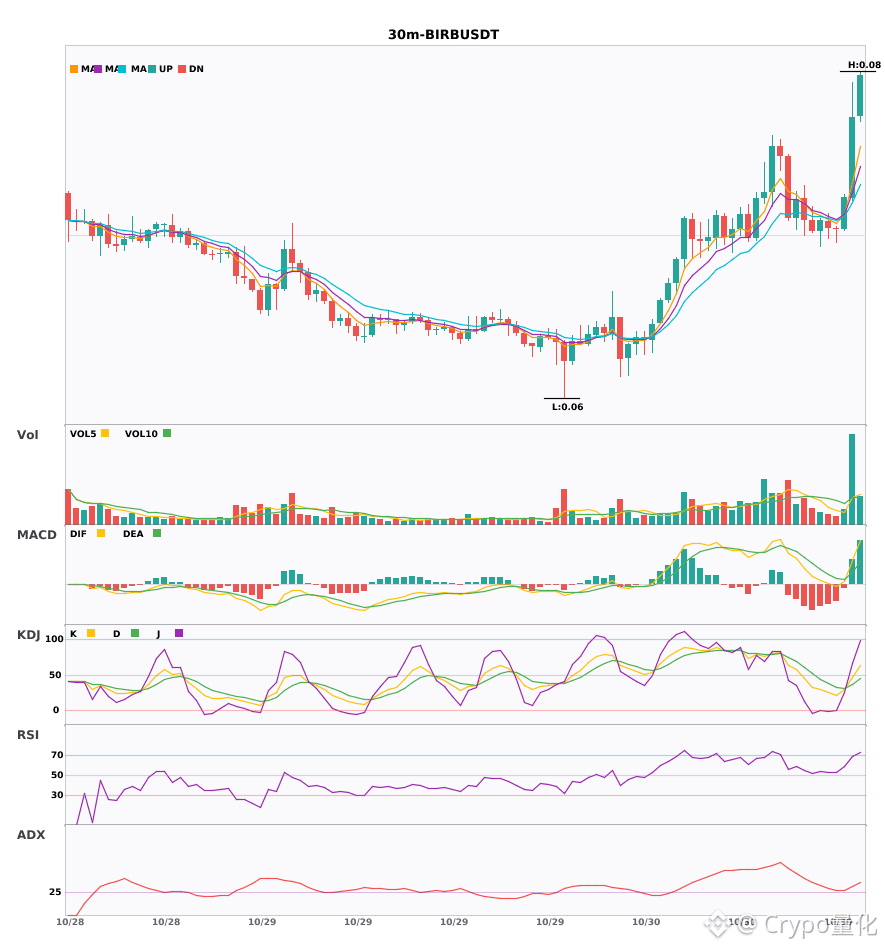
$BE / $ASTS / $BIRB 30-minute technicals are strengthening in unison—which has greater breakout potential? 🔥
════════════════════
🔴 $BE 30-minute bullish signals
⚠️Technical analysis: ADX(49) indicates a very strong trend (watch for an overheated pullback) | MACD is bullish, with a strong trend but weakening momentum | EMA5 > EMA8 > EMA13, bullish alignment | KDJ is weak, with bears in control (K: 37.9, D: 32.2) | Volume surged (2.3x)
📢Market update: Predict (PREDICT) Listing Will Be Postponed
════════════════════
🔴 $ASTS 30-minute bullish signals
⚠️Technical analysis: ADX(48) indicates a very strong trend (watch for an overheated pullback) | MACD DIF has broken above the zero line, signaling a bullish trend | EMA5 > EMA8 > EMA13, bullish alignment | KDJ is weak, with bears in control (K: 41.1, D: 31.4) | Volume exploded (5.1x)
════════════════════
🔴 $BIRB 30-minute bullish signals
⚠️Technical analysis: ADX(33) indicates a clear trending market | MACD golden cross above zero, releasing bullish momentum | EMA5 crossed above EMA8, turning bullish in the short term | KDJ golden cross, bullish in the short term (K: 46.1, D: 36.4) | Volume exploded (3.3x)
════════════════════
🔔 Follow for the latest market movements 🔔
#技术分析 #BE #ASTS #BIRB
📌 When trading, pay attention to whether the candlestick pattern confirms the signal
$BE / $ASTS / $BIRB 30-minute technicals are strengthening in unison—which has greater breakout potential? 🔥
════════════════════
🔴 $BE 30-minute bullish signals
⚠️Technical analysis: ADX(49) indicates a very strong trend (watch for an overheated pullback) | MACD is bullish, with a strong trend but weakening momentum | EMA5 > EMA8 > EMA13, bullish alignment | KDJ is weak, with bears in control (K: 37.9, D: 32.2) | Volume surged (2.3x)
📢Market update: Predict (PREDICT) Listing Will Be Postponed
════════════════════
🔴 $ASTS 30-minute bullish signals
⚠️Technical analysis: ADX(48) indicates a very strong trend (watch for an overheated pullback) | MACD DIF has broken above the zero line, signaling a bullish trend | EMA5 > EMA8 > EMA13, bullish alignment | KDJ is weak, with bears in control (K: 41.1, D: 31.4) | Volume exploded (5.1x)
════════════════════
🔴 $BIRB 30-minute bullish signals
⚠️Technical analysis: ADX(33) indicates a clear trending market | MACD golden cross above zero, releasing bullish momentum | EMA5 crossed above EMA8, turning bullish in the short term | KDJ golden cross, bullish in the short term (K: 46.1, D: 36.4) | Volume exploded (3.3x)
════════════════════
🔔 Follow for the latest market movements 🔔
#技术分析 #BE #ASTS #BIRB
📌 When trading, pay attention to whether the candlestick pattern confirms the signal
════════════════════
🔴 $BE 30-minute bullish signals
⚠️Technical analysis: ADX(49) indicates a very strong trend (watch for an overheated pullback) | MACD is bullish, with a strong trend but weakening momentum | EMA5 > EMA8 > EMA13, bullish alignment | KDJ is weak, with bears in control (K: 37.9, D: 32.2) | Volume surged (2.3x)
📢Market update: Predict (PREDICT) Listing Will Be Postponed
════════════════════
🔴 $ASTS 30-minute bullish signals
⚠️Technical analysis: ADX(48) indicates a very strong trend (watch for an overheated pullback) | MACD DIF has broken above the zero line, signaling a bullish trend | EMA5 > EMA8 > EMA13, bullish alignment | KDJ is weak, with bears in control (K: 41.1, D: 31.4) | Volume exploded (5.1x)
════════════════════
🔴 $BIRB 30-minute bullish signals
⚠️Technical analysis: ADX(33) indicates a clear trending market | MACD golden cross above zero, releasing bullish momentum | EMA5 crossed above EMA8, turning bullish in the short term | KDJ golden cross, bullish in the short term (K: 46.1, D: 36.4) | Volume exploded (3.3x)
════════════════════
🔔 Follow for the latest market movements 🔔
#技术分析 #BE #ASTS #BIRB
📌 When trading, pay attention to whether the candlestick pattern confirms the signal
13
·
--
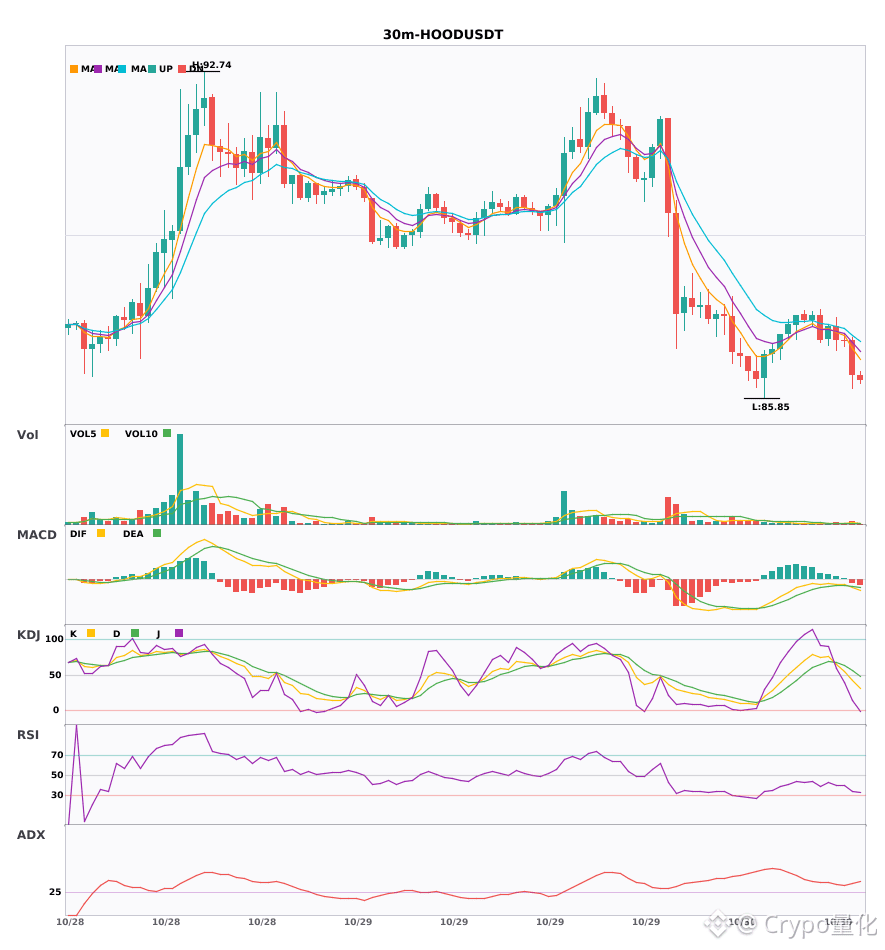
3 30-Minute Bearish Alerts: $HOOD / $ASTS / $ETH🔥
════════════════════
🟢 $HOOD 30-Minute Bearish Signal
⚠️Technical Analysis: ADX(33): Clear trending market | MACD bearish crossover below zero, bearish momentum accelerating | EMA5 < EMA8 < EMA13: bearish alignment | Volume increased (2.0x)
════════════════════
🟢 $ASTS 30-Minute Bearish Signal
⚠️Technical Analysis: ADX(40): Clear trending market | MACD bearish crossover below zero, bearish momentum accelerating | EMA5 < EMA8 < EMA13: bearish alignment | KDJ trending weakly, bears in control (K: 31.9, D: 46.5) | Volume increased (1.5x)
════════════════════
🟢 $ETH 30-Minute Bearish Signal
⚠️Technical Analysis: ADX(29): Trend is forming; entry is possible | MACD DIF fell below the zero line, trend turning bearish | Moving averages are converging, momentum building; direction to be determined soon | KDJ bearish crossover, short-term outlook is bearish (K: 70.4, D: 76.6) | Volume increased (1.8x)
📢Market Update: Wallet Maintenance for Ethereum Network (ETH) - 2026-10-28
════════════════════
🔔 Follow for first-hand market alerts 🔔
#技术分析 #HOOD #ASTS #ETH
📌 When trading, pay attention to whether the candlestick pattern confirms the signal
3 30-Minute Bearish Alerts: $HOOD / $ASTS / $ETH 🔥
════════════════════
🟢 $HOOD 30-Minute Bearish Signal
⚠️Technical Analysis: ADX(33): Clear trending market | MACD bearish crossover below zero, bearish momentum accelerating | EMA5 < EMA8 < EMA13: bearish alignment | Volume increased (2.0x)
════════════════════
🟢 $ASTS 30-Minute Bearish Signal
⚠️Technical Analysis: ADX(40): Clear trending market | MACD bearish crossover below zero, bearish momentum accelerating | EMA5 < EMA8 < EMA13: bearish alignment | KDJ trending weakly, bears in control (K: 31.9, D: 46.5) | Volume increased (1.5x)
════════════════════
🟢 $ETH 30-Minute Bearish Signal
⚠️Technical Analysis: ADX(29): Trend is forming; entry is possible | MACD DIF fell below the zero line, trend turning bearish | Moving averages are converging, momentum building; direction to be determined soon | KDJ bearish crossover, short-term outlook is bearish (K: 70.4, D: 76.6) | Volume increased (1.8x)
📢Market Update: Wallet Maintenance for Ethereum Network (ETH) - 2026-10-28
════════════════════
🔔 Follow for first-hand market alerts 🔔
#技术分析 #HOOD #ASTS #ETH
📌 When trading, pay attention to whether the candlestick pattern confirms the signal
════════════════════
🟢 $HOOD 30-Minute Bearish Signal
⚠️Technical Analysis: ADX(33): Clear trending market | MACD bearish crossover below zero, bearish momentum accelerating | EMA5 < EMA8 < EMA13: bearish alignment | Volume increased (2.0x)
════════════════════
🟢 $ASTS 30-Minute Bearish Signal
⚠️Technical Analysis: ADX(40): Clear trending market | MACD bearish crossover below zero, bearish momentum accelerating | EMA5 < EMA8 < EMA13: bearish alignment | KDJ trending weakly, bears in control (K: 31.9, D: 46.5) | Volume increased (1.5x)
════════════════════
🟢 $ETH 30-Minute Bearish Signal
⚠️Technical Analysis: ADX(29): Trend is forming; entry is possible | MACD DIF fell below the zero line, trend turning bearish | Moving averages are converging, momentum building; direction to be determined soon | KDJ bearish crossover, short-term outlook is bearish (K: 70.4, D: 76.6) | Volume increased (1.8x)
📢Market Update: Wallet Maintenance for Ethereum Network (ETH) - 2026-10-28
════════════════════
🔔 Follow for first-hand market alerts 🔔
#技术分析 #HOOD #ASTS #ETH
📌 When trading, pay attention to whether the candlestick pattern confirms the signal
3

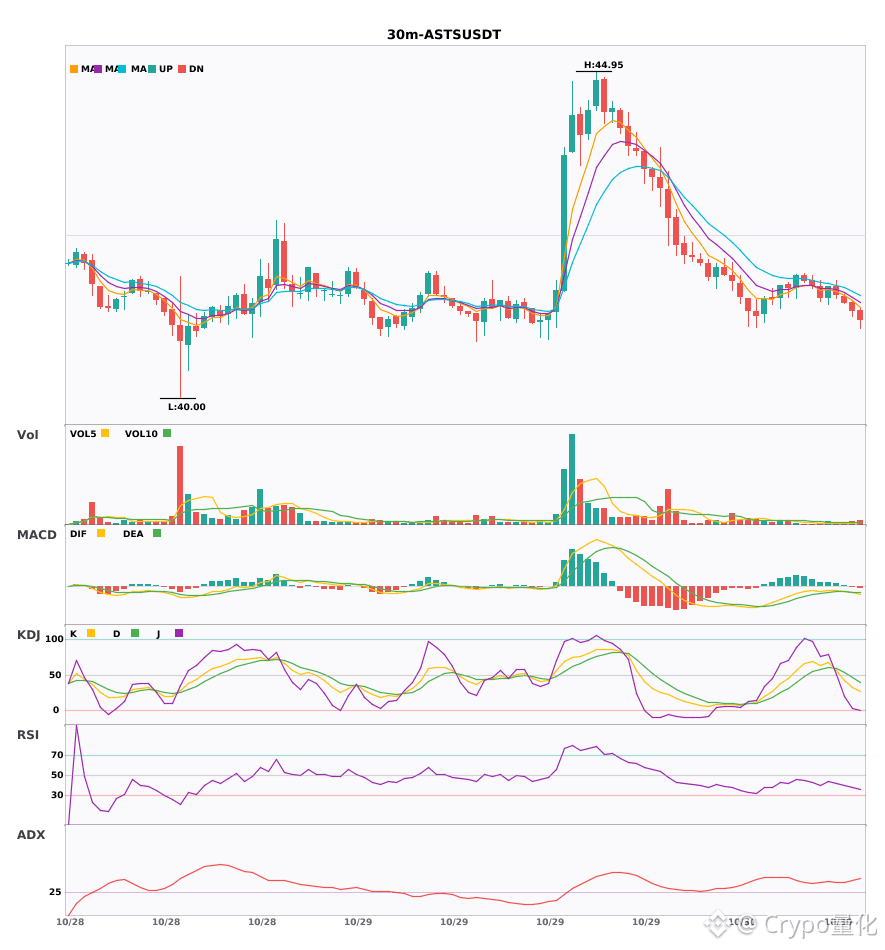
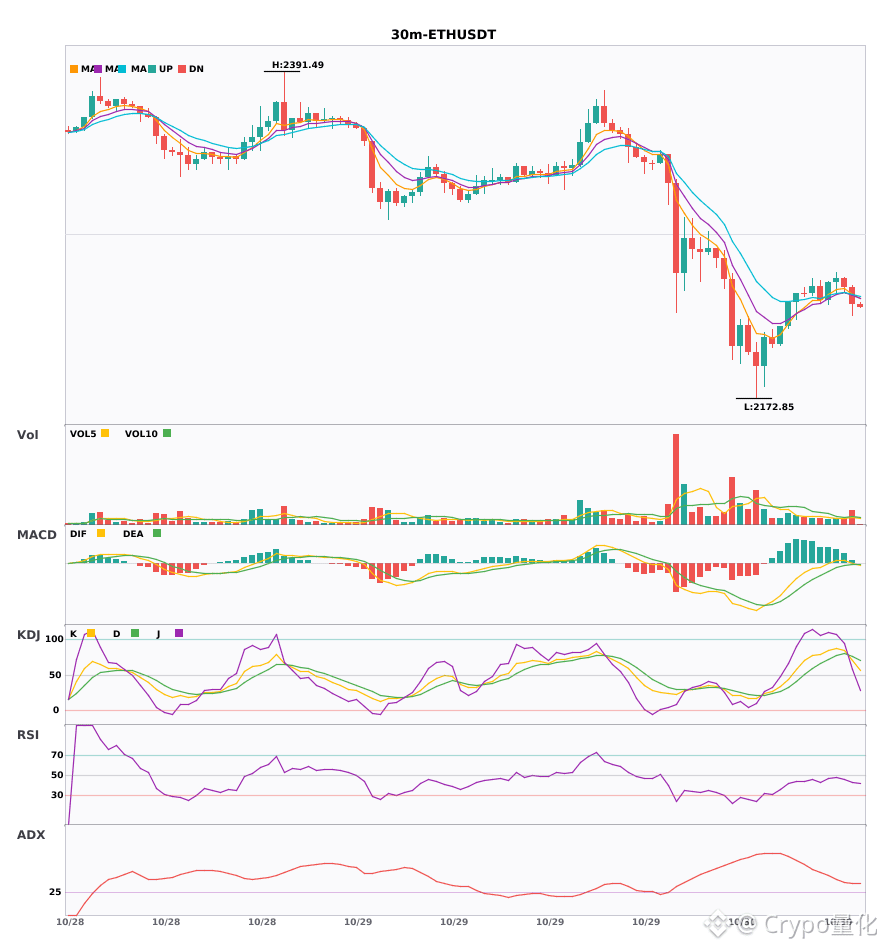
The Quiet Range That’s Testing Patience on $ASTS 🎗️
ASTS is holding $41.39 inside a neutral band, with support clustered at the $38.50–$39.20 EMAs and resistance capped at the $43.50 intraday supply zone. The 1-hour chart shows higher-low repair, yet the 4-hour structure remains counter-trend below the mid-Bollinger, keeping upside conviction limited.
Buyers can look to add near $38.50–$39.20 on volume confirmation; sellers may trim into $43.50 if momentum stalls. A break above $43.50 with expanding volume would open the path toward $45.80, while a slip below $36.80 would invalidate the current setup—especially with daily volume still thin at $1.83M.
$ASTSB $ASTS.US #CoinVahini #ASTS #TechnicalAnalysis #StockTrading
The Quiet Range That’s Testing Patience on $ASTS 🎗️
ASTS is holding $41.39 inside a neutral band, with support clustered at the $38.50–$39.20 EMAs and resistance capped at the $43.50 intraday supply zone. The 1-hour chart shows higher-low repair, yet the 4-hour structure remains counter-trend below the mid-Bollinger, keeping upside conviction limited.
Buyers can look to add near $38.50–$39.20 on volume confirmation; sellers may trim into $43.50 if momentum stalls. A break above $43.50 with expanding volume would open the path toward $45.80, while a slip below $36.80 would invalidate the current setup—especially with daily volume still thin at $1.83M.
$ASTSB $ASTS.US #CoinVahini #ASTS #TechnicalAnalysis #StockTrading
ASTS is holding $41.39 inside a neutral band, with support clustered at the $38.50–$39.20 EMAs and resistance capped at the $43.50 intraday supply zone. The 1-hour chart shows higher-low repair, yet the 4-hour structure remains counter-trend below the mid-Bollinger, keeping upside conviction limited.
Buyers can look to add near $38.50–$39.20 on volume confirmation; sellers may trim into $43.50 if momentum stalls. A break above $43.50 with expanding volume would open the path toward $45.80, while a slip below $36.80 would invalidate the current setup—especially with daily volume still thin at $1.83M.
$ASTSB $ASTS.US #CoinVahini #ASTS #TechnicalAnalysis #StockTrading
ASTSUS-14.27%
ASTSB-15.50%
7
·
--
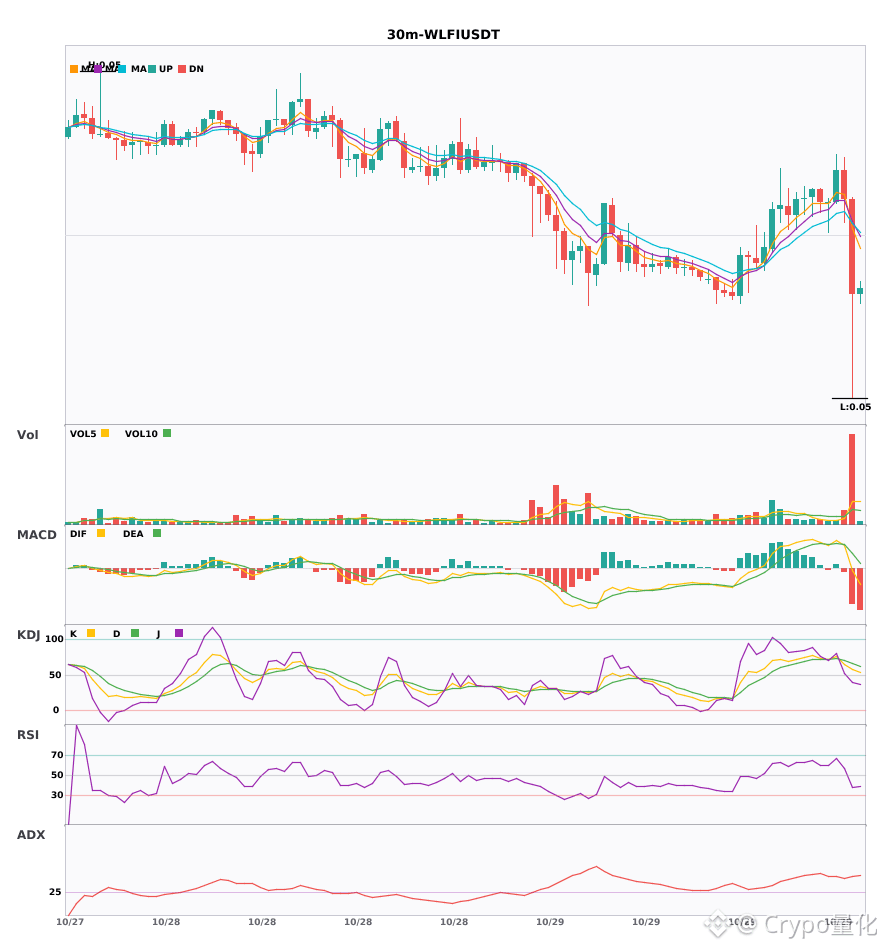
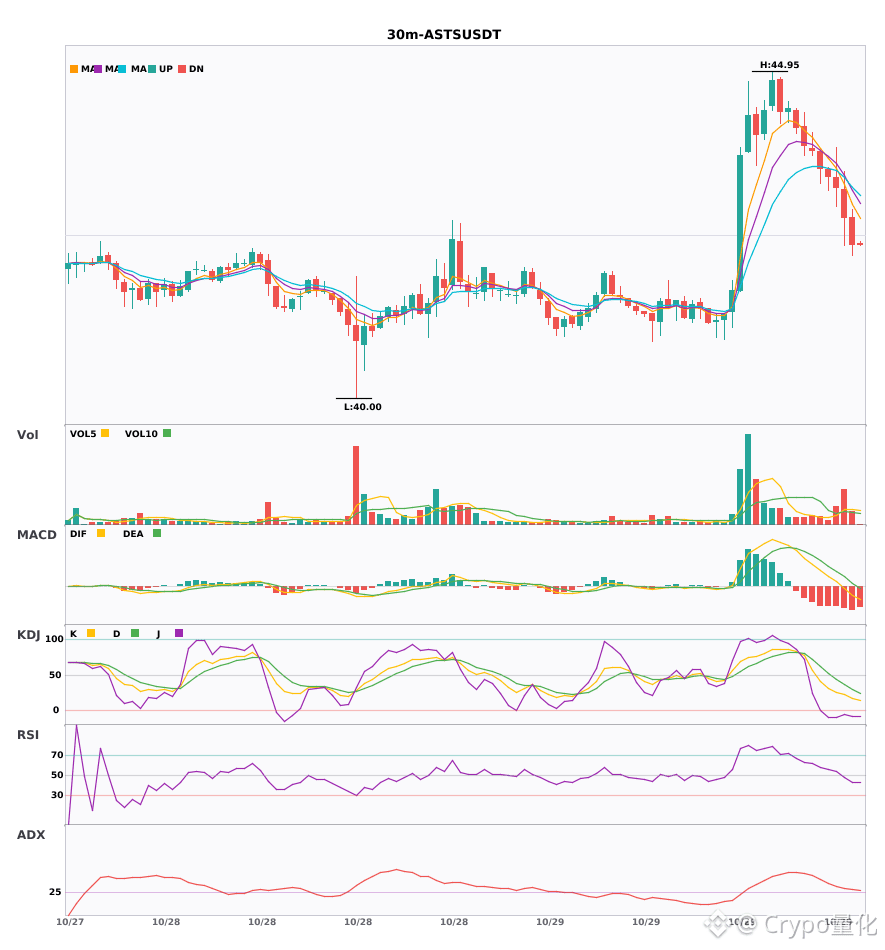
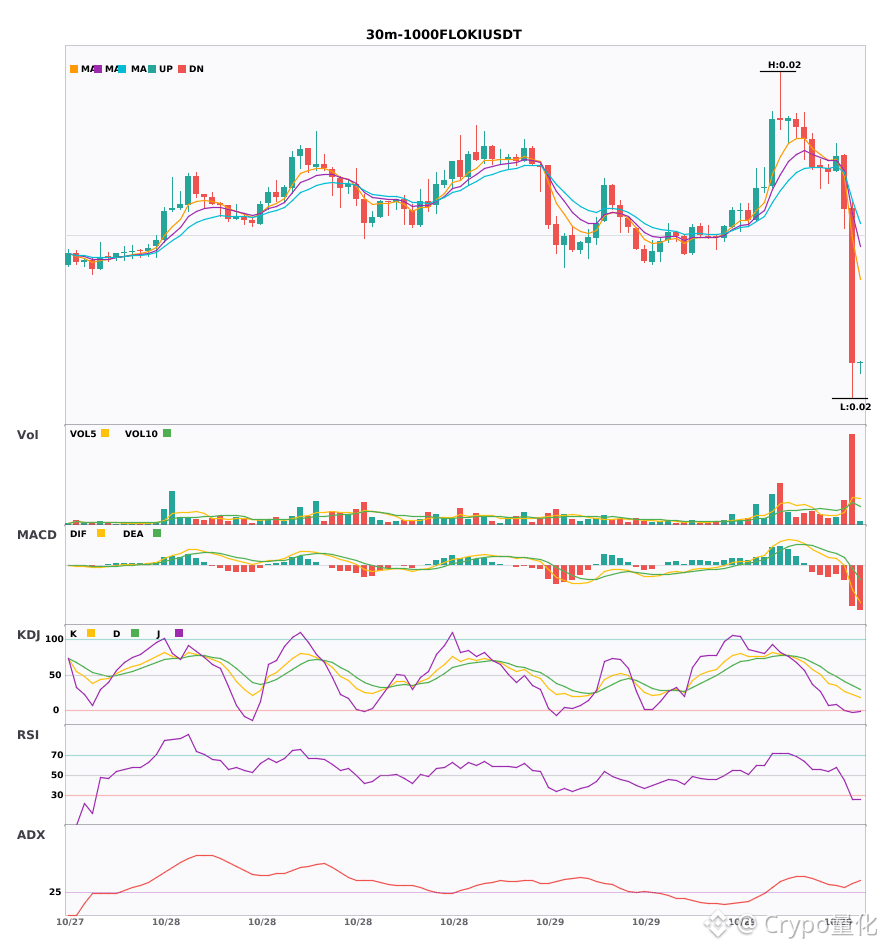
$WLFI / $ASTS / $1000FLOKI 30-minute technical indicators are weakening in sync; exercise caution 🔥
════════════════════
🟢 $WLFI 30-minute bearish signal
⚠️Technical analysis: ADX(45) clear trending market | MACD DIF falls below the zero line, trend turns bearish | EMA5 crosses below EMA8, short-term trend turns bearish | KDJ running strong, bulls have the advantage (K is 57.0, D is 65.8) | Volume surge (5.8x)
════════════════════
🟢 $ASTS 30-minute bearish signal
⚠️Technical analysis: ADX(28) trend is forming, opportunity to participate | MACD DIF falls below the zero line, trend turns bearish | Moving averages are converging, building momentum; direction will be chosen soon | KDJ running weak, bears have the advantage (K is 22.3, D is 36.1) | Volume surge (2.7x)
════════════════════
🟢 $1000FLOKI 30-minute bearish signal
⚠️Technical analysis: ADX(36) clear trending market | MACD bearish, trend is weak, momentum strengthening | EMA5 below EMA8 below EMA13, bearish alignment | KDJ running weak, bears have the advantage (K is 22.4, D is 34.8) | Volume surge (4.0x)
════════════════════
🔔 Follow for first-hand market updates 🔔
#技术分析 #WLFI #ASTS #1000FLOKI
📌 When trading, pay attention to whether the candlestick pattern confirms the signal
$WLFI / $ASTS / $1000FLOKI 30-minute technical indicators are weakening in sync; exercise caution 🔥
════════════════════
🟢 $WLFI 30-minute bearish signal
⚠️Technical analysis: ADX(45) clear trending market | MACD DIF falls below the zero line, trend turns bearish | EMA5 crosses below EMA8, short-term trend turns bearish | KDJ running strong, bulls have the advantage (K is 57.0, D is 65.8) | Volume surge (5.8x)
════════════════════
🟢 $ASTS 30-minute bearish signal
⚠️Technical analysis: ADX(28) trend is forming, opportunity to participate | MACD DIF falls below the zero line, trend turns bearish | Moving averages are converging, building momentum; direction will be chosen soon | KDJ running weak, bears have the advantage (K is 22.3, D is 36.1) | Volume surge (2.7x)
════════════════════
🟢 $1000FLOKI 30-minute bearish signal
⚠️Technical analysis: ADX(36) clear trending market | MACD bearish, trend is weak, momentum strengthening | EMA5 below EMA8 below EMA13, bearish alignment | KDJ running weak, bears have the advantage (K is 22.4, D is 34.8) | Volume surge (4.0x)
════════════════════
🔔 Follow for first-hand market updates 🔔
#技术分析 #WLFI #ASTS #1000FLOKI
📌 When trading, pay attention to whether the candlestick pattern confirms the signal
════════════════════
🟢 $WLFI 30-minute bearish signal
⚠️Technical analysis: ADX(45) clear trending market | MACD DIF falls below the zero line, trend turns bearish | EMA5 crosses below EMA8, short-term trend turns bearish | KDJ running strong, bulls have the advantage (K is 57.0, D is 65.8) | Volume surge (5.8x)
════════════════════
🟢 $ASTS 30-minute bearish signal
⚠️Technical analysis: ADX(28) trend is forming, opportunity to participate | MACD DIF falls below the zero line, trend turns bearish | Moving averages are converging, building momentum; direction will be chosen soon | KDJ running weak, bears have the advantage (K is 22.3, D is 36.1) | Volume surge (2.7x)
════════════════════
🟢 $1000FLOKI 30-minute bearish signal
⚠️Technical analysis: ADX(36) clear trending market | MACD bearish, trend is weak, momentum strengthening | EMA5 below EMA8 below EMA13, bearish alignment | KDJ running weak, bears have the advantage (K is 22.4, D is 34.8) | Volume surge (4.0x)
════════════════════
🔔 Follow for first-hand market updates 🔔
#技术分析 #WLFI #ASTS #1000FLOKI
📌 When trading, pay attention to whether the candlestick pattern confirms the signal
8


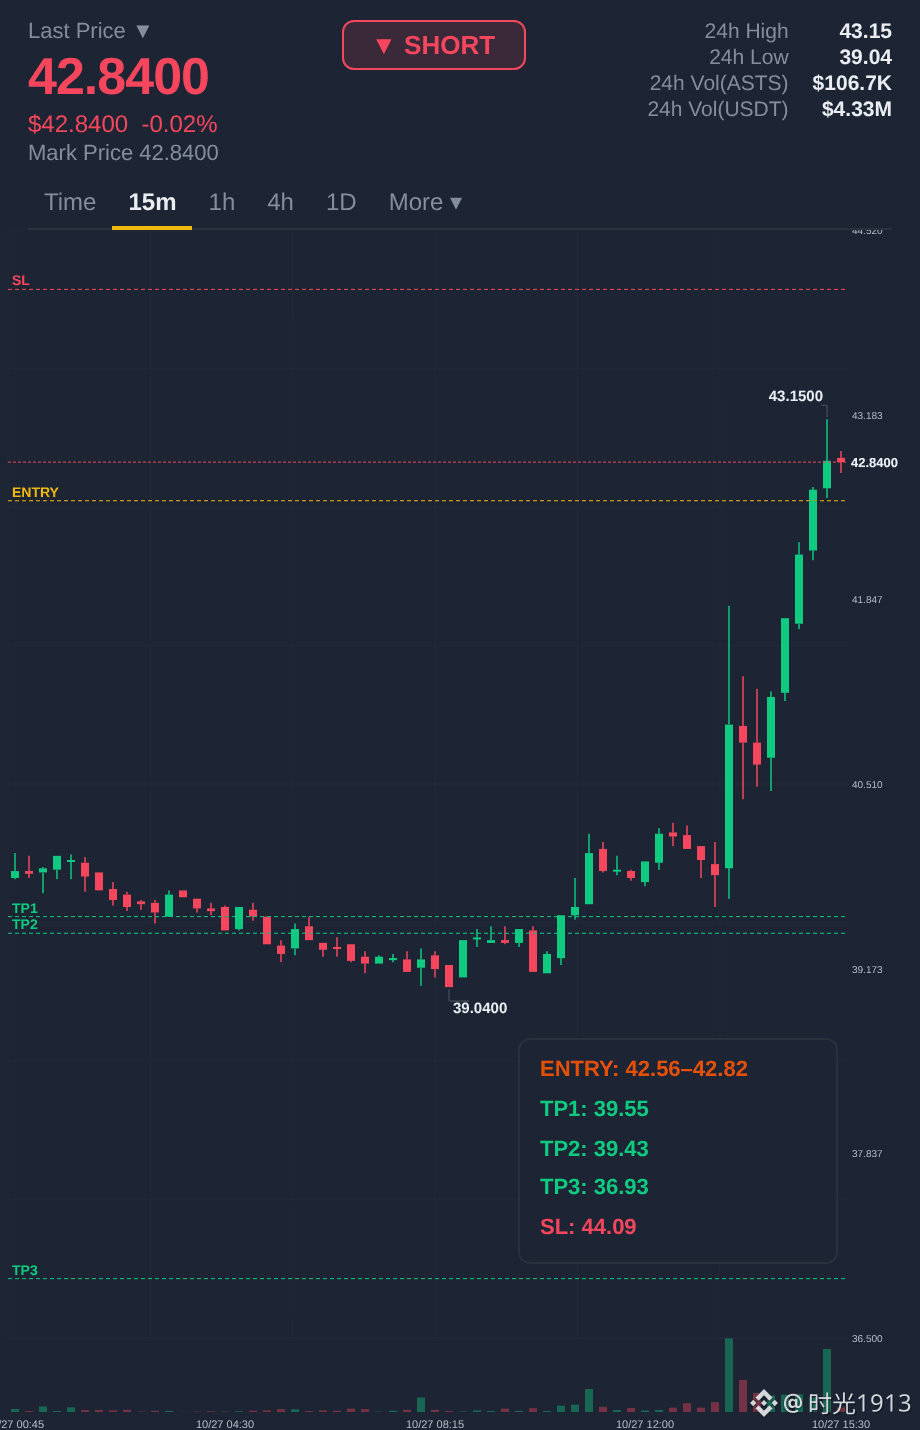

💥 $ASTS BOUNCES OFF LOCAL BOTTOM WITH 8% SURGE TOWARD NEW HIGHS! 🚀
Target: 74.50 🚀
Bulls just defended the local floor with absolute authority, sparking an 8% momentum impulse right off key support. 📊 Market structure is shifting fast from quiet consolidation into an aggressive expansion phase as buyers reclaim control.
⚡ With order flow accelerating, this structural pivot sets up a clean run back toward previous swing highs while sympathetic movers like $TUT and $BTR draw secondary eye. 💬 Are you positioning ahead of the momentum expansion or waiting for high-tf confirmation? 👇
⚠️ Not financial advice. Always manage your risk. 🛡️
🏷️ #ASTS #TrendReversal #Breakout #Crypto
⚡ 🎯
💥 $ASTS BOUNCES OFF LOCAL BOTTOM WITH 8% SURGE TOWARD NEW HIGHS! 🚀
Target: 74.50 🚀
Bulls just defended the local floor with absolute authority, sparking an 8% momentum impulse right off key support. 📊 Market structure is shifting fast from quiet consolidation into an aggressive expansion phase as buyers reclaim control.
⚡ With order flow accelerating, this structural pivot sets up a clean run back toward previous swing highs while sympathetic movers like $TUT and $BTR draw secondary eye. 💬 Are you positioning ahead of the momentum expansion or waiting for high-tf confirmation? 👇
⚠️ Not financial advice. Always manage your risk. 🛡️
🏷️ #ASTS #TrendReversal #Breakout #Crypto
⚡ 🎯
Target: 74.50 🚀
Bulls just defended the local floor with absolute authority, sparking an 8% momentum impulse right off key support. 📊 Market structure is shifting fast from quiet consolidation into an aggressive expansion phase as buyers reclaim control.
⚡ With order flow accelerating, this structural pivot sets up a clean run back toward previous swing highs while sympathetic movers like $TUT and $BTR draw secondary eye. 💬 Are you positioning ahead of the momentum expansion or waiting for high-tf confirmation? 👇
⚠️ Not financial advice. Always manage your risk. 🛡️
🏷️ #ASTS #TrendReversal #Breakout #Crypto
⚡ 🎯
36


Log in to explore more content
Join global crypto users on Binance Square
⚡️ Get latest and useful information about crypto.
💬 Trusted by the world’s largest crypto exchange.
👍 Discover real insights from verified creators.
Email / Phone number
Trending Topics
1
#BinanceReopensWithdrawalsForMoreAssets
768,778 views
4,253 Discussing
2
#Binance98PercentReplenished
140,456 views
1,641 Discussing
3
#USStocksSlipandCryptoMarketUnderBroadPressure
313 views
89 Discussing
4
#StrategySTRCResumesIssuanceAfterOver170Days
12,848 views
322 Discussing
5
#ADPUSPrivateEmployersAdd86000JobsInOctober
28,301 views
494 Discussing
6
#KazakhstanReportedlyInvests$100MInCryptoFunds
1,062 views
39 Discussing
7
#SouthKoreaSeeksCryptoTaxDelayUntil2029
16,628 views
214 Discussing
8
#USMidterms-WhatAreMarketsExpecting?
574,355 views
2,807 Discussing
9
#US10YearTreasuryYieldFallsTo4.845%
18,376 views
160 Discussing
10
#ZcashExpectsNU7ToMake$16MSproutZECInaccessible
1,149 views
18 Discussing