
#baba
baba
64,741 views
845 Discussing
Hot
Latest

·
--
🚀 $BABA LONG 🚀
Entry: 110.24 – 110.90
SL: 108.93
TP1: 111.98
TP2: 112.92
TP3: 114.09
📈 Technical Outlook:
$BABA is showing strong bullish momentum after confirming strength near a key technical zone. The setup is supported by EMA trend is bullish, price is breaking above recent resistance, volume is expanding. As long as price holds above the entry area, buyers may continue pushing toward the listed targets.
#BABA #Crypto #BinanceSquare #Trading
🚀 $BABA LONG 🚀
Entry: 110.24 – 110.90
SL: 108.93
TP1: 111.98
TP2: 112.92
TP3: 114.09
📈 Technical Outlook:
$BABA is showing strong bullish momentum after confirming strength near a key technical zone. The setup is supported by EMA trend is bullish, price is breaking above recent resistance, volume is expanding. As long as price holds above the entry area, buyers may continue pushing toward the listed targets.
#BABA #Crypto #BinanceSquare #Trading
Entry: 110.24 – 110.90
SL: 108.93
TP1: 111.98
TP2: 112.92
TP3: 114.09
📈 Technical Outlook:
$BABA is showing strong bullish momentum after confirming strength near a key technical zone. The setup is supported by EMA trend is bullish, price is breaking above recent resistance, volume is expanding. As long as price holds above the entry area, buyers may continue pushing toward the listed targets.
#BABA #Crypto #BinanceSquare #Trading

4

·
--
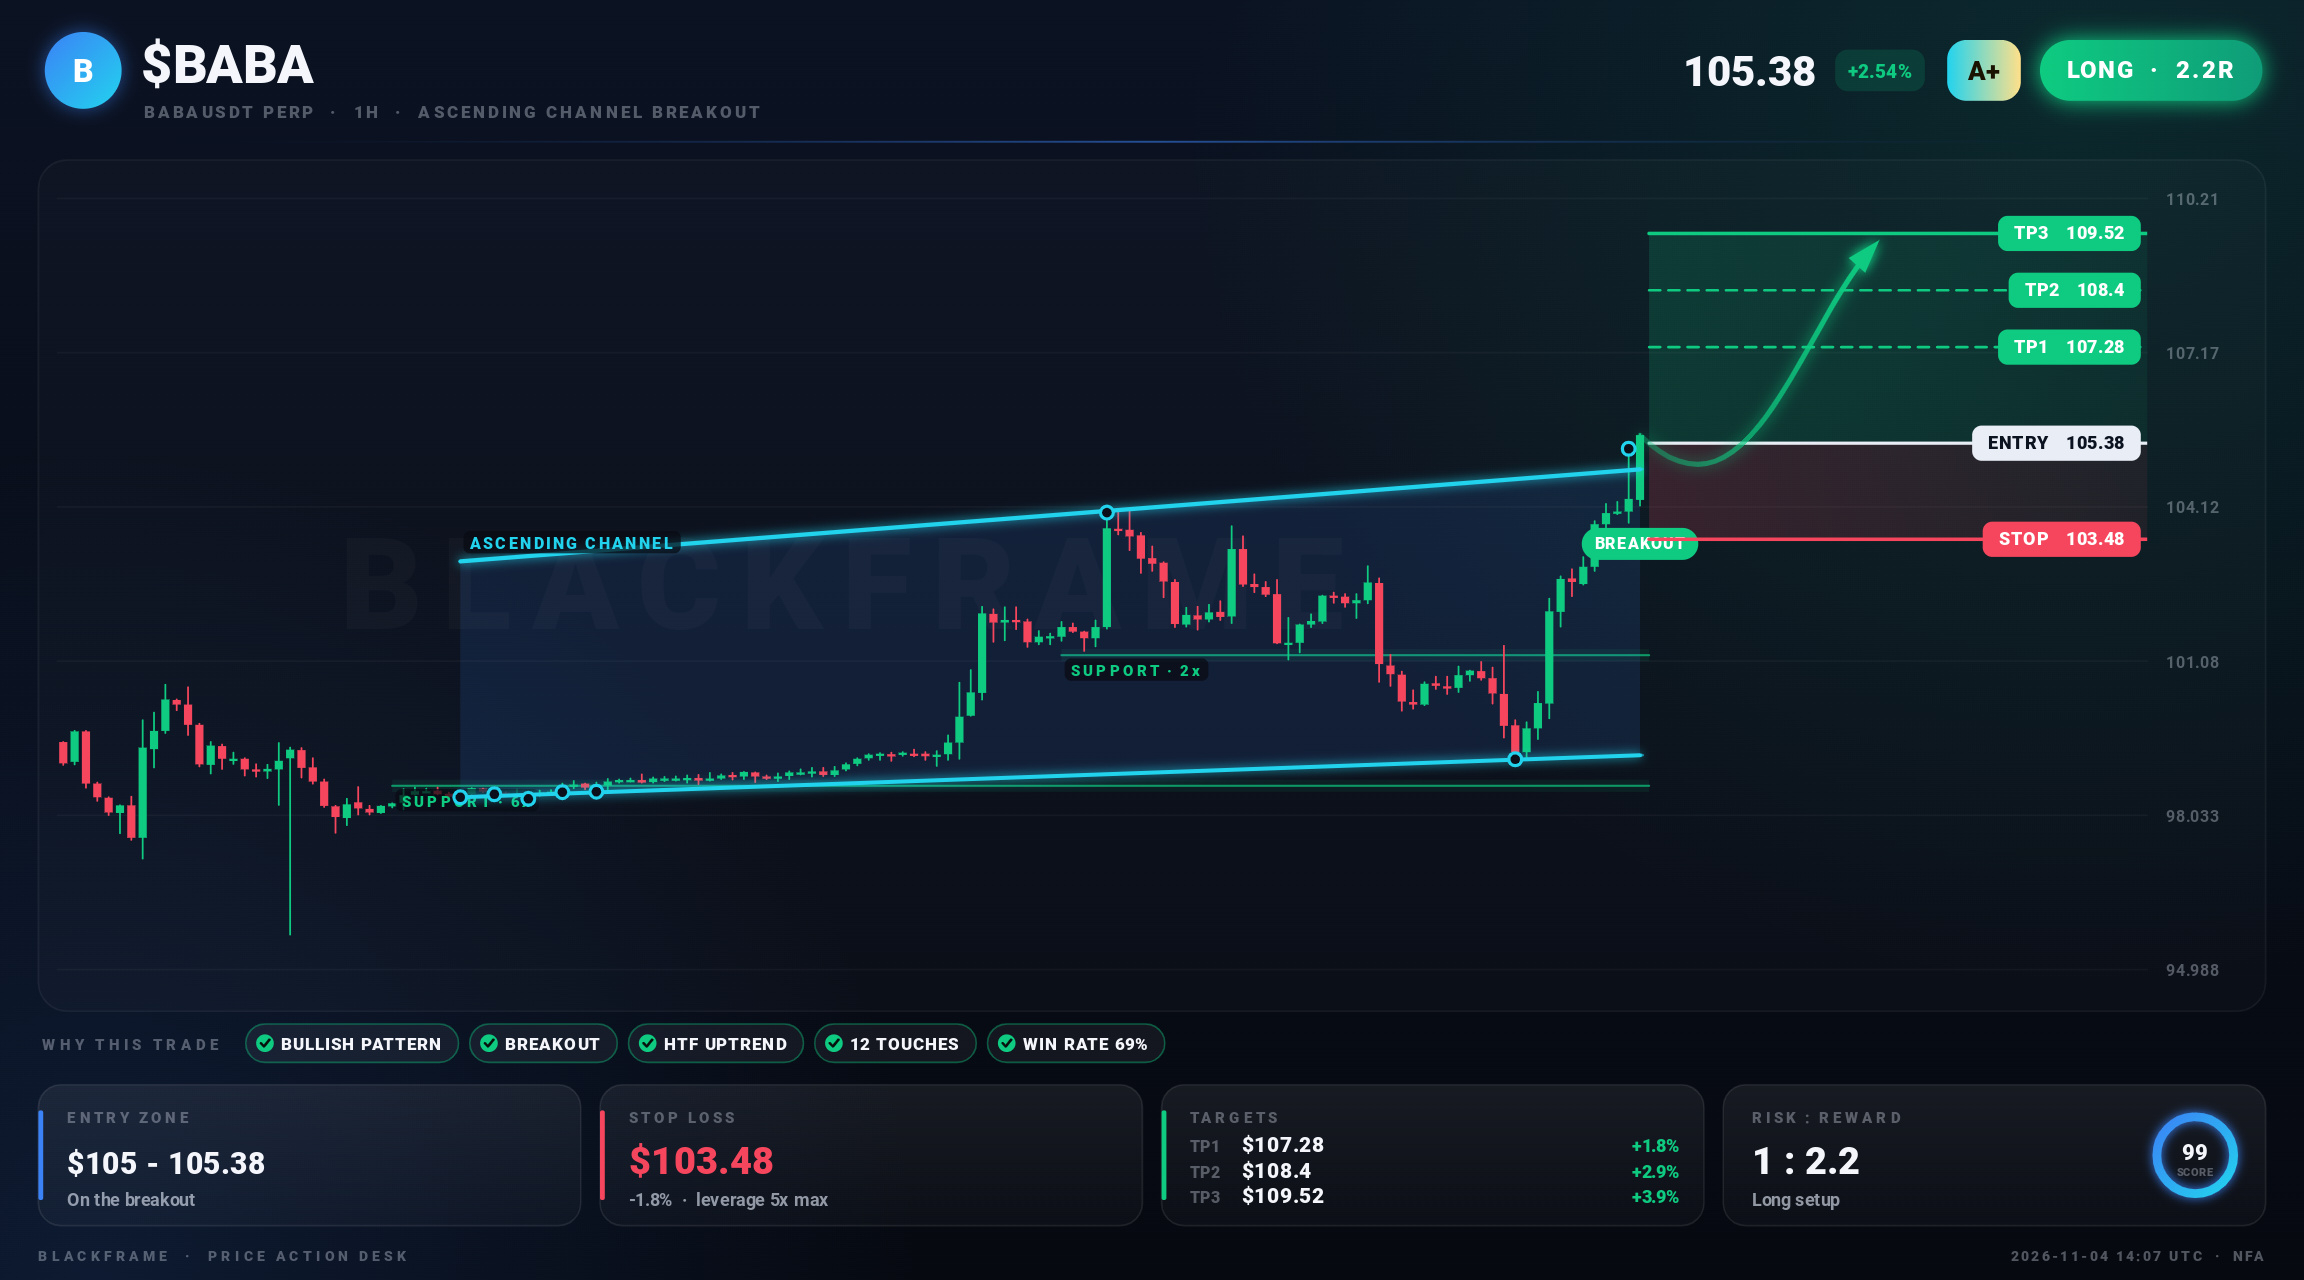
$BABA spikes above channel breakout 📈
LONG · 1H
Entry: $104.91 - $105.38
TP1: $107.28
TP2: $108.4
TP3: $109.52
SL: $103.48
The hourly ascending channel fractured, confirming bullish pressure. Entry aligns with the breakout zone, stop placed at $103.48 and target at $109.52. Invalidates if price retests below $104.86.
#BABA #Crypto #Futures · NFA
$BABA spikes above channel breakout 📈
LONG · 1H
Entry: $104.91 - $105.38
TP1: $107.28
TP2: $108.4
TP3: $109.52
SL: $103.48
The hourly ascending channel fractured, confirming bullish pressure. Entry aligns with the breakout zone, stop placed at $103.48 and target at $109.52. Invalidates if price retests below $104.86.
#BABA #Crypto #Futures · NFA
LONG · 1H
Entry: $104.91 - $105.38
TP1: $107.28
TP2: $108.4
TP3: $109.52
SL: $103.48
The hourly ascending channel fractured, confirming bullish pressure. Entry aligns with the breakout zone, stop placed at $103.48 and target at $109.52. Invalidates if price retests below $104.86.
#BABA #Crypto #Futures · NFA
1
144
·
--
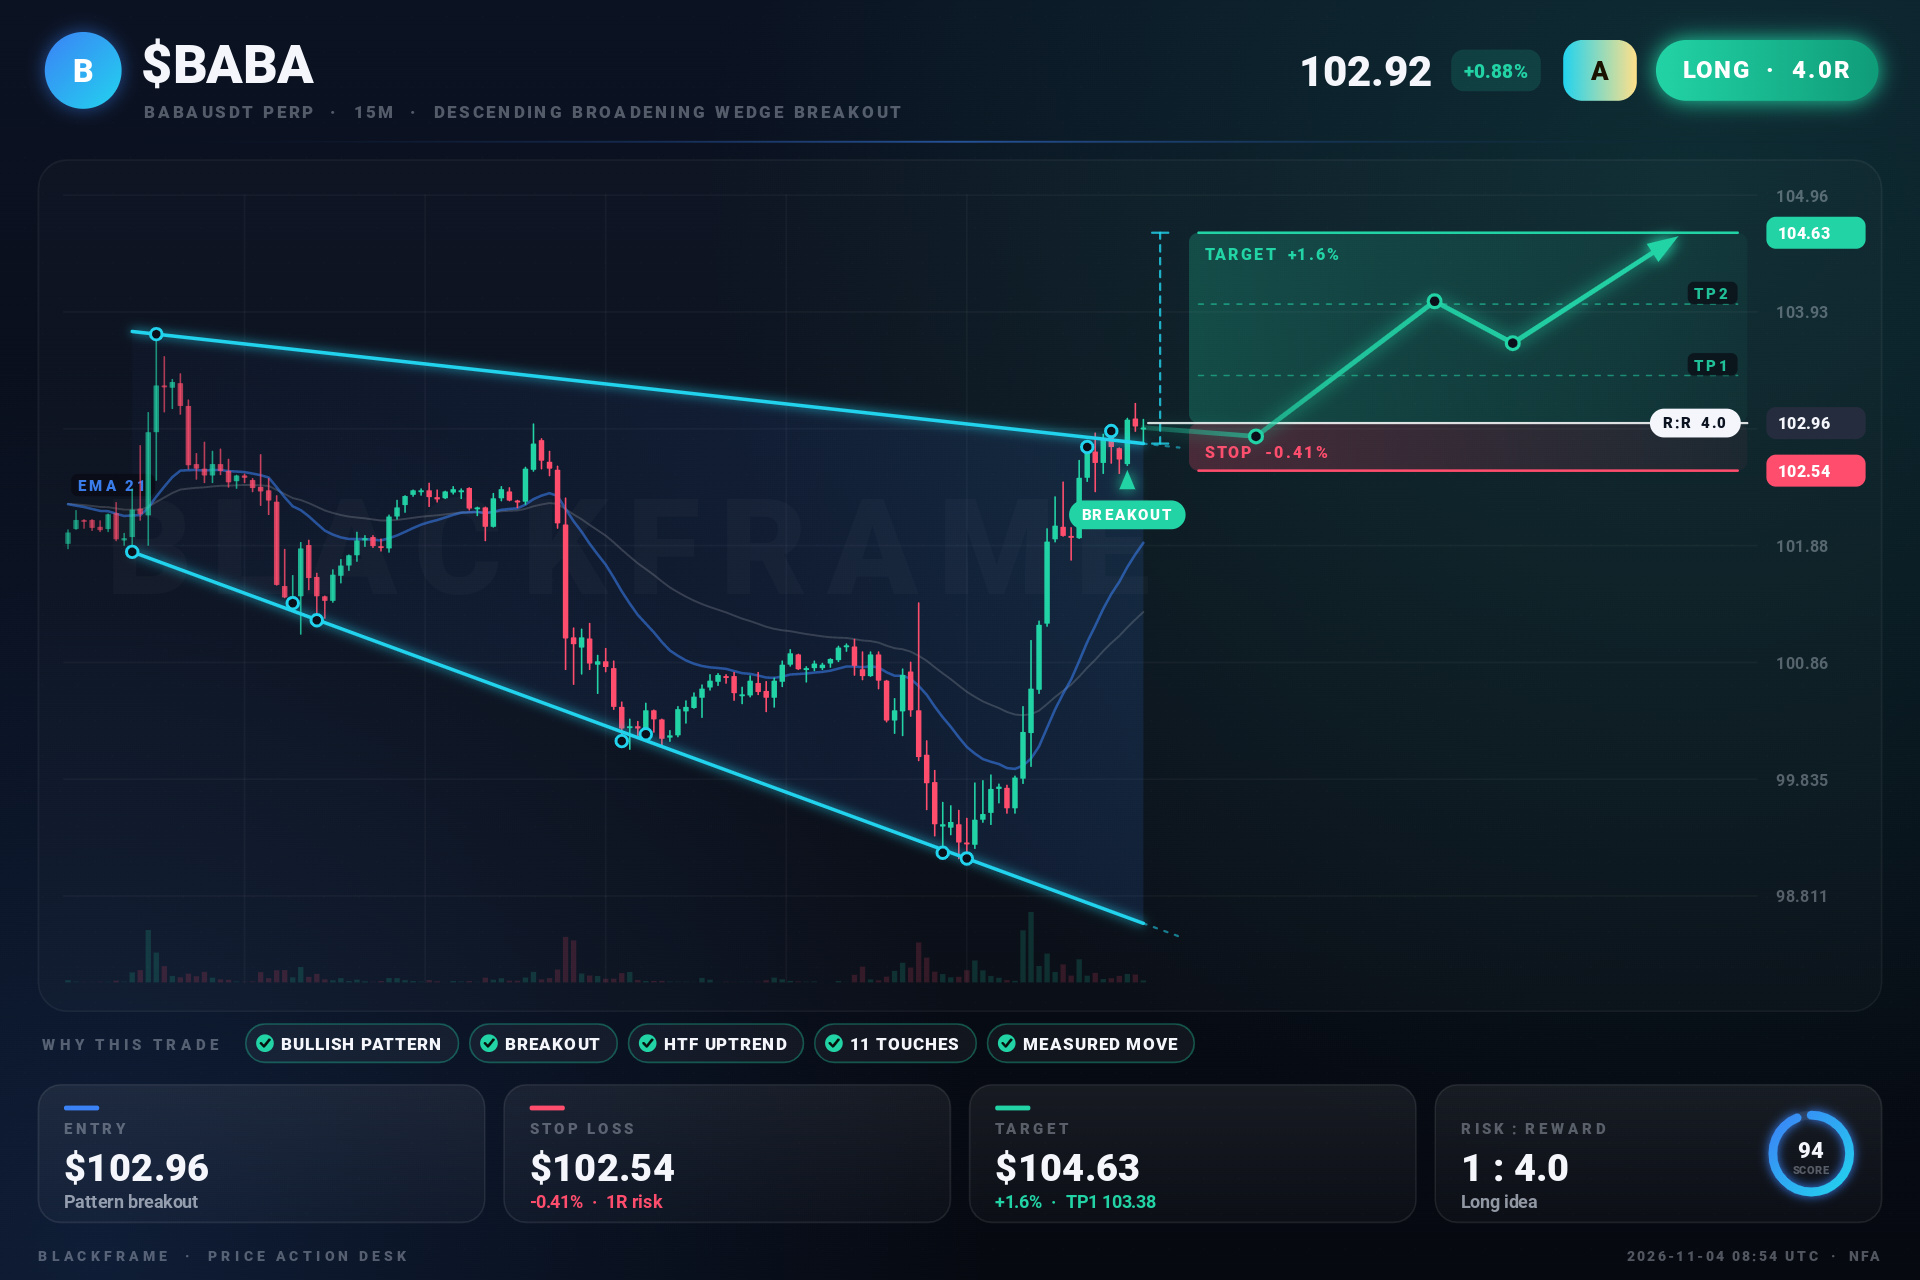
**$BABA LONG**
TP: $104.63
SL: $102.54
$102.78 is holding steady, a clean break feels natural.
Liquidity pools linger near $104.63-104.68, ready to snap.
Higher TF confirms bullish bias, the wedge is collapsing.
Momentum stretched, a quick pop could drive it higher.
👀 I’m watching this breakout, ready for the upside.
#BABA #Futures · NFA
**$BABA LONG**
TP: $104.63
SL: $102.54
$102.78 is holding steady, a clean break feels natural.
Liquidity pools linger near $104.63-104.68, ready to snap.
Higher TF confirms bullish bias, the wedge is collapsing.
Momentum stretched, a quick pop could drive it higher.
👀 I’m watching this breakout, ready for the upside.
#BABA #Futures · NFA
TP: $104.63
SL: $102.54
$102.78 is holding steady, a clean break feels natural.
Liquidity pools linger near $104.63-104.68, ready to snap.
Higher TF confirms bullish bias, the wedge is collapsing.
Momentum stretched, a quick pop could drive it higher.
👀 I’m watching this breakout, ready for the upside.
#BABA #Futures · NFA
1
117

·
--
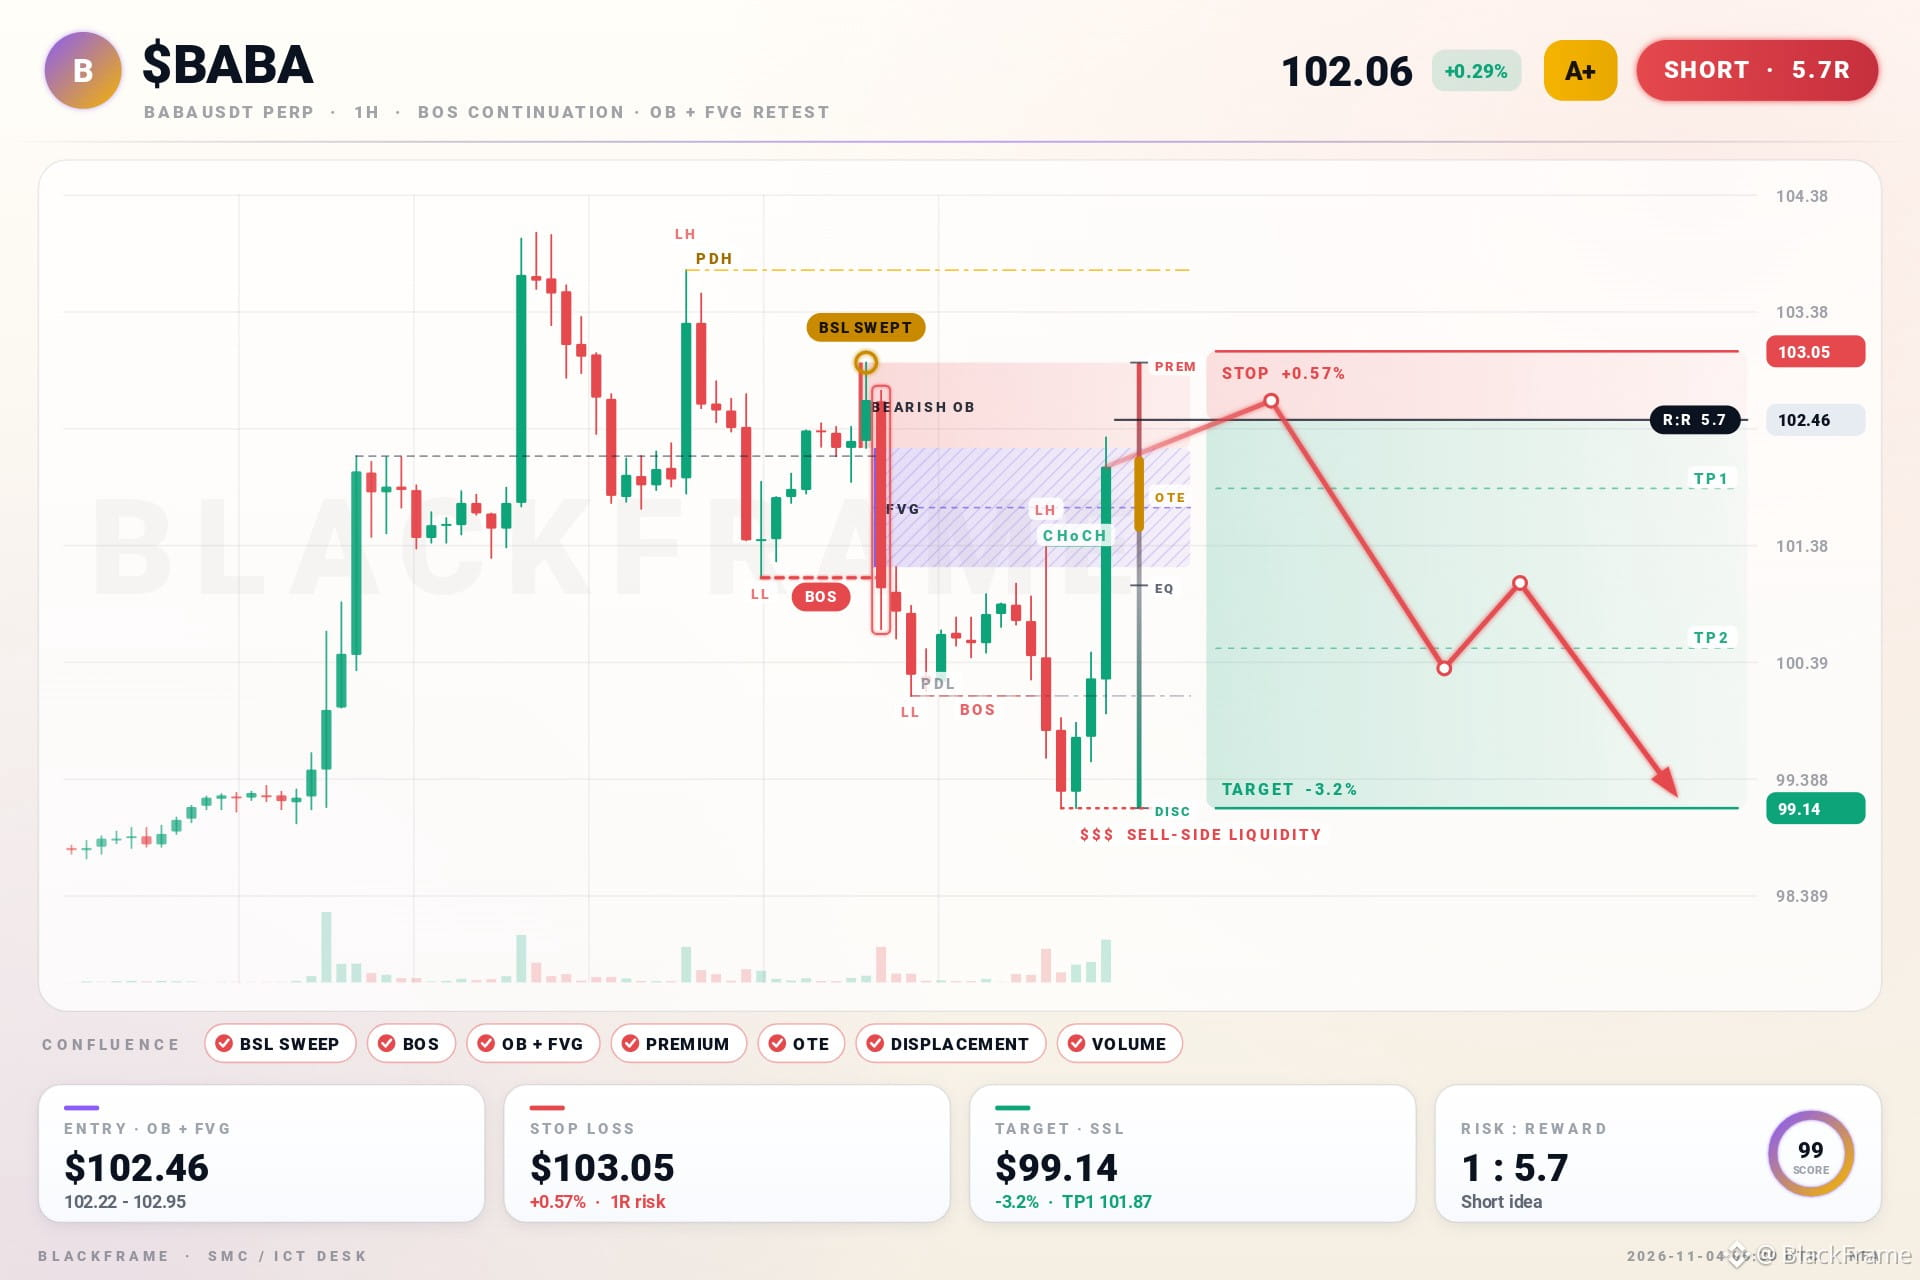
? Smart money clearing sell-side liquidity on $BABA 😈
BOS continuation on the 1H.
Entry $102.46 · SL $103.05 · TP $99.14
#BABA #TradingSignals · NFA
? Smart money clearing sell-side liquidity on $BABA 😈
BOS continuation on the 1H.
Entry $102.46 · SL $103.05 · TP $99.14
#BABA #TradingSignals · NFA
BOS continuation on the 1H.
Entry $102.46 · SL $103.05 · TP $99.14
#BABA #TradingSignals · NFA
92

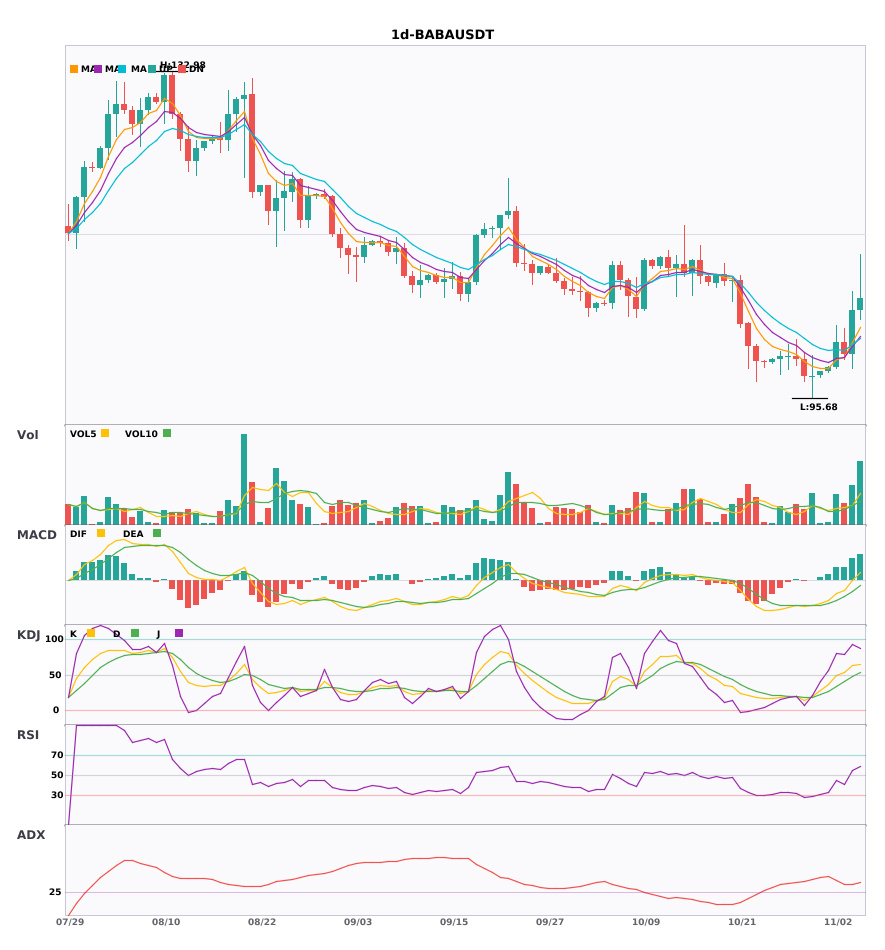
$BABA Daily chart turns bullish—has a short-term opportunity arrived?
📈 $BABA | Daily chart: bullish signal
━━━━━━━━━━━━━━━━━━
Technical analysis: ADX(38) indicates a clear trend | MACD DIF crosses above the zero line, signaling a bullish trend | EMA5 crosses above EMA8, signaling a short-term bullish trend | Volume increases (2.0x)
Price change: 4.9000%
━━━━━━━━━━━━━━━━━━
#技术分析 #BABA
📌 The above content is for reference only and does not constitute investment advice
$BABA Daily chart turns bullish—has a short-term opportunity arrived?
📈 $BABA | Daily chart: bullish signal
━━━━━━━━━━━━━━━━━━
Technical analysis: ADX(38) indicates a clear trend | MACD DIF crosses above the zero line, signaling a bullish trend | EMA5 crosses above EMA8, signaling a short-term bullish trend | Volume increases (2.0x)
Price change: 4.9000%
━━━━━━━━━━━━━━━━━━
#技术分析 #BABA
📌 The above content is for reference only and does not constitute investment advice
📈 $BABA | Daily chart: bullish signal
━━━━━━━━━━━━━━━━━━
Technical analysis: ADX(38) indicates a clear trend | MACD DIF crosses above the zero line, signaling a bullish trend | EMA5 crosses above EMA8, signaling a short-term bullish trend | Volume increases (2.0x)
Price change: 4.9000%
━━━━━━━━━━━━━━━━━━
#技术分析 #BABA
📌 The above content is for reference only and does not constitute investment advice

·
--
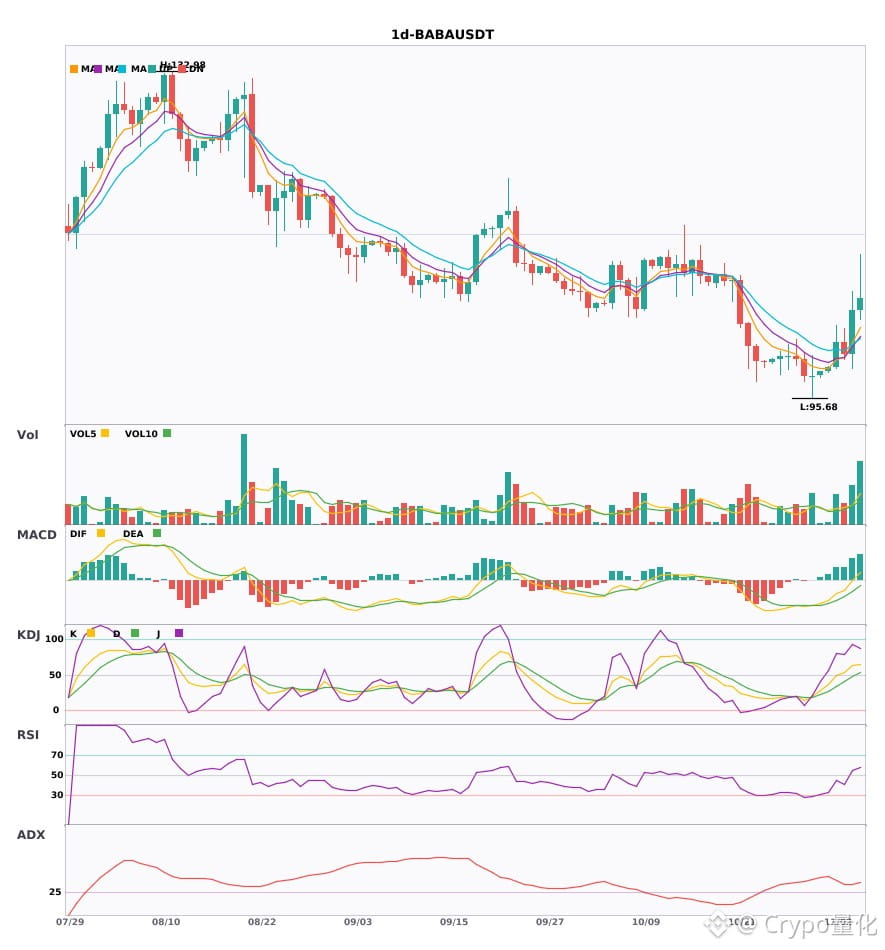
$BABA A bullish signal has appeared on the daily timeframe🔥
════════════════════
🔴 $BABA Daily bullish signal
⚠️Technical analysis: ADX(38) indicates a strong trending market | MACD DIF breaks above the zero line, turning the trend bullish | EMA5 crosses above EMA8, turning short-term momentum bullish | Volume increases (2.0x)
════════════════════
🔔 Follow for first-hand market updates 🔔
#技术分析 #BABA
📌 When trading, check whether the candlestick pattern confirms the signal
$BABA A bullish signal has appeared on the daily timeframe🔥
════════════════════
🔴 $BABA Daily bullish signal
⚠️Technical analysis: ADX(38) indicates a strong trending market | MACD DIF breaks above the zero line, turning the trend bullish | EMA5 crosses above EMA8, turning short-term momentum bullish | Volume increases (2.0x)
════════════════════
🔔 Follow for first-hand market updates 🔔
#技术分析 #BABA
📌 When trading, check whether the candlestick pattern confirms the signal
════════════════════
🔴 $BABA Daily bullish signal
⚠️Technical analysis: ADX(38) indicates a strong trending market | MACD DIF breaks above the zero line, turning the trend bullish | EMA5 crosses above EMA8, turning short-term momentum bullish | Volume increases (2.0x)
════════════════════
🔔 Follow for first-hand market updates 🔔
#技术分析 #BABA
📌 When trading, check whether the candlestick pattern confirms the signal
1
·
--
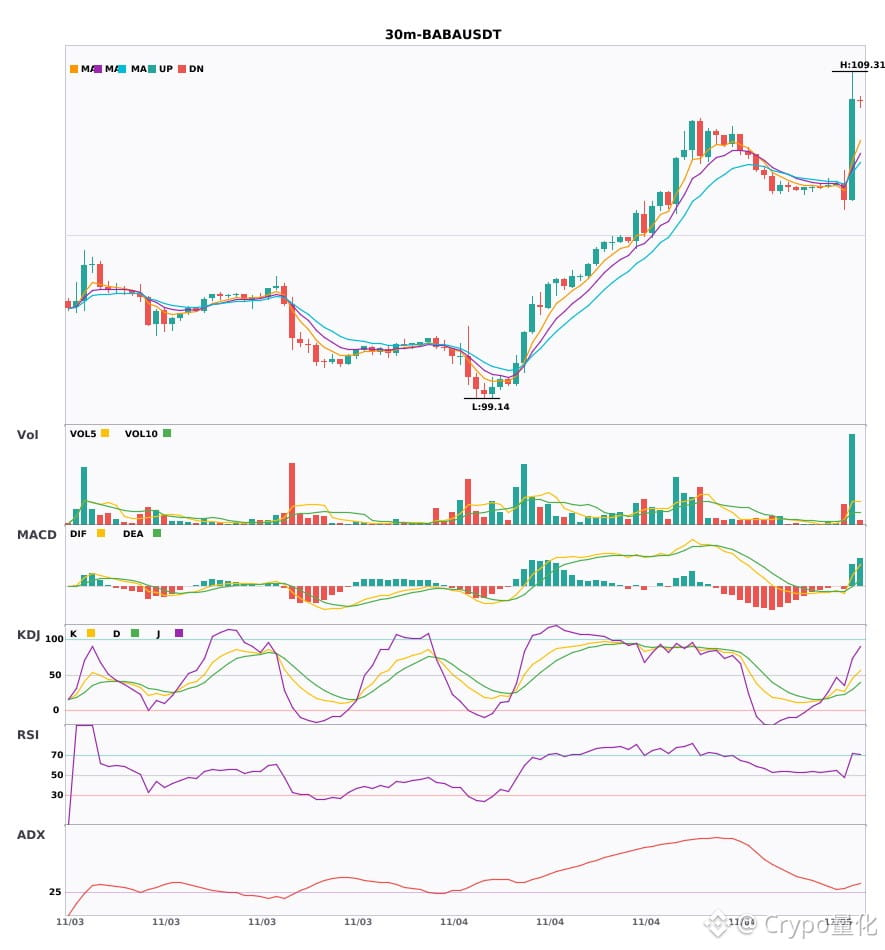
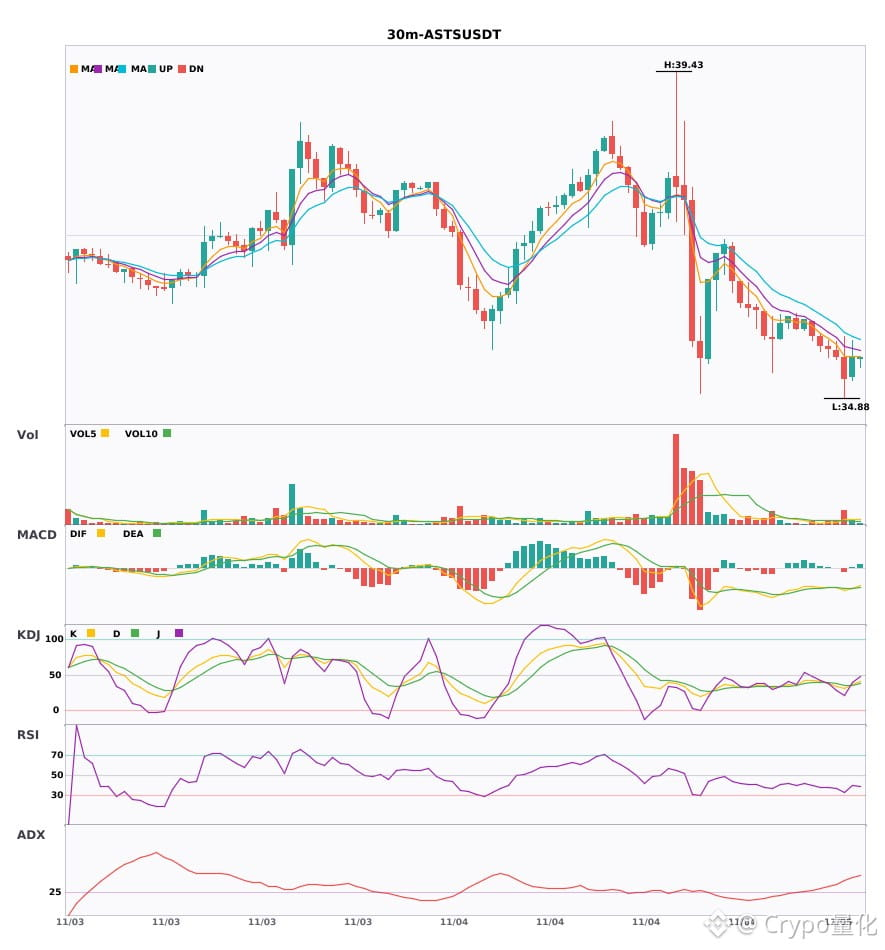
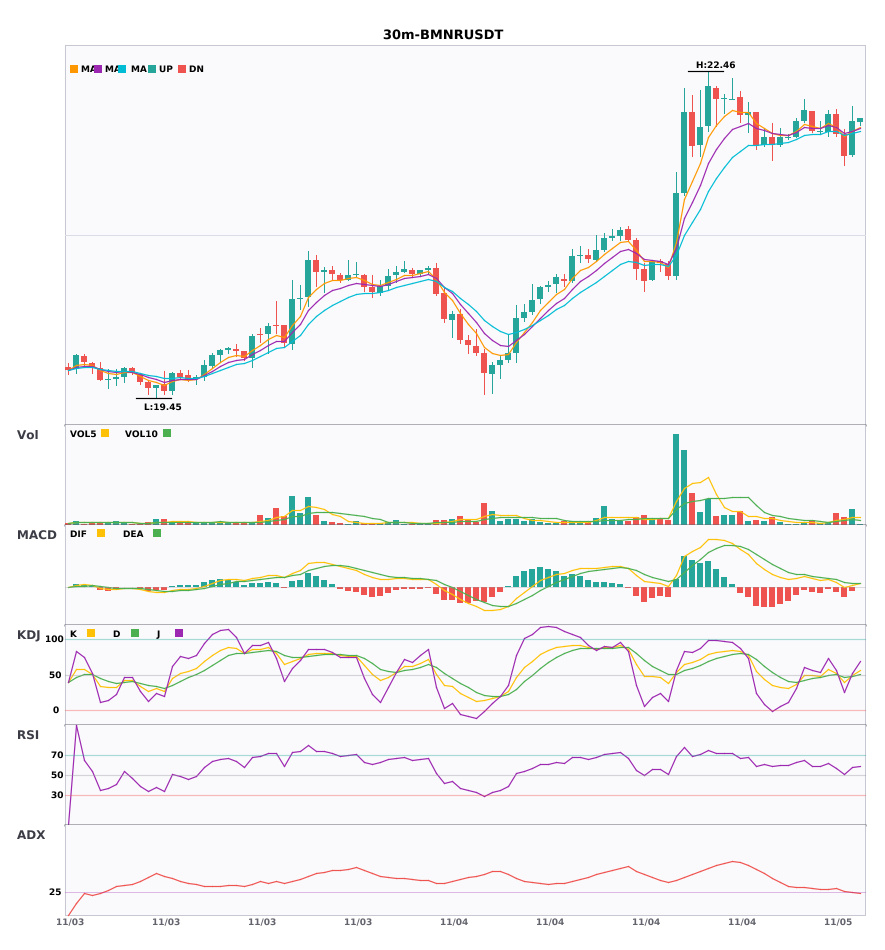
$BABA / $ASTS / $BMNR 30-minute technical indicators are weakening across the board; beware of risk🔥
════════════════════
🟢 $BABA 30-minute bearish signal
⚠️Technical analysis: ADX(31): clear trending market | MACD bearish crossover below zero, bearish momentum accelerating | EMA5 < EMA8 < EMA13, bearish alignment | KDJ moving weakly, bears in control (K: 27.3, D: 23.3) | Volume surge (4.6x)
════════════════════
🟢 $ASTS 30-minute bearish signal
⚠️Technical analysis: ADX(43): clear trending market | MACD bearish crossover below zero, bearish momentum accelerating | EMA5 < EMA8 < EMA13, bearish alignment | KDJ moving weakly, bears in control (K: 30.6, D: 35.2) | Volume surge (3.1x)
════════════════════
🟢 $BMNR 30-minute bearish signal
⚠️Technical analysis: ADX(25): trend is forming; opportunity to participate | MACD DIF has fallen below zero, trend turning bearish | EMA5 has crossed below EMA8, short-term outlook turning bearish | KDJ bearish crossover, short-term bearish outlook (K: 39.9, D: 47.1) | Volume surge (3.2x)
════════════════════
🔔 Follow for first-hand market alerts 🔔
#技术分析 #BABA #ASTS #BMNR
📌 When trading, check whether the candlestick pattern meets the criteria
$BABA / $ASTS / $BMNR 30-minute technical indicators are weakening across the board; beware of risk🔥
════════════════════
🟢 $BABA 30-minute bearish signal
⚠️Technical analysis: ADX(31): clear trending market | MACD bearish crossover below zero, bearish momentum accelerating | EMA5 < EMA8 < EMA13, bearish alignment | KDJ moving weakly, bears in control (K: 27.3, D: 23.3) | Volume surge (4.6x)
════════════════════
🟢 $ASTS 30-minute bearish signal
⚠️Technical analysis: ADX(43): clear trending market | MACD bearish crossover below zero, bearish momentum accelerating | EMA5 < EMA8 < EMA13, bearish alignment | KDJ moving weakly, bears in control (K: 30.6, D: 35.2) | Volume surge (3.1x)
════════════════════
🟢 $BMNR 30-minute bearish signal
⚠️Technical analysis: ADX(25): trend is forming; opportunity to participate | MACD DIF has fallen below zero, trend turning bearish | EMA5 has crossed below EMA8, short-term outlook turning bearish | KDJ bearish crossover, short-term bearish outlook (K: 39.9, D: 47.1) | Volume surge (3.2x)
════════════════════
🔔 Follow for first-hand market alerts 🔔
#技术分析 #BABA #ASTS #BMNR
📌 When trading, check whether the candlestick pattern meets the criteria
════════════════════
🟢 $BABA 30-minute bearish signal
⚠️Technical analysis: ADX(31): clear trending market | MACD bearish crossover below zero, bearish momentum accelerating | EMA5 < EMA8 < EMA13, bearish alignment | KDJ moving weakly, bears in control (K: 27.3, D: 23.3) | Volume surge (4.6x)
════════════════════
🟢 $ASTS 30-minute bearish signal
⚠️Technical analysis: ADX(43): clear trending market | MACD bearish crossover below zero, bearish momentum accelerating | EMA5 < EMA8 < EMA13, bearish alignment | KDJ moving weakly, bears in control (K: 30.6, D: 35.2) | Volume surge (3.1x)
════════════════════
🟢 $BMNR 30-minute bearish signal
⚠️Technical analysis: ADX(25): trend is forming; opportunity to participate | MACD DIF has fallen below zero, trend turning bearish | EMA5 has crossed below EMA8, short-term outlook turning bearish | KDJ bearish crossover, short-term bearish outlook (K: 39.9, D: 47.1) | Volume surge (3.2x)
════════════════════
🔔 Follow for first-hand market alerts 🔔
#技术分析 #BABA #ASTS #BMNR
📌 When trading, check whether the candlestick pattern meets the criteria
9

·
--
$BABA / Tokenized Stocks · Premium Monitoring
Token: BABAon | Underlying: BABA | Ratio: 1.00891
On-chain price: $106.78 (24h +5.37%)
Underlying U.S. stock: $105.84
Premium / Discount: -0.00% (vs. underlying fair value)
52-week range: $91.99 - $181.10
Number of holder addresses: 1404
Underlying status: regular
Why monitor the premium? Tokens trade 24/7, while the underlying U.S. stock is quoted only during U.S. market hours.
Premiums are most likely to widen when the market is closed—either due to on-chain buying pressure or expectations of redemptions / trading halts.
Unusual premium swings often reveal sentiment and arbitrage gaps earlier than the price itself.
Do you find premium monitoring more useful, or is watching the price enough? 👇
(The above is for informational purposes only and based on public data. Not investment advice. DYOR.)
#BABA
$BABA / Tokenized Stocks · Premium Monitoring
Token: BABAon | Underlying: BABA | Ratio: 1.00891
On-chain price: $106.78 (24h +5.37%)
Underlying U.S. stock: $105.84
Premium / Discount: -0.00% (vs. underlying fair value)
52-week range: $91.99 - $181.10
Number of holder addresses: 1404
Underlying status: regular
Why monitor the premium? Tokens trade 24/7, while the underlying U.S. stock is quoted only during U.S. market hours.
Premiums are most likely to widen when the market is closed—either due to on-chain buying pressure or expectations of redemptions / trading halts.
Unusual premium swings often reveal sentiment and arbitrage gaps earlier than the price itself.
Do you find premium monitoring more useful, or is watching the price enough? 👇
(The above is for informational purposes only and based on public data. Not investment advice. DYOR.)
#BABA
Token: BABAon | Underlying: BABA | Ratio: 1.00891
On-chain price: $106.78 (24h +5.37%)
Underlying U.S. stock: $105.84
Premium / Discount: -0.00% (vs. underlying fair value)
52-week range: $91.99 - $181.10
Number of holder addresses: 1404
Underlying status: regular
Why monitor the premium? Tokens trade 24/7, while the underlying U.S. stock is quoted only during U.S. market hours.
Premiums are most likely to widen when the market is closed—either due to on-chain buying pressure or expectations of redemptions / trading halts.
Unusual premium swings often reveal sentiment and arbitrage gaps earlier than the price itself.
Do you find premium monitoring more useful, or is watching the price enough? 👇
(The above is for informational purposes only and based on public data. Not investment advice. DYOR.)
#BABA
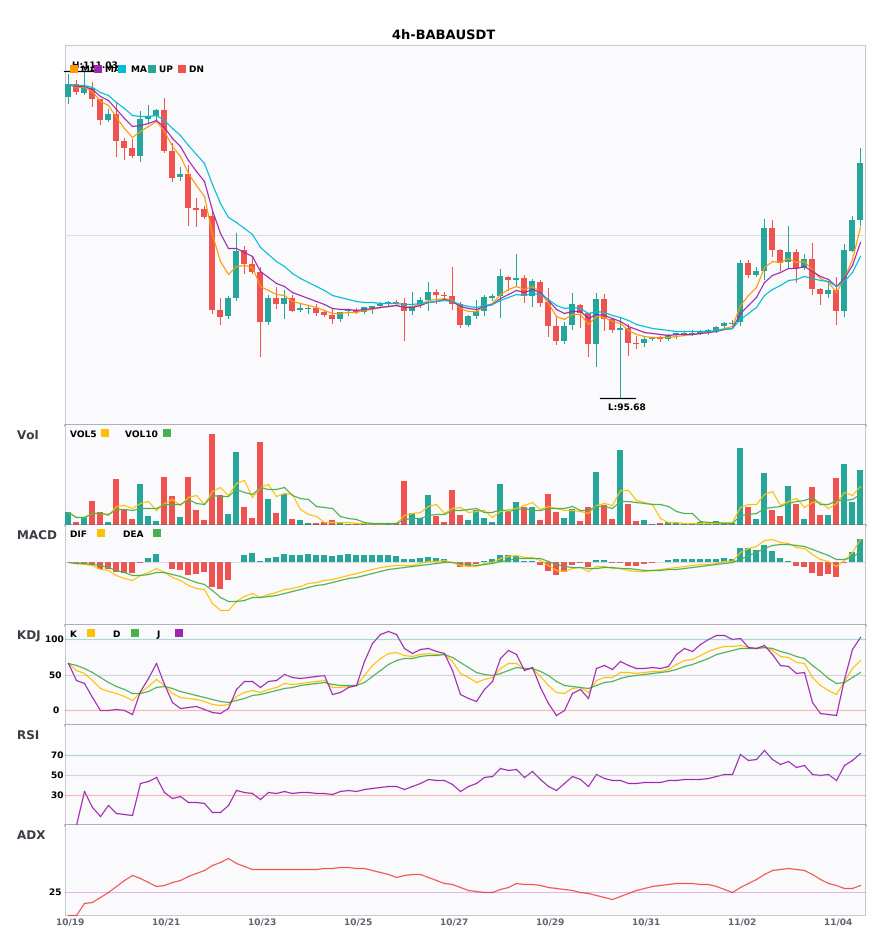
$BABA 4 Hourly bullish signal appears
📈 $BABA | 4-hour bullish signal
━━━━━━━━━━━━━━━━━━
Technical analysis: ADX(29) Trend is forming; participation is possible | MACD golden cross above zero, bullish momentum released | EMA5 > EMA8 > EMA13 bullish alignment | Volume increased (2.4x)
Price change: 1.3500%
━━━━━━━━━━━━━━━━━━
#技术分析 #BABA
📌 The above content is for reference only and does not constitute investment advice
$BABA 4 Hourly bullish signal appears
📈 $BABA | 4-hour bullish signal
━━━━━━━━━━━━━━━━━━
Technical analysis: ADX(29) Trend is forming; participation is possible | MACD golden cross above zero, bullish momentum released | EMA5 > EMA8 > EMA13 bullish alignment | Volume increased (2.4x)
Price change: 1.3500%
━━━━━━━━━━━━━━━━━━
#技术分析 #BABA
📌 The above content is for reference only and does not constitute investment advice
📈 $BABA | 4-hour bullish signal
━━━━━━━━━━━━━━━━━━
Technical analysis: ADX(29) Trend is forming; participation is possible | MACD golden cross above zero, bullish momentum released | EMA5 > EMA8 > EMA13 bullish alignment | Volume increased (2.4x)
Price change: 1.3500%
━━━━━━━━━━━━━━━━━━
#技术分析 #BABA
📌 The above content is for reference only and does not constitute investment advice
5
·
--
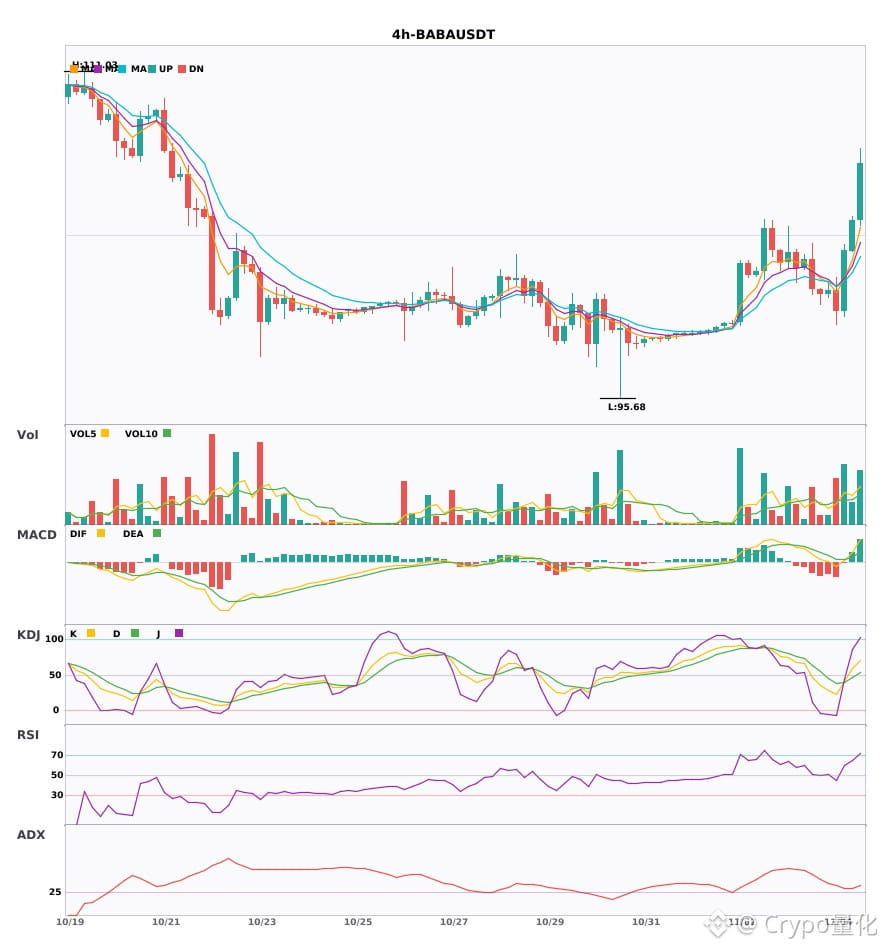
$BABA 4-hour technicals are turning bullish—has a short-term opportunity arrived? 🔥
════════════════════
🔴 $BABA 4-hour bullish signals
⚠️ Technicals: ADX (29): trend is forming, opportunity to participate | MACD golden cross above zero, bullish momentum building | EMA5 > EMA8 > EMA13: bullish alignment | Volume up (2.4x)
════════════════════
🔔 Follow for first-hand market alerts 🔔
#技术分析 #BABA
📌 When trading, check whether the candlestick pattern meets the criteria
$BABA 4-hour technicals are turning bullish—has a short-term opportunity arrived? 🔥
════════════════════
🔴 $BABA 4-hour bullish signals
⚠️ Technicals: ADX (29): trend is forming, opportunity to participate | MACD golden cross above zero, bullish momentum building | EMA5 > EMA8 > EMA13: bullish alignment | Volume up (2.4x)
════════════════════
🔔 Follow for first-hand market alerts 🔔
#技术分析 #BABA
📌 When trading, check whether the candlestick pattern meets the criteria
════════════════════
🔴 $BABA 4-hour bullish signals
⚠️ Technicals: ADX (29): trend is forming, opportunity to participate | MACD golden cross above zero, bullish momentum building | EMA5 > EMA8 > EMA13: bullish alignment | Volume up (2.4x)
════════════════════
🔔 Follow for first-hand market alerts 🔔
#技术分析 #BABA
📌 When trading, check whether the candlestick pattern meets the criteria
6
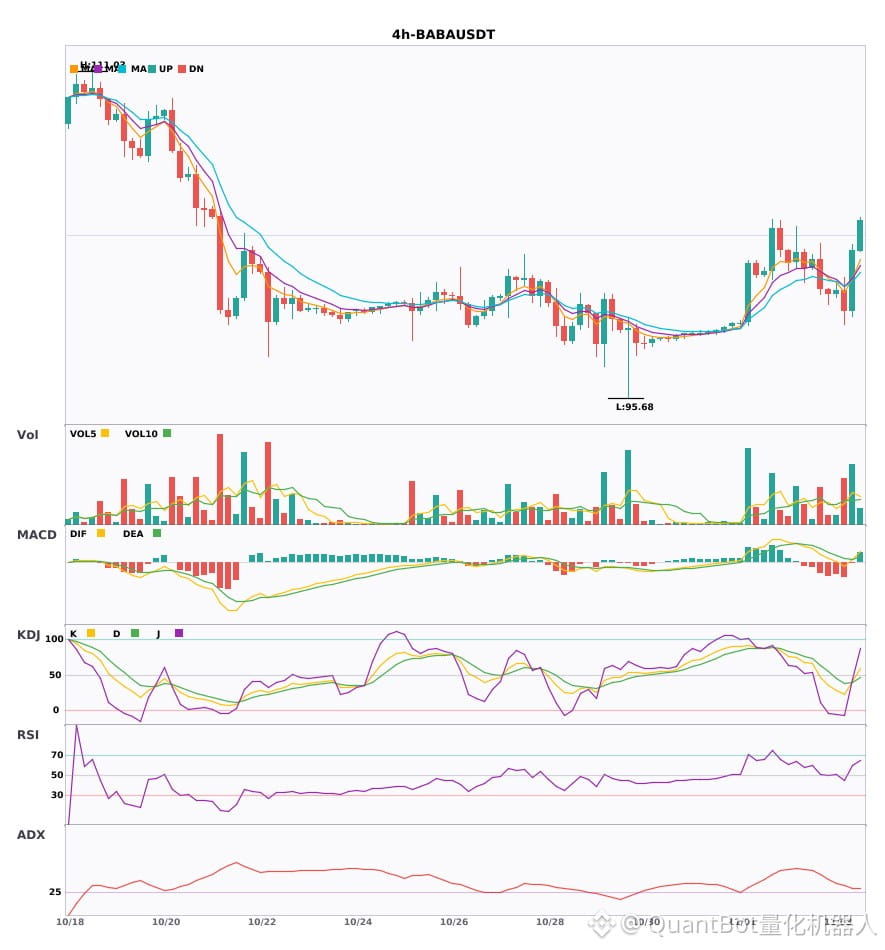
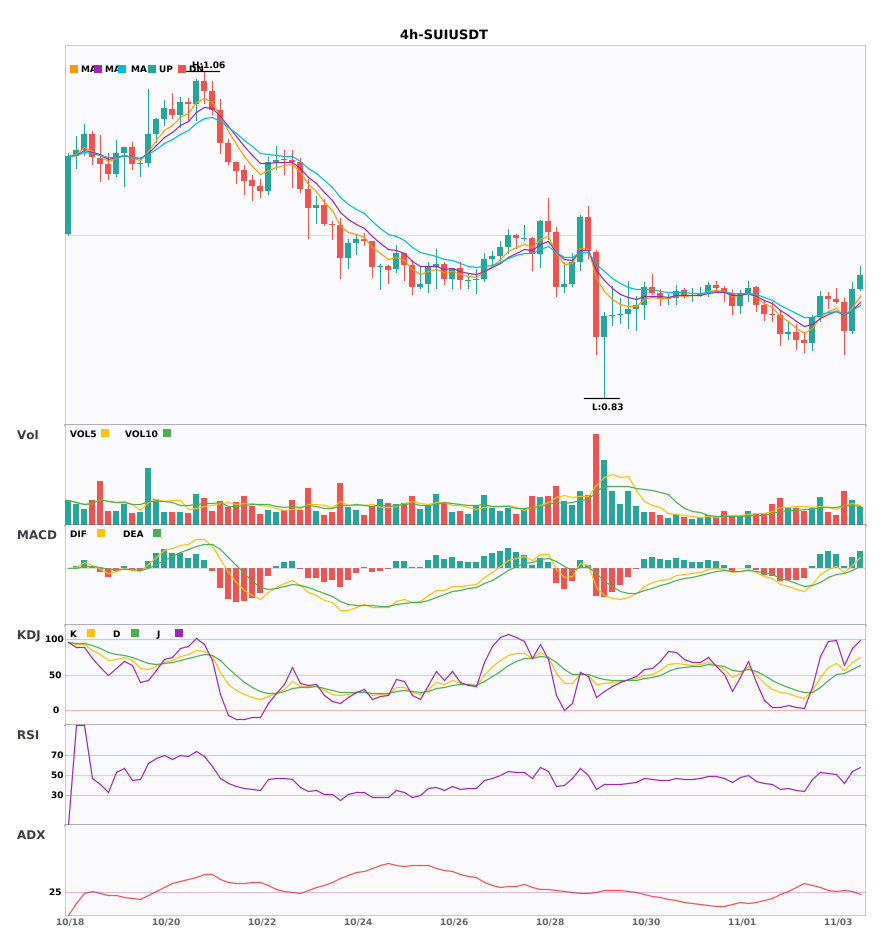
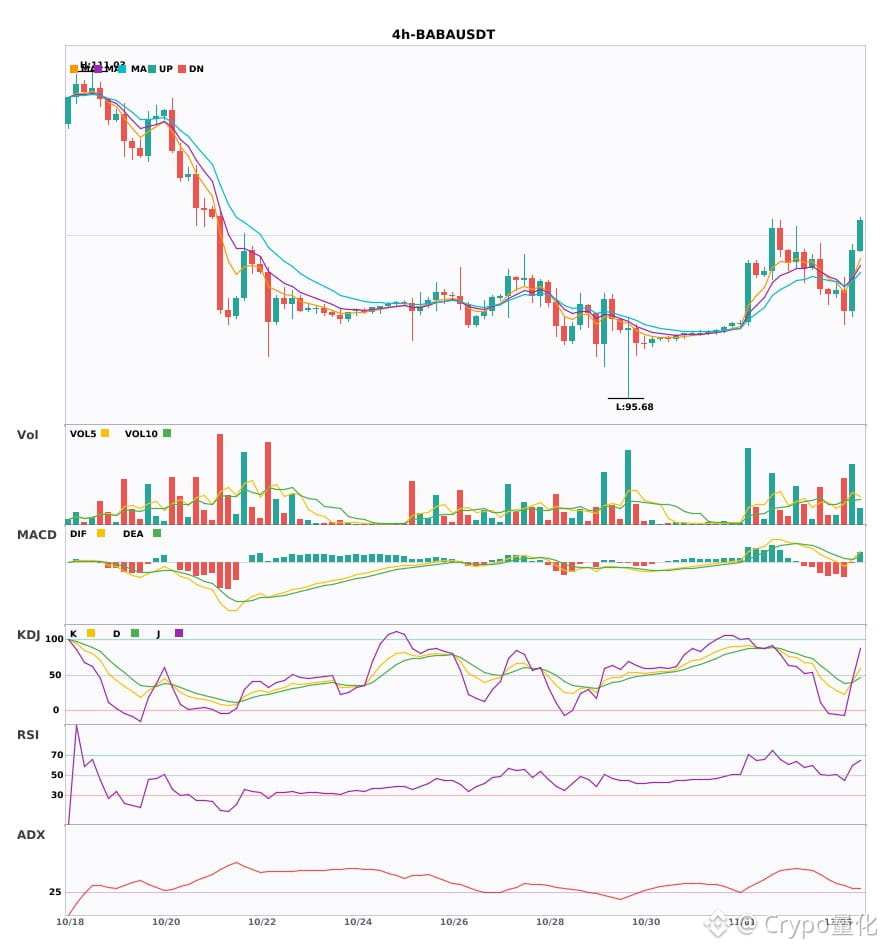
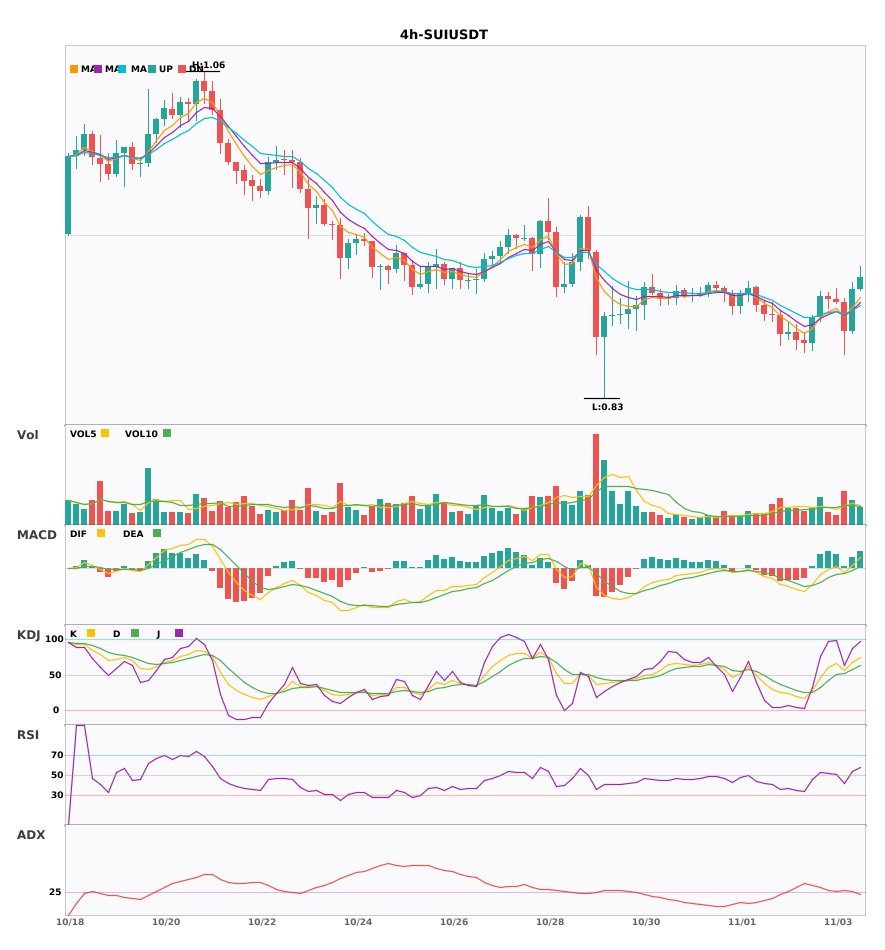
$BABA / $SUI 4-hour technical signals are strengthening. Which has greater breakout potential?
📈 $BABA | 4-hour bullish signal
━━━━━━━━━━━━━━━━━━
Technical analysis: ADX(30) Trend is forming; participation is possible | MACDDIF breaks above the zero line; trend turns bullish | EMA5 crosses above EMA8; short-term trend turns bullish | KDJ golden cross; short-term outlook is bullish (K is 40.9, D is 39.2) | Volume increases (2.4x)
Price change: 2.9000%
📈 $SUI | 4-hour bullish signal
━━━━━━━━━━━━━━━━━━
Technical analysis: ADX(29) Trend is forming; participation is possible | MACDDIF breaks above the zero line; trend turns bullish | EMA5 crosses above EMA8; short-term trend turns bullish | KDJ is running strongly; bulls have the upper hand (K is 67.3, D is 57.1) | Volume increases (1.7x)
Price change: 3.3200%
━━━━━━━━━━━━━━━━━━
#技术分析 #BABA #SUI
📌 The above content is for reference only and does not constitute investment advice
$BABA / $SUI 4-hour technical signals are strengthening. Which has greater breakout potential?
📈 $BABA | 4-hour bullish signal
━━━━━━━━━━━━━━━━━━
Technical analysis: ADX(30) Trend is forming; participation is possible | MACDDIF breaks above the zero line; trend turns bullish | EMA5 crosses above EMA8; short-term trend turns bullish | KDJ golden cross; short-term outlook is bullish (K is 40.9, D is 39.2) | Volume increases (2.4x)
Price change: 2.9000%
📈 $SUI | 4-hour bullish signal
━━━━━━━━━━━━━━━━━━
Technical analysis: ADX(29) Trend is forming; participation is possible | MACDDIF breaks above the zero line; trend turns bullish | EMA5 crosses above EMA8; short-term trend turns bullish | KDJ is running strongly; bulls have the upper hand (K is 67.3, D is 57.1) | Volume increases (1.7x)
Price change: 3.3200%
━━━━━━━━━━━━━━━━━━
#技术分析 #BABA #SUI
📌 The above content is for reference only and does not constitute investment advice
📈 $BABA | 4-hour bullish signal
━━━━━━━━━━━━━━━━━━
Technical analysis: ADX(30) Trend is forming; participation is possible | MACDDIF breaks above the zero line; trend turns bullish | EMA5 crosses above EMA8; short-term trend turns bullish | KDJ golden cross; short-term outlook is bullish (K is 40.9, D is 39.2) | Volume increases (2.4x)
Price change: 2.9000%
📈 $SUI | 4-hour bullish signal
━━━━━━━━━━━━━━━━━━
Technical analysis: ADX(29) Trend is forming; participation is possible | MACDDIF breaks above the zero line; trend turns bullish | EMA5 crosses above EMA8; short-term trend turns bullish | KDJ is running strongly; bulls have the upper hand (K is 67.3, D is 57.1) | Volume increases (1.7x)
Price change: 3.3200%
━━━━━━━━━━━━━━━━━━
#技术分析 #BABA #SUI
📌 The above content is for reference only and does not constitute investment advice
13
·
--
Two 4-hour bullish signals appeared at the same time: $BABA / $SUI🔥
════════════════════
🔴 $BABA 4-hour bullish signal
⚠️Technical analysis: ADX(30) Trend is forming; opportunity to participate | MACD DIF breaks above zero, trend turns bullish | EMA5 crosses above EMA8, short-term trend turns bullish | KDJ golden cross, short-term outlook bullish (K is 40.9, D is 39.2) | Volume increases (2.4x)
════════════════════
🔴 $SUI 4-hour bullish signal
⚠️Technical analysis: ADX(29) Trend is forming; opportunity to participate | MACD DIF breaks above zero, trend turns bullish | EMA5 crosses above EMA8, short-term trend turns bullish | KDJ running strong, bulls have the advantage (K is 67.3, D is 57.1) | Volume increases (1.7x)
════════════════════
🔔 Follow to get first-hand market alerts 🔔
#技术分析 #BABA #SUI
📌 When trading, pay attention to whether the candlestick pattern aligns
Two 4-hour bullish signals appeared at the same time: $BABA / $SUI 🔥
════════════════════
🔴 $BABA 4-hour bullish signal
⚠️Technical analysis: ADX(30) Trend is forming; opportunity to participate | MACD DIF breaks above zero, trend turns bullish | EMA5 crosses above EMA8, short-term trend turns bullish | KDJ golden cross, short-term outlook bullish (K is 40.9, D is 39.2) | Volume increases (2.4x)
════════════════════
🔴 $SUI 4-hour bullish signal
⚠️Technical analysis: ADX(29) Trend is forming; opportunity to participate | MACD DIF breaks above zero, trend turns bullish | EMA5 crosses above EMA8, short-term trend turns bullish | KDJ running strong, bulls have the advantage (K is 67.3, D is 57.1) | Volume increases (1.7x)
════════════════════
🔔 Follow to get first-hand market alerts 🔔
#技术分析 #BABA #SUI
📌 When trading, pay attention to whether the candlestick pattern aligns
════════════════════
🔴 $BABA 4-hour bullish signal
⚠️Technical analysis: ADX(30) Trend is forming; opportunity to participate | MACD DIF breaks above zero, trend turns bullish | EMA5 crosses above EMA8, short-term trend turns bullish | KDJ golden cross, short-term outlook bullish (K is 40.9, D is 39.2) | Volume increases (2.4x)
════════════════════
🔴 $SUI 4-hour bullish signal
⚠️Technical analysis: ADX(29) Trend is forming; opportunity to participate | MACD DIF breaks above zero, trend turns bullish | EMA5 crosses above EMA8, short-term trend turns bullish | KDJ running strong, bulls have the advantage (K is 67.3, D is 57.1) | Volume increases (1.7x)
════════════════════
🔔 Follow to get first-hand market alerts 🔔
#技术分析 #BABA #SUI
📌 When trading, pay attention to whether the candlestick pattern aligns
7


·
--
Bullish
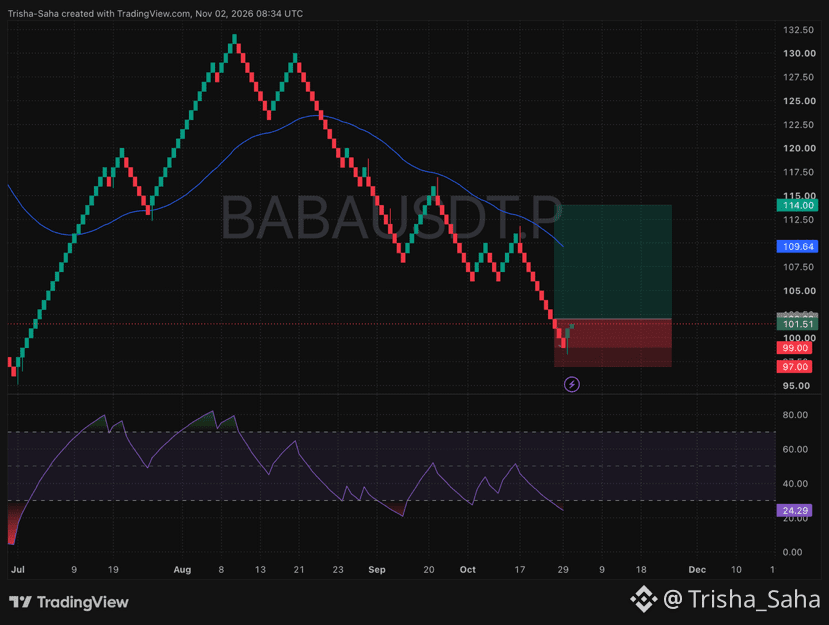
🦾 $BABA Sell-Off Just Hit a Brick Wall — Big Reversal Firing Up! 🧨
📍 Trade Setup:
• Entry Zone: $101 – $102
• Stop Loss: $97
• Target: $114
📡 Chart Analysis:
• Sellers got completely shut down right at the $99.00 floor, and two fresh green candles have already pushed the price back above $101.51.
• The bottom momentum indicator is dipped deep at 24.29, proving the selling pressure is exhausted and a sharp bounce is ready.
• Reclaiming the blue moving average line at $109.64 opens a wide, clear runway straight up to the $114.00 target.
🛡️ Protect your capital early by moving your Stop Loss up to Break-Even as soon as this trade hits +3% to +4% in profit.
I've already locked in my entry. Are you riding this bounce up with me? Drop a comment below! 👇
#BABA #BABAUSDT #CryptoTrading #BinanceSquare
{future}(BABAUSDT)
🦾 $BABA Sell-Off Just Hit a Brick Wall — Big Reversal Firing Up! 🧨
📍 Trade Setup:
• Entry Zone: $101 – $102
• Stop Loss: $97
• Target: $114
📡 Chart Analysis:
• Sellers got completely shut down right at the $99.00 floor, and two fresh green candles have already pushed the price back above $101.51.
• The bottom momentum indicator is dipped deep at 24.29, proving the selling pressure is exhausted and a sharp bounce is ready.
• Reclaiming the blue moving average line at $109.64 opens a wide, clear runway straight up to the $114.00 target.
🛡️ Protect your capital early by moving your Stop Loss up to Break-Even as soon as this trade hits +3% to +4% in profit.
I've already locked in my entry. Are you riding this bounce up with me? Drop a comment below! 👇
#BABA #BABAUSDT #CryptoTrading #BinanceSquare
📍 Trade Setup:
• Entry Zone: $101 – $102
• Stop Loss: $97
• Target: $114
📡 Chart Analysis:
• Sellers got completely shut down right at the $99.00 floor, and two fresh green candles have already pushed the price back above $101.51.
• The bottom momentum indicator is dipped deep at 24.29, proving the selling pressure is exhausted and a sharp bounce is ready.
• Reclaiming the blue moving average line at $109.64 opens a wide, clear runway straight up to the $114.00 target.
🛡️ Protect your capital early by moving your Stop Loss up to Break-Even as soon as this trade hits +3% to +4% in profit.
I've already locked in my entry. Are you riding this bounce up with me? Drop a comment below! 👇
#BABA #BABAUSDT #CryptoTrading #BinanceSquare
192
·
--
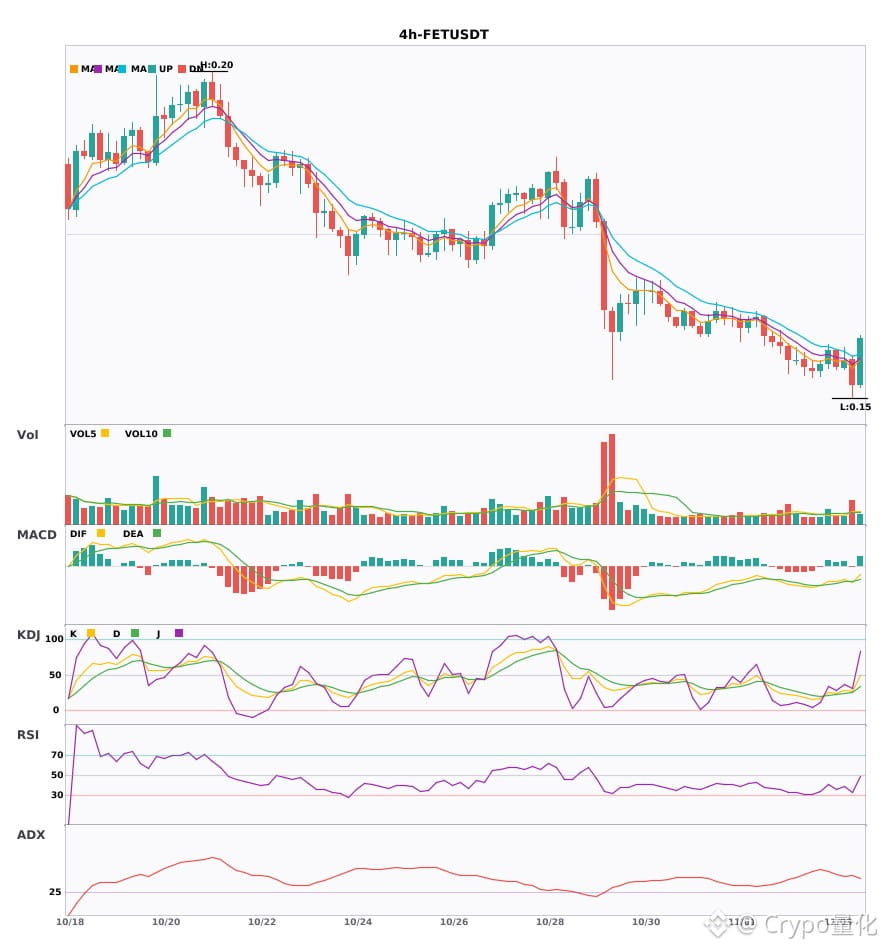
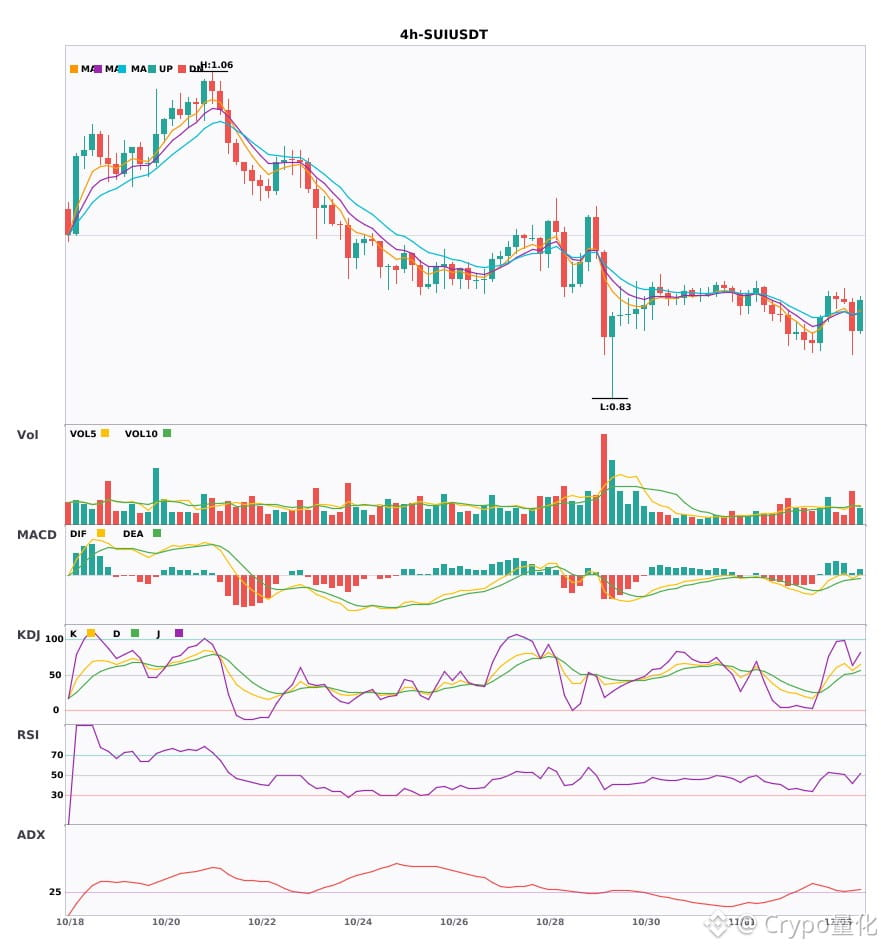
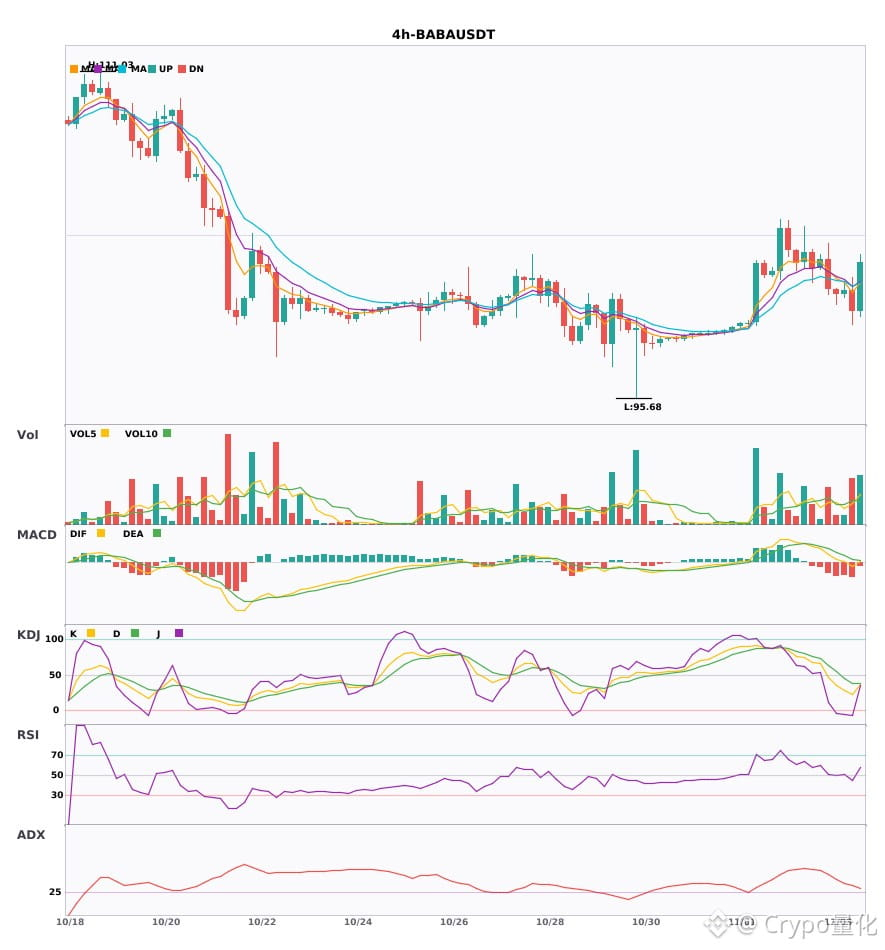
$FET / $SUI / $BABA 4-hour timeframe bearish, under short-term pressure 🔥
════════════════════
🟢 $FET 4-hour bearish signal
⚠️Technical analysis: ADX(44) indicates a clear trending market | MACD bearish crossover below zero, bearish momentum accelerating | EMA5 < EMA8 < EMA13, bearish alignment | KDJ moving weakly, bears in control (K: 27.1, D: 25.5) | Volume increased (1.9x)
════════════════════
🟢 $SUI 4-hour bearish signal
⚠️Technical analysis: ADX(31) indicates a clear trending market | MACD DIF fell below the zero line, trend turning bearish | EMA5 crossed below EMA8, short-term outlook turning bearish | KDJ moving strongly, bulls in control (K: 55.8, D: 52.0) | Volume increased (1.7x)
════════════════════
🟢 $BABA 4-hour bearish signal
⚠️Technical analysis: ADX(34) indicates a clear trending market | MACD DIF fell below the zero line, trend turning bearish | EMA5 < EMA8 < EMA13, bearish alignment | KDJ moving weakly, bears in control (K: 23.3, D: 38.3) | Volume increased (1.9x)
════════════════════
🔔 Follow for first-hand market updates 🔔
#技术分析 #FET #SUI #BABA
📌 When trading, pay attention to whether the candlestick pattern confirms the signal
$FET / $SUI / $BABA 4-hour timeframe bearish, under short-term pressure 🔥
════════════════════
🟢 $FET 4-hour bearish signal
⚠️Technical analysis: ADX(44) indicates a clear trending market | MACD bearish crossover below zero, bearish momentum accelerating | EMA5 < EMA8 < EMA13, bearish alignment | KDJ moving weakly, bears in control (K: 27.1, D: 25.5) | Volume increased (1.9x)
════════════════════
🟢 $SUI 4-hour bearish signal
⚠️Technical analysis: ADX(31) indicates a clear trending market | MACD DIF fell below the zero line, trend turning bearish | EMA5 crossed below EMA8, short-term outlook turning bearish | KDJ moving strongly, bulls in control (K: 55.8, D: 52.0) | Volume increased (1.7x)
════════════════════
🟢 $BABA 4-hour bearish signal
⚠️Technical analysis: ADX(34) indicates a clear trending market | MACD DIF fell below the zero line, trend turning bearish | EMA5 < EMA8 < EMA13, bearish alignment | KDJ moving weakly, bears in control (K: 23.3, D: 38.3) | Volume increased (1.9x)
════════════════════
🔔 Follow for first-hand market updates 🔔
#技术分析 #FET #SUI #BABA
📌 When trading, pay attention to whether the candlestick pattern confirms the signal
════════════════════
🟢 $FET 4-hour bearish signal
⚠️Technical analysis: ADX(44) indicates a clear trending market | MACD bearish crossover below zero, bearish momentum accelerating | EMA5 < EMA8 < EMA13, bearish alignment | KDJ moving weakly, bears in control (K: 27.1, D: 25.5) | Volume increased (1.9x)
════════════════════
🟢 $SUI 4-hour bearish signal
⚠️Technical analysis: ADX(31) indicates a clear trending market | MACD DIF fell below the zero line, trend turning bearish | EMA5 crossed below EMA8, short-term outlook turning bearish | KDJ moving strongly, bulls in control (K: 55.8, D: 52.0) | Volume increased (1.7x)
════════════════════
🟢 $BABA 4-hour bearish signal
⚠️Technical analysis: ADX(34) indicates a clear trending market | MACD DIF fell below the zero line, trend turning bearish | EMA5 < EMA8 < EMA13, bearish alignment | KDJ moving weakly, bears in control (K: 23.3, D: 38.3) | Volume increased (1.9x)
════════════════════
🔔 Follow for first-hand market updates 🔔
#技术分析 #FET #SUI #BABA
📌 When trading, pay attention to whether the candlestick pattern confirms the signal
16

·
--
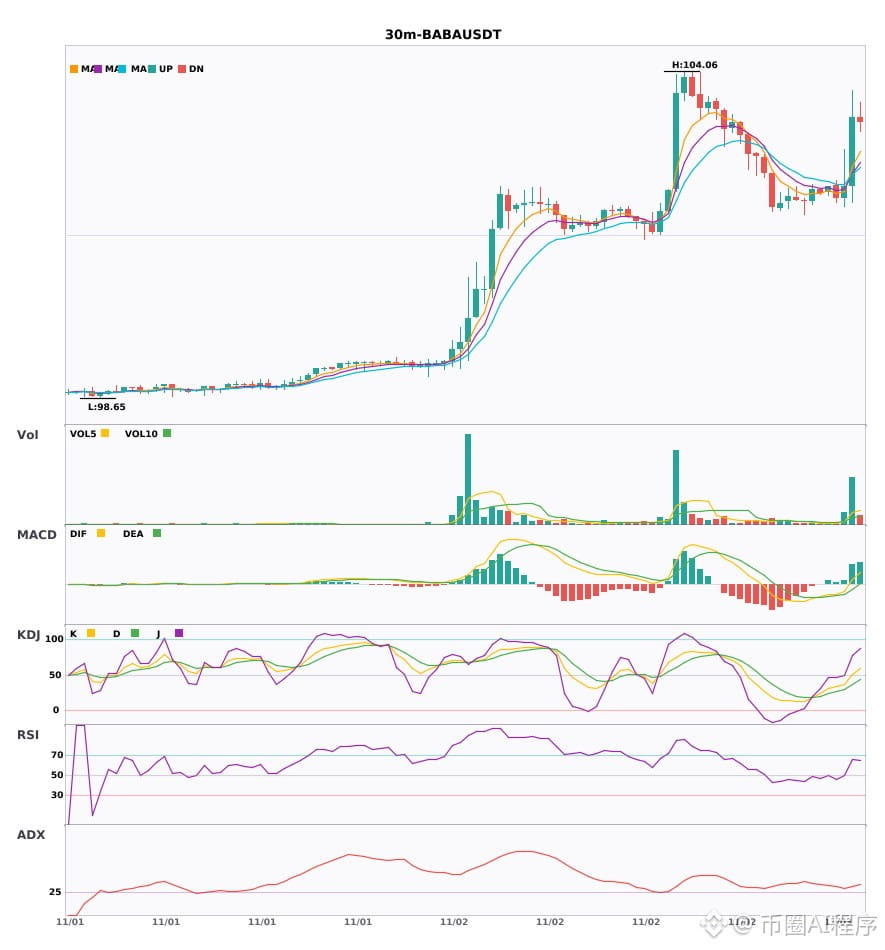
$BABA 30-minute convergence with 4-hour bullish momentum—has a short-term opportunity arrived? 🔥
════════════════════
🔴 $BABA 30-minute bullish signal
⚠️Technical analysis: 4-hour bullish convergence confirmed | 30-minute entry: MACD DIF breaks above the zero line, signaling a bullish trend | EMA5 crosses above EMA8, turning bullish in the short term | Volume surge (6.4x)
════════════════════
🔔 Follow for first-hand market updates 🔔
#多周期共振 #BABA
📌 When trading, check whether the candlestick pattern confirms the signal
$BABA 30-minute convergence with 4-hour bullish momentum—has a short-term opportunity arrived? 🔥
════════════════════
🔴 $BABA 30-minute bullish signal
⚠️Technical analysis: 4-hour bullish convergence confirmed | 30-minute entry: MACD DIF breaks above the zero line, signaling a bullish trend | EMA5 crosses above EMA8, turning bullish in the short term | Volume surge (6.4x)
════════════════════
🔔 Follow for first-hand market updates 🔔
#多周期共振 #BABA
📌 When trading, check whether the candlestick pattern confirms the signal
════════════════════
🔴 $BABA 30-minute bullish signal
⚠️Technical analysis: 4-hour bullish convergence confirmed | 30-minute entry: MACD DIF breaks above the zero line, signaling a bullish trend | EMA5 crosses above EMA8, turning bullish in the short term | Volume surge (6.4x)
════════════════════
🔔 Follow for first-hand market updates 🔔
#多周期共振 #BABA
📌 When trading, check whether the candlestick pattern confirms the signal
3
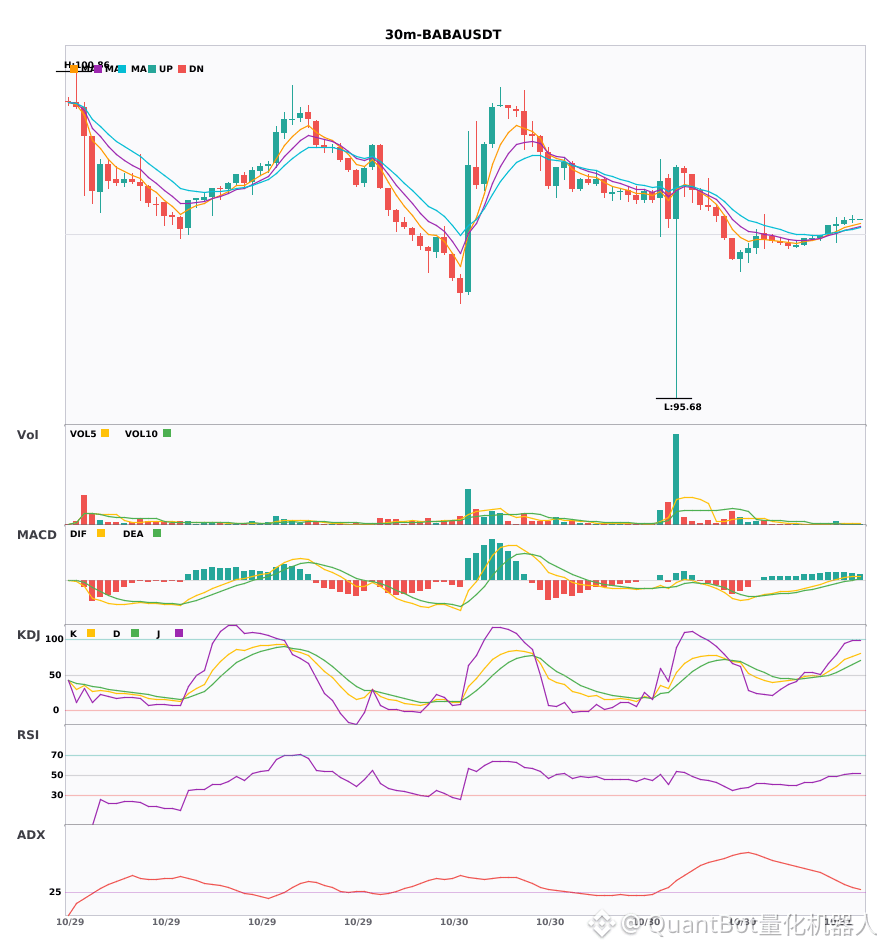
$BABA 30-minute timeframe bullish, key indicators confirm
📈 $BABA | 30-minute bullish signal
━━━━━━━━━━━━━━━━━━
Technical analysis: ADX (31) indicates a clear trending market | MACD is bullish, with a strong trend but weakening momentum | EMA5 > EMA8 > EMA13, bullish alignment | KDJ is strong, with bulls in control (K: 71.4, D: 59.8) | Volume surge (3.5x)
Price change: 0.0700%
━━━━━━━━━━━━━━━━━━
#技术分析 #BABA
📌 The above is for reference only and does not constitute investment advice
$BABA 30-minute timeframe bullish, key indicators confirm
📈 $BABA | 30-minute bullish signal
━━━━━━━━━━━━━━━━━━
Technical analysis: ADX (31) indicates a clear trending market | MACD is bullish, with a strong trend but weakening momentum | EMA5 > EMA8 > EMA13, bullish alignment | KDJ is strong, with bulls in control (K: 71.4, D: 59.8) | Volume surge (3.5x)
Price change: 0.0700%
━━━━━━━━━━━━━━━━━━
#技术分析 #BABA
📌 The above is for reference only and does not constitute investment advice
📈 $BABA | 30-minute bullish signal
━━━━━━━━━━━━━━━━━━
Technical analysis: ADX (31) indicates a clear trending market | MACD is bullish, with a strong trend but weakening momentum | EMA5 > EMA8 > EMA13, bullish alignment | KDJ is strong, with bulls in control (K: 71.4, D: 59.8) | Volume surge (3.5x)
Price change: 0.0700%
━━━━━━━━━━━━━━━━━━
#技术分析 #BABA
📌 The above is for reference only and does not constitute investment advice
15
·
--
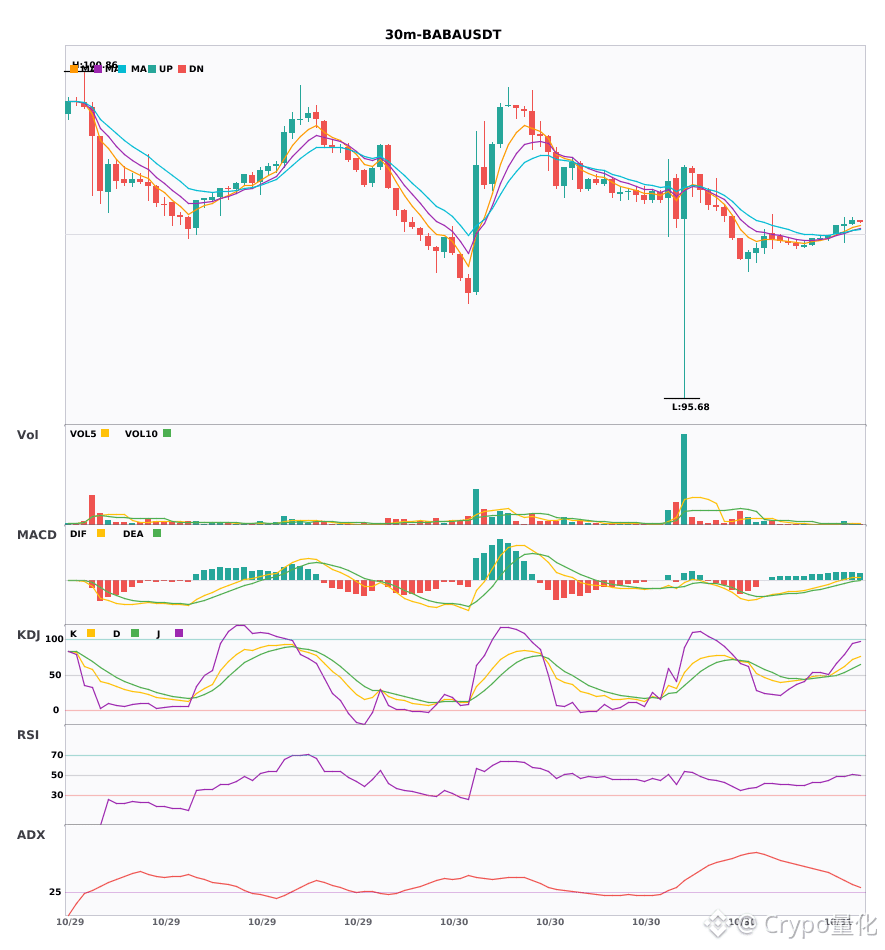
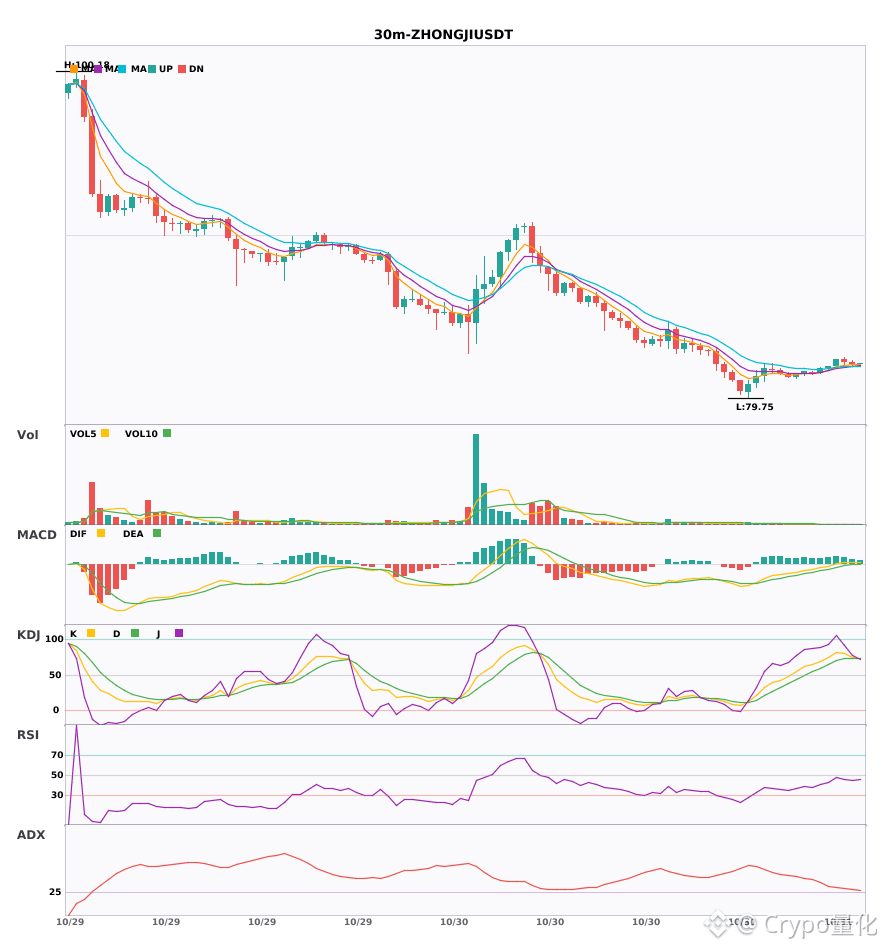
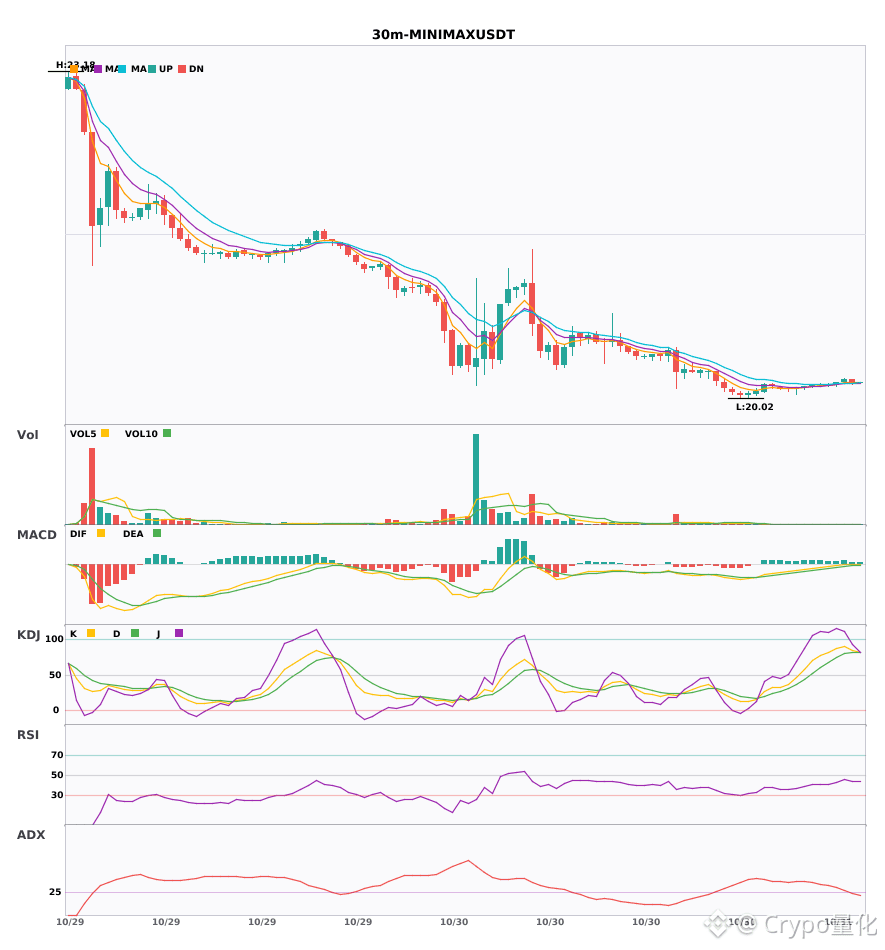
$BABA / $ZHONGJI / $MINIMAX 30-minute technical indicators are strengthening in sync—which has greater explosive potential? 🔥
════════════════════
🔴 $BABA 30-minute Bullish Signal
⚠️Technical analysis: ADX(31) Clear trending market | MACD bullish, trend is strong, momentum is weakening | EMA5 > EMA8 > EMA13 bullish alignment | KDJ strong, bulls have the upper hand (K: 71.4, D: 59.8) | Volume surge (3.5x)
════════════════════
🔴 $ZHONGJI 30-minute Bullish Signal
⚠️Technical analysis: ADX(28) Trend is forming; entry is possible | MACD bullish, trend is strong, momentum is weakening | EMA5 > EMA8 > EMA13 bullish alignment | KDJ strong, bulls have the upper hand (K: 74.9, D: 73.8) | Volume increase (2.1x)
════════════════════
🔴 $MINIMAX 30-minute Bullish Signal
⚠️Technical analysis: ADX(27) Trend is forming; entry is possible | MACD DIF breaks above the zero line, trend turns bullish | Moving averages are converging and building momentum; a directional move is imminent | KDJ strong, bulls have the upper hand (K: 89.8, D: 79.4) | Volume surge (3.1x)
════════════════════
🔔 Follow for first-hand market alerts 🔔
#技术分析 #BABA #ZHONGJI #MINIMAX
📌 When trading, pay attention to whether the candlestick patterns are aligned
$BABA / $ZHONGJI / $MINIMAX 30-minute technical indicators are strengthening in sync—which has greater explosive potential? 🔥
════════════════════
🔴 $BABA 30-minute Bullish Signal
⚠️Technical analysis: ADX(31) Clear trending market | MACD bullish, trend is strong, momentum is weakening | EMA5 > EMA8 > EMA13 bullish alignment | KDJ strong, bulls have the upper hand (K: 71.4, D: 59.8) | Volume surge (3.5x)
════════════════════
🔴 $ZHONGJI 30-minute Bullish Signal
⚠️Technical analysis: ADX(28) Trend is forming; entry is possible | MACD bullish, trend is strong, momentum is weakening | EMA5 > EMA8 > EMA13 bullish alignment | KDJ strong, bulls have the upper hand (K: 74.9, D: 73.8) | Volume increase (2.1x)
════════════════════
🔴 $MINIMAX 30-minute Bullish Signal
⚠️Technical analysis: ADX(27) Trend is forming; entry is possible | MACD DIF breaks above the zero line, trend turns bullish | Moving averages are converging and building momentum; a directional move is imminent | KDJ strong, bulls have the upper hand (K: 89.8, D: 79.4) | Volume surge (3.1x)
════════════════════
🔔 Follow for first-hand market alerts 🔔
#技术分析 #BABA #ZHONGJI #MINIMAX
📌 When trading, pay attention to whether the candlestick patterns are aligned
════════════════════
🔴 $BABA 30-minute Bullish Signal
⚠️Technical analysis: ADX(31) Clear trending market | MACD bullish, trend is strong, momentum is weakening | EMA5 > EMA8 > EMA13 bullish alignment | KDJ strong, bulls have the upper hand (K: 71.4, D: 59.8) | Volume surge (3.5x)
════════════════════
🔴 $ZHONGJI 30-minute Bullish Signal
⚠️Technical analysis: ADX(28) Trend is forming; entry is possible | MACD bullish, trend is strong, momentum is weakening | EMA5 > EMA8 > EMA13 bullish alignment | KDJ strong, bulls have the upper hand (K: 74.9, D: 73.8) | Volume increase (2.1x)
════════════════════
🔴 $MINIMAX 30-minute Bullish Signal
⚠️Technical analysis: ADX(27) Trend is forming; entry is possible | MACD DIF breaks above the zero line, trend turns bullish | Moving averages are converging and building momentum; a directional move is imminent | KDJ strong, bulls have the upper hand (K: 89.8, D: 79.4) | Volume surge (3.1x)
════════════════════
🔔 Follow for first-hand market alerts 🔔
#技术分析 #BABA #ZHONGJI #MINIMAX
📌 When trading, pay attention to whether the candlestick patterns are aligned
11
·
--
$RLC / $UNITREE / $BABA 3 30-minute confluence turns bullish, with bullish signals appearing simultaneously 🔥
════════════════════
🔴 $RLC 30-minute bullish signal
⚠️Technical analysis: ADX(50) indicates a very strong trend (beware of an overheated pullback) | MACD DIF breaks above zero, turning the trend bullish | Moving averages converge and build momentum, with a directional move imminent | KDJ remains strong, with bulls in control (K=65.9, D=52.7) | Volume increases (2.1x)
════════════════════
🔴 $UNITREE 30-minute bullish signal
⚠️Technical analysis: ADX(43) indicates a clear trending market | MACD golden cross above zero, releasing bullish momentum | EMA5 crosses above EMA8, turning bullish in the short term | KDJ golden cross, bullish short-term outlook (K=36.9, D=30.5) | Volume surges (2.9x)
════════════════════
🔴 $BABA 3 30-minute bullish signal
⚠️Technical analysis: ADX(43) indicates a clear trending market | MACD DIF breaks above zero, turning the trend bullish | EMA5 > EMA8 > EMA13, bullish alignment | Volume increases (1.8x)
════════════════════
🔔 Follow for first-hand market movement alerts 🔔
#技术分析 #RLC #UNITREE #BABA
📌 When trading, check whether the candlestick pattern confirms
$RLC / $UNITREE / $BABA 3 30-minute confluence turns bullish, with bullish signals appearing simultaneously 🔥
════════════════════
🔴 $RLC 30-minute bullish signal
⚠️Technical analysis: ADX(50) indicates a very strong trend (beware of an overheated pullback) | MACD DIF breaks above zero, turning the trend bullish | Moving averages converge and build momentum, with a directional move imminent | KDJ remains strong, with bulls in control (K=65.9, D=52.7) | Volume increases (2.1x)
════════════════════
🔴 $UNITREE 30-minute bullish signal
⚠️Technical analysis: ADX(43) indicates a clear trending market | MACD golden cross above zero, releasing bullish momentum | EMA5 crosses above EMA8, turning bullish in the short term | KDJ golden cross, bullish short-term outlook (K=36.9, D=30.5) | Volume surges (2.9x)
════════════════════
🔴 $BABA 3 30-minute bullish signal
⚠️Technical analysis: ADX(43) indicates a clear trending market | MACD DIF breaks above zero, turning the trend bullish | EMA5 > EMA8 > EMA13, bullish alignment | Volume increases (1.8x)
════════════════════
🔔 Follow for first-hand market movement alerts 🔔
#技术分析 #RLC #UNITREE #BABA
📌 When trading, check whether the candlestick pattern confirms
════════════════════
🔴 $RLC 30-minute bullish signal
⚠️Technical analysis: ADX(50) indicates a very strong trend (beware of an overheated pullback) | MACD DIF breaks above zero, turning the trend bullish | Moving averages converge and build momentum, with a directional move imminent | KDJ remains strong, with bulls in control (K=65.9, D=52.7) | Volume increases (2.1x)
════════════════════
🔴 $UNITREE 30-minute bullish signal
⚠️Technical analysis: ADX(43) indicates a clear trending market | MACD golden cross above zero, releasing bullish momentum | EMA5 crosses above EMA8, turning bullish in the short term | KDJ golden cross, bullish short-term outlook (K=36.9, D=30.5) | Volume surges (2.9x)
════════════════════
🔴 $BABA 3 30-minute bullish signal
⚠️Technical analysis: ADX(43) indicates a clear trending market | MACD DIF breaks above zero, turning the trend bullish | EMA5 > EMA8 > EMA13, bullish alignment | Volume increases (1.8x)
════════════════════
🔔 Follow for first-hand market movement alerts 🔔
#技术分析 #RLC #UNITREE #BABA
📌 When trading, check whether the candlestick pattern confirms


10

The Tight Range Holding #BABA While Traders Wait for Direction❕
BABA is consolidating between key support at $98.50 (EMA cluster) and resistance at $103.40, with a mild bearish tilt on the 1-hour structure. Secondary support sits at the $96.20 swing low, while the next major supply zone rests near $106.80.
{spot}(BABABUSDT)
Buyers are looking to accumulate near $98.50 on volume stabilization; sellers favor trimming into the $103.40 zone. A decisive 1-hour close above $103.40 would be required to shift the bias higher, while a daily break below $96.20 would invalidate the current range thesis.
$BABAB $BABA #CoinVahini #BABA #TechnicalAnalysis #StockTrading
The Tight Range Holding #BABA While Traders Wait for Direction❕
BABA is consolidating between key support at $98.50 (EMA cluster) and resistance at $103.40, with a mild bearish tilt on the 1-hour structure. Secondary support sits at the $96.20 swing low, while the next major supply zone rests near $106.80.
Buyers are looking to accumulate near $98.50 on volume stabilization; sellers favor trimming into the $103.40 zone. A decisive 1-hour close above $103.40 would be required to shift the bias higher, while a daily break below $96.20 would invalidate the current range thesis.
$BABAB $BABA #CoinVahini #BABA #TechnicalAnalysis #StockTrading
BABA is consolidating between key support at $98.50 (EMA cluster) and resistance at $103.40, with a mild bearish tilt on the 1-hour structure. Secondary support sits at the $96.20 swing low, while the next major supply zone rests near $106.80.
Buyers are looking to accumulate near $98.50 on volume stabilization; sellers favor trimming into the $103.40 zone. A decisive 1-hour close above $103.40 would be required to shift the bias higher, while a daily break below $96.20 would invalidate the current range thesis.
$BABAB $BABA #CoinVahini #BABA #TechnicalAnalysis #StockTrading
7
·
--
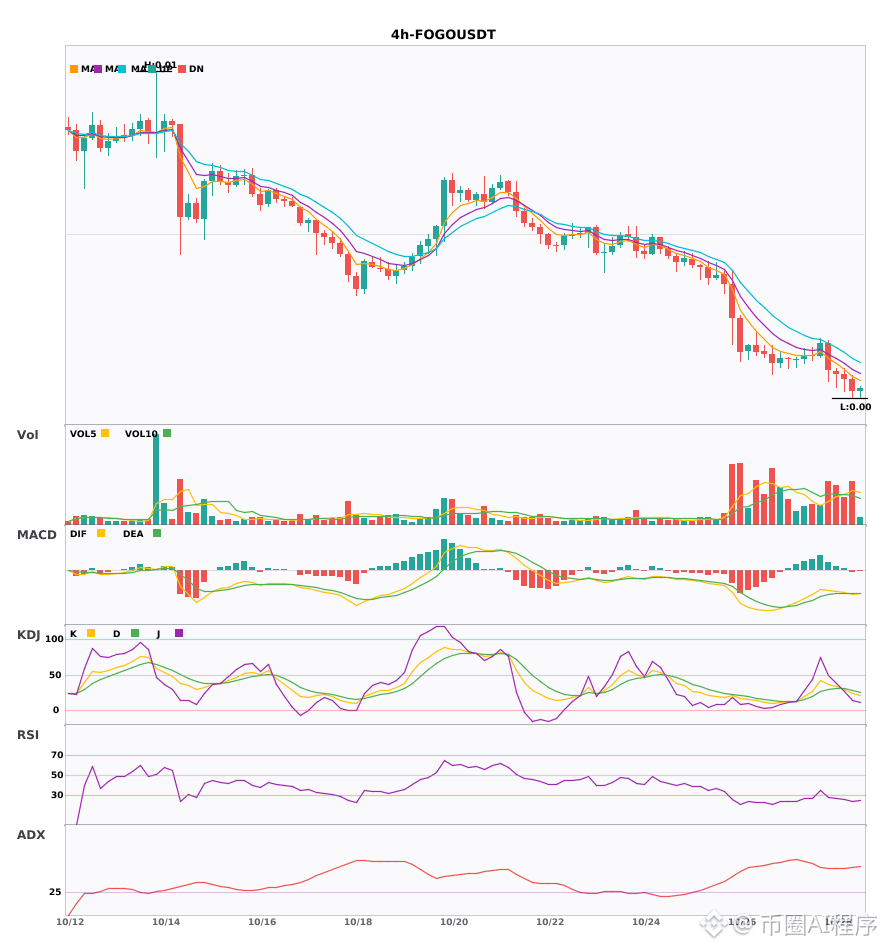
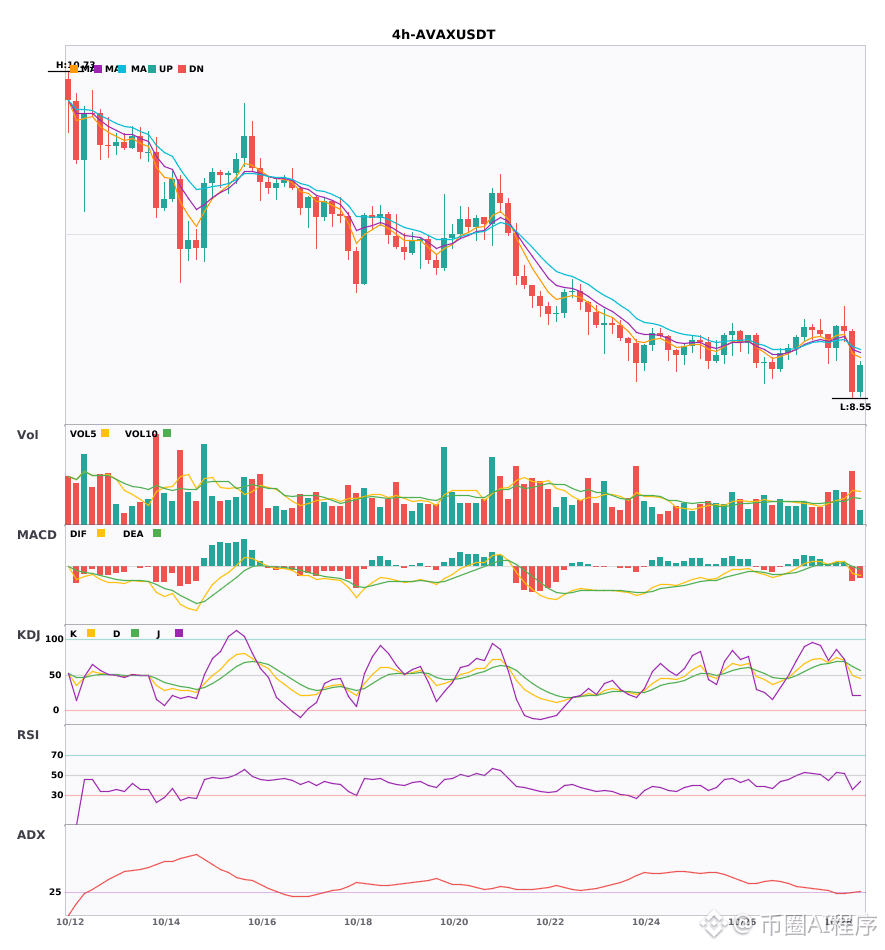
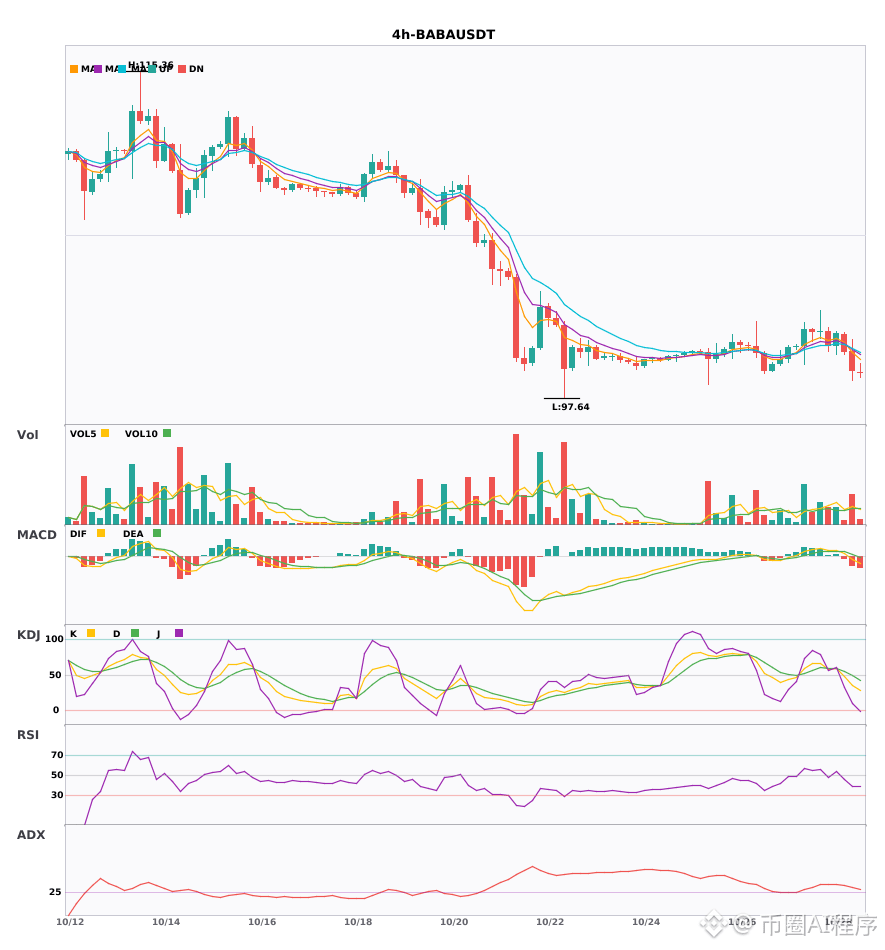
$FOGO / $AVAX / $BABA 4-hour bearish signals, daily bearish trend confirmed 🔥
════════════════════
🟢 $FOGO 4-hour bearish signal
⚠️Technical analysis: Daily bearish confluence confirmed | 4-hour entry: MACD bearish crossover below zero, bearish momentum accelerating | EMA5 < EMA8 < EMA13, bearish alignment | KDJ moving weakly, bears in control (K: 23.8, D: 28.4) | Trading volume increased (1.5x)
════════════════════
🟢 $AVAX 4-hour bearish signal
⚠️Technical analysis: Daily bearish confluence confirmed | 4-hour entry: MACD bearish crossover below zero, bearish momentum accelerating | EMA5 crossed below EMA8, short-term outlook turns bearish | KDJ bearish crossover, short-term outlook bearish (K: 48.8, D: 62.3) | Trading volume increased (1.9x)
════════════════════
🟢 $BABA 4-hour bearish signal
⚠️Technical analysis: Daily bearish confluence confirmed | 4-hour entry: MACD DIF fell below the zero line, trend turns bearish | EMA5 crossed below EMA8, short-term outlook turns bearish | KDJ moving weakly, bears in control (K: 36.0, D: 49.0) | Trading volume increased (1.8x)
════════════════════
🔔 Follow for the latest market movements 🔔
#多周期共振 #FOGO #AVAX #BABA
📌 When trading, pay attention to whether the candlestick patterns align
$FOGO / $AVAX / $BABA 4-hour bearish signals, daily bearish trend confirmed 🔥
════════════════════
🟢 $FOGO 4-hour bearish signal
⚠️Technical analysis: Daily bearish confluence confirmed | 4-hour entry: MACD bearish crossover below zero, bearish momentum accelerating | EMA5 < EMA8 < EMA13, bearish alignment | KDJ moving weakly, bears in control (K: 23.8, D: 28.4) | Trading volume increased (1.5x)
════════════════════
🟢 $AVAX 4-hour bearish signal
⚠️Technical analysis: Daily bearish confluence confirmed | 4-hour entry: MACD bearish crossover below zero, bearish momentum accelerating | EMA5 crossed below EMA8, short-term outlook turns bearish | KDJ bearish crossover, short-term outlook bearish (K: 48.8, D: 62.3) | Trading volume increased (1.9x)
════════════════════
🟢 $BABA 4-hour bearish signal
⚠️Technical analysis: Daily bearish confluence confirmed | 4-hour entry: MACD DIF fell below the zero line, trend turns bearish | EMA5 crossed below EMA8, short-term outlook turns bearish | KDJ moving weakly, bears in control (K: 36.0, D: 49.0) | Trading volume increased (1.8x)
════════════════════
🔔 Follow for the latest market movements 🔔
#多周期共振 #FOGO #AVAX #BABA
📌 When trading, pay attention to whether the candlestick patterns align
════════════════════
🟢 $FOGO 4-hour bearish signal
⚠️Technical analysis: Daily bearish confluence confirmed | 4-hour entry: MACD bearish crossover below zero, bearish momentum accelerating | EMA5 < EMA8 < EMA13, bearish alignment | KDJ moving weakly, bears in control (K: 23.8, D: 28.4) | Trading volume increased (1.5x)
════════════════════
🟢 $AVAX 4-hour bearish signal
⚠️Technical analysis: Daily bearish confluence confirmed | 4-hour entry: MACD bearish crossover below zero, bearish momentum accelerating | EMA5 crossed below EMA8, short-term outlook turns bearish | KDJ bearish crossover, short-term outlook bearish (K: 48.8, D: 62.3) | Trading volume increased (1.9x)
════════════════════
🟢 $BABA 4-hour bearish signal
⚠️Technical analysis: Daily bearish confluence confirmed | 4-hour entry: MACD DIF fell below the zero line, trend turns bearish | EMA5 crossed below EMA8, short-term outlook turns bearish | KDJ moving weakly, bears in control (K: 36.0, D: 49.0) | Trading volume increased (1.8x)
════════════════════
🔔 Follow for the latest market movements 🔔
#多周期共振 #FOGO #AVAX #BABA
📌 When trading, pay attention to whether the candlestick patterns align
50
Log in to explore more content
Join global crypto users on Binance Square
⚡️ Get latest and useful information about crypto.
💬 Trusted by the world’s largest crypto exchange.
👍 Discover real insights from verified creators.
Email / Phone number
Trending Topics
1
#BinanceReopensWithdrawalsForMoreAssets
820,771 views
4,510 Discussing
2
#Binance98PercentReplenished
171,979 views
1,806 Discussing
3
#USStocksSlipandCryptoMarketUnderBroadPressure
8,148 views
208 Discussing
4
#StrategySTRCResumesIssuanceAfterOver170Days
20,057 views
397 Discussing
5
#ADPUSPrivateEmployersAdd86000JobsInOctober
35,770 views
547 Discussing
6
#KazakhstanReportedlyInvests$100MInCryptoFunds
1,981 views
51 Discussing
7
#SouthKoreaSeeksCryptoTaxDelayUntil2029
21,463 views
248 Discussing
8
#USMidterms-WhatAreMarketsExpecting?
617,937 views
2,900 Discussing
9
#US10YearTreasuryYieldFallsTo4.845%
27,762 views
186 Discussing
10
#ZcashExpectsNU7ToMake$16MSproutZECInaccessible
1,595 views
23 Discussing