
#pnut
pnut
14.4M views
10,966 Discussing
Hot
Latest

🚨 $PNUT PREPARES FOR A HEAVY DOWNSIDE SWEEP AS SELLER PRESSURE MOUNTS! 🔻
Entry: 0.05533 ⚡
Target: 0.052794 🚀
Sellers are aggressively defending local supply, shutting down attempts to reclaim upper levels. 📊 Order flow reveals momentum tipping heavily to the downside as buyers run out of gas at resistance. 🔍
We are eyeing a quick liquidity drain into lower support zones while technical structure favors the short side. 📉 Are you riding this move down or waiting for a deeper bottom test? 👇
⚠️ Not financial advice. Always manage your risk. 🛡️
🏷️ #PNUT #ShortSetup #Bearish #Crypto
📉 🐻
🚨 $PNUT PREPARES FOR A HEAVY DOWNSIDE SWEEP AS SELLER PRESSURE MOUNTS! 🔻
Entry: 0.05533 ⚡
Target: 0.052794 🚀
Sellers are aggressively defending local supply, shutting down attempts to reclaim upper levels. 📊 Order flow reveals momentum tipping heavily to the downside as buyers run out of gas at resistance. 🔍
We are eyeing a quick liquidity drain into lower support zones while technical structure favors the short side. 📉 Are you riding this move down or waiting for a deeper bottom test? 👇
⚠️ Not financial advice. Always manage your risk. 🛡️
🏷️ #PNUT #ShortSetup #Bearish #Crypto
📉 🐻
Entry: 0.05533 ⚡
Target: 0.052794 🚀
Sellers are aggressively defending local supply, shutting down attempts to reclaim upper levels. 📊 Order flow reveals momentum tipping heavily to the downside as buyers run out of gas at resistance. 🔍
We are eyeing a quick liquidity drain into lower support zones while technical structure favors the short side. 📉 Are you riding this move down or waiting for a deeper bottom test? 👇
⚠️ Not financial advice. Always manage your risk. 🛡️
🏷️ #PNUT #ShortSetup #Bearish #Crypto
📉 🐻
22

⚡ $PNUT IGNITING ULTRA-FAST SCALP MOMENTUM BEFORE EXPLOSIVE LEG UP! 💥
Entry: 0.05335 ⚡
Target: 0.05379 🚀
Price is coiling right at the 0.05335 inflection point, priming order flow for an immediate micro-burst. 📊 Taker buy volume is ramping up fast as market participants absorb localized ask liquidity.
We are hunting a tight velocity play targeting 0.05379 before overhead resistance can re-establish. ⚡ Execution speed is key when order books compress for a fast momentum expansion. 💬 Are you catching this high-velocity push or waiting for confirmation? 👇
⚠️ Not financial advice. Always manage your risk. 🛡️
🏷️ #PNUT #ScalpSetup #Crypto #Trading #Breakout
⚡ 🔥
⚡ $PNUT IGNITING ULTRA-FAST SCALP MOMENTUM BEFORE EXPLOSIVE LEG UP! 💥
Entry: 0.05335 ⚡
Target: 0.05379 🚀
Price is coiling right at the 0.05335 inflection point, priming order flow for an immediate micro-burst. 📊 Taker buy volume is ramping up fast as market participants absorb localized ask liquidity.
We are hunting a tight velocity play targeting 0.05379 before overhead resistance can re-establish. ⚡ Execution speed is key when order books compress for a fast momentum expansion. 💬 Are you catching this high-velocity push or waiting for confirmation? 👇
⚠️ Not financial advice. Always manage your risk. 🛡️
🏷️ #PNUT #ScalpSetup #Crypto #Trading #Breakout
⚡ 🔥
Entry: 0.05335 ⚡
Target: 0.05379 🚀
Price is coiling right at the 0.05335 inflection point, priming order flow for an immediate micro-burst. 📊 Taker buy volume is ramping up fast as market participants absorb localized ask liquidity.
We are hunting a tight velocity play targeting 0.05379 before overhead resistance can re-establish. ⚡ Execution speed is key when order books compress for a fast momentum expansion. 💬 Are you catching this high-velocity push or waiting for confirmation? 👇
⚠️ Not financial advice. Always manage your risk. 🛡️
🏷️ #PNUT #ScalpSetup #Crypto #Trading #Breakout
⚡ 🔥
41

💥 $PNUT IS COILING TIGHT FOR AN IMMEDIATE MOMENTUM EXPANSION! ⚡
Entry: 0.05335 ⚡
Target: 0.05343 - 0.05379 🚀
Stop Loss: 5% - 10% ⚠️
📌 Price action on $PNUT is compressed inside a high-density accumulation block, with bid liquidity stacking aggressively right below current market price. 📊 Volume is quietly building, signaling that market makers are preparing to absorb overhead sell orders and drive a swift momentum expansion.
💡 Scalpers are locking in low-timeframe positioning to catch the initial liquidity sweep before the spread widens. 💬 Are you bidding this tight consolidation range or waiting for a high-volume breakout confirmation? 👇
⚠️ Not financial advice. Always manage your risk. 🛡️
🏷️ #PNUT #ScalpSetup #Breakout #Crypto
🔥 ⚡
💥 $PNUT IS COILING TIGHT FOR AN IMMEDIATE MOMENTUM EXPANSION! ⚡
Entry: 0.05335 ⚡
Target: 0.05343 - 0.05379 🚀
Stop Loss: 5% - 10% ⚠️
📌 Price action on $PNUT is compressed inside a high-density accumulation block, with bid liquidity stacking aggressively right below current market price. 📊 Volume is quietly building, signaling that market makers are preparing to absorb overhead sell orders and drive a swift momentum expansion.
💡 Scalpers are locking in low-timeframe positioning to catch the initial liquidity sweep before the spread widens. 💬 Are you bidding this tight consolidation range or waiting for a high-volume breakout confirmation? 👇
⚠️ Not financial advice. Always manage your risk. 🛡️
🏷️ #PNUT #ScalpSetup #Breakout #Crypto
🔥 ⚡
Entry: 0.05335 ⚡
Target: 0.05343 - 0.05379 🚀
Stop Loss: 5% - 10% ⚠️
📌 Price action on $PNUT is compressed inside a high-density accumulation block, with bid liquidity stacking aggressively right below current market price. 📊 Volume is quietly building, signaling that market makers are preparing to absorb overhead sell orders and drive a swift momentum expansion.
💡 Scalpers are locking in low-timeframe positioning to catch the initial liquidity sweep before the spread widens. 💬 Are you bidding this tight consolidation range or waiting for a high-volume breakout confirmation? 👇
⚠️ Not financial advice. Always manage your risk. 🛡️
🏷️ #PNUT #ScalpSetup #Breakout #Crypto
🔥 ⚡
36

·
--
💥 $PNUT IS COILING AT KEY SUPPORT FOR AN EXPLOSIVE MOMENTUM BREAKOUT! ⚡
Entry: 0.05241 ⚡
Target: 0.0527746 🚀
📌 Buyers are stepping up around 0.05241, absorbing remaining sell-side liquidity and establishing a tight compression zone. 📊 Order flow indicates sellers are exhausting, paving the way for a sharp upside impulse as volume begins to build on lower timeframes.
💡 Following the plan with disciplined execution remains critical as price presses against immediate resistance. 💬 Are you bidding this accumulation level early, or waiting for the breakout candle to confirm? 👇
⚠️ Not financial advice. Always manage your risk. 🛡️
🏷️ #PNUT #LongSetup #Trading #Breakout #Crypto
⚡ 💎
💥 $PNUT IS COILING AT KEY SUPPORT FOR AN EXPLOSIVE MOMENTUM BREAKOUT! ⚡
Entry: 0.05241 ⚡
Target: 0.0527746 🚀
📌 Buyers are stepping up around 0.05241, absorbing remaining sell-side liquidity and establishing a tight compression zone. 📊 Order flow indicates sellers are exhausting, paving the way for a sharp upside impulse as volume begins to build on lower timeframes.
💡 Following the plan with disciplined execution remains critical as price presses against immediate resistance. 💬 Are you bidding this accumulation level early, or waiting for the breakout candle to confirm? 👇
⚠️ Not financial advice. Always manage your risk. 🛡️
🏷️ #PNUT #LongSetup #Trading #Breakout #Crypto
⚡ 💎
Entry: 0.05241 ⚡
Target: 0.0527746 🚀
📌 Buyers are stepping up around 0.05241, absorbing remaining sell-side liquidity and establishing a tight compression zone. 📊 Order flow indicates sellers are exhausting, paving the way for a sharp upside impulse as volume begins to build on lower timeframes.
💡 Following the plan with disciplined execution remains critical as price presses against immediate resistance. 💬 Are you bidding this accumulation level early, or waiting for the breakout candle to confirm? 👇
⚠️ Not financial advice. Always manage your risk. 🛡️
🏷️ #PNUT #LongSetup #Trading #Breakout #Crypto
⚡ 💎
47

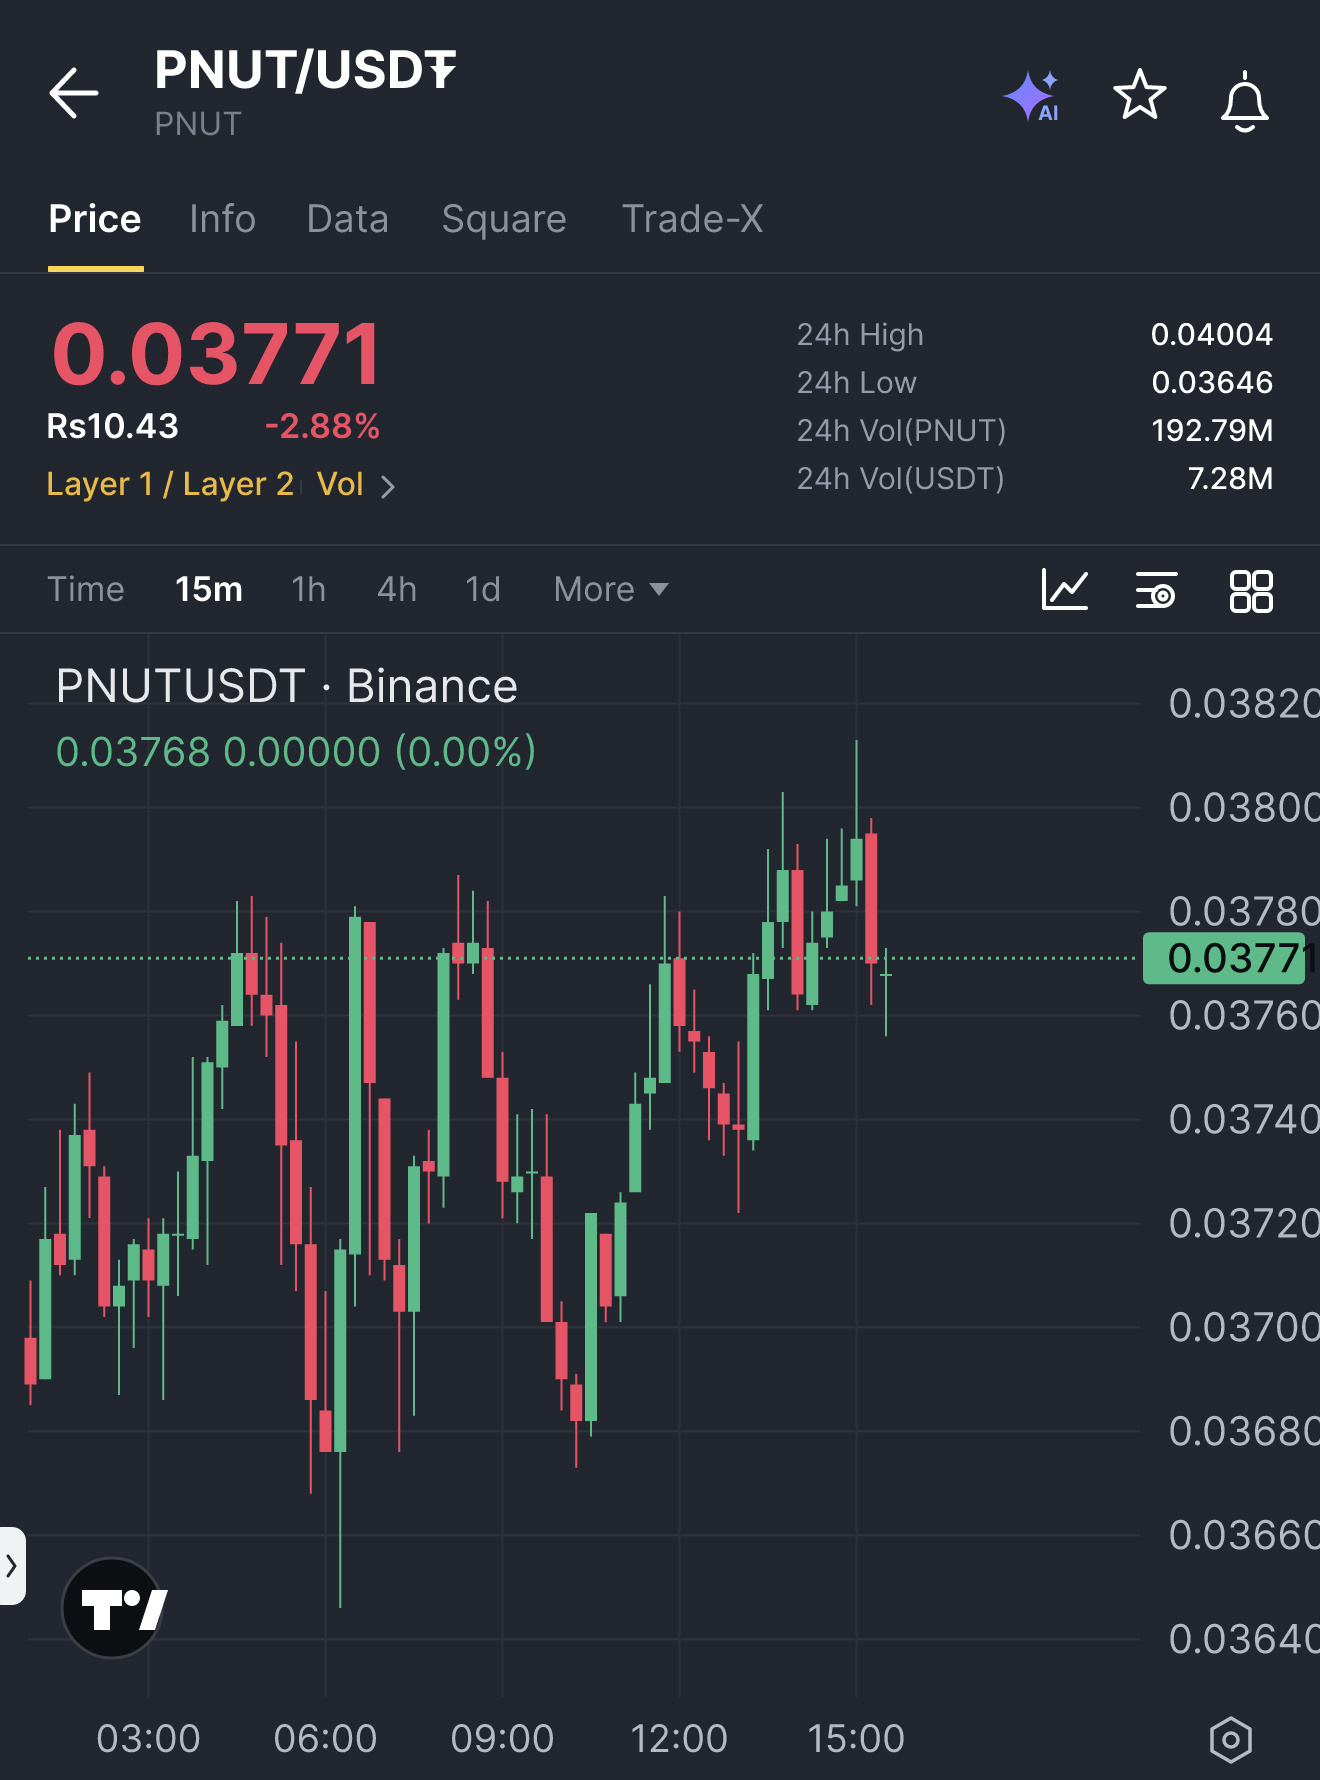
🔴 $PNUT BEARS THE LIQUIDITY SWEEP, SHORT ENTRY LIVE! 💥
Entry: 0.03772 ⚡
Target: 0.03706 🚀
Stop Loss: 0.03816 ⚠️
📊 Sellers pierced the prior candle’s low after a sustained rally, confirming a clean liquidity sweep and exposing the bearish order block at 0.03772. 🌊 The pull‑back is now primed, with volume confirming the shift in dominance.
⚡ With a tight stop just above the broken low, the risk‑to‑reward ratio comfortably exceeds 1:2 across the target ladder. 🔍 Discipline on each level will preserve capital while the smart‑money engine drives price lower. 💬 Are you ready to ride the downside or wait for a deeper liquidity hunt? 👇
⚠️ Not financial advice. Always manage your risk. 🛡️
🏷️ #PNUT #ShortSetup #LiquiditySweep #Crypto
🦈 🔥
🔴 $PNUT BEARS THE LIQUIDITY SWEEP, SHORT ENTRY LIVE! 💥
Entry: 0.03772 ⚡
Target: 0.03706 🚀
Stop Loss: 0.03816 ⚠️
📊 Sellers pierced the prior candle’s low after a sustained rally, confirming a clean liquidity sweep and exposing the bearish order block at 0.03772. 🌊 The pull‑back is now primed, with volume confirming the shift in dominance.
⚡ With a tight stop just above the broken low, the risk‑to‑reward ratio comfortably exceeds 1:2 across the target ladder. 🔍 Discipline on each level will preserve capital while the smart‑money engine drives price lower. 💬 Are you ready to ride the downside or wait for a deeper liquidity hunt? 👇
⚠️ Not financial advice. Always manage your risk. 🛡️
🏷️ #PNUT #ShortSetup #LiquiditySweep #Crypto
🦈 🔥
Entry: 0.03772 ⚡
Target: 0.03706 🚀
Stop Loss: 0.03816 ⚠️
📊 Sellers pierced the prior candle’s low after a sustained rally, confirming a clean liquidity sweep and exposing the bearish order block at 0.03772. 🌊 The pull‑back is now primed, with volume confirming the shift in dominance.
⚡ With a tight stop just above the broken low, the risk‑to‑reward ratio comfortably exceeds 1:2 across the target ladder. 🔍 Discipline on each level will preserve capital while the smart‑money engine drives price lower. 💬 Are you ready to ride the downside or wait for a deeper liquidity hunt? 👇
⚠️ Not financial advice. Always manage your risk. 🛡️
🏷️ #PNUT #ShortSetup #LiquiditySweep #Crypto
🦈 🔥
21
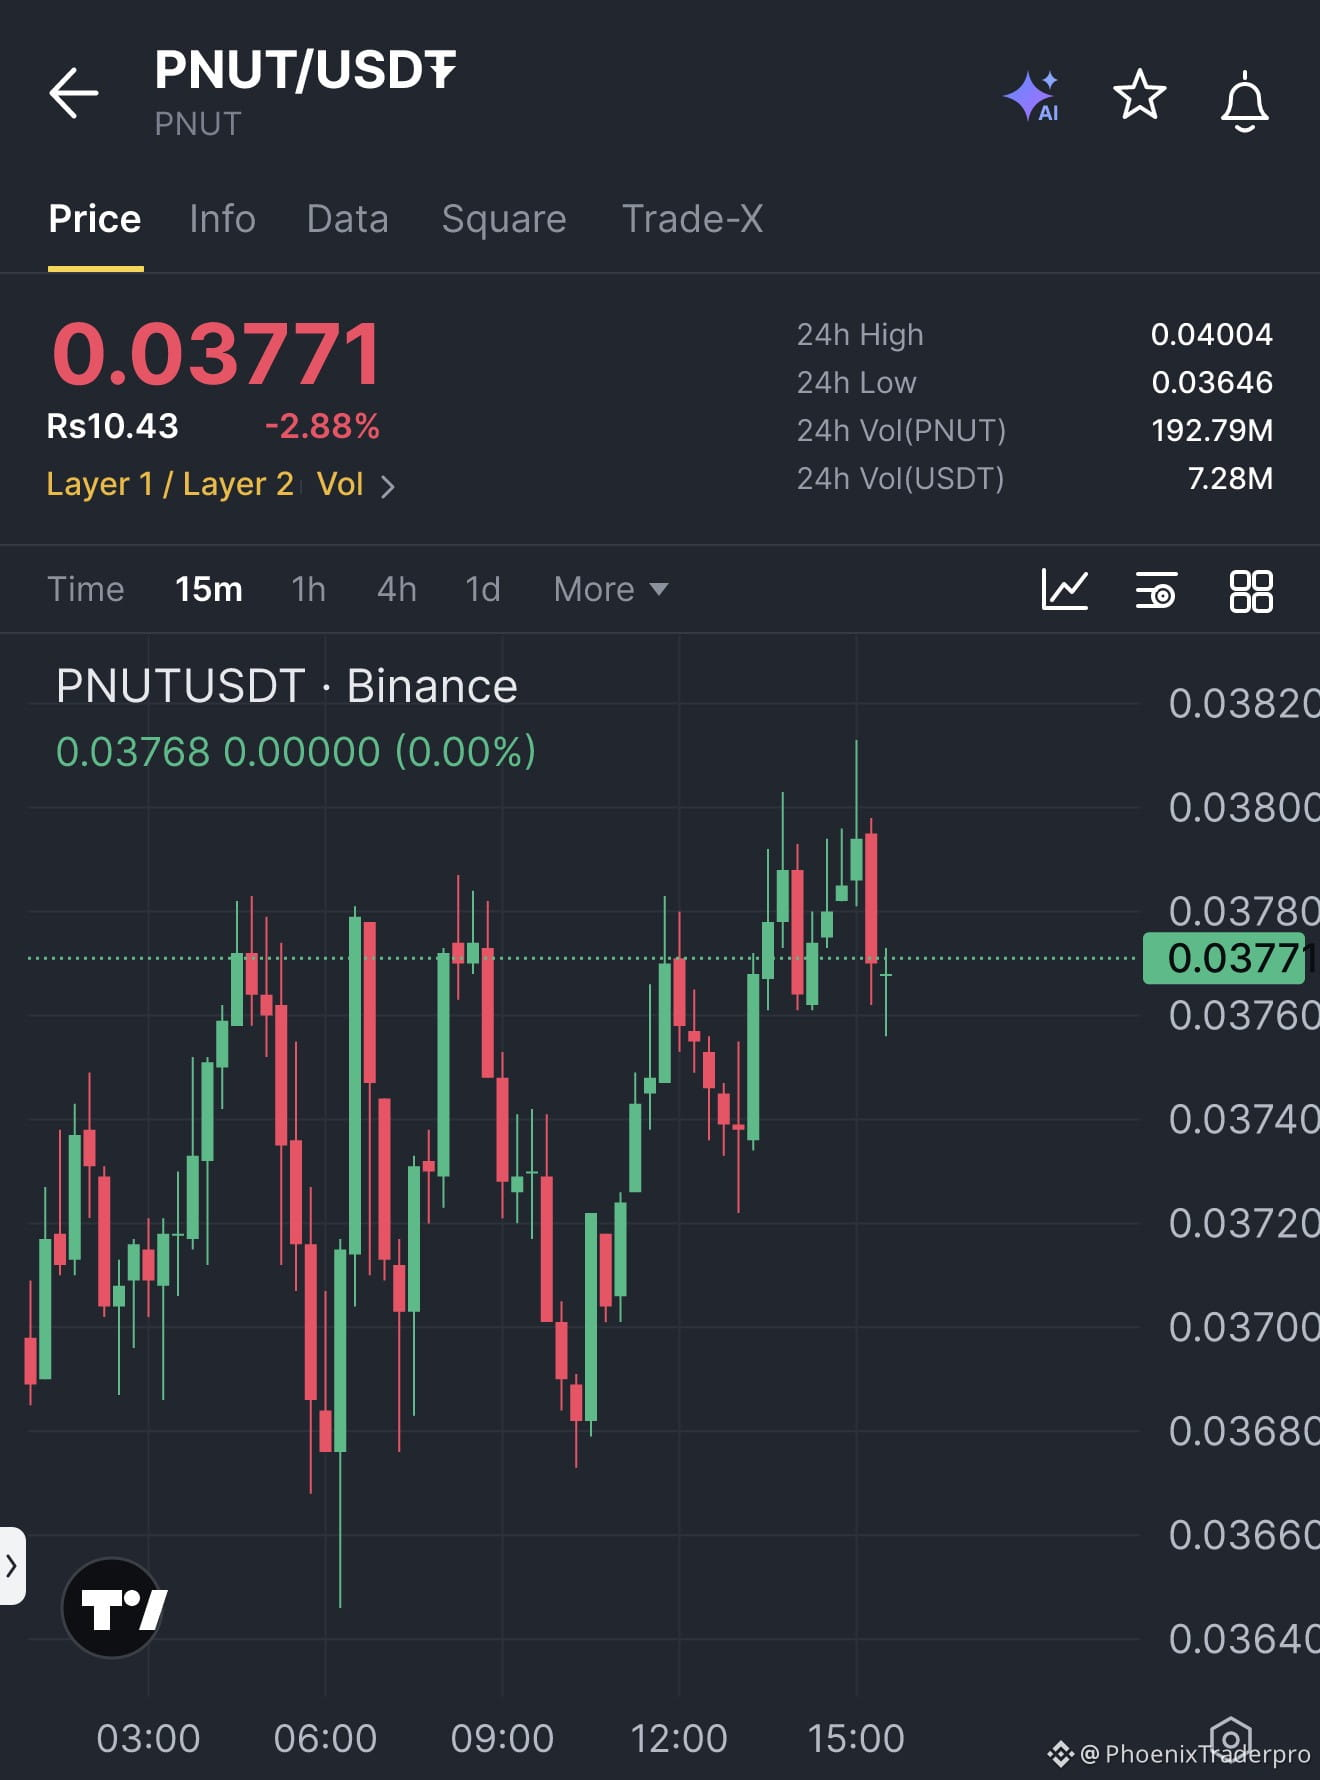
🔴 $PNUT SPARKS A SWIFT SELL OFF – SHORT ON THE RISE! 🚀
Entry: 0.03772 ⚡
Target: 0.03706 / 0.03662 / 0.03596 🚀
Stop Loss: 0.03816 ⚠️
The candle just smashed its low, confirming sellers have seized the momentum after the recent rise. 📊 The break below the prior low acts as a clean trigger for the pullback, flipping order flow to the downside.
With entry locked at 0.03772, the trade eyes three stacked profit zones, each catching the next wave of liquidity as the market hunts lower. ⚡ Keep the stop tight above 0.03816 to protect against a sudden reversal.
💬 Are you ready to ride the downside wave or waiting for the next liquidity sweep? 👇
⚠️ Not financial advice. Always manage your risk. 🛡️
🏷️ #PNUT #ShortSetup #Bearish #Crypto
🐻 🔥
🔴 $PNUT SPARKS A SWIFT SELL OFF – SHORT ON THE RISE! 🚀
Entry: 0.03772 ⚡
Target: 0.03706 / 0.03662 / 0.03596 🚀
Stop Loss: 0.03816 ⚠️
The candle just smashed its low, confirming sellers have seized the momentum after the recent rise. 📊 The break below the prior low acts as a clean trigger for the pullback, flipping order flow to the downside.
With entry locked at 0.03772, the trade eyes three stacked profit zones, each catching the next wave of liquidity as the market hunts lower. ⚡ Keep the stop tight above 0.03816 to protect against a sudden reversal.
💬 Are you ready to ride the downside wave or waiting for the next liquidity sweep? 👇
⚠️ Not financial advice. Always manage your risk. 🛡️
🏷️ #PNUT #ShortSetup #Bearish #Crypto
🐻 🔥
Entry: 0.03772 ⚡
Target: 0.03706 / 0.03662 / 0.03596 🚀
Stop Loss: 0.03816 ⚠️
The candle just smashed its low, confirming sellers have seized the momentum after the recent rise. 📊 The break below the prior low acts as a clean trigger for the pullback, flipping order flow to the downside.
With entry locked at 0.03772, the trade eyes three stacked profit zones, each catching the next wave of liquidity as the market hunts lower. ⚡ Keep the stop tight above 0.03816 to protect against a sudden reversal.
💬 Are you ready to ride the downside wave or waiting for the next liquidity sweep? 👇
⚠️ Not financial advice. Always manage your risk. 🛡️
🏷️ #PNUT #ShortSetup #Bearish #Crypto
🐻 🔥
19

·
--
Bearish
🐿️ PNUT SLIPS 3.39% — PEANUT TOKEN RECORDS A DAILY DECLINE!
Peanut the Squirrel ($PNUT
{spot}(PNUTUSDT)
) is ending up among today's selected Binance Spot losers, declining 3.39% over the last 24 hours.
📊 Market Snapshot
Price: $0.0370
24H Change: -3.39%
24H Trading Volume: $1.54M
🔍 What is PNUT?
PNUT is a meme cryptocurrency inspired by Peanut the Squirrel, whose story became widely known across the internet.
Like other meme-based cryptocurrencies, its price can be particularly sensitive to community attention, social media trends and speculative trading.
📉 What to watch:
Although its decline is smaller than those of several other tokens on today's loser list, traders should monitor trading volume and market sentiment.
Could PNUT recover its momentum?
#Pnut #PeanutTheSquirrel #memecoin #CryptoNews #Binance
🐿️ PNUT SLIPS 3.39% — PEANUT TOKEN RECORDS A DAILY DECLINE!
Peanut the Squirrel ($PNUT
) is ending up among today's selected Binance Spot losers, declining 3.39% over the last 24 hours.
📊 Market Snapshot
Price: $0.0370
24H Change: -3.39%
24H Trading Volume: $1.54M
🔍 What is PNUT?
PNUT is a meme cryptocurrency inspired by Peanut the Squirrel, whose story became widely known across the internet.
Like other meme-based cryptocurrencies, its price can be particularly sensitive to community attention, social media trends and speculative trading.
📉 What to watch:
Although its decline is smaller than those of several other tokens on today's loser list, traders should monitor trading volume and market sentiment.
Could PNUT recover its momentum?
#Pnut #PeanutTheSquirrel #memecoin #CryptoNews #Binance
Peanut the Squirrel ($PNUT
) is ending up among today's selected Binance Spot losers, declining 3.39% over the last 24 hours.
📊 Market Snapshot
Price: $0.0370
24H Change: -3.39%
24H Trading Volume: $1.54M
🔍 What is PNUT?
PNUT is a meme cryptocurrency inspired by Peanut the Squirrel, whose story became widely known across the internet.
Like other meme-based cryptocurrencies, its price can be particularly sensitive to community attention, social media trends and speculative trading.
📉 What to watch:
Although its decline is smaller than those of several other tokens on today's loser list, traders should monitor trading volume and market sentiment.
Could PNUT recover its momentum?
#Pnut #PeanutTheSquirrel #memecoin #CryptoNews #Binance
1
714

·
--
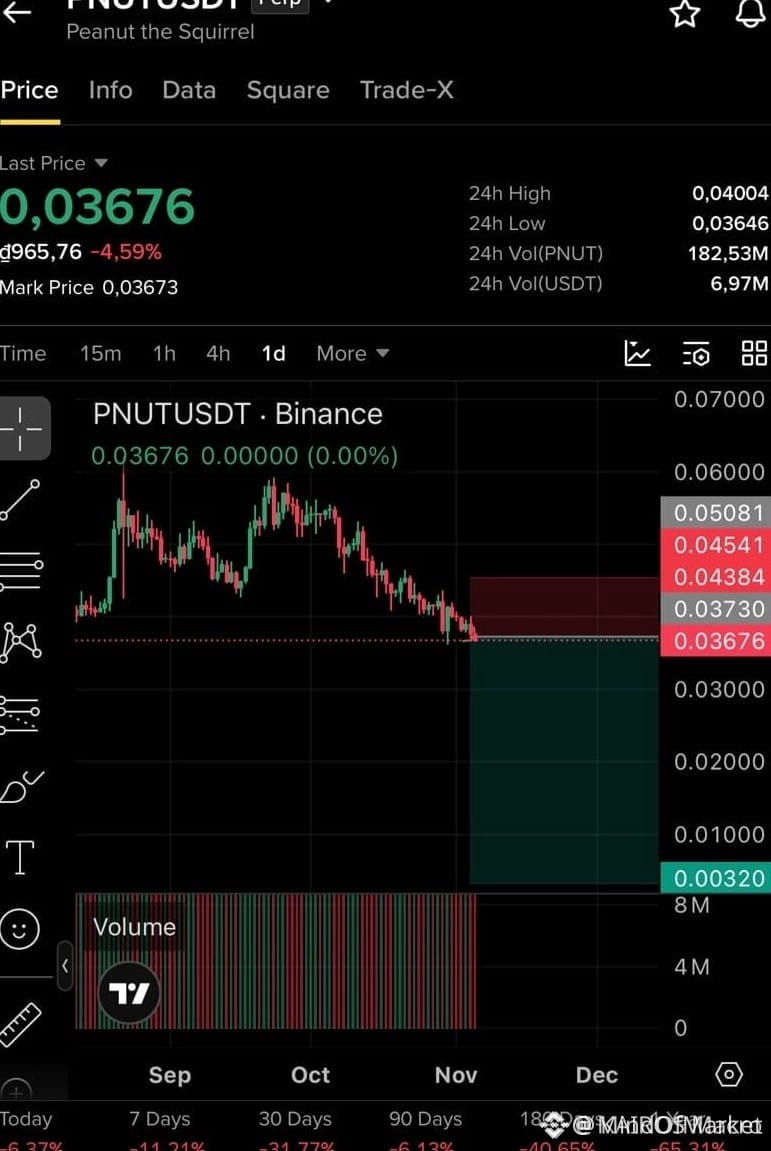
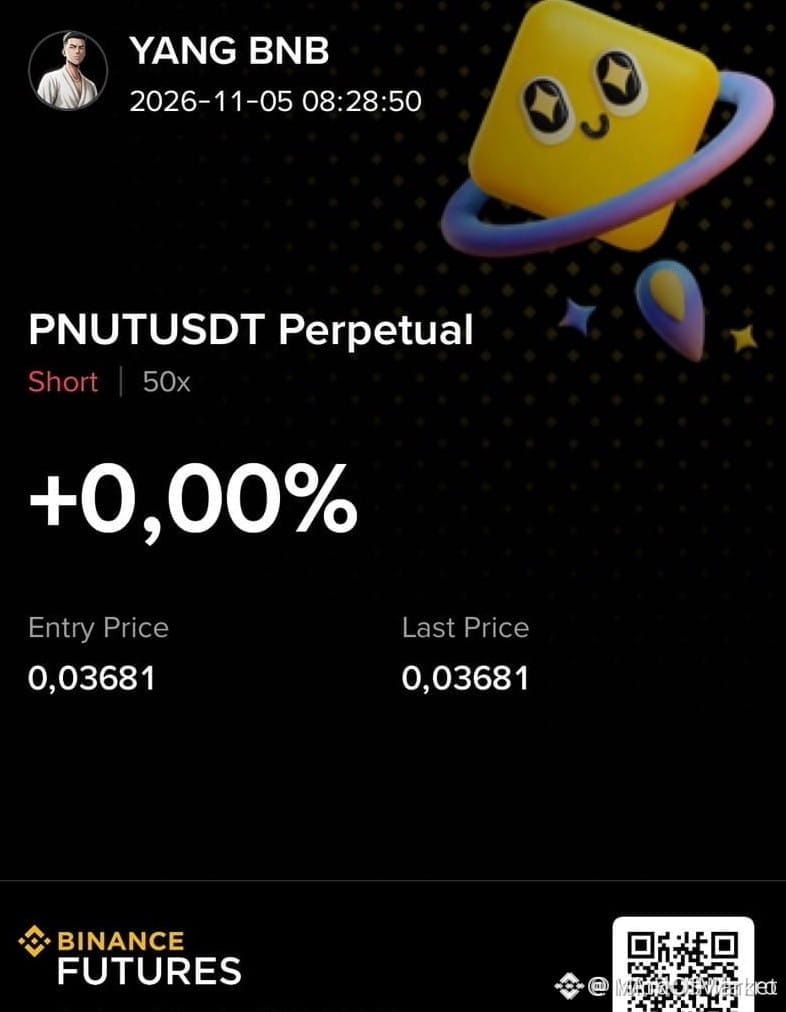
🚨 $PNUT ON THE EDGE OF A STEEP SHORT SINK! 📉
Entry: 0.0370 ⚡
Target: 0.00320 🚀
Stop Loss: 0.04384 ⚠️
📊 The 0.0370 short zone sits on a freshly broken order block, where aggressive sellers have devoured liquidity since the last spike.
⚡ Volume on the 1H chart shows a pronounced surge, confirming smart money’s intent to push the price deeper into the bearish corridor.
🌊 A lingering fair‑value gap above 0.0420 acts as a magnet for stop‑run liquidations, giving the short side a clean runway to the 0.0032 reclaim zone. 💡 Discipline is the only shield against the weekly volatility—tight stops and tight risk are non‑negotiable.
💬 Are you riding this sell‑off or waiting for the next liquidity dump?
⚠️ Not financial advice. Always manage your risk. 🛡️
🏷️ #PNUT #ShortSetup #LiquiditySweep #Crypto
🚀 🦈
🚨 $PNUT ON THE EDGE OF A STEEP SHORT SINK! 📉
Entry: 0.0370 ⚡
Target: 0.00320 🚀
Stop Loss: 0.04384 ⚠️
📊 The 0.0370 short zone sits on a freshly broken order block, where aggressive sellers have devoured liquidity since the last spike.
⚡ Volume on the 1H chart shows a pronounced surge, confirming smart money’s intent to push the price deeper into the bearish corridor.
🌊 A lingering fair‑value gap above 0.0420 acts as a magnet for stop‑run liquidations, giving the short side a clean runway to the 0.0032 reclaim zone. 💡 Discipline is the only shield against the weekly volatility—tight stops and tight risk are non‑negotiable.
💬 Are you riding this sell‑off or waiting for the next liquidity dump?
⚠️ Not financial advice. Always manage your risk. 🛡️
🏷️ #PNUT #ShortSetup #LiquiditySweep #Crypto
🚀 🦈
Entry: 0.0370 ⚡
Target: 0.00320 🚀
Stop Loss: 0.04384 ⚠️
📊 The 0.0370 short zone sits on a freshly broken order block, where aggressive sellers have devoured liquidity since the last spike.
⚡ Volume on the 1H chart shows a pronounced surge, confirming smart money’s intent to push the price deeper into the bearish corridor.
🌊 A lingering fair‑value gap above 0.0420 acts as a magnet for stop‑run liquidations, giving the short side a clean runway to the 0.0032 reclaim zone. 💡 Discipline is the only shield against the weekly volatility—tight stops and tight risk are non‑negotiable.
💬 Are you riding this sell‑off or waiting for the next liquidity dump?
⚠️ Not financial advice. Always manage your risk. 🛡️
🏷️ #PNUT #ShortSetup #LiquiditySweep #Crypto
🚀 🦈
10
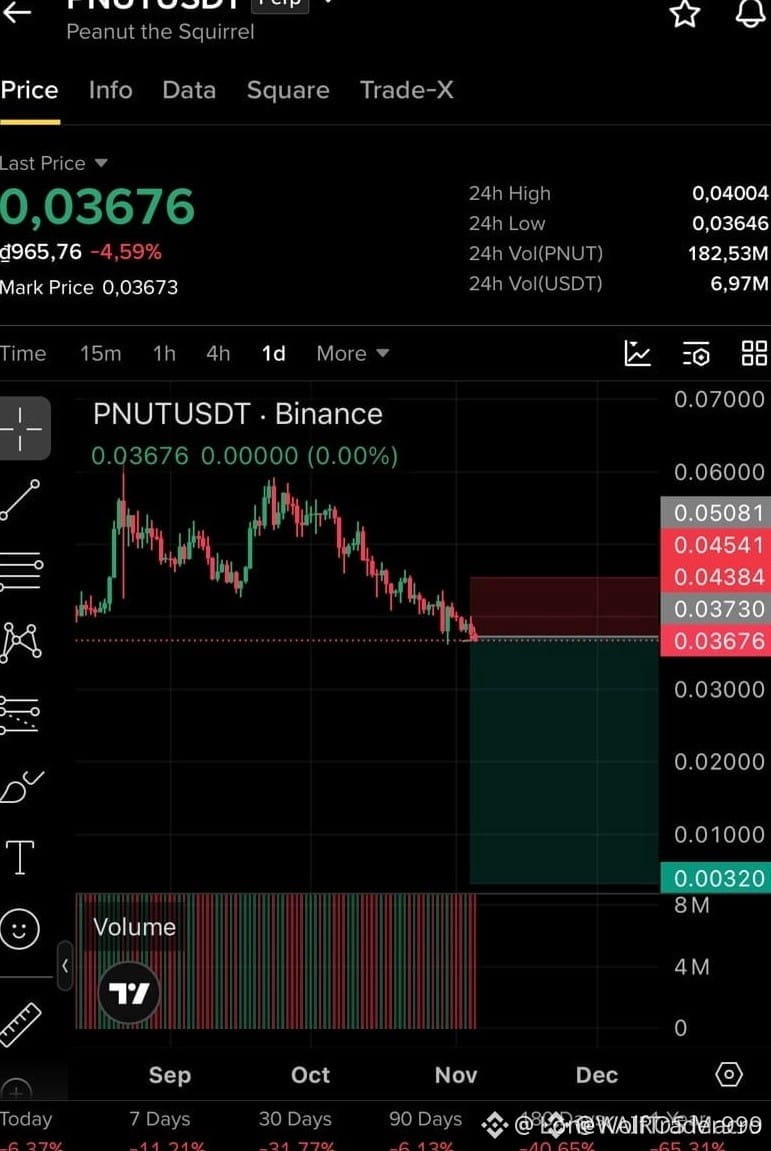
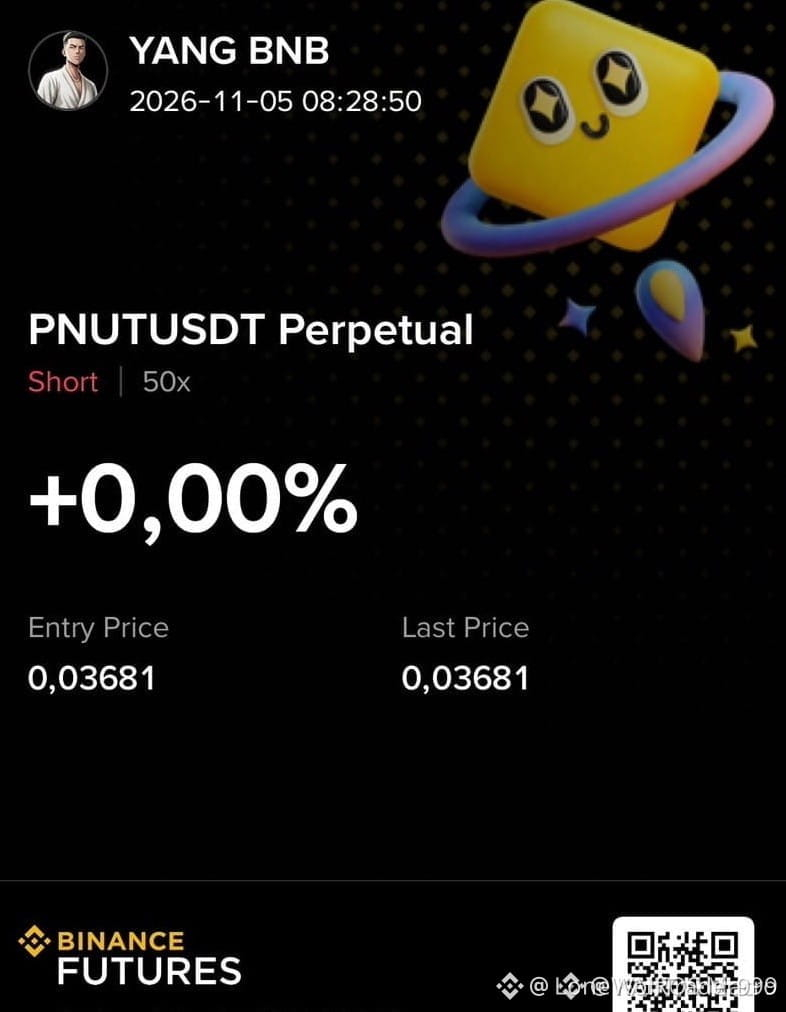
🚨 $PNUT SHORT SETUP BLASTING THROUGH RESISTANCE! ⚡
Entry: 0.0367-0.0373 ⚡
Target: 0.00320 🚀
Stop Loss: 0.04384 ⚠️
The order flow just ripped through the 0.0367‑0.0373 band, flipping the tape into a rapid sell‑off. 📊 Smart money is sweeping liquidity, and the price is racing toward the next demand crater.
With stop set tight at 0.04384, the trade respects risk while the market’s bearish thrust is fueled by aggressive volume spikes. ⚡ Keep your capital tight; this wave won’t wait for the hesitant. 💡
💬 Are you riding the short wave or holding back for the next dip? 👇
⚠️ Not financial advice. Always manage your risk. 🛡️
🏷️ #PNUT #ShortSetup #Crypto #Liquidity #Bearish
🔥 💎
🚨 $PNUT SHORT SETUP BLASTING THROUGH RESISTANCE! ⚡
Entry: 0.0367-0.0373 ⚡
Target: 0.00320 🚀
Stop Loss: 0.04384 ⚠️
The order flow just ripped through the 0.0367‑0.0373 band, flipping the tape into a rapid sell‑off. 📊 Smart money is sweeping liquidity, and the price is racing toward the next demand crater.
With stop set tight at 0.04384, the trade respects risk while the market’s bearish thrust is fueled by aggressive volume spikes. ⚡ Keep your capital tight; this wave won’t wait for the hesitant. 💡
💬 Are you riding the short wave or holding back for the next dip? 👇
⚠️ Not financial advice. Always manage your risk. 🛡️
🏷️ #PNUT #ShortSetup #Crypto #Liquidity #Bearish
🔥 💎
Entry: 0.0367-0.0373 ⚡
Target: 0.00320 🚀
Stop Loss: 0.04384 ⚠️
The order flow just ripped through the 0.0367‑0.0373 band, flipping the tape into a rapid sell‑off. 📊 Smart money is sweeping liquidity, and the price is racing toward the next demand crater.
With stop set tight at 0.04384, the trade respects risk while the market’s bearish thrust is fueled by aggressive volume spikes. ⚡ Keep your capital tight; this wave won’t wait for the hesitant. 💡
💬 Are you riding the short wave or holding back for the next dip? 👇
⚠️ Not financial advice. Always manage your risk. 🛡️
🏷️ #PNUT #ShortSetup #Crypto #Liquidity #Bearish
🔥 💎
27
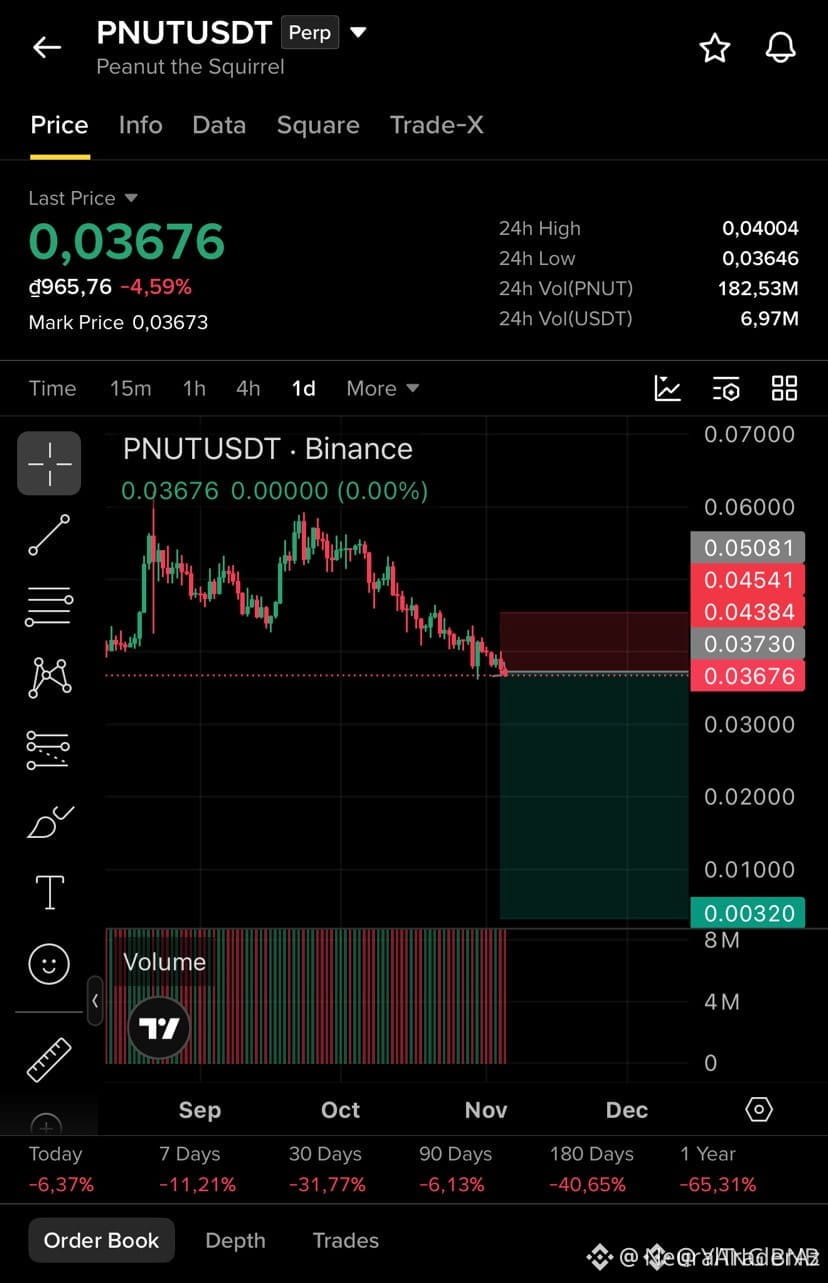
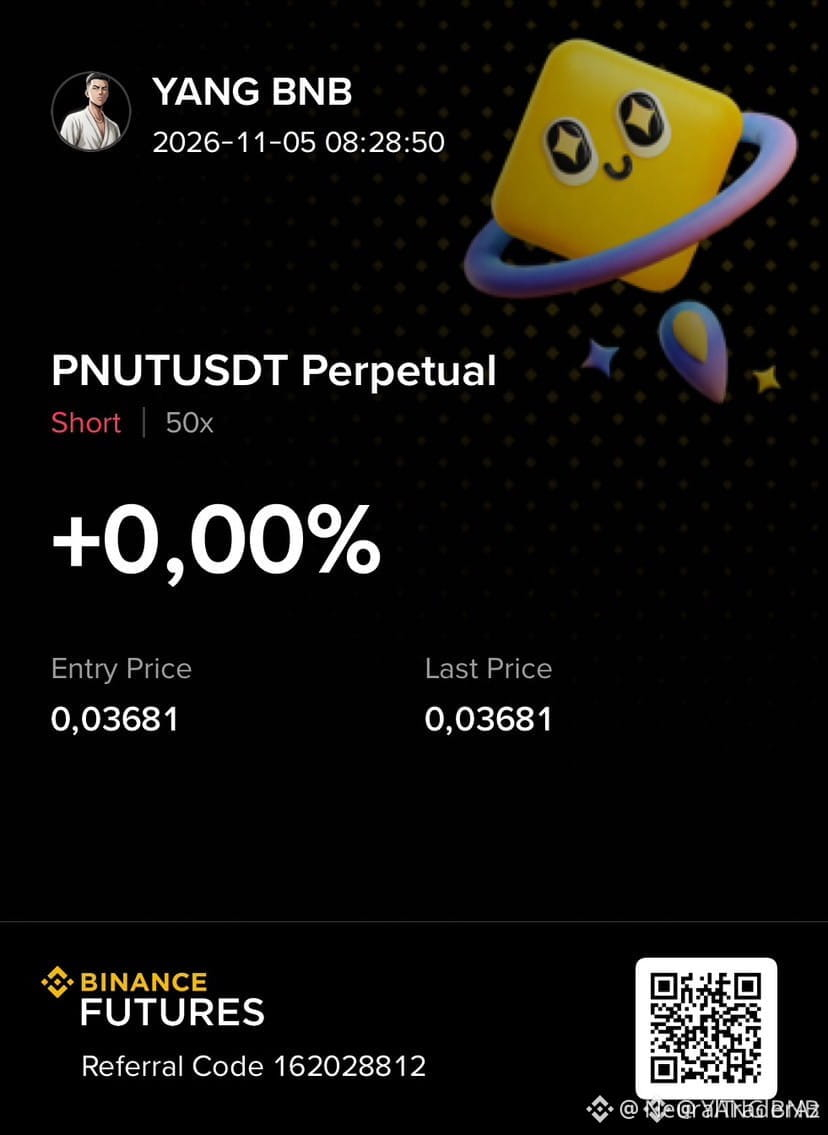
🚨 $PNUT ON THE EDGE OF A LIQUIDITY SWEEP! 🔴
Entry: 0.0367-0.0373 ⚡
Stop Loss: 0.04384 ⚠️
📊 Smart money has been harvesting sell orders around the 0.0370 zone, creating a tight demand block that snapped multiple times this week. 🦈 The recent price action on the 4H shows a classic liquidity hunt, with the market testing the upper edge before retreating. 📌 A break below the 0.0367‑0.0373 range signals the next leg of the short narrative, while the stop sits just above the prior swing high at 0.04384, preserving risk.
💬 Are you riding the short pressure now or waiting for a deeper dip to flip the trade? 👇
⚠️ Not financial advice. Always manage your risk. 🛡️
🏷️ #PNUT #ShortSetup #LiquiditySweep #Crypto
🦈 ⚡
🚨 $PNUT ON THE EDGE OF A LIQUIDITY SWEEP! 🔴
Entry: 0.0367-0.0373 ⚡
Stop Loss: 0.04384 ⚠️
📊 Smart money has been harvesting sell orders around the 0.0370 zone, creating a tight demand block that snapped multiple times this week. 🦈 The recent price action on the 4H shows a classic liquidity hunt, with the market testing the upper edge before retreating. 📌 A break below the 0.0367‑0.0373 range signals the next leg of the short narrative, while the stop sits just above the prior swing high at 0.04384, preserving risk.
💬 Are you riding the short pressure now or waiting for a deeper dip to flip the trade? 👇
⚠️ Not financial advice. Always manage your risk. 🛡️
🏷️ #PNUT #ShortSetup #LiquiditySweep #Crypto
🦈 ⚡
Entry: 0.0367-0.0373 ⚡
Stop Loss: 0.04384 ⚠️
📊 Smart money has been harvesting sell orders around the 0.0370 zone, creating a tight demand block that snapped multiple times this week. 🦈 The recent price action on the 4H shows a classic liquidity hunt, with the market testing the upper edge before retreating. 📌 A break below the 0.0367‑0.0373 range signals the next leg of the short narrative, while the stop sits just above the prior swing high at 0.04384, preserving risk.
💬 Are you riding the short pressure now or waiting for a deeper dip to flip the trade? 👇
⚠️ Not financial advice. Always manage your risk. 🛡️
🏷️ #PNUT #ShortSetup #LiquiditySweep #Crypto
🦈 ⚡
5

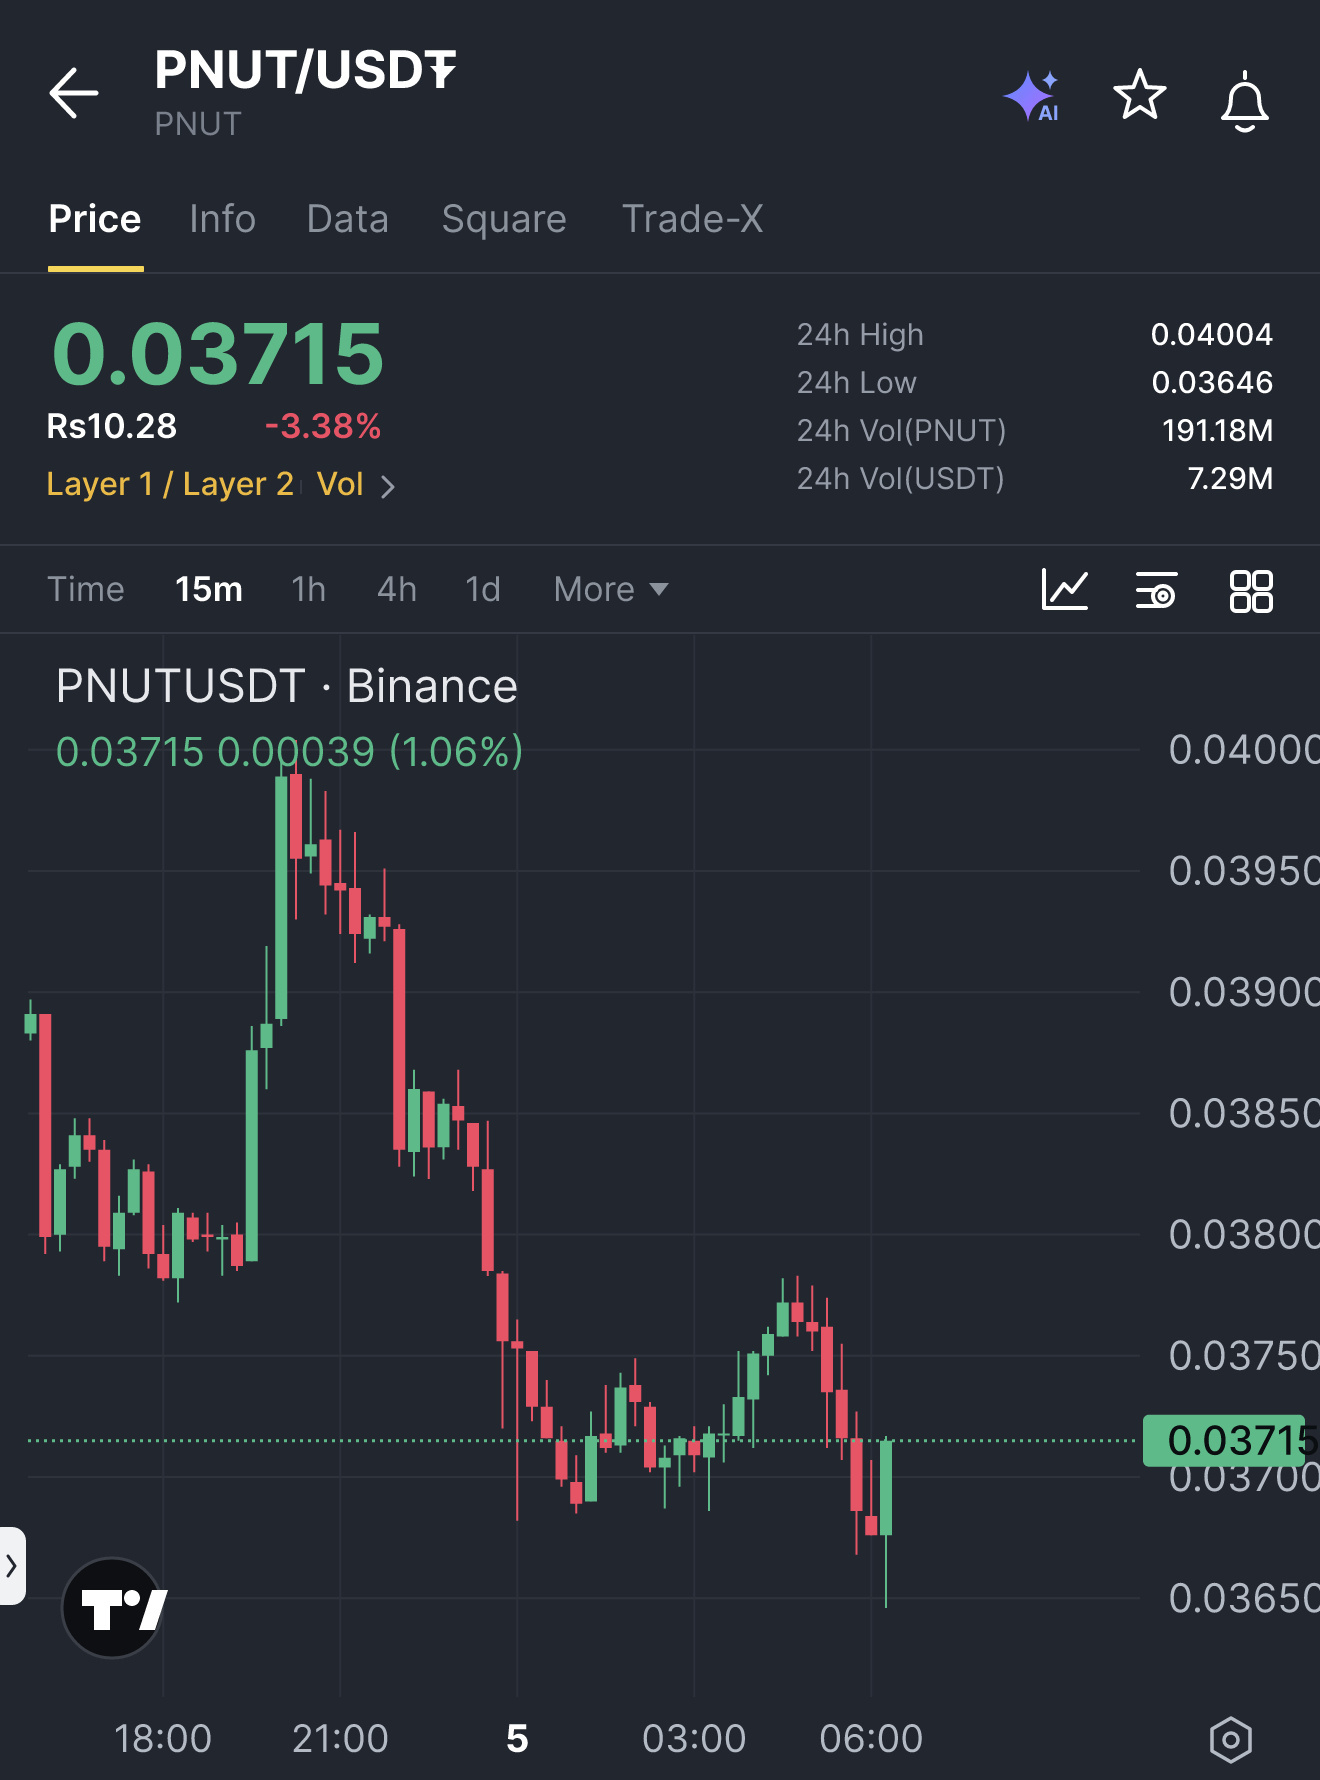
🚀 $PNUT SURGES INTO LONG ZONE AFTER BREAKOUT 💥
Entry: 0.03715 ⚡
Target: 0.03825 / 0.03898 / 0.04007 🚀
Stop Loss: 0.03642 ⚠️
📊 The bullish order block at 0.03715 has just swallowed the prior candle’s high, a classic smart‑money liquidity sweep 🦈. Volume spikes on the 4H confirm the demand absorption, and the price now sits above the break‑even line, priming the next risk‑reward expansion. 📌 Keep eyes on the 0.03642 floor – a breach invalidates the setup and flips the bias.
💬 How will you allocate your position as the targets unfold? 👇
⚠️ Not financial advice. Always manage your risk. 🛡️
🏷️ #PNUT #LongSetup #Liquidity #Crypto
🔥 🦈
🚀 $PNUT SURGES INTO LONG ZONE AFTER BREAKOUT 💥
Entry: 0.03715 ⚡
Target: 0.03825 / 0.03898 / 0.04007 🚀
Stop Loss: 0.03642 ⚠️
📊 The bullish order block at 0.03715 has just swallowed the prior candle’s high, a classic smart‑money liquidity sweep 🦈. Volume spikes on the 4H confirm the demand absorption, and the price now sits above the break‑even line, priming the next risk‑reward expansion. 📌 Keep eyes on the 0.03642 floor – a breach invalidates the setup and flips the bias.
💬 How will you allocate your position as the targets unfold? 👇
⚠️ Not financial advice. Always manage your risk. 🛡️
🏷️ #PNUT #LongSetup #Liquidity #Crypto
🔥 🦈
Entry: 0.03715 ⚡
Target: 0.03825 / 0.03898 / 0.04007 🚀
Stop Loss: 0.03642 ⚠️
📊 The bullish order block at 0.03715 has just swallowed the prior candle’s high, a classic smart‑money liquidity sweep 🦈. Volume spikes on the 4H confirm the demand absorption, and the price now sits above the break‑even line, priming the next risk‑reward expansion. 📌 Keep eyes on the 0.03642 floor – a breach invalidates the setup and flips the bias.
💬 How will you allocate your position as the targets unfold? 👇
⚠️ Not financial advice. Always manage your risk. 🛡️
🏷️ #PNUT #LongSetup #Liquidity #Crypto
🔥 🦈
33
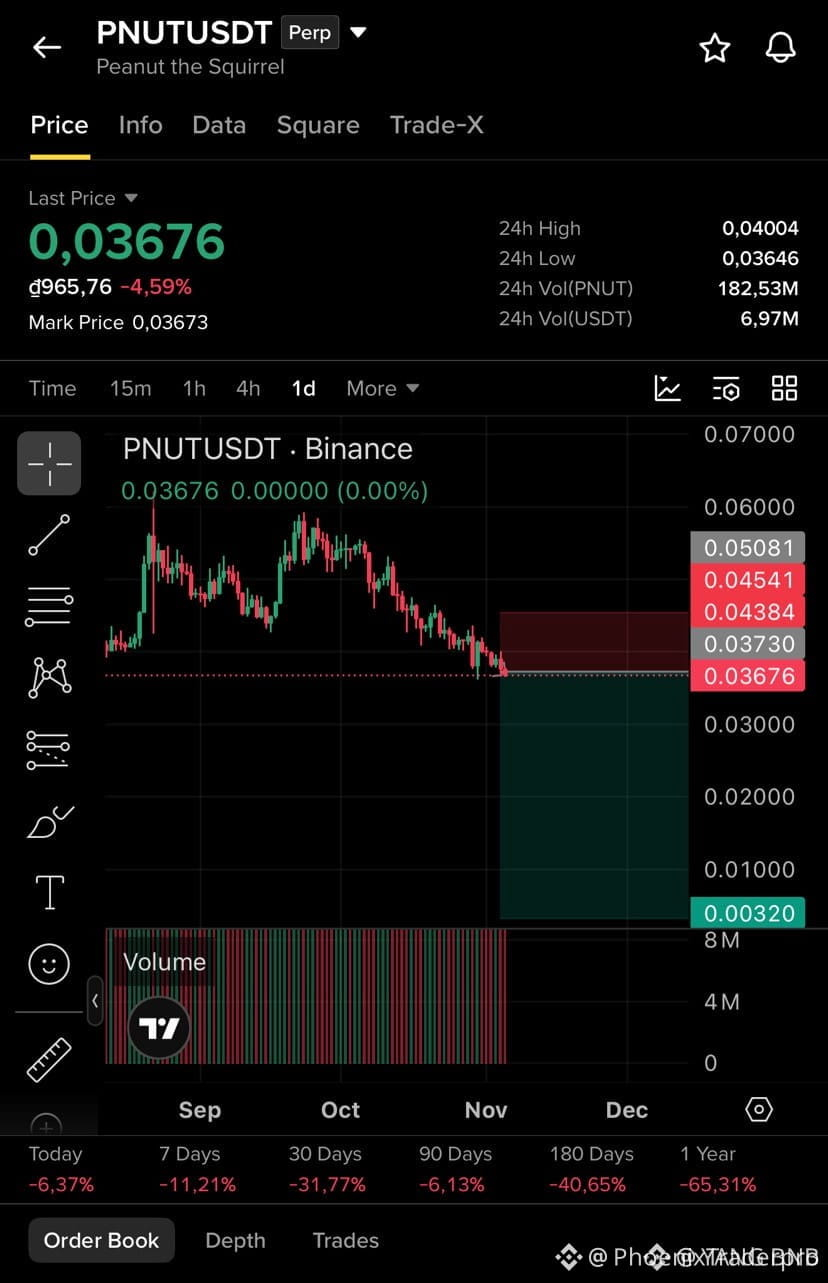
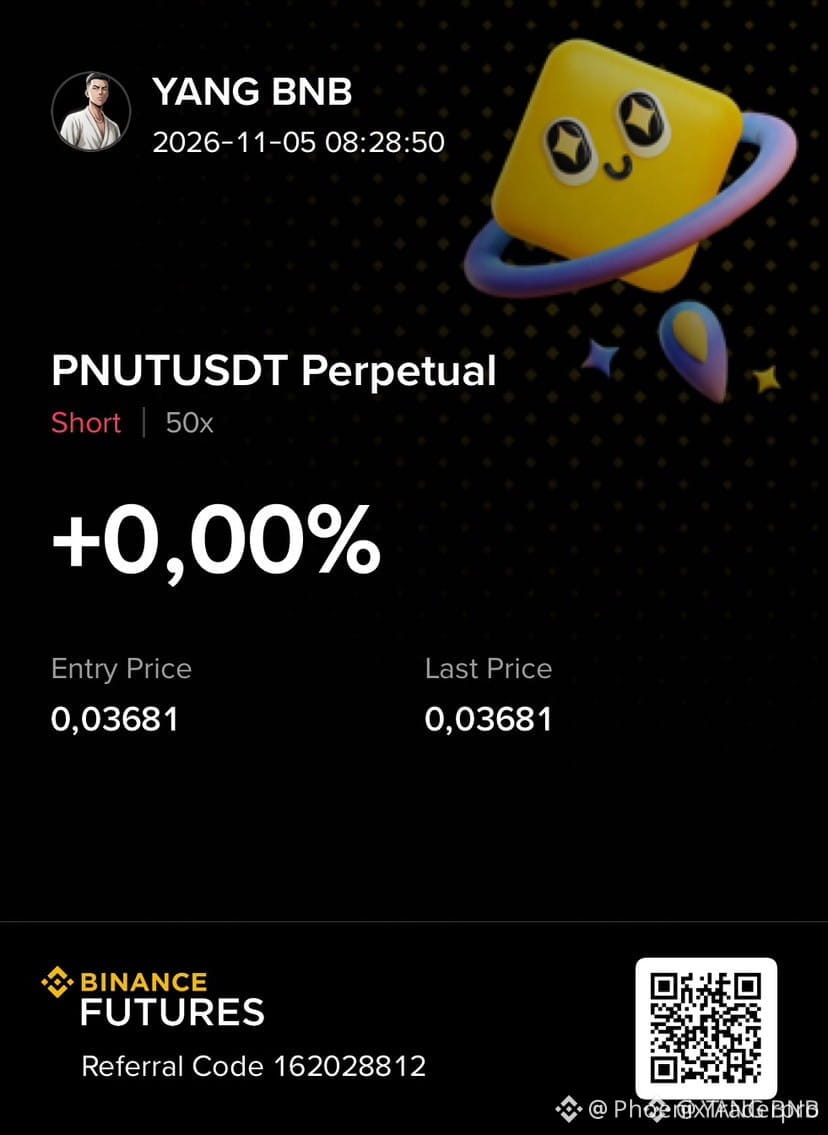
🚨 $PNUT READY FOR A HARD HITTING SHORT SWEEP! 🦈
Entry: 0.0367-0.0373 ⚡
Stop Loss: 0.04384 ⚠️
🦈 Smart‑money is clearing the last liquidity bucket under 0.04, and sellers are stacking orders like a tidal wall. 📊 The 4H volume spike confirms a decisive pressure shift, making the 0.0367‑0.0373 band the sweet entry for a clean short. 📌 Keep eyes on the 0.04384 ceiling; a breach would signal a short‑term rally, but the odds favor a swift dip toward the 0.00320 zone later.
💬 Are you lining up your bids for the downmove or waiting for the rebound? 👇
⚠️ Not financial advice. Always manage your risk. 🛡️
🏷️ #PNUT #ShortSetup #LiquiditySweep #Crypto
🔥 💎
🚨 $PNUT READY FOR A HARD HITTING SHORT SWEEP! 🦈
Entry: 0.0367-0.0373 ⚡
Stop Loss: 0.04384 ⚠️
🦈 Smart‑money is clearing the last liquidity bucket under 0.04, and sellers are stacking orders like a tidal wall. 📊 The 4H volume spike confirms a decisive pressure shift, making the 0.0367‑0.0373 band the sweet entry for a clean short. 📌 Keep eyes on the 0.04384 ceiling; a breach would signal a short‑term rally, but the odds favor a swift dip toward the 0.00320 zone later.
💬 Are you lining up your bids for the downmove or waiting for the rebound? 👇
⚠️ Not financial advice. Always manage your risk. 🛡️
🏷️ #PNUT #ShortSetup #LiquiditySweep #Crypto
🔥 💎
Entry: 0.0367-0.0373 ⚡
Stop Loss: 0.04384 ⚠️
🦈 Smart‑money is clearing the last liquidity bucket under 0.04, and sellers are stacking orders like a tidal wall. 📊 The 4H volume spike confirms a decisive pressure shift, making the 0.0367‑0.0373 band the sweet entry for a clean short. 📌 Keep eyes on the 0.04384 ceiling; a breach would signal a short‑term rally, but the odds favor a swift dip toward the 0.00320 zone later.
💬 Are you lining up your bids for the downmove or waiting for the rebound? 👇
⚠️ Not financial advice. Always manage your risk. 🛡️
🏷️ #PNUT #ShortSetup #LiquiditySweep #Crypto
🔥 💎
33
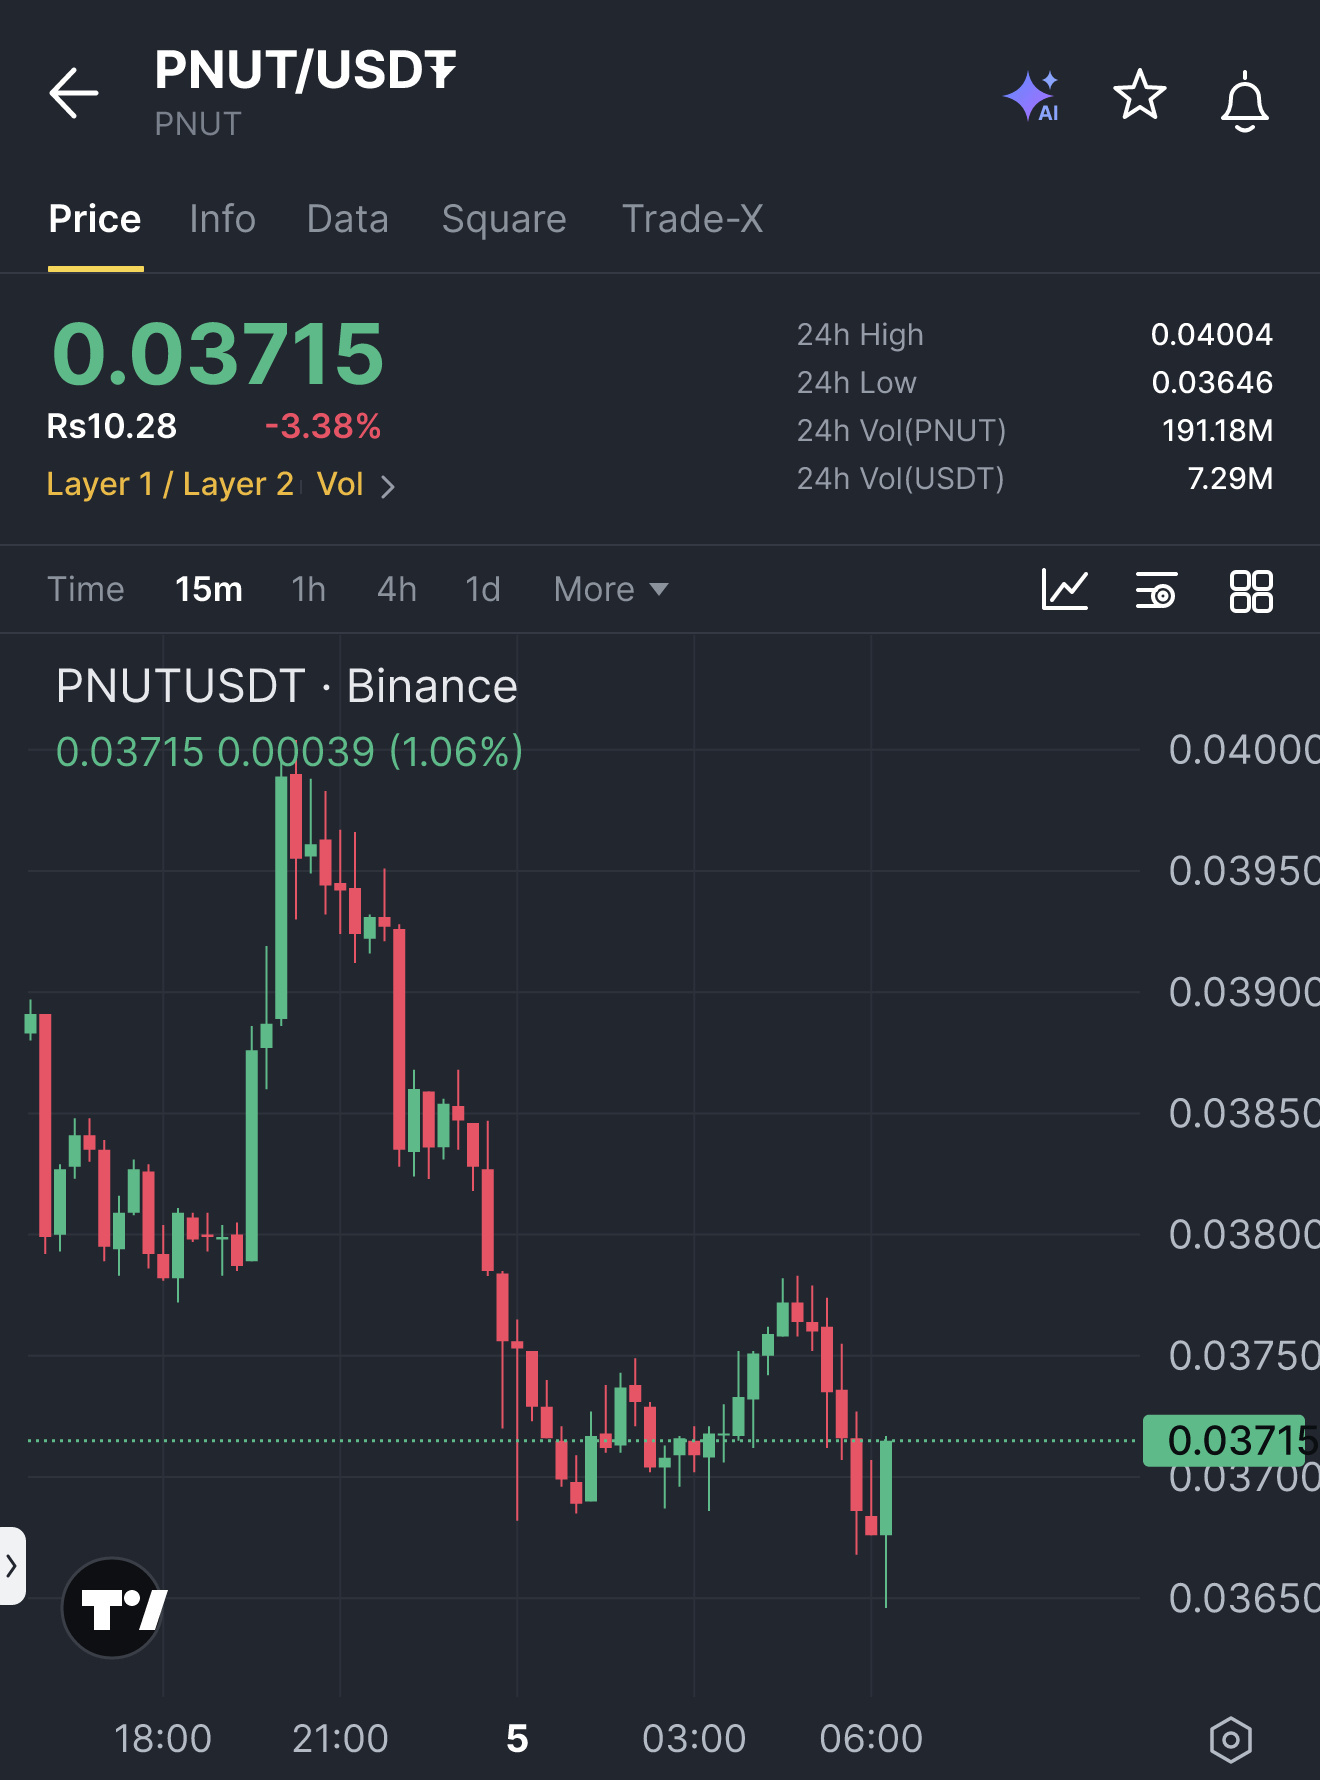
🚀 $PNUT SURGES BEYOND KEY RESISTANCE – WHALE BUYERS ON THE MOVE 🦈
Entry: 0.03715 ⚡
Stop Loss: 0.03642 ⚠️
Target: 0.03825 🚀
Target: 0.03898 🚀
Target: 0.04007 🚀
📊 Buyers ripped the prior candle’s high after a steady decline, flipping the momentum into a clean recovery. 🌊 The order flow shows a fresh liquidity sweep, with smart money stepping in at 0.03715 and driving volume northward. ⚡ Each target aligns with the next order block, giving a layered profit ladder as the price climbs.
💬 How are you positioning for the next wave—stacking at the entry or scaling into the higher targets? 👇
⚠️ Not financial advice. Always manage your risk. 🛡️
🏷️ #PNUT #LongSetup #WhaleAction #Breakout #Crypto
🔥 💎
🚀 $PNUT SURGES BEYOND KEY RESISTANCE – WHALE BUYERS ON THE MOVE 🦈
Entry: 0.03715 ⚡
Stop Loss: 0.03642 ⚠️
Target: 0.03825 🚀
Target: 0.03898 🚀
Target: 0.04007 🚀
📊 Buyers ripped the prior candle’s high after a steady decline, flipping the momentum into a clean recovery. 🌊 The order flow shows a fresh liquidity sweep, with smart money stepping in at 0.03715 and driving volume northward. ⚡ Each target aligns with the next order block, giving a layered profit ladder as the price climbs.
💬 How are you positioning for the next wave—stacking at the entry or scaling into the higher targets? 👇
⚠️ Not financial advice. Always manage your risk. 🛡️
🏷️ #PNUT #LongSetup #WhaleAction #Breakout #Crypto
🔥 💎
Entry: 0.03715 ⚡
Stop Loss: 0.03642 ⚠️
Target: 0.03825 🚀
Target: 0.03898 🚀
Target: 0.04007 🚀
📊 Buyers ripped the prior candle’s high after a steady decline, flipping the momentum into a clean recovery. 🌊 The order flow shows a fresh liquidity sweep, with smart money stepping in at 0.03715 and driving volume northward. ⚡ Each target aligns with the next order block, giving a layered profit ladder as the price climbs.
💬 How are you positioning for the next wave—stacking at the entry or scaling into the higher targets? 👇
⚠️ Not financial advice. Always manage your risk. 🛡️
🏷️ #PNUT #LongSetup #WhaleAction #Breakout #Crypto
🔥 💎
31

·
--
PNUT buy pressure is strengthening.
Buy Share
15m 78.1% | 1h 57.0%
4h 44.5% | 12h 45.4% | 1D 41.6%
15m Flow
Buy $48.52K | Sell $13.62K
Net +$34.90K | B/S 3.56
Cash Share 0.2%
Market
12h 52.5% | 1D 52.1%
Order Book: Bid-heavy (1.72)
Buy-side flow is also supported by bid-heavy order-book depth.
RADAVOX Market Intelligence
#PNUT #Crypto
PNUT buy pressure is strengthening.
Buy Share
15m 78.1% | 1h 57.0%
4h 44.5% | 12h 45.4% | 1D 41.6%
15m Flow
Buy $48.52K | Sell $13.62K
Net +$34.90K | B/S 3.56
Cash Share 0.2%
Market
12h 52.5% | 1D 52.1%
Order Book: Bid-heavy (1.72)
Buy-side flow is also supported by bid-heavy order-book depth.
RADAVOX Market Intelligence
#PNUT #Crypto
Buy Share
15m 78.1% | 1h 57.0%
4h 44.5% | 12h 45.4% | 1D 41.6%
15m Flow
Buy $48.52K | Sell $13.62K
Net +$34.90K | B/S 3.56
Cash Share 0.2%
Market
12h 52.5% | 1D 52.1%
Order Book: Bid-heavy (1.72)
Buy-side flow is also supported by bid-heavy order-book depth.
RADAVOX Market Intelligence
#PNUT #Crypto
63

·
--
Bullish
🚀 A new update is on the horizon for PNUT!
The official PNUT - Peanut The Squirrel account on X posted a teaser saying: "Cooking up something nuts... Stay tuned for updates soon," hinting at upcoming developments or surprises.
📊 Expected impact on the coin:
Teaser posts like these often excite the community and increase speculative momentum around the coin, which may lead to higher trading volume and positive price movements in the short term, until the official details are revealed. Markets are watching for any new announcement that could drive another upward price wave.
#Pnut #bullish #cryptosignals
$PNUT
{spot}(PNUTUSDT)
🚀 A new update is on the horizon for PNUT!
The official PNUT - Peanut The Squirrel account on X posted a teaser saying: "Cooking up something nuts... Stay tuned for updates soon," hinting at upcoming developments or surprises.
📊 Expected impact on the coin:
Teaser posts like these often excite the community and increase speculative momentum around the coin, which may lead to higher trading volume and positive price movements in the short term, until the official details are revealed. Markets are watching for any new announcement that could drive another upward price wave.
#Pnut #bullish #cryptosignals
$PNUT
The official PNUT - Peanut The Squirrel account on X posted a teaser saying: "Cooking up something nuts... Stay tuned for updates soon," hinting at upcoming developments or surprises.
📊 Expected impact on the coin:
Teaser posts like these often excite the community and increase speculative momentum around the coin, which may lead to higher trading volume and positive price movements in the short term, until the official details are revealed. Markets are watching for any new announcement that could drive another upward price wave.
#Pnut #bullish #cryptosignals
$PNUT
1
1

·
--
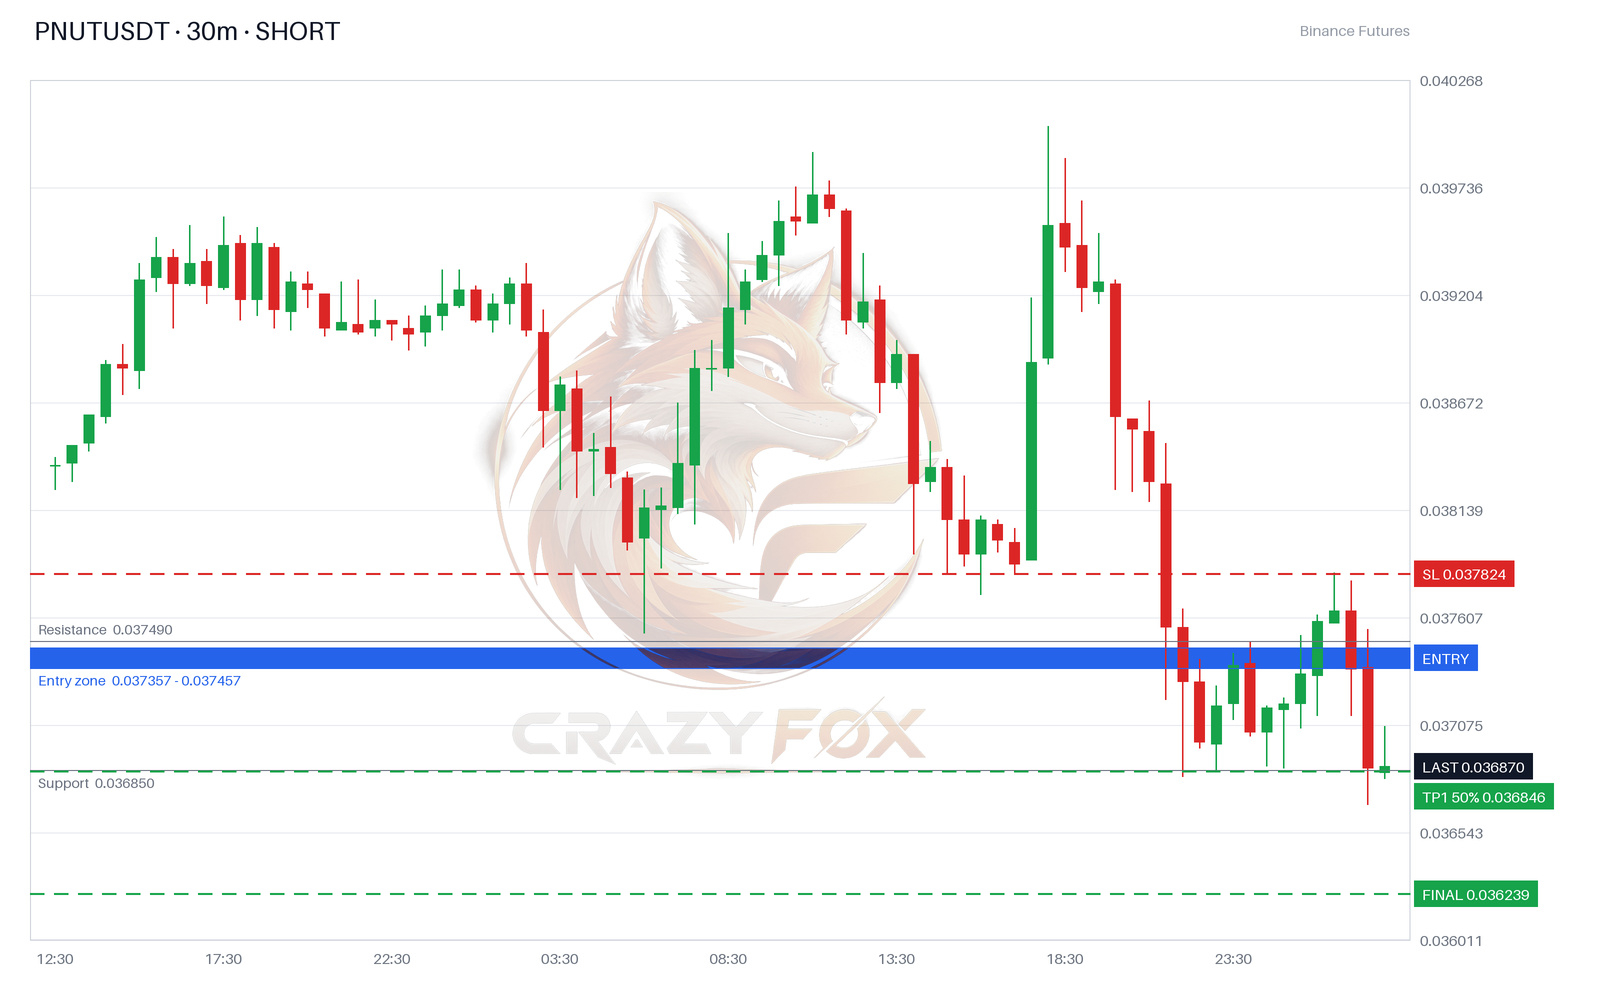
🦊 $PNUT · SHORT SELL 📉 · 30m
📍 Entry: 0.037357 – 0.037457 (wait for the rebound)
🎯 Target 1: 0.036990 (-1.11%)
🎯 Target 2: 0.036656 (-2.01%)
🎯 Target 3: 0.036239 (-3.12%)
🛑 Stop: 0.037824 (+1.11%)
🤝 Your money is entrusted to us · Not financial advice
#PNUT #CRAZYFOX
🦊 $PNUT · SHORT SELL 📉 · 30m
📍 Entry: 0.037357 – 0.037457 (wait for the rebound)
🎯 Target 1: 0.036990 (-1.11%)
🎯 Target 2: 0.036656 (-2.01%)
🎯 Target 3: 0.036239 (-3.12%)
🛑 Stop: 0.037824 (+1.11%)
🤝 Your money is entrusted to us · Not financial advice
#PNUT #CRAZYFOX
📍 Entry: 0.037357 – 0.037457 (wait for the rebound)
🎯 Target 1: 0.036990 (-1.11%)
🎯 Target 2: 0.036656 (-2.01%)
🎯 Target 3: 0.036239 (-3.12%)
🛑 Stop: 0.037824 (+1.11%)
🤝 Your money is entrusted to us · Not financial advice
#PNUT #CRAZYFOX
127

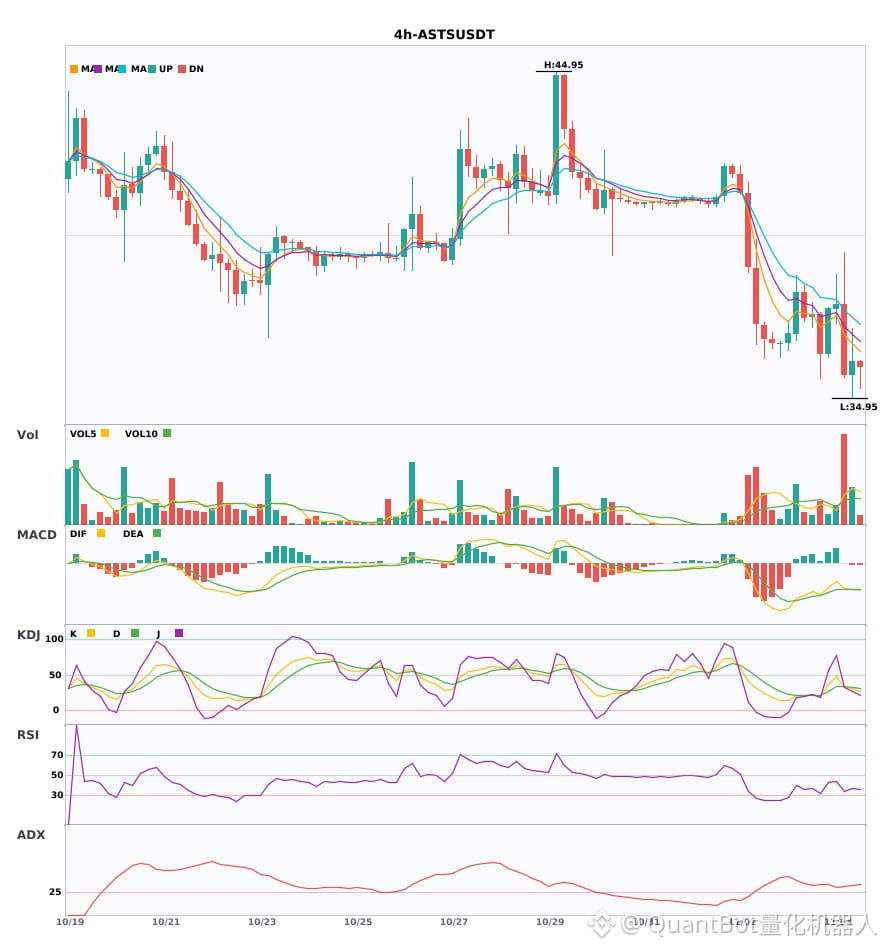
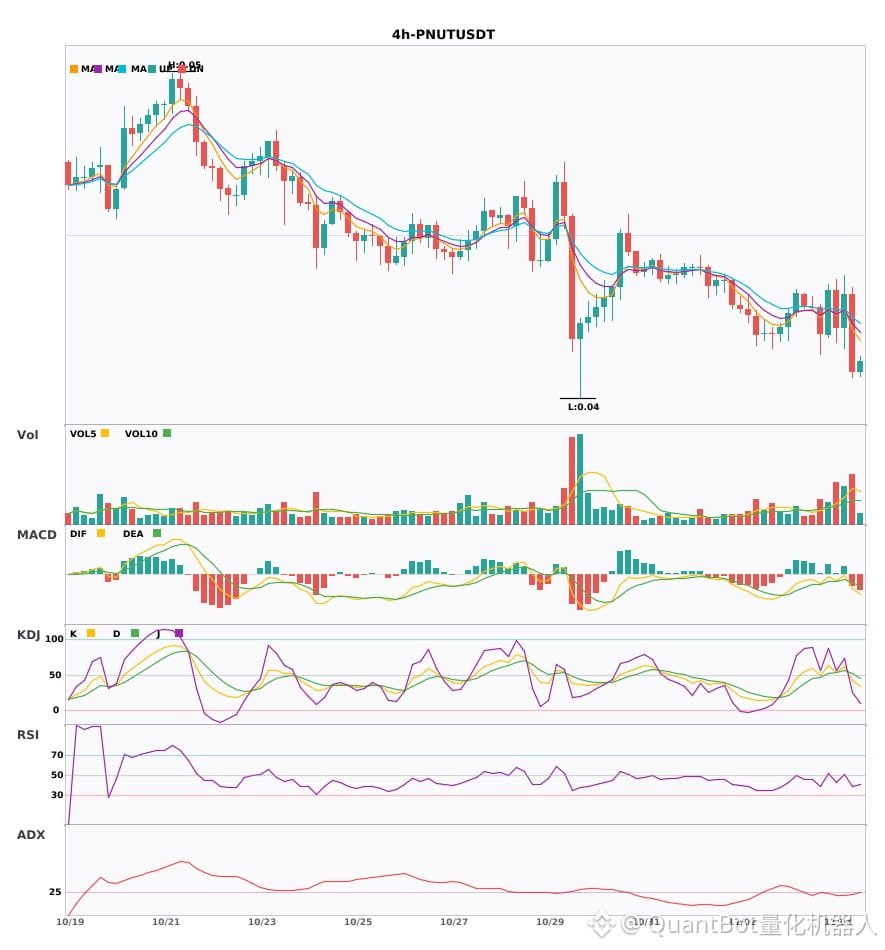
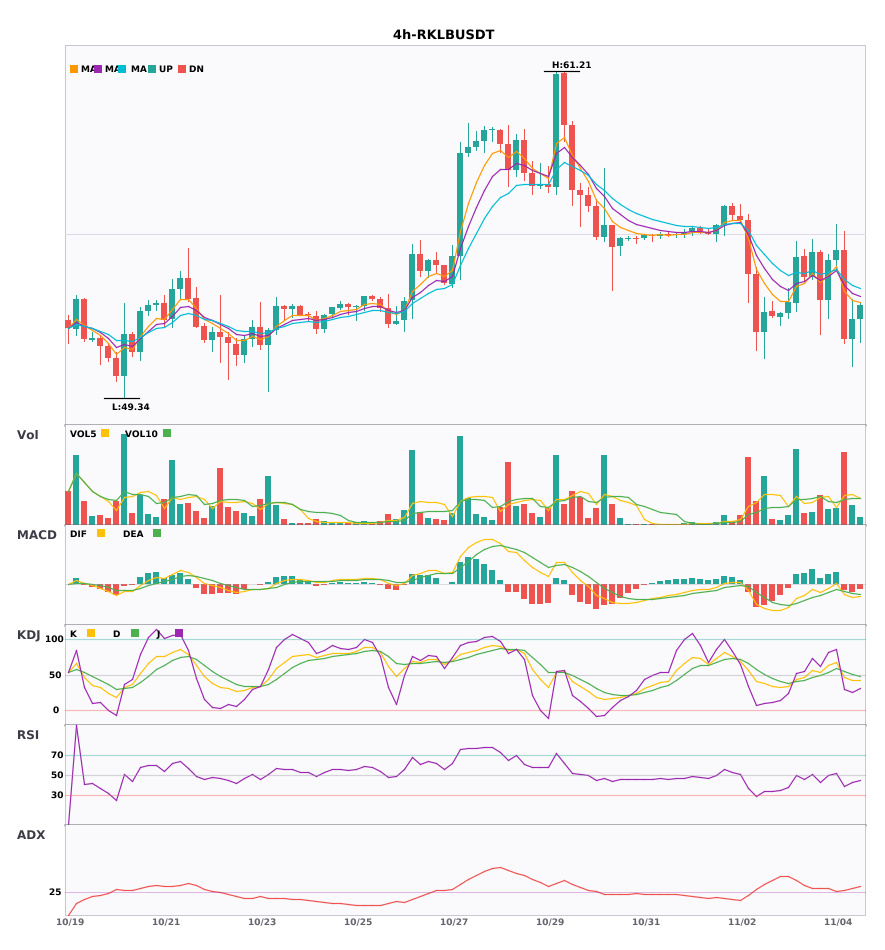
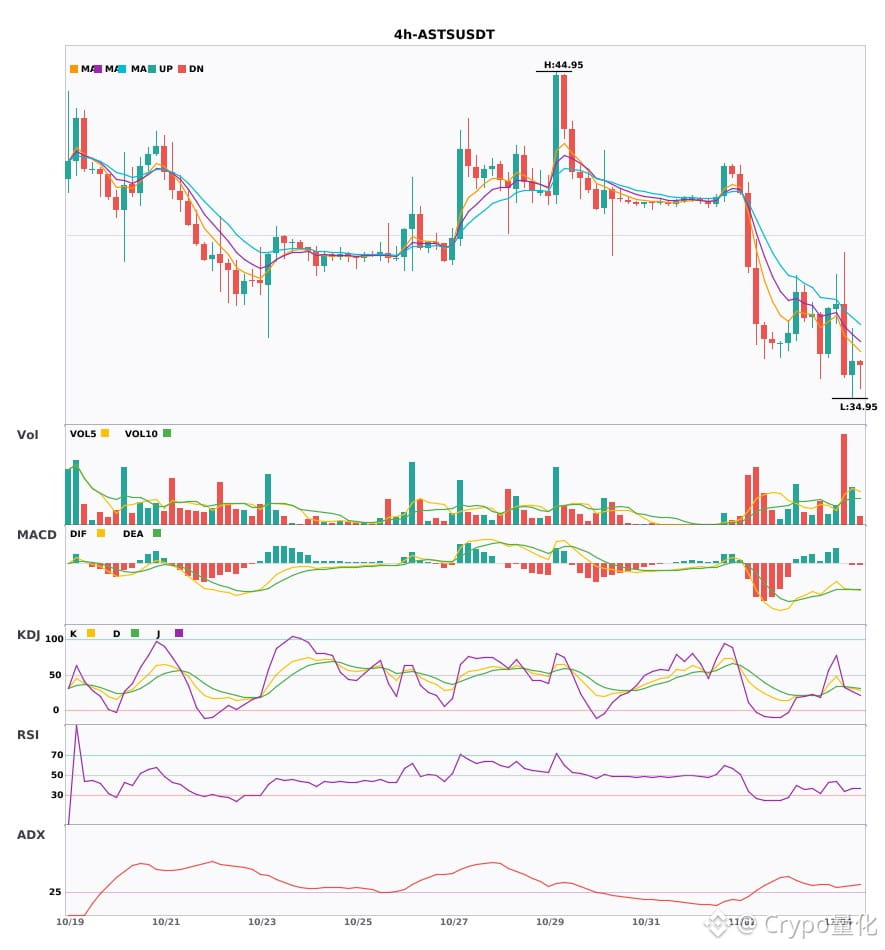
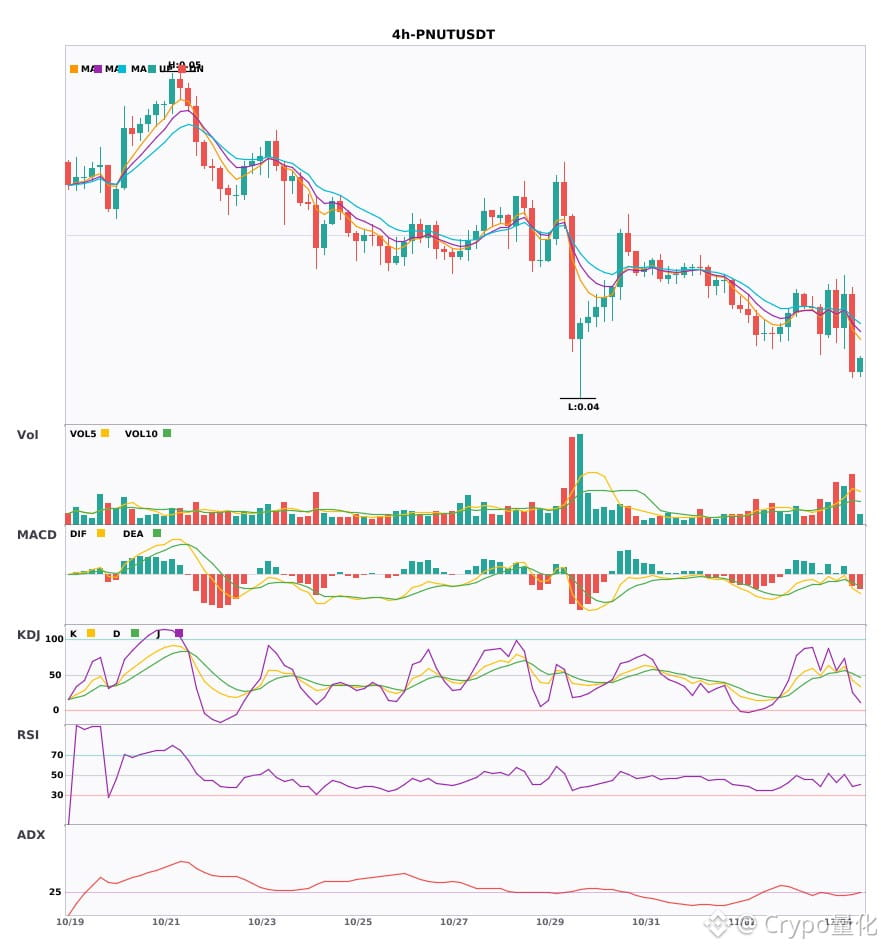
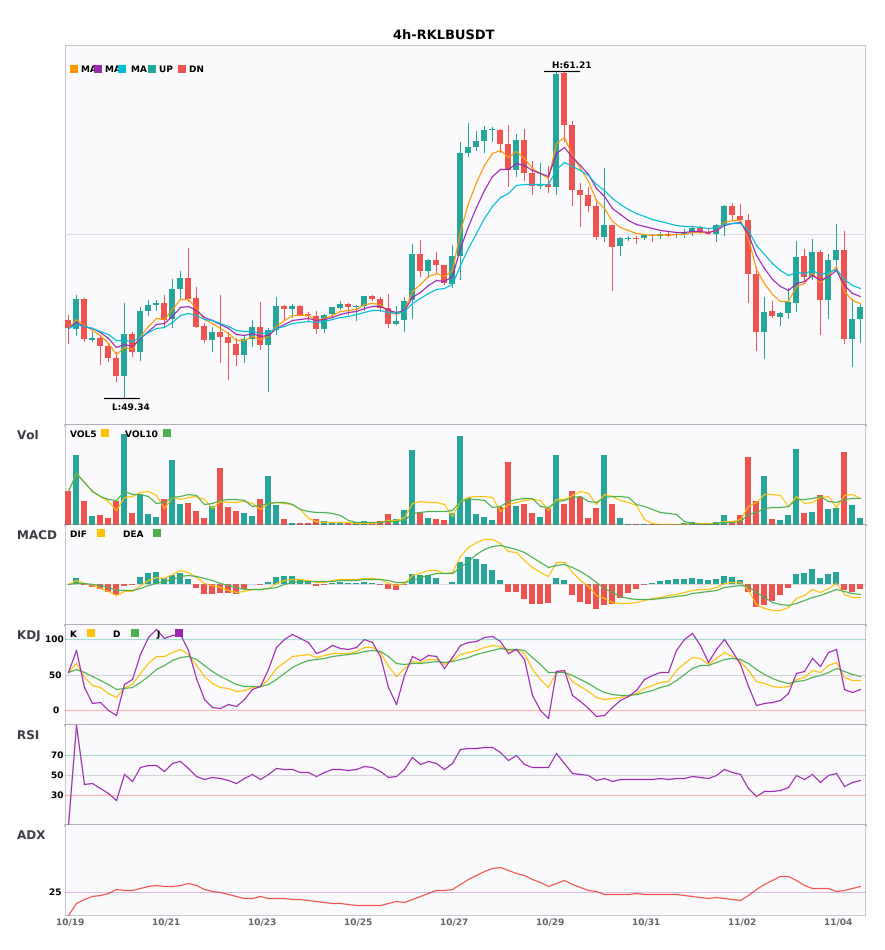
3 4-hour bearish alerts: $ASTS / $PNUT / $RKLB
📉 $ASTS | 4-hour bearish signal
━━━━━━━━━━━━━━━━━━
Technical analysis: ADX(32) clear trending market | MACD bearish crossover below zero, bearish momentum accelerating | EMA5 < EMA8 < EMA13, bearish alignment | KDJ in weak territory, bears in control (K: 30.6, D: 32.5) | Volume surge (3.8x)
Price change: 1.2100%
📉 $PNUT | 4-hour bearish signal
━━━━━━━━━━━━━━━━━━
Technical analysis: ADX(25) trend forming, opportunity to participate | MACD bearish crossover below zero, bearish momentum accelerating | EMA5 crossed below EMA8, short-term outlook turns bearish | KDJ bearish crossover, short-term bearish outlook (K: 42.7, D: 51.5) | Volume increase (2.1x)
Price change: -6.2100%
📉 $RKLB | 4-hour bearish signal
━━━━━━━━━━━━━━━━━━
Technical analysis: ADX(28) trend forming, opportunity to participate | MACD bearish crossover below zero, bearish momentum accelerating | EMA5 crossed below EMA8, short-term outlook turns bearish | KDJ bearish crossover, short-term bearish outlook (K: 46.1, D: 54.3) | Volume surge (2.9x)
Price change: -5.9400%
━━━━━━━━━━━━━━━━━━
#技术分析 #ASTS #PNUT #RKLB
📌 The above content is for reference only and does not constitute investment advice
3 4-hour bearish alerts: $ASTS / $PNUT / $RKLB
📉 $ASTS | 4-hour bearish signal
━━━━━━━━━━━━━━━━━━
Technical analysis: ADX(32) clear trending market | MACD bearish crossover below zero, bearish momentum accelerating | EMA5 < EMA8 < EMA13, bearish alignment | KDJ in weak territory, bears in control (K: 30.6, D: 32.5) | Volume surge (3.8x)
Price change: 1.2100%
📉 $PNUT | 4-hour bearish signal
━━━━━━━━━━━━━━━━━━
Technical analysis: ADX(25) trend forming, opportunity to participate | MACD bearish crossover below zero, bearish momentum accelerating | EMA5 crossed below EMA8, short-term outlook turns bearish | KDJ bearish crossover, short-term bearish outlook (K: 42.7, D: 51.5) | Volume increase (2.1x)
Price change: -6.2100%
📉 $RKLB | 4-hour bearish signal
━━━━━━━━━━━━━━━━━━
Technical analysis: ADX(28) trend forming, opportunity to participate | MACD bearish crossover below zero, bearish momentum accelerating | EMA5 crossed below EMA8, short-term outlook turns bearish | KDJ bearish crossover, short-term bearish outlook (K: 46.1, D: 54.3) | Volume surge (2.9x)
Price change: -5.9400%
━━━━━━━━━━━━━━━━━━
#技术分析 #ASTS #PNUT #RKLB
📌 The above content is for reference only and does not constitute investment advice
📉 $ASTS | 4-hour bearish signal
━━━━━━━━━━━━━━━━━━
Technical analysis: ADX(32) clear trending market | MACD bearish crossover below zero, bearish momentum accelerating | EMA5 < EMA8 < EMA13, bearish alignment | KDJ in weak territory, bears in control (K: 30.6, D: 32.5) | Volume surge (3.8x)
Price change: 1.2100%
📉 $PNUT | 4-hour bearish signal
━━━━━━━━━━━━━━━━━━
Technical analysis: ADX(25) trend forming, opportunity to participate | MACD bearish crossover below zero, bearish momentum accelerating | EMA5 crossed below EMA8, short-term outlook turns bearish | KDJ bearish crossover, short-term bearish outlook (K: 42.7, D: 51.5) | Volume increase (2.1x)
Price change: -6.2100%
📉 $RKLB | 4-hour bearish signal
━━━━━━━━━━━━━━━━━━
Technical analysis: ADX(28) trend forming, opportunity to participate | MACD bearish crossover below zero, bearish momentum accelerating | EMA5 crossed below EMA8, short-term outlook turns bearish | KDJ bearish crossover, short-term bearish outlook (K: 46.1, D: 54.3) | Volume surge (2.9x)
Price change: -5.9400%
━━━━━━━━━━━━━━━━━━
#技术分析 #ASTS #PNUT #RKLB
📌 The above content is for reference only and does not constitute investment advice
12

·
--
$ASTS / $PNUT / $RKLB 4-hour technical indicators are weakening in sync; watch out for risk 🔥
════════════════════
🟢 $ASTS 4-hour bearish signal
⚠️Technical analysis: ADX(32) Strong trending market | MACD bearish cross below zero, bearish momentum accelerating | EMA5 < EMA8 < EMA13, bearish alignment | KDJ trending weakly, bears in control (K=30.6, D=32.5) | Volume surge (3.8x)
════════════════════
🟢 $PNUT 4-hour bearish signal
⚠️Technical analysis: ADX(25) Trend forming, potential entry | MACD bearish cross below zero, bearish momentum accelerating | EMA5 crossed below EMA8, short-term outlook turns bearish | KDJ bearish cross, short-term bearish outlook (K=42.7, D=51.5) | Volume increased (2.1x)
════════════════════
🟢 $RKLB 4-hour bearish signal
⚠️Technical analysis: ADX(28) Trend forming, potential entry | MACD bearish cross below zero, bearish momentum accelerating | EMA5 crossed below EMA8, short-term outlook turns bearish | KDJ bearish cross, short-term bearish outlook (K=46.1, D=54.3) | Volume surge (2.9x)
════════════════════
🔔 Follow for first-hand updates on unusual market movements 🔔
#技术分析 #ASTS #PNUT #RKLB
📌 When trading, check whether the candlestick pattern aligns
$ASTS / $PNUT / $RKLB 4-hour technical indicators are weakening in sync; watch out for risk 🔥
════════════════════
🟢 $ASTS 4-hour bearish signal
⚠️Technical analysis: ADX(32) Strong trending market | MACD bearish cross below zero, bearish momentum accelerating | EMA5 < EMA8 < EMA13, bearish alignment | KDJ trending weakly, bears in control (K=30.6, D=32.5) | Volume surge (3.8x)
════════════════════
🟢 $PNUT 4-hour bearish signal
⚠️Technical analysis: ADX(25) Trend forming, potential entry | MACD bearish cross below zero, bearish momentum accelerating | EMA5 crossed below EMA8, short-term outlook turns bearish | KDJ bearish cross, short-term bearish outlook (K=42.7, D=51.5) | Volume increased (2.1x)
════════════════════
🟢 $RKLB 4-hour bearish signal
⚠️Technical analysis: ADX(28) Trend forming, potential entry | MACD bearish cross below zero, bearish momentum accelerating | EMA5 crossed below EMA8, short-term outlook turns bearish | KDJ bearish cross, short-term bearish outlook (K=46.1, D=54.3) | Volume surge (2.9x)
════════════════════
🔔 Follow for first-hand updates on unusual market movements 🔔
#技术分析 #ASTS #PNUT #RKLB
📌 When trading, check whether the candlestick pattern aligns
════════════════════
🟢 $ASTS 4-hour bearish signal
⚠️Technical analysis: ADX(32) Strong trending market | MACD bearish cross below zero, bearish momentum accelerating | EMA5 < EMA8 < EMA13, bearish alignment | KDJ trending weakly, bears in control (K=30.6, D=32.5) | Volume surge (3.8x)
════════════════════
🟢 $PNUT 4-hour bearish signal
⚠️Technical analysis: ADX(25) Trend forming, potential entry | MACD bearish cross below zero, bearish momentum accelerating | EMA5 crossed below EMA8, short-term outlook turns bearish | KDJ bearish cross, short-term bearish outlook (K=42.7, D=51.5) | Volume increased (2.1x)
════════════════════
🟢 $RKLB 4-hour bearish signal
⚠️Technical analysis: ADX(28) Trend forming, potential entry | MACD bearish cross below zero, bearish momentum accelerating | EMA5 crossed below EMA8, short-term outlook turns bearish | KDJ bearish cross, short-term bearish outlook (K=46.1, D=54.3) | Volume surge (2.9x)
════════════════════
🔔 Follow for first-hand updates on unusual market movements 🔔
#技术分析 #ASTS #PNUT #RKLB
📌 When trading, check whether the candlestick pattern aligns
34

·
--
🐿️ $PNUT : When a News Story Becomes a Token
PNUT is named after Peanut the squirrel, whose story went viral and turned into a memecoin almost overnight.
What it shows 👇
In crypto, news → meme → token can happen in hours. The market prices attention, not fundamentals.
How these "news memes" usually trade:
📈 Fast spike while the story trends
📉 Long bleed once the news cycle moves on
🔁 Short revivals on anniversaries or new headlines
📌 If you trade them:
✅ Enter early or not at all
✅ Take profits aggressively
✅ Compare liquidity with established memes like $DOGE and $PEPE
💬 Would you ever buy a token created from a news story? 👇
⚠️ Educational content only, not financial advice. DYOR.
#PNUT #Memecoins #Crypto #BinanceSquare
🐿️ $PNUT : When a News Story Becomes a Token
PNUT is named after Peanut the squirrel, whose story went viral and turned into a memecoin almost overnight.
What it shows 👇
In crypto, news → meme → token can happen in hours. The market prices attention, not fundamentals.
How these "news memes" usually trade:
📈 Fast spike while the story trends
📉 Long bleed once the news cycle moves on
🔁 Short revivals on anniversaries or new headlines
📌 If you trade them:
✅ Enter early or not at all
✅ Take profits aggressively
✅ Compare liquidity with established memes like $DOGE and $PEPE
💬 Would you ever buy a token created from a news story? 👇
⚠️ Educational content only, not financial advice. DYOR.
#PNUT #Memecoins #Crypto #BinanceSquare
PNUT is named after Peanut the squirrel, whose story went viral and turned into a memecoin almost overnight.
What it shows 👇
In crypto, news → meme → token can happen in hours. The market prices attention, not fundamentals.
How these "news memes" usually trade:
📈 Fast spike while the story trends
📉 Long bleed once the news cycle moves on
🔁 Short revivals on anniversaries or new headlines
📌 If you trade them:
✅ Enter early or not at all
✅ Take profits aggressively
✅ Compare liquidity with established memes like $DOGE and $PEPE
💬 Would you ever buy a token created from a news story? 👇
⚠️ Educational content only, not financial advice. DYOR.
#PNUT #Memecoins #Crypto #BinanceSquare

3
517

·
--
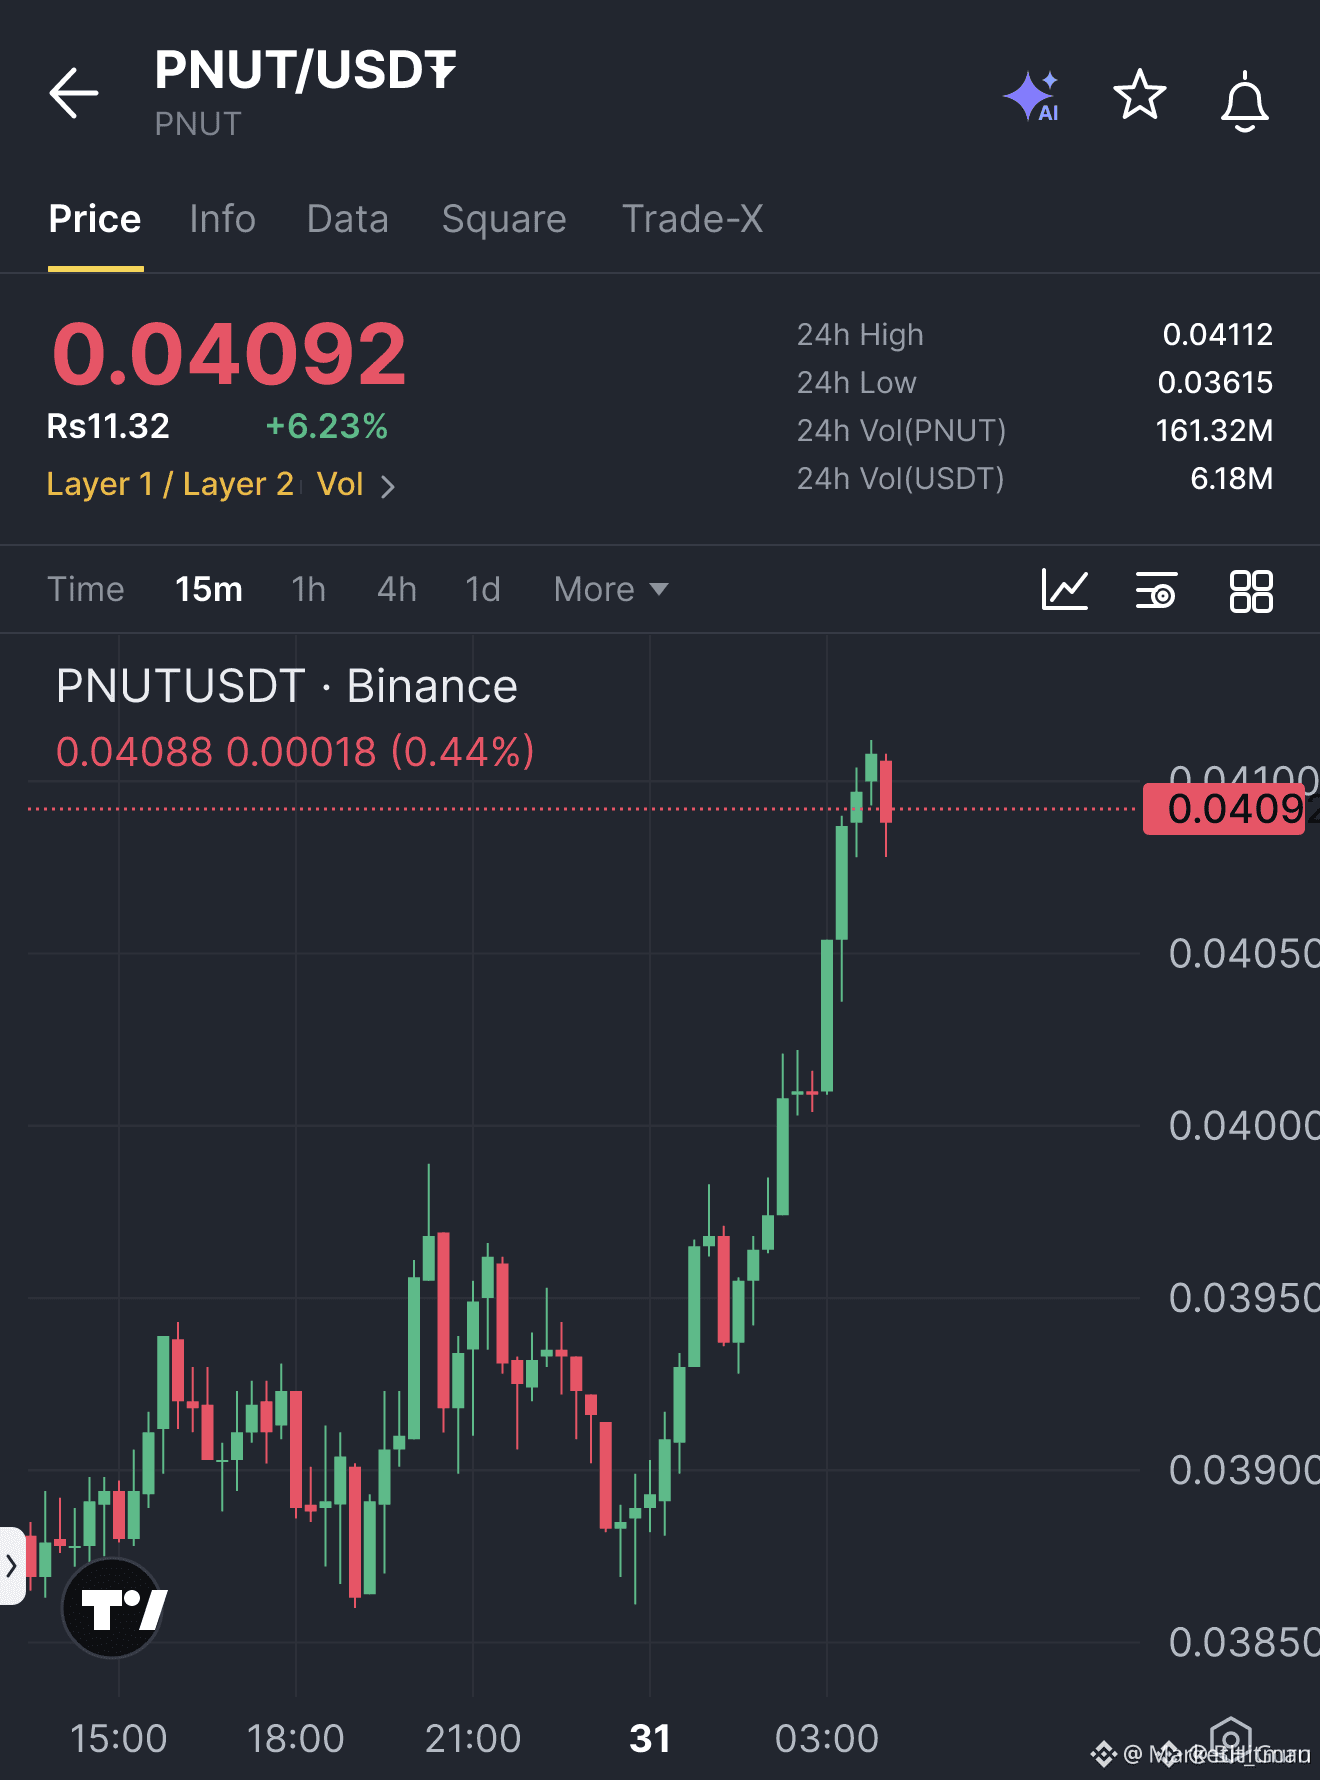
🚨 $PNUT LOSES MOMENTUM AS AGGRESSIVE SELLERS BREAK CRUCIAL STRUCTURE! 📉
Entry: 0.0409 ⚡
Target: 0.04051 / 0.04025 / 0.03986 🎯
Stop Loss: 0.04116 🛑
After a sustained climb, buyer exhaustion has finally opened the door for sellers to step in with conviction. 📉 The break below the prior candle low signals an immediate shift in short-term order flow, leaving late longs trapped at the top.
📌 We are tracking a clean pullback setup where market liquidity sits waiting across lower demand levels. ⚡ With structural invalidation clearly defined right above 0.04116, the asymmetric downside reward makes this setup prime for disciplined execution.
🤔 Are you front-running this corrective drop or waiting for the bids below? 👇
⚠️ Not financial advice. Always manage your risk. 🛡️
🏷️ #PNUT #ShortSetup #Bearish #PriceAction #Crypto
🎯 🐻
🚨 $PNUT LOSES MOMENTUM AS AGGRESSIVE SELLERS BREAK CRUCIAL STRUCTURE! 📉
Entry: 0.0409 ⚡
Target: 0.04051 / 0.04025 / 0.03986 🎯
Stop Loss: 0.04116 🛑
After a sustained climb, buyer exhaustion has finally opened the door for sellers to step in with conviction. 📉 The break below the prior candle low signals an immediate shift in short-term order flow, leaving late longs trapped at the top.
📌 We are tracking a clean pullback setup where market liquidity sits waiting across lower demand levels. ⚡ With structural invalidation clearly defined right above 0.04116, the asymmetric downside reward makes this setup prime for disciplined execution.
🤔 Are you front-running this corrective drop or waiting for the bids below? 👇
⚠️ Not financial advice. Always manage your risk. 🛡️
🏷️ #PNUT #ShortSetup #Bearish #PriceAction #Crypto
🎯 🐻
Entry: 0.0409 ⚡
Target: 0.04051 / 0.04025 / 0.03986 🎯
Stop Loss: 0.04116 🛑
After a sustained climb, buyer exhaustion has finally opened the door for sellers to step in with conviction. 📉 The break below the prior candle low signals an immediate shift in short-term order flow, leaving late longs trapped at the top.
📌 We are tracking a clean pullback setup where market liquidity sits waiting across lower demand levels. ⚡ With structural invalidation clearly defined right above 0.04116, the asymmetric downside reward makes this setup prime for disciplined execution.
🤔 Are you front-running this corrective drop or waiting for the bids below? 👇
⚠️ Not financial advice. Always manage your risk. 🛡️
🏷️ #PNUT #ShortSetup #Bearish #PriceAction #Crypto
🎯 🐻
50
Log in to explore more content
Join global crypto users on Binance Square
⚡️ Get latest and useful information about crypto.
💬 Trusted by the world’s largest crypto exchange.
👍 Discover real insights from verified creators.
Email / Phone number
Trending Topics
1
#JobsReportRaisesHikeOdds
515,224 views
3,321 Discussing
2
#CPITestsDecemberRateOutlook
148,467 views
1,098 Discussing
3
#BitcoinRebounds$75KAsChipsLead
47,455 views
341 Discussing
4
#US Data Center Rules May Constrain AI Expansion
71,905 views
229 Discussing
5
#ARKPlans14ThematicETFsCoveringAIAndTokenizedMarkets
4,218 views
67 Discussing
6
#WillAnthropicListOnTime
154,194 views
1,340 Discussing
7
#WillUS-IranTensionsBoostSafe-HavenDemand?
68,416 views
492 Discussing
8
#BitcoinETFsSee$412MNetOutflows
15,311 views
75 Discussing
9
#HKSFCPlansToRestrictCryptoAndExchangeTerms
59,081 views
530 Discussing
10
#TradFiForBeginners
91,156 views
985 Discussing