
#amat
amat
21,294 views
534 Discussing
Hot
Latest

·
--
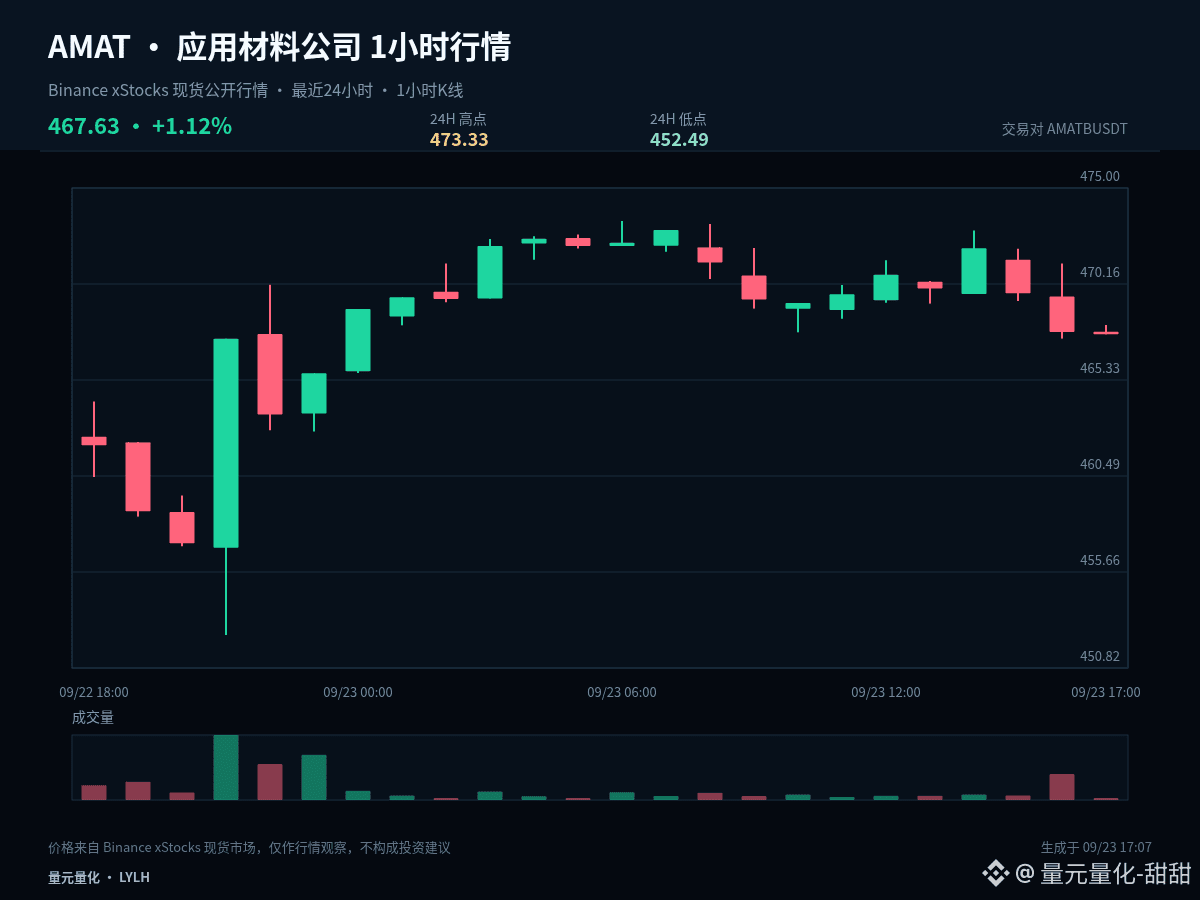
$AMATB #AMAT Placing the intraday conclusion first: if it can’t be reclaimed at 462.91, then you need to keep defending 452.49. Current price: 467.63, 1-hour -0.03%, 24-hour +2.06%.
At present, 1-hour -0.03% and 24-hour +2.06%—the two timeframes have not formed sufficiently clear alignment in the same direction. In a range-bound market, the tolerance for chasing or selling into weakness is lower. It’s more suitable to use confirmation of the upper boundary for direction and confirmation of the lower boundary for support/hold. The midline is only used as the line separating strength from weakness.
On key levels: 462.91 is the midline that must be reclaimed for a weak repair to take hold. If price can’t stand back above this level, any rebound should still be treated as a technical correction. Below, 452.49 still has a chance of being tested again. Only after reclaiming the midline do you earn the right to further observe 473.33.
My scenario analysis isn’t betting on a single direction. A break above 473.33 and the ability to hold it means the upside space has been reopened. A breakdown below 452.49 with an inability to snap back means the structure is further deteriorating. If price moves between the two, then keep monitoring the closing behavior on both sides of 462.91.
Position management should distinguish between swing/medium-term and short-term trades. For existing swing positions, first assess whether the structure is broken; don’t be repeatedly swayed by single 1-hour candlesticks. Short-term positions should be managed around support, resistance, and close-based confirmation. Those currently in cash don’t need to chase price in the middle of the range—waiting for a clearer location often offers an advantage.
Simplifying the conclusion doesn’t mean simplifying risk control. In real execution, you still must wait for price confirmation and leave room to exit in case your judgment is invalid. The real disagreement in this market lies in whether it will continue or return to the range. Will you wait for breakout confirmation, or will you wait for a support pullback? Share the price level you’re most focused on.
#CardanoJoinsX402PaymentStandard
$AMATB #AMAT Placing the intraday conclusion first: if it can’t be reclaimed at 462.91, then you need to keep defending 452.49. Current price: 467.63, 1-hour -0.03%, 24-hour +2.06%.
At present, 1-hour -0.03% and 24-hour +2.06%—the two timeframes have not formed sufficiently clear alignment in the same direction. In a range-bound market, the tolerance for chasing or selling into weakness is lower. It’s more suitable to use confirmation of the upper boundary for direction and confirmation of the lower boundary for support/hold. The midline is only used as the line separating strength from weakness.
On key levels: 462.91 is the midline that must be reclaimed for a weak repair to take hold. If price can’t stand back above this level, any rebound should still be treated as a technical correction. Below, 452.49 still has a chance of being tested again. Only after reclaiming the midline do you earn the right to further observe 473.33.
My scenario analysis isn’t betting on a single direction. A break above 473.33 and the ability to hold it means the upside space has been reopened. A breakdown below 452.49 with an inability to snap back means the structure is further deteriorating. If price moves between the two, then keep monitoring the closing behavior on both sides of 462.91.
Position management should distinguish between swing/medium-term and short-term trades. For existing swing positions, first assess whether the structure is broken; don’t be repeatedly swayed by single 1-hour candlesticks. Short-term positions should be managed around support, resistance, and close-based confirmation. Those currently in cash don’t need to chase price in the middle of the range—waiting for a clearer location often offers an advantage.
Simplifying the conclusion doesn’t mean simplifying risk control. In real execution, you still must wait for price confirmation and leave room to exit in case your judgment is invalid. The real disagreement in this market lies in whether it will continue or return to the range. Will you wait for breakout confirmation, or will you wait for a support pullback? Share the price level you’re most focused on.
#CardanoJoinsX402PaymentStandard
At present, 1-hour -0.03% and 24-hour +2.06%—the two timeframes have not formed sufficiently clear alignment in the same direction. In a range-bound market, the tolerance for chasing or selling into weakness is lower. It’s more suitable to use confirmation of the upper boundary for direction and confirmation of the lower boundary for support/hold. The midline is only used as the line separating strength from weakness.
On key levels: 462.91 is the midline that must be reclaimed for a weak repair to take hold. If price can’t stand back above this level, any rebound should still be treated as a technical correction. Below, 452.49 still has a chance of being tested again. Only after reclaiming the midline do you earn the right to further observe 473.33.
My scenario analysis isn’t betting on a single direction. A break above 473.33 and the ability to hold it means the upside space has been reopened. A breakdown below 452.49 with an inability to snap back means the structure is further deteriorating. If price moves between the two, then keep monitoring the closing behavior on both sides of 462.91.
Position management should distinguish between swing/medium-term and short-term trades. For existing swing positions, first assess whether the structure is broken; don’t be repeatedly swayed by single 1-hour candlesticks. Short-term positions should be managed around support, resistance, and close-based confirmation. Those currently in cash don’t need to chase price in the middle of the range—waiting for a clearer location often offers an advantage.
Simplifying the conclusion doesn’t mean simplifying risk control. In real execution, you still must wait for price confirmation and leave room to exit in case your judgment is invalid. The real disagreement in this market lies in whether it will continue or return to the range. Will you wait for breakout confirmation, or will you wait for a support pullback? Share the price level you’re most focused on.
#CardanoJoinsX402PaymentStandard
14

$AMAT LONG
🔹Entry zone: 447.03
✅Take 1: 449.18507979 (+0.48%)
✅Take 2: 451.79015958 (+1.06%)
✅Take 3: 455.69777927 (+1.94%)
🛡Protection: 442.67238031 (-0.97%)
The position is oriented toward an upward scenario, supported by the 447.03 level, where buyers are trying to maintain control of the situation. The market is forming the conditions for growth if bulls can hold their ground, maintain initiative, and protect the current zone from a pullback.
⚠️ This is not financial advice. Trade at your own risk. DYOR.
#AMAT #ZEC #Bitcoin 📈
$AMAT
$AMAT LONG
🔹Entry zone: 447.03
✅Take 1: 449.18507979 (+0.48%)
✅Take 2: 451.79015958 (+1.06%)
✅Take 3: 455.69777927 (+1.94%)
🛡Protection: 442.67238031 (-0.97%)
The position is oriented toward an upward scenario, supported by the 447.03 level, where buyers are trying to maintain control of the situation. The market is forming the conditions for growth if bulls can hold their ground, maintain initiative, and protect the current zone from a pullback.
⚠️ This is not financial advice. Trade at your own risk. DYOR.
#AMAT #ZEC #Bitcoin 📈
$AMAT
🔹Entry zone: 447.03
✅Take 1: 449.18507979 (+0.48%)
✅Take 2: 451.79015958 (+1.06%)
✅Take 3: 455.69777927 (+1.94%)
🛡Protection: 442.67238031 (-0.97%)
The position is oriented toward an upward scenario, supported by the 447.03 level, where buyers are trying to maintain control of the situation. The market is forming the conditions for growth if bulls can hold their ground, maintain initiative, and protect the current zone from a pullback.
⚠️ This is not financial advice. Trade at your own risk. DYOR.
#AMAT #ZEC #Bitcoin 📈
$AMAT
10
·
--
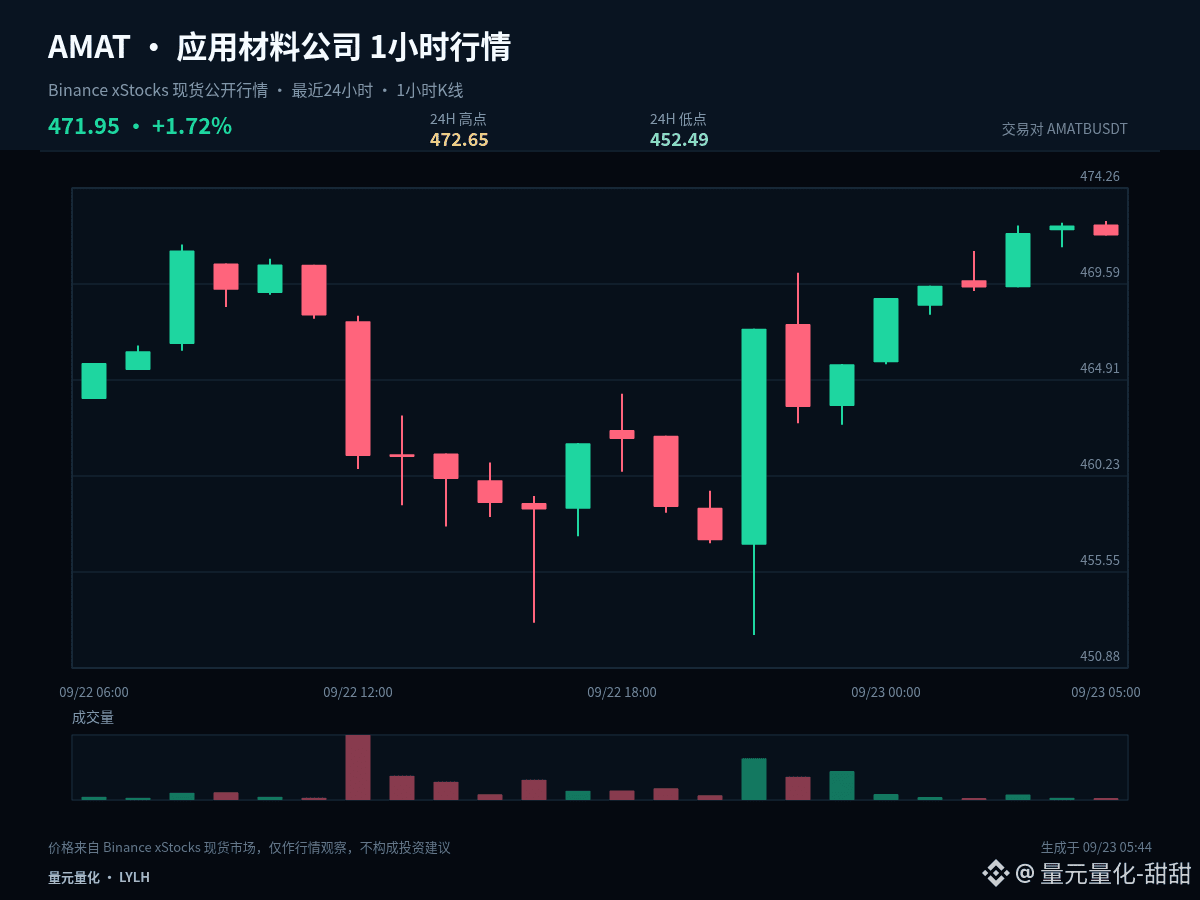
$AMATB #AMAT Right now it looks more like range-based rotation and turnover. You don’t need to explain every single 1-hour candlestick as a brand-new trend. Current price is 471.95, 1 hour -0.10%, 24 hours +1.56%.
The current price is near the upper bound of the past 24-hour range: 1 hour -0.10%, 24 hours +1.56%. The most important thing for the highs is confirming market acceptance after the breakout. If price can stay above the upper band, it shows the market is认可ing a higher range; if it only briefly pierces and then quickly snaps back, you need to guard against a false breakout.
The range top is 472.65, the range bottom is 452.49, and the midline is 462.57. When price is near the upper band, watch the breakout quality; near the lower band, watch for support/holding. Around the midline, reduce frequent trading—here it isn’t far enough from either side, so neither direction nor the risk-reward is clear.
The signals worth acting on are: after the price breaks the boundary, it is willing to stay in the new range; or after it dips to the boundary, it quickly pulls back. Without such confirmation, keep treating it as consolidation and don’t change the overall plan due to brief intraday fluctuations.
For existing positions, handle them in stages around key levels to avoid making all judgments at once. Those with no position should wait for breakout confirmation or for a retest that holds. For US stocks, also be mindful of volatility caused by trading session transitions—your plan should be based on price conditions, not on emotions replacing execution.
Your trading plan must include invalidation conditions. If you’re right, you can realize gains in portions; if you’re wrong, you must allow yourself to exit. Don’t use adding to positions to cover the fact that the original logic has already changed. The market will update, and your views should adjust based on price evidence.
#MuseOvertakesChatGPTAsTopFreeIOSApp
$AMATB #AMAT Right now it looks more like range-based rotation and turnover. You don’t need to explain every single 1-hour candlestick as a brand-new trend. Current price is 471.95, 1 hour -0.10%, 24 hours +1.56%.
The current price is near the upper bound of the past 24-hour range: 1 hour -0.10%, 24 hours +1.56%. The most important thing for the highs is confirming market acceptance after the breakout. If price can stay above the upper band, it shows the market is认可ing a higher range; if it only briefly pierces and then quickly snaps back, you need to guard against a false breakout.
The range top is 472.65, the range bottom is 452.49, and the midline is 462.57. When price is near the upper band, watch the breakout quality; near the lower band, watch for support/holding. Around the midline, reduce frequent trading—here it isn’t far enough from either side, so neither direction nor the risk-reward is clear.
The signals worth acting on are: after the price breaks the boundary, it is willing to stay in the new range; or after it dips to the boundary, it quickly pulls back. Without such confirmation, keep treating it as consolidation and don’t change the overall plan due to brief intraday fluctuations.
For existing positions, handle them in stages around key levels to avoid making all judgments at once. Those with no position should wait for breakout confirmation or for a retest that holds. For US stocks, also be mindful of volatility caused by trading session transitions—your plan should be based on price conditions, not on emotions replacing execution.
Your trading plan must include invalidation conditions. If you’re right, you can realize gains in portions; if you’re wrong, you must allow yourself to exit. Don’t use adding to positions to cover the fact that the original logic has already changed. The market will update, and your views should adjust based on price evidence.
#MuseOvertakesChatGPTAsTopFreeIOSApp
The current price is near the upper bound of the past 24-hour range: 1 hour -0.10%, 24 hours +1.56%. The most important thing for the highs is confirming market acceptance after the breakout. If price can stay above the upper band, it shows the market is认可ing a higher range; if it only briefly pierces and then quickly snaps back, you need to guard against a false breakout.
The range top is 472.65, the range bottom is 452.49, and the midline is 462.57. When price is near the upper band, watch the breakout quality; near the lower band, watch for support/holding. Around the midline, reduce frequent trading—here it isn’t far enough from either side, so neither direction nor the risk-reward is clear.
The signals worth acting on are: after the price breaks the boundary, it is willing to stay in the new range; or after it dips to the boundary, it quickly pulls back. Without such confirmation, keep treating it as consolidation and don’t change the overall plan due to brief intraday fluctuations.
For existing positions, handle them in stages around key levels to avoid making all judgments at once. Those with no position should wait for breakout confirmation or for a retest that holds. For US stocks, also be mindful of volatility caused by trading session transitions—your plan should be based on price conditions, not on emotions replacing execution.
Your trading plan must include invalidation conditions. If you’re right, you can realize gains in portions; if you’re wrong, you must allow yourself to exit. Don’t use adding to positions to cover the fact that the original logic has already changed. The market will update, and your views should adjust based on price evidence.
#MuseOvertakesChatGPTAsTopFreeIOSApp
3

·
--
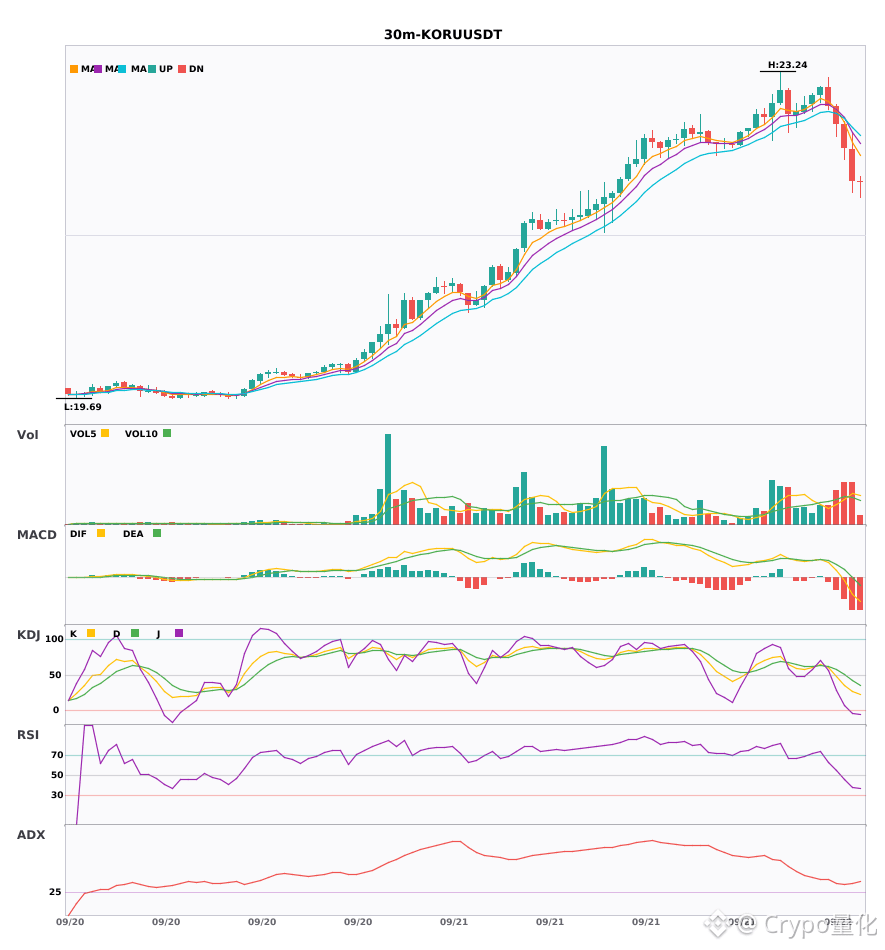
$AMAT / $JASMY / $KORU 30 minutes technical analysis sync weakens; watch out for risks🔥
════════════════════
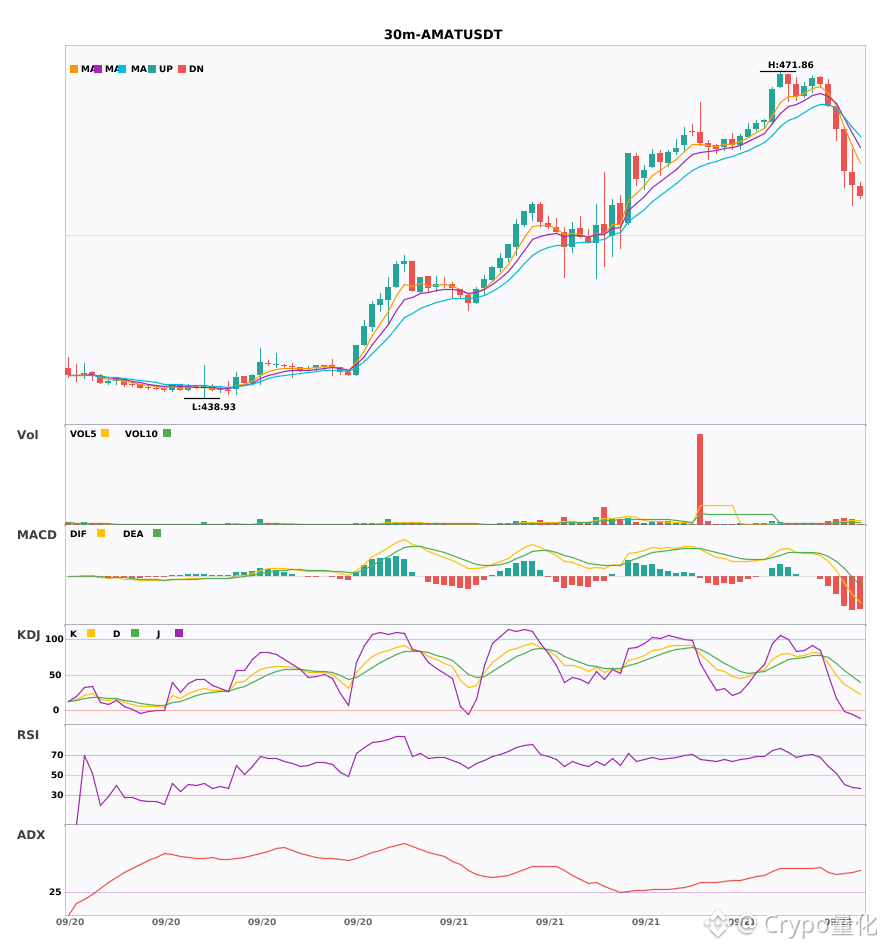
🟢 $AMAT 30 minutes Bearish signal
⚠️Technical analysis: ADX (48) is a very strong trend (be cautious of a hotness pullback) | MACD DIFF breaks below the zero line, trend turns bearish | EMA5 < EMA8 < EMA13 bearish alignment | Volume surges (2.5x)
════════════════════
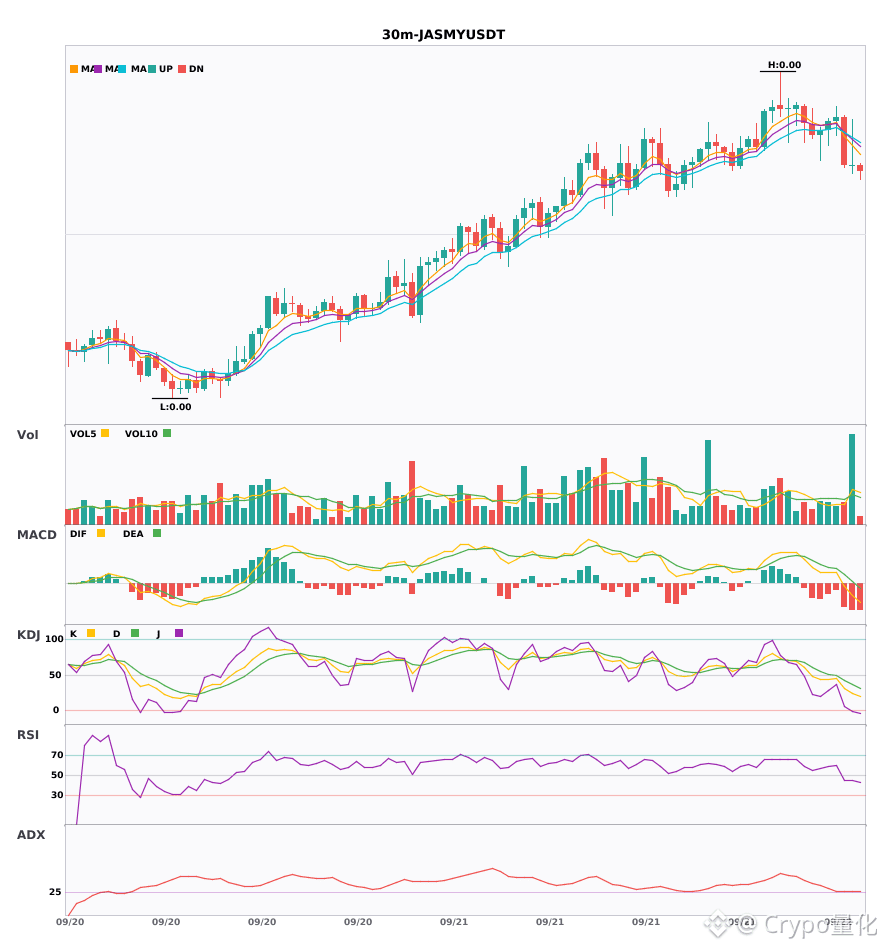
🟢 $JASMY 30 minutes Bearish signal
⚠️Technical analysis: ADX (26) — the trend is forming, you can participate | MACD is running bearish; the trend is weaker and momentum is increasing | EMA5 < EMA8 < EMA13 bearish alignment | KDJ is running weak with bears in control (K is 24.1, D is 36.6) | Volume surges (2.9x)
════════════════════
🟢 $KORU 30 minutes Bearish signal
⚠️Technical analysis: ADX (31) — a clear trending market | MACD DIFF breaks below the zero line, trend turns bearish | Moving averages are sticking together and building energy, soon to choose a direction | Volume expands (1.5x)
════════════════════
🔔 Pay attention to get the first-hand market move alerts 🔔
#技术分析 #AMAT #JASMY #KORU
📌 When trading, pay attention to whether the candlestick patterns match
$AMAT / $JASMY / $KORU 30 minutes technical analysis sync weakens; watch out for risks🔥
════════════════════
🟢 $AMAT 30 minutes Bearish signal
⚠️Technical analysis: ADX (48) is a very strong trend (be cautious of a hotness pullback) | MACD DIFF breaks below the zero line, trend turns bearish | EMA5 < EMA8 < EMA13 bearish alignment | Volume surges (2.5x)
════════════════════
🟢 $JASMY 30 minutes Bearish signal
⚠️Technical analysis: ADX (26) — the trend is forming, you can participate | MACD is running bearish; the trend is weaker and momentum is increasing | EMA5 < EMA8 < EMA13 bearish alignment | KDJ is running weak with bears in control (K is 24.1, D is 36.6) | Volume surges (2.9x)
════════════════════
🟢 $KORU 30 minutes Bearish signal
⚠️Technical analysis: ADX (31) — a clear trending market | MACD DIFF breaks below the zero line, trend turns bearish | Moving averages are sticking together and building energy, soon to choose a direction | Volume expands (1.5x)
════════════════════
🔔 Pay attention to get the first-hand market move alerts 🔔
#技术分析 #AMAT #JASMY #KORU
📌 When trading, pay attention to whether the candlestick patterns match
════════════════════
🟢 $AMAT 30 minutes Bearish signal
⚠️Technical analysis: ADX (48) is a very strong trend (be cautious of a hotness pullback) | MACD DIFF breaks below the zero line, trend turns bearish | EMA5 < EMA8 < EMA13 bearish alignment | Volume surges (2.5x)
════════════════════
🟢 $JASMY 30 minutes Bearish signal
⚠️Technical analysis: ADX (26) — the trend is forming, you can participate | MACD is running bearish; the trend is weaker and momentum is increasing | EMA5 < EMA8 < EMA13 bearish alignment | KDJ is running weak with bears in control (K is 24.1, D is 36.6) | Volume surges (2.9x)
════════════════════
🟢 $KORU 30 minutes Bearish signal
⚠️Technical analysis: ADX (31) — a clear trending market | MACD DIFF breaks below the zero line, trend turns bearish | Moving averages are sticking together and building energy, soon to choose a direction | Volume expands (1.5x)
════════════════════
🔔 Pay attention to get the first-hand market move alerts 🔔
#技术分析 #AMAT #JASMY #KORU
📌 When trading, pay attention to whether the candlestick patterns match
360
·
--
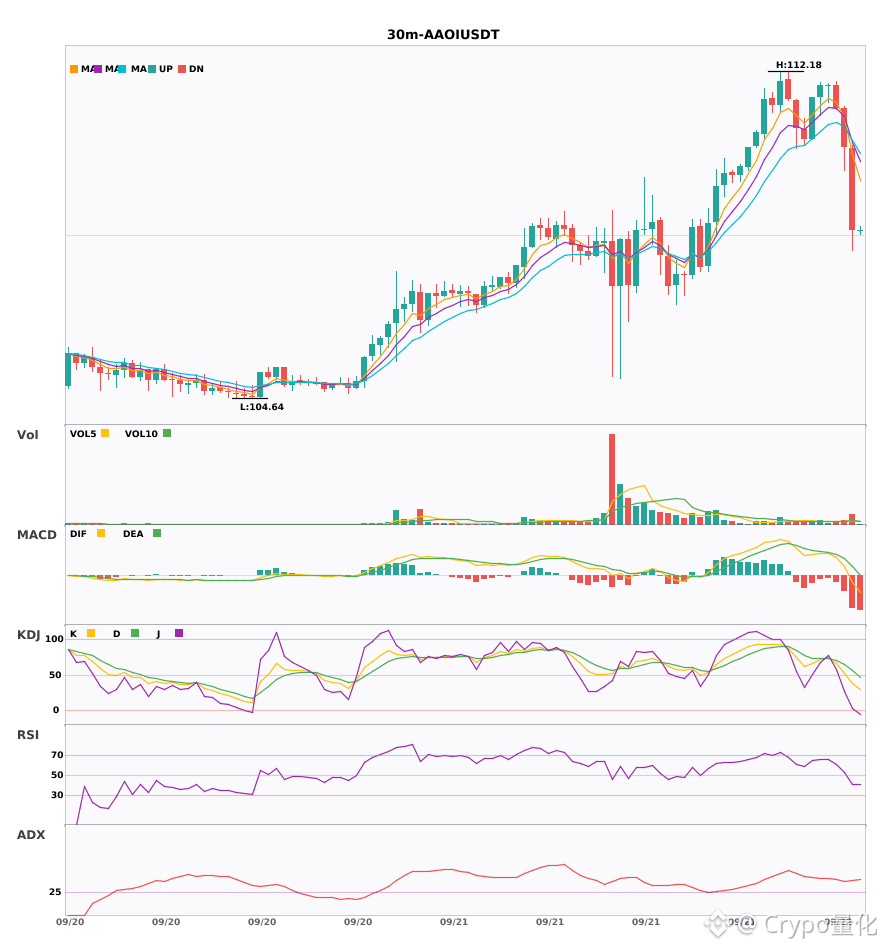
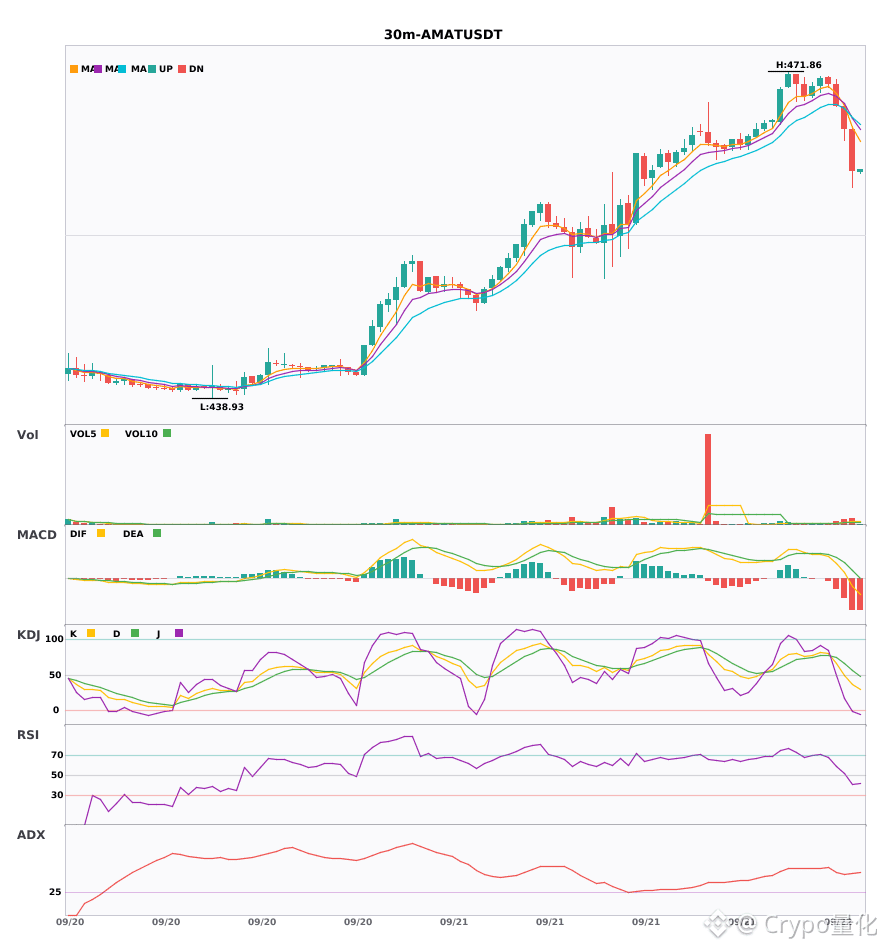
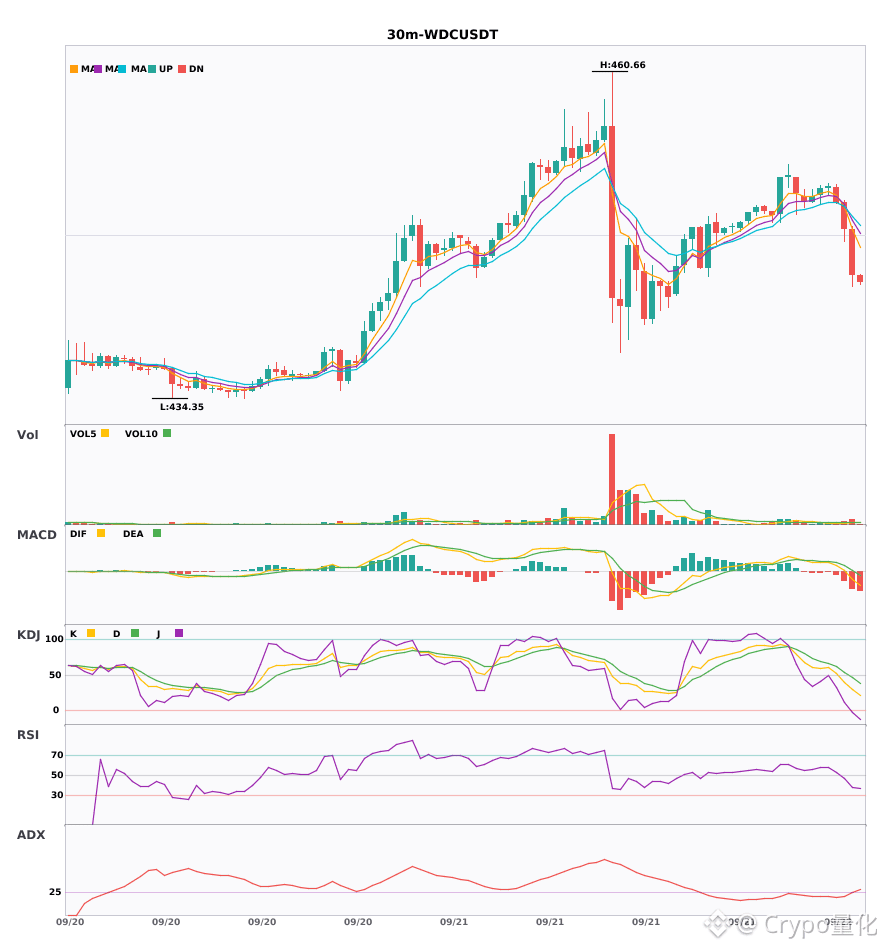
Three 30-minute-level short-selling alerts: $AAOI / $AMAT / $WDC🔥
════════════════════
🟢 $AAOI 30-minute Short Signal
⚠️ Technicals: ADX(41) shows a clear trending market | MACD DIF breaks below the zero line, trend turns bearish | EMA5 < EMA8 < EMA13 bearish alignment | Volume increases (2.2x)
════════════════════
🟢 $AMAT 30-minute Short Signal
⚠️ Technicals: ADX(48) is a very strong trend (watch for overheated pullbacks) | MACD DIF breaks below the zero line, trend turns bearish | EMA5 < EMA8 < EMA13 bearish alignment | Volume surges (2.5x)
════════════════════
🟢 $WDC 30-minute Short Signal
⚠️ Technicals: ADX(28) the trend is forming—can participate | MACD DIF breaks below the zero line, trend turns bearish | EMA5 < EMA8 < EMA13 bearish alignment | KDJ is weak (bearish dominates) (K is 29.5, D is 45.9) | Volume increases (1.9x)
════════════════════
🔔 Follow to get first-hand updates on market moves 🔔
#技术分析 #AAOI #AMAT #WDC
📌 When trading, pay attention to whether the candlestick patterns match
Three 30-minute-level short-selling alerts: $AAOI / $AMAT / $WDC 🔥
════════════════════
🟢 $AAOI 30-minute Short Signal
⚠️ Technicals: ADX(41) shows a clear trending market | MACD DIF breaks below the zero line, trend turns bearish | EMA5 < EMA8 < EMA13 bearish alignment | Volume increases (2.2x)
════════════════════
🟢 $AMAT 30-minute Short Signal
⚠️ Technicals: ADX(48) is a very strong trend (watch for overheated pullbacks) | MACD DIF breaks below the zero line, trend turns bearish | EMA5 < EMA8 < EMA13 bearish alignment | Volume surges (2.5x)
════════════════════
🟢 $WDC 30-minute Short Signal
⚠️ Technicals: ADX(28) the trend is forming—can participate | MACD DIF breaks below the zero line, trend turns bearish | EMA5 < EMA8 < EMA13 bearish alignment | KDJ is weak (bearish dominates) (K is 29.5, D is 45.9) | Volume increases (1.9x)
════════════════════
🔔 Follow to get first-hand updates on market moves 🔔
#技术分析 #AAOI #AMAT #WDC
📌 When trading, pay attention to whether the candlestick patterns match
════════════════════
🟢 $AAOI 30-minute Short Signal
⚠️ Technicals: ADX(41) shows a clear trending market | MACD DIF breaks below the zero line, trend turns bearish | EMA5 < EMA8 < EMA13 bearish alignment | Volume increases (2.2x)
════════════════════
🟢 $AMAT 30-minute Short Signal
⚠️ Technicals: ADX(48) is a very strong trend (watch for overheated pullbacks) | MACD DIF breaks below the zero line, trend turns bearish | EMA5 < EMA8 < EMA13 bearish alignment | Volume surges (2.5x)
════════════════════
🟢 $WDC 30-minute Short Signal
⚠️ Technicals: ADX(28) the trend is forming—can participate | MACD DIF breaks below the zero line, trend turns bearish | EMA5 < EMA8 < EMA13 bearish alignment | KDJ is weak (bearish dominates) (K is 29.5, D is 45.9) | Volume increases (1.9x)
════════════════════
🔔 Follow to get first-hand updates on market moves 🔔
#技术分析 #AAOI #AMAT #WDC
📌 When trading, pay attention to whether the candlestick patterns match
1

·
--
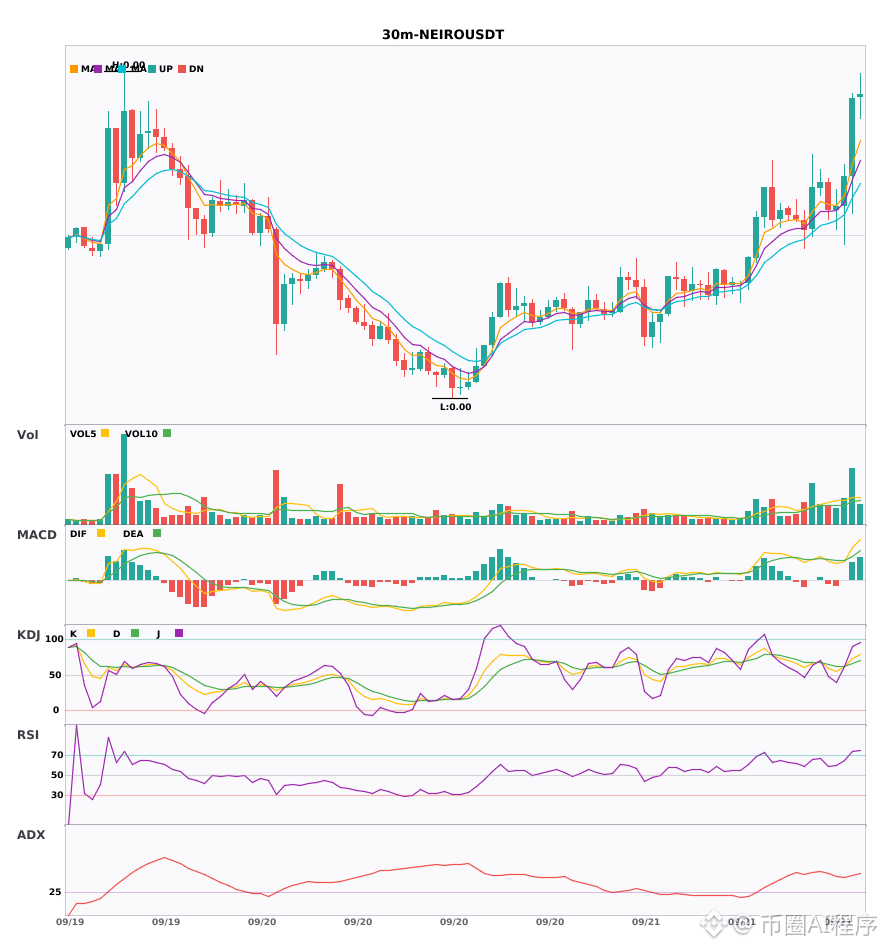
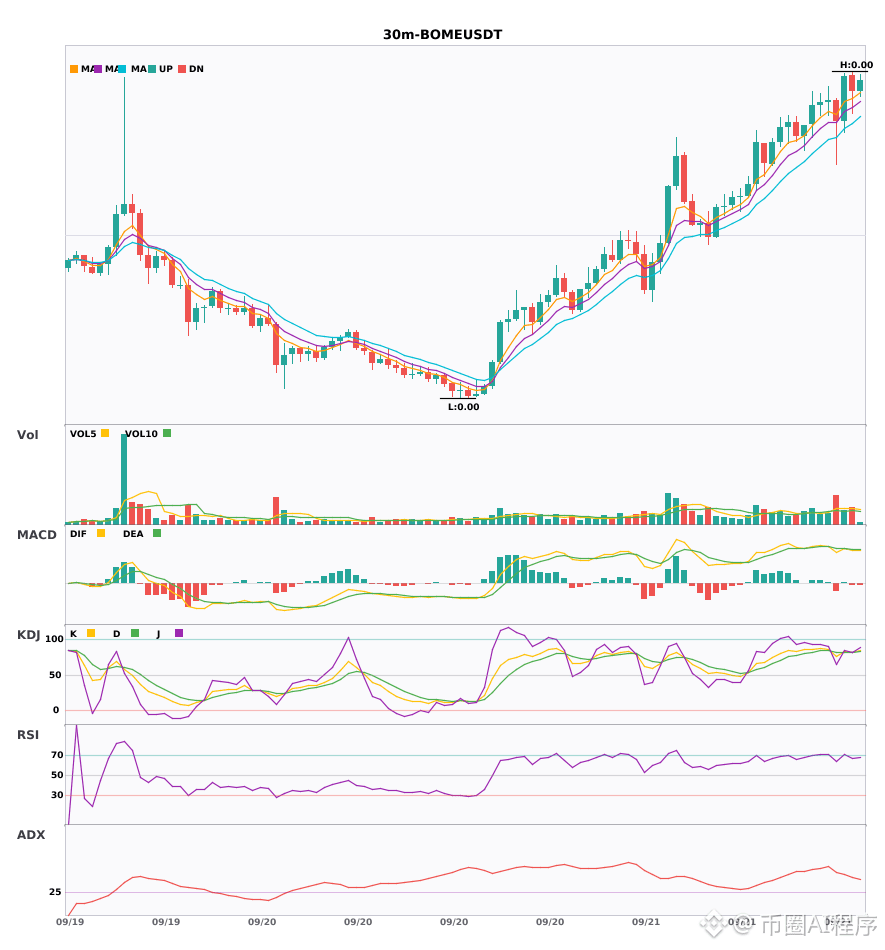
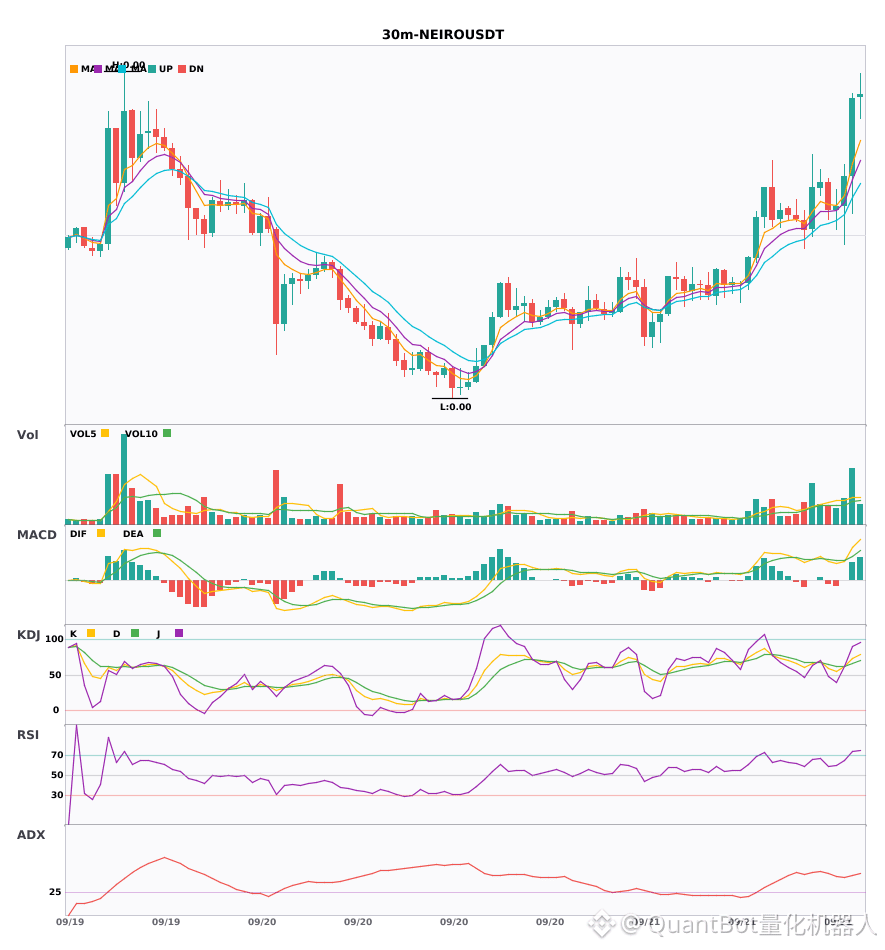
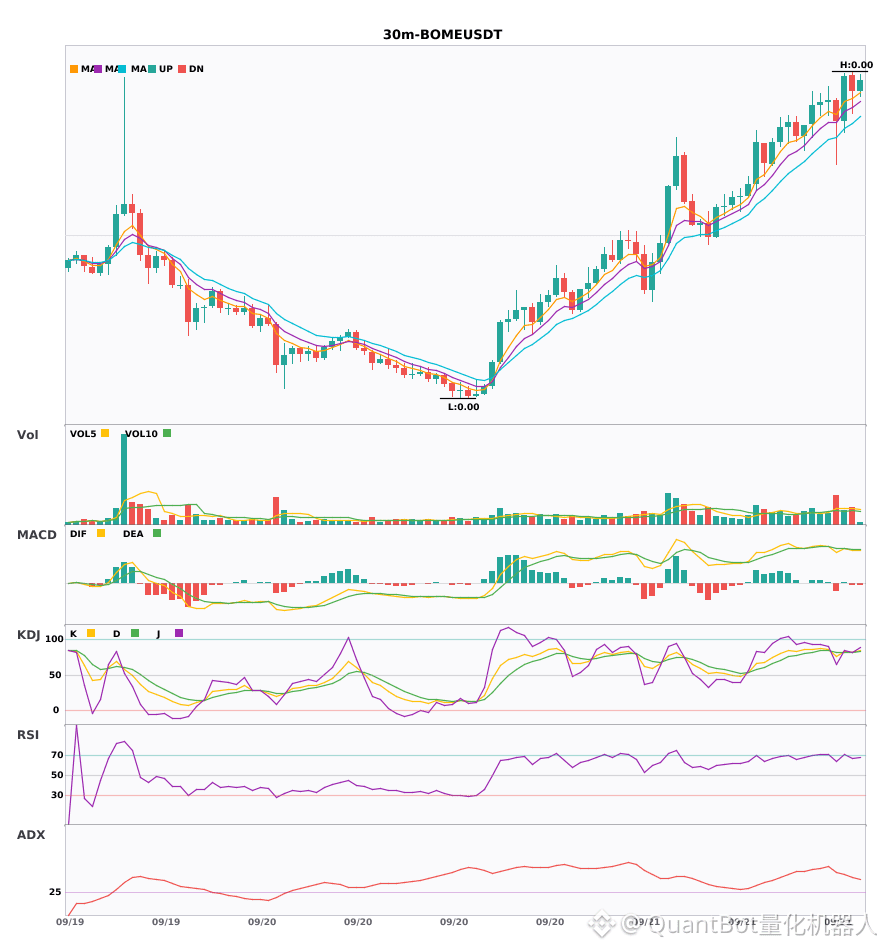
$NEIRO / $AMAT / $BOME 30 minutes long + 4-hour long in the same direction, multi-cycle resonance transitions to 🔥
════════════════════
🔴 $NEIRO 30-minute long signal
⚠️ Technical: 4-hour long resonance confirmation | Enter on the 30-minute with MACD above zero and a golden cross; long momentum released | EMA5 > EMA8 > EMA13; long alignment | KDJ is running strongly, long bias dominates (K is 73.5, D is 65.5) | Trading volume increases (2.5x)
════════════════════
🔴 $AMAT 30-minute long signal
⚠️ Technical: 4-hour long resonance confirmation | Enter on the 30-minute with MACD above zero and a golden cross; long momentum released | EMA5 > EMA8 > EMA13; long alignment | KDJ is running strongly, long bias dominates (K is 59.0, D is 59.5) | Trading volume surges (3.8x)
════════════════════
🔴 $BOME 30-minute long signal
⚠️ Technical: 4-hour long resonance confirmation | Enter on the 30-minute with MACD above zero and a golden cross; long momentum released | EMA5 > EMA8 > EMA13; long alignment | KDJ golden cross; bullish in the short term (K is 83.1, D is 82.1) | Trading volume increases (2.1x)
════════════════════
🔔 Watch out for first-hand market fluctuations 🔔
#多周期共振 #NEIRO #AMAT #BOME
📌 When trading, pay attention to whether the candlestick pattern fits the setup
$NEIRO / $AMAT / $BOME 30 minutes long + 4-hour long in the same direction, multi-cycle resonance transitions to 🔥
════════════════════
🔴 $NEIRO 30-minute long signal
⚠️ Technical: 4-hour long resonance confirmation | Enter on the 30-minute with MACD above zero and a golden cross; long momentum released | EMA5 > EMA8 > EMA13; long alignment | KDJ is running strongly, long bias dominates (K is 73.5, D is 65.5) | Trading volume increases (2.5x)
════════════════════
🔴 $AMAT 30-minute long signal
⚠️ Technical: 4-hour long resonance confirmation | Enter on the 30-minute with MACD above zero and a golden cross; long momentum released | EMA5 > EMA8 > EMA13; long alignment | KDJ is running strongly, long bias dominates (K is 59.0, D is 59.5) | Trading volume surges (3.8x)
════════════════════
🔴 $BOME 30-minute long signal
⚠️ Technical: 4-hour long resonance confirmation | Enter on the 30-minute with MACD above zero and a golden cross; long momentum released | EMA5 > EMA8 > EMA13; long alignment | KDJ golden cross; bullish in the short term (K is 83.1, D is 82.1) | Trading volume increases (2.1x)
════════════════════
🔔 Watch out for first-hand market fluctuations 🔔
#多周期共振 #NEIRO #AMAT #BOME
📌 When trading, pay attention to whether the candlestick pattern fits the setup
════════════════════
🔴 $NEIRO 30-minute long signal
⚠️ Technical: 4-hour long resonance confirmation | Enter on the 30-minute with MACD above zero and a golden cross; long momentum released | EMA5 > EMA8 > EMA13; long alignment | KDJ is running strongly, long bias dominates (K is 73.5, D is 65.5) | Trading volume increases (2.5x)
════════════════════
🔴 $AMAT 30-minute long signal
⚠️ Technical: 4-hour long resonance confirmation | Enter on the 30-minute with MACD above zero and a golden cross; long momentum released | EMA5 > EMA8 > EMA13; long alignment | KDJ is running strongly, long bias dominates (K is 59.0, D is 59.5) | Trading volume surges (3.8x)
════════════════════
🔴 $BOME 30-minute long signal
⚠️ Technical: 4-hour long resonance confirmation | Enter on the 30-minute with MACD above zero and a golden cross; long momentum released | EMA5 > EMA8 > EMA13; long alignment | KDJ golden cross; bullish in the short term (K is 83.1, D is 82.1) | Trading volume increases (2.1x)
════════════════════
🔔 Watch out for first-hand market fluctuations 🔔
#多周期共振 #NEIRO #AMAT #BOME
📌 When trading, pay attention to whether the candlestick pattern fits the setup
18
·
--
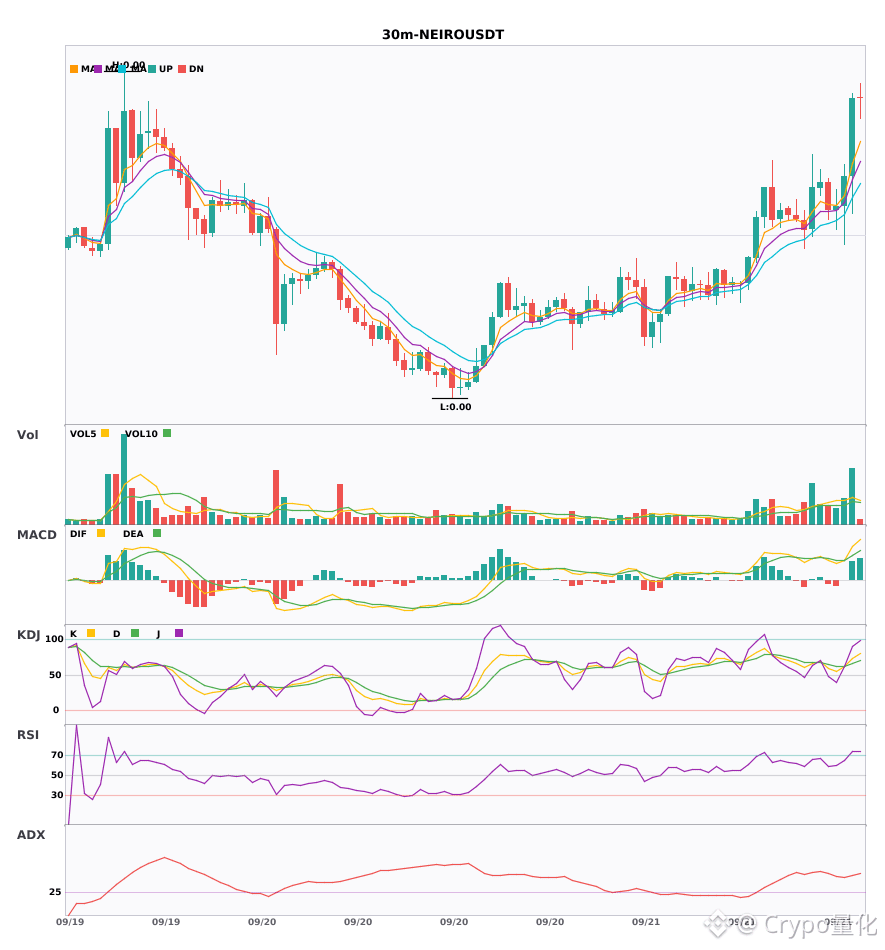
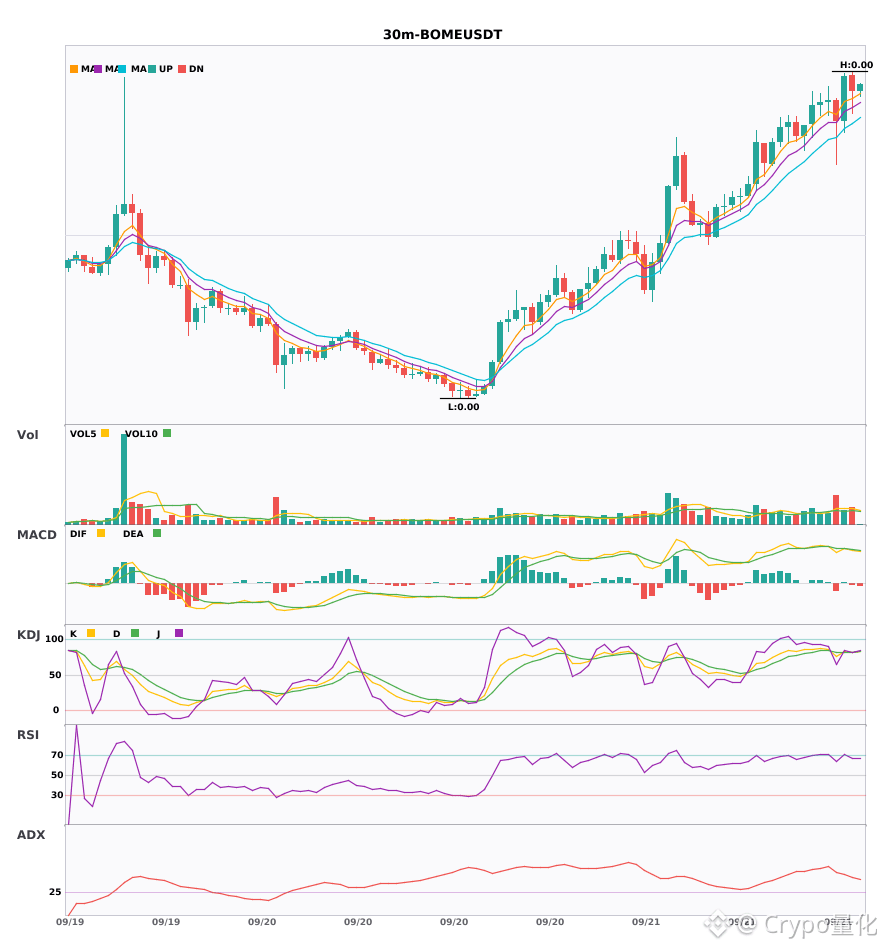
$NEIRO / $AMAT / $BOME 30 minutes resonance reversal to more, bullish signals appearing at the same time 🔥
════════════════════
🔴 $NEIRO 30 minutes bullish signal
⚠️ Technical analysis: ADX(44) clearly shows a trending market | MACD is above zero forming a golden cross, bullish momentum is being released | EMA5 > EMA8 > EMA13 bullish alignment | KDJ is running strongly, bullish dominance (K is 73.5, D is 65.5) | Volume expands (2.5x)
════════════════════
🔴 $AMAT 30 minutes bullish signal
⚠️ Technical analysis: ADX(28) the trend is forming, can participate | MACD is above zero forming a golden cross, bullish momentum is being released | EMA5 > EMA8 > EMA13 bullish alignment | KDJ is running strongly, bullish dominance (K is 59.0, D is 59.5) | Volume surges (3.8x)
════════════════════
🔴 $BOME 30 minutes bullish signal
⚠️ Technical analysis: ADX(45) clearly shows a trending market | MACD is above zero forming a golden cross, bullish momentum is being released | EMA5 > EMA8 > EMA13 bullish alignment | KDJ forms a golden cross, short-term bullish (K is 83.1, D is 82.1) | Volume expands (2.1x)
════════════════════
🔔 Follow to get first-hand market moves 🔔
#技术分析 #NEIRO #AMAT #BOME
📌 When trading, pay attention to whether the candlestick pattern matches
$NEIRO / $AMAT / $BOME 30 minutes resonance reversal to more, bullish signals appearing at the same time 🔥
════════════════════
🔴 $NEIRO 30 minutes bullish signal
⚠️ Technical analysis: ADX(44) clearly shows a trending market | MACD is above zero forming a golden cross, bullish momentum is being released | EMA5 > EMA8 > EMA13 bullish alignment | KDJ is running strongly, bullish dominance (K is 73.5, D is 65.5) | Volume expands (2.5x)
════════════════════
🔴 $AMAT 30 minutes bullish signal
⚠️ Technical analysis: ADX(28) the trend is forming, can participate | MACD is above zero forming a golden cross, bullish momentum is being released | EMA5 > EMA8 > EMA13 bullish alignment | KDJ is running strongly, bullish dominance (K is 59.0, D is 59.5) | Volume surges (3.8x)
════════════════════
🔴 $BOME 30 minutes bullish signal
⚠️ Technical analysis: ADX(45) clearly shows a trending market | MACD is above zero forming a golden cross, bullish momentum is being released | EMA5 > EMA8 > EMA13 bullish alignment | KDJ forms a golden cross, short-term bullish (K is 83.1, D is 82.1) | Volume expands (2.1x)
════════════════════
🔔 Follow to get first-hand market moves 🔔
#技术分析 #NEIRO #AMAT #BOME
📌 When trading, pay attention to whether the candlestick pattern matches
════════════════════
🔴 $NEIRO 30 minutes bullish signal
⚠️ Technical analysis: ADX(44) clearly shows a trending market | MACD is above zero forming a golden cross, bullish momentum is being released | EMA5 > EMA8 > EMA13 bullish alignment | KDJ is running strongly, bullish dominance (K is 73.5, D is 65.5) | Volume expands (2.5x)
════════════════════
🔴 $AMAT 30 minutes bullish signal
⚠️ Technical analysis: ADX(28) the trend is forming, can participate | MACD is above zero forming a golden cross, bullish momentum is being released | EMA5 > EMA8 > EMA13 bullish alignment | KDJ is running strongly, bullish dominance (K is 59.0, D is 59.5) | Volume surges (3.8x)
════════════════════
🔴 $BOME 30 minutes bullish signal
⚠️ Technical analysis: ADX(45) clearly shows a trending market | MACD is above zero forming a golden cross, bullish momentum is being released | EMA5 > EMA8 > EMA13 bullish alignment | KDJ forms a golden cross, short-term bullish (K is 83.1, D is 82.1) | Volume expands (2.1x)
════════════════════
🔔 Follow to get first-hand market moves 🔔
#技术分析 #NEIRO #AMAT #BOME
📌 When trading, pay attention to whether the candlestick pattern matches
17

$NEIRO / $AMAT / $BOME 30 minutes of technical analysis syncing strengthens—who has more explosive potential?
📈 $NEIRO | 30-minute bullish signal
━━━━━━━━━━━━━━━━━━
Technical analysis: ADX(44) clearly shows a trending market | MACD crosses above zero with a golden cross, bullish momentum released | EMA5 > EMA8 > EMA13 in a bullish alignment | KDJ is running strongly, bulls dominate (K is 73.5, D is 65.5) | Volume expands (2.5x)
Price change: 2.9700%
📈 $AMAT | 30-minute bullish signal
━━━━━━━━━━━━━━━━━━
Technical analysis: ADX(28) the trend is forming, can consider entering | MACD crosses above zero with a golden cross, bullish momentum released | EMA5 > EMA8 > EMA13 in a bullish alignment | KDJ is running strongly, bulls dominate (K is 59.0, D is 59.5) | Volume surges (3.8x)
Price change: 0.6200%
📈 $BOME | 30-minute bullish signal
━━━━━━━━━━━━━━━━━━
Technical analysis: ADX(45) clearly shows a trending market | MACD crosses above zero with a golden cross, bullish momentum released | EMA5 > EMA8 > EMA13 in a bullish alignment | KDJ golden cross, bullish in the short term (K is 83.1, D is 82.1) | Volume expands (2.1x)
Price change: 2.4200%
━━━━━━━━━━━━━━━━━━
#技术分析 #NEIRO #AMAT #BOME
📌 The above information is for reference only and does not constitute investment advice
$NEIRO / $AMAT / $BOME 30 minutes of technical analysis syncing strengthens—who has more explosive potential?
📈 $NEIRO | 30-minute bullish signal
━━━━━━━━━━━━━━━━━━
Technical analysis: ADX(44) clearly shows a trending market | MACD crosses above zero with a golden cross, bullish momentum released | EMA5 > EMA8 > EMA13 in a bullish alignment | KDJ is running strongly, bulls dominate (K is 73.5, D is 65.5) | Volume expands (2.5x)
Price change: 2.9700%
📈 $AMAT | 30-minute bullish signal
━━━━━━━━━━━━━━━━━━
Technical analysis: ADX(28) the trend is forming, can consider entering | MACD crosses above zero with a golden cross, bullish momentum released | EMA5 > EMA8 > EMA13 in a bullish alignment | KDJ is running strongly, bulls dominate (K is 59.0, D is 59.5) | Volume surges (3.8x)
Price change: 0.6200%
📈 $BOME | 30-minute bullish signal
━━━━━━━━━━━━━━━━━━
Technical analysis: ADX(45) clearly shows a trending market | MACD crosses above zero with a golden cross, bullish momentum released | EMA5 > EMA8 > EMA13 in a bullish alignment | KDJ golden cross, bullish in the short term (K is 83.1, D is 82.1) | Volume expands (2.1x)
Price change: 2.4200%
━━━━━━━━━━━━━━━━━━
#技术分析 #NEIRO #AMAT #BOME
📌 The above information is for reference only and does not constitute investment advice
📈 $NEIRO | 30-minute bullish signal
━━━━━━━━━━━━━━━━━━
Technical analysis: ADX(44) clearly shows a trending market | MACD crosses above zero with a golden cross, bullish momentum released | EMA5 > EMA8 > EMA13 in a bullish alignment | KDJ is running strongly, bulls dominate (K is 73.5, D is 65.5) | Volume expands (2.5x)
Price change: 2.9700%
📈 $AMAT | 30-minute bullish signal
━━━━━━━━━━━━━━━━━━
Technical analysis: ADX(28) the trend is forming, can consider entering | MACD crosses above zero with a golden cross, bullish momentum released | EMA5 > EMA8 > EMA13 in a bullish alignment | KDJ is running strongly, bulls dominate (K is 59.0, D is 59.5) | Volume surges (3.8x)
Price change: 0.6200%
📈 $BOME | 30-minute bullish signal
━━━━━━━━━━━━━━━━━━
Technical analysis: ADX(45) clearly shows a trending market | MACD crosses above zero with a golden cross, bullish momentum released | EMA5 > EMA8 > EMA13 in a bullish alignment | KDJ golden cross, bullish in the short term (K is 83.1, D is 82.1) | Volume expands (2.1x)
Price change: 2.4200%
━━━━━━━━━━━━━━━━━━
#技术分析 #NEIRO #AMAT #BOME
📌 The above information is for reference only and does not constitute investment advice
30

·
--
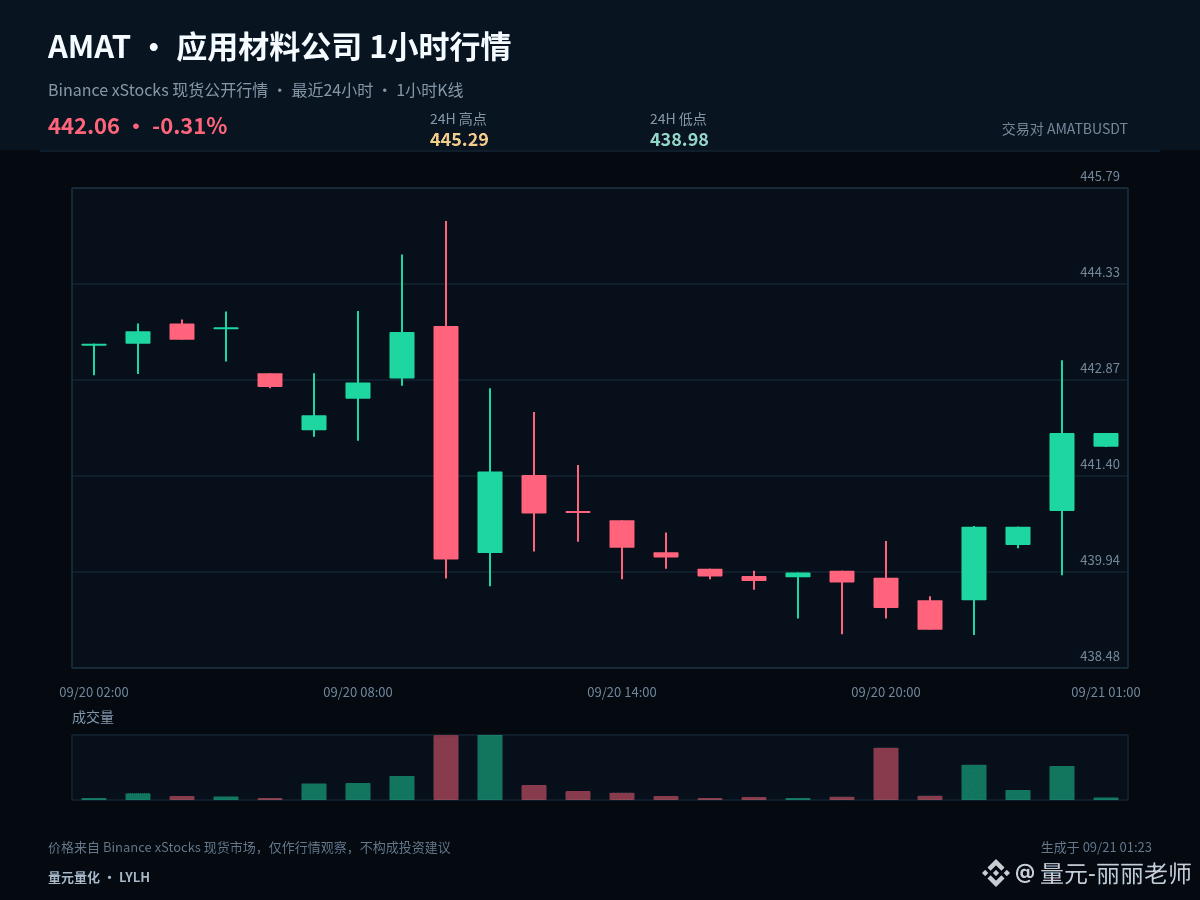
$AMATB #AMAT Currently, within the past 24-hour range, the asset has repeatedly changed hands, and there is no clear directional advantage. The middle position is the most test of patience; waiting for boundary signals is usually more effective.
For the current 1-hour period, it is 0.00%, and for the past 24 hours, -0.16%. These two cycles have not formed sufficiently clear alignment in the same direction. In range-bound market conditions, the tolerance for chasing and selling off is lower. It is more suitable to confirm direction using the upper boundary, confirm support using the lower boundary, and use the midline only as a line to distinguish strength and weakness.
I will treat 442.135 as the short-term long/short dividing line: if it holds, it indicates the pullback is still within a manageable range; after that, there is potential to test 445.29 again. If there is an effective breakdown, do not rush to enter—wait for a new stable structure to appear around 438.98.
In terms of execution, set clear conditions: after a breakout above 445.29, you need confirmation—not chasing just because of a momentary spike. After a dip to 438.98, you need to see whether it can quickly reclaim—don’t buy just because it drops. When the middle zone does not offer sufficient reward-to-risk, waiting itself is also part of the strategy.
Position management should distinguish between swing trades and short-term trades. For existing swing positions, first assess whether the structure is broken; don’t let repeated fluctuations of a single 1-hour candlestick overly influence you. For short-term positions, execute around support, resistance, and closing confirmation. If you are currently in cash, there’s no need to chase price in the middle of the range—waiting for a clearer level usually provides the edge.
If the next 1-hour candle closes above 442.135, the structure will become more proactive; if it closes below, continue to be cautious. Which path are you leaning toward right now?
#VietnamPlansFirstCryptoLicensesIn2026
$AMATB #AMAT Currently, within the past 24-hour range, the asset has repeatedly changed hands, and there is no clear directional advantage. The middle position is the most test of patience; waiting for boundary signals is usually more effective.
For the current 1-hour period, it is 0.00%, and for the past 24 hours, -0.16%. These two cycles have not formed sufficiently clear alignment in the same direction. In range-bound market conditions, the tolerance for chasing and selling off is lower. It is more suitable to confirm direction using the upper boundary, confirm support using the lower boundary, and use the midline only as a line to distinguish strength and weakness.
I will treat 442.135 as the short-term long/short dividing line: if it holds, it indicates the pullback is still within a manageable range; after that, there is potential to test 445.29 again. If there is an effective breakdown, do not rush to enter—wait for a new stable structure to appear around 438.98.
In terms of execution, set clear conditions: after a breakout above 445.29, you need confirmation—not chasing just because of a momentary spike. After a dip to 438.98, you need to see whether it can quickly reclaim—don’t buy just because it drops. When the middle zone does not offer sufficient reward-to-risk, waiting itself is also part of the strategy.
Position management should distinguish between swing trades and short-term trades. For existing swing positions, first assess whether the structure is broken; don’t let repeated fluctuations of a single 1-hour candlestick overly influence you. For short-term positions, execute around support, resistance, and closing confirmation. If you are currently in cash, there’s no need to chase price in the middle of the range—waiting for a clearer level usually provides the edge.
If the next 1-hour candle closes above 442.135, the structure will become more proactive; if it closes below, continue to be cautious. Which path are you leaning toward right now?
#VietnamPlansFirstCryptoLicensesIn2026
For the current 1-hour period, it is 0.00%, and for the past 24 hours, -0.16%. These two cycles have not formed sufficiently clear alignment in the same direction. In range-bound market conditions, the tolerance for chasing and selling off is lower. It is more suitable to confirm direction using the upper boundary, confirm support using the lower boundary, and use the midline only as a line to distinguish strength and weakness.
I will treat 442.135 as the short-term long/short dividing line: if it holds, it indicates the pullback is still within a manageable range; after that, there is potential to test 445.29 again. If there is an effective breakdown, do not rush to enter—wait for a new stable structure to appear around 438.98.
In terms of execution, set clear conditions: after a breakout above 445.29, you need confirmation—not chasing just because of a momentary spike. After a dip to 438.98, you need to see whether it can quickly reclaim—don’t buy just because it drops. When the middle zone does not offer sufficient reward-to-risk, waiting itself is also part of the strategy.
Position management should distinguish between swing trades and short-term trades. For existing swing positions, first assess whether the structure is broken; don’t let repeated fluctuations of a single 1-hour candlestick overly influence you. For short-term positions, execute around support, resistance, and closing confirmation. If you are currently in cash, there’s no need to chase price in the middle of the range—waiting for a clearer level usually provides the edge.
If the next 1-hour candle closes above 442.135, the structure will become more proactive; if it closes below, continue to be cautious. Which path are you leaning toward right now?
#VietnamPlansFirstCryptoLicensesIn2026
5

·
--
Bearish
The $2.8402K AMAT long liquidation shows forced selling around $442.39328.
I’d watch this level for a clean reaction after the leverage flush.
$AMAT
{future}(AMATUSDT)
$AKE
{future}(AKEUSDT)
$G
{future}(GUSDT)
🔴 LIQUIDITY ZONE HIT 🔴
Long liquidation spotted 🧨
$2.8402K cleared at $442.39328
Downside liquidity swept — watch reaction 👀
🎯 TP Targets:
TP1: ~$437.97
TP2: ~$431.35
TP3: ~$422.00
#AMAT
The $2.8402K AMAT long liquidation shows forced selling around $442.39328.
I’d watch this level for a clean reaction after the leverage flush.
$AMAT
$AKE
$G
🔴 LIQUIDITY ZONE HIT 🔴
Long liquidation spotted 🧨
$2.8402K cleared at $442.39328
Downside liquidity swept — watch reaction 👀
🎯 TP Targets:
TP1: ~$437.97
TP2: ~$431.35
TP3: ~$422.00
#AMAT
I’d watch this level for a clean reaction after the leverage flush.
$AMAT
$AKE
$G
🔴 LIQUIDITY ZONE HIT 🔴
Long liquidation spotted 🧨
$2.8402K cleared at $442.39328
Downside liquidity swept — watch reaction 👀
🎯 TP Targets:
TP1: ~$437.97
TP2: ~$431.35
TP3: ~$422.00
#AMAT
30
·
--
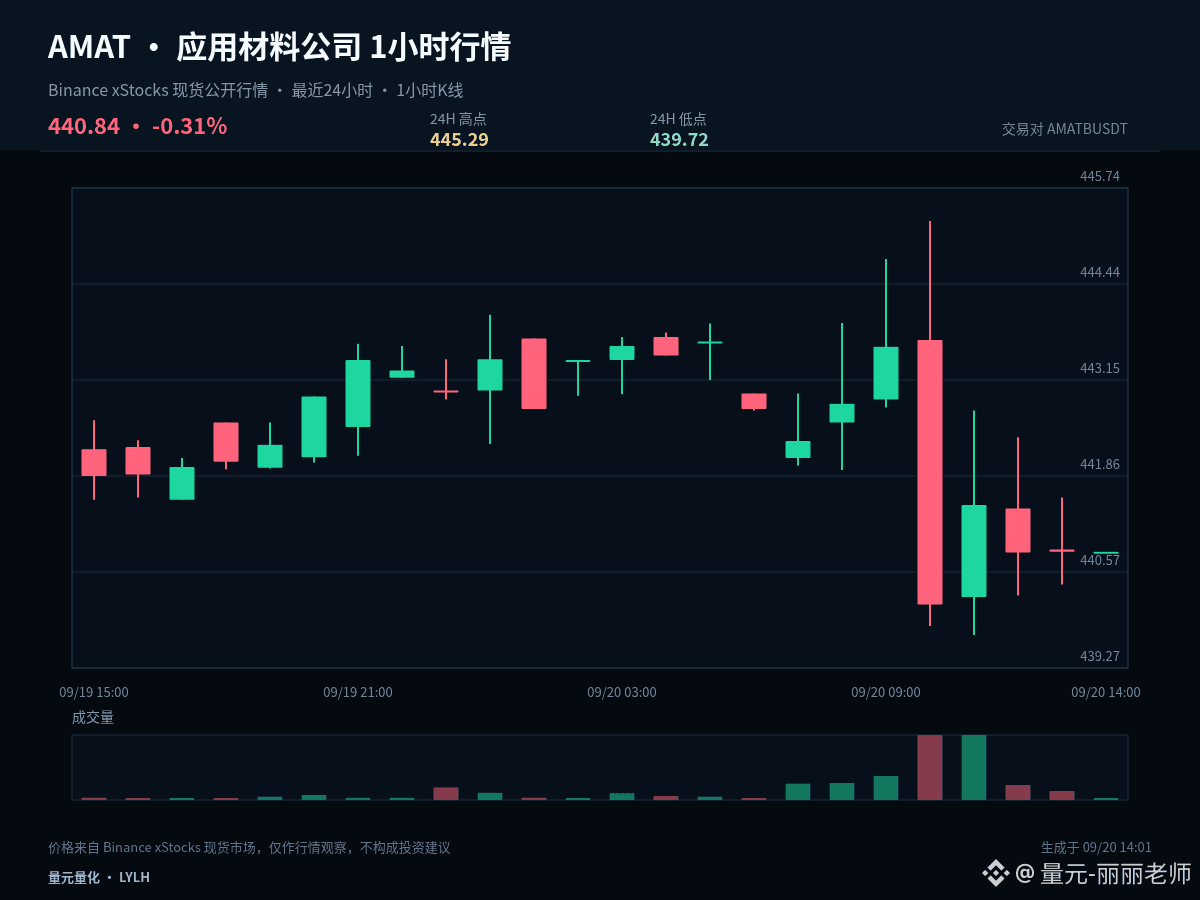
$AMATB #AMAT If I can keep only one observation price this round, I would choose 442.505. Current price: 440.84. 1 hour: 0.00%, 24 hours: -0.31%. The gains/losses relative to the central axis can help filter out a lot of intraday noise.
As long as the price stays above 442.505, it shows that the pullback is still controlled by the bulls. The next target is to test the pressure at 445.29. If it falls back below the central axis again, the previous strength will need to be discounted, and you should also prevent a further move back toward 439.72.
Currently, 1 hour: 0.00%, 24 hours: -0.31%. The two timeframes have not formed a sufficiently clear alignment in the same direction. In a range-bound market, the tolerance for chasing or killing positions is lower. It’s better to confirm direction with the upper boundary, confirm support with the lower boundary, and use the central axis only as a line separating strength and weakness.
My scenario analysis is not betting on a single direction. A break above 445.29 and the ability to hold it means the upside space has been reopened. If it breaks below 439.72 and fails to reclaim it on a retest, it indicates the structure is weakening further. If price keeps trading between them, continue observing the closing behavior on both sides of 442.505.
Existing positions can be managed in stages based on key levels to avoid making all decisions at once. For those who are currently flat, wait for confirmation of the breakout or for pullback stabilization. For U.S. market instruments, also watch for volatility caused by trading session transitions. Let price conditions guide the plan—don’t let emotions replace execution.
If the next 1-hour candle closes above 442.505, the structure will be more proactive; if it closes below, stay cautious. Which path are you leaning toward right now?
#HKCompletesFirstHKDStablecoinUseCase
$AMATB #AMAT If I can keep only one observation price this round, I would choose 442.505. Current price: 440.84. 1 hour: 0.00%, 24 hours: -0.31%. The gains/losses relative to the central axis can help filter out a lot of intraday noise.
As long as the price stays above 442.505, it shows that the pullback is still controlled by the bulls. The next target is to test the pressure at 445.29. If it falls back below the central axis again, the previous strength will need to be discounted, and you should also prevent a further move back toward 439.72.
Currently, 1 hour: 0.00%, 24 hours: -0.31%. The two timeframes have not formed a sufficiently clear alignment in the same direction. In a range-bound market, the tolerance for chasing or killing positions is lower. It’s better to confirm direction with the upper boundary, confirm support with the lower boundary, and use the central axis only as a line separating strength and weakness.
My scenario analysis is not betting on a single direction. A break above 445.29 and the ability to hold it means the upside space has been reopened. If it breaks below 439.72 and fails to reclaim it on a retest, it indicates the structure is weakening further. If price keeps trading between them, continue observing the closing behavior on both sides of 442.505.
Existing positions can be managed in stages based on key levels to avoid making all decisions at once. For those who are currently flat, wait for confirmation of the breakout or for pullback stabilization. For U.S. market instruments, also watch for volatility caused by trading session transitions. Let price conditions guide the plan—don’t let emotions replace execution.
If the next 1-hour candle closes above 442.505, the structure will be more proactive; if it closes below, stay cautious. Which path are you leaning toward right now?
#HKCompletesFirstHKDStablecoinUseCase
As long as the price stays above 442.505, it shows that the pullback is still controlled by the bulls. The next target is to test the pressure at 445.29. If it falls back below the central axis again, the previous strength will need to be discounted, and you should also prevent a further move back toward 439.72.
Currently, 1 hour: 0.00%, 24 hours: -0.31%. The two timeframes have not formed a sufficiently clear alignment in the same direction. In a range-bound market, the tolerance for chasing or killing positions is lower. It’s better to confirm direction with the upper boundary, confirm support with the lower boundary, and use the central axis only as a line separating strength and weakness.
My scenario analysis is not betting on a single direction. A break above 445.29 and the ability to hold it means the upside space has been reopened. If it breaks below 439.72 and fails to reclaim it on a retest, it indicates the structure is weakening further. If price keeps trading between them, continue observing the closing behavior on both sides of 442.505.
Existing positions can be managed in stages based on key levels to avoid making all decisions at once. For those who are currently flat, wait for confirmation of the breakout or for pullback stabilization. For U.S. market instruments, also watch for volatility caused by trading session transitions. Let price conditions guide the plan—don’t let emotions replace execution.
If the next 1-hour candle closes above 442.505, the structure will be more proactive; if it closes below, stay cautious. Which path are you leaning toward right now?
#HKCompletesFirstHKDStablecoinUseCase
5
·
--
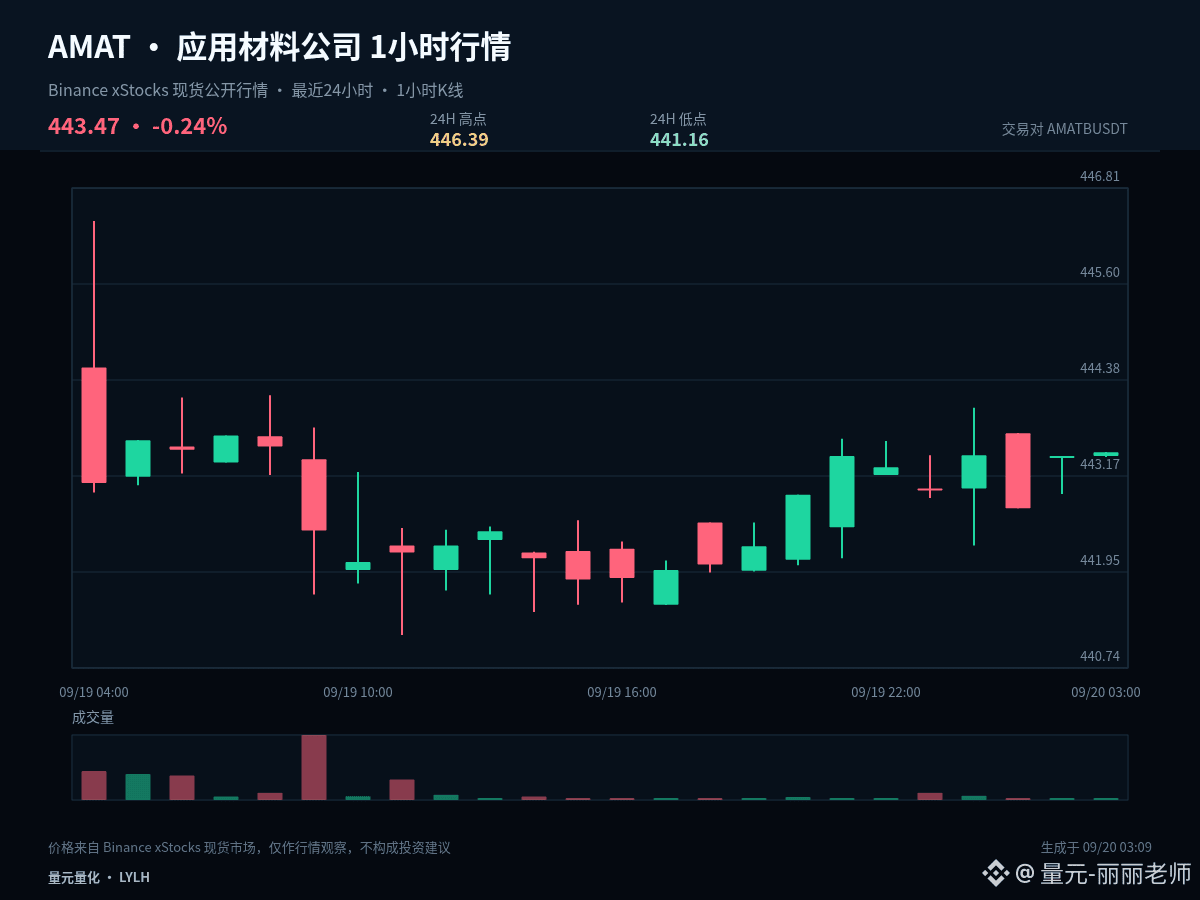
$AMATB #AMAT Do a structural review. Current price 443.47, 1 hour +0.01%, 24 hours +1.50%, and the last 24 hours’ range amplitude is about 1.2%.
At present, 1 hour is +0.01% and 24 hours is +1.50%. In the two timeframes, there isn’t enough clear same-direction coordination. In a range-bound market, the tolerance for chasing moves and cutting losses is low; it’s more suitable to use the upper bound to confirm direction, the lower bound to confirm acceptance/support, and treat the midline only as the boundary between strength and weakness.
Key levels to review: 443.775 determines short-term directional initiative; 446.39 is used to confirm upside room; 441.16 is used to observe downside defense. Going forward, you don’t need to guess every step—just check whether the original assessment still holds when price passes these levels.
If the market matches expectations, manage profits in segments and continue to raise protection; if it doesn’t match, promptly admit that conditions have changed. Professional trading isn’t always being right—it’s staying consistent in execution after the information updates.
Existing positions can be handled in segments based on the key levels to avoid making all judgments at once. Those without positions should wait for breakout confirmation or a pullback and stabilization. For US stocks, also watch for volatility caused by trading-session transitions. The plan should be based on price conditions, not emotion replacing execution.
Next, I’ll focus on tracking the gains and losses around 443.775. Do you lean more toward first testing 446.39, or first returning to 441.16? Feel free to share your view and rationale.
#VietnamPlansFirstCryptoLicensesIn2026
$AMATB #AMAT Do a structural review. Current price 443.47, 1 hour +0.01%, 24 hours +1.50%, and the last 24 hours’ range amplitude is about 1.2%.
At present, 1 hour is +0.01% and 24 hours is +1.50%. In the two timeframes, there isn’t enough clear same-direction coordination. In a range-bound market, the tolerance for chasing moves and cutting losses is low; it’s more suitable to use the upper bound to confirm direction, the lower bound to confirm acceptance/support, and treat the midline only as the boundary between strength and weakness.
Key levels to review: 443.775 determines short-term directional initiative; 446.39 is used to confirm upside room; 441.16 is used to observe downside defense. Going forward, you don’t need to guess every step—just check whether the original assessment still holds when price passes these levels.
If the market matches expectations, manage profits in segments and continue to raise protection; if it doesn’t match, promptly admit that conditions have changed. Professional trading isn’t always being right—it’s staying consistent in execution after the information updates.
Existing positions can be handled in segments based on the key levels to avoid making all judgments at once. Those without positions should wait for breakout confirmation or a pullback and stabilization. For US stocks, also watch for volatility caused by trading-session transitions. The plan should be based on price conditions, not emotion replacing execution.
Next, I’ll focus on tracking the gains and losses around 443.775. Do you lean more toward first testing 446.39, or first returning to 441.16? Feel free to share your view and rationale.
#VietnamPlansFirstCryptoLicensesIn2026
At present, 1 hour is +0.01% and 24 hours is +1.50%. In the two timeframes, there isn’t enough clear same-direction coordination. In a range-bound market, the tolerance for chasing moves and cutting losses is low; it’s more suitable to use the upper bound to confirm direction, the lower bound to confirm acceptance/support, and treat the midline only as the boundary between strength and weakness.
Key levels to review: 443.775 determines short-term directional initiative; 446.39 is used to confirm upside room; 441.16 is used to observe downside defense. Going forward, you don’t need to guess every step—just check whether the original assessment still holds when price passes these levels.
If the market matches expectations, manage profits in segments and continue to raise protection; if it doesn’t match, promptly admit that conditions have changed. Professional trading isn’t always being right—it’s staying consistent in execution after the information updates.
Existing positions can be handled in segments based on the key levels to avoid making all judgments at once. Those without positions should wait for breakout confirmation or a pullback and stabilization. For US stocks, also watch for volatility caused by trading-session transitions. The plan should be based on price conditions, not emotion replacing execution.
Next, I’ll focus on tracking the gains and losses around 443.775. Do you lean more toward first testing 446.39, or first returning to 441.16? Feel free to share your view and rationale.
#VietnamPlansFirstCryptoLicensesIn2026
8

·
--
[M1_mag7]
$AMAT 24 hours surge up 6.604%, price touched 442.79. Meanwhile, the on-chain contract funding rate has been stuck at 0. The price moved, but the funding rate didn’t budge at all—this is a rare structure.
A funding rate of zero means neither side—longs nor shorts—needs to pay the other right now. Longs aren’t crowded, and shorts haven’t been pushed into a corner. This is completely different from the common pattern where rallies come with a positive funding rate (longs pay, crowding is high). Price is up while funding is flat; a single signal like this suggests the current upswing may not yet have triggered a large-scale chase or a squeeze. It looks more like existing liquidity is pushing, rather than fresh entrants piling in to bet against it.
Old dog glanced at the trading volume—over 9 million USD, not small. But paired with the funding rate, it feels more like a planned one-way buy, not enough to attract sufficient opposing orders to enter and take the other side.
So the key question now is: is $AMAT ’s strength this round independent, or is it simply following the rebound in sentiment of US tech heavyweight stocks (e.g., QQQ)? The input contains no secondary-market benchmark data. I can only judge from the derivatives side. With funding at zero, if the price continues to push upward next, the funding rate will likely turn positive—only then will it enter the crowded long “battle” phase. Calling it the leader right now is still too early; it’s more of an upside move driven by a relatively clean positioning structure.
Old dog’s stance is observation—no rush to act.
Trading tags: #BinanceFutures #TradFi #USDⓈM #AMAT #AMATUSDT $AMAT
[M1_mag7]
$AMAT 24 hours surge up 6.604%, price touched 442.79. Meanwhile, the on-chain contract funding rate has been stuck at 0. The price moved, but the funding rate didn’t budge at all—this is a rare structure.
A funding rate of zero means neither side—longs nor shorts—needs to pay the other right now. Longs aren’t crowded, and shorts haven’t been pushed into a corner. This is completely different from the common pattern where rallies come with a positive funding rate (longs pay, crowding is high). Price is up while funding is flat; a single signal like this suggests the current upswing may not yet have triggered a large-scale chase or a squeeze. It looks more like existing liquidity is pushing, rather than fresh entrants piling in to bet against it.
Old dog glanced at the trading volume—over 9 million USD, not small. But paired with the funding rate, it feels more like a planned one-way buy, not enough to attract sufficient opposing orders to enter and take the other side.
So the key question now is: is $AMAT ’s strength this round independent, or is it simply following the rebound in sentiment of US tech heavyweight stocks (e.g., QQQ)? The input contains no secondary-market benchmark data. I can only judge from the derivatives side. With funding at zero, if the price continues to push upward next, the funding rate will likely turn positive—only then will it enter the crowded long “battle” phase. Calling it the leader right now is still too early; it’s more of an upside move driven by a relatively clean positioning structure.
Old dog’s stance is observation—no rush to act.
Trading tags: #BinanceFutures #TradFi #USDⓈM #AMAT #AMATUSDT $AMAT
$AMAT 24 hours surge up 6.604%, price touched 442.79. Meanwhile, the on-chain contract funding rate has been stuck at 0. The price moved, but the funding rate didn’t budge at all—this is a rare structure.
A funding rate of zero means neither side—longs nor shorts—needs to pay the other right now. Longs aren’t crowded, and shorts haven’t been pushed into a corner. This is completely different from the common pattern where rallies come with a positive funding rate (longs pay, crowding is high). Price is up while funding is flat; a single signal like this suggests the current upswing may not yet have triggered a large-scale chase or a squeeze. It looks more like existing liquidity is pushing, rather than fresh entrants piling in to bet against it.
Old dog glanced at the trading volume—over 9 million USD, not small. But paired with the funding rate, it feels more like a planned one-way buy, not enough to attract sufficient opposing orders to enter and take the other side.
So the key question now is: is $AMAT ’s strength this round independent, or is it simply following the rebound in sentiment of US tech heavyweight stocks (e.g., QQQ)? The input contains no secondary-market benchmark data. I can only judge from the derivatives side. With funding at zero, if the price continues to push upward next, the funding rate will likely turn positive—only then will it enter the crowded long “battle” phase. Calling it the leader right now is still too early; it’s more of an upside move driven by a relatively clean positioning structure.
Old dog’s stance is observation—no rush to act.
Trading tags: #BinanceFutures #TradFi #USDⓈM #AMAT #AMATUSDT $AMAT
128
·
--
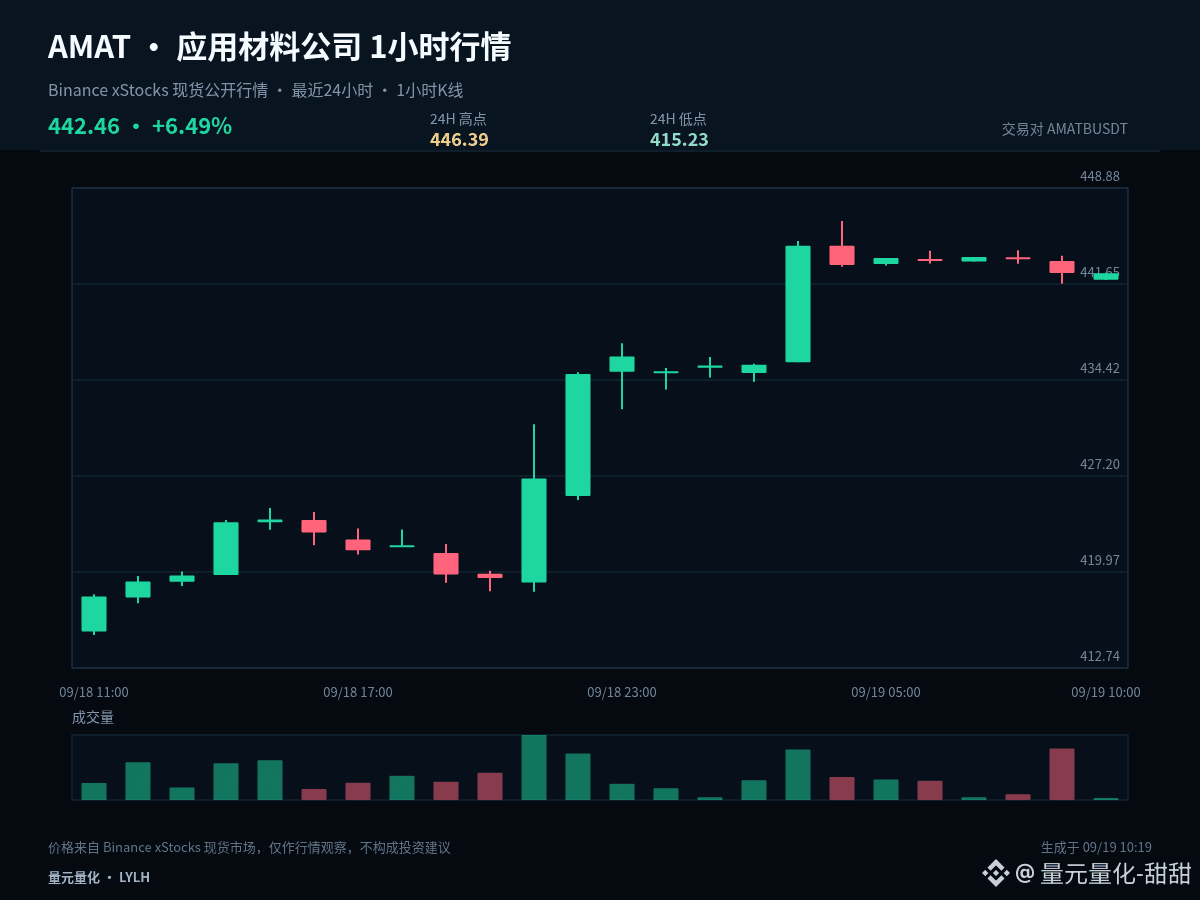
$AMATB #AMAT Right now, it’s more suitable to first confirm a rebound rather than define a reversal in advance. Current price is 442.46. In the last 1 hour: -0.00%; in the last 24 hours: +6.60%. Whether the two time periods turn back in the same direction is the key focus going forward.
The current price is near the upper bound of the past 24-hour range. The most important part at the highs is to confirm the market’s acceptance after a breakout: if the price can stay above the upper bound, it suggests the market is acknowledging a higher zone; if it only briefly pierces higher and then quickly snaps back, you need to guard against a false breakout.
If the rebound can reclaim 430.81 and then further hold above 446.39, it indicates that buying pressure is starting to change the prior weak momentum. If, after moving up toward the midline, it falls back again—especially if it re-drops toward 415.23—then it looks more like a failed repair, and you shouldn’t keep using a “strengthening” expectation.
Confirmation of a rebound failure also requires evidence; you shouldn’t just chase shorts directly because of a single push-up followed by a rejection. A more reasonable sequence is to observe whether resistance holds and the lows start moving lower again, then decide on actions based on whether subsequent pullbacks reclaim key levels.
Position management should distinguish between medium-term and short-term exposure. For existing medium-term positions, first assess whether the structure is broken—you don’t need to be repeatedly affected by single 1-hour candles. For short-term positions, execute around support, resistance, and confirmation by closing price. Those with no position shouldn’t chase prices in the middle of the range; waiting for a clearer location often has the advantage.
Risk control still comes before the conclusion: only act when conditions appear; if the price invalidates the thesis, reassess promptly. The greater the volatility, the more restrained each individual position should be. The above is a scenario analysis based on the current 1-hour and 24-hour data, and it does not constitute a promise of returns.
#BuffettBecomesBerkshireChairmanEmeritus
$AMATB #AMAT Right now, it’s more suitable to first confirm a rebound rather than define a reversal in advance. Current price is 442.46. In the last 1 hour: -0.00%; in the last 24 hours: +6.60%. Whether the two time periods turn back in the same direction is the key focus going forward.
The current price is near the upper bound of the past 24-hour range. The most important part at the highs is to confirm the market’s acceptance after a breakout: if the price can stay above the upper bound, it suggests the market is acknowledging a higher zone; if it only briefly pierces higher and then quickly snaps back, you need to guard against a false breakout.
If the rebound can reclaim 430.81 and then further hold above 446.39, it indicates that buying pressure is starting to change the prior weak momentum. If, after moving up toward the midline, it falls back again—especially if it re-drops toward 415.23—then it looks more like a failed repair, and you shouldn’t keep using a “strengthening” expectation.
Confirmation of a rebound failure also requires evidence; you shouldn’t just chase shorts directly because of a single push-up followed by a rejection. A more reasonable sequence is to observe whether resistance holds and the lows start moving lower again, then decide on actions based on whether subsequent pullbacks reclaim key levels.
Position management should distinguish between medium-term and short-term exposure. For existing medium-term positions, first assess whether the structure is broken—you don’t need to be repeatedly affected by single 1-hour candles. For short-term positions, execute around support, resistance, and confirmation by closing price. Those with no position shouldn’t chase prices in the middle of the range; waiting for a clearer location often has the advantage.
Risk control still comes before the conclusion: only act when conditions appear; if the price invalidates the thesis, reassess promptly. The greater the volatility, the more restrained each individual position should be. The above is a scenario analysis based on the current 1-hour and 24-hour data, and it does not constitute a promise of returns.
#BuffettBecomesBerkshireChairmanEmeritus
The current price is near the upper bound of the past 24-hour range. The most important part at the highs is to confirm the market’s acceptance after a breakout: if the price can stay above the upper bound, it suggests the market is acknowledging a higher zone; if it only briefly pierces higher and then quickly snaps back, you need to guard against a false breakout.
If the rebound can reclaim 430.81 and then further hold above 446.39, it indicates that buying pressure is starting to change the prior weak momentum. If, after moving up toward the midline, it falls back again—especially if it re-drops toward 415.23—then it looks more like a failed repair, and you shouldn’t keep using a “strengthening” expectation.
Confirmation of a rebound failure also requires evidence; you shouldn’t just chase shorts directly because of a single push-up followed by a rejection. A more reasonable sequence is to observe whether resistance holds and the lows start moving lower again, then decide on actions based on whether subsequent pullbacks reclaim key levels.
Position management should distinguish between medium-term and short-term exposure. For existing medium-term positions, first assess whether the structure is broken—you don’t need to be repeatedly affected by single 1-hour candles. For short-term positions, execute around support, resistance, and confirmation by closing price. Those with no position shouldn’t chase prices in the middle of the range; waiting for a clearer location often has the advantage.
Risk control still comes before the conclusion: only act when conditions appear; if the price invalidates the thesis, reassess promptly. The greater the volatility, the more restrained each individual position should be. The above is a scenario analysis based on the current 1-hour and 24-hour data, and it does not constitute a promise of returns.
#BuffettBecomesBerkshireChairmanEmeritus
32
·
--
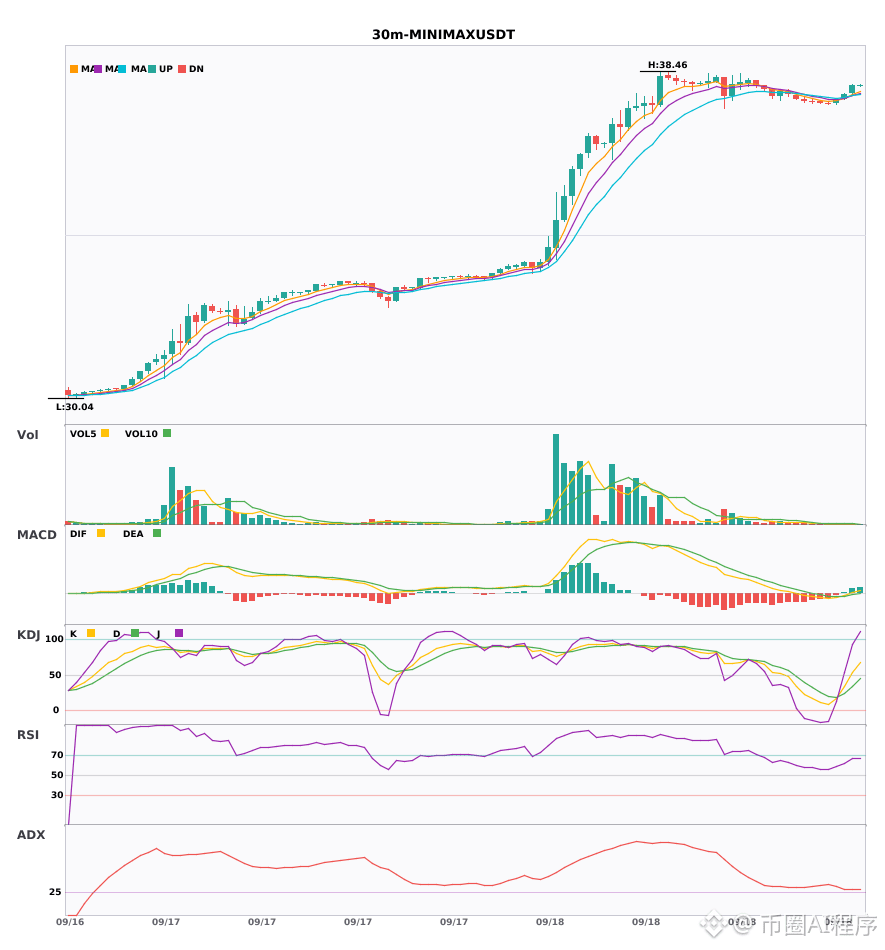
$AMAT / $MVLL / $MINIMAX 30 minutes long + 4-hour long in the same direction. Multiple cycles resonate, shifting into long positions 🔥
════════════════════
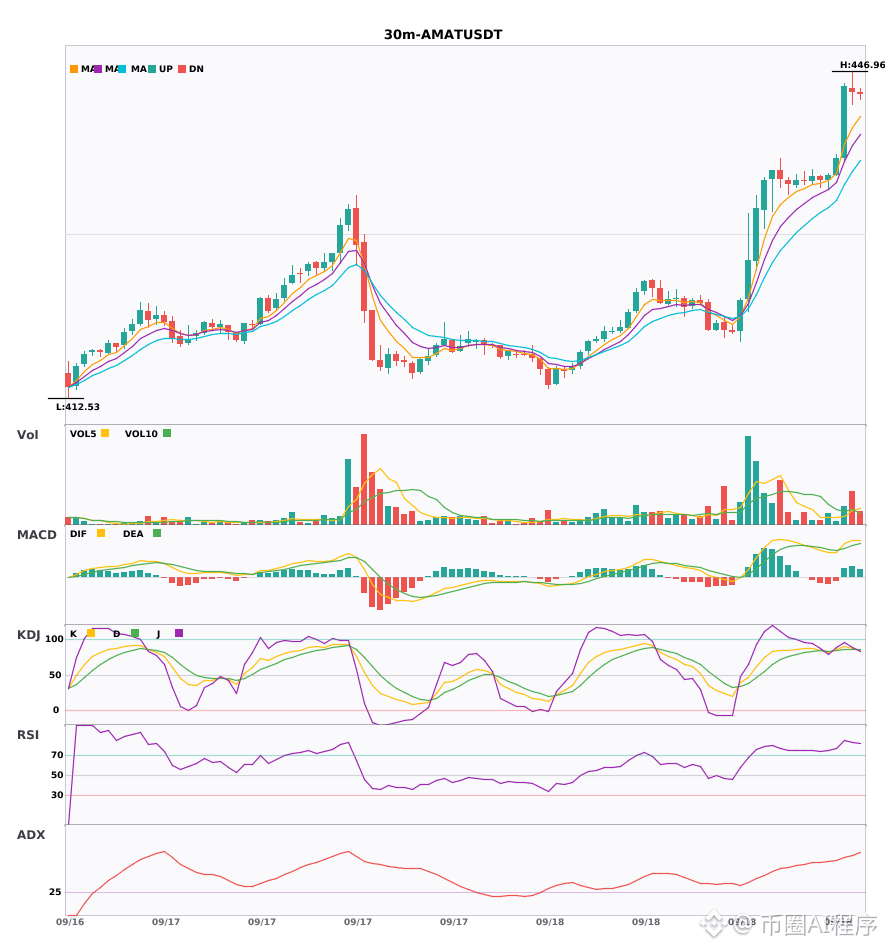
🔴 $AMAT 30 minutes long signal
⚠️ Technical analysis: 4-hour long resonance confirmation | Enter on the 30-minute chart: MACD forms a golden cross above zero; long momentum releases | EMA5 > EMA8 > EMA13, bullish alignment | KDJ in the overbought zone—watch for pullback risk (K is 89.2, D is 85.8) | Volume is normal (1.4x)
════════════════════
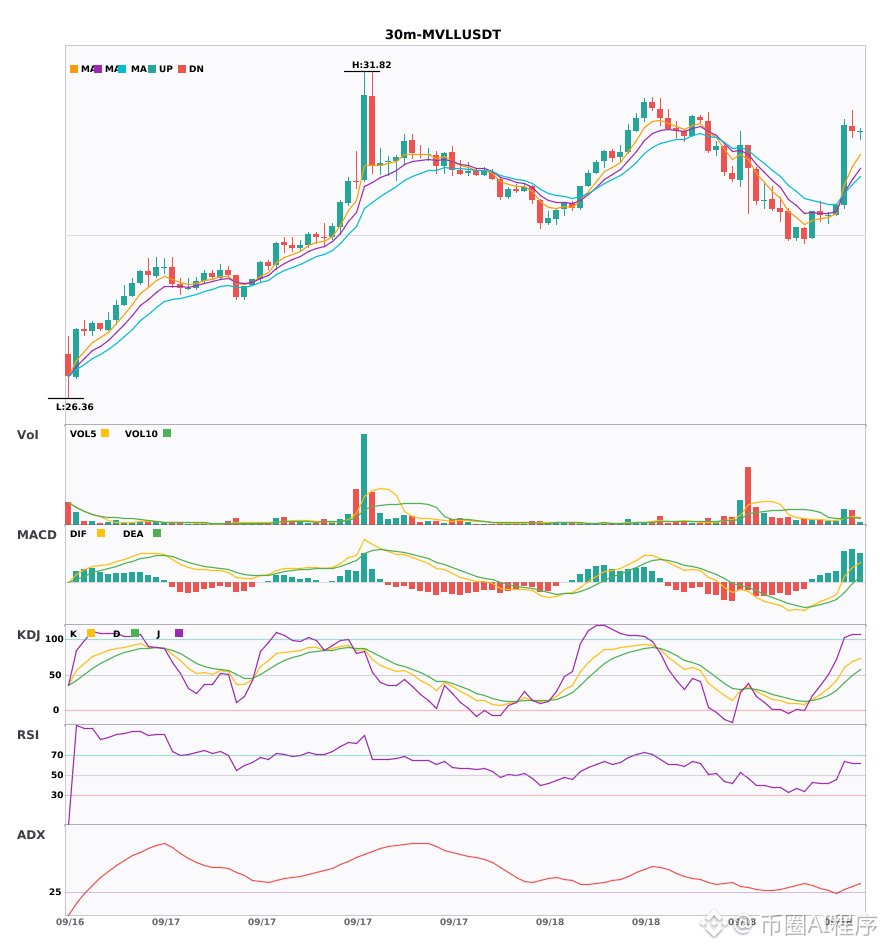
🔴 $MVLL 30 minutes long signal
⚠️ Technical analysis: This is a multi-cycle resonance long signal! 4-hour confirms the bullish trend; 30-minute provides entry/exit signal: EMA5 crosses above EMA8, MACD’s DIF breaks above the zero line, and trading volume increases 2.3x to bullish.
════════════════════
🔴 $MINIMAX 30 minutes long signal
⚠️ Technical analysis: This is a multi-cycle resonance long setup! 4-hour confirms the bullish trend; 30-minute gives the entry point: MACD breaks above the zero line, short moving averages form a golden cross, and trading volume increases 1.6x.
════════════════════
🔔 Follow to get first-hand market movements 🔔
#多周期共振 #AMAT #MVLL #MINIMAX
📌 When trading, pay attention to whether the candlestick pattern matches
$AMAT / $MVLL / $MINIMAX 30 minutes long + 4-hour long in the same direction. Multiple cycles resonate, shifting into long positions 🔥
════════════════════
🔴 $AMAT 30 minutes long signal
⚠️ Technical analysis: 4-hour long resonance confirmation | Enter on the 30-minute chart: MACD forms a golden cross above zero; long momentum releases | EMA5 > EMA8 > EMA13, bullish alignment | KDJ in the overbought zone—watch for pullback risk (K is 89.2, D is 85.8) | Volume is normal (1.4x)
════════════════════
🔴 $MVLL 30 minutes long signal
⚠️ Technical analysis: This is a multi-cycle resonance long signal! 4-hour confirms the bullish trend; 30-minute provides entry/exit signal: EMA5 crosses above EMA8, MACD’s DIF breaks above the zero line, and trading volume increases 2.3x to bullish.
════════════════════
🔴 $MINIMAX 30 minutes long signal
⚠️ Technical analysis: This is a multi-cycle resonance long setup! 4-hour confirms the bullish trend; 30-minute gives the entry point: MACD breaks above the zero line, short moving averages form a golden cross, and trading volume increases 1.6x.
════════════════════
🔔 Follow to get first-hand market movements 🔔
#多周期共振 #AMAT #MVLL #MINIMAX
📌 When trading, pay attention to whether the candlestick pattern matches
════════════════════
🔴 $AMAT 30 minutes long signal
⚠️ Technical analysis: 4-hour long resonance confirmation | Enter on the 30-minute chart: MACD forms a golden cross above zero; long momentum releases | EMA5 > EMA8 > EMA13, bullish alignment | KDJ in the overbought zone—watch for pullback risk (K is 89.2, D is 85.8) | Volume is normal (1.4x)
════════════════════
🔴 $MVLL 30 minutes long signal
⚠️ Technical analysis: This is a multi-cycle resonance long signal! 4-hour confirms the bullish trend; 30-minute provides entry/exit signal: EMA5 crosses above EMA8, MACD’s DIF breaks above the zero line, and trading volume increases 2.3x to bullish.
════════════════════
🔴 $MINIMAX 30 minutes long signal
⚠️ Technical analysis: This is a multi-cycle resonance long setup! 4-hour confirms the bullish trend; 30-minute gives the entry point: MACD breaks above the zero line, short moving averages form a golden cross, and trading volume increases 1.6x.
════════════════════
🔔 Follow to get first-hand market movements 🔔
#多周期共振 #AMAT #MVLL #MINIMAX
📌 When trading, pay attention to whether the candlestick pattern matches
349
·
--
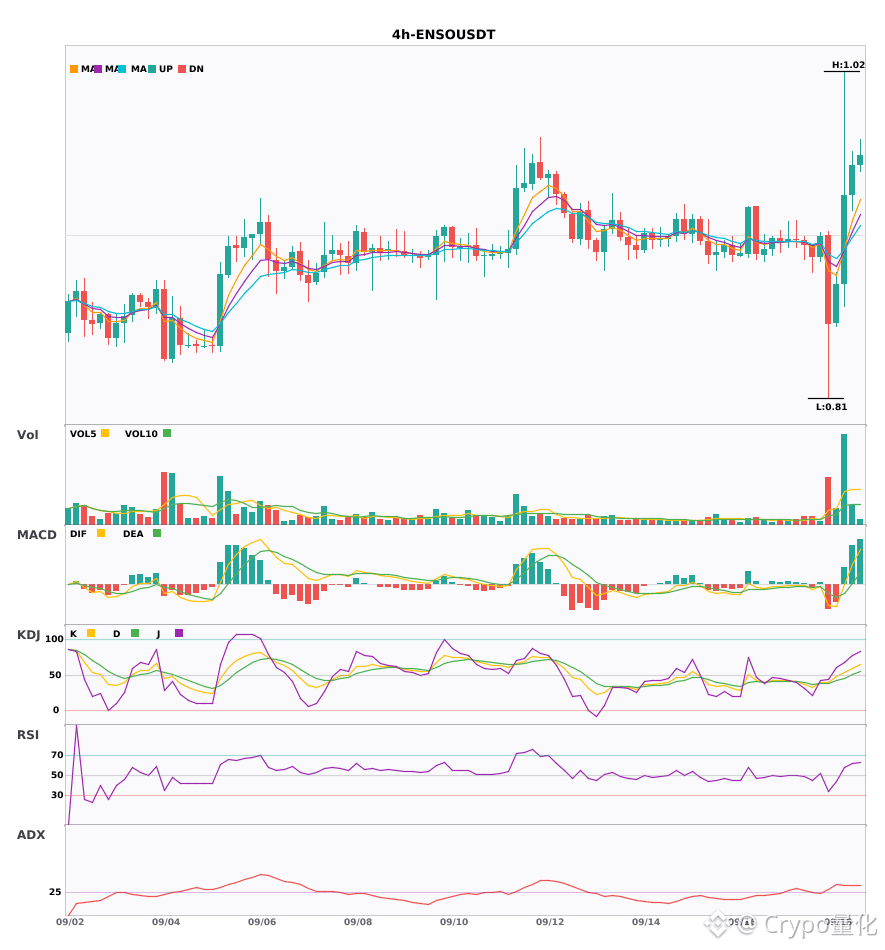
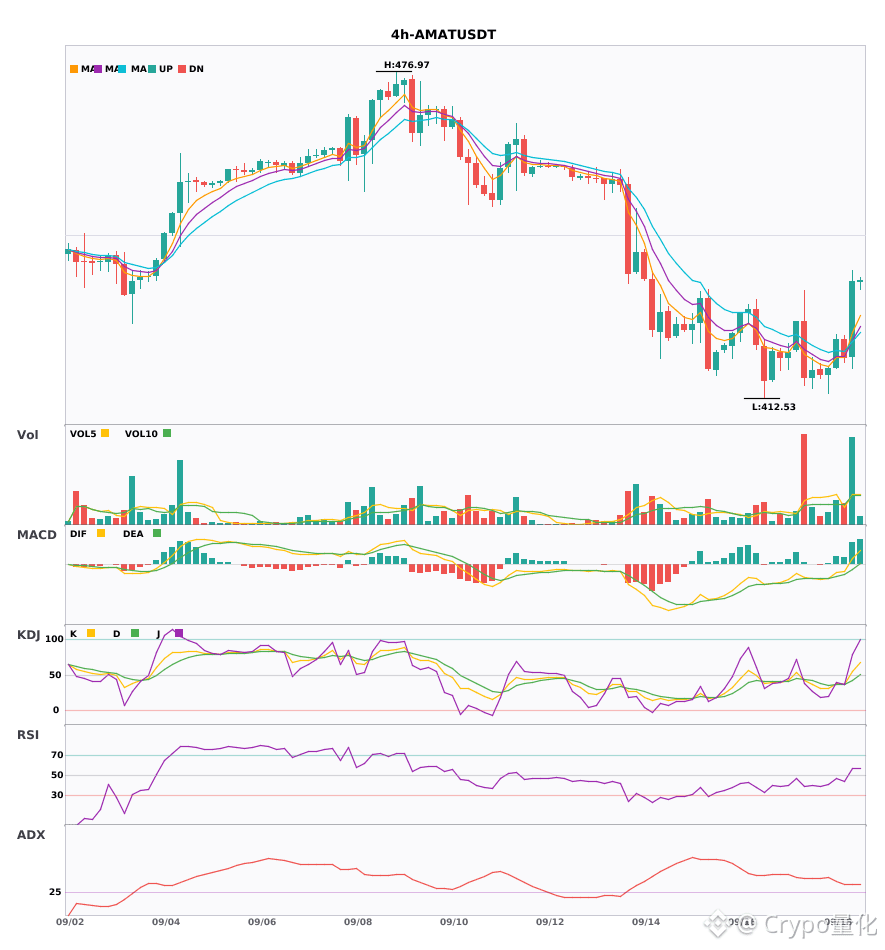
$ENSO and $AMAT both strengthen on the four-hour technical chart—whose breakout power is stronger?🔥
════════════════════
🔴 $ENSO 4-hour bullish signal
⚠️Technical view: ADX(35) shows a clear trending market | MACD DIF breaks above the zero line, trend turns bullish | EMA5 > EMA8 > EMA13 bullish alignment | KDJ is running strong, bullish dominance (K is 59.0, D is 50.0) | Volume surges (4.7x)
════════════════════
🔴 $AMAT 4-hour bullish signal
⚠️Technical view: ADX(32) shows a clear trending market | MACD DIF breaks above the zero line, trend turns bullish | EMA5 crosses above EMA8, short-term turns bullish | KDJ forms a golden cross, short-term looks bullish (K is 54.4, D is 42.3) | Volume surges (3.0x)
════════════════════
🔔 Follow to get the first-hand market move alerts 🔔
#技术分析 #ENSO #AMAT
📌 When trading, pay attention to whether the candlestick patterns match
$ENSO and $AMAT both strengthen on the four-hour technical chart—whose breakout power is stronger?🔥
════════════════════
🔴 $ENSO 4-hour bullish signal
⚠️Technical view: ADX(35) shows a clear trending market | MACD DIF breaks above the zero line, trend turns bullish | EMA5 > EMA8 > EMA13 bullish alignment | KDJ is running strong, bullish dominance (K is 59.0, D is 50.0) | Volume surges (4.7x)
════════════════════
🔴 $AMAT 4-hour bullish signal
⚠️Technical view: ADX(32) shows a clear trending market | MACD DIF breaks above the zero line, trend turns bullish | EMA5 crosses above EMA8, short-term turns bullish | KDJ forms a golden cross, short-term looks bullish (K is 54.4, D is 42.3) | Volume surges (3.0x)
════════════════════
🔔 Follow to get the first-hand market move alerts 🔔
#技术分析 #ENSO #AMAT
📌 When trading, pay attention to whether the candlestick patterns match
════════════════════
🔴 $ENSO 4-hour bullish signal
⚠️Technical view: ADX(35) shows a clear trending market | MACD DIF breaks above the zero line, trend turns bullish | EMA5 > EMA8 > EMA13 bullish alignment | KDJ is running strong, bullish dominance (K is 59.0, D is 50.0) | Volume surges (4.7x)
════════════════════
🔴 $AMAT 4-hour bullish signal
⚠️Technical view: ADX(32) shows a clear trending market | MACD DIF breaks above the zero line, trend turns bullish | EMA5 crosses above EMA8, short-term turns bullish | KDJ forms a golden cross, short-term looks bullish (K is 54.4, D is 42.3) | Volume surges (3.0x)
════════════════════
🔔 Follow to get the first-hand market move alerts 🔔
#技术分析 #ENSO #AMAT
📌 When trading, pay attention to whether the candlestick patterns match
125
·
--
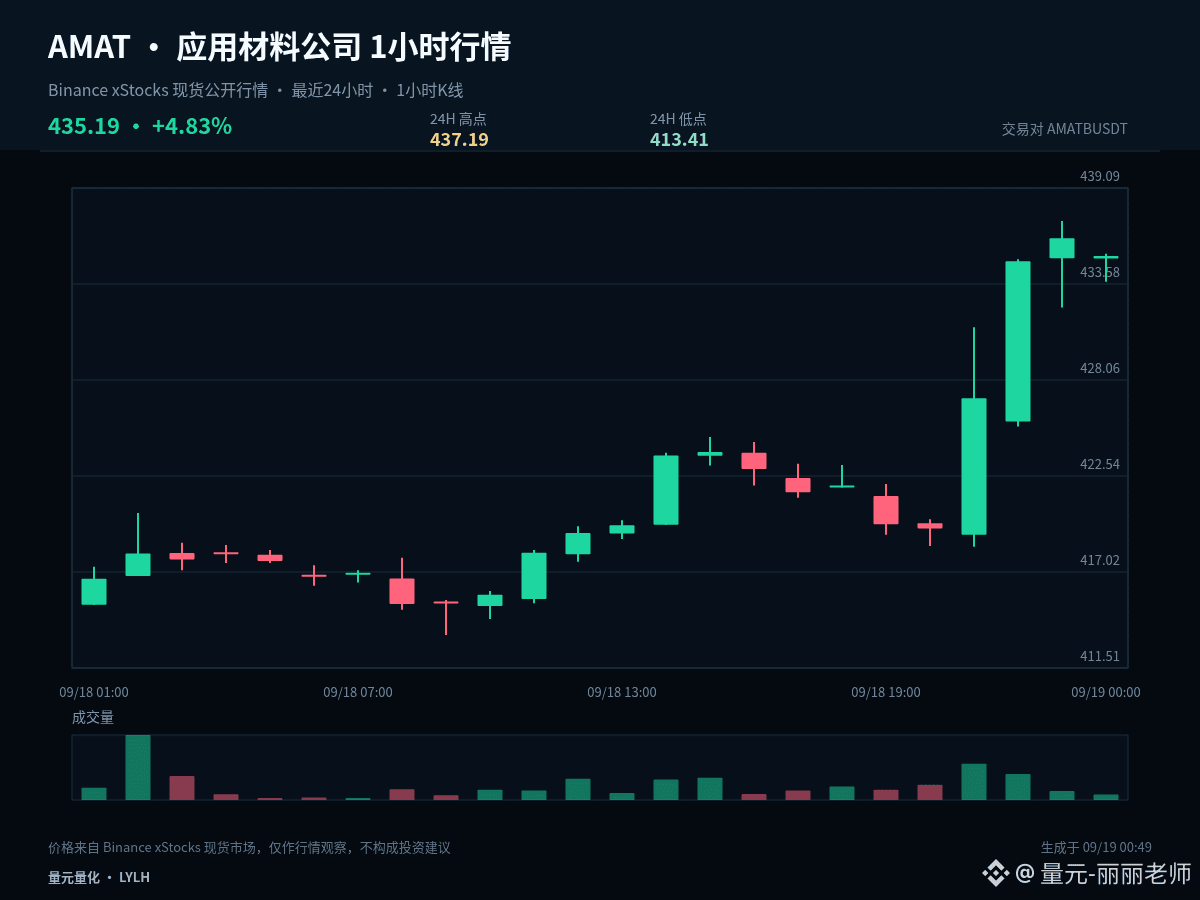
$AMATB #AMAT Order book notes: Current price 435.19, 1 hour -0.23%, 24 hours +4.89%, with an amplitude of about 5.5% over the last 24 hours. First write down the current data and my judgment; later I will verify it against the trend.
$AMATB #AMAT is once again approaching the high of the past 24 hours. The closer it gets to the resistance zone, the more important the closing position and the subsequent pullback become—breaking through intraday by itself does not mean it has truly settled above.
On key levels: 425.3 is the midline that must be reclaimed for a weak recovery. If price cannot stand back above this level, any rebound should still be treated as a technical repair. The area below 413.41 still has the possibility of being tested again; only after regaining the midline will it be valid to further observe 437.19.
For execution, set clear conditions: after a breakout above 437.19, you need confirmation—not chasing just because of a sudden spike; after a dip to 413.41, you need to see whether it can quickly reclaim the level—not just react to the drop. When the middle zone does not offer sufficient odds, waiting itself is also part of the strategy.
During review, I will check three things: how price reacts when it first approaches a key level, whether the 1-hour close completes the confirmation, and whether the plan is adjusted when the judgment becomes invalid. Compared with merely recording outcomes, these three items reveal execution issues more effectively.
Risk control comes before any conclusion: execute only when the conditions are met; if the price invalidates the setup, reassess promptly. The greater the volatility, the more restrained the position size per trade should be. The above is a projection based on current 1-hour and 24-hour data and does not constitute any promise of returns.
#BOJHikesRatesTo31YearHigh
$AMATB #AMAT Order book notes: Current price 435.19, 1 hour -0.23%, 24 hours +4.89%, with an amplitude of about 5.5% over the last 24 hours. First write down the current data and my judgment; later I will verify it against the trend.
$AMATB #AMAT is once again approaching the high of the past 24 hours. The closer it gets to the resistance zone, the more important the closing position and the subsequent pullback become—breaking through intraday by itself does not mean it has truly settled above.
On key levels: 425.3 is the midline that must be reclaimed for a weak recovery. If price cannot stand back above this level, any rebound should still be treated as a technical repair. The area below 413.41 still has the possibility of being tested again; only after regaining the midline will it be valid to further observe 437.19.
For execution, set clear conditions: after a breakout above 437.19, you need confirmation—not chasing just because of a sudden spike; after a dip to 413.41, you need to see whether it can quickly reclaim the level—not just react to the drop. When the middle zone does not offer sufficient odds, waiting itself is also part of the strategy.
During review, I will check three things: how price reacts when it first approaches a key level, whether the 1-hour close completes the confirmation, and whether the plan is adjusted when the judgment becomes invalid. Compared with merely recording outcomes, these three items reveal execution issues more effectively.
Risk control comes before any conclusion: execute only when the conditions are met; if the price invalidates the setup, reassess promptly. The greater the volatility, the more restrained the position size per trade should be. The above is a projection based on current 1-hour and 24-hour data and does not constitute any promise of returns.
#BOJHikesRatesTo31YearHigh
$AMATB #AMAT is once again approaching the high of the past 24 hours. The closer it gets to the resistance zone, the more important the closing position and the subsequent pullback become—breaking through intraday by itself does not mean it has truly settled above.
On key levels: 425.3 is the midline that must be reclaimed for a weak recovery. If price cannot stand back above this level, any rebound should still be treated as a technical repair. The area below 413.41 still has the possibility of being tested again; only after regaining the midline will it be valid to further observe 437.19.
For execution, set clear conditions: after a breakout above 437.19, you need confirmation—not chasing just because of a sudden spike; after a dip to 413.41, you need to see whether it can quickly reclaim the level—not just react to the drop. When the middle zone does not offer sufficient odds, waiting itself is also part of the strategy.
During review, I will check three things: how price reacts when it first approaches a key level, whether the 1-hour close completes the confirmation, and whether the plan is adjusted when the judgment becomes invalid. Compared with merely recording outcomes, these three items reveal execution issues more effectively.
Risk control comes before any conclusion: execute only when the conditions are met; if the price invalidates the setup, reassess promptly. The greater the volatility, the more restrained the position size per trade should be. The above is a projection based on current 1-hour and 24-hour data and does not constitute any promise of returns.
#BOJHikesRatesTo31YearHigh
18
·
--
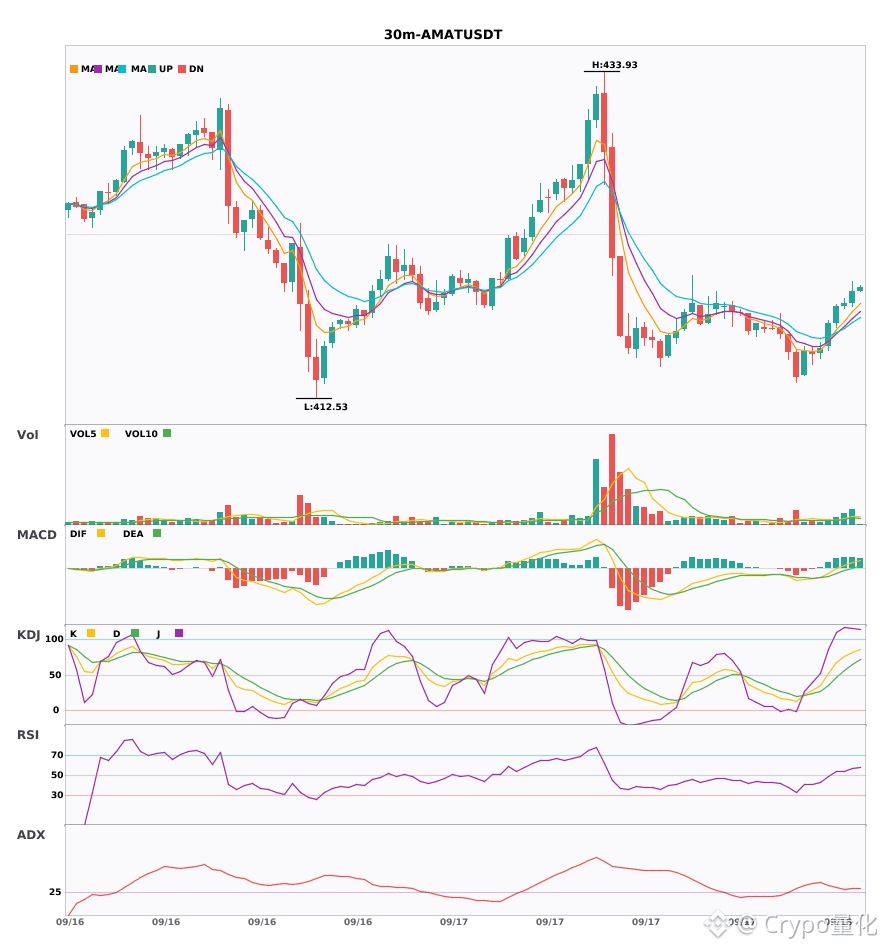
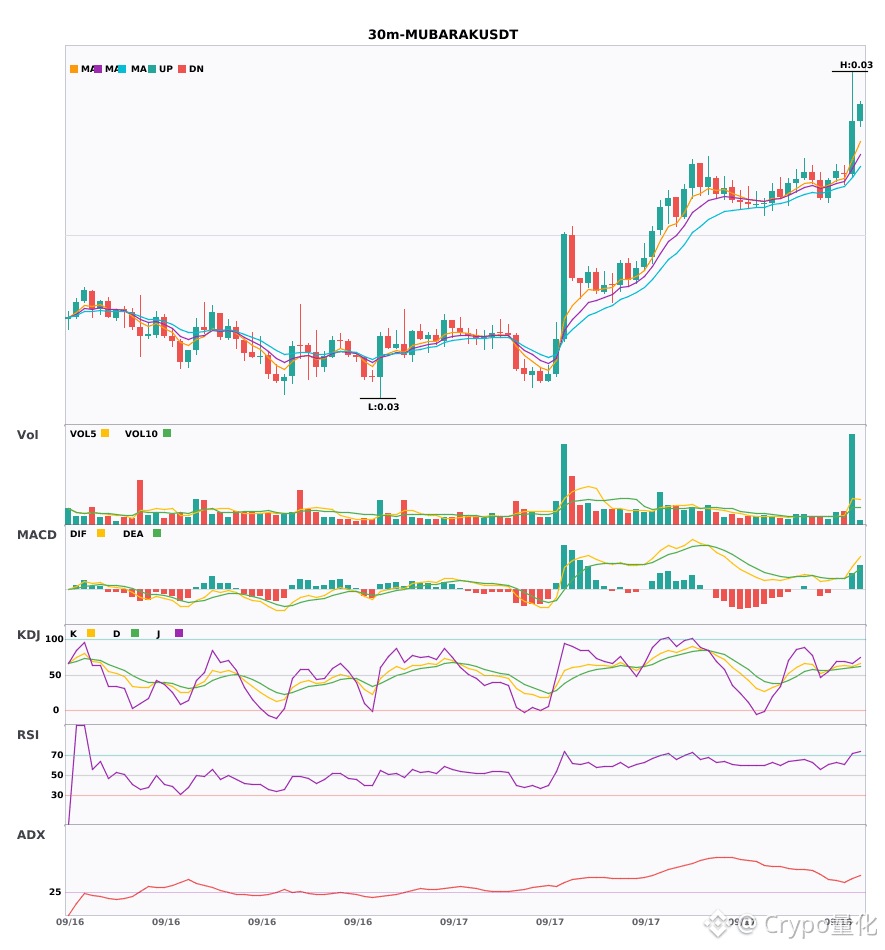
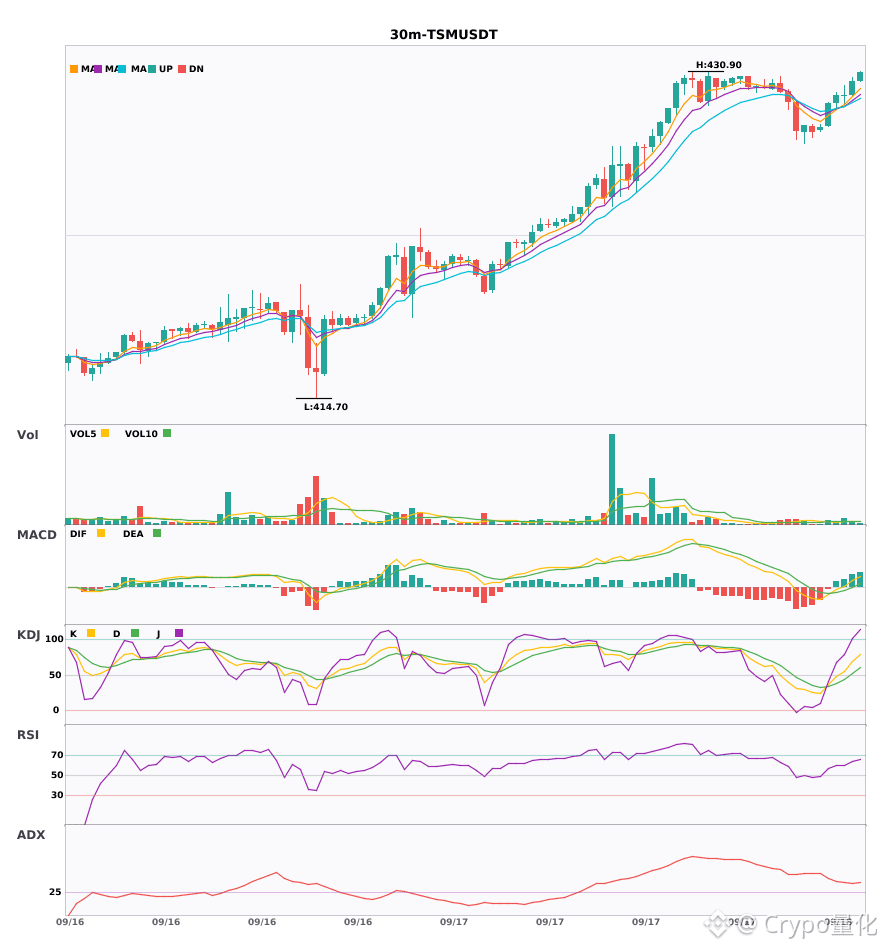
$AMAT / $MUBARAK / $TSM 30 minutes resonance to turn more, bullish signals appear at the same time🔥
════════════════════
🔴 $AMAT 30 minutes bullish signals
⚠️ Technicals: ADX reaching 31 indicates a clear trend. After the MACD golden cross, the volume increases and red histogram bars continue expanding. Moving averages are in a bullish alignment. KDJ K crosses above D without entering the overbought zone, and trading volume is up to twice.
════════════════════
🔴 $MUBARAK 30 minutes bullish signals
⚠️ Technicals: ADX (37) clearly shows a trending market | MACD forms an above-zero golden cross, releasing bullish momentum | EMA5 > EMA8 > EMA13 in bullish alignment | KDJ is running strongly with bulls in control (K 62.5, D 60.4) | Trading volume explodes (5.3x)
📢 Market update: Binance will support airdropping Doodles (DOOD) to holders of MUBARAK, BROCCOLI714, TST, 1MBABYDOGE, and KOMA.
════════════════════
🔴 $TSM 30 minutes bullish signals
⚠️ Technicals: ADX reaches 37, a clearly trending market; MACD DIF breaks above the zero axis to turn bullish, EMA5 crosses above EMA8 for a short-term bullish shift, with volume expanding by 1.8x.
📢 Market update: Binance will, via the bStocks platform, support the distribution of cash dividends for TSM (TSMC) and CRM (Salesforce).
════════════════════
🔔 Follow to get first-hand updates on unusual price moves 🔔
#技术分析 #AMAT #MUBARAK #TSM
📌 When trading, pay attention to whether the candlestick patterns match
$AMAT / $MUBARAK / $TSM 30 minutes resonance to turn more, bullish signals appear at the same time🔥
════════════════════
🔴 $AMAT 30 minutes bullish signals
⚠️ Technicals: ADX reaching 31 indicates a clear trend. After the MACD golden cross, the volume increases and red histogram bars continue expanding. Moving averages are in a bullish alignment. KDJ K crosses above D without entering the overbought zone, and trading volume is up to twice.
════════════════════
🔴 $MUBARAK 30 minutes bullish signals
⚠️ Technicals: ADX (37) clearly shows a trending market | MACD forms an above-zero golden cross, releasing bullish momentum | EMA5 > EMA8 > EMA13 in bullish alignment | KDJ is running strongly with bulls in control (K 62.5, D 60.4) | Trading volume explodes (5.3x)
📢 Market update: Binance will support airdropping Doodles (DOOD) to holders of MUBARAK, BROCCOLI714, TST, 1MBABYDOGE, and KOMA.
════════════════════
🔴 $TSM 30 minutes bullish signals
⚠️ Technicals: ADX reaches 37, a clearly trending market; MACD DIF breaks above the zero axis to turn bullish, EMA5 crosses above EMA8 for a short-term bullish shift, with volume expanding by 1.8x.
📢 Market update: Binance will, via the bStocks platform, support the distribution of cash dividends for TSM (TSMC) and CRM (Salesforce).
════════════════════
🔔 Follow to get first-hand updates on unusual price moves 🔔
#技术分析 #AMAT #MUBARAK #TSM
📌 When trading, pay attention to whether the candlestick patterns match
════════════════════
🔴 $AMAT 30 minutes bullish signals
⚠️ Technicals: ADX reaching 31 indicates a clear trend. After the MACD golden cross, the volume increases and red histogram bars continue expanding. Moving averages are in a bullish alignment. KDJ K crosses above D without entering the overbought zone, and trading volume is up to twice.
════════════════════
🔴 $MUBARAK 30 minutes bullish signals
⚠️ Technicals: ADX (37) clearly shows a trending market | MACD forms an above-zero golden cross, releasing bullish momentum | EMA5 > EMA8 > EMA13 in bullish alignment | KDJ is running strongly with bulls in control (K 62.5, D 60.4) | Trading volume explodes (5.3x)
📢 Market update: Binance will support airdropping Doodles (DOOD) to holders of MUBARAK, BROCCOLI714, TST, 1MBABYDOGE, and KOMA.
════════════════════
🔴 $TSM 30 minutes bullish signals
⚠️ Technicals: ADX reaches 37, a clearly trending market; MACD DIF breaks above the zero axis to turn bullish, EMA5 crosses above EMA8 for a short-term bullish shift, with volume expanding by 1.8x.
📢 Market update: Binance will, via the bStocks platform, support the distribution of cash dividends for TSM (TSMC) and CRM (Salesforce).
════════════════════
🔔 Follow to get first-hand updates on unusual price moves 🔔
#技术分析 #AMAT #MUBARAK #TSM
📌 When trading, pay attention to whether the candlestick patterns match
19
·
--
$AMATB #AMAT Current price 431.33, 1 hour +1.05%, 24 hours +0.82%. Rather than locking in long or short positions in advance, it’s better to list the possible paths and the corresponding actions.
The current price is close to the upper bound of the past 24-hour range: 1 hour +1.05%, 24 hours +0.82%. The most important thing at the highs is to confirm post-breakout acceptance. If the price can stay above the upper band, it indicates the market recognizes a higher trading range. If it only briefly pierces through and quickly reverts, you need to guard against a false breakout.
The first path is upward: the price needs to break 431.85 and form a stable close above it; only then is the confirmation valid if a subsequent pullback does not break back below. The second path is downward: once 412.4 is lost and the ensuing retest fails to reclaim it, it suggests insufficient support—focus on defense rather than rushing to add to positions.
If the price continues to trade between 431.85 and 412.4, 422.125 should be used only as a short-term reference for initiative. The middle of the range has no clear advantage—don’t open positions just to have a sense of participation; wait for the market to show its direction.
Existing positions can be handled in stages based on key levels to avoid making all decisions at once. Those with no position should wait for breakout confirmation or a pullback that stabilizes. For U.S. stock-related instruments, also pay attention to volatility caused by trading session changes. Let price conditions determine the plan—don’t let emotions replace execution.
For short-term positions, the focus is not to predict every single candlestick; it’s to ensure there’s a basis for entry, trimming, and exiting. Do less until it’s confirmed. If key levels fail, redo the plan. Control single-trade risk first, then talk about the potential upside or downside space.
#SKPoliceRefer18PolymarketUsersToProsecutors
$AMATB #AMAT Current price 431.33, 1 hour +1.05%, 24 hours +0.82%. Rather than locking in long or short positions in advance, it’s better to list the possible paths and the corresponding actions.
The current price is close to the upper bound of the past 24-hour range: 1 hour +1.05%, 24 hours +0.82%. The most important thing at the highs is to confirm post-breakout acceptance. If the price can stay above the upper band, it indicates the market recognizes a higher trading range. If it only briefly pierces through and quickly reverts, you need to guard against a false breakout.
The first path is upward: the price needs to break 431.85 and form a stable close above it; only then is the confirmation valid if a subsequent pullback does not break back below. The second path is downward: once 412.4 is lost and the ensuing retest fails to reclaim it, it suggests insufficient support—focus on defense rather than rushing to add to positions.
If the price continues to trade between 431.85 and 412.4, 422.125 should be used only as a short-term reference for initiative. The middle of the range has no clear advantage—don’t open positions just to have a sense of participation; wait for the market to show its direction.
Existing positions can be handled in stages based on key levels to avoid making all decisions at once. Those with no position should wait for breakout confirmation or a pullback that stabilizes. For U.S. stock-related instruments, also pay attention to volatility caused by trading session changes. Let price conditions determine the plan—don’t let emotions replace execution.
For short-term positions, the focus is not to predict every single candlestick; it’s to ensure there’s a basis for entry, trimming, and exiting. Do less until it’s confirmed. If key levels fail, redo the plan. Control single-trade risk first, then talk about the potential upside or downside space.
#SKPoliceRefer18PolymarketUsersToProsecutors
The current price is close to the upper bound of the past 24-hour range: 1 hour +1.05%, 24 hours +0.82%. The most important thing at the highs is to confirm post-breakout acceptance. If the price can stay above the upper band, it indicates the market recognizes a higher trading range. If it only briefly pierces through and quickly reverts, you need to guard against a false breakout.
The first path is upward: the price needs to break 431.85 and form a stable close above it; only then is the confirmation valid if a subsequent pullback does not break back below. The second path is downward: once 412.4 is lost and the ensuing retest fails to reclaim it, it suggests insufficient support—focus on defense rather than rushing to add to positions.
If the price continues to trade between 431.85 and 412.4, 422.125 should be used only as a short-term reference for initiative. The middle of the range has no clear advantage—don’t open positions just to have a sense of participation; wait for the market to show its direction.
Existing positions can be handled in stages based on key levels to avoid making all decisions at once. Those with no position should wait for breakout confirmation or a pullback that stabilizes. For U.S. stock-related instruments, also pay attention to volatility caused by trading session changes. Let price conditions determine the plan—don’t let emotions replace execution.
For short-term positions, the focus is not to predict every single candlestick; it’s to ensure there’s a basis for entry, trimming, and exiting. Do less until it’s confirmed. If key levels fail, redo the plan. Control single-trade risk first, then talk about the potential upside or downside space.
#SKPoliceRefer18PolymarketUsersToProsecutors
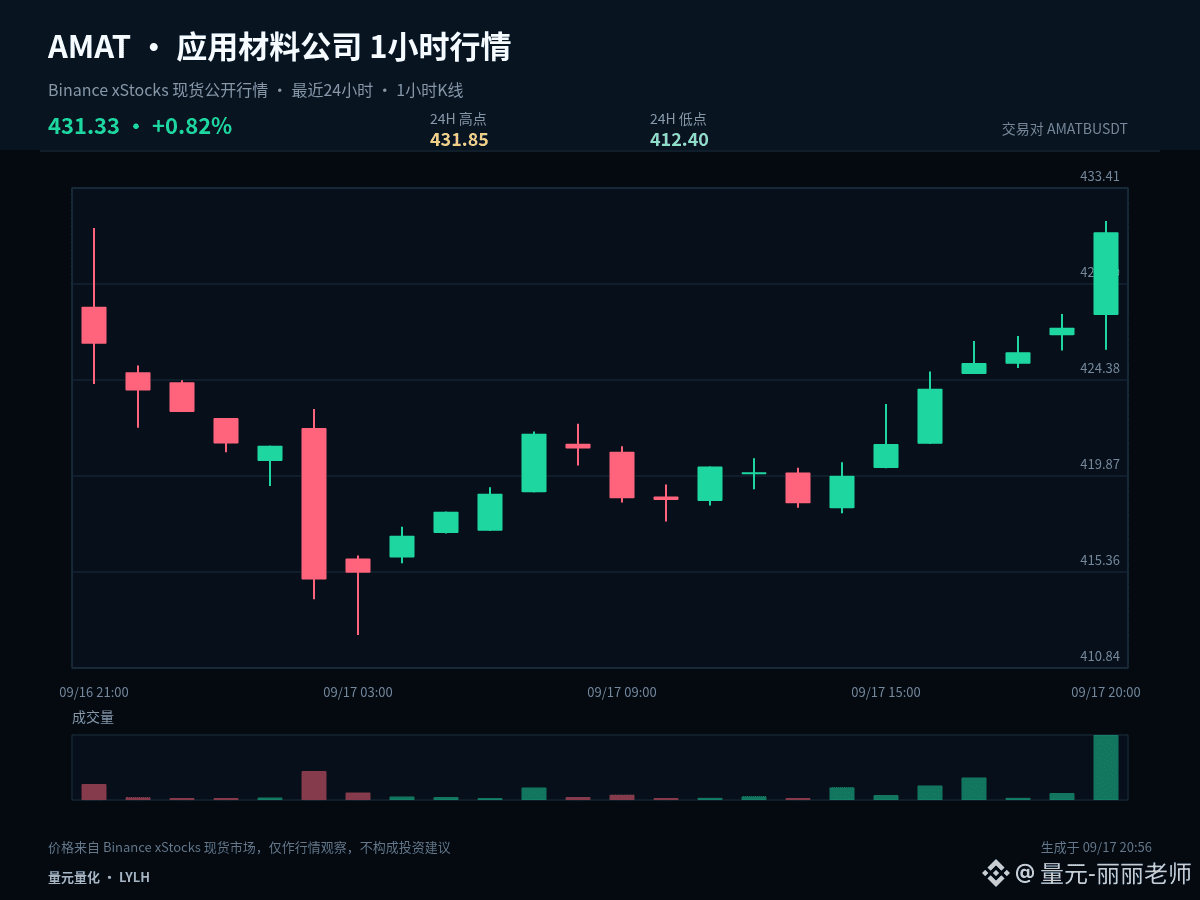
49
·
--
$AMATB #AMAT It currently feels more like a range with rotation/turnover, so there’s no need to interpret every individual 1-hour candlestick as a brand-new trend. Current price is 424.29; 1 hour -0.42%, 24 hours +0.09%.
With the 1-hour -0.42% and 24-hour +0.09%, the two periods have not formed sufficiently clear alignment in the same direction. In a ranging market, the tolerance for chasing and killing (buying high/selling low) is lower. It’s more suitable to use confirmation at the upper boundary for direction, confirmation at the lower boundary for support, and treat the midline only as the strength/weakness dividing line.
Upper range: 431.53, lower range: 417.21, midline: 424.37. Watch for breakout quality near the upper boundary; watch for support near the lower boundary. Near the midline, reduce frequent trading—because it’s not far enough from either side, and both the direction and risk-reward are not clear.
The signals truly worth acting on are: after a price breakout, it’s willing to stay inside the new range; or after dipping to the boundary, it quickly snaps back. Without such confirmation, continue treating it as consolidation, and don’t let brief intraday fluctuations change the overall plan.
Position management should distinguish between swing/medium-term and short-term trades. For existing medium-term positions, first check whether the structure is broken; don’t let repeated reactions from a single 1-hour candlestick constantly influence you. For short-term positions, execute around support, resistance, and close-based confirmation. If you’re in cash, there’s no need to chase price in the middle of the range—waiting for a clearer level is often more advantageous.
Every trading plan must include invalidation conditions. If you’re right, you can realize gains in stages; if you’re wrong, you must allow yourself to exit. You can’t use adding positions to mask the fact that the original logic has changed. The market will evolve, and your view should adjust along with price evidence.
#USSenateBlocksClarityAct
$AMATB #AMAT It currently feels more like a range with rotation/turnover, so there’s no need to interpret every individual 1-hour candlestick as a brand-new trend. Current price is 424.29; 1 hour -0.42%, 24 hours +0.09%.
With the 1-hour -0.42% and 24-hour +0.09%, the two periods have not formed sufficiently clear alignment in the same direction. In a ranging market, the tolerance for chasing and killing (buying high/selling low) is lower. It’s more suitable to use confirmation at the upper boundary for direction, confirmation at the lower boundary for support, and treat the midline only as the strength/weakness dividing line.
Upper range: 431.53, lower range: 417.21, midline: 424.37. Watch for breakout quality near the upper boundary; watch for support near the lower boundary. Near the midline, reduce frequent trading—because it’s not far enough from either side, and both the direction and risk-reward are not clear.
The signals truly worth acting on are: after a price breakout, it’s willing to stay inside the new range; or after dipping to the boundary, it quickly snaps back. Without such confirmation, continue treating it as consolidation, and don’t let brief intraday fluctuations change the overall plan.
Position management should distinguish between swing/medium-term and short-term trades. For existing medium-term positions, first check whether the structure is broken; don’t let repeated reactions from a single 1-hour candlestick constantly influence you. For short-term positions, execute around support, resistance, and close-based confirmation. If you’re in cash, there’s no need to chase price in the middle of the range—waiting for a clearer level is often more advantageous.
Every trading plan must include invalidation conditions. If you’re right, you can realize gains in stages; if you’re wrong, you must allow yourself to exit. You can’t use adding positions to mask the fact that the original logic has changed. The market will evolve, and your view should adjust along with price evidence.
#USSenateBlocksClarityAct
With the 1-hour -0.42% and 24-hour +0.09%, the two periods have not formed sufficiently clear alignment in the same direction. In a ranging market, the tolerance for chasing and killing (buying high/selling low) is lower. It’s more suitable to use confirmation at the upper boundary for direction, confirmation at the lower boundary for support, and treat the midline only as the strength/weakness dividing line.
Upper range: 431.53, lower range: 417.21, midline: 424.37. Watch for breakout quality near the upper boundary; watch for support near the lower boundary. Near the midline, reduce frequent trading—because it’s not far enough from either side, and both the direction and risk-reward are not clear.
The signals truly worth acting on are: after a price breakout, it’s willing to stay inside the new range; or after dipping to the boundary, it quickly snaps back. Without such confirmation, continue treating it as consolidation, and don’t let brief intraday fluctuations change the overall plan.
Position management should distinguish between swing/medium-term and short-term trades. For existing medium-term positions, first check whether the structure is broken; don’t let repeated reactions from a single 1-hour candlestick constantly influence you. For short-term positions, execute around support, resistance, and close-based confirmation. If you’re in cash, there’s no need to chase price in the middle of the range—waiting for a clearer level is often more advantageous.
Every trading plan must include invalidation conditions. If you’re right, you can realize gains in stages; if you’re wrong, you must allow yourself to exit. You can’t use adding positions to mask the fact that the original logic has changed. The market will evolve, and your view should adjust along with price evidence.
#USSenateBlocksClarityAct
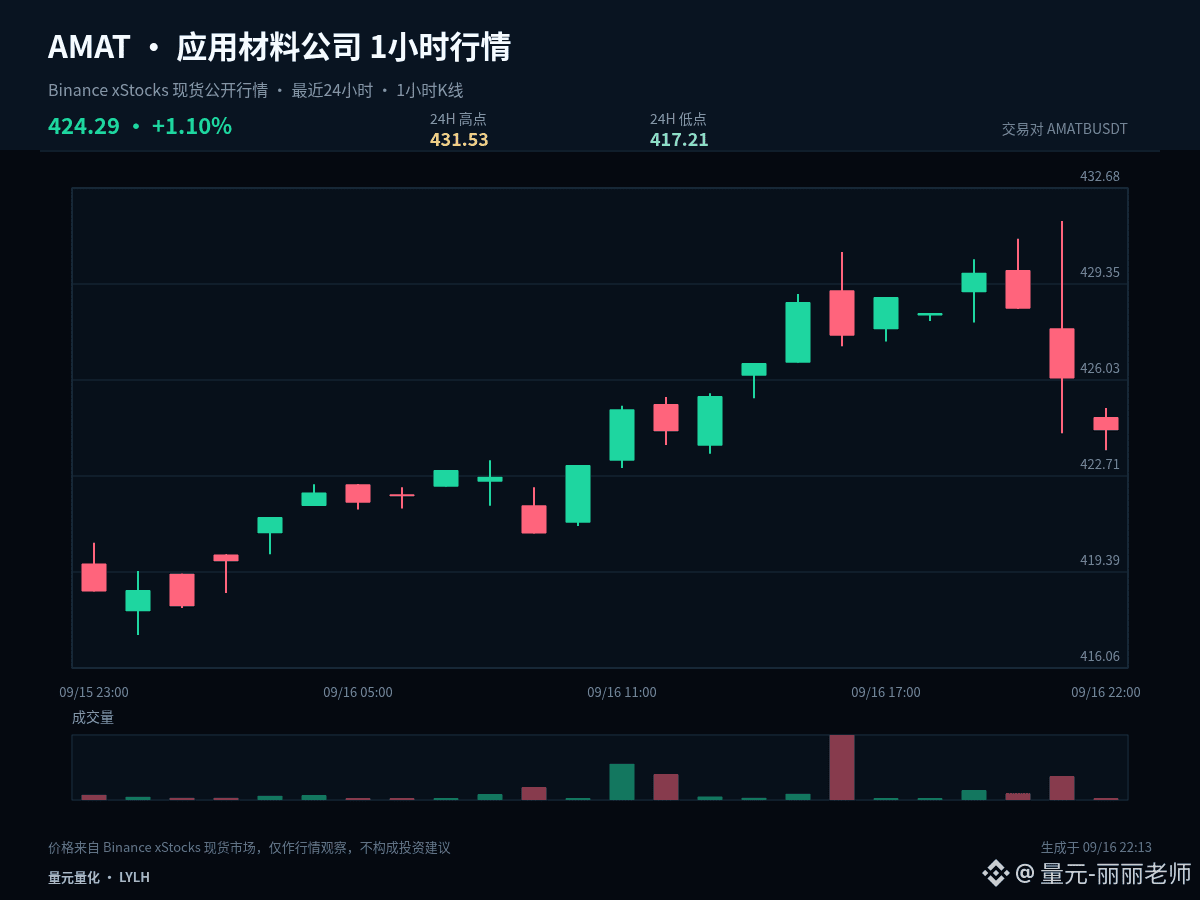
8
Log in to explore more content
Join global crypto users on Binance Square
⚡️ Get latest and useful information about crypto.
💬 Trusted by the world’s largest crypto exchange.
👍 Discover real insights from verified creators.
Email / Phone number
Trending Topics
1
#AIStocksWhatNext
874,300 views
6,580 Discussing
2
#BitcoinRejectedAt$87,300Twice
0 views
0 Discussing
3
#BCHJumps28%OnCMEFuturesListing
10,061 views
489 Discussing
4
#WallStreetEarningsRevisionsTurnBearish
7,287 views
364 Discussing
5
#DollarIndexReclaims101
5,889 views
303 Discussing
6
#21SharesLaunchesEuropesFirstZcashETP
40,400 views
1,096 Discussing
7
#CardanoJoinsX402PaymentStandard
25,635 views
786 Discussing
8
#BitcoinTops$87KAtEightMonthHigh
12,398 views
133 Discussing
9
#ZECBreaksAbove$1600AtRecordHigh
8,765 views
107 Discussing
10
#BitwiseNEARStakingETPAssetsTop$100M
40,916 views
108 Discussing