
#8
8
68,216 views
490 Discussing
Hot
Latest

💡 Important info: TRON is quietly holding its ground as the 8th largest coin in the world with a market cap of over 31 billion USD, while most of the market is still drowning in fear.
Details:
💰 Current TRX price: 0.3286 USD
📉 24h change: -0.89%
📈 7-day change: +3.33%
📊 24h volume: ~442 million USD
🏦 Market Cap: ~31.16 billion USD (ranked #8)
🔒 TVL on TRON: ~4.57 billion USD
💵 USDT on TRC20: accounts for a large portion of the 186 billion USD global market cap of USDT
⚡ Distance from ATH (0.4313 USD): -23.8%
Noteworthy:
TRON is currently the largest backbone for the USDT stablecoin, processing billions of transactions daily with nearly zero fees. As Ethereum fees skyrocket, stablecoin flows naturally shift to TRC20. This is the "golden goose" that few are paying attention to.
Looking ahead:
With a TVL of 4.57 billion USD and JustLend controlling over 3 billion, TRON has evolved from just a transfer network to a real DeFi ecosystem. In the context of extreme market fear (Fear & Greed Index = 23), TRX has only dipped slightly by 0.89% in 24h — showcasing strong support compared to many other altcoins.
Do you think TRX can hit its ATH of 0.43 USD again this year?
👉 Keep an eye on the market 24/7 — Follow the channel https://app.binance.com/uni-qr/cpro/Square-Creator-4a0f2008149d?l=en&r=BOZMO8A1
#TRX #TRON #CryptoNews #BinanceSquare $ETH
💡 Important info: TRON is quietly holding its ground as the 8th largest coin in the world with a market cap of over 31 billion USD, while most of the market is still drowning in fear.
Details:
💰 Current TRX price: 0.3286 USD
📉 24h change: -0.89%
📈 7-day change: +3.33%
📊 24h volume: ~442 million USD
🏦 Market Cap: ~31.16 billion USD (ranked #8)
🔒 TVL on TRON: ~4.57 billion USD
💵 USDT on TRC20: accounts for a large portion of the 186 billion USD global market cap of USDT
⚡ Distance from ATH (0.4313 USD): -23.8%
Noteworthy:
TRON is currently the largest backbone for the USDT stablecoin, processing billions of transactions daily with nearly zero fees. As Ethereum fees skyrocket, stablecoin flows naturally shift to TRC20. This is the "golden goose" that few are paying attention to.
Looking ahead:
With a TVL of 4.57 billion USD and JustLend controlling over 3 billion, TRON has evolved from just a transfer network to a real DeFi ecosystem. In the context of extreme market fear (Fear & Greed Index = 23), TRX has only dipped slightly by 0.89% in 24h — showcasing strong support compared to many other altcoins.
Do you think TRX can hit its ATH of 0.43 USD again this year?
👉 Keep an eye on the market 24/7 — Follow the channel https://app.binance.com/uni-qr/cpro/Square-Creator-4a0f2008149d?l=en&r=BOZMO8A1
#TRX #TRON #CryptoNews #BinanceSquare $ETH
Details:
💰 Current TRX price: 0.3286 USD
📉 24h change: -0.89%
📈 7-day change: +3.33%
📊 24h volume: ~442 million USD
🏦 Market Cap: ~31.16 billion USD (ranked #8)
🔒 TVL on TRON: ~4.57 billion USD
💵 USDT on TRC20: accounts for a large portion of the 186 billion USD global market cap of USDT
⚡ Distance from ATH (0.4313 USD): -23.8%
Noteworthy:
TRON is currently the largest backbone for the USDT stablecoin, processing billions of transactions daily with nearly zero fees. As Ethereum fees skyrocket, stablecoin flows naturally shift to TRC20. This is the "golden goose" that few are paying attention to.
Looking ahead:
With a TVL of 4.57 billion USD and JustLend controlling over 3 billion, TRON has evolved from just a transfer network to a real DeFi ecosystem. In the context of extreme market fear (Fear & Greed Index = 23), TRX has only dipped slightly by 0.89% in 24h — showcasing strong support compared to many other altcoins.
Do you think TRX can hit its ATH of 0.43 USD again this year?
👉 Keep an eye on the market 24/7 — Follow the channel https://app.binance.com/uni-qr/cpro/Square-Creator-4a0f2008149d?l=en&r=BOZMO8A1
#TRX #TRON #CryptoNews #BinanceSquare $ETH
54

·
--
Don’t let intraday pullbacks scare you off. For this trade on H, I’m only looking to go long on the dips; if it breaks down, I’ll admit I was wrong.
HUSDT contract execution plan
- Direction: Long (buying on dips in batches)
- Entry range: 0.24615 - 0.25171
- Stop-loss: 0.23742
- Target 1: 0.26124
- Target 2: 0.26680
- Target 3: 0.27394
This trade is based on the "odds of a strong asset recovering after a pullback," not just blindly catching the bottom. Alpha rank #8, Alpha 24h +11.55%, contract 24h +11.51%, with spot and contract gains moving in sync, still showing directional consistency; however, 1h -1.68%, 4h -3.26%, indicating short-term pullback, so it’s better to wait for the range to hold before jumping in, no chasing highs. OI at 286 million, 24h about -0.00%, implying overall positions are stable, and I haven’t seen any crowded leverage getting out of hand; 24h trading volume at 34.755 million, plenty of liquidity for batching. Note that funding is +0.0459% which is on the high side, meaning long positions have a steep cost; if the price doesn’t pump soon, the pullback could intensify, which is why the stop-loss is set at 0.23742. Risk rating: medium; if the stop-loss level is breached, this long logic goes out the window.
Click here to open a position on $H👇
Don’t let intraday pullbacks scare you off. For this trade on H, I’m only looking to go long on the dips; if it breaks down, I’ll admit I was wrong.
HUSDT contract execution plan
- Direction: Long (buying on dips in batches)
- Entry range: 0.24615 - 0.25171
- Stop-loss: 0.23742
- Target 1: 0.26124
- Target 2: 0.26680
- Target 3: 0.27394
This trade is based on the "odds of a strong asset recovering after a pullback," not just blindly catching the bottom. Alpha rank #8, Alpha 24h +11.55%, contract 24h +11.51%, with spot and contract gains moving in sync, still showing directional consistency; however, 1h -1.68%, 4h -3.26%, indicating short-term pullback, so it’s better to wait for the range to hold before jumping in, no chasing highs. OI at 286 million, 24h about -0.00%, implying overall positions are stable, and I haven’t seen any crowded leverage getting out of hand; 24h trading volume at 34.755 million, plenty of liquidity for batching. Note that funding is +0.0459% which is on the high side, meaning long positions have a steep cost; if the price doesn’t pump soon, the pullback could intensify, which is why the stop-loss is set at 0.23742. Risk rating: medium; if the stop-loss level is breached, this long logic goes out the window.
Click here to open a position on $H 👇
HUSDT contract execution plan
- Direction: Long (buying on dips in batches)
- Entry range: 0.24615 - 0.25171
- Stop-loss: 0.23742
- Target 1: 0.26124
- Target 2: 0.26680
- Target 3: 0.27394
This trade is based on the "odds of a strong asset recovering after a pullback," not just blindly catching the bottom. Alpha rank #8, Alpha 24h +11.55%, contract 24h +11.51%, with spot and contract gains moving in sync, still showing directional consistency; however, 1h -1.68%, 4h -3.26%, indicating short-term pullback, so it’s better to wait for the range to hold before jumping in, no chasing highs. OI at 286 million, 24h about -0.00%, implying overall positions are stable, and I haven’t seen any crowded leverage getting out of hand; 24h trading volume at 34.755 million, plenty of liquidity for batching. Note that funding is +0.0459% which is on the high side, meaning long positions have a steep cost; if the price doesn’t pump soon, the pullback could intensify, which is why the stop-loss is set at 0.23742. Risk rating: medium; if the stop-loss level is breached, this long logic goes out the window.
Click here to open a position on $H 👇
203
·
--
H How to play this segment? My answer is: only go long on pullbacks, don’t chase the price that just pumped up.
I’m setting my plan in stone, no changes during the session:
Entry looks to be in the range of `0.27169 - 0.27673`, with a stop-loss at `0.26376`, and targets up at `0.28538 / 0.29043 / 0.29692`.
Why this approach? — First, let's look at the time frame divergence. The 1h chart is currently at `+2.50%`, making a quick short-term jump; however, the 4h is at `-0.05%`, indicating that the mid-term hasn’t fully transitioned into a smooth uptrend yet. This setup feels more like '1-hour sprint, 4-hour confirmation'. Chasing high prices now doesn’t offer great risk-reward, so it’s better to wait for a pullback into the planned zone to grab a position; this makes stop-loss clearer and the risk-reward ratio more manageable.
On the data side, it’s leaning bullish but not extreme: Alpha Rank `#8`, Alpha24h `+9.20%`, futures 24h `+9.06%`, both spot and futures are moving in the same direction; 24h trading volume is `2176.26万`, providing liquidity to execute in batches. The risks to watch out for are in position sizing and fees: OI is `2.96亿` but down `-0.03%`, indicating that the new positions in this uptrend aren’t significant, so we need to monitor for continuation; funding is at `+0.0594%`, which is relatively high, meaning long positions are getting more expensive, and chasing orders could easily lead to a pullback. The conclusion is clear: execute with medium risk, only scale into longs within the range, and cut losses if it breaks `0.26376`.
Click here to place an order $H👇
H How to play this segment? My answer is: only go long on pullbacks, don’t chase the price that just pumped up.
I’m setting my plan in stone, no changes during the session:
Entry looks to be in the range of `0.27169 - 0.27673`, with a stop-loss at `0.26376`, and targets up at `0.28538 / 0.29043 / 0.29692`.
Why this approach? — First, let's look at the time frame divergence. The 1h chart is currently at `+2.50%`, making a quick short-term jump; however, the 4h is at `-0.05%`, indicating that the mid-term hasn’t fully transitioned into a smooth uptrend yet. This setup feels more like '1-hour sprint, 4-hour confirmation'. Chasing high prices now doesn’t offer great risk-reward, so it’s better to wait for a pullback into the planned zone to grab a position; this makes stop-loss clearer and the risk-reward ratio more manageable.
On the data side, it’s leaning bullish but not extreme: Alpha Rank `#8`, Alpha24h `+9.20%`, futures 24h `+9.06%`, both spot and futures are moving in the same direction; 24h trading volume is `2176.26万`, providing liquidity to execute in batches. The risks to watch out for are in position sizing and fees: OI is `2.96亿` but down `-0.03%`, indicating that the new positions in this uptrend aren’t significant, so we need to monitor for continuation; funding is at `+0.0594%`, which is relatively high, meaning long positions are getting more expensive, and chasing orders could easily lead to a pullback. The conclusion is clear: execute with medium risk, only scale into longs within the range, and cut losses if it breaks `0.26376`.
Click here to place an order $H 👇
I’m setting my plan in stone, no changes during the session:
Entry looks to be in the range of `0.27169 - 0.27673`, with a stop-loss at `0.26376`, and targets up at `0.28538 / 0.29043 / 0.29692`.
Why this approach? — First, let's look at the time frame divergence. The 1h chart is currently at `+2.50%`, making a quick short-term jump; however, the 4h is at `-0.05%`, indicating that the mid-term hasn’t fully transitioned into a smooth uptrend yet. This setup feels more like '1-hour sprint, 4-hour confirmation'. Chasing high prices now doesn’t offer great risk-reward, so it’s better to wait for a pullback into the planned zone to grab a position; this makes stop-loss clearer and the risk-reward ratio more manageable.
On the data side, it’s leaning bullish but not extreme: Alpha Rank `#8`, Alpha24h `+9.20%`, futures 24h `+9.06%`, both spot and futures are moving in the same direction; 24h trading volume is `2176.26万`, providing liquidity to execute in batches. The risks to watch out for are in position sizing and fees: OI is `2.96亿` but down `-0.03%`, indicating that the new positions in this uptrend aren’t significant, so we need to monitor for continuation; funding is at `+0.0594%`, which is relatively high, meaning long positions are getting more expensive, and chasing orders could easily lead to a pullback. The conclusion is clear: execute with medium risk, only scale into longs within the range, and cut losses if it breaks `0.26376`.
Click here to place an order $H 👇
163

·
--
$HOME This drop is a bit brutal—on the 15m chart it’s directly -2.59%. The trading volume has hit 2.08x, with a Z value of 3.02, which indicates a volume-backed sell-off. The key point is that OI is falling along with it: 15m -0.44%, 1h -0.12%, nominal change -135K / -130K. This is typical long deleveraging, stop-lossing, or position reduction—not new shorts rushing in to smash the market.
The closing price has broken below the lower edge of the recent 20 5m K-line range. The aggressive trade gap is -21.8%, the buy/sell ratio is 0.64, and selling pressure is clearly skewed. The OI abnormal percentile is 99.4%; the entire pool’s anomalies are ranked at #8, continuing across multiple consecutive periods. The confirmation level from depth isn’t low.
Over the past 24h, turnover is 13.95M, and liquidity isn’t particularly thick. At this level, price is approaching its own historical extreme zone. With price down + OI down, it could either be a sign that panic liquidation/clearing is nearing completion, or a continuation leg within the downtrend. We’ll see whether it can quickly reclaim—don’t rush in yet; wait for structural confirmation.
$HOME This drop is a bit brutal—on the 15m chart it’s directly -2.59%. The trading volume has hit 2.08x, with a Z value of 3.02, which indicates a volume-backed sell-off. The key point is that OI is falling along with it: 15m -0.44%, 1h -0.12%, nominal change -135K / -130K. This is typical long deleveraging, stop-lossing, or position reduction—not new shorts rushing in to smash the market.
The closing price has broken below the lower edge of the recent 20 5m K-line range. The aggressive trade gap is -21.8%, the buy/sell ratio is 0.64, and selling pressure is clearly skewed. The OI abnormal percentile is 99.4%; the entire pool’s anomalies are ranked at #8, continuing across multiple consecutive periods. The confirmation level from depth isn’t low.
Over the past 24h, turnover is 13.95M, and liquidity isn’t particularly thick. At this level, price is approaching its own historical extreme zone. With price down + OI down, it could either be a sign that panic liquidation/clearing is nearing completion, or a continuation leg within the downtrend. We’ll see whether it can quickly reclaim—don’t rush in yet; wait for structural confirmation.
The closing price has broken below the lower edge of the recent 20 5m K-line range. The aggressive trade gap is -21.8%, the buy/sell ratio is 0.64, and selling pressure is clearly skewed. The OI abnormal percentile is 99.4%; the entire pool’s anomalies are ranked at #8, continuing across multiple consecutive periods. The confirmation level from depth isn’t low.
Over the past 24h, turnover is 13.95M, and liquidity isn’t particularly thick. At this level, price is approaching its own historical extreme zone. With price down + OI down, it could either be a sign that panic liquidation/clearing is nearing completion, or a continuation leg within the downtrend. We’ll see whether it can quickly reclaim—don’t rush in yet; wait for structural confirmation.
6

·
--
$VVV This move is kind of interesting on the 15m. The price is above the upper edge of the near 20 5m-band, with the aggressive buy orders leaning toward the move; the buy-sell ratio is 1.42, and volume is 1.44x. It looks like a breakout, but OI actually falls instead of rising.
With price up and positions down, this structure is basically either short covering or old longs exiting—it's not fresh longs piling in from below. The abnormality across the whole pool ranks at #8, and the nominal change is also earlier on; the 85.7% percentile suggests something truly moved, but the chip foundation isn't solid.
This is pretty awkward. If you chase, you're afraid it's just short covering finishing its burst and then going soft. If you don't chase, it's also indeed stuck right at the boundary of the range. The 24h turnover of 55M is just so-so; while the depth provides confirmation, there's no sustained position support.
Personally, I lean toward letting it move first, and then see whether a pullback can hold this upper edge. If it can't hold, it's a fake breakout that snaps back like a needle. Don't rush to go long; this kind of setup easily triggers a double squeeze on both sides.
$VVV This move is kind of interesting on the 15m. The price is above the upper edge of the near 20 5m-band, with the aggressive buy orders leaning toward the move; the buy-sell ratio is 1.42, and volume is 1.44x. It looks like a breakout, but OI actually falls instead of rising.
With price up and positions down, this structure is basically either short covering or old longs exiting—it's not fresh longs piling in from below. The abnormality across the whole pool ranks at #8, and the nominal change is also earlier on; the 85.7% percentile suggests something truly moved, but the chip foundation isn't solid.
This is pretty awkward. If you chase, you're afraid it's just short covering finishing its burst and then going soft. If you don't chase, it's also indeed stuck right at the boundary of the range. The 24h turnover of 55M is just so-so; while the depth provides confirmation, there's no sustained position support.
Personally, I lean toward letting it move first, and then see whether a pullback can hold this upper edge. If it can't hold, it's a fake breakout that snaps back like a needle. Don't rush to go long; this kind of setup easily triggers a double squeeze on both sides.
With price up and positions down, this structure is basically either short covering or old longs exiting—it's not fresh longs piling in from below. The abnormality across the whole pool ranks at #8, and the nominal change is also earlier on; the 85.7% percentile suggests something truly moved, but the chip foundation isn't solid.
This is pretty awkward. If you chase, you're afraid it's just short covering finishing its burst and then going soft. If you don't chase, it's also indeed stuck right at the boundary of the range. The 24h turnover of 55M is just so-so; while the depth provides confirmation, there's no sustained position support.
Personally, I lean toward letting it move first, and then see whether a pullback can hold this upper edge. If it can't hold, it's a fake breakout that snaps back like a needle. Don't rush to go long; this kind of setup easily triggers a double squeeze on both sides.
·
--
$INJ That move is a bit brutal.
In 15m, it dropped directly by 2.62%; volume expanded to 1.78x; the Z value reached 3.00; and the close fell below the lower edge of the past ~20 5m-range candles. The aggressive trade imbalance was -47.4%, and the buy/sell ratio was 0.36—sell orders were hitting it down hard, not the kind of low-volume, slow bearish drift.
But interestingly, the OI: 15m -0.51%, 1h -0.55%, with notional down by 1.19M and 897K respectively. Price fell while OI also fell—this doesn’t look like brand-new shorts entering; it looks more like longs deleveraging, stop-losses being swept, or positions being actively reduced.
The OI abnormal percentile is 97.8%, overall pool abnormal #3, and notional change #8. Price is also close to historical extreme ranges again.
With this kind of structure, I usually don’t rush to bottom-fish. The volume-price alignment is bearish and short-dominated, but the drop in OI suggests leverage is being flushed. Whether the next move is more killing or smashing out a “pit” depends on whether there’s someone to step in after this wave of stop-loss orders gets consumed. I’ll just keep watching.
$INJ That move is a bit brutal.
In 15m, it dropped directly by 2.62%; volume expanded to 1.78x; the Z value reached 3.00; and the close fell below the lower edge of the past ~20 5m-range candles. The aggressive trade imbalance was -47.4%, and the buy/sell ratio was 0.36—sell orders were hitting it down hard, not the kind of low-volume, slow bearish drift.
But interestingly, the OI: 15m -0.51%, 1h -0.55%, with notional down by 1.19M and 897K respectively. Price fell while OI also fell—this doesn’t look like brand-new shorts entering; it looks more like longs deleveraging, stop-losses being swept, or positions being actively reduced.
The OI abnormal percentile is 97.8%, overall pool abnormal #3, and notional change #8. Price is also close to historical extreme ranges again.
With this kind of structure, I usually don’t rush to bottom-fish. The volume-price alignment is bearish and short-dominated, but the drop in OI suggests leverage is being flushed. Whether the next move is more killing or smashing out a “pit” depends on whether there’s someone to step in after this wave of stop-loss orders gets consumed. I’ll just keep watching.
In 15m, it dropped directly by 2.62%; volume expanded to 1.78x; the Z value reached 3.00; and the close fell below the lower edge of the past ~20 5m-range candles. The aggressive trade imbalance was -47.4%, and the buy/sell ratio was 0.36—sell orders were hitting it down hard, not the kind of low-volume, slow bearish drift.
But interestingly, the OI: 15m -0.51%, 1h -0.55%, with notional down by 1.19M and 897K respectively. Price fell while OI also fell—this doesn’t look like brand-new shorts entering; it looks more like longs deleveraging, stop-losses being swept, or positions being actively reduced.
The OI abnormal percentile is 97.8%, overall pool abnormal #3, and notional change #8. Price is also close to historical extreme ranges again.
With this kind of structure, I usually don’t rush to bottom-fish. The volume-price alignment is bearish and short-dominated, but the drop in OI suggests leverage is being flushed. Whether the next move is more killing or smashing out a “pit” depends on whether there’s someone to step in after this wave of stop-loss orders gets consumed. I’ll just keep watching.
1

·
--
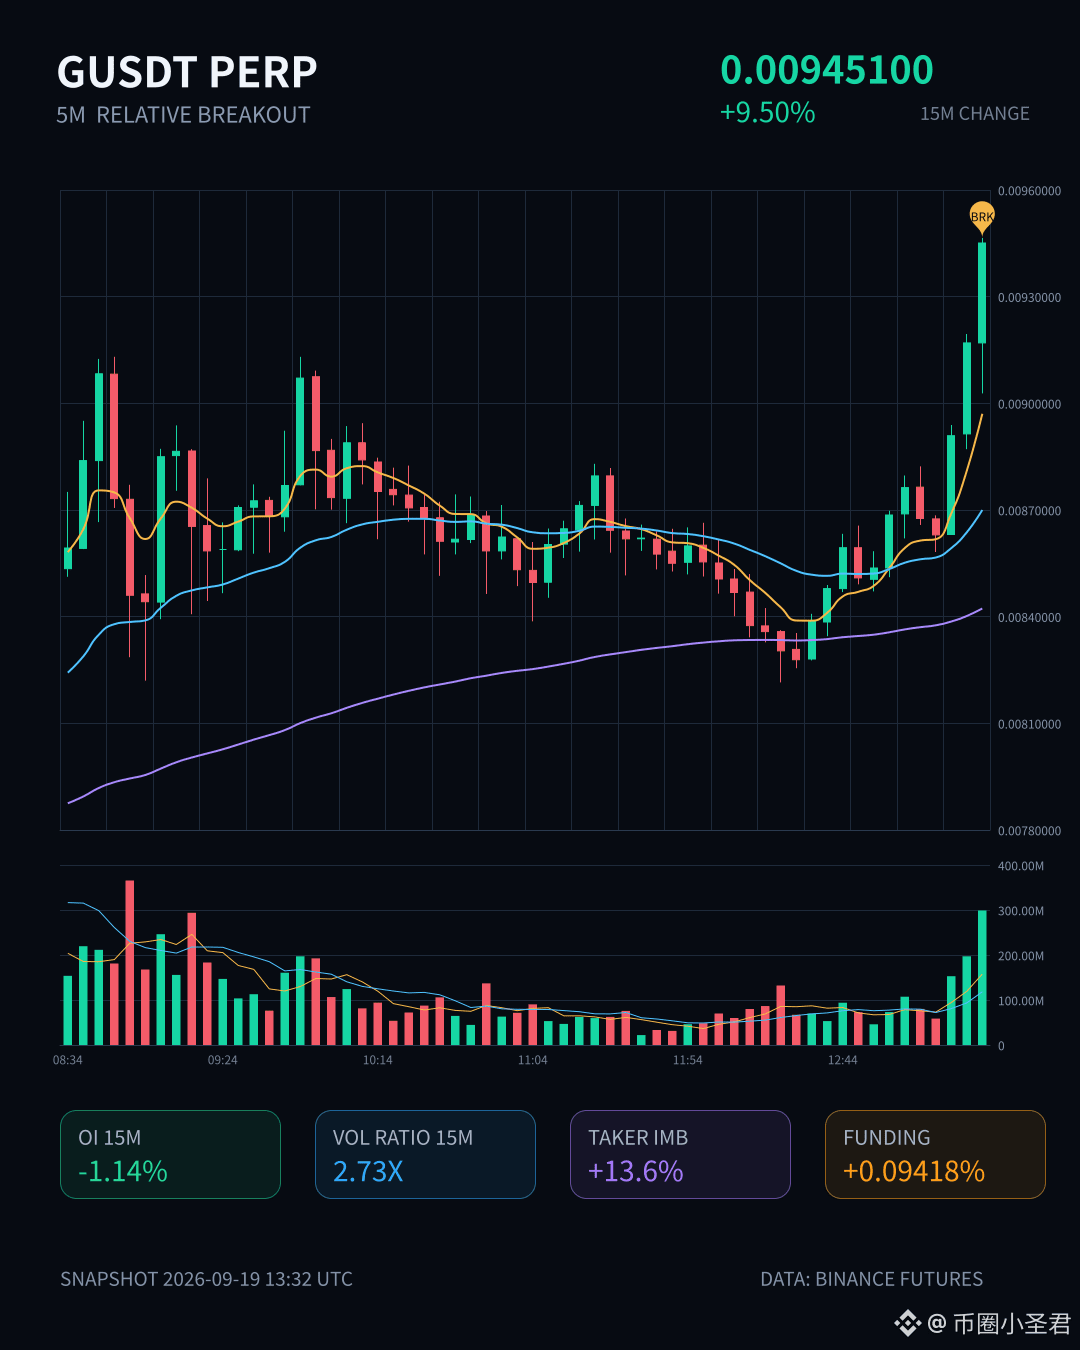
$G In this 15m, it directly pulled up 9.5%, with volume at 2.73x, and the volatility Z reached 4.58.
But there’s a detail that’s actually pretty interesting: OI on the 15m is -1.14%, and on the 1h it’s -1.79%. Price is pushing upward while open interest is dropping. Yet the OI anomaly percentile is still at 95.6%—this doesn’t look like brand-new long positions are being aggressively opened. It looks more like shorts are being forced to cover, and they’re being squeezed upward along with existing positions.
The aggressive trades are down 13.6%, the buy/sell ratio is 1.32, and the close even broke above the top edge of the recent 20 five-minute candles. The funding rate is also in a high percentile recently. After grinding for several consecutive cycles in this extreme range, today it basically pierced through the boundary.
Over the last 24h, turnover is 630 million yuan. Across the whole pool, abnormal #5 and nominal change #8—the heat and money are both flowing in. With this kind of structure, I generally don’t chase the first leg. You want to see whether, after the short covering is done, there’s still someone willing to take the baton. $G
$G In this 15m, it directly pulled up 9.5%, with volume at 2.73x, and the volatility Z reached 4.58.
But there’s a detail that’s actually pretty interesting: OI on the 15m is -1.14%, and on the 1h it’s -1.79%. Price is pushing upward while open interest is dropping. Yet the OI anomaly percentile is still at 95.6%—this doesn’t look like brand-new long positions are being aggressively opened. It looks more like shorts are being forced to cover, and they’re being squeezed upward along with existing positions.
The aggressive trades are down 13.6%, the buy/sell ratio is 1.32, and the close even broke above the top edge of the recent 20 five-minute candles. The funding rate is also in a high percentile recently. After grinding for several consecutive cycles in this extreme range, today it basically pierced through the boundary.
Over the last 24h, turnover is 630 million yuan. Across the whole pool, abnormal #5 and nominal change #8—the heat and money are both flowing in. With this kind of structure, I generally don’t chase the first leg. You want to see whether, after the short covering is done, there’s still someone willing to take the baton. $G
But there’s a detail that’s actually pretty interesting: OI on the 15m is -1.14%, and on the 1h it’s -1.79%. Price is pushing upward while open interest is dropping. Yet the OI anomaly percentile is still at 95.6%—this doesn’t look like brand-new long positions are being aggressively opened. It looks more like shorts are being forced to cover, and they’re being squeezed upward along with existing positions.
The aggressive trades are down 13.6%, the buy/sell ratio is 1.32, and the close even broke above the top edge of the recent 20 five-minute candles. The funding rate is also in a high percentile recently. After grinding for several consecutive cycles in this extreme range, today it basically pierced through the boundary.
Over the last 24h, turnover is 630 million yuan. Across the whole pool, abnormal #5 and nominal change #8—the heat and money are both flowing in. With this kind of structure, I generally don’t chase the first leg. You want to see whether, after the short covering is done, there’s still someone willing to take the baton. $G
14
·
--
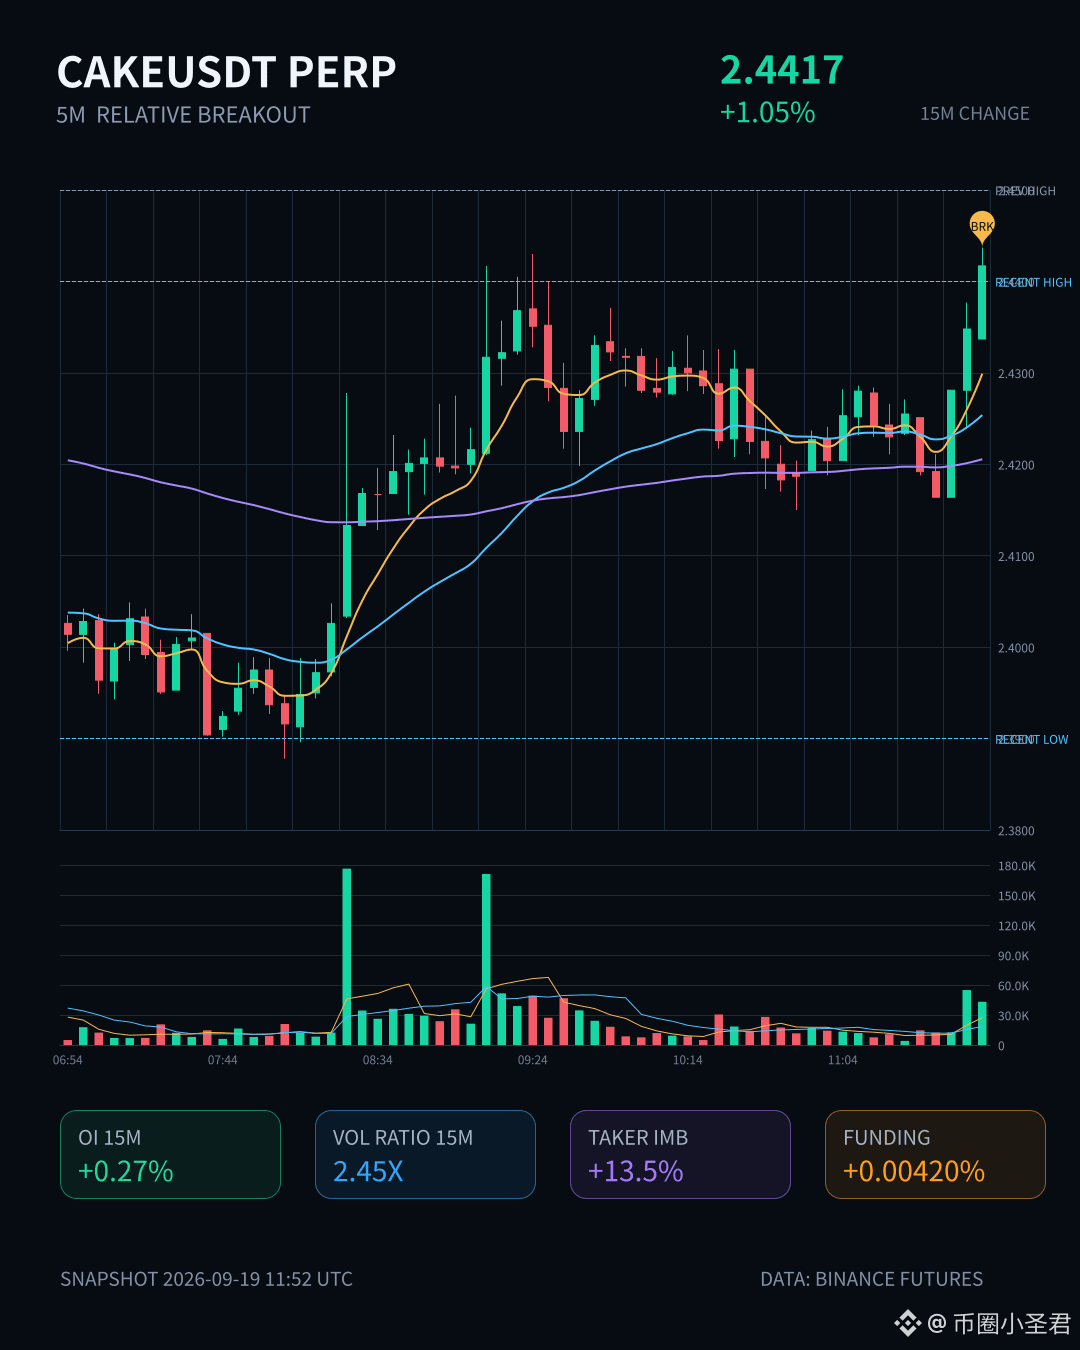
CAKE This wave is a bit interesting.
In the 15m timeframe it directly surged 1.05%; volume hit 2.45x, with a Z value of 2.99—this isn’t just a random shake. The closing price broke above the upper edge of the last ~20 consecutive 5m intervals, with aggressive trades showing a +13.5% differential, buy/sell ratio of 1.31, and the bias is toward buyers.
More importantly, look at OI: 15m +0.27%, 1h +0.29%. The notional change is a little over $200k, with an abnormal percentile of 96.2%, ranking #8 across the whole pool. Price is rising and OI is rising along with it—structurally it looks more like new leveraged long positions entering, not short covering driven by shorts getting squeezed.
It’s been continuing across multiple consecutive cycles, and volume is also above normal, nearing the extreme end of its own historical range. I wouldn’t chase the top from this spot, but I’ll keep an eye on it—if OI keeps stacking and the price doesn’t pull back, then it won’t just be a one-off spike.
CAKE This wave is a bit interesting.
In the 15m timeframe it directly surged 1.05%; volume hit 2.45x, with a Z value of 2.99—this isn’t just a random shake. The closing price broke above the upper edge of the last ~20 consecutive 5m intervals, with aggressive trades showing a +13.5% differential, buy/sell ratio of 1.31, and the bias is toward buyers.
More importantly, look at OI: 15m +0.27%, 1h +0.29%. The notional change is a little over $200k, with an abnormal percentile of 96.2%, ranking #8 across the whole pool. Price is rising and OI is rising along with it—structurally it looks more like new leveraged long positions entering, not short covering driven by shorts getting squeezed.
It’s been continuing across multiple consecutive cycles, and volume is also above normal, nearing the extreme end of its own historical range. I wouldn’t chase the top from this spot, but I’ll keep an eye on it—if OI keeps stacking and the price doesn’t pull back, then it won’t just be a one-off spike.
In the 15m timeframe it directly surged 1.05%; volume hit 2.45x, with a Z value of 2.99—this isn’t just a random shake. The closing price broke above the upper edge of the last ~20 consecutive 5m intervals, with aggressive trades showing a +13.5% differential, buy/sell ratio of 1.31, and the bias is toward buyers.
More importantly, look at OI: 15m +0.27%, 1h +0.29%. The notional change is a little over $200k, with an abnormal percentile of 96.2%, ranking #8 across the whole pool. Price is rising and OI is rising along with it—structurally it looks more like new leveraged long positions entering, not short covering driven by shorts getting squeezed.
It’s been continuing across multiple consecutive cycles, and volume is also above normal, nearing the extreme end of its own historical range. I wouldn’t chase the top from this spot, but I’ll keep an eye on it—if OI keeps stacking and the price doesn’t pull back, then it won’t just be a one-off spike.
22

·
--
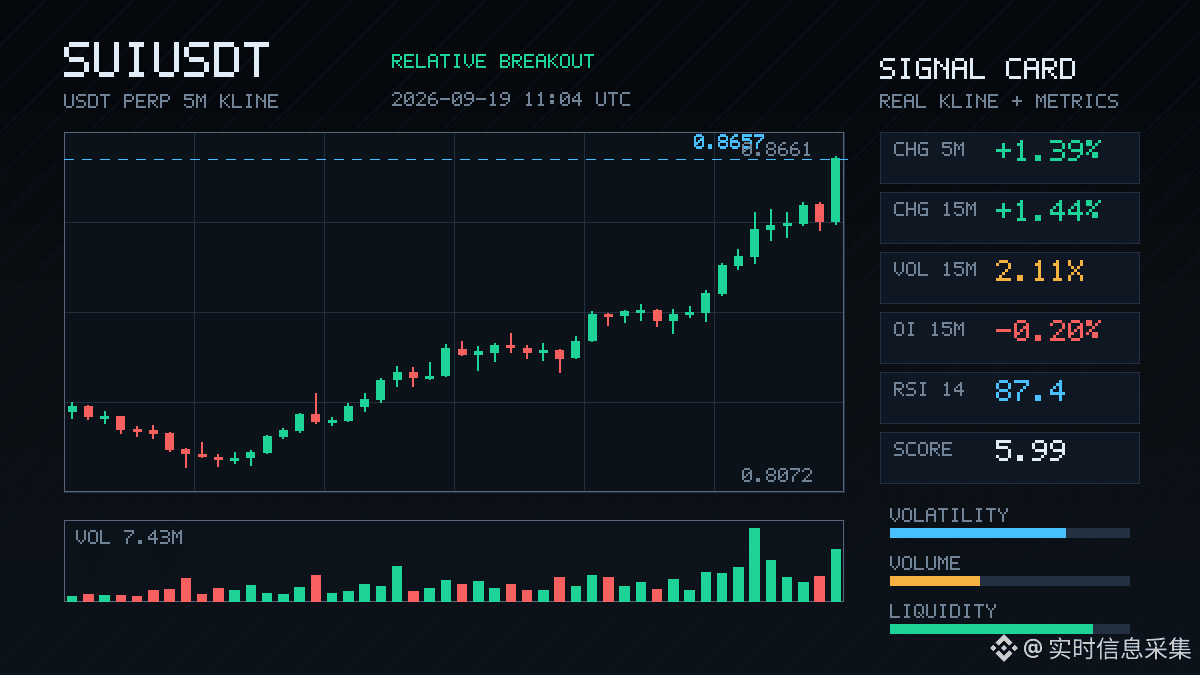
$SUI This move is a bit interesting.
In the 15m timeframe, it straight up surged 1.44% with volume hitting 2.11x, and the closing price broke above the upper edge of the past ~20 5m candles. The aggressive buy/sell ratio is 1.39, with a spread of 16.3%—the bids are genuinely being stacked.
But take a quick look at OI: the 15m contract is -0.20%, while the 1h is +1.06%. Price is rising, yet short-term OI is actually falling—that’s the classic short-covering playbook, not something new longs are pushing in. Over on the 1h side, though, there is position being added.
The funding rate is already in the top percentile recently; the anomaly percentile is 96.4%, with the whole-pool anomaly ranked #8. At this kind of level, either it’s setting up for a squeeze continuation, or it’s increasing the leverage/pressure for the people chasing longs.
24h turnover is 338M, and the order book depth is sufficient. The breakout is real, but the driving force is short covering rather than incremental demand—those who get it, get it.
$SUI This move is a bit interesting.
In the 15m timeframe, it straight up surged 1.44% with volume hitting 2.11x, and the closing price broke above the upper edge of the past ~20 5m candles. The aggressive buy/sell ratio is 1.39, with a spread of 16.3%—the bids are genuinely being stacked.
But take a quick look at OI: the 15m contract is -0.20%, while the 1h is +1.06%. Price is rising, yet short-term OI is actually falling—that’s the classic short-covering playbook, not something new longs are pushing in. Over on the 1h side, though, there is position being added.
The funding rate is already in the top percentile recently; the anomaly percentile is 96.4%, with the whole-pool anomaly ranked #8. At this kind of level, either it’s setting up for a squeeze continuation, or it’s increasing the leverage/pressure for the people chasing longs.
24h turnover is 338M, and the order book depth is sufficient. The breakout is real, but the driving force is short covering rather than incremental demand—those who get it, get it.
In the 15m timeframe, it straight up surged 1.44% with volume hitting 2.11x, and the closing price broke above the upper edge of the past ~20 5m candles. The aggressive buy/sell ratio is 1.39, with a spread of 16.3%—the bids are genuinely being stacked.
But take a quick look at OI: the 15m contract is -0.20%, while the 1h is +1.06%. Price is rising, yet short-term OI is actually falling—that’s the classic short-covering playbook, not something new longs are pushing in. Over on the 1h side, though, there is position being added.
The funding rate is already in the top percentile recently; the anomaly percentile is 96.4%, with the whole-pool anomaly ranked #8. At this kind of level, either it’s setting up for a squeeze continuation, or it’s increasing the leverage/pressure for the people chasing longs.
24h turnover is 338M, and the order book depth is sufficient. The breakout is real, but the driving force is short covering rather than incremental demand—those who get it, get it.
3
·
--
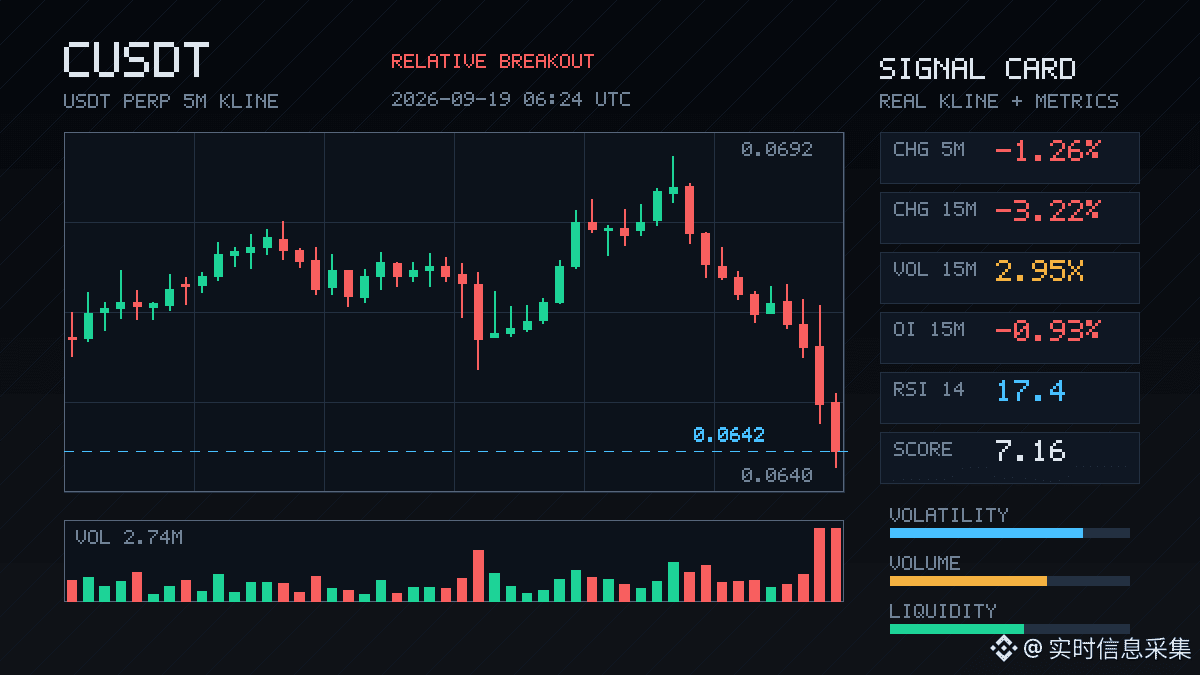
$C This drop is pretty decisive. On the 15m timeframe, it directly dumped 3.22%, volume surged to nearly 3x, and the Z value is 3.21—this isn’t just random jostling; someone is genuinely bailing.
What’s interesting is that OI is falling at the same time: 15m -0.93%, 1h -0.48%, with notional down by roughly 280k U. Price is down while open interest is shrinking—this is a textbook deleveraging script. It’s not new shorts rushing in to smash it; it’s longs getting unable to hold and reducing positions, or being swept out by stop-losses.
The aggressive trade gap is -37%, buy/sell ratio is 0.46, and sell pressure is one-sided. Even the lower edge of the range on the 20 K candles on the 5m timeframe got broken through. So the technical board should have flushed a batch too.
OI abnormal percentile is 95.8%, in the whole pool #8. It’s been extending across several consecutive cycles—this kind of depth confirmation isn’t that common. Price is currently hugging the historical extreme zone, 24h turnover is 46M, so liquidity can’t be called thick.
With this kind of structure, after a sharp selloff you often get a dead-cat bounce, but while positions are still bleeding out, buying into it typically isn’t great value. I’d rather first see whether OI can hold steady before talking about anything else.
$C This drop is pretty decisive. On the 15m timeframe, it directly dumped 3.22%, volume surged to nearly 3x, and the Z value is 3.21—this isn’t just random jostling; someone is genuinely bailing.
What’s interesting is that OI is falling at the same time: 15m -0.93%, 1h -0.48%, with notional down by roughly 280k U. Price is down while open interest is shrinking—this is a textbook deleveraging script. It’s not new shorts rushing in to smash it; it’s longs getting unable to hold and reducing positions, or being swept out by stop-losses.
The aggressive trade gap is -37%, buy/sell ratio is 0.46, and sell pressure is one-sided. Even the lower edge of the range on the 20 K candles on the 5m timeframe got broken through. So the technical board should have flushed a batch too.
OI abnormal percentile is 95.8%, in the whole pool #8. It’s been extending across several consecutive cycles—this kind of depth confirmation isn’t that common. Price is currently hugging the historical extreme zone, 24h turnover is 46M, so liquidity can’t be called thick.
With this kind of structure, after a sharp selloff you often get a dead-cat bounce, but while positions are still bleeding out, buying into it typically isn’t great value. I’d rather first see whether OI can hold steady before talking about anything else.
What’s interesting is that OI is falling at the same time: 15m -0.93%, 1h -0.48%, with notional down by roughly 280k U. Price is down while open interest is shrinking—this is a textbook deleveraging script. It’s not new shorts rushing in to smash it; it’s longs getting unable to hold and reducing positions, or being swept out by stop-losses.
The aggressive trade gap is -37%, buy/sell ratio is 0.46, and sell pressure is one-sided. Even the lower edge of the range on the 20 K candles on the 5m timeframe got broken through. So the technical board should have flushed a batch too.
OI abnormal percentile is 95.8%, in the whole pool #8. It’s been extending across several consecutive cycles—this kind of depth confirmation isn’t that common. Price is currently hugging the historical extreme zone, 24h turnover is 46M, so liquidity can’t be called thick.
With this kind of structure, after a sharp selloff you often get a dead-cat bounce, but while positions are still bleeding out, buying into it typically isn’t great value. I’d rather first see whether OI can hold steady before talking about anything else.
16
·
--
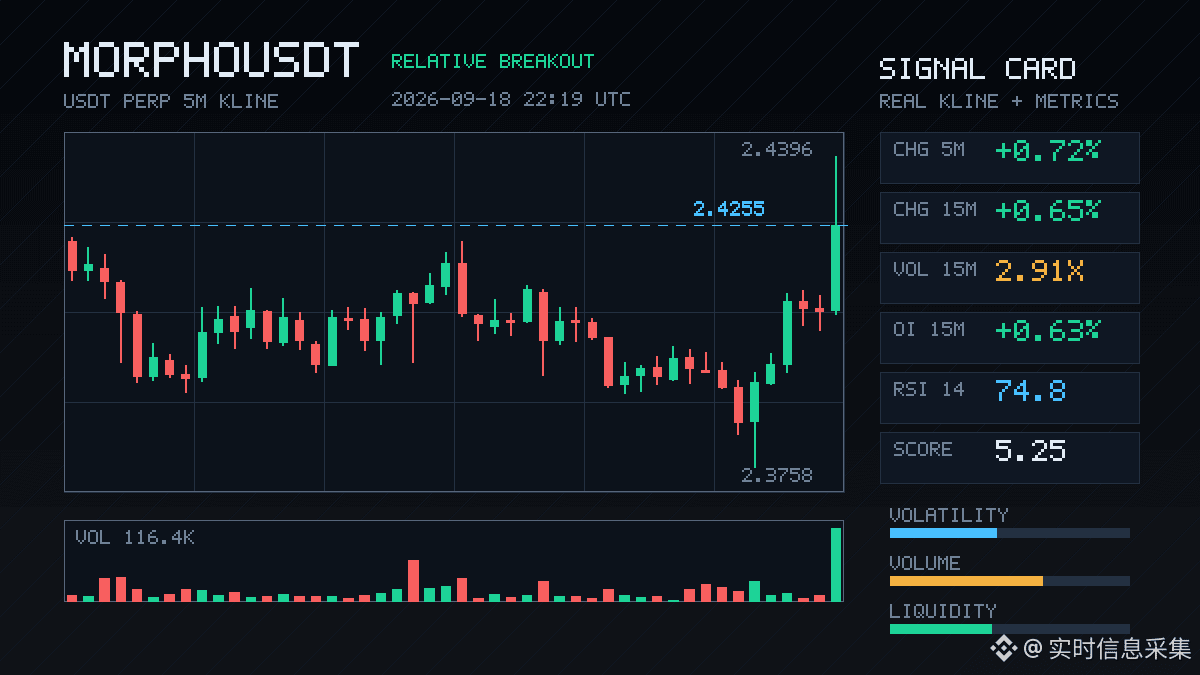
$MORPHO This 15m has a bit of something.
The price popped by 0.65%—not much at first glance—but the trading volume surged straight to 2.91x. The buy/sell ratio is 1.83, and active trading is down 29.4%. This isn’t just a random poke; someone is actually spending real money to push it up. It also broke through the upper band of the past ~20 5m candles.
The key is that OI moved in sync: the 15m contract is up +0.63%, with an abnormal percentile at 93.8%, and the entire pool ranks all the way up to #8. Price is rising and OI is rising—this is a classic case of fresh leveraged longs entering, not that kind of short-covering fueled by empty heat.
Funding rate has also reached a high percentile recently, suggesting long sentiment is already getting crowded. Structurally, if things go well it’s a trend start; if things go badly—since the funding is this high—if the move can’t keep going, it can turn into a massacre among longs.
In the past 24h, turnover is only 18M, the pool isn’t deep, so big orders can push it up easily—and sell-offs can hit fast too.
After the breakout, watch whether it can hold. If OI keeps following through, that’s a real breakout; if OI turns around, be careful—could be a fake move.
$MORPHO This 15m has a bit of something.
The price popped by 0.65%—not much at first glance—but the trading volume surged straight to 2.91x. The buy/sell ratio is 1.83, and active trading is down 29.4%. This isn’t just a random poke; someone is actually spending real money to push it up. It also broke through the upper band of the past ~20 5m candles.
The key is that OI moved in sync: the 15m contract is up +0.63%, with an abnormal percentile at 93.8%, and the entire pool ranks all the way up to #8. Price is rising and OI is rising—this is a classic case of fresh leveraged longs entering, not that kind of short-covering fueled by empty heat.
Funding rate has also reached a high percentile recently, suggesting long sentiment is already getting crowded. Structurally, if things go well it’s a trend start; if things go badly—since the funding is this high—if the move can’t keep going, it can turn into a massacre among longs.
In the past 24h, turnover is only 18M, the pool isn’t deep, so big orders can push it up easily—and sell-offs can hit fast too.
After the breakout, watch whether it can hold. If OI keeps following through, that’s a real breakout; if OI turns around, be careful—could be a fake move.
The price popped by 0.65%—not much at first glance—but the trading volume surged straight to 2.91x. The buy/sell ratio is 1.83, and active trading is down 29.4%. This isn’t just a random poke; someone is actually spending real money to push it up. It also broke through the upper band of the past ~20 5m candles.
The key is that OI moved in sync: the 15m contract is up +0.63%, with an abnormal percentile at 93.8%, and the entire pool ranks all the way up to #8. Price is rising and OI is rising—this is a classic case of fresh leveraged longs entering, not that kind of short-covering fueled by empty heat.
Funding rate has also reached a high percentile recently, suggesting long sentiment is already getting crowded. Structurally, if things go well it’s a trend start; if things go badly—since the funding is this high—if the move can’t keep going, it can turn into a massacre among longs.
In the past 24h, turnover is only 18M, the pool isn’t deep, so big orders can push it up easily—and sell-offs can hit fast too.
After the breakout, watch whether it can hold. If OI keeps following through, that’s a real breakout; if OI turns around, be careful—could be a fake move.
8

·
--
$PONS 15m down 1.88%, it doesn’t look like much, but when combined with the abnormal percentile of 88.3% OI, it tastes different.
Price down + OI down isn’t new short entries—it’s longs getting forced out: stop-losses, position reductions, and deleveraging. The closing price directly broke below the lower line of the past ~20 5m candles. Active trades are down -26.7%, buy/sell ratio is 0.58, and sell-side pressure is absorbing orders.
Whole-pool abnormal #8, nominal change #6. Over the last 24h there’s also 164M in trading volume—liquidity is there, so this move looks more like someone is seriously reducing positions, not a few scattered hit orders. Keep watching OI: if during the drop the OI is still falling, then it’s washing positions—not the start of a trend.
$PONS 15m down 1.88%, it doesn’t look like much, but when combined with the abnormal percentile of 88.3% OI, it tastes different.
Price down + OI down isn’t new short entries—it’s longs getting forced out: stop-losses, position reductions, and deleveraging. The closing price directly broke below the lower line of the past ~20 5m candles. Active trades are down -26.7%, buy/sell ratio is 0.58, and sell-side pressure is absorbing orders.
Whole-pool abnormal #8, nominal change #6. Over the last 24h there’s also 164M in trading volume—liquidity is there, so this move looks more like someone is seriously reducing positions, not a few scattered hit orders. Keep watching OI: if during the drop the OI is still falling, then it’s washing positions—not the start of a trend.
Price down + OI down isn’t new short entries—it’s longs getting forced out: stop-losses, position reductions, and deleveraging. The closing price directly broke below the lower line of the past ~20 5m candles. Active trades are down -26.7%, buy/sell ratio is 0.58, and sell-side pressure is absorbing orders.
Whole-pool abnormal #8, nominal change #6. Over the last 24h there’s also 164M in trading volume—liquidity is there, so this move looks more like someone is seriously reducing positions, not a few scattered hit orders. Keep watching OI: if during the drop the OI is still falling, then it’s washing positions—not the start of a trend.
6
·
--
$UAI In these 15 minutes, it got a bit ruthless—straight down 3.62%. The volume surged to 5.31x, Z-score 4.62, clearly not normal turnover.
Price just broke below the lower band of the recent 20 5m candles. Active trades are down -35.6%, buy/sell ratio is 0.48, and the sell pressure is genuinely pushing downward. What’s interesting is this: OI nominal over 1h is still less by -712K, but in 15m it barely increased by +0.26%. Meanwhile the nominal change is -517K (-3.37%)—with price falling and OI not collapsing alongside it. This looks more like fresh shorts adding in to press down, not longs simply cutting losses.
The OI abnormal percentile has already spiked to 97%. In the whole pool, it’s abnormal #8; nominal change is #22. The total 24h trading value is only 20.99M. This pool isn’t very deep. With this kind of volume, slippage and wick-spikes (price pokes) can easily be amplified.
I won’t chase the short, and I won’t catch a falling knife. I’ll wait for this 15m candle to finish and see whether it can reclaim the lower boundary of the range. If it can’t, chances are there’s another leg down. If it instead quickly snaps back after a near-fake drop, then today’s 97th-percentile anomaly is likely an induced-short or bear-trap storyline. $UAI
$UAI In these 15 minutes, it got a bit ruthless—straight down 3.62%. The volume surged to 5.31x, Z-score 4.62, clearly not normal turnover.
Price just broke below the lower band of the recent 20 5m candles. Active trades are down -35.6%, buy/sell ratio is 0.48, and the sell pressure is genuinely pushing downward. What’s interesting is this: OI nominal over 1h is still less by -712K, but in 15m it barely increased by +0.26%. Meanwhile the nominal change is -517K (-3.37%)—with price falling and OI not collapsing alongside it. This looks more like fresh shorts adding in to press down, not longs simply cutting losses.
The OI abnormal percentile has already spiked to 97%. In the whole pool, it’s abnormal #8; nominal change is #22. The total 24h trading value is only 20.99M. This pool isn’t very deep. With this kind of volume, slippage and wick-spikes (price pokes) can easily be amplified.
I won’t chase the short, and I won’t catch a falling knife. I’ll wait for this 15m candle to finish and see whether it can reclaim the lower boundary of the range. If it can’t, chances are there’s another leg down. If it instead quickly snaps back after a near-fake drop, then today’s 97th-percentile anomaly is likely an induced-short or bear-trap storyline. $UAI
Price just broke below the lower band of the recent 20 5m candles. Active trades are down -35.6%, buy/sell ratio is 0.48, and the sell pressure is genuinely pushing downward. What’s interesting is this: OI nominal over 1h is still less by -712K, but in 15m it barely increased by +0.26%. Meanwhile the nominal change is -517K (-3.37%)—with price falling and OI not collapsing alongside it. This looks more like fresh shorts adding in to press down, not longs simply cutting losses.
The OI abnormal percentile has already spiked to 97%. In the whole pool, it’s abnormal #8; nominal change is #22. The total 24h trading value is only 20.99M. This pool isn’t very deep. With this kind of volume, slippage and wick-spikes (price pokes) can easily be amplified.
I won’t chase the short, and I won’t catch a falling knife. I’ll wait for this 15m candle to finish and see whether it can reclaim the lower boundary of the range. If it can’t, chances are there’s another leg down. If it instead quickly snaps back after a near-fake drop, then today’s 97th-percentile anomaly is likely an induced-short or bear-trap storyline. $UAI
17
·
--
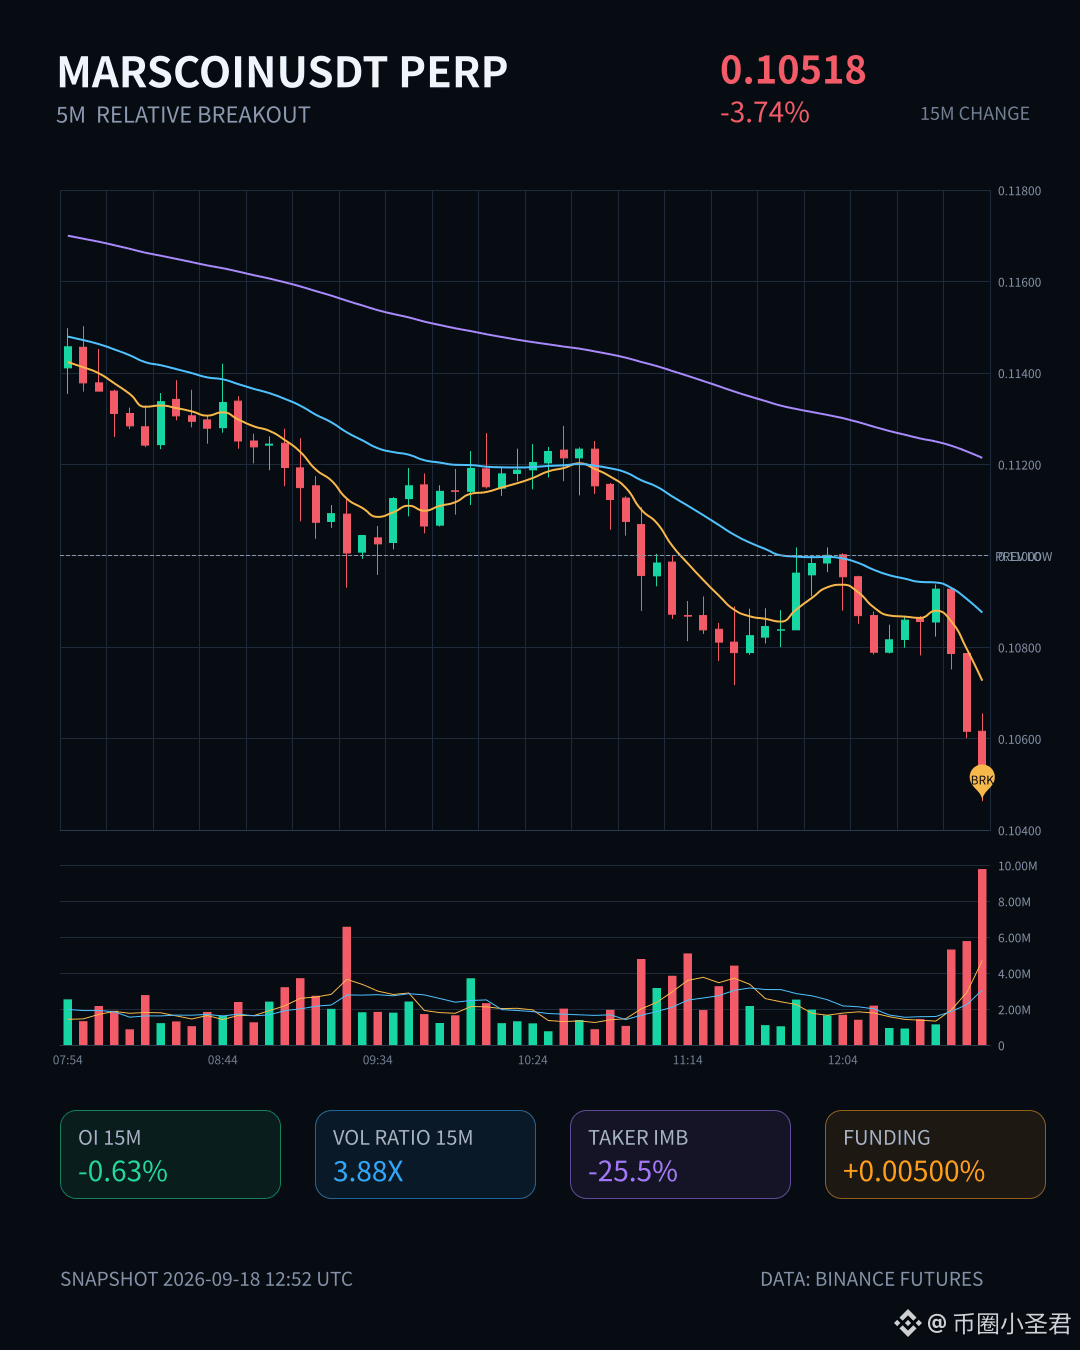
$MARSCOIN This one hits pretty hard.
At 15m, it directly crashed 3.74%, with volume jumping to 3.88x the norm. The Z value is 4.33, and the close also fell below the lower bound of the last 20 5m candles. The aggressive trade delta is -25.5%, the buy/sell ratio is 0.59, and the selling pressure was truly smashed out—not just orders placed to scare people.
But what’s interesting is that OI is declining. 15m -0.63%, 1h -0.74%, with a nominal decrease of more than 1M contracts. Price is down while open interest is down—this looks more like longs deleveraging and getting swept for stop-losses, rather than new shorts piling in aggressively. In other words, this move is about position reduction, not shorts building a new position.
OI’s abnormal percentile is 93.8%, ranking #8 across the whole pool; nominal change is #10. 24h turnover is 116M. It’s approaching historical extreme territory, and this kind of spot usually won’t stay quiet for long.
Either leverage gets washed out and then it finds a direction again, or there’s still another leg coming. I tend to first see whether it can reclaim that 5m lower-bound area—if it can’t, don’t rush to catch it.
$MARSCOIN This one hits pretty hard.
At 15m, it directly crashed 3.74%, with volume jumping to 3.88x the norm. The Z value is 4.33, and the close also fell below the lower bound of the last 20 5m candles. The aggressive trade delta is -25.5%, the buy/sell ratio is 0.59, and the selling pressure was truly smashed out—not just orders placed to scare people.
But what’s interesting is that OI is declining. 15m -0.63%, 1h -0.74%, with a nominal decrease of more than 1M contracts. Price is down while open interest is down—this looks more like longs deleveraging and getting swept for stop-losses, rather than new shorts piling in aggressively. In other words, this move is about position reduction, not shorts building a new position.
OI’s abnormal percentile is 93.8%, ranking #8 across the whole pool; nominal change is #10. 24h turnover is 116M. It’s approaching historical extreme territory, and this kind of spot usually won’t stay quiet for long.
Either leverage gets washed out and then it finds a direction again, or there’s still another leg coming. I tend to first see whether it can reclaim that 5m lower-bound area—if it can’t, don’t rush to catch it.
At 15m, it directly crashed 3.74%, with volume jumping to 3.88x the norm. The Z value is 4.33, and the close also fell below the lower bound of the last 20 5m candles. The aggressive trade delta is -25.5%, the buy/sell ratio is 0.59, and the selling pressure was truly smashed out—not just orders placed to scare people.
But what’s interesting is that OI is declining. 15m -0.63%, 1h -0.74%, with a nominal decrease of more than 1M contracts. Price is down while open interest is down—this looks more like longs deleveraging and getting swept for stop-losses, rather than new shorts piling in aggressively. In other words, this move is about position reduction, not shorts building a new position.
OI’s abnormal percentile is 93.8%, ranking #8 across the whole pool; nominal change is #10. 24h turnover is 116M. It’s approaching historical extreme territory, and this kind of spot usually won’t stay quiet for long.
Either leverage gets washed out and then it finds a direction again, or there’s still another leg coming. I tend to first see whether it can reclaim that 5m lower-bound area—if it can’t, don’t rush to catch it.
13
·
--
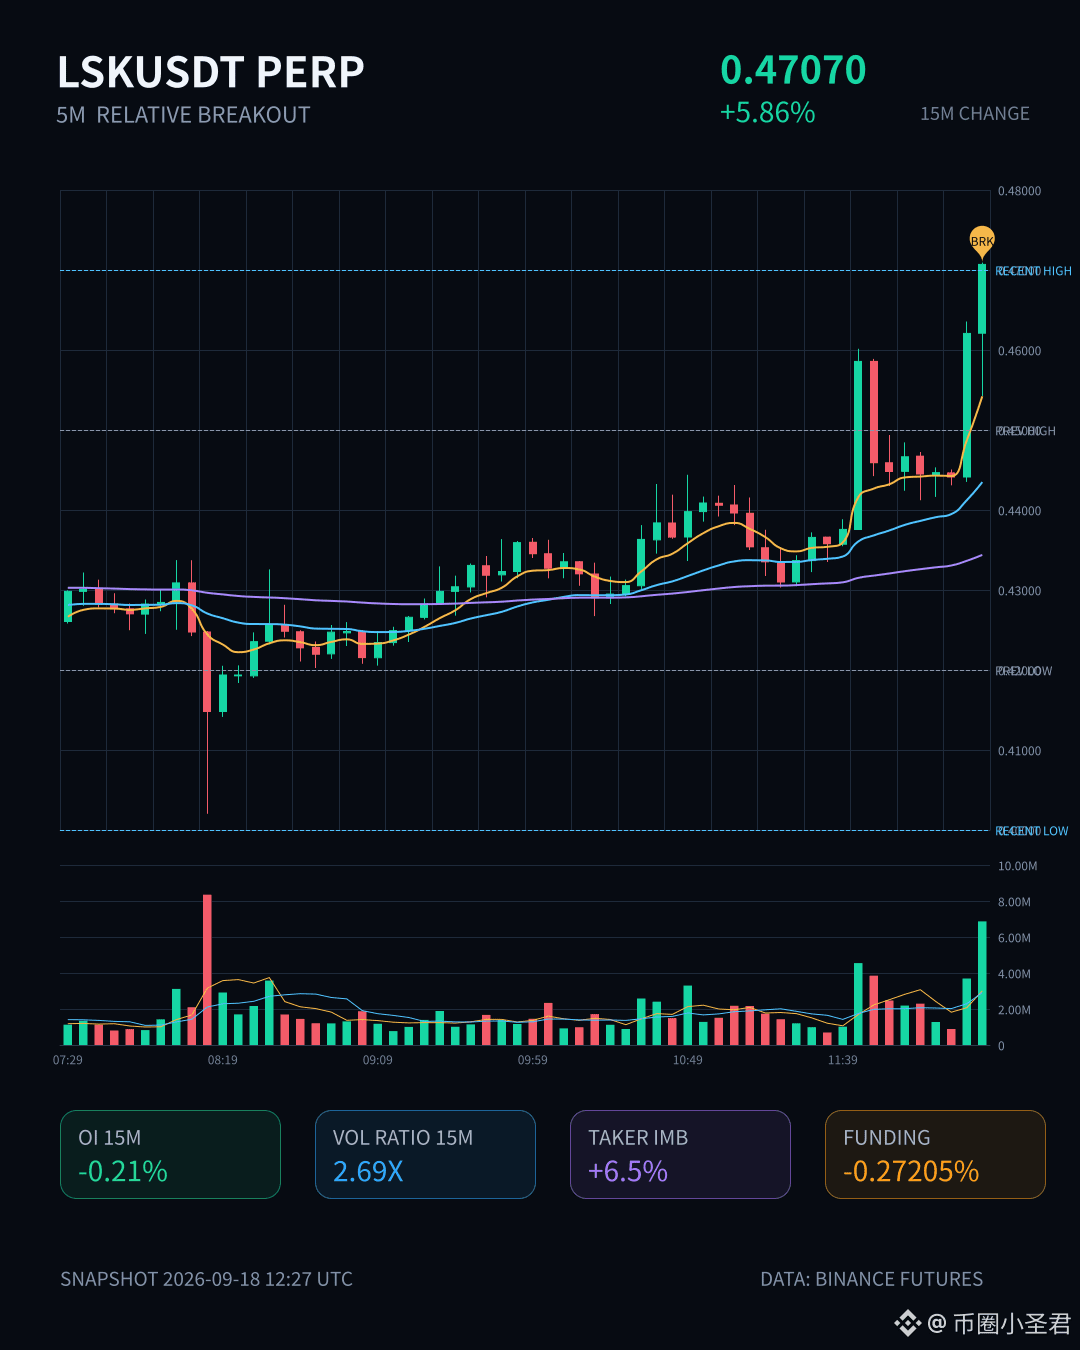
$LSK This move has some substance. In 15m it surged 5.86% directly, with volume reaching 2.69x the normal level, Z-score 4.31, and the closing price breaking above the upper band of the most recent 20 5m candles.
But interestingly, it’s the OI that matters—on the 15m contract, OI is still -0.21%, while only 1h is +0.18%. Price is up, but positions aren’t following: a typical short covering, not fresh long entry. The pool’s abnormal percentile is 93.8%, abnormal rank #10, nominal change #8. It has continued across multiple consecutive cycles, and the depth confirmation checks out.
This kind of structure is either shorts getting forced into a corner and starting to stampede, or someone pushing it upward using thin liquidity—then running after the push. Active traded amount is down 6.5%, buy/sell ratio 1.14; the buy side is indeed dominant, but not extremely so.
Over 24h, turnover is 311M—this isn’t small in the pool. At this level it’s close to the historical extreme range; don’t chase without weighing it yourself.
$LSK This move has some substance. In 15m it surged 5.86% directly, with volume reaching 2.69x the normal level, Z-score 4.31, and the closing price breaking above the upper band of the most recent 20 5m candles.
But interestingly, it’s the OI that matters—on the 15m contract, OI is still -0.21%, while only 1h is +0.18%. Price is up, but positions aren’t following: a typical short covering, not fresh long entry. The pool’s abnormal percentile is 93.8%, abnormal rank #10, nominal change #8. It has continued across multiple consecutive cycles, and the depth confirmation checks out.
This kind of structure is either shorts getting forced into a corner and starting to stampede, or someone pushing it upward using thin liquidity—then running after the push. Active traded amount is down 6.5%, buy/sell ratio 1.14; the buy side is indeed dominant, but not extremely so.
Over 24h, turnover is 311M—this isn’t small in the pool. At this level it’s close to the historical extreme range; don’t chase without weighing it yourself.
But interestingly, it’s the OI that matters—on the 15m contract, OI is still -0.21%, while only 1h is +0.18%. Price is up, but positions aren’t following: a typical short covering, not fresh long entry. The pool’s abnormal percentile is 93.8%, abnormal rank #10, nominal change #8. It has continued across multiple consecutive cycles, and the depth confirmation checks out.
This kind of structure is either shorts getting forced into a corner and starting to stampede, or someone pushing it upward using thin liquidity—then running after the push. Active traded amount is down 6.5%, buy/sell ratio 1.14; the buy side is indeed dominant, but not extremely so.
Over 24h, turnover is 311M—this isn’t small in the pool. At this level it’s close to the historical extreme range; don’t chase without weighing it yourself.
19
·
--
$USELESS This drop is a bit sudden.
On the 15m chart, it’s down 2.77% directly, with volume hitting 3.53x the normal level and a Z value of 2.61—this isn’t a typical pullback. The key point is that OI fell along with it: on 15m it’s -1.79%, on 1h it’s -1.32%, and nominal value shrank by almost 1.7 million U. Price is down and positions are reduced—this is classic long de-leveraging, with stop-loss orders exiting rather than new shorts piling in to slam the market.
Active trade underperformance is -14.2%, the buy/sell ratio is 0.75, and sell pressure is in control. The close has already broken below the lower bound of the most recent 5m range for about 20 bars. At this level, there wasn’t much defense to begin with.
OI abnormal percentile is 97%—it ranks #6 across the whole pool, and nominal change ranks #8. Usually this coin’s OI doesn’t swing this extremely; today it’s one of the most eye-catching in the pool.
24h turnover is 98.59M. Liquidity is still there, but the direction is quite clear. Next, we need to see whether this lower bound can be reclaimed; if it can’t, the de-leveraging may not be over yet.
$USELESS This drop is a bit sudden.
On the 15m chart, it’s down 2.77% directly, with volume hitting 3.53x the normal level and a Z value of 2.61—this isn’t a typical pullback. The key point is that OI fell along with it: on 15m it’s -1.79%, on 1h it’s -1.32%, and nominal value shrank by almost 1.7 million U. Price is down and positions are reduced—this is classic long de-leveraging, with stop-loss orders exiting rather than new shorts piling in to slam the market.
Active trade underperformance is -14.2%, the buy/sell ratio is 0.75, and sell pressure is in control. The close has already broken below the lower bound of the most recent 5m range for about 20 bars. At this level, there wasn’t much defense to begin with.
OI abnormal percentile is 97%—it ranks #6 across the whole pool, and nominal change ranks #8. Usually this coin’s OI doesn’t swing this extremely; today it’s one of the most eye-catching in the pool.
24h turnover is 98.59M. Liquidity is still there, but the direction is quite clear. Next, we need to see whether this lower bound can be reclaimed; if it can’t, the de-leveraging may not be over yet.
On the 15m chart, it’s down 2.77% directly, with volume hitting 3.53x the normal level and a Z value of 2.61—this isn’t a typical pullback. The key point is that OI fell along with it: on 15m it’s -1.79%, on 1h it’s -1.32%, and nominal value shrank by almost 1.7 million U. Price is down and positions are reduced—this is classic long de-leveraging, with stop-loss orders exiting rather than new shorts piling in to slam the market.
Active trade underperformance is -14.2%, the buy/sell ratio is 0.75, and sell pressure is in control. The close has already broken below the lower bound of the most recent 5m range for about 20 bars. At this level, there wasn’t much defense to begin with.
OI abnormal percentile is 97%—it ranks #6 across the whole pool, and nominal change ranks #8. Usually this coin’s OI doesn’t swing this extremely; today it’s one of the most eye-catching in the pool.
24h turnover is 98.59M. Liquidity is still there, but the direction is quite clear. Next, we need to see whether this lower bound can be reclaimed; if it can’t, the de-leveraging may not be over yet.
4
·
--
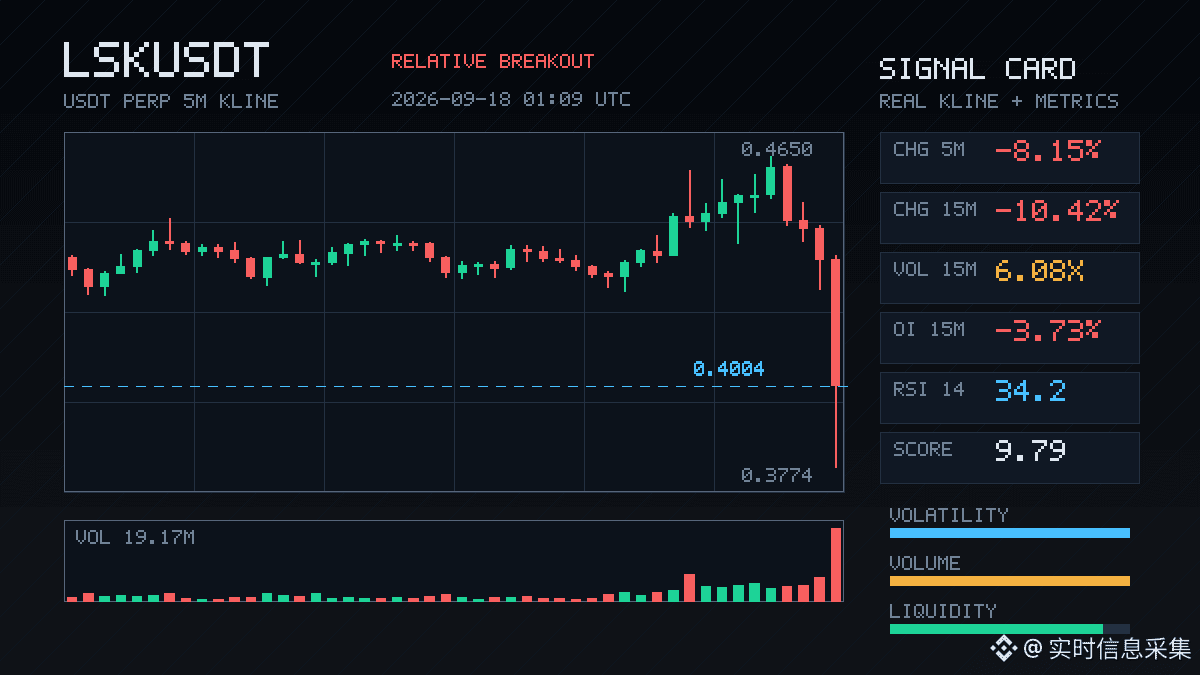
$LSK This drop was pretty decisive.
In 15m, it went straight down -10.42%, trading volume hit 6x the usual level, and the volatility Z reached 8.8. This doesn’t look like a normal pullback at all—there’s clearly aggressive sell pressure on the order book. The buy/sell ratio is 0.66; aggressive trade volume is down by more than 20%, and the direction of the sell-off is consistent.
But what’s even more worth noting isn’t just the magnitude of the decline—it’s the confirmation from OI (open interest). In the 15m contract, OI dropped 3.73%, with a nominal decrease of 2.55 million U. The 1h metric is also contracting. Price is falling while OI is dropping—this is a typical long-side deleveraging structure. Stop-losses and passive liquidations are what’s driving it, not shorts adding aggressively to push price lower. In other words, it looks more like longs collapsing themselves rather than shorts being unconcerned and building positions.
The abnormal percentile for OI has already reached 96.8%. In the whole pool, abnormal ranking is #8 and nominal change is #5. At this kind of position, a relative breakdown usually indicates that chips are being forced to churn near an extreme range. The closing price has already broken below the lower edge of the last 20 or so 5m K-bars, and the short-term structure has completely turned bad.
At this point, the focus isn’t guessing the bottom—it’s checking whether the leverage is being cleared cleanly. Only if OI continues shrinking and price stabilizes without falling further do we have the qualifications to talk about a rebound. If instead there’s a low-volume snapback, it’s very likely just giving room for the next wave of selling pressure. LSK’s liquidity was already thin. With leverage contracting at this scale, don’t rush to catch the falling knife.
$LSK This drop was pretty decisive.
In 15m, it went straight down -10.42%, trading volume hit 6x the usual level, and the volatility Z reached 8.8. This doesn’t look like a normal pullback at all—there’s clearly aggressive sell pressure on the order book. The buy/sell ratio is 0.66; aggressive trade volume is down by more than 20%, and the direction of the sell-off is consistent.
But what’s even more worth noting isn’t just the magnitude of the decline—it’s the confirmation from OI (open interest). In the 15m contract, OI dropped 3.73%, with a nominal decrease of 2.55 million U. The 1h metric is also contracting. Price is falling while OI is dropping—this is a typical long-side deleveraging structure. Stop-losses and passive liquidations are what’s driving it, not shorts adding aggressively to push price lower. In other words, it looks more like longs collapsing themselves rather than shorts being unconcerned and building positions.
The abnormal percentile for OI has already reached 96.8%. In the whole pool, abnormal ranking is #8 and nominal change is #5. At this kind of position, a relative breakdown usually indicates that chips are being forced to churn near an extreme range. The closing price has already broken below the lower edge of the last 20 or so 5m K-bars, and the short-term structure has completely turned bad.
At this point, the focus isn’t guessing the bottom—it’s checking whether the leverage is being cleared cleanly. Only if OI continues shrinking and price stabilizes without falling further do we have the qualifications to talk about a rebound. If instead there’s a low-volume snapback, it’s very likely just giving room for the next wave of selling pressure. LSK’s liquidity was already thin. With leverage contracting at this scale, don’t rush to catch the falling knife.
In 15m, it went straight down -10.42%, trading volume hit 6x the usual level, and the volatility Z reached 8.8. This doesn’t look like a normal pullback at all—there’s clearly aggressive sell pressure on the order book. The buy/sell ratio is 0.66; aggressive trade volume is down by more than 20%, and the direction of the sell-off is consistent.
But what’s even more worth noting isn’t just the magnitude of the decline—it’s the confirmation from OI (open interest). In the 15m contract, OI dropped 3.73%, with a nominal decrease of 2.55 million U. The 1h metric is also contracting. Price is falling while OI is dropping—this is a typical long-side deleveraging structure. Stop-losses and passive liquidations are what’s driving it, not shorts adding aggressively to push price lower. In other words, it looks more like longs collapsing themselves rather than shorts being unconcerned and building positions.
The abnormal percentile for OI has already reached 96.8%. In the whole pool, abnormal ranking is #8 and nominal change is #5. At this kind of position, a relative breakdown usually indicates that chips are being forced to churn near an extreme range. The closing price has already broken below the lower edge of the last 20 or so 5m K-bars, and the short-term structure has completely turned bad.
At this point, the focus isn’t guessing the bottom—it’s checking whether the leverage is being cleared cleanly. Only if OI continues shrinking and price stabilizes without falling further do we have the qualifications to talk about a rebound. If instead there’s a low-volume snapback, it’s very likely just giving room for the next wave of selling pressure. LSK’s liquidity was already thin. With leverage contracting at this scale, don’t rush to catch the falling knife.
73

·
--
Hyperliquid ($HYPE) Gains Momentum with High Trading Volume
Hyperliquid ($HYPE) is trending at #8 with a strong 24h volume of $810M. Despite a slight 0.80% drop, the coin's robust trading activity signals strong market interest. $HYPE's high liquidity and growing community engagement make it a key player to watch in the DeFi space. Traders should keep an eye on this coin for potential movements. ⚡
Follow for more crypto setups.
#DeGenYuv #Hyperliquid
Hyperliquid ($HYPE ) Gains Momentum with High Trading Volume
Hyperliquid ($HYPE ) is trending at #8 with a strong 24h volume of $810M. Despite a slight 0.80% drop, the coin's robust trading activity signals strong market interest. $HYPE 's high liquidity and growing community engagement make it a key player to watch in the DeFi space. Traders should keep an eye on this coin for potential movements. ⚡
Follow for more crypto setups.
#DeGenYuv #Hyperliquid
Hyperliquid ($HYPE ) is trending at #8 with a strong 24h volume of $810M. Despite a slight 0.80% drop, the coin's robust trading activity signals strong market interest. $HYPE 's high liquidity and growing community engagement make it a key player to watch in the DeFi space. Traders should keep an eye on this coin for potential movements. ⚡
Follow for more crypto setups.
#DeGenYuv #Hyperliquid
29

·
--
Hyperliquid ($HYPE) Gains Momentum with High Volume
Hyperliquid ($HYPE) is trending at #8 with a strong 24h volume of $811.72M. Despite a slight -0.82% dip, the high liquidity and market cap rank of 11 are drawing trader attention. The coin is known for its innovative trading and lending platform, making it a key player in the DeFi space. 📊 Traders should keep an eye on $HYPE's volume and market dynamics for potential opportunities. 👀
Follow for more setups like this.
#HahaProfit #Hyperliquid
Hyperliquid ($HYPE ) Gains Momentum with High Volume
Hyperliquid ($HYPE ) is trending at #8 with a strong 24h volume of $811.72M. Despite a slight -0.82% dip, the high liquidity and market cap rank of 11 are drawing trader attention. The coin is known for its innovative trading and lending platform, making it a key player in the DeFi space. 📊 Traders should keep an eye on $HYPE 's volume and market dynamics for potential opportunities. 👀
Follow for more setups like this.
#HahaProfit #Hyperliquid
Hyperliquid ($HYPE ) is trending at #8 with a strong 24h volume of $811.72M. Despite a slight -0.82% dip, the high liquidity and market cap rank of 11 are drawing trader attention. The coin is known for its innovative trading and lending platform, making it a key player in the DeFi space. 📊 Traders should keep an eye on $HYPE 's volume and market dynamics for potential opportunities. 👀
Follow for more setups like this.
#HahaProfit #Hyperliquid

·
--
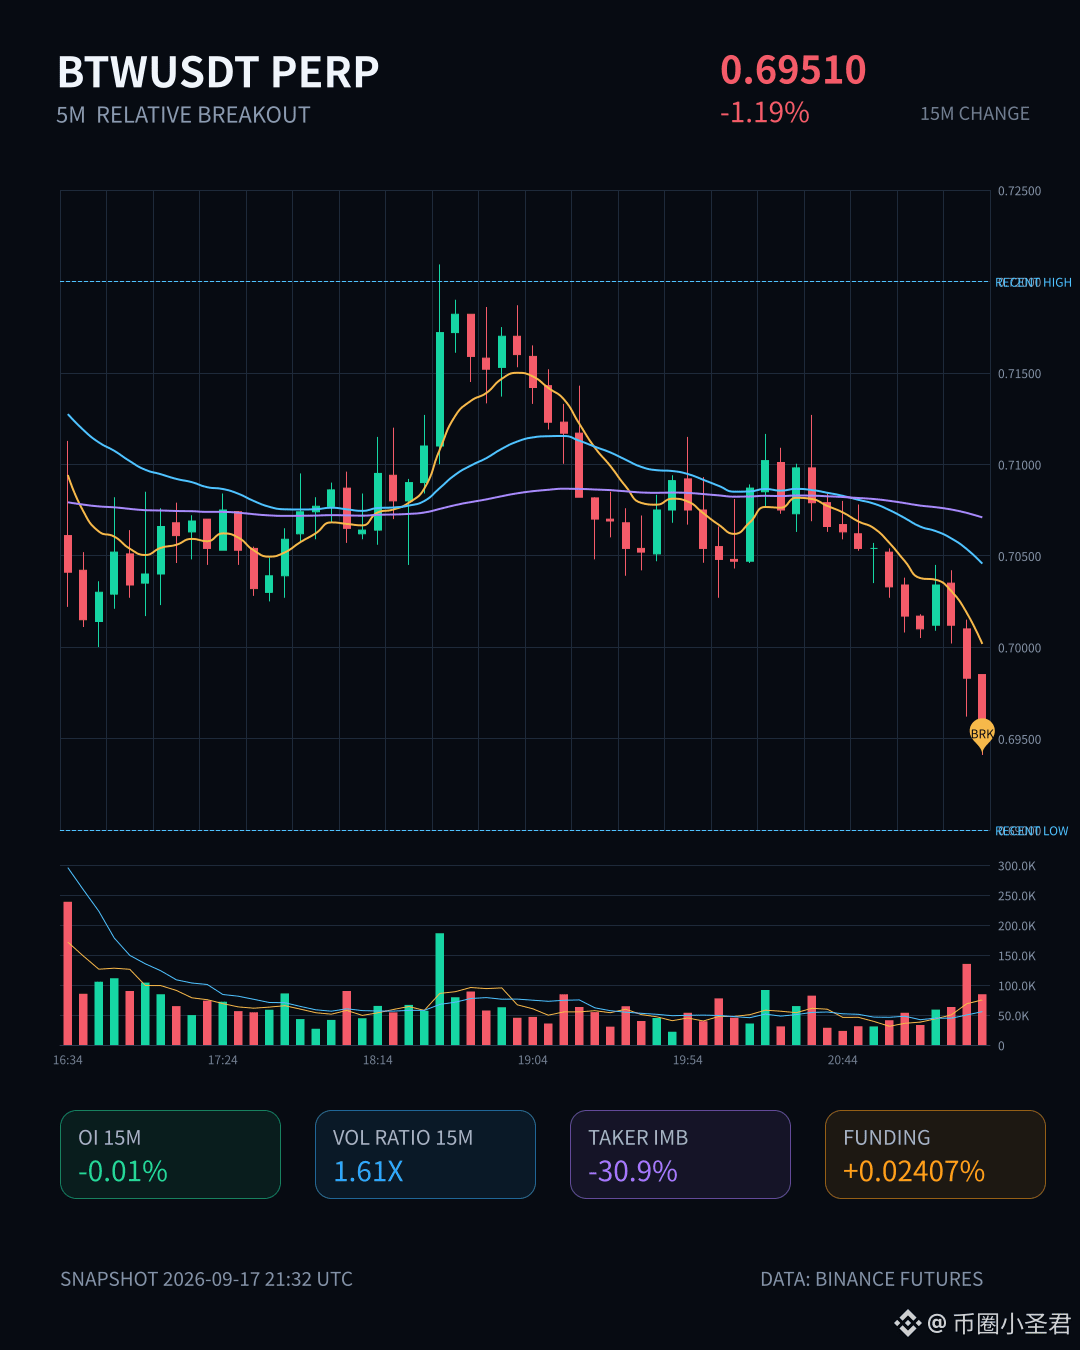
$BTW This drop isn’t that fierce, but the structure is pretty interesting—price broke below the lower edge of the near-20 5m range, volume expanded to 1.61x, and the aggressive buy/sell ratio is 0.53, with sell pressure in control.
The key is OI: 15m -0.01%, 1h -0.03%, with a nominal reduction of 2.26M. When price falls and OI declines, it’s a typical sign of long liquidation/deleveraging and stop-outs. This isn’t new short entry—it’s the old longs getting cut.
It’s at the 84.3rd percentile, the whole pool #8. In the last 24h, volume is 38M; liquidity is sufficient, but the direction is bearish. Under this kind of structure, any rebound may be an opportunity to reduce positions, not a bottom-fishing signal.
Focus on observation and wait for OI to stabilize before reassessing.
$BTW This drop isn’t that fierce, but the structure is pretty interesting—price broke below the lower edge of the near-20 5m range, volume expanded to 1.61x, and the aggressive buy/sell ratio is 0.53, with sell pressure in control.
The key is OI: 15m -0.01%, 1h -0.03%, with a nominal reduction of 2.26M. When price falls and OI declines, it’s a typical sign of long liquidation/deleveraging and stop-outs. This isn’t new short entry—it’s the old longs getting cut.
It’s at the 84.3rd percentile, the whole pool #8. In the last 24h, volume is 38M; liquidity is sufficient, but the direction is bearish. Under this kind of structure, any rebound may be an opportunity to reduce positions, not a bottom-fishing signal.
Focus on observation and wait for OI to stabilize before reassessing.
The key is OI: 15m -0.01%, 1h -0.03%, with a nominal reduction of 2.26M. When price falls and OI declines, it’s a typical sign of long liquidation/deleveraging and stop-outs. This isn’t new short entry—it’s the old longs getting cut.
It’s at the 84.3rd percentile, the whole pool #8. In the last 24h, volume is 38M; liquidity is sufficient, but the direction is bearish. Under this kind of structure, any rebound may be an opportunity to reduce positions, not a bottom-fishing signal.
Focus on observation and wait for OI to stabilize before reassessing.
21
Log in to explore more content
Join global crypto users on Binance Square
⚡️ Get latest and useful information about crypto.
💬 Trusted by the world’s largest crypto exchange.
👍 Discover real insights from verified creators.
Email / Phone number
Trending Topics
1
#SaylorHintsStrategyBitcoinBuy
2.2M views
11,482 Discussing
2
#BOJRaisesRatesTo31YearHigh
184,451 views
2,727 Discussing
3
#BuffettStepsDownAsBerkshireChairman
89,358 views
1,413 Discussing
4
#XRPExchangeReservesHitSevenYearLow
96,516 views
1,252 Discussing
5
#HKCompletesFirstHKDStablecoinUseCase
127,510 views
1,649 Discussing
6
#VietnamPlansFirstCryptoLicensesIn2026
80,103 views
1,137 Discussing
7
#BTCBreaks80K
468,700 views
5,395 Discussing
8
#BitcoinMarketCapTopsTesla
111,877 views
1,302 Discussing
9
#SOLJumpsAbout10%
113,451 views
1,185 Discussing
10
#EthereumReclaims$2600
9,949 views
133 Discussing