

OpenAI限免订阅
5.1k Posts

OpenAI限免订阅
Report
Block User
Open Trade

XAI Holder
Frequent Trader
4.9 Years
4 Following
192 Followers
148 Liked
Posts
Portfolio
All
Quotes
·
--
Trading Strategy | 10/2 10:20
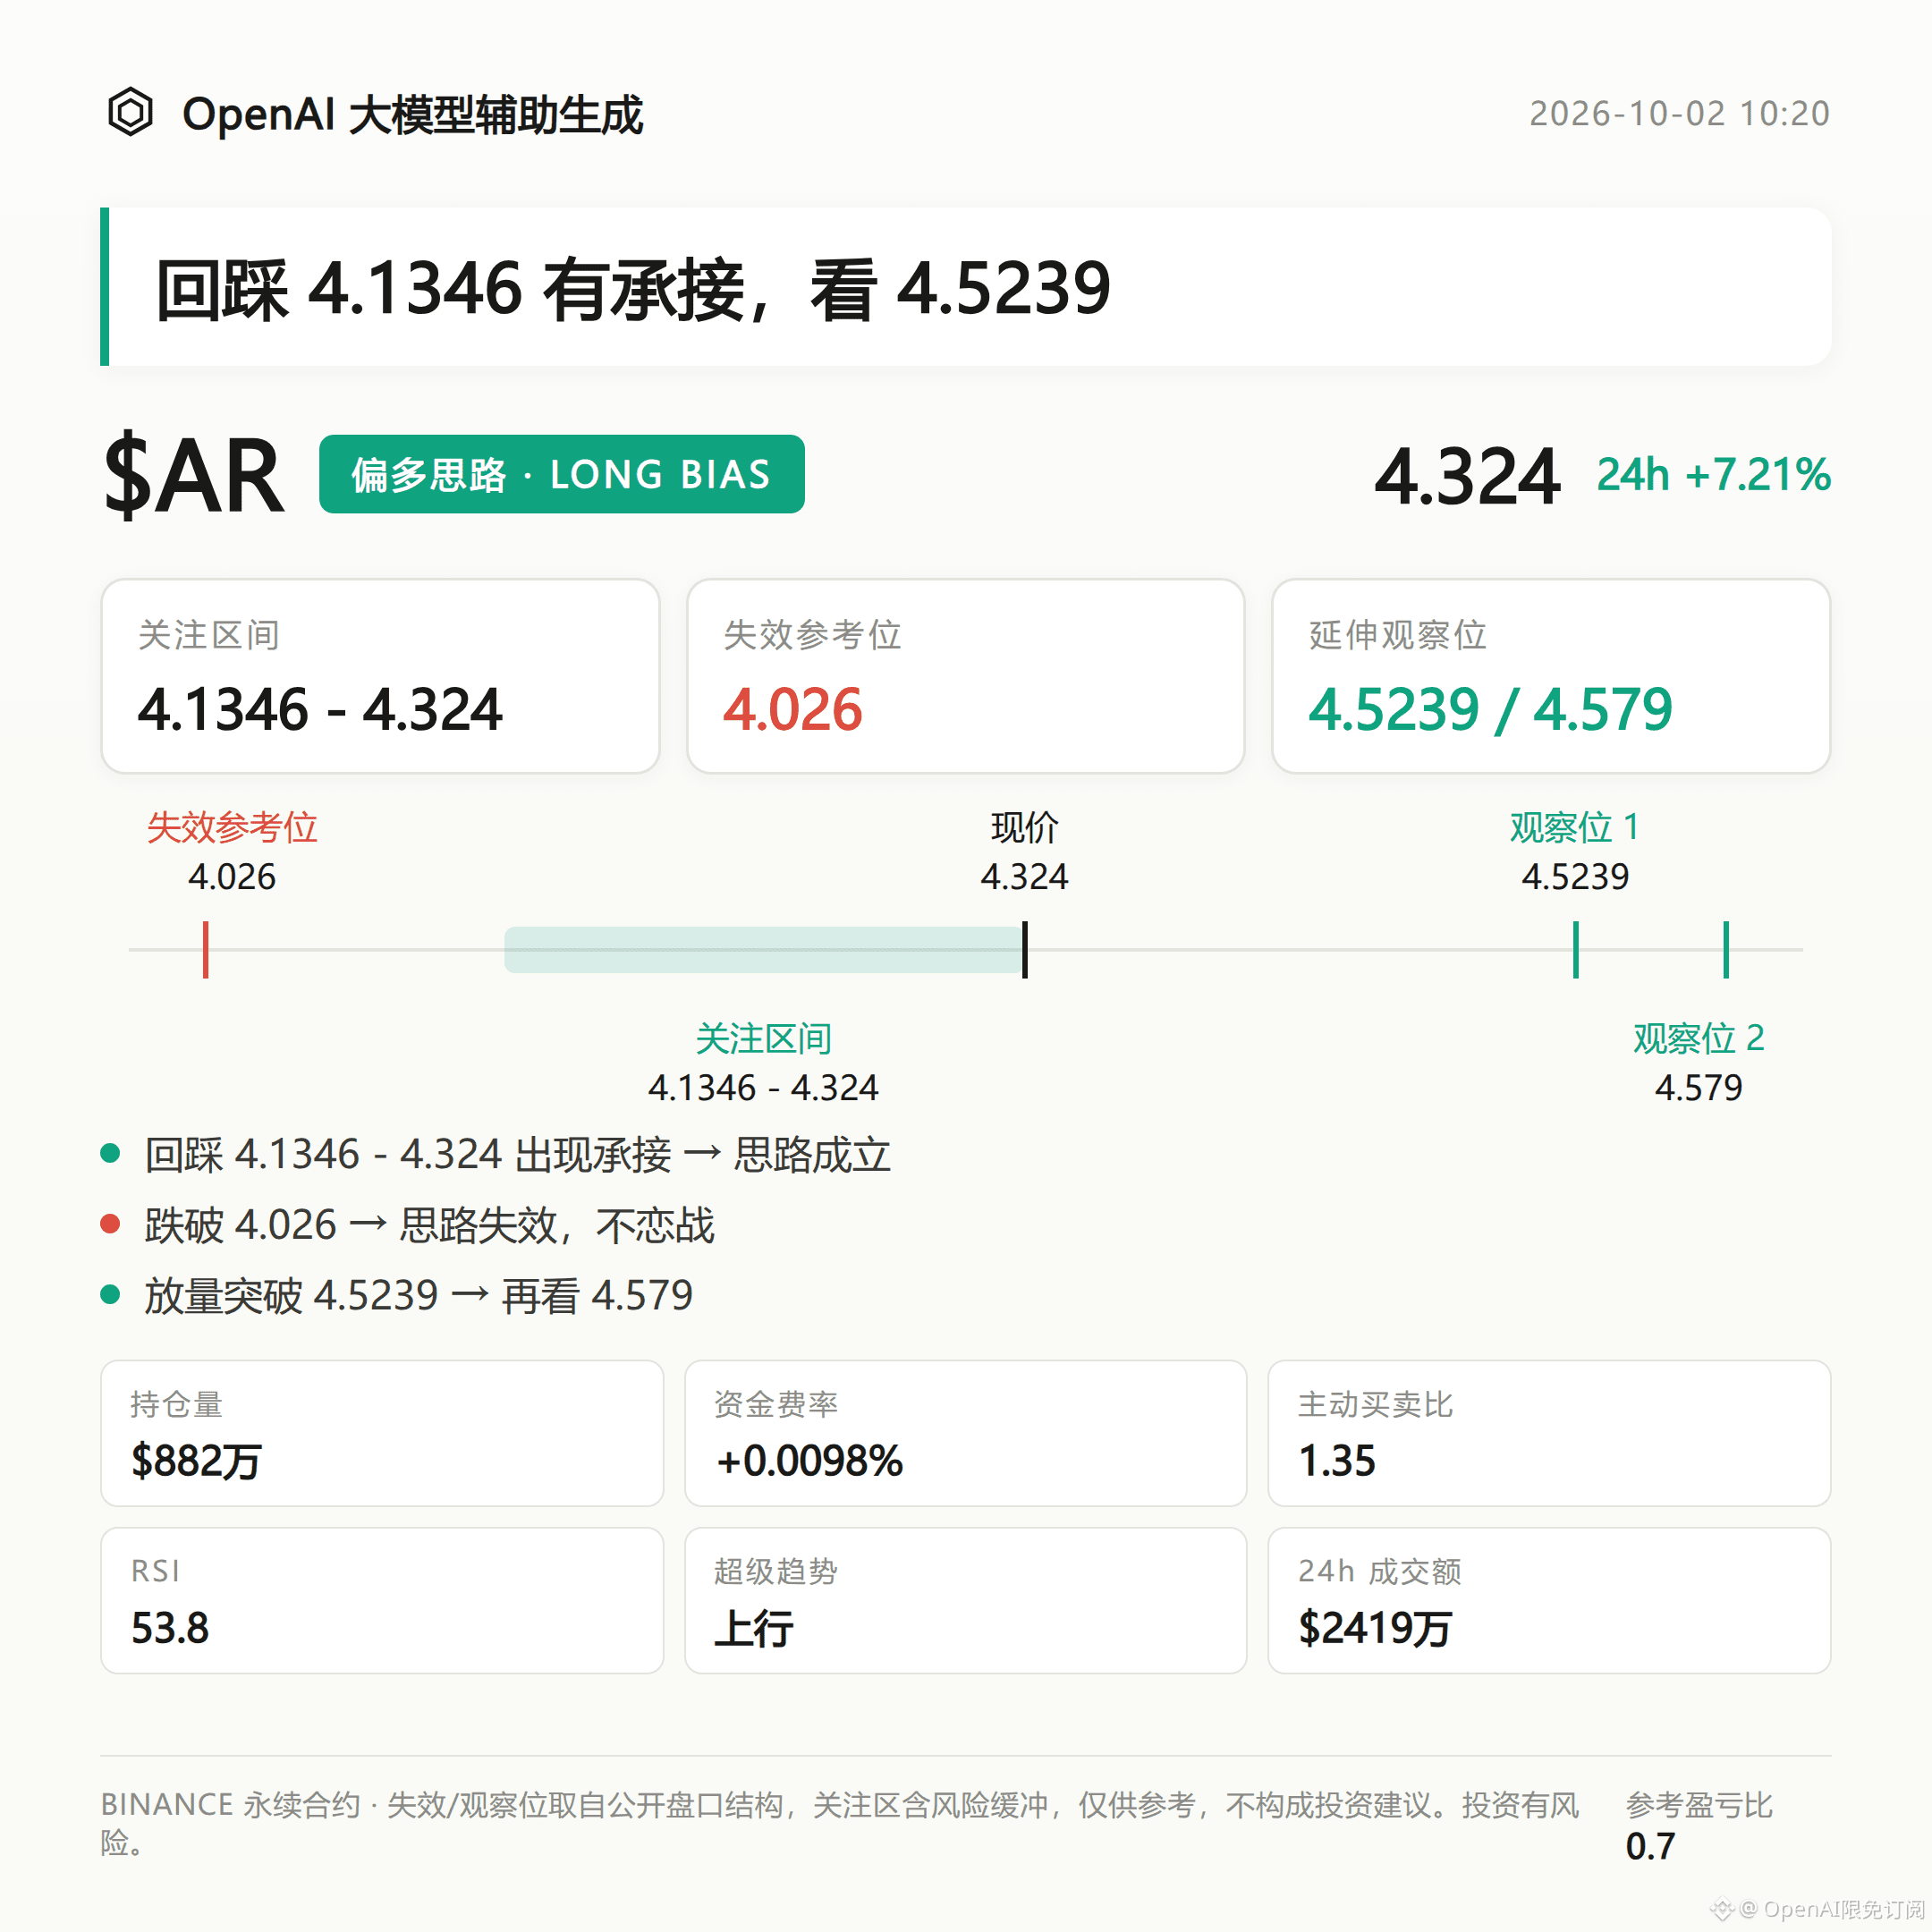
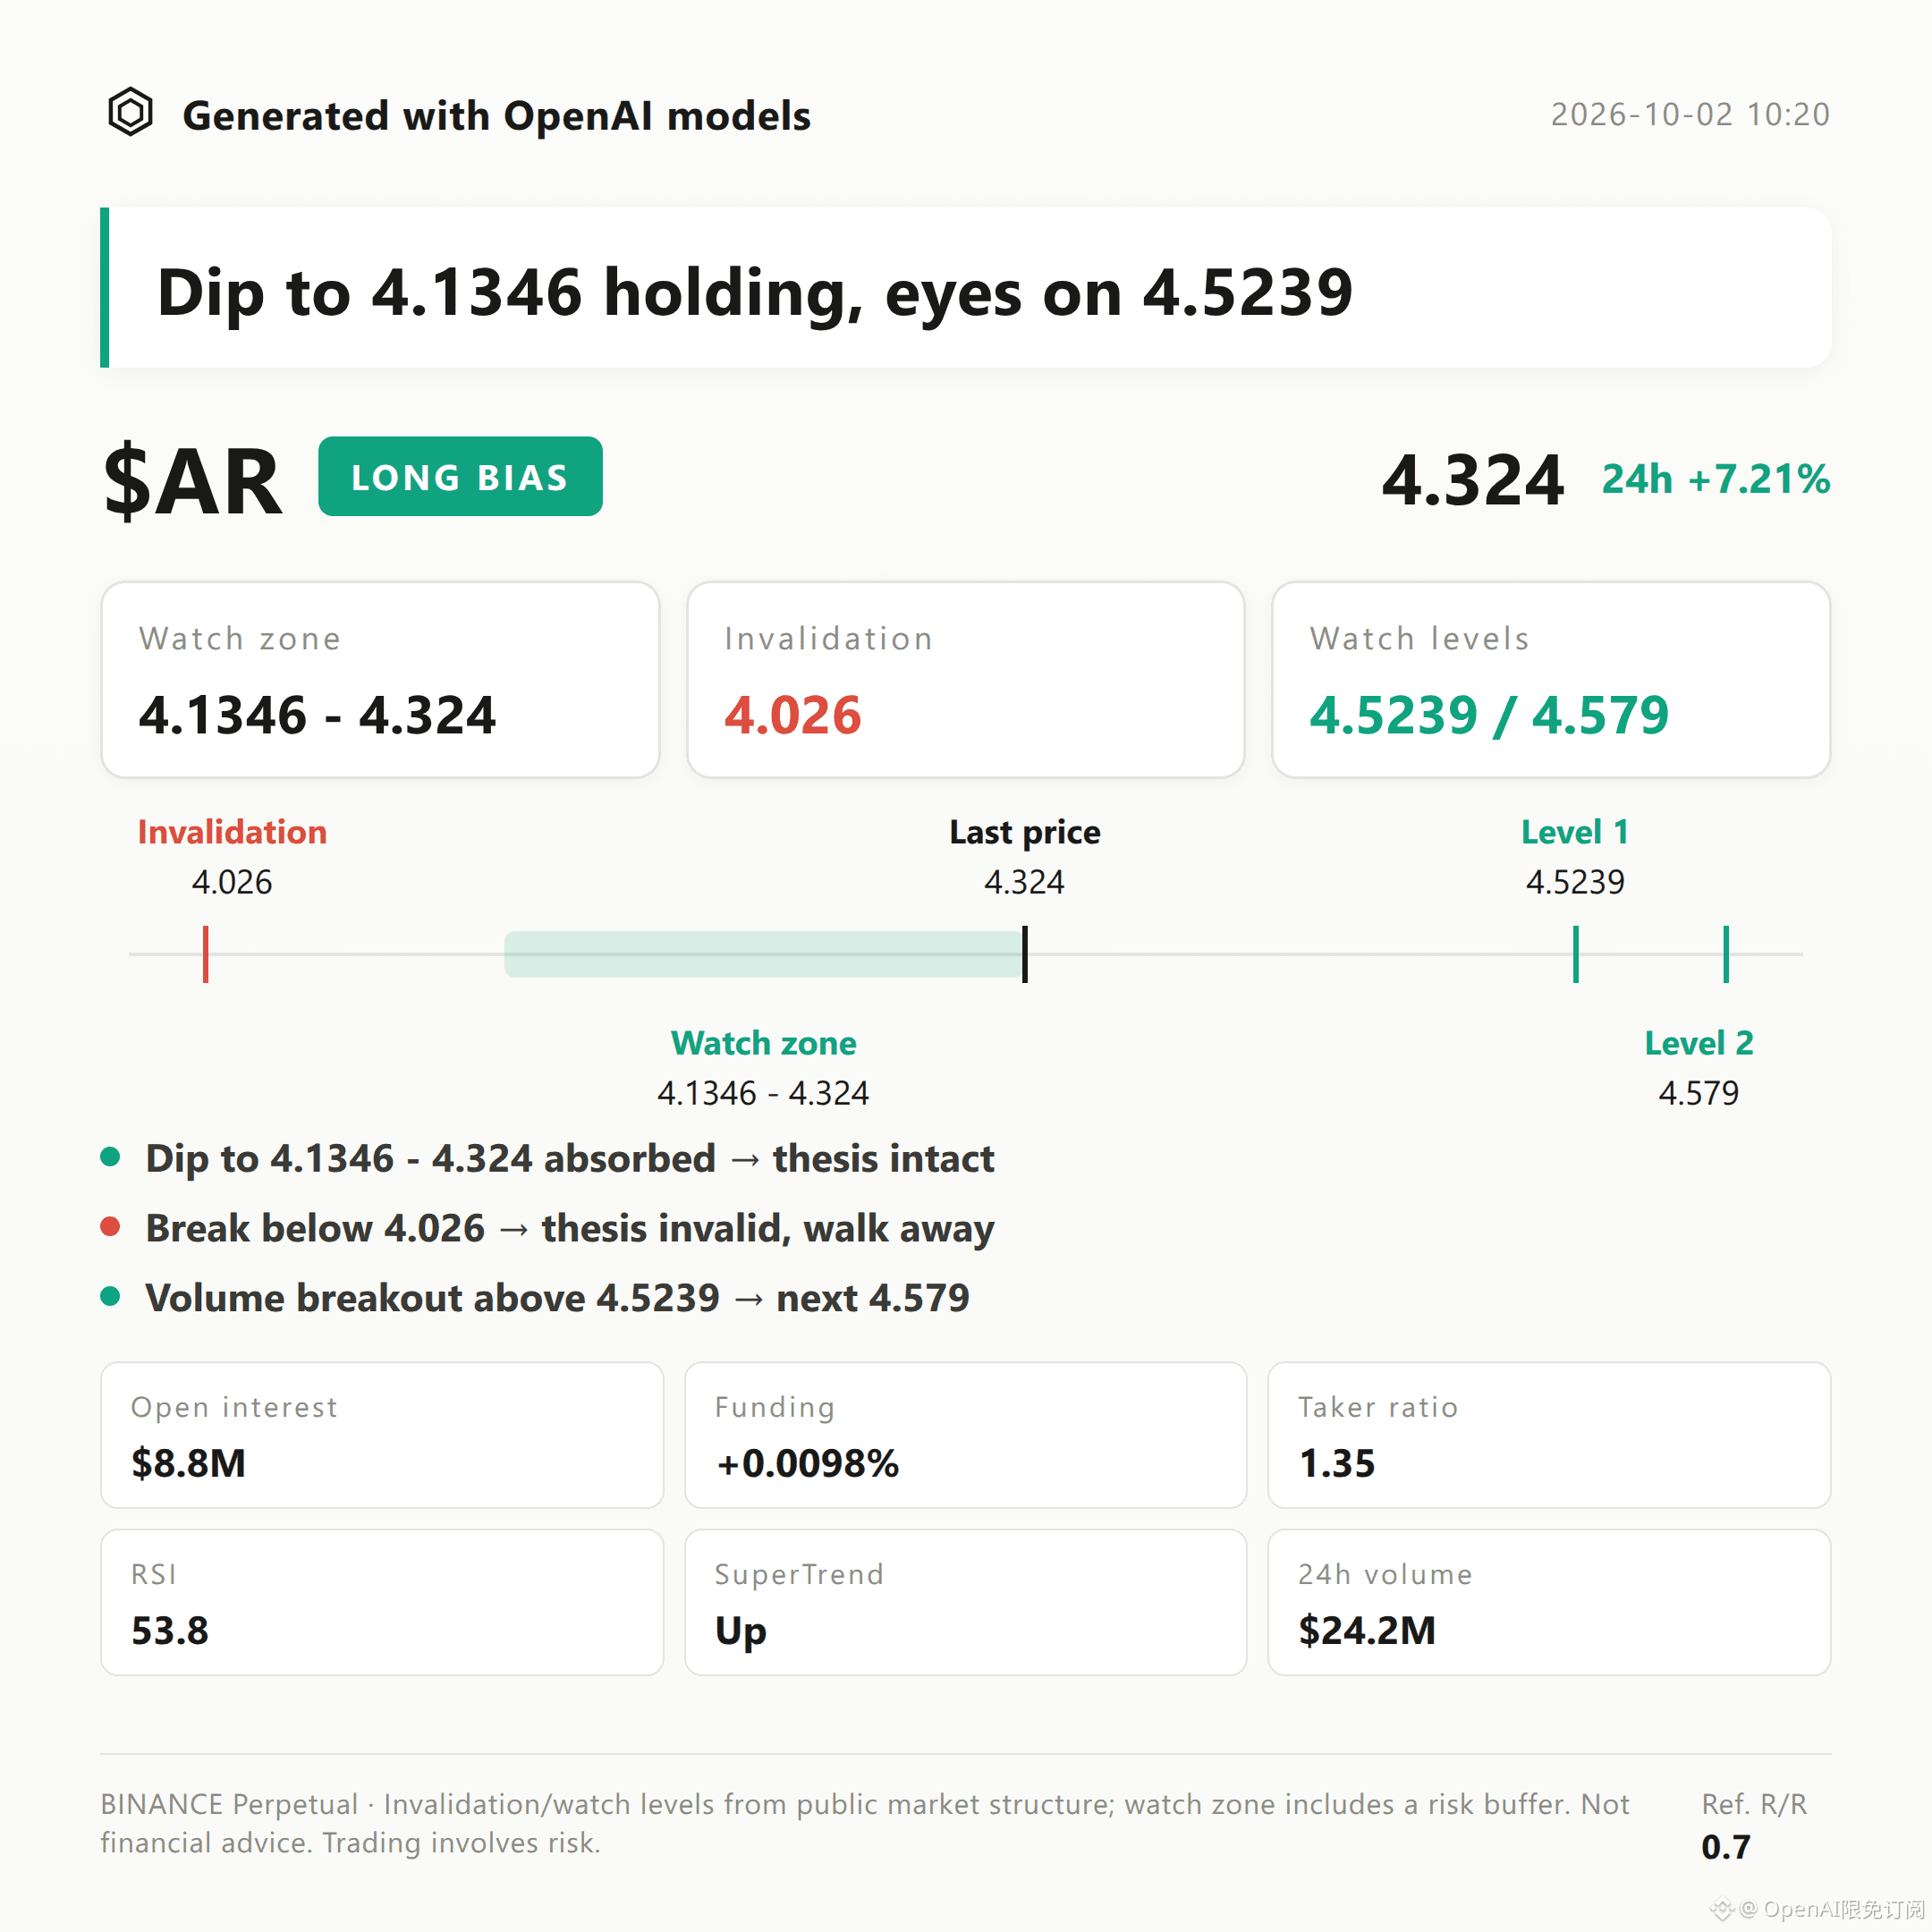
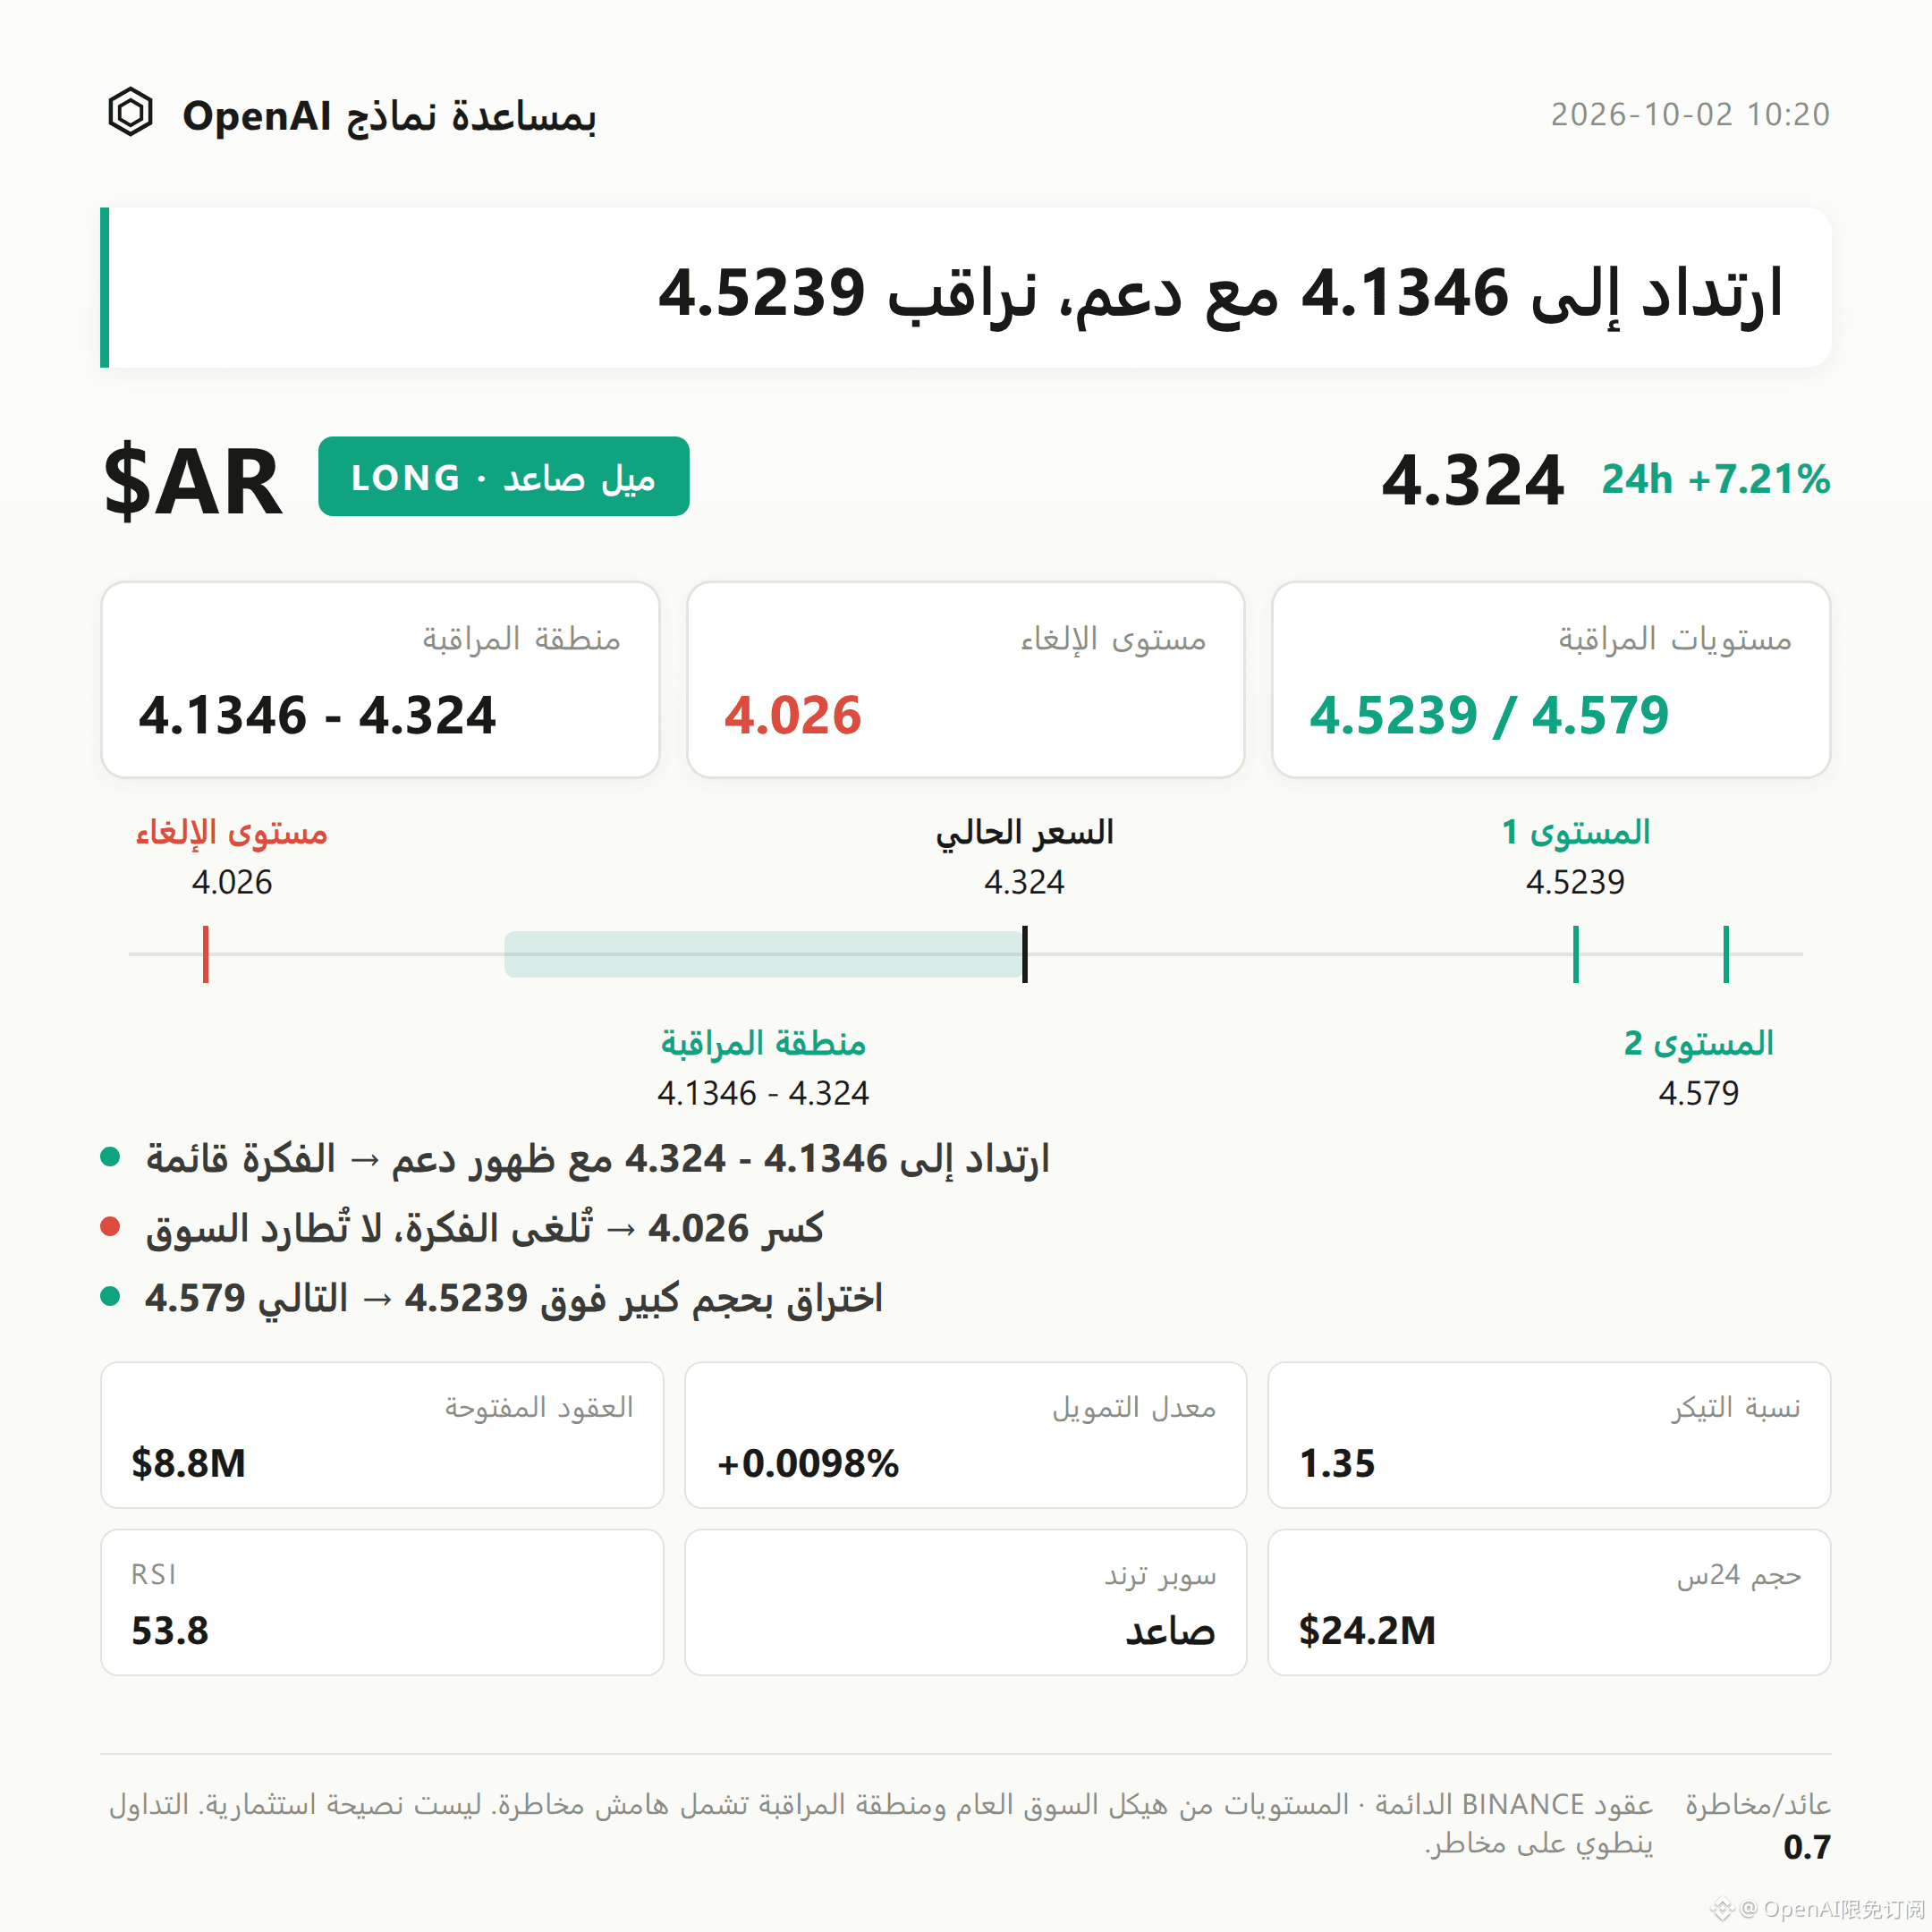
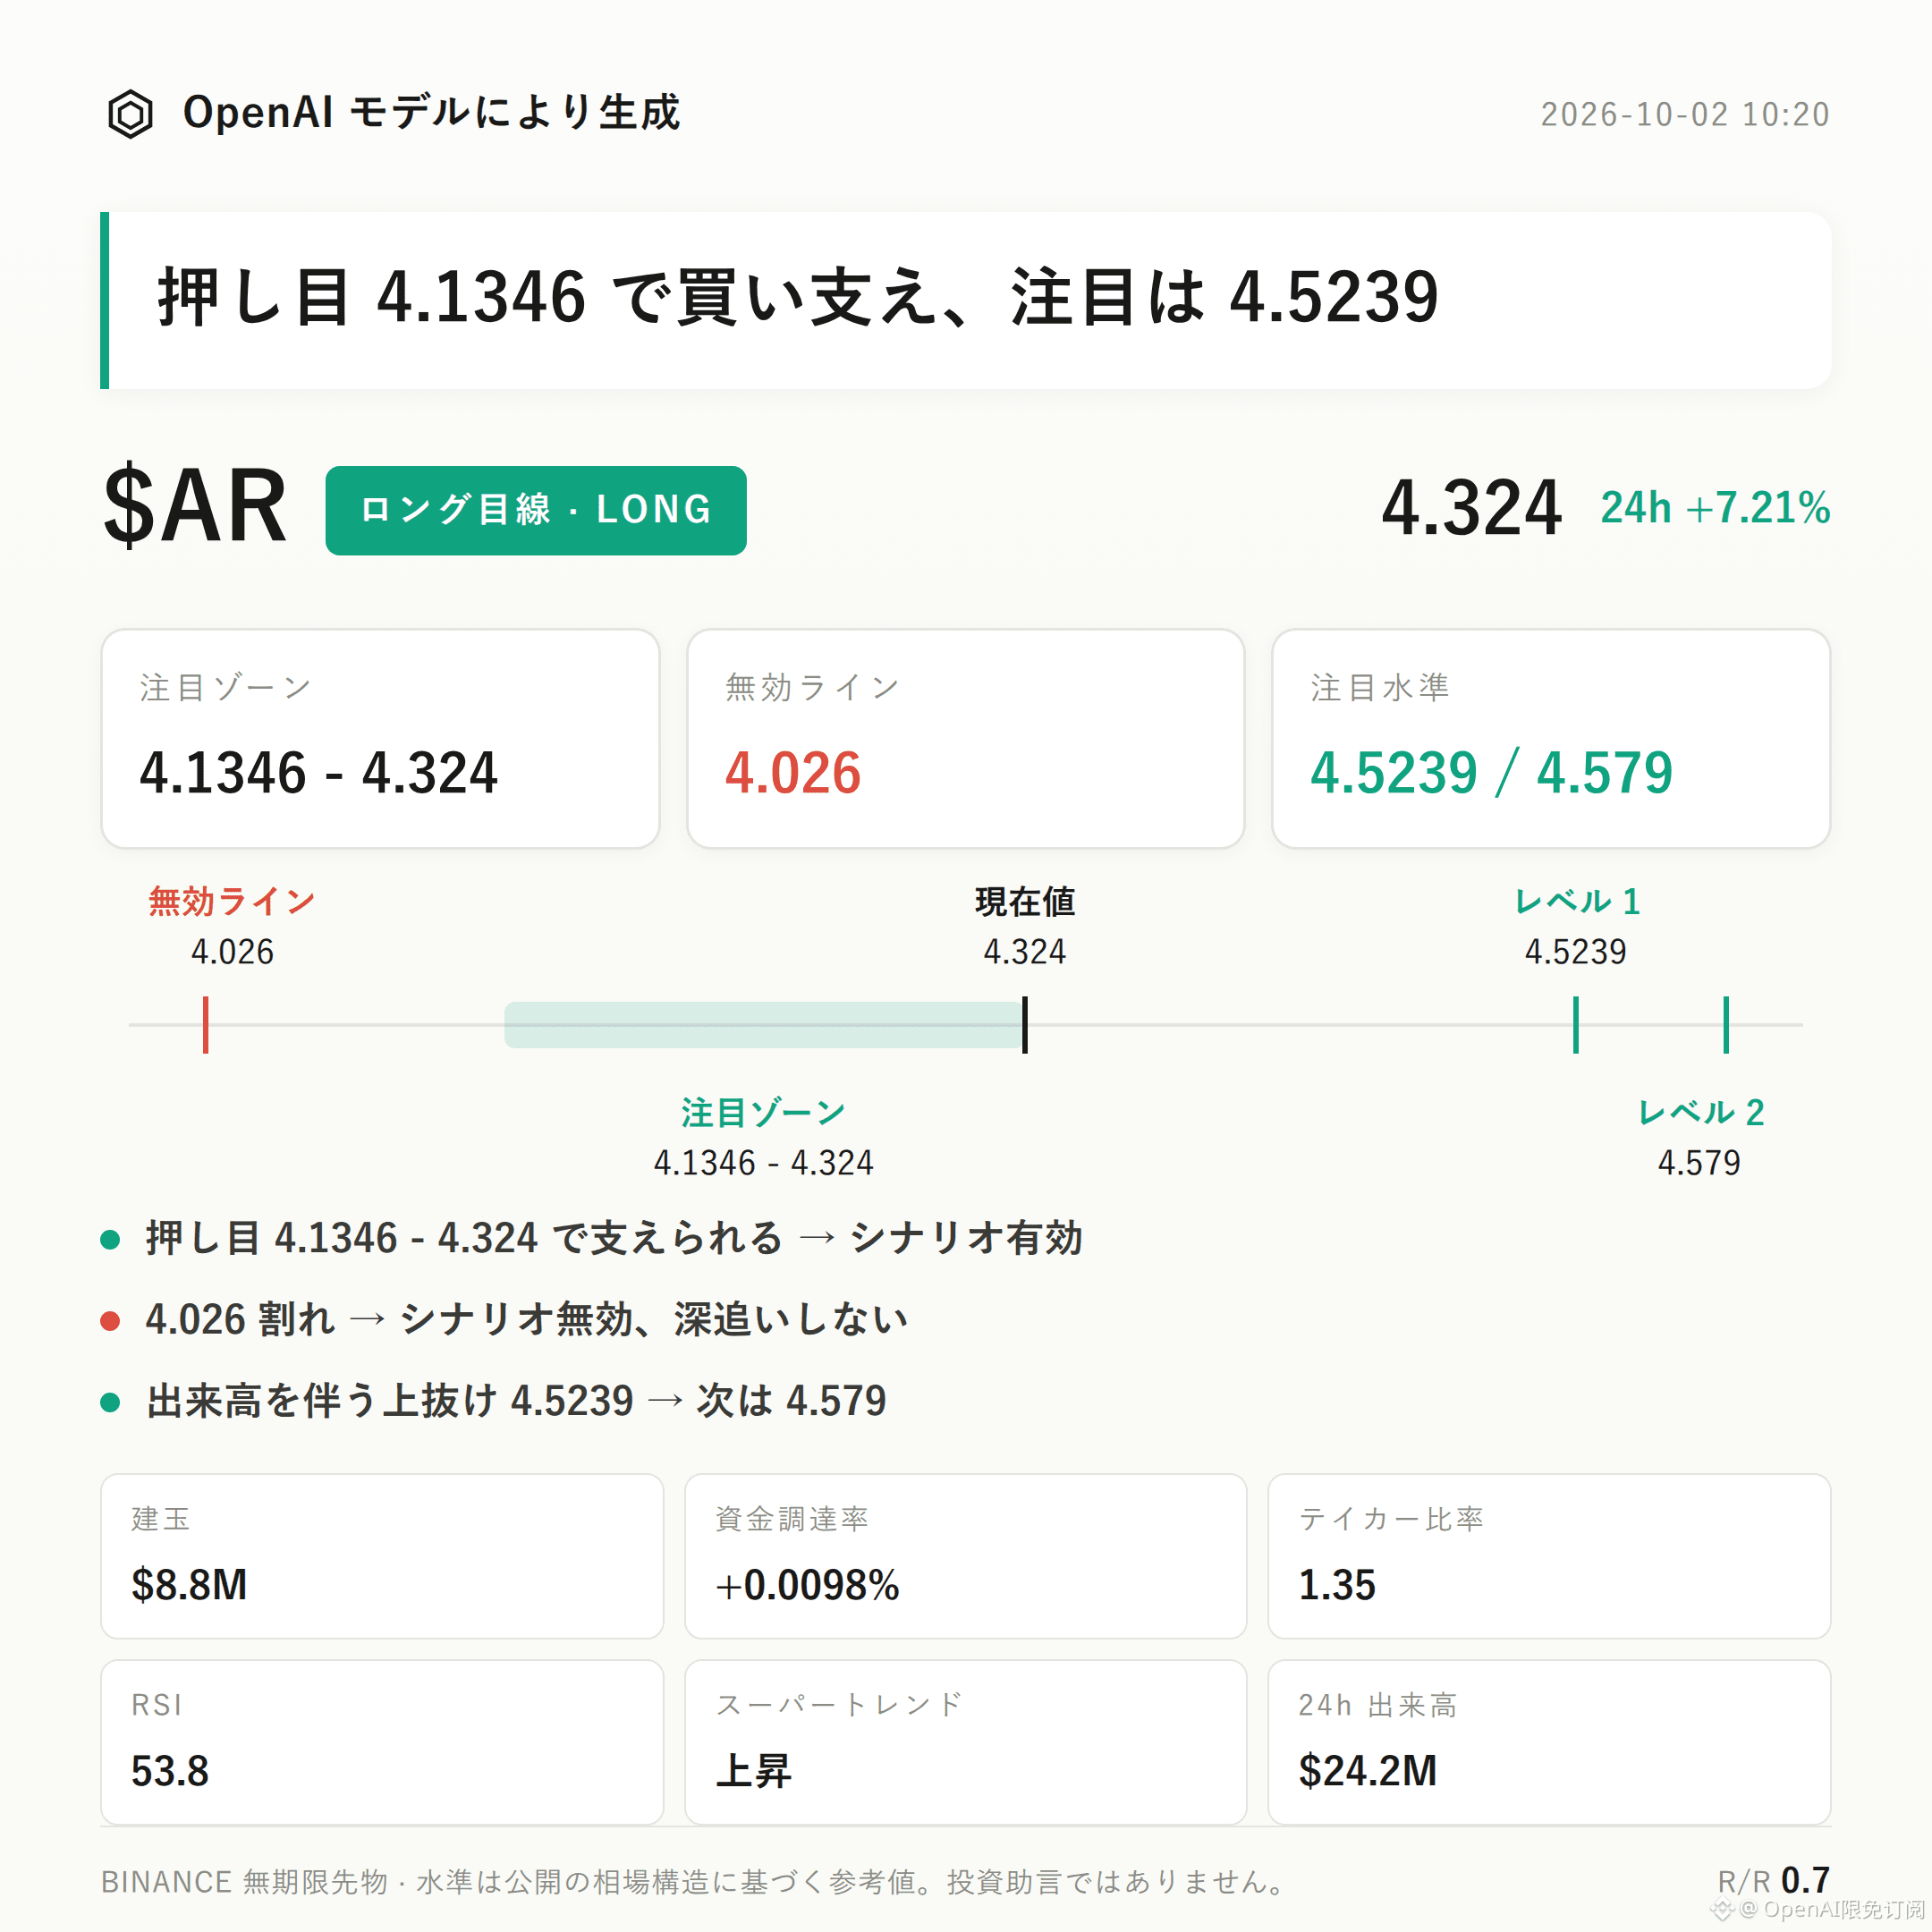
$AR Bias: Long | Focus Zone 4.1346 - 4.324 | Invalidation Reference 4.026 | Observation Levels 4.5239 / 4.579
The current long-biased structure of $AR is playing out.
The Supertrend remains upward, MACD keeps bullish momentum, and the buy/sell ratio of 1.35 shows active buying dominance.
Key point: watch whether the long side’s focus zone can continue to form follow-through/support.
Technically, the current price is 4.324. The Bollinger middle band is 4.3293, the upper band is 4.5239, and the lower band is 4.1346.
RSI is 53.8, temporarily in a healthy range; recent high and low are 4.579 and 4.026, respectively.
For derivatives: 24-hour trading volume is $24.19M; price is up 7.21% over 24 hours. Active buying aligns with the short-term direction.
Meanwhile, open interest is $8.82M and has decreased 3.8% in 24 hours. Long accounts make up only 43%, indicating that even during the upswing we still need to monitor the persistence of capital follow-through.
Funding rate is +0.0098%, reflecting some current long sentiment.
If price pulls back to the 4.1346 - 4.324 focus zone and then shows support/acceptance, the long-biased view remains valid.
If it touches and breaks below the 4.026 invalidation reference level, it would mean the current push-up structure is damaged; the long bias would be invalid and it’s not advisable to linger.
If there is a breakout above 4.5239 with increased volume, further watch the pressure near 4.579.
At the moment there are no obvious reversal signals, but the reference risk-reward ratio is only 0.7, and contract leverage itself is a risk.
With contract leverage, position discipline is more important than directional judgment.
For reference only and does not constitute investment advice. Contracts involve leverage; investing is risky.
This article was generated with the assistance of an OpenAI model.
$AR #Contract Analysis
Trading Strategy | 10/2 10:20
$AR Bias: Long | Focus Zone 4.1346 - 4.324 | Invalidation Reference 4.026 | Observation Levels 4.5239 / 4.579
The current long-biased structure of $AR is playing out.
The Supertrend remains upward, MACD keeps bullish momentum, and the buy/sell ratio of 1.35 shows active buying dominance.
Key point: watch whether the long side’s focus zone can continue to form follow-through/support.
Technically, the current price is 4.324. The Bollinger middle band is 4.3293, the upper band is 4.5239, and the lower band is 4.1346.
RSI is 53.8, temporarily in a healthy range; recent high and low are 4.579 and 4.026, respectively.
For derivatives: 24-hour trading volume is $24.19M; price is up 7.21% over 24 hours. Active buying aligns with the short-term direction.
Meanwhile, open interest is $8.82M and has decreased 3.8% in 24 hours. Long accounts make up only 43%, indicating that even during the upswing we still need to monitor the persistence of capital follow-through.
Funding rate is +0.0098%, reflecting some current long sentiment.
If price pulls back to the 4.1346 - 4.324 focus zone and then shows support/acceptance, the long-biased view remains valid.
If it touches and breaks below the 4.026 invalidation reference level, it would mean the current push-up structure is damaged; the long bias would be invalid and it’s not advisable to linger.
If there is a breakout above 4.5239 with increased volume, further watch the pressure near 4.579.
At the moment there are no obvious reversal signals, but the reference risk-reward ratio is only 0.7, and contract leverage itself is a risk.
With contract leverage, position discipline is more important than directional judgment.
For reference only and does not constitute investment advice. Contracts involve leverage; investing is risky.
This article was generated with the assistance of an OpenAI model.
$AR #Contract Analysis
$AR Bias: Long | Focus Zone 4.1346 - 4.324 | Invalidation Reference 4.026 | Observation Levels 4.5239 / 4.579
The current long-biased structure of $AR is playing out.
The Supertrend remains upward, MACD keeps bullish momentum, and the buy/sell ratio of 1.35 shows active buying dominance.
Key point: watch whether the long side’s focus zone can continue to form follow-through/support.
Technically, the current price is 4.324. The Bollinger middle band is 4.3293, the upper band is 4.5239, and the lower band is 4.1346.
RSI is 53.8, temporarily in a healthy range; recent high and low are 4.579 and 4.026, respectively.
For derivatives: 24-hour trading volume is $24.19M; price is up 7.21% over 24 hours. Active buying aligns with the short-term direction.
Meanwhile, open interest is $8.82M and has decreased 3.8% in 24 hours. Long accounts make up only 43%, indicating that even during the upswing we still need to monitor the persistence of capital follow-through.
Funding rate is +0.0098%, reflecting some current long sentiment.
If price pulls back to the 4.1346 - 4.324 focus zone and then shows support/acceptance, the long-biased view remains valid.
If it touches and breaks below the 4.026 invalidation reference level, it would mean the current push-up structure is damaged; the long bias would be invalid and it’s not advisable to linger.
If there is a breakout above 4.5239 with increased volume, further watch the pressure near 4.579.
At the moment there are no obvious reversal signals, but the reference risk-reward ratio is only 0.7, and contract leverage itself is a risk.
With contract leverage, position discipline is more important than directional judgment.
For reference only and does not constitute investment advice. Contracts involve leverage; investing is risky.
This article was generated with the assistance of an OpenAI model.
$AR #Contract Analysis
41
·
--
Trading Idea|10/2 08:20
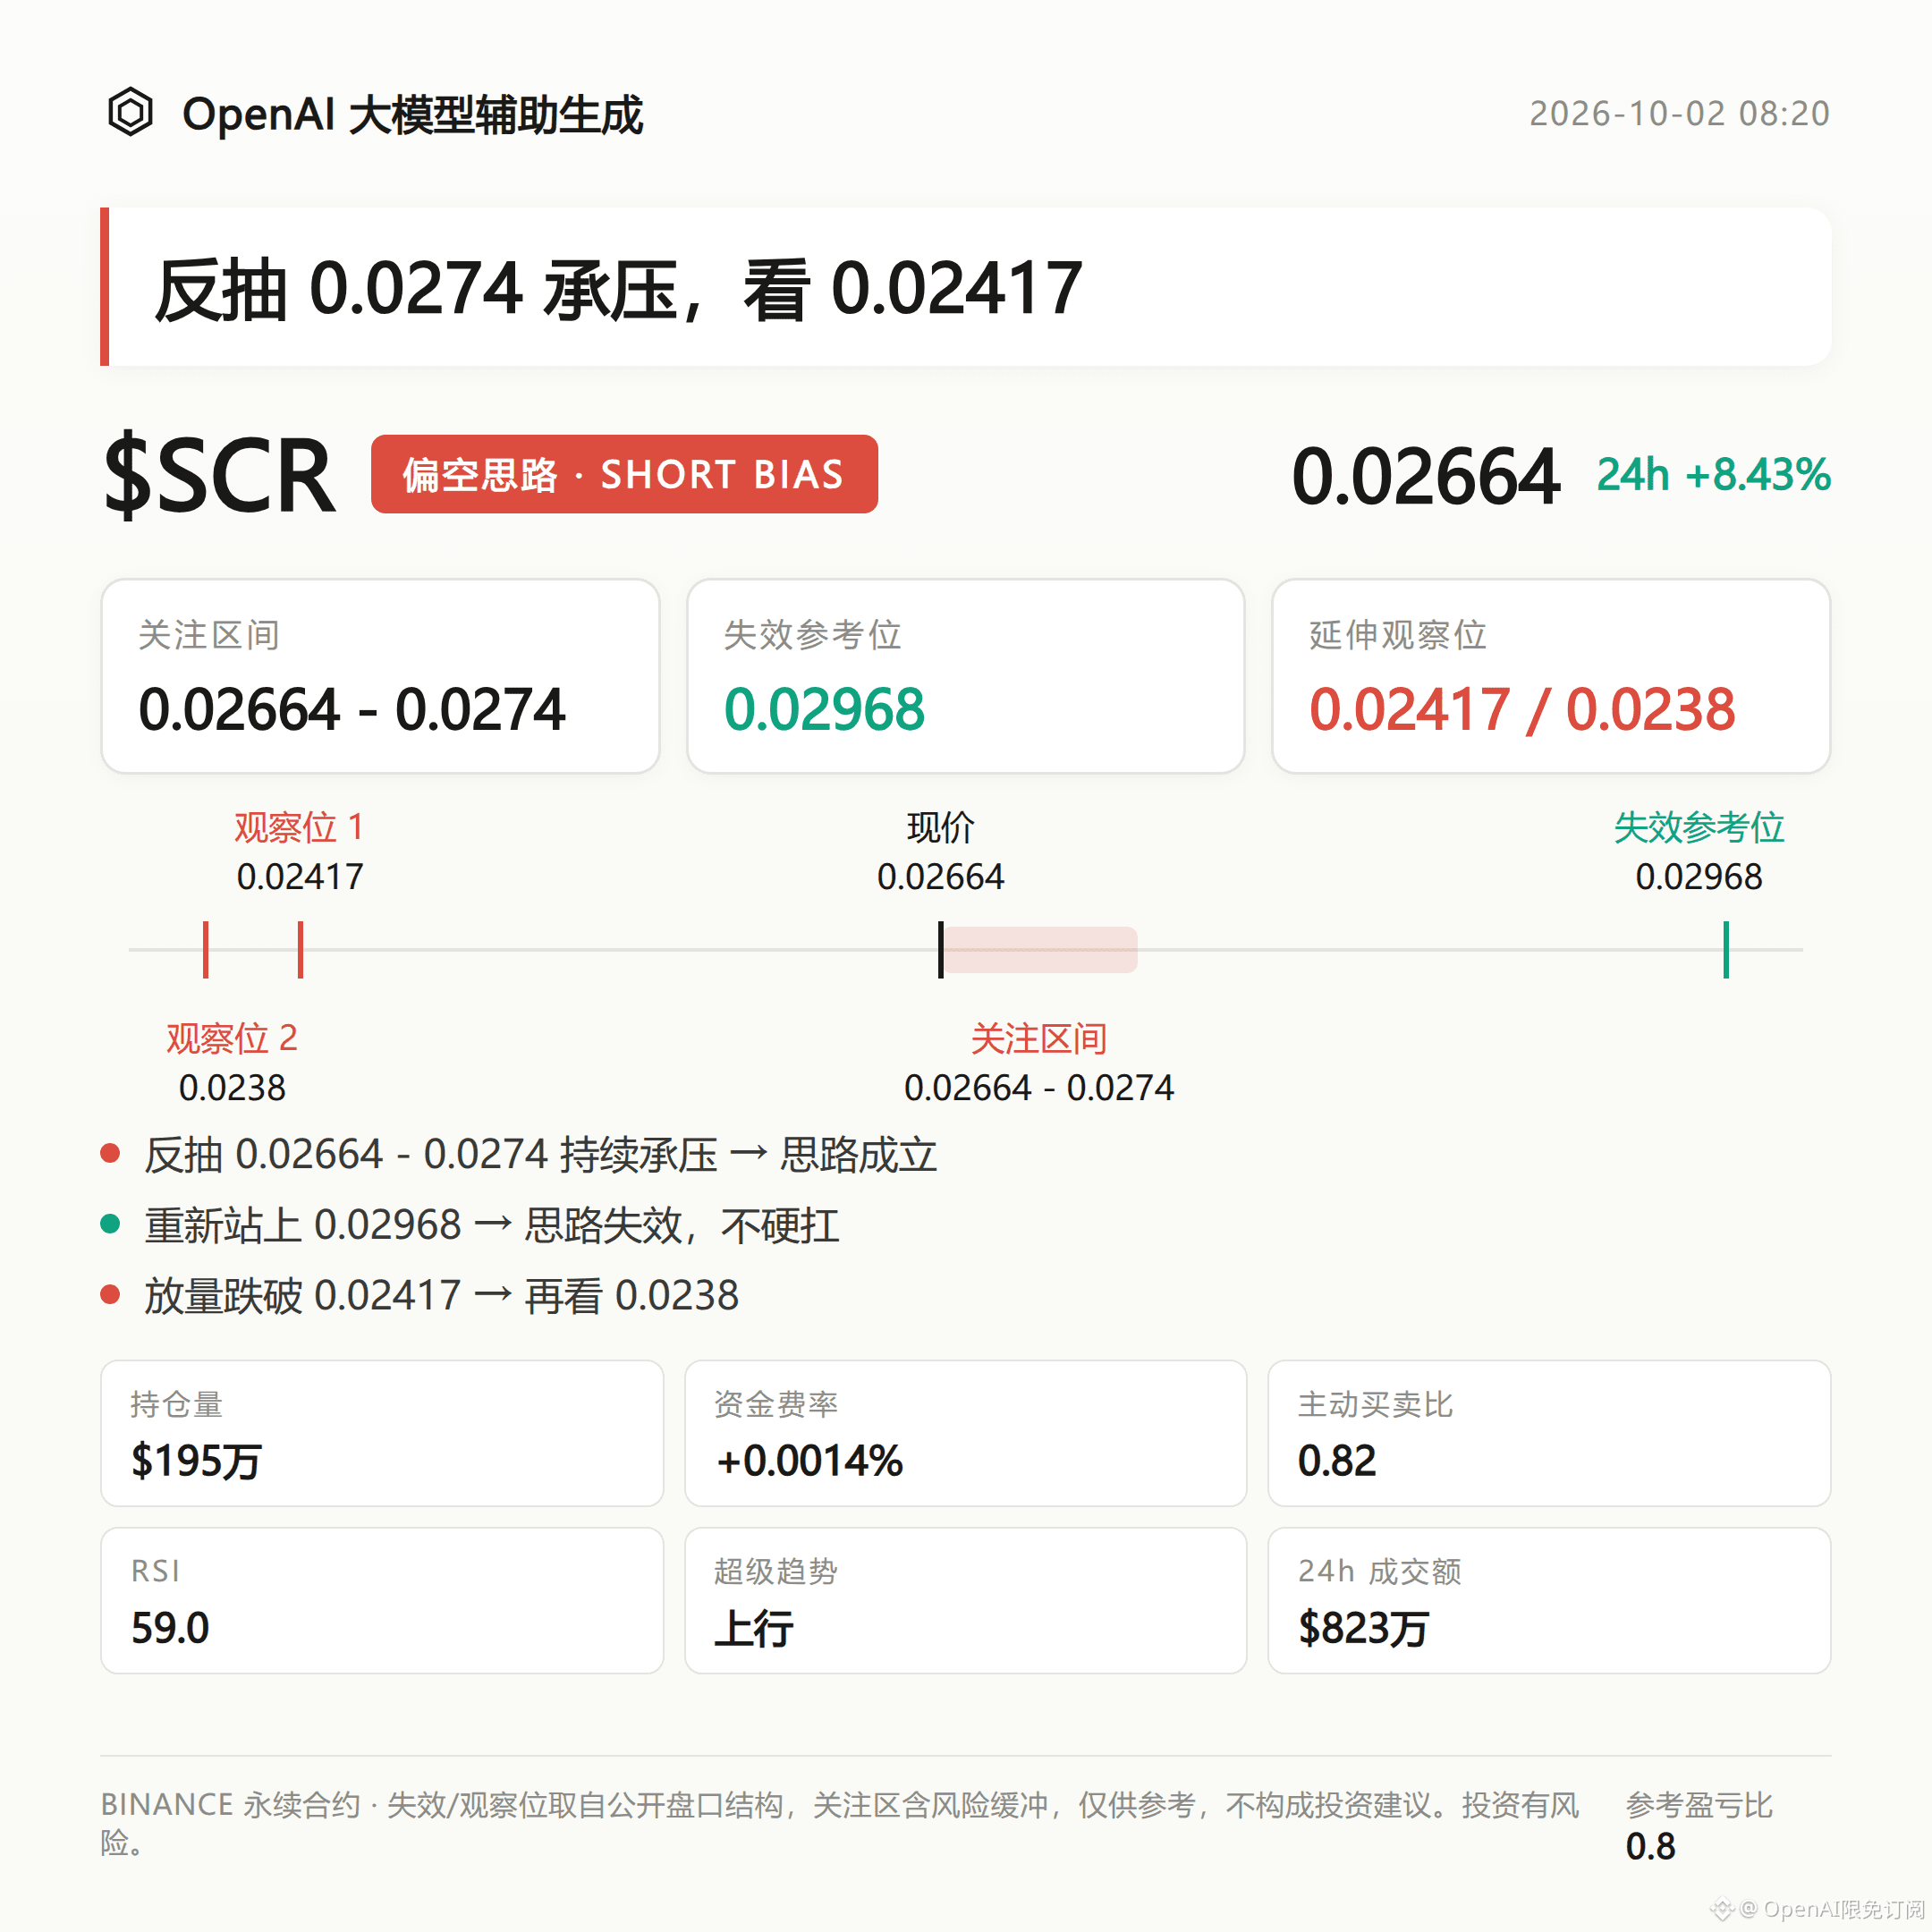
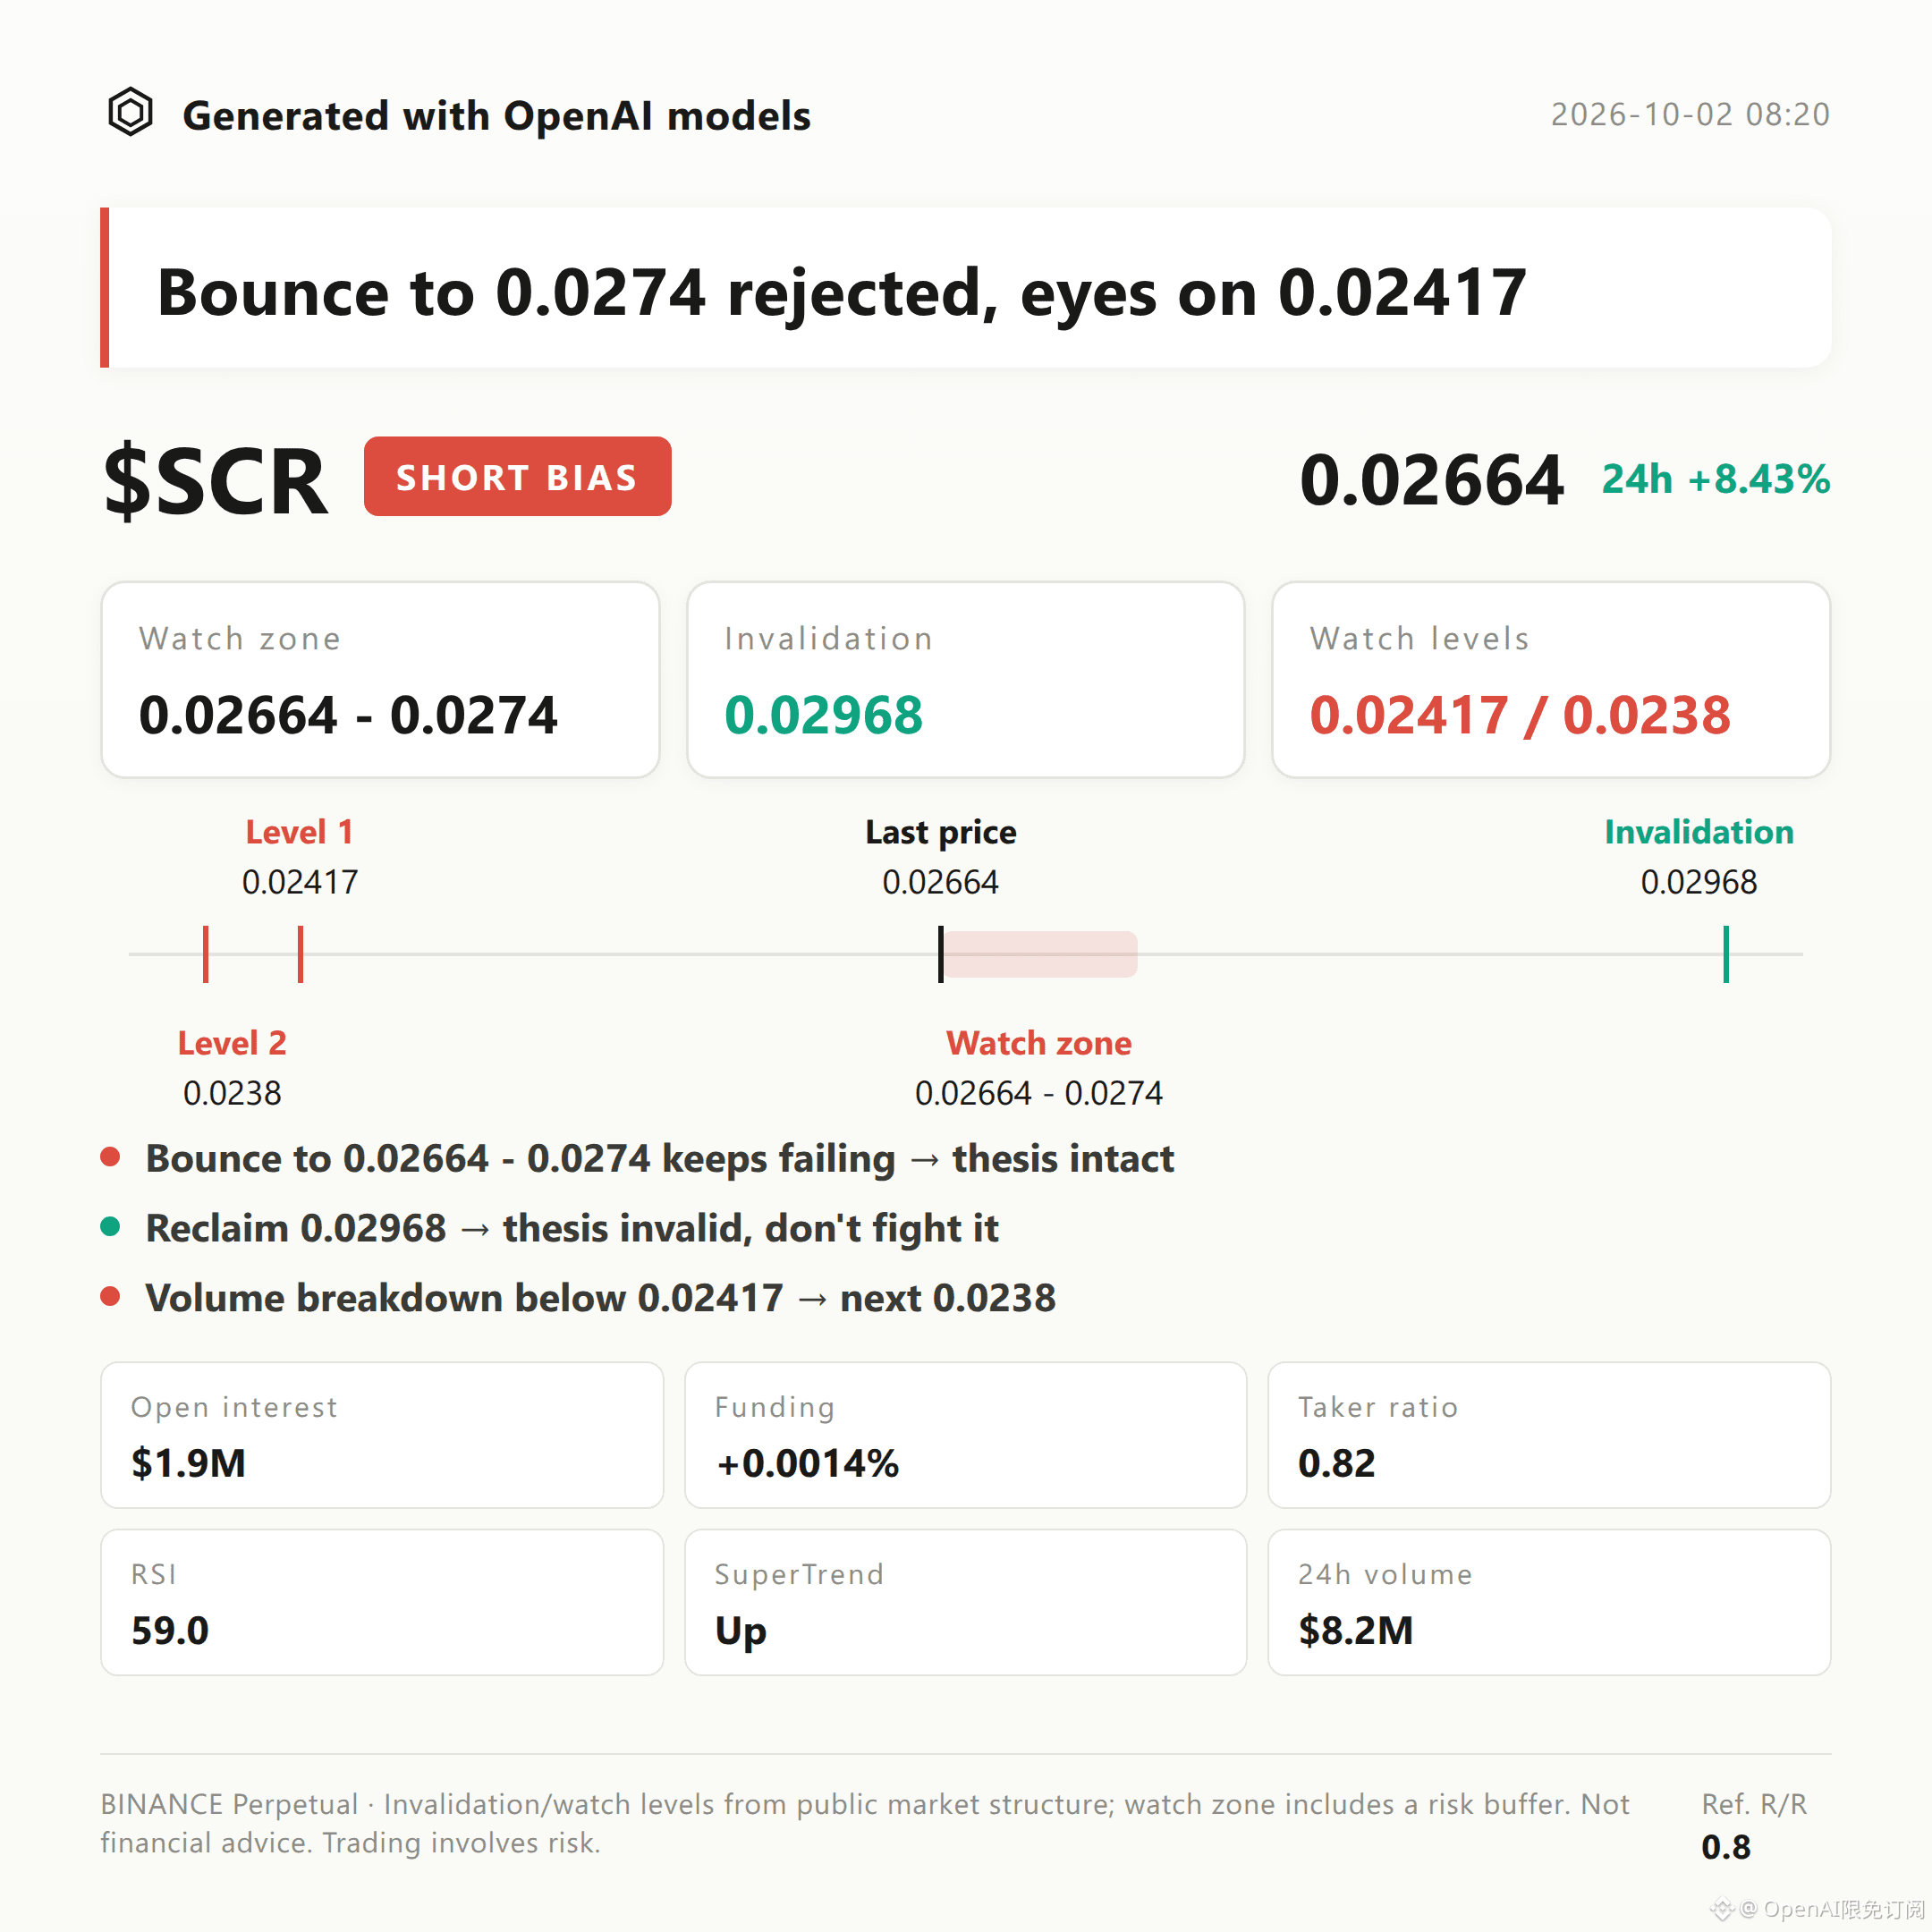
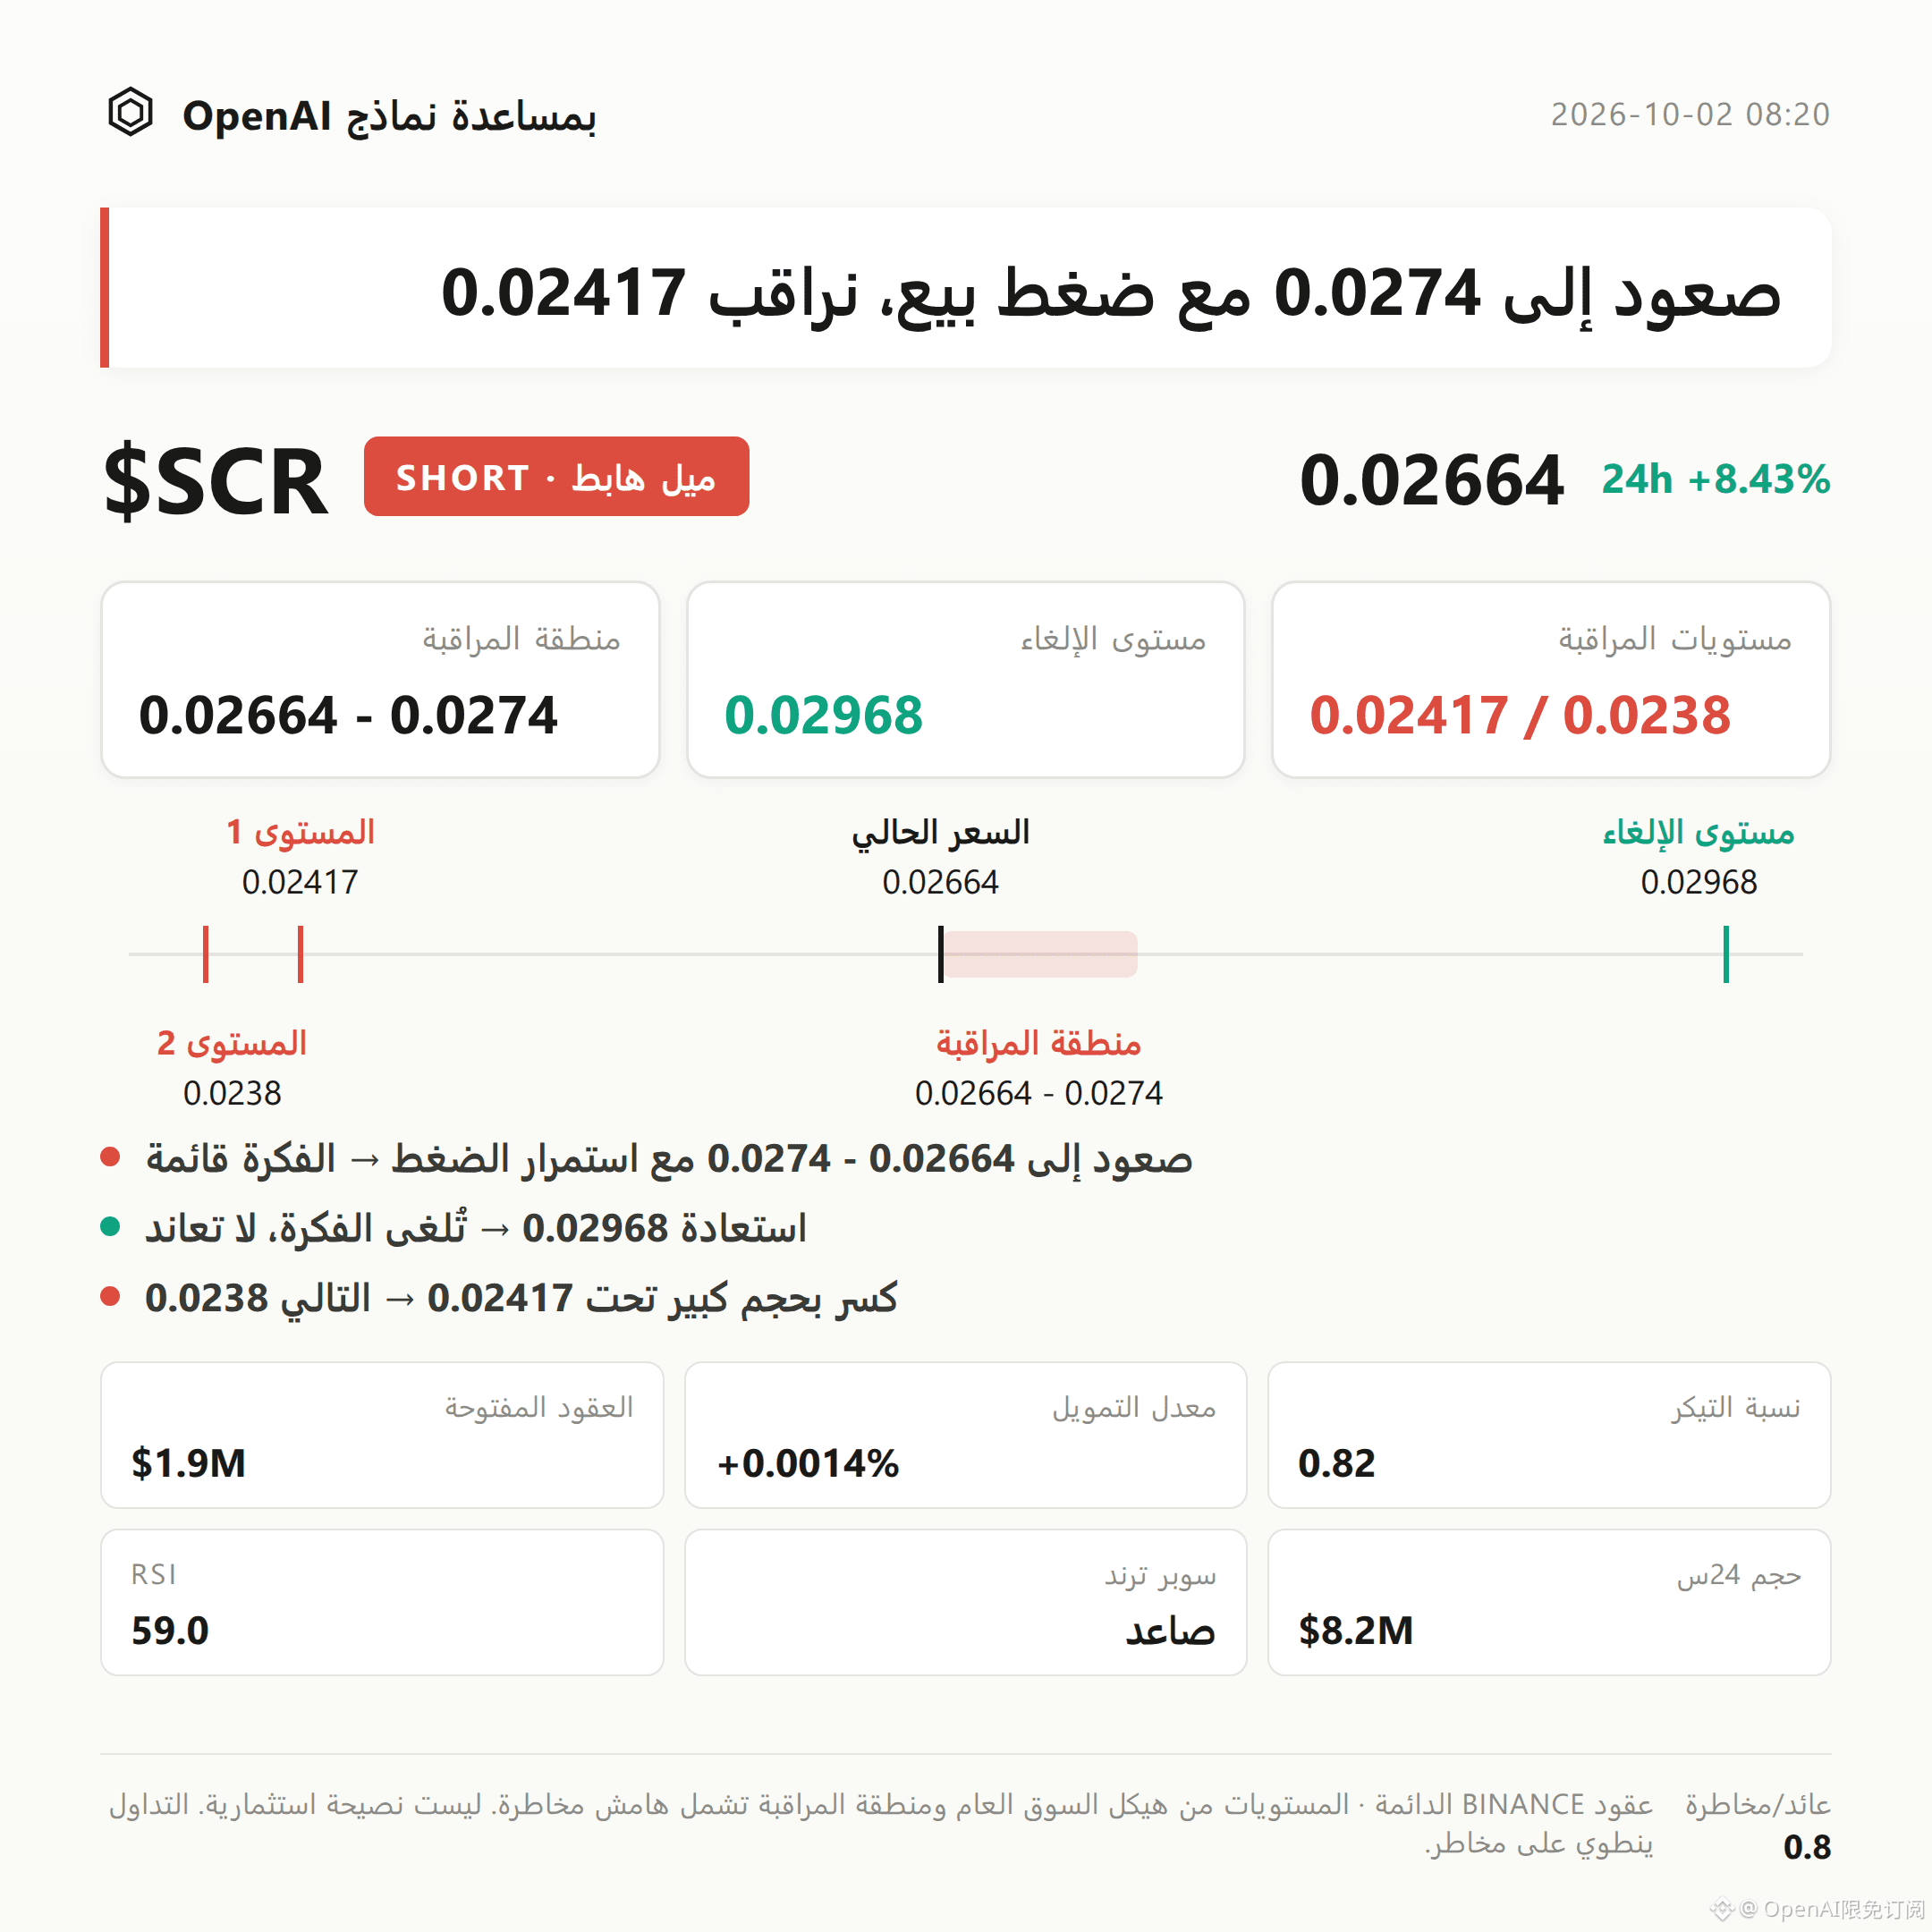
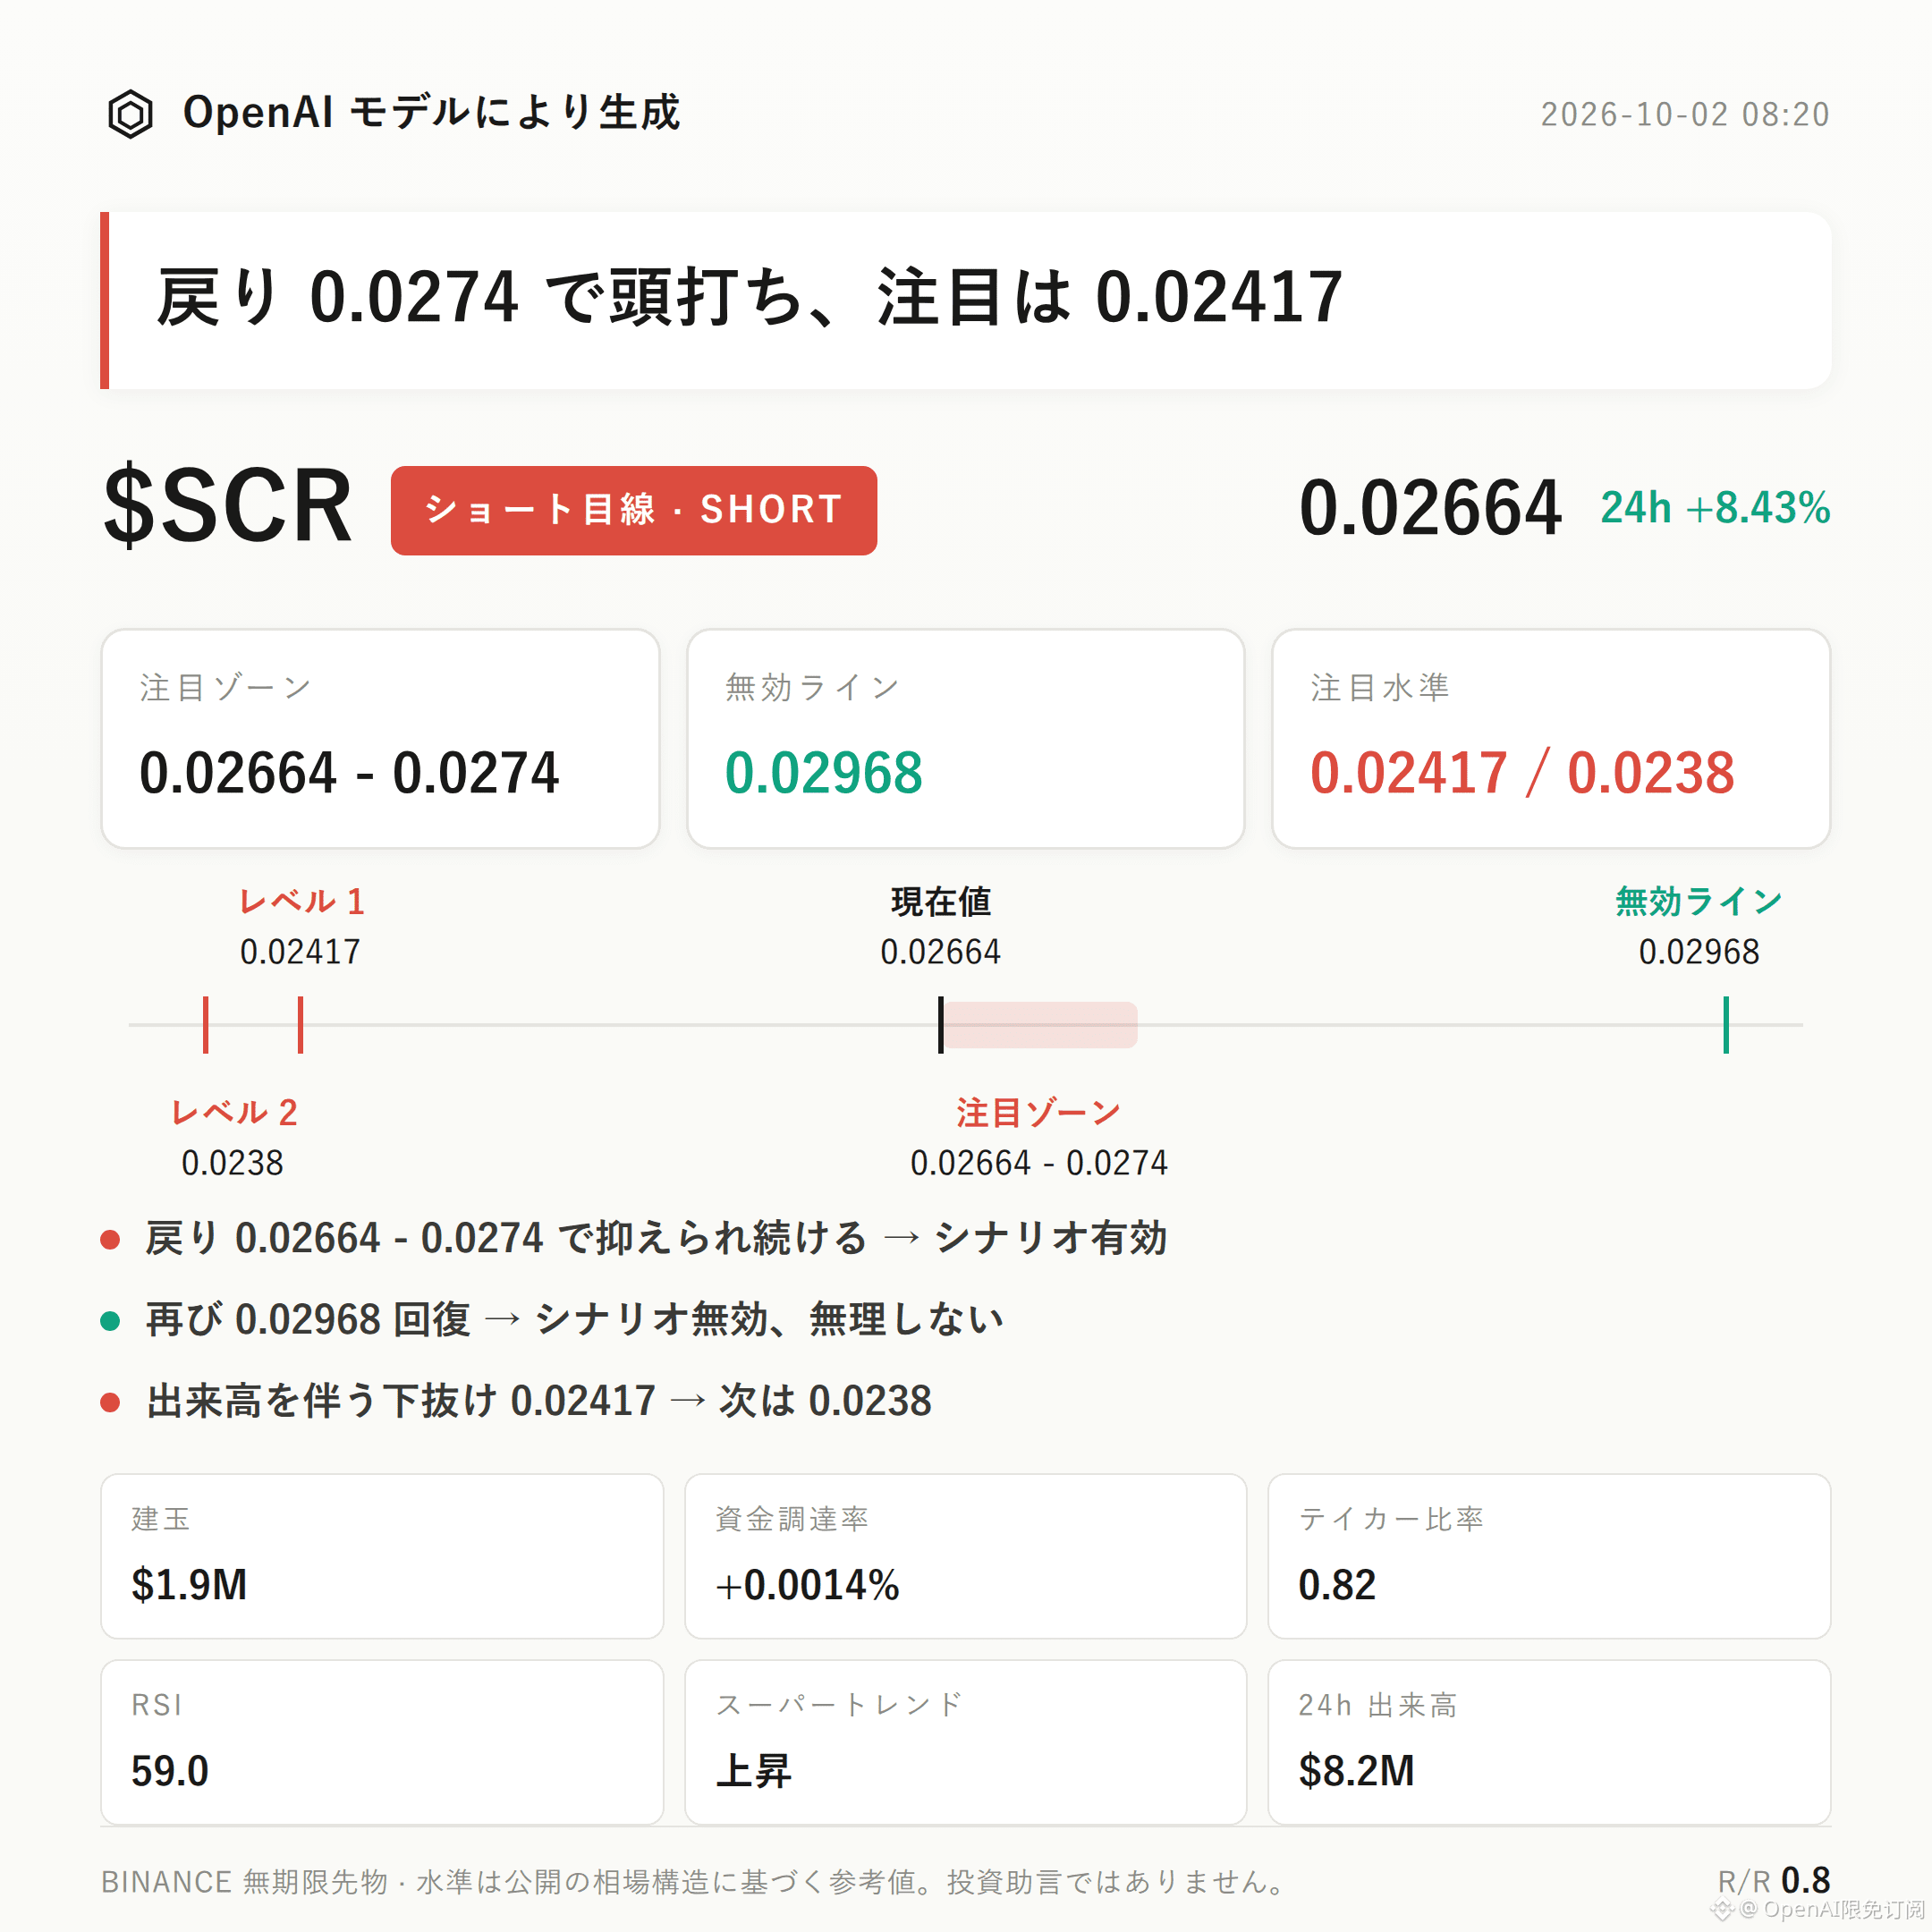
$SCR bearish-leaning strategy | Focus range 0.02664 - 0.0274 | Invalidation reference 0.02968 | Observation levels 0.02417 / 0.0238
$SCR current structure is worth observing as a bearish-leaning setup.
The buy/sell ratio is only 0.82, open interest has increased by 15.2%, and the long account share has reached 76%. The main bearish basis is that crowded longs coincide with an advantage in active sell orders.
The key is to watch whether pullbacks can be suppressed in the resistance zone.
Technicals are not uniformly bearish: the current price is still above the Bollinger midline at 0.0256. The Super Trend is rising, RSI is 59.0, and MACD still maintains bullish momentum.
The upper Bollinger band at 0.0274 and the recent high at 0.02968 form the resistance reference. Below, watch the recent low at 0.02417 and then the lower Bollinger band at 0.0238.
These bullish indicators are must-consider contrary evidence, so the bearish call still requires price confirmation.
The 24-hour gain is 8.43%, with trading volume of $8.23M. Open interest is $1.95M and has increased 15.2% in 24 hours.
Funding rate is +0.0014%; long account share is 76%. However, the active buy/sell ratio is only 0.82, indicating that during the price rise and the expansion of positions, active sell pressure still has the upper hand.
If high-level support fails and turns weaker, crowded longs may amplify the magnitude of pullback volatility.
For the short side, first focus on the bearish zone 0.02664 - 0.0274; it’s more suitable to wait for confirmation after a pullback meets resistance.
If, when price retests this focus range, only brief support appears and the price is then pressured again, the bearish idea holds.
If the invalidation reference level 0.02968 is triggered, it means the current pullback structure is broken—the idea is invalid; don’t linger.
If price breaks below the observation level 0.02417 with increased volume, then look for support near 0.0238.
At present, there are no clear reversal signals. But the Super Trend is still rising and MACD’s bullish momentum remains, and the reference risk-reward ratio is only 0.8—structural advantage is not strong enough.
Leverage in the contract itself is the risk. Position discipline matters more than directional judgment.
For reference only and does not constitute investment advice. Contracts have leverage; investing involves risk.
This article was generated with the assistance of an OpenAI large model.
$SCR and #contract analysis
Trading Idea|10/2 08:20
$SCR bearish-leaning strategy | Focus range 0.02664 - 0.0274 | Invalidation reference 0.02968 | Observation levels 0.02417 / 0.0238
$SCR current structure is worth observing as a bearish-leaning setup.
The buy/sell ratio is only 0.82, open interest has increased by 15.2%, and the long account share has reached 76%. The main bearish basis is that crowded longs coincide with an advantage in active sell orders.
The key is to watch whether pullbacks can be suppressed in the resistance zone.
Technicals are not uniformly bearish: the current price is still above the Bollinger midline at 0.0256. The Super Trend is rising, RSI is 59.0, and MACD still maintains bullish momentum.
The upper Bollinger band at 0.0274 and the recent high at 0.02968 form the resistance reference. Below, watch the recent low at 0.02417 and then the lower Bollinger band at 0.0238.
These bullish indicators are must-consider contrary evidence, so the bearish call still requires price confirmation.
The 24-hour gain is 8.43%, with trading volume of $8.23M. Open interest is $1.95M and has increased 15.2% in 24 hours.
Funding rate is +0.0014%; long account share is 76%. However, the active buy/sell ratio is only 0.82, indicating that during the price rise and the expansion of positions, active sell pressure still has the upper hand.
If high-level support fails and turns weaker, crowded longs may amplify the magnitude of pullback volatility.
For the short side, first focus on the bearish zone 0.02664 - 0.0274; it’s more suitable to wait for confirmation after a pullback meets resistance.
If, when price retests this focus range, only brief support appears and the price is then pressured again, the bearish idea holds.
If the invalidation reference level 0.02968 is triggered, it means the current pullback structure is broken—the idea is invalid; don’t linger.
If price breaks below the observation level 0.02417 with increased volume, then look for support near 0.0238.
At present, there are no clear reversal signals. But the Super Trend is still rising and MACD’s bullish momentum remains, and the reference risk-reward ratio is only 0.8—structural advantage is not strong enough.
Leverage in the contract itself is the risk. Position discipline matters more than directional judgment.
For reference only and does not constitute investment advice. Contracts have leverage; investing involves risk.
This article was generated with the assistance of an OpenAI large model.
$SCR and #contract analysis
$SCR bearish-leaning strategy | Focus range 0.02664 - 0.0274 | Invalidation reference 0.02968 | Observation levels 0.02417 / 0.0238
$SCR current structure is worth observing as a bearish-leaning setup.
The buy/sell ratio is only 0.82, open interest has increased by 15.2%, and the long account share has reached 76%. The main bearish basis is that crowded longs coincide with an advantage in active sell orders.
The key is to watch whether pullbacks can be suppressed in the resistance zone.
Technicals are not uniformly bearish: the current price is still above the Bollinger midline at 0.0256. The Super Trend is rising, RSI is 59.0, and MACD still maintains bullish momentum.
The upper Bollinger band at 0.0274 and the recent high at 0.02968 form the resistance reference. Below, watch the recent low at 0.02417 and then the lower Bollinger band at 0.0238.
These bullish indicators are must-consider contrary evidence, so the bearish call still requires price confirmation.
The 24-hour gain is 8.43%, with trading volume of $8.23M. Open interest is $1.95M and has increased 15.2% in 24 hours.
Funding rate is +0.0014%; long account share is 76%. However, the active buy/sell ratio is only 0.82, indicating that during the price rise and the expansion of positions, active sell pressure still has the upper hand.
If high-level support fails and turns weaker, crowded longs may amplify the magnitude of pullback volatility.
For the short side, first focus on the bearish zone 0.02664 - 0.0274; it’s more suitable to wait for confirmation after a pullback meets resistance.
If, when price retests this focus range, only brief support appears and the price is then pressured again, the bearish idea holds.
If the invalidation reference level 0.02968 is triggered, it means the current pullback structure is broken—the idea is invalid; don’t linger.
If price breaks below the observation level 0.02417 with increased volume, then look for support near 0.0238.
At present, there are no clear reversal signals. But the Super Trend is still rising and MACD’s bullish momentum remains, and the reference risk-reward ratio is only 0.8—structural advantage is not strong enough.
Leverage in the contract itself is the risk. Position discipline matters more than directional judgment.
For reference only and does not constitute investment advice. Contracts have leverage; investing involves risk.
This article was generated with the assistance of an OpenAI large model.
$SCR and #contract analysis
59
·
--
Trading Thesis|10/2 07:20
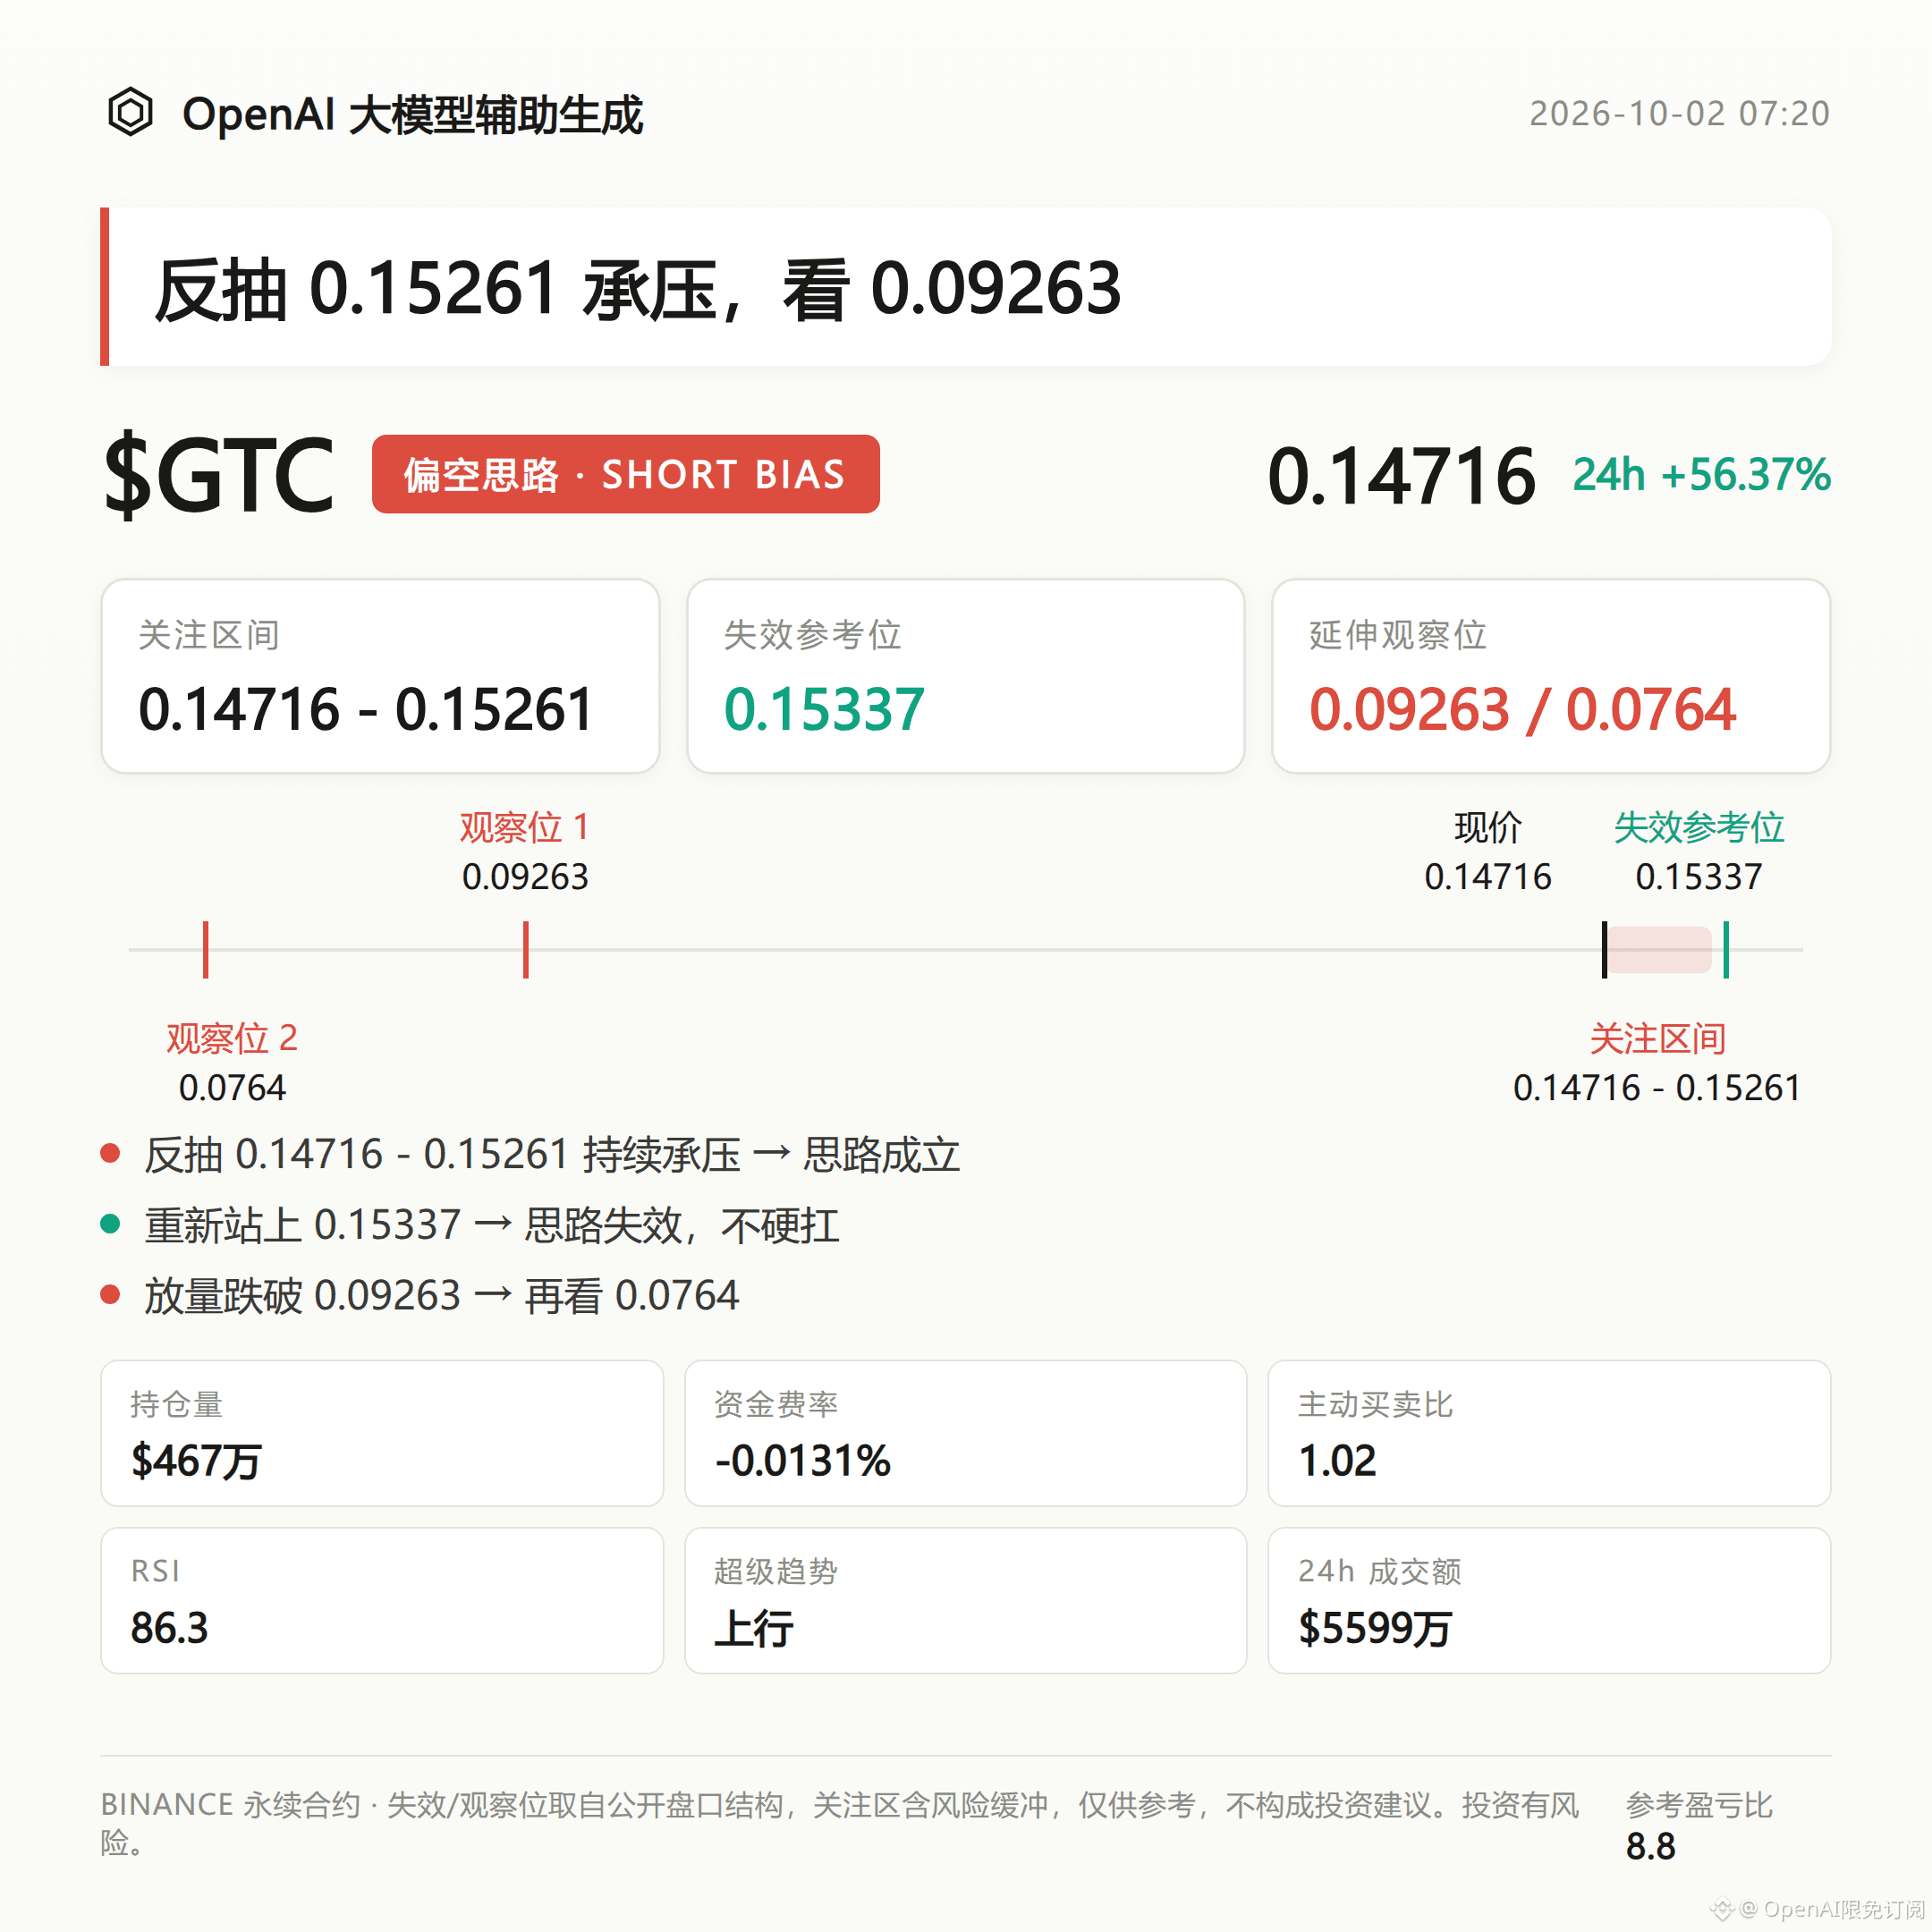
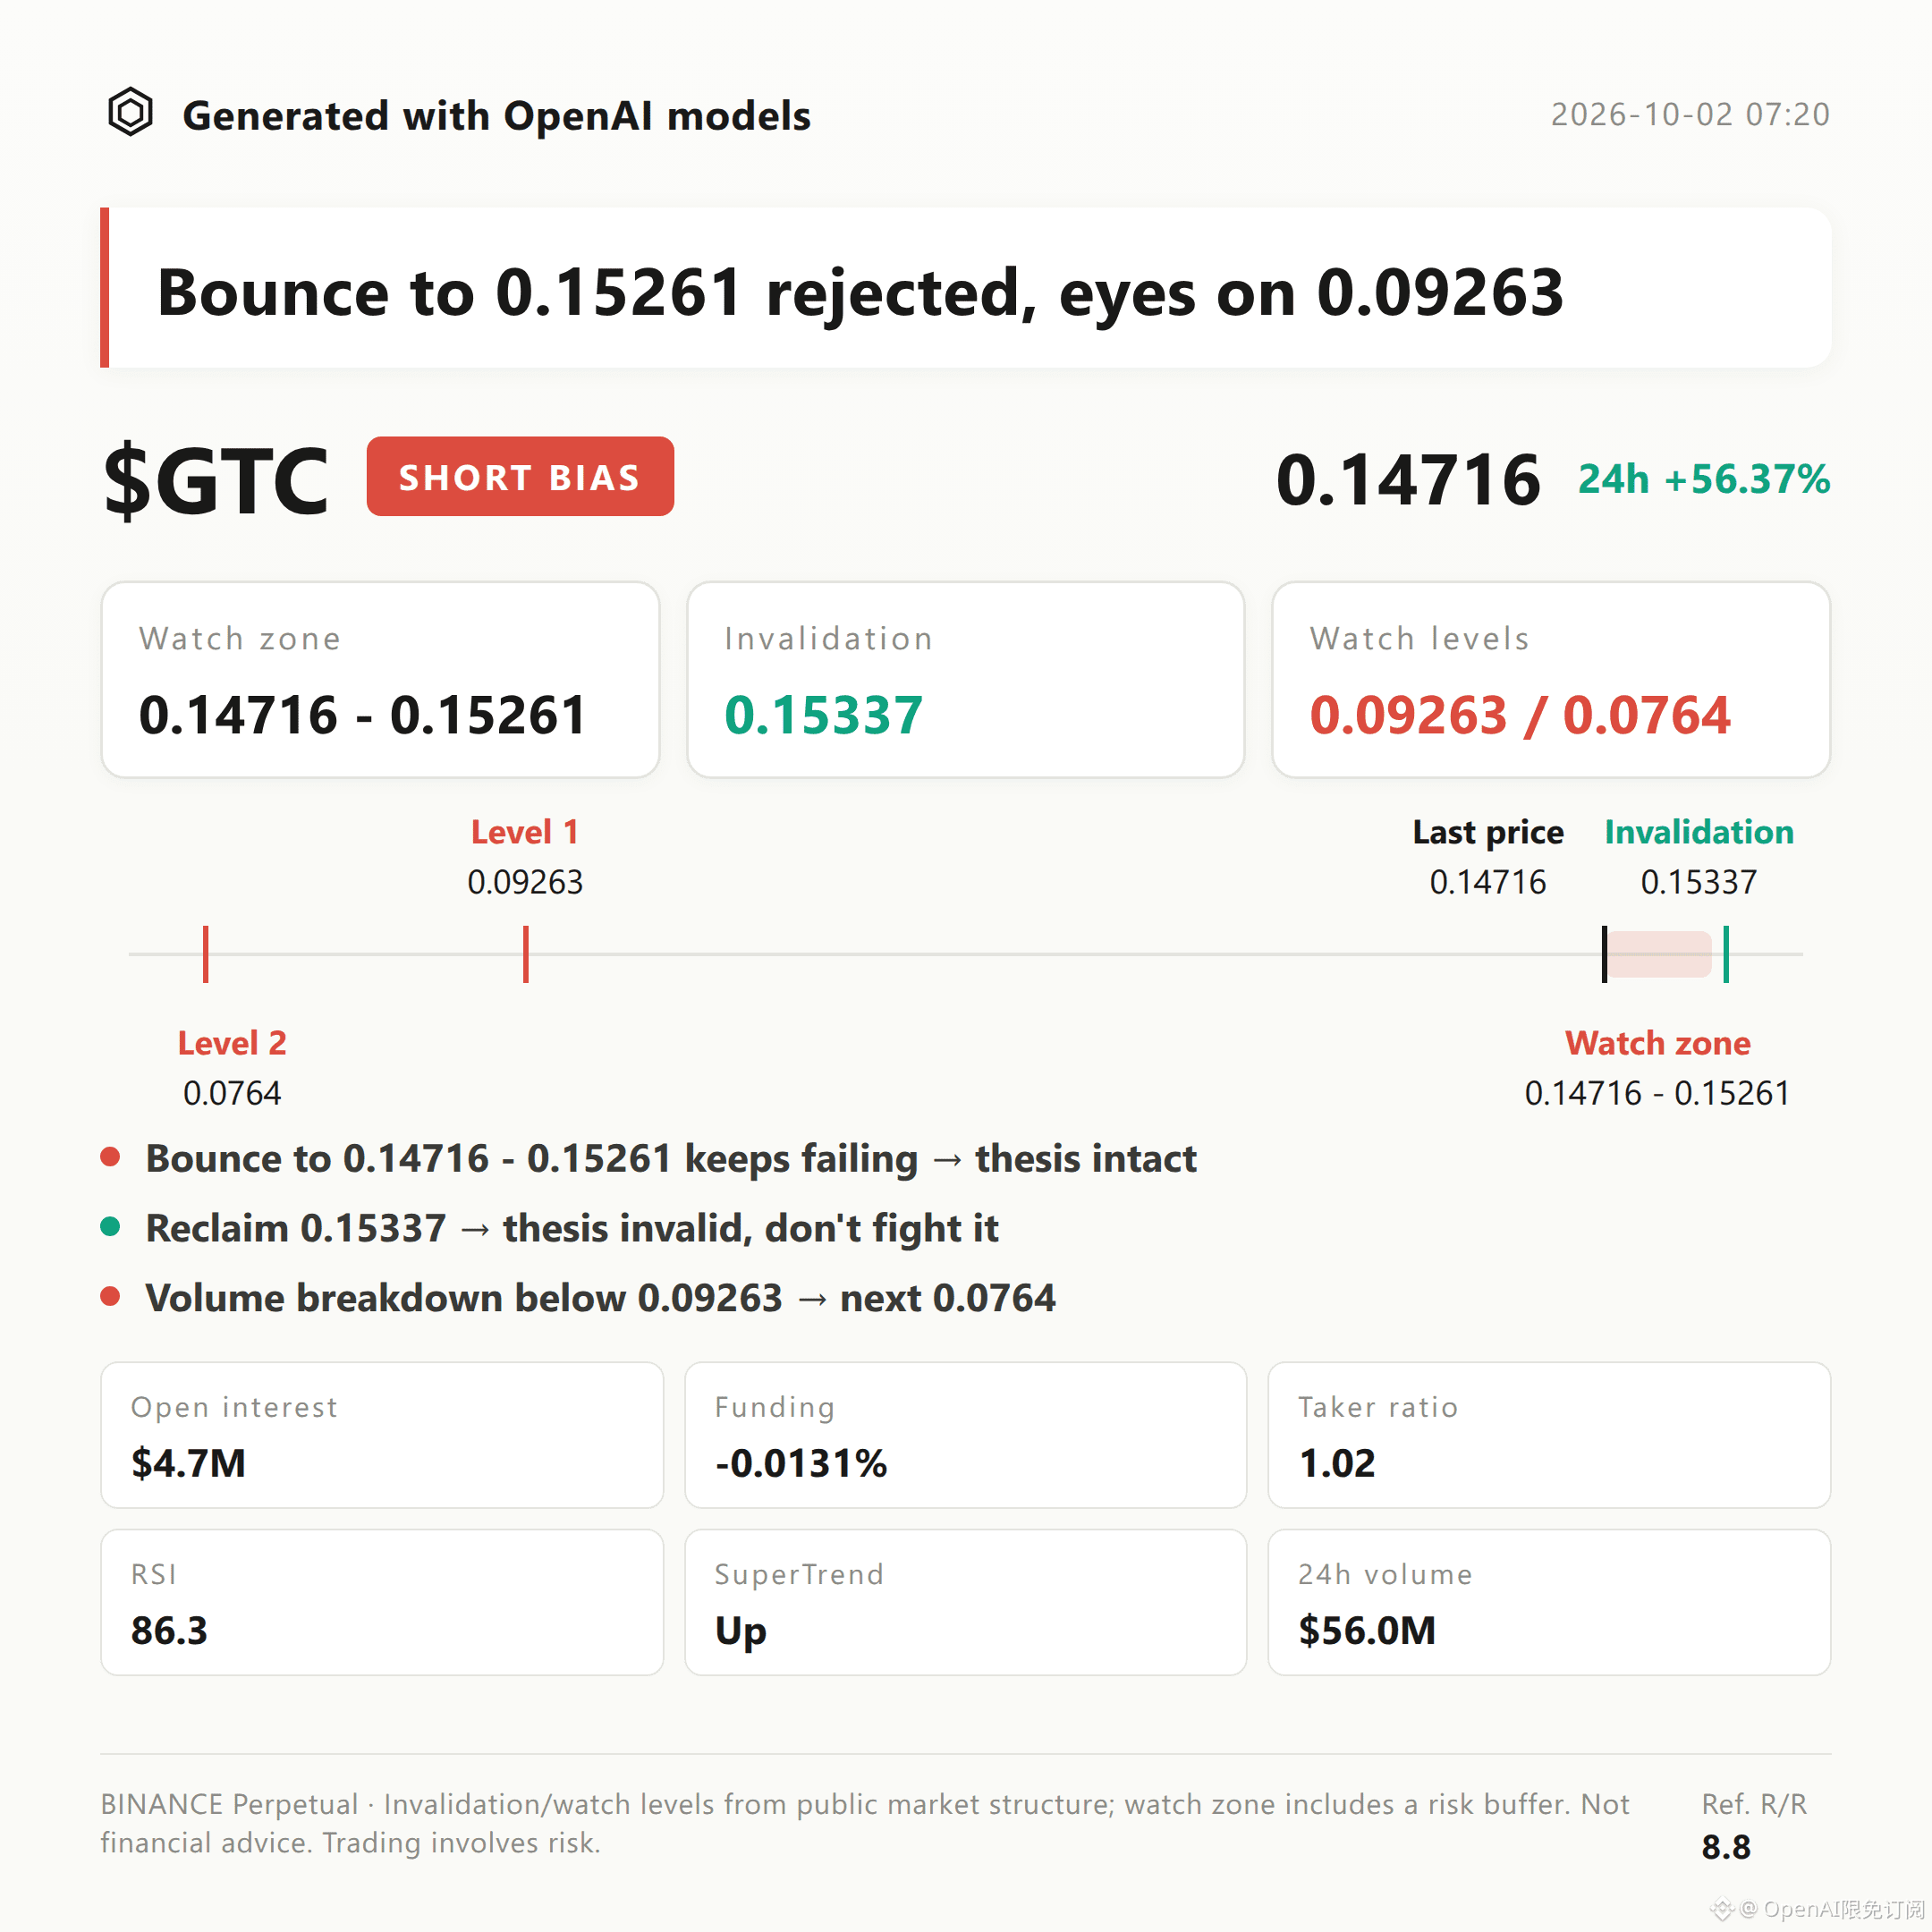
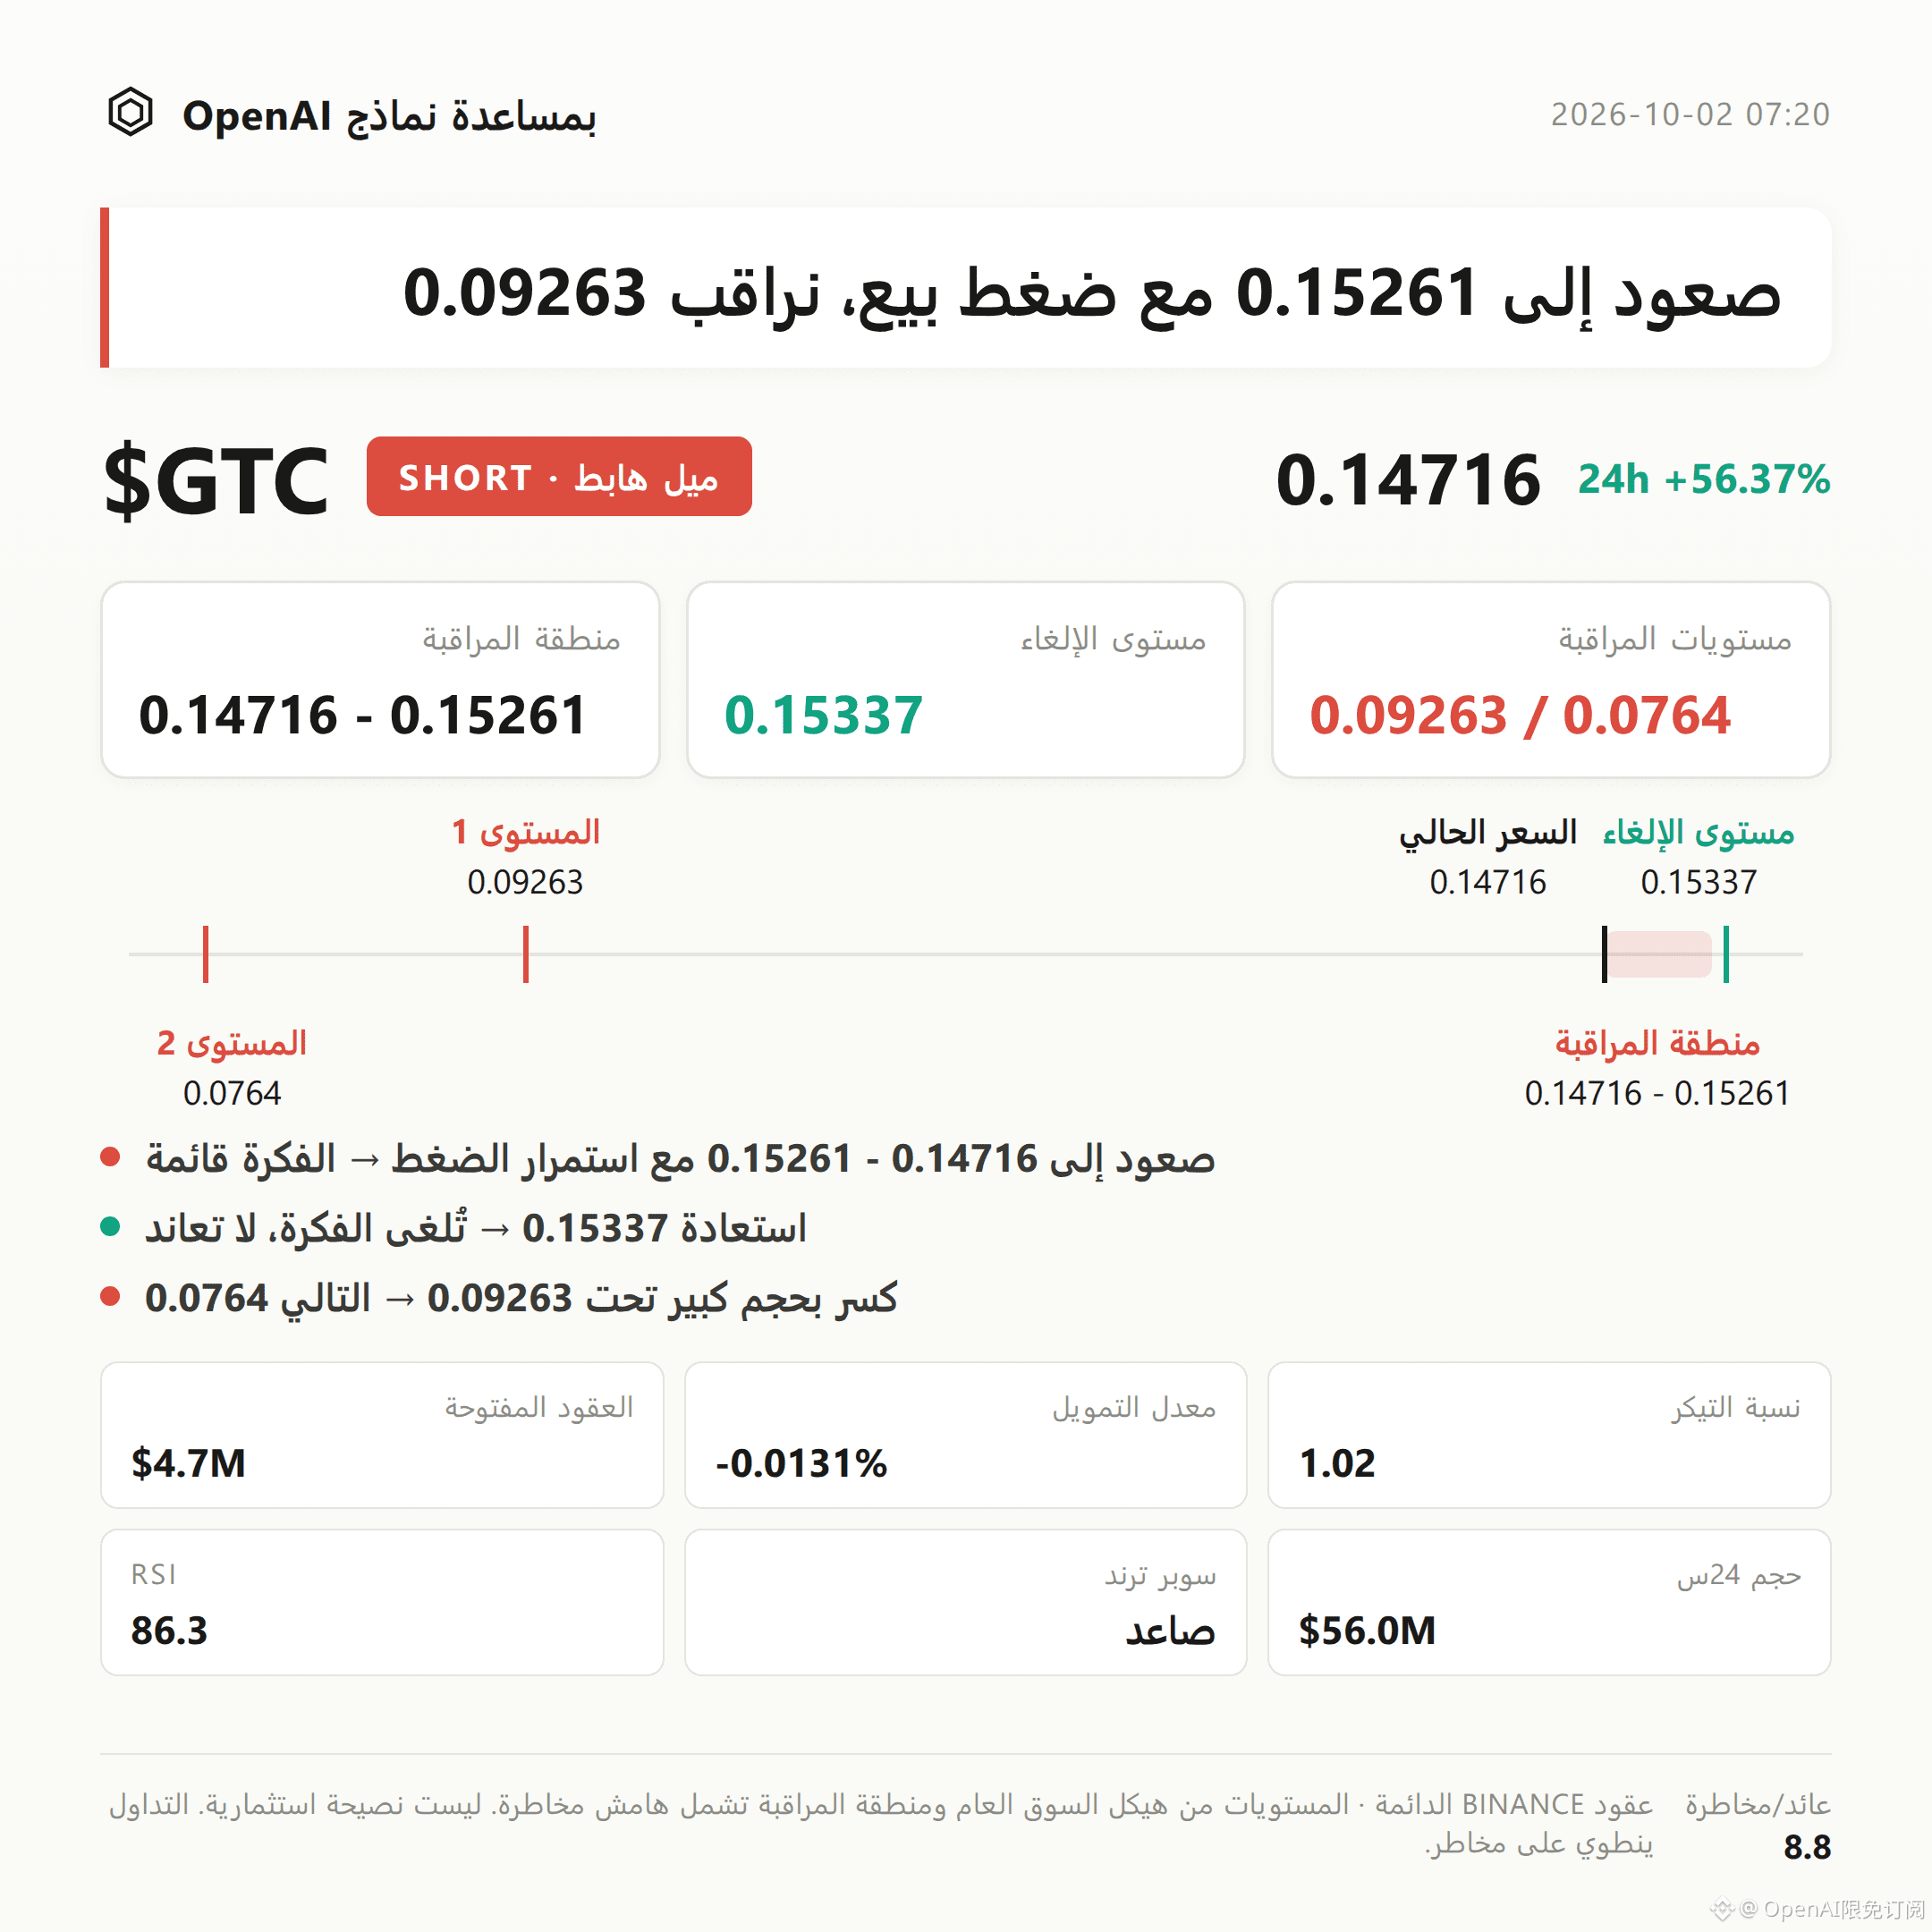
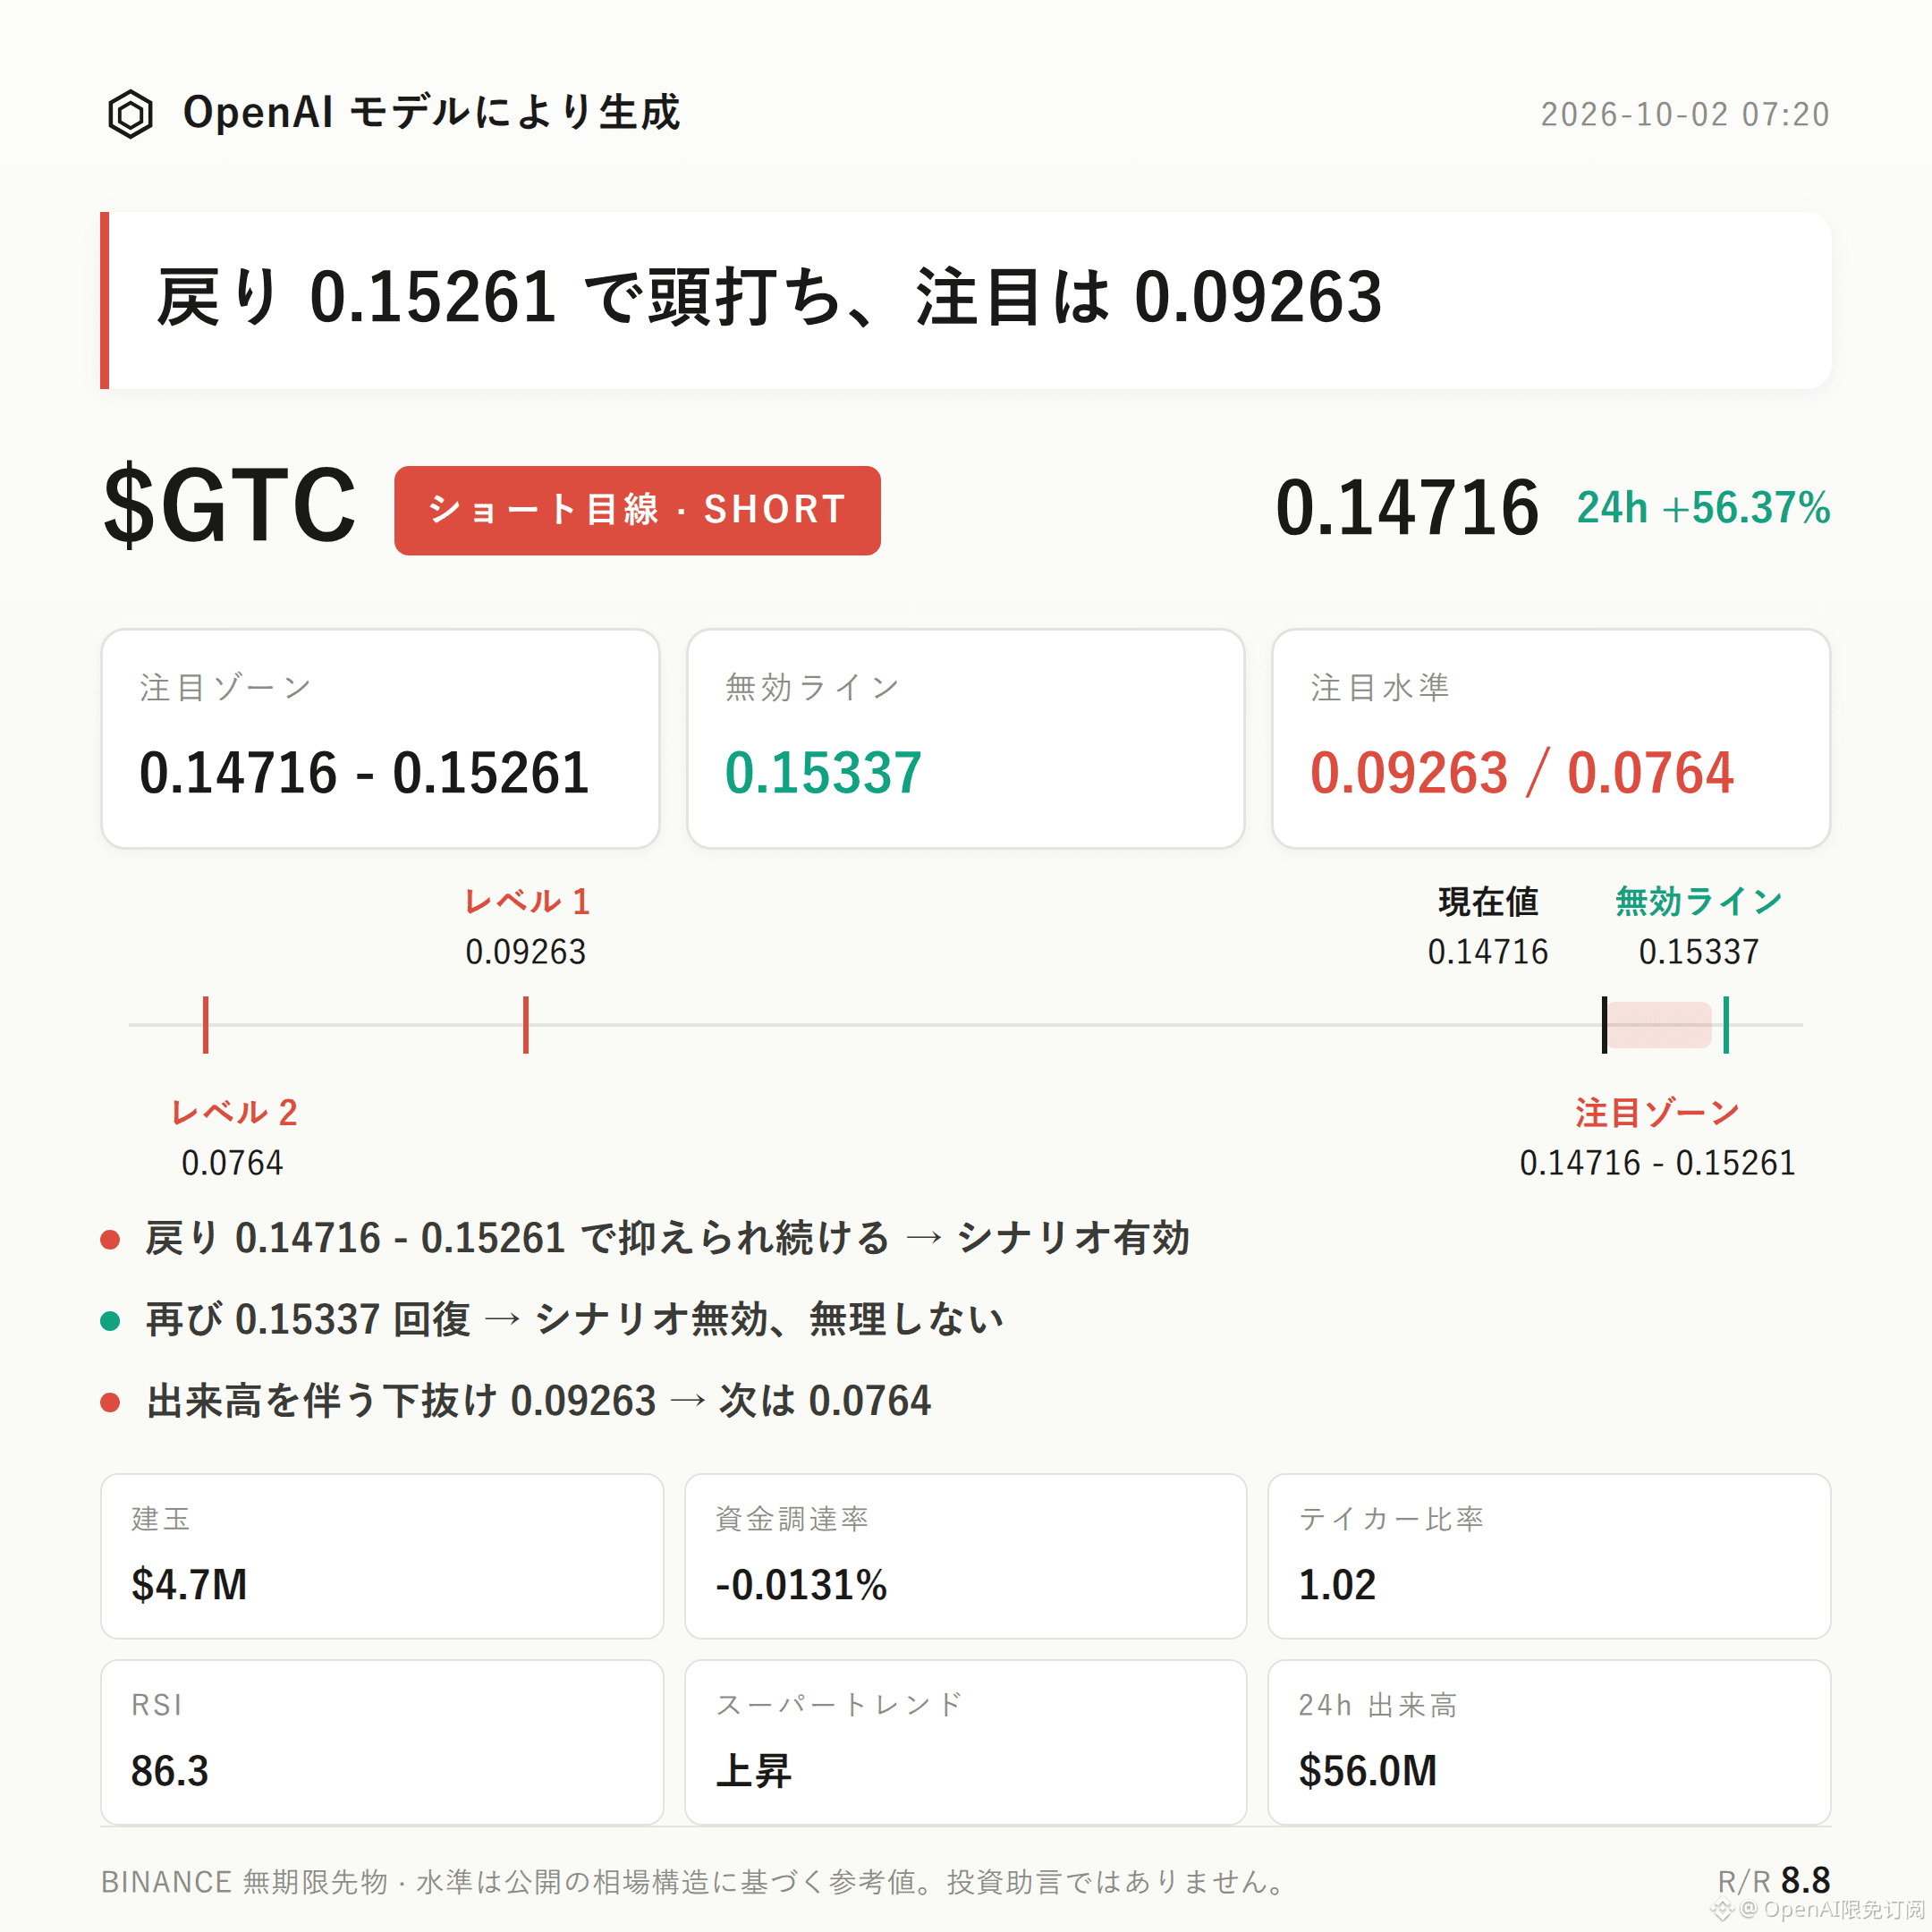
$GTC Bearish Bias | Watch Range 0.14716 - 0.15261 | Invalid Reference 0.15337 | Observation Levels 0.09263 / 0.0764
$GTC The current structure is moving in a bearish direction.
In the past 24 hours, price has risen 56.37%, open interest has increased 65.8%, and RSI is at 86.3—short-term overheating and crowded conditions are the key basis.
Focus on whether the pullback can be held down in the resistance zone, to validate the declining structure.
Current price 0.14716 is above the upper Bollinger Band 0.1431 and close to the recent high 0.15337, indicating a relatively clear price expansion.
RSI at 86.3 signals a risk of a hot-to-cool pullback.
However, MACD is still bullish momentum, and the Supertrend remains upward—this is the counter-evidence that the bearish call must face.
In the past 24 hours, trading volume is $55.99 million, and open interest is $4.67 million. Open interest also increased in step by 65.8%, suggesting that when volatility expands, leveraged funds are clearly accumulating.
Long-account ratio is 60%, funding rate is -0.0131%, and the buy/sell ratio is 1.02. The data has not formed a fully consistent one-way resonance, so confirmation from price action is still required.
For shorts, focus first on the bearish zone 0.14716 - 0.15261; it is more suitable to wait for confirmation after a pullback meets resistance.
If price pulls back into this range and gets pressed down, the bearish thesis is validated; if price reclaims the invalid reference level 0.15337, it means the current pullback structure has been broken and the bearish thesis is invalid—don’t get stubborn.
For downside extensions, watch 0.09263; if it breaks down on increased volume, then look for support around 0.0764.
The reference risk-reward ratio is 8.8, but it still depends on whether the conditions above are met sequentially.
Besides the bullish MACD momentum and Supertrend upward move, there are no significant reversal signals at present, but contract leverage itself is a risk.
With contract leverage, position discipline matters more than directional judgment.
For reference only; not investment advice. Contracts involve leverage; investing has risk.
This article was generated with assistance from an OpenAI large model.
$GTC # Contract Analysis
Trading Thesis|10/2 07:20
$GTC Bearish Bias | Watch Range 0.14716 - 0.15261 | Invalid Reference 0.15337 | Observation Levels 0.09263 / 0.0764
$GTC The current structure is moving in a bearish direction.
In the past 24 hours, price has risen 56.37%, open interest has increased 65.8%, and RSI is at 86.3—short-term overheating and crowded conditions are the key basis.
Focus on whether the pullback can be held down in the resistance zone, to validate the declining structure.
Current price 0.14716 is above the upper Bollinger Band 0.1431 and close to the recent high 0.15337, indicating a relatively clear price expansion.
RSI at 86.3 signals a risk of a hot-to-cool pullback.
However, MACD is still bullish momentum, and the Supertrend remains upward—this is the counter-evidence that the bearish call must face.
In the past 24 hours, trading volume is $55.99 million, and open interest is $4.67 million. Open interest also increased in step by 65.8%, suggesting that when volatility expands, leveraged funds are clearly accumulating.
Long-account ratio is 60%, funding rate is -0.0131%, and the buy/sell ratio is 1.02. The data has not formed a fully consistent one-way resonance, so confirmation from price action is still required.
For shorts, focus first on the bearish zone 0.14716 - 0.15261; it is more suitable to wait for confirmation after a pullback meets resistance.
If price pulls back into this range and gets pressed down, the bearish thesis is validated; if price reclaims the invalid reference level 0.15337, it means the current pullback structure has been broken and the bearish thesis is invalid—don’t get stubborn.
For downside extensions, watch 0.09263; if it breaks down on increased volume, then look for support around 0.0764.
The reference risk-reward ratio is 8.8, but it still depends on whether the conditions above are met sequentially.
Besides the bullish MACD momentum and Supertrend upward move, there are no significant reversal signals at present, but contract leverage itself is a risk.
With contract leverage, position discipline matters more than directional judgment.
For reference only; not investment advice. Contracts involve leverage; investing has risk.
This article was generated with assistance from an OpenAI large model.
$GTC # Contract Analysis
$GTC Bearish Bias | Watch Range 0.14716 - 0.15261 | Invalid Reference 0.15337 | Observation Levels 0.09263 / 0.0764
$GTC The current structure is moving in a bearish direction.
In the past 24 hours, price has risen 56.37%, open interest has increased 65.8%, and RSI is at 86.3—short-term overheating and crowded conditions are the key basis.
Focus on whether the pullback can be held down in the resistance zone, to validate the declining structure.
Current price 0.14716 is above the upper Bollinger Band 0.1431 and close to the recent high 0.15337, indicating a relatively clear price expansion.
RSI at 86.3 signals a risk of a hot-to-cool pullback.
However, MACD is still bullish momentum, and the Supertrend remains upward—this is the counter-evidence that the bearish call must face.
In the past 24 hours, trading volume is $55.99 million, and open interest is $4.67 million. Open interest also increased in step by 65.8%, suggesting that when volatility expands, leveraged funds are clearly accumulating.
Long-account ratio is 60%, funding rate is -0.0131%, and the buy/sell ratio is 1.02. The data has not formed a fully consistent one-way resonance, so confirmation from price action is still required.
For shorts, focus first on the bearish zone 0.14716 - 0.15261; it is more suitable to wait for confirmation after a pullback meets resistance.
If price pulls back into this range and gets pressed down, the bearish thesis is validated; if price reclaims the invalid reference level 0.15337, it means the current pullback structure has been broken and the bearish thesis is invalid—don’t get stubborn.
For downside extensions, watch 0.09263; if it breaks down on increased volume, then look for support around 0.0764.
The reference risk-reward ratio is 8.8, but it still depends on whether the conditions above are met sequentially.
Besides the bullish MACD momentum and Supertrend upward move, there are no significant reversal signals at present, but contract leverage itself is a risk.
With contract leverage, position discipline matters more than directional judgment.
For reference only; not investment advice. Contracts involve leverage; investing has risk.
This article was generated with assistance from an OpenAI large model.
$GTC # Contract Analysis
81
·
--
Trading Outlook|10/2 06:20
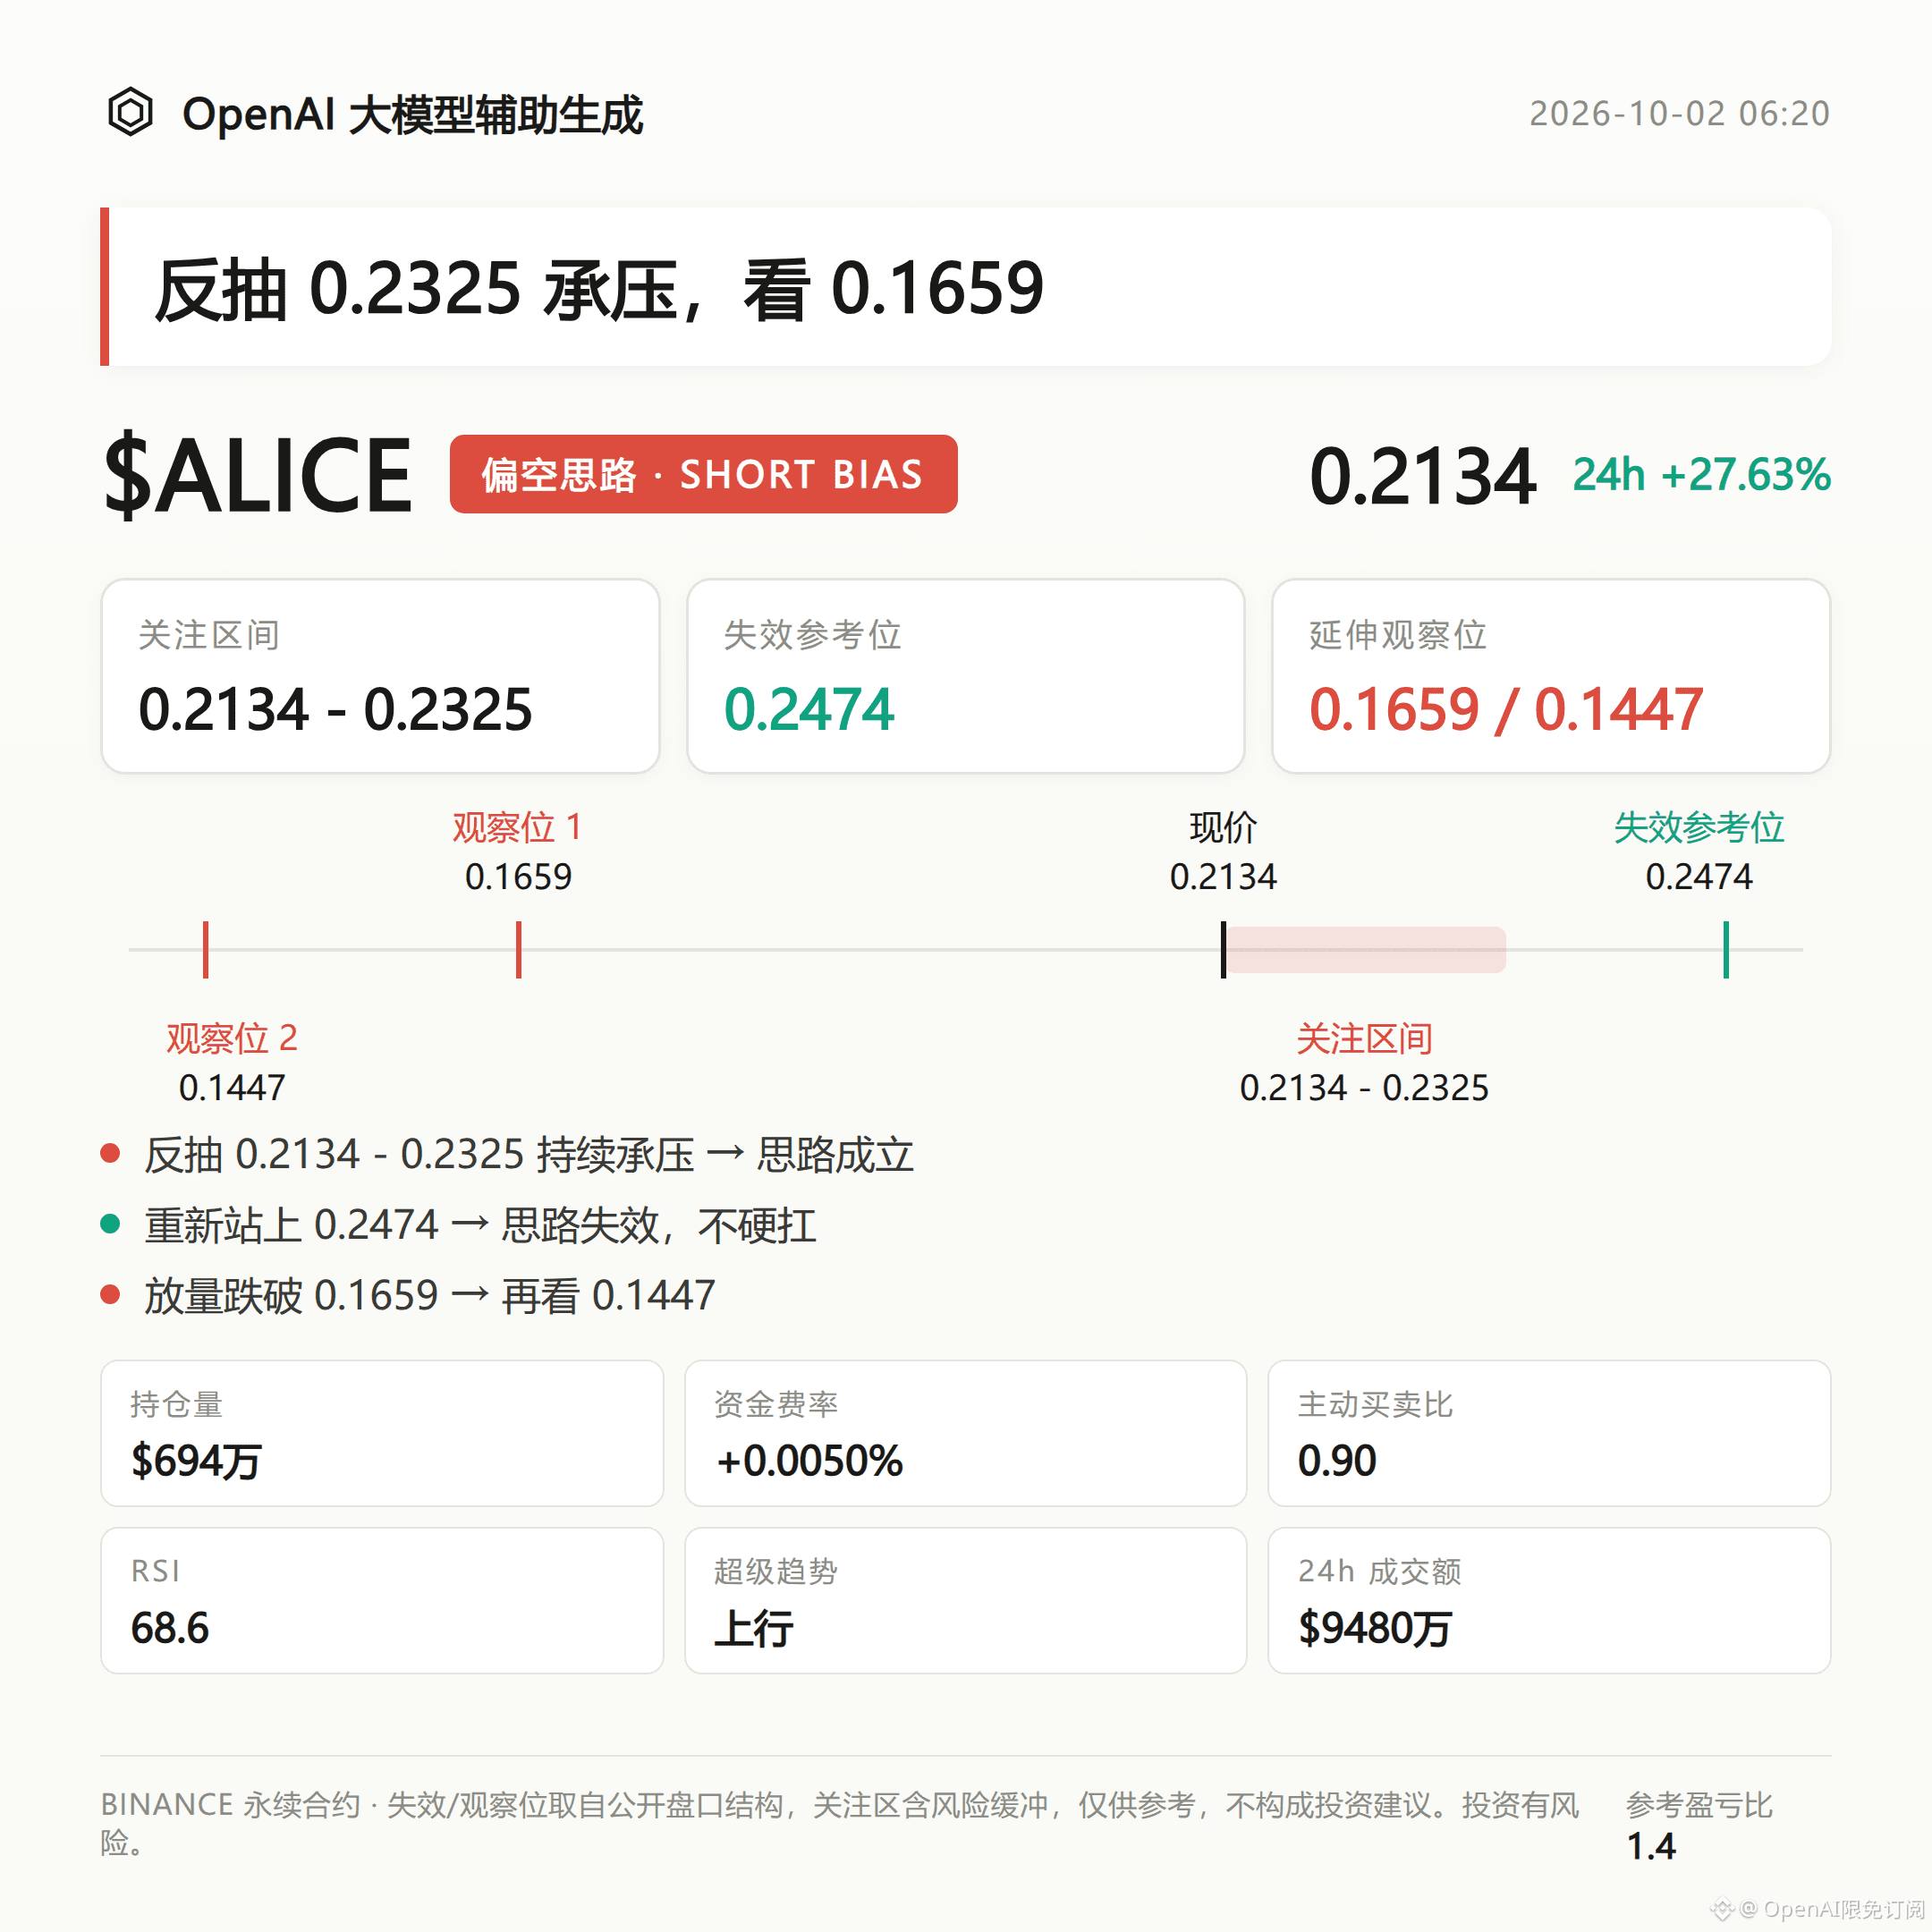
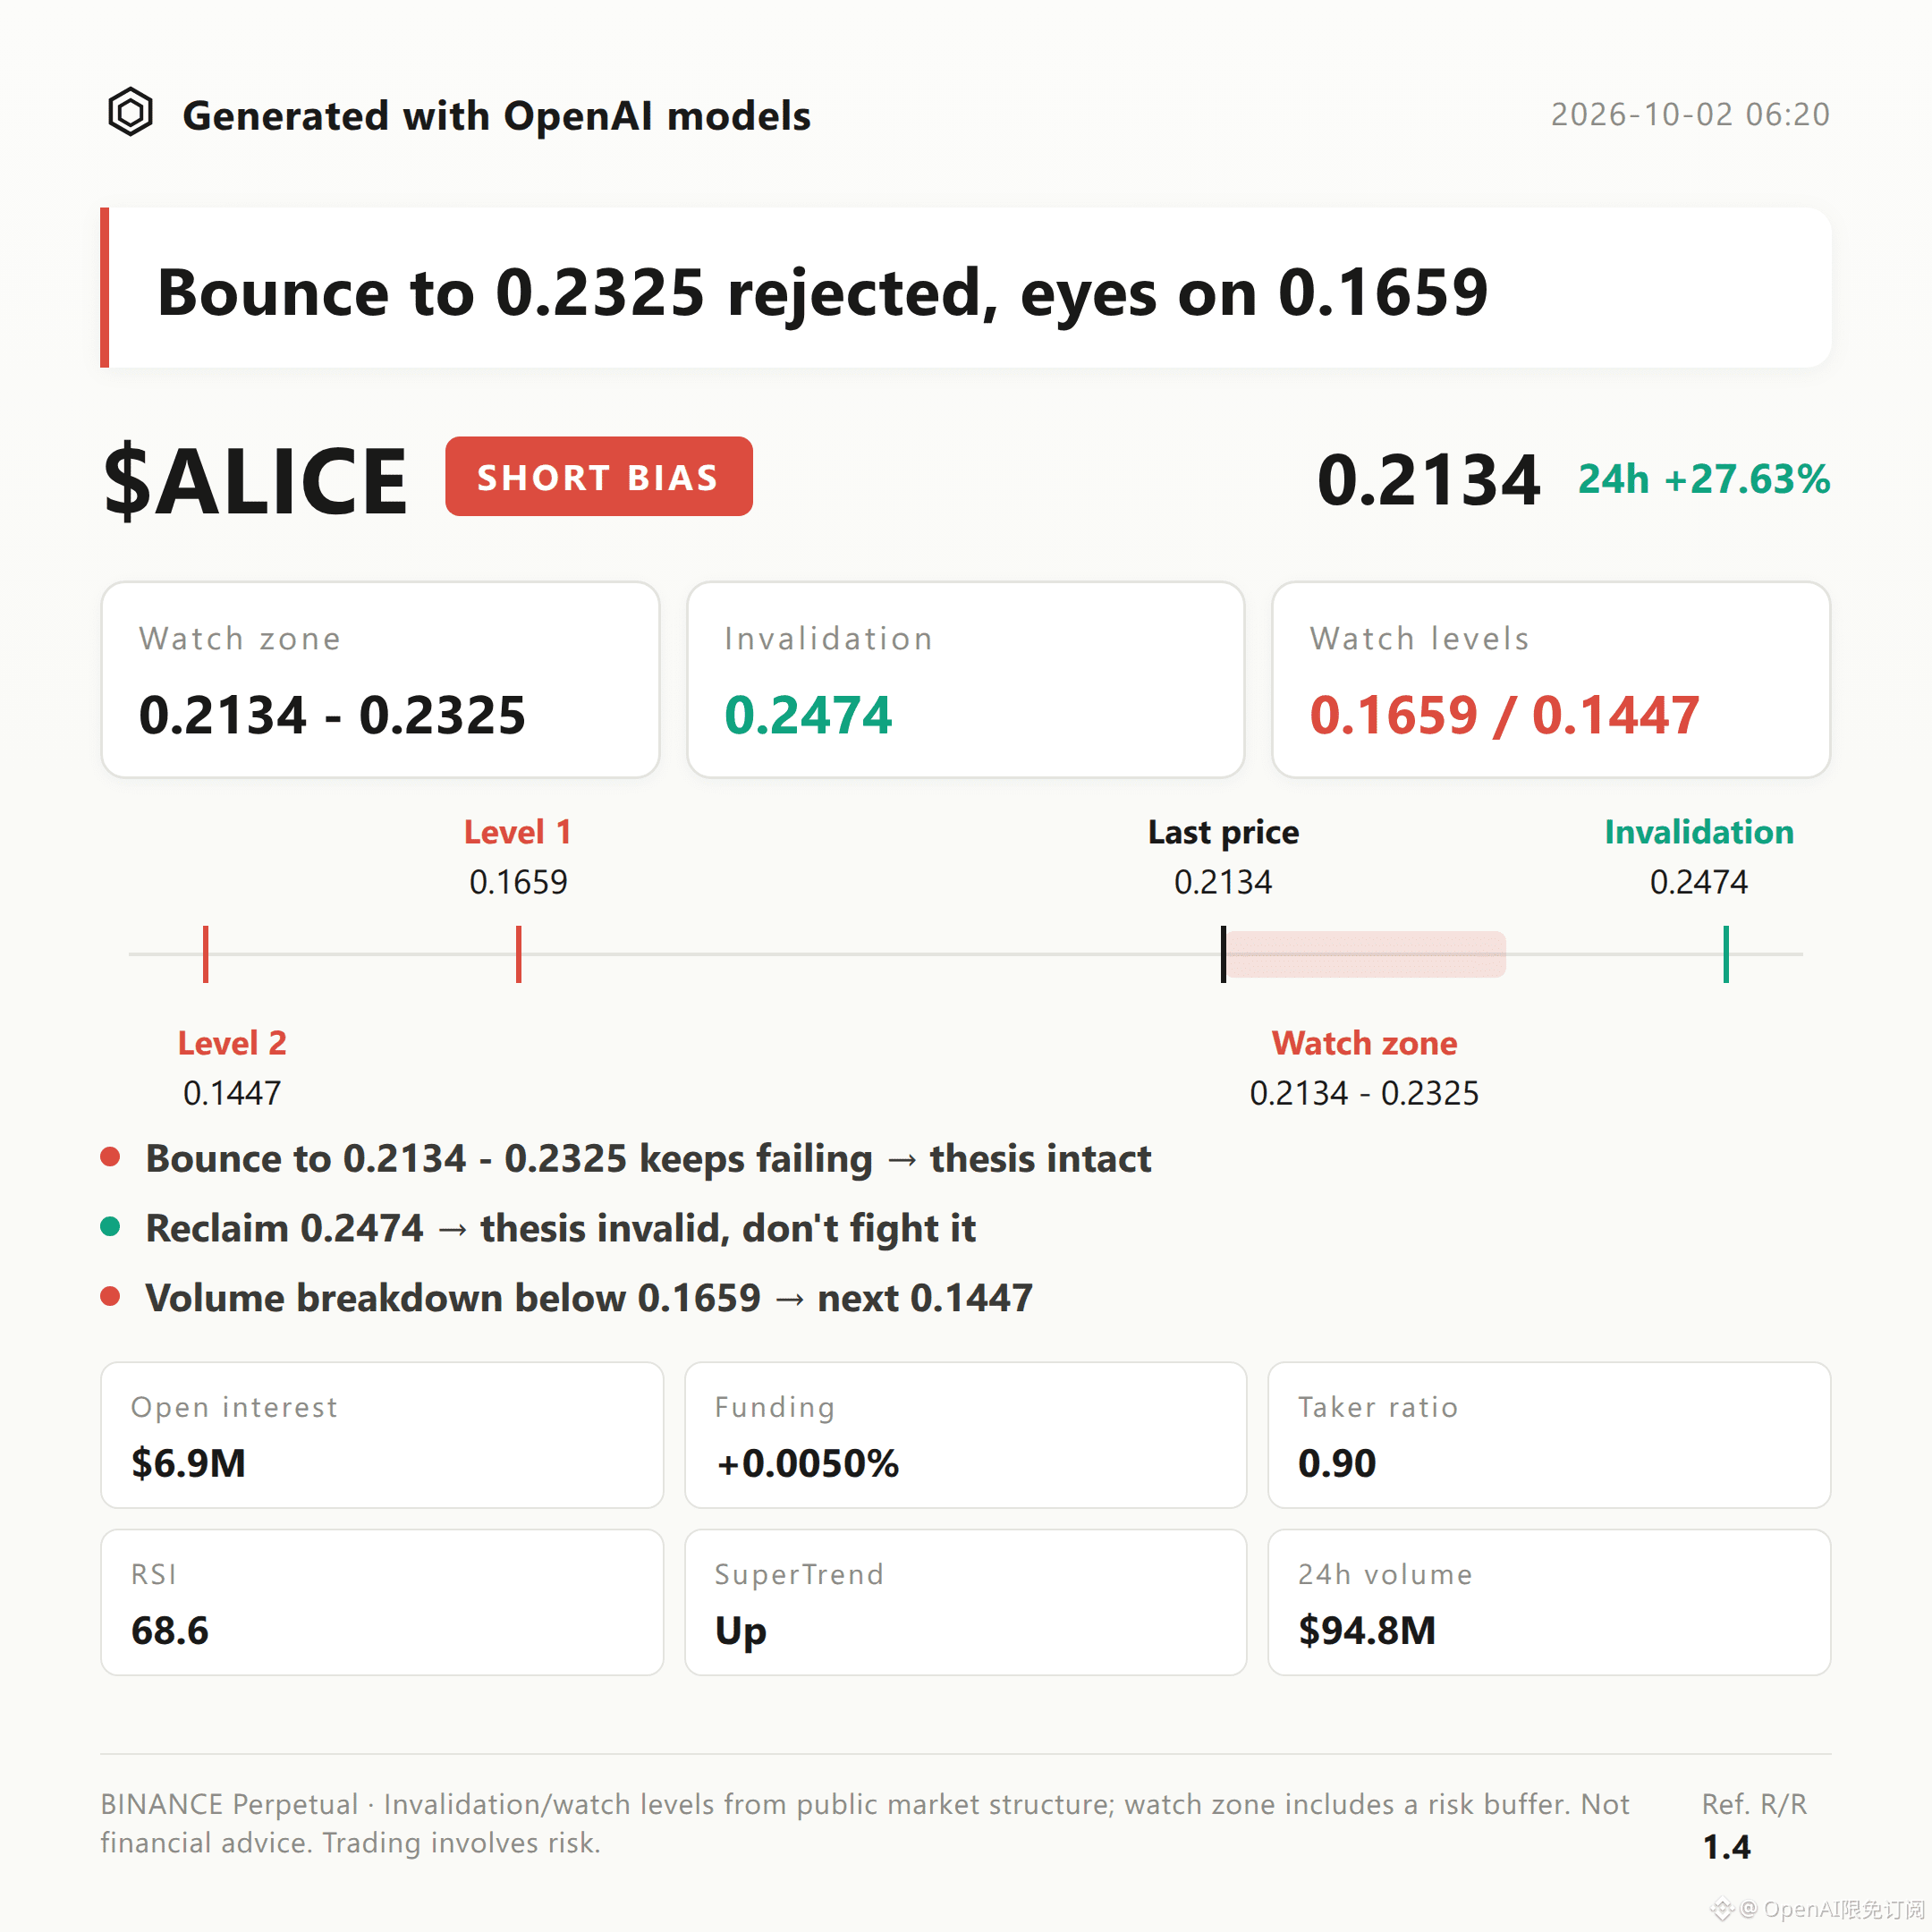
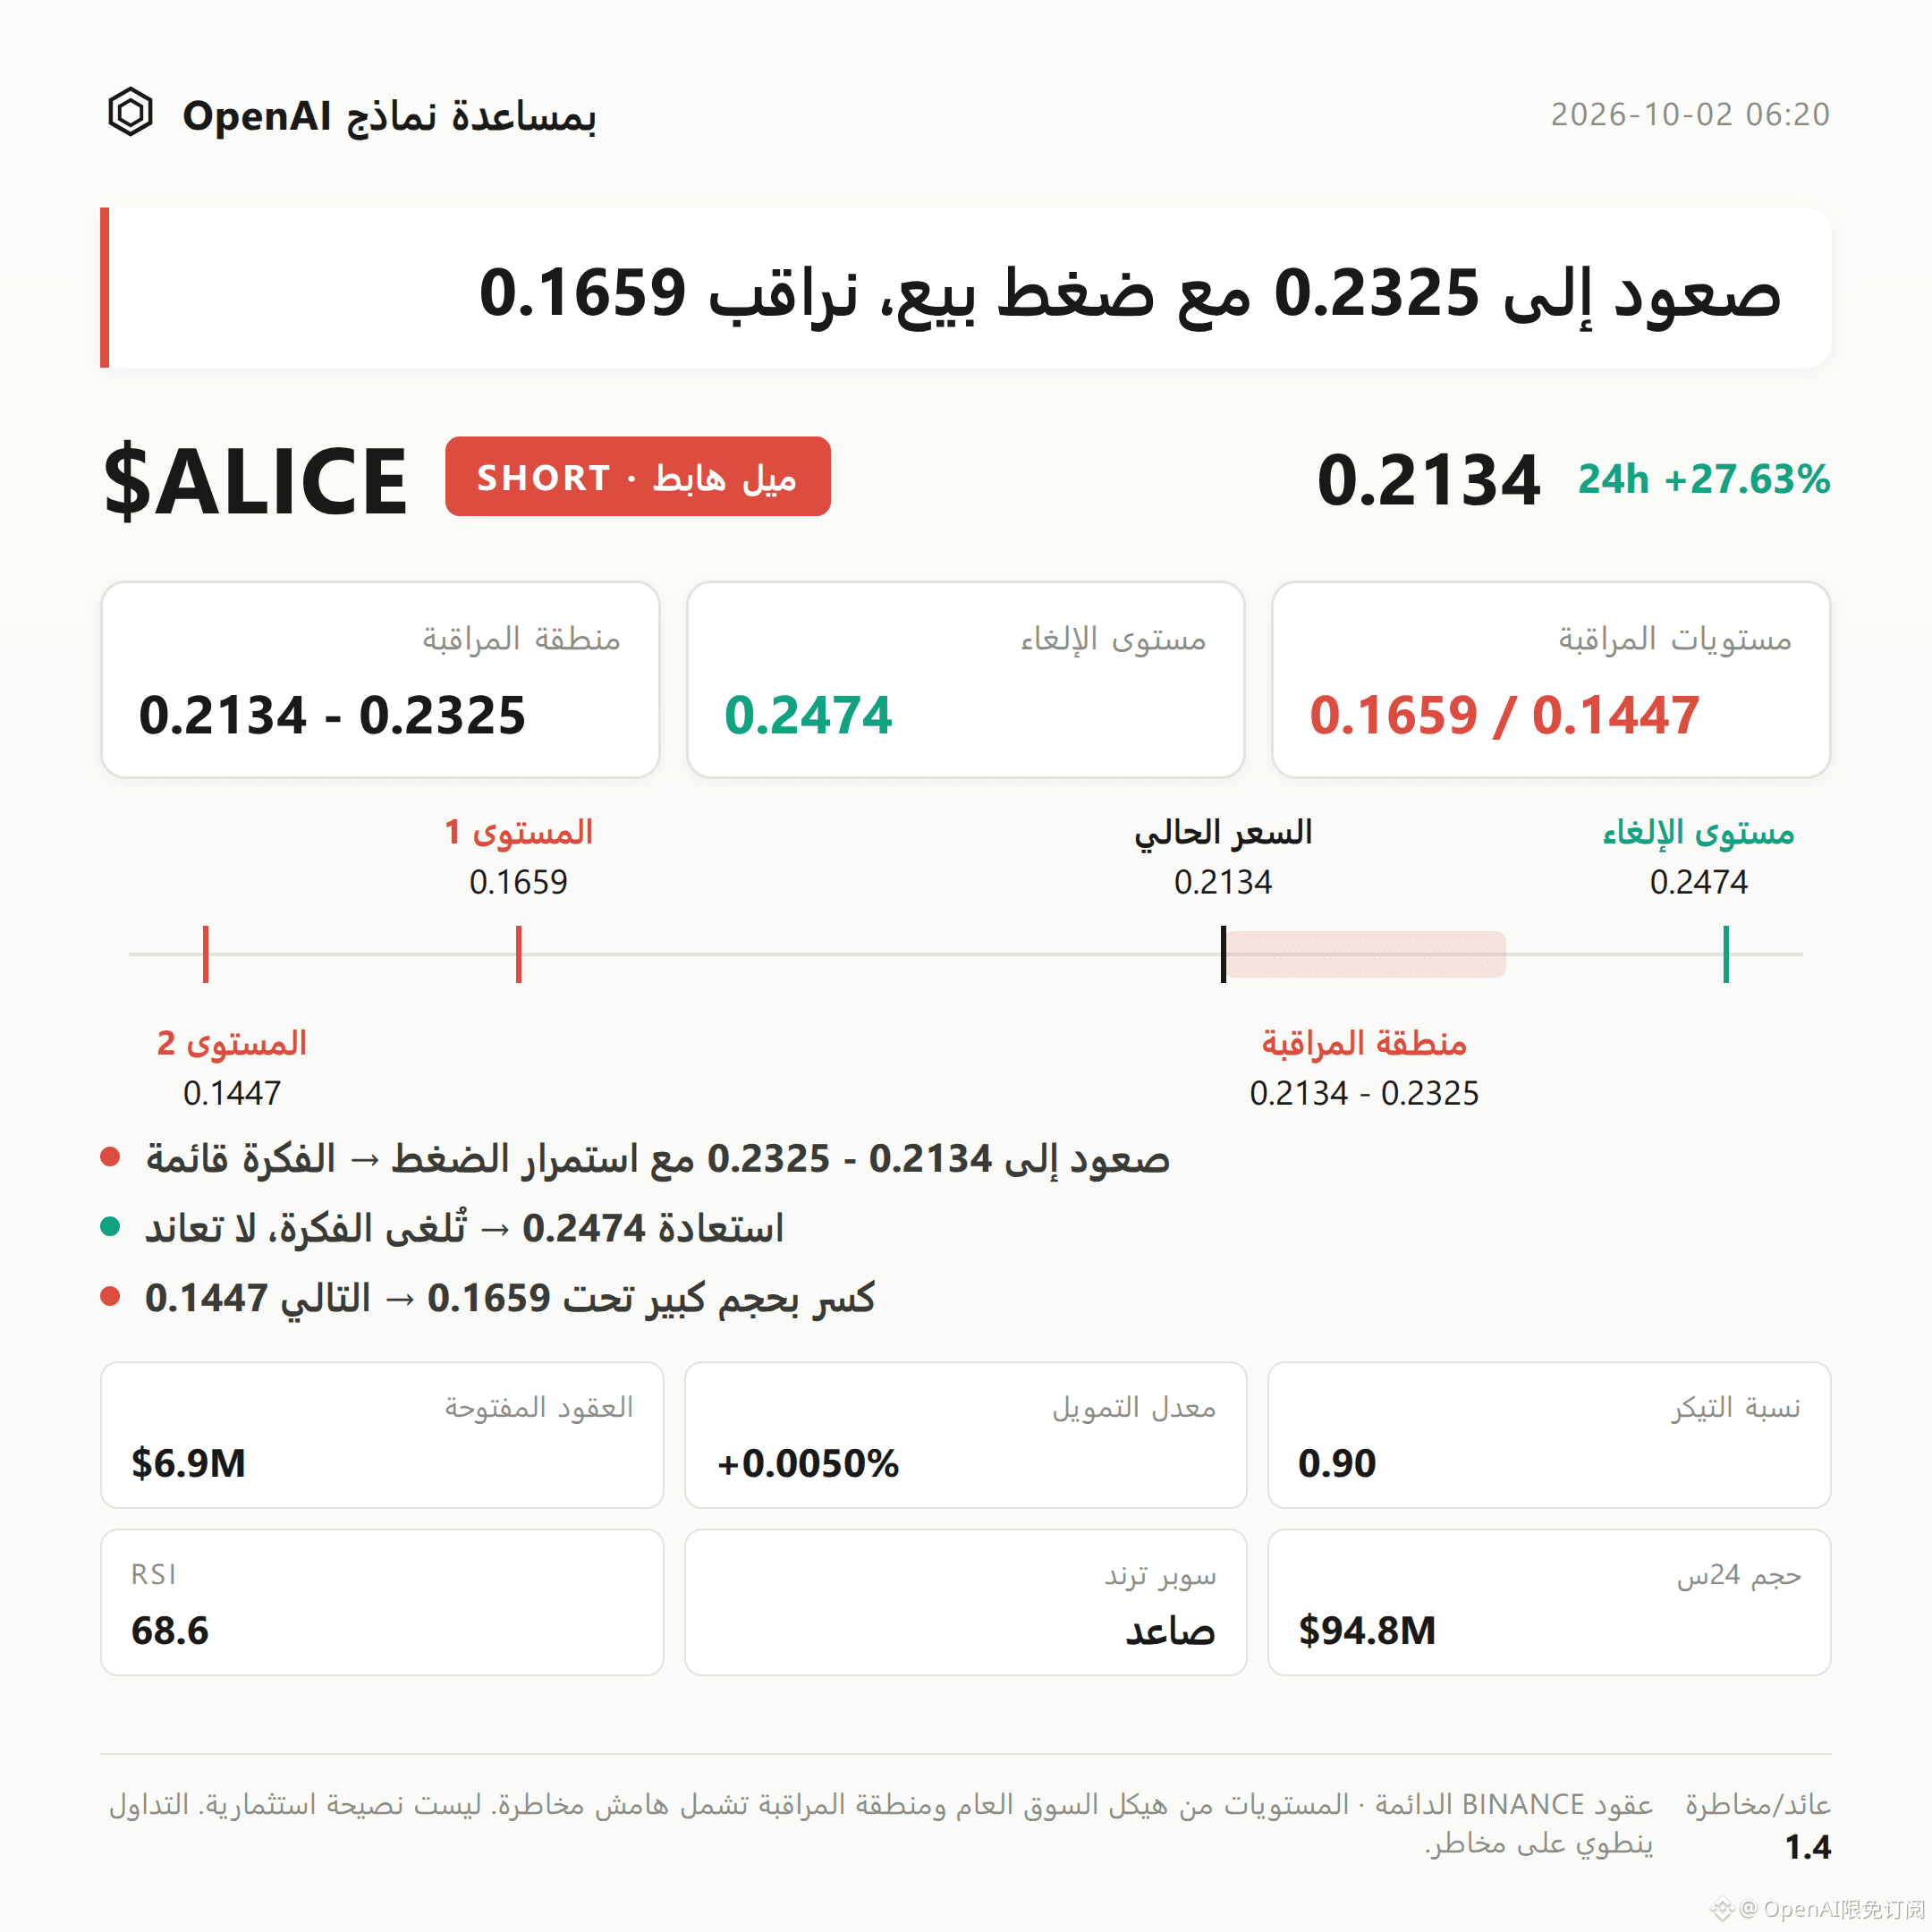
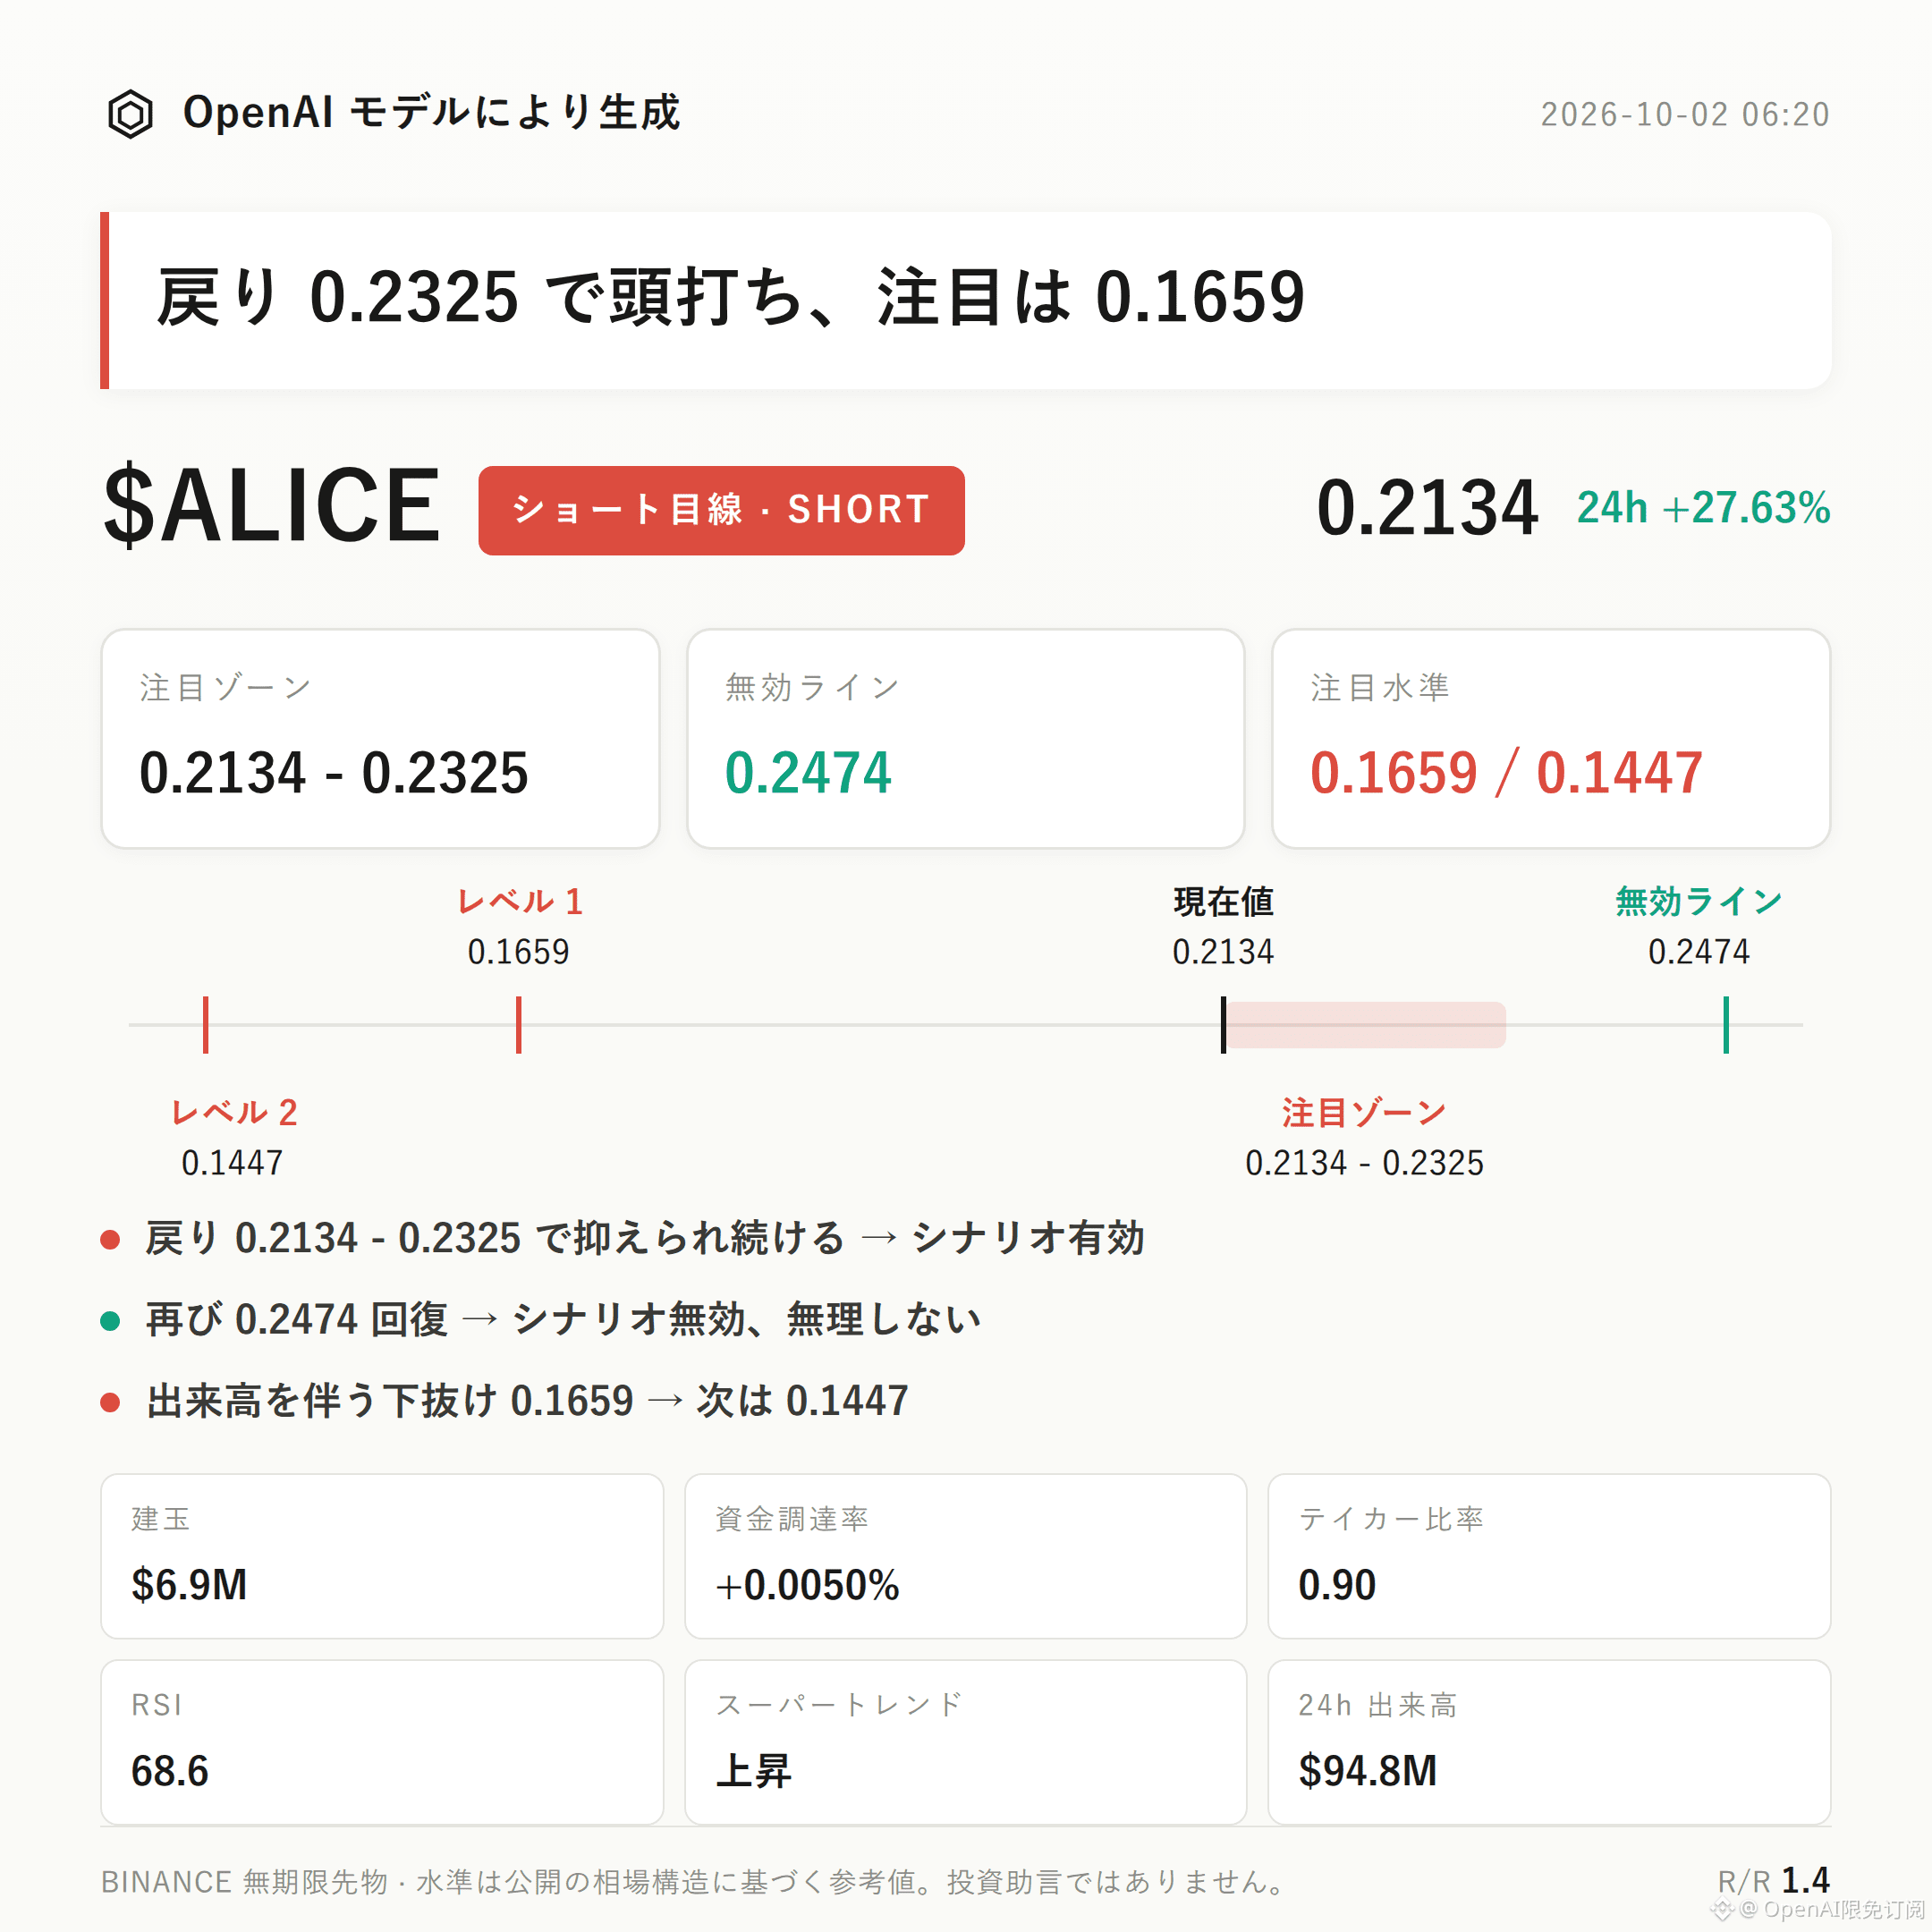
$ALICE Bearish Bias | Watch Range 0.2134 - 0.2325 | Invalidation Reference 0.2474 | Observation Levels 0.1659 / 0.1447
The current structure for $ALICE is trending bearish.
In the past 24h, it rose 27.63% with open interest surging 107.0%. At the same time, the buy/sell ratio from aggressive (active) trading is only 0.90—combined with overcrowding at the highs and active sell orders outweighing buys, this creates a pullback risk.
The key is whether the rebound can be suppressed in the pressure zone.
Current price is 0.2134, having fallen from the recent high of 0.2474, but it is still above the Bollinger midline of 0.1886.
RSI is 68.6, close to the overbought area; however, MACD still shows bullish momentum, and the Supertrend remains upward. This means the bearish call has not yet received complete trend confirmation.
24h turnover is $94.8M, and open interest reached $6.94M. The sharp price surge plus expanding open interest indicates a clear increase in crowded leveraged positions.
Funding rate is +0.0050%. Long accounts make up 64%, and the aggressive buy/sell ratio is 0.90, indicating active sell dominance. If bullish momentum weakens, the crowded longs could amplify volatility.
For shorts, start by watching the 0.2134 - 0.2325 range. It’s more suitable to wait for confirmation after the rebound meets resistance.
If after retesting the watch range there isn’t enough follow-through/support, and the rebound continues to be pressured, then the bearish outlook is valid.
If the price reclaims the invalidation level of 0.2474, it means the current pullback structure is broken and the bearish outlook fails—no need to overstay.
If price breaks down below the observation level of 0.1659 with increased volume, then look for support around 0.1447.
At the moment, there are no significant reversal signals. But the bullish MACD momentum and the Supertrend uptrend remain structural headwinds that the bearish outlook must take into account. Contract leverage itself can also magnify judgment errors.
The risk-reward ratio is 1.4. Until the conditions are confirmed, stay restrained. With leverage, position discipline matters more than directional bias.
For reference only—this does not constitute investment advice. Contracts involve leverage; investing involves risk.
This article was generated with assistance from an OpenAI model.
$ALICE #Contract Analysis
Trading Outlook|10/2 06:20
$ALICE Bearish Bias | Watch Range 0.2134 - 0.2325 | Invalidation Reference 0.2474 | Observation Levels 0.1659 / 0.1447
The current structure for $ALICE is trending bearish.
In the past 24h, it rose 27.63% with open interest surging 107.0%. At the same time, the buy/sell ratio from aggressive (active) trading is only 0.90—combined with overcrowding at the highs and active sell orders outweighing buys, this creates a pullback risk.
The key is whether the rebound can be suppressed in the pressure zone.
Current price is 0.2134, having fallen from the recent high of 0.2474, but it is still above the Bollinger midline of 0.1886.
RSI is 68.6, close to the overbought area; however, MACD still shows bullish momentum, and the Supertrend remains upward. This means the bearish call has not yet received complete trend confirmation.
24h turnover is $94.8M, and open interest reached $6.94M. The sharp price surge plus expanding open interest indicates a clear increase in crowded leveraged positions.
Funding rate is +0.0050%. Long accounts make up 64%, and the aggressive buy/sell ratio is 0.90, indicating active sell dominance. If bullish momentum weakens, the crowded longs could amplify volatility.
For shorts, start by watching the 0.2134 - 0.2325 range. It’s more suitable to wait for confirmation after the rebound meets resistance.
If after retesting the watch range there isn’t enough follow-through/support, and the rebound continues to be pressured, then the bearish outlook is valid.
If the price reclaims the invalidation level of 0.2474, it means the current pullback structure is broken and the bearish outlook fails—no need to overstay.
If price breaks down below the observation level of 0.1659 with increased volume, then look for support around 0.1447.
At the moment, there are no significant reversal signals. But the bullish MACD momentum and the Supertrend uptrend remain structural headwinds that the bearish outlook must take into account. Contract leverage itself can also magnify judgment errors.
The risk-reward ratio is 1.4. Until the conditions are confirmed, stay restrained. With leverage, position discipline matters more than directional bias.
For reference only—this does not constitute investment advice. Contracts involve leverage; investing involves risk.
This article was generated with assistance from an OpenAI model.
$ALICE #Contract Analysis
$ALICE Bearish Bias | Watch Range 0.2134 - 0.2325 | Invalidation Reference 0.2474 | Observation Levels 0.1659 / 0.1447
The current structure for $ALICE is trending bearish.
In the past 24h, it rose 27.63% with open interest surging 107.0%. At the same time, the buy/sell ratio from aggressive (active) trading is only 0.90—combined with overcrowding at the highs and active sell orders outweighing buys, this creates a pullback risk.
The key is whether the rebound can be suppressed in the pressure zone.
Current price is 0.2134, having fallen from the recent high of 0.2474, but it is still above the Bollinger midline of 0.1886.
RSI is 68.6, close to the overbought area; however, MACD still shows bullish momentum, and the Supertrend remains upward. This means the bearish call has not yet received complete trend confirmation.
24h turnover is $94.8M, and open interest reached $6.94M. The sharp price surge plus expanding open interest indicates a clear increase in crowded leveraged positions.
Funding rate is +0.0050%. Long accounts make up 64%, and the aggressive buy/sell ratio is 0.90, indicating active sell dominance. If bullish momentum weakens, the crowded longs could amplify volatility.
For shorts, start by watching the 0.2134 - 0.2325 range. It’s more suitable to wait for confirmation after the rebound meets resistance.
If after retesting the watch range there isn’t enough follow-through/support, and the rebound continues to be pressured, then the bearish outlook is valid.
If the price reclaims the invalidation level of 0.2474, it means the current pullback structure is broken and the bearish outlook fails—no need to overstay.
If price breaks down below the observation level of 0.1659 with increased volume, then look for support around 0.1447.
At the moment, there are no significant reversal signals. But the bullish MACD momentum and the Supertrend uptrend remain structural headwinds that the bearish outlook must take into account. Contract leverage itself can also magnify judgment errors.
The risk-reward ratio is 1.4. Until the conditions are confirmed, stay restrained. With leverage, position discipline matters more than directional bias.
For reference only—this does not constitute investment advice. Contracts involve leverage; investing involves risk.
This article was generated with assistance from an OpenAI model.
$ALICE #Contract Analysis
2
·
--
Trading Idea|10/2 04:21
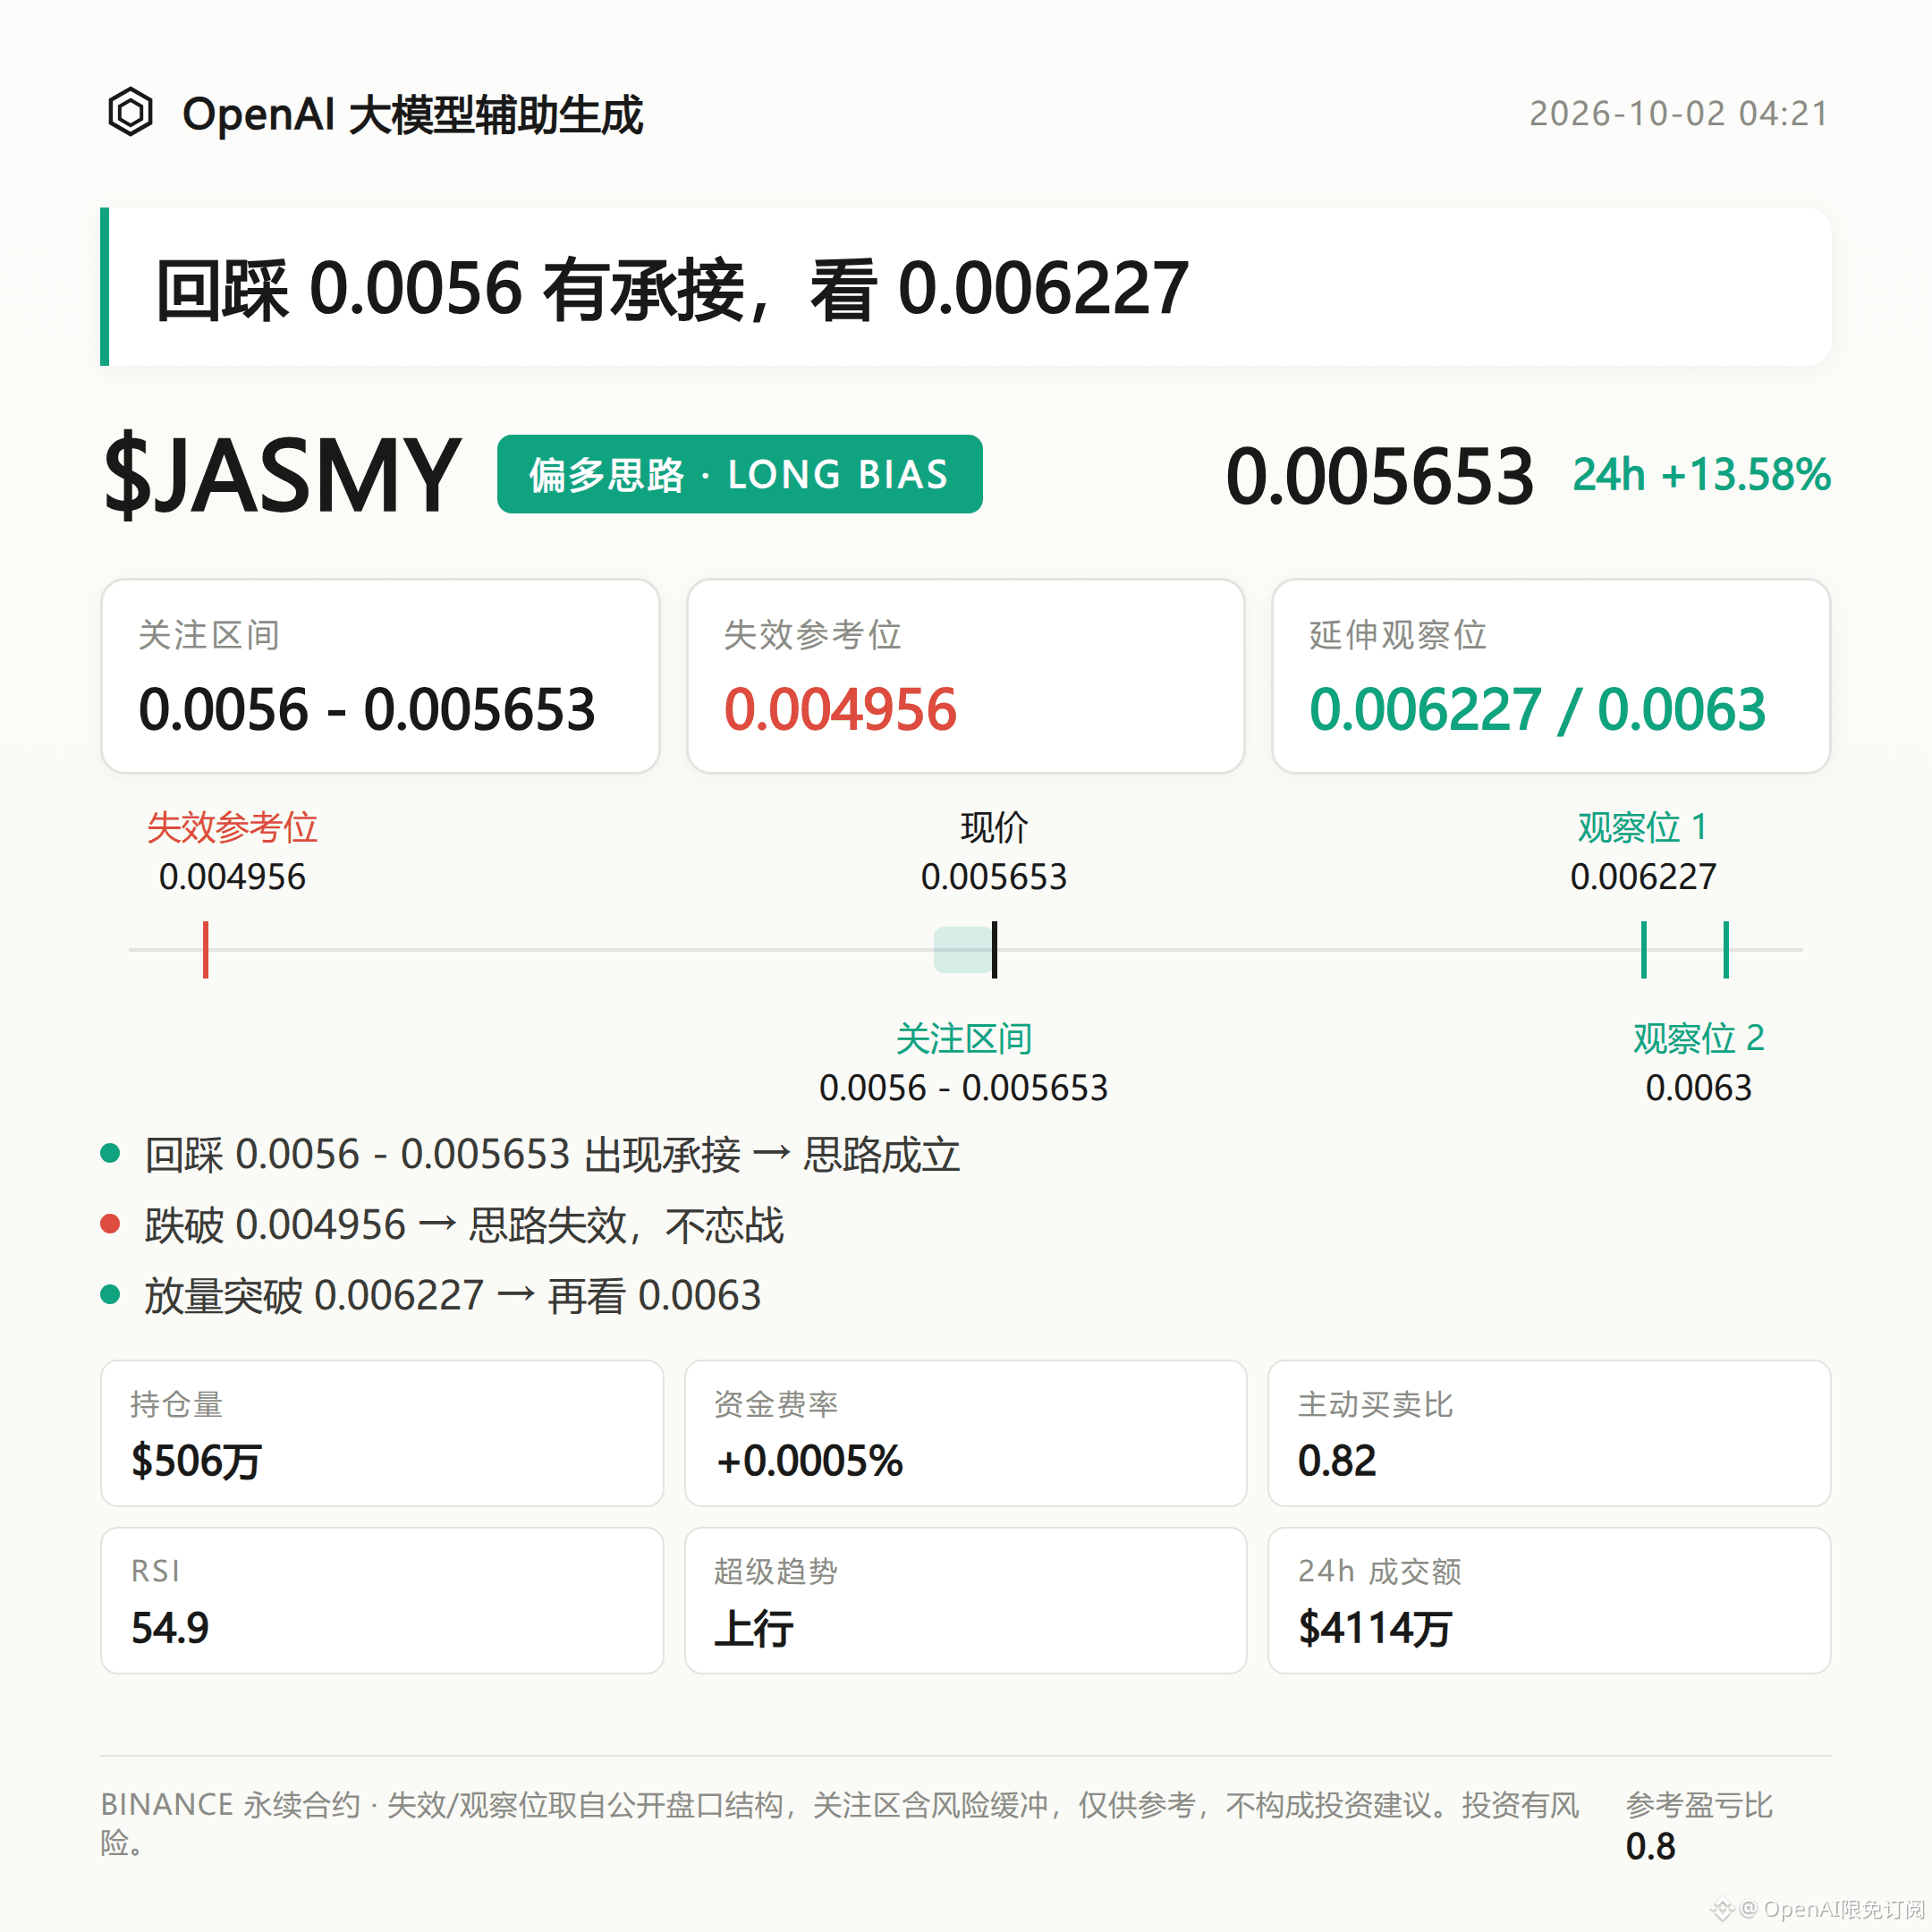
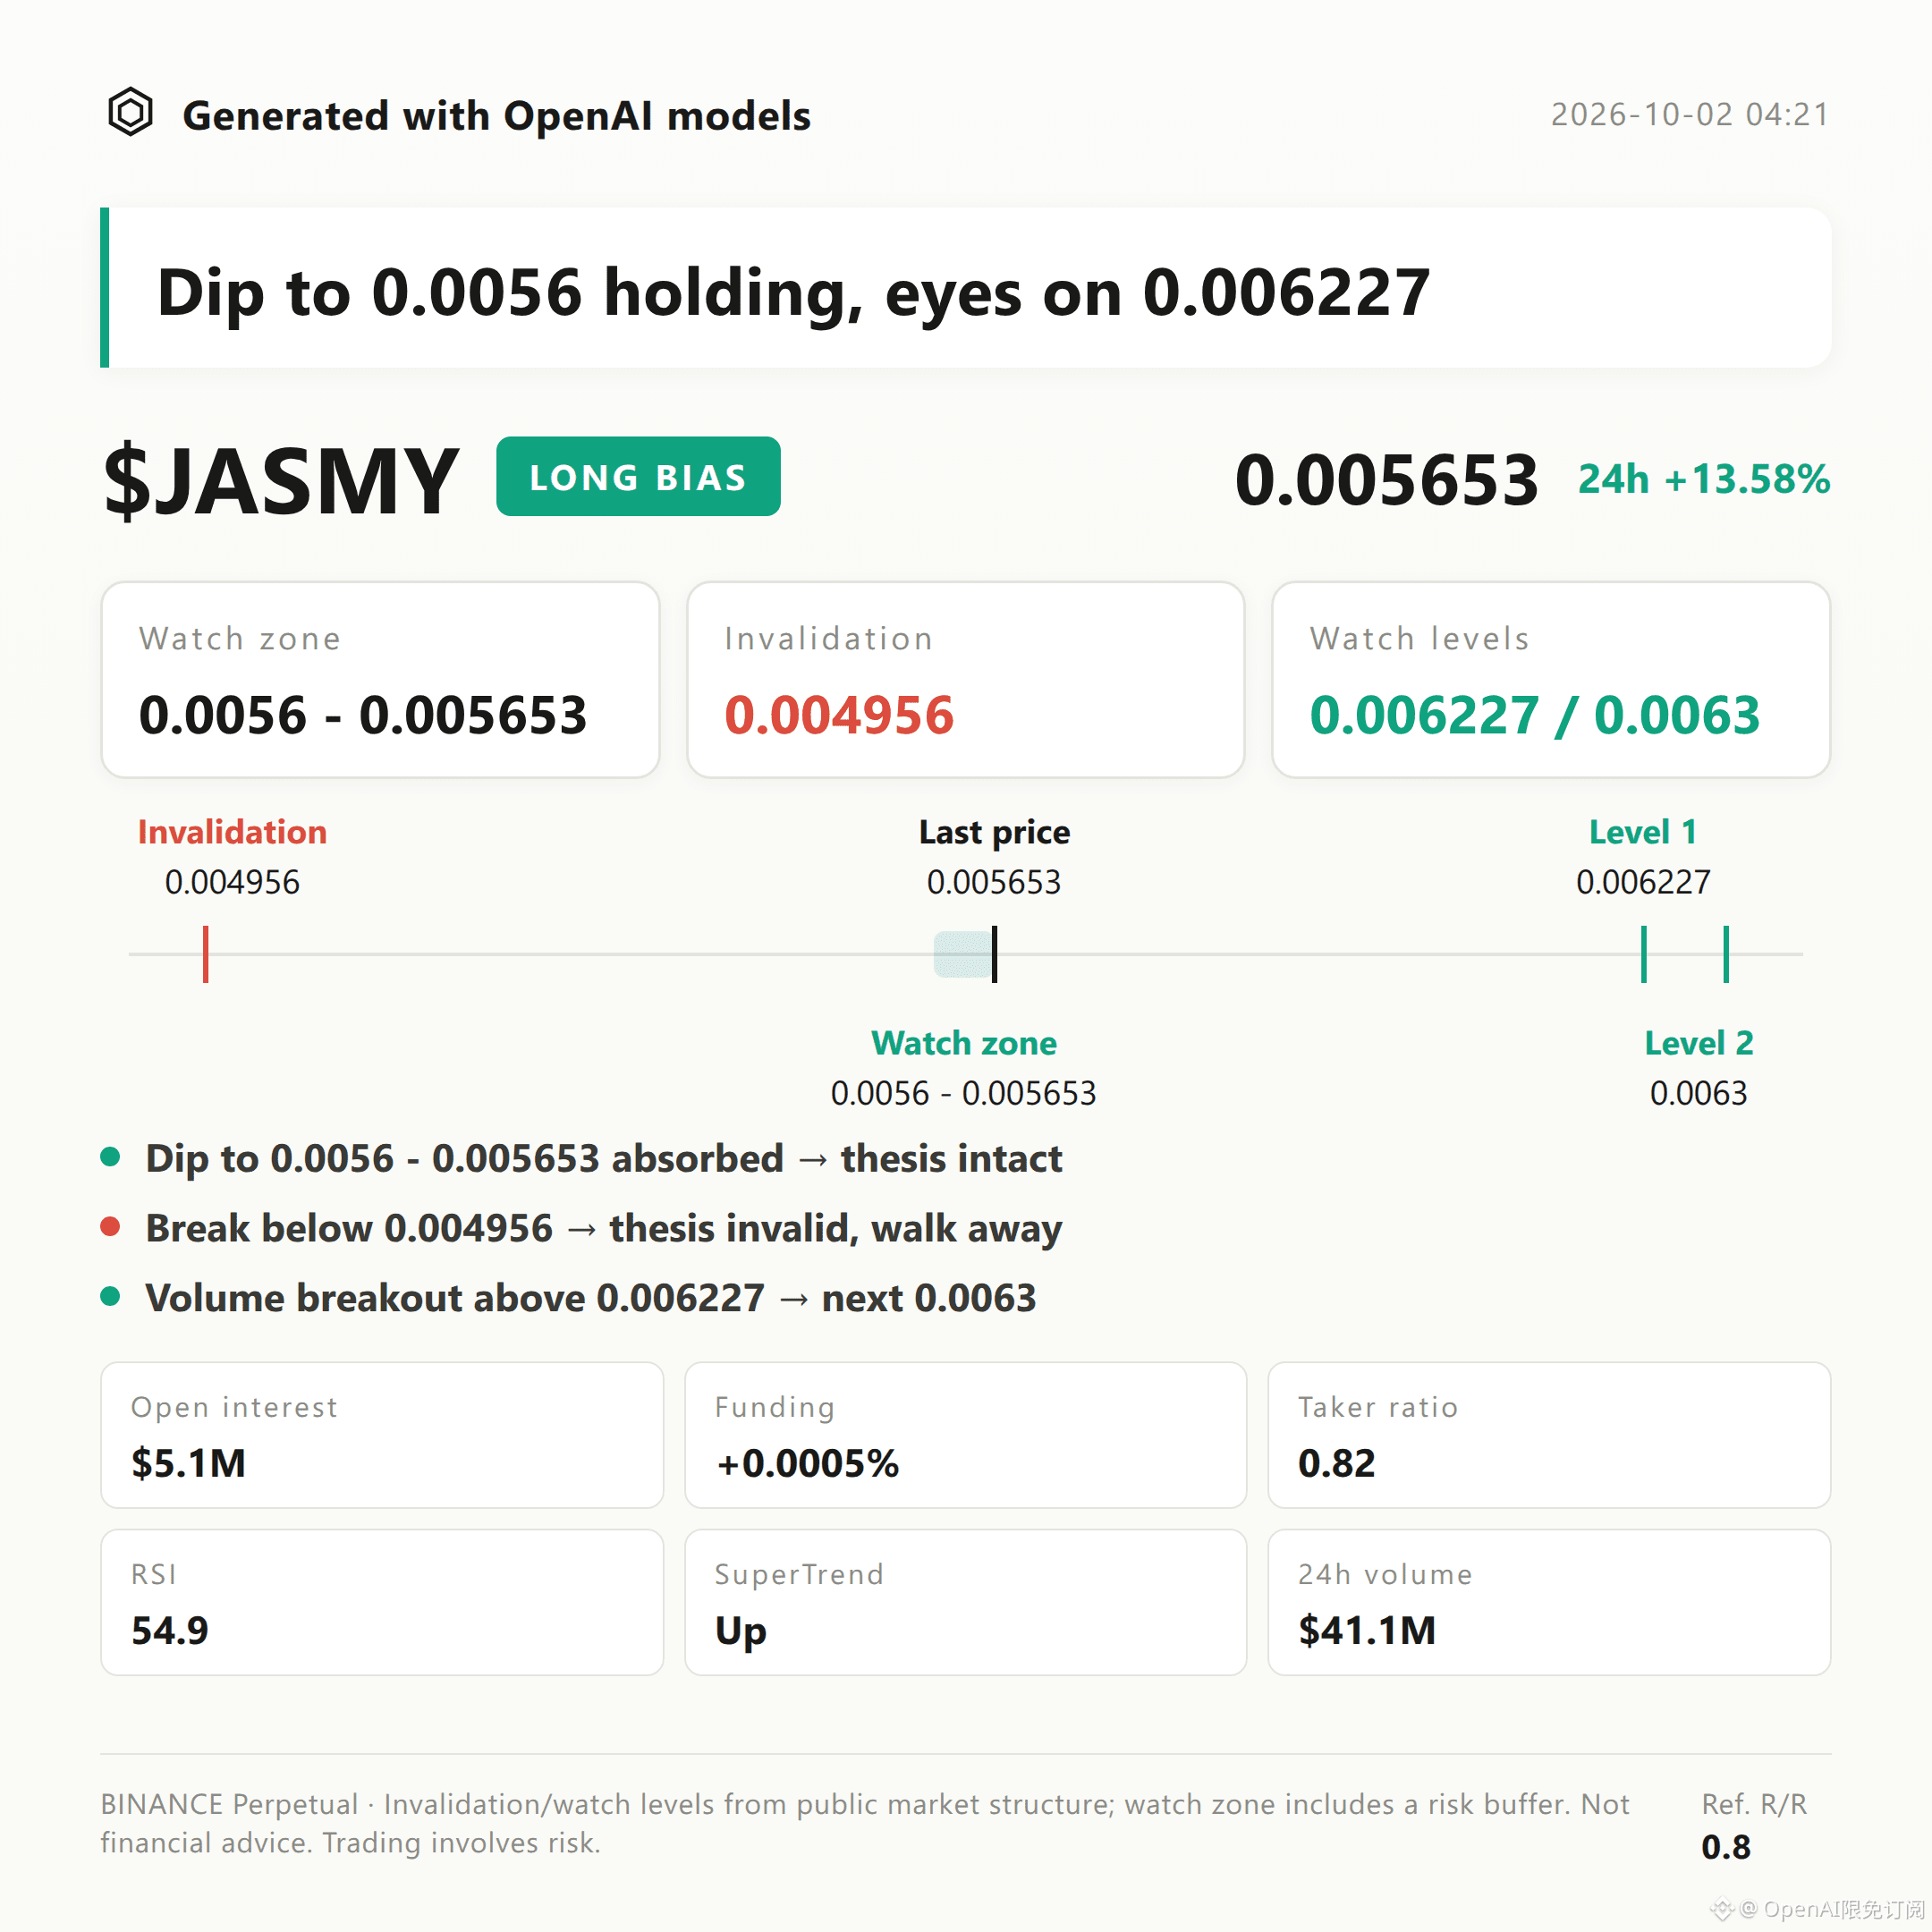
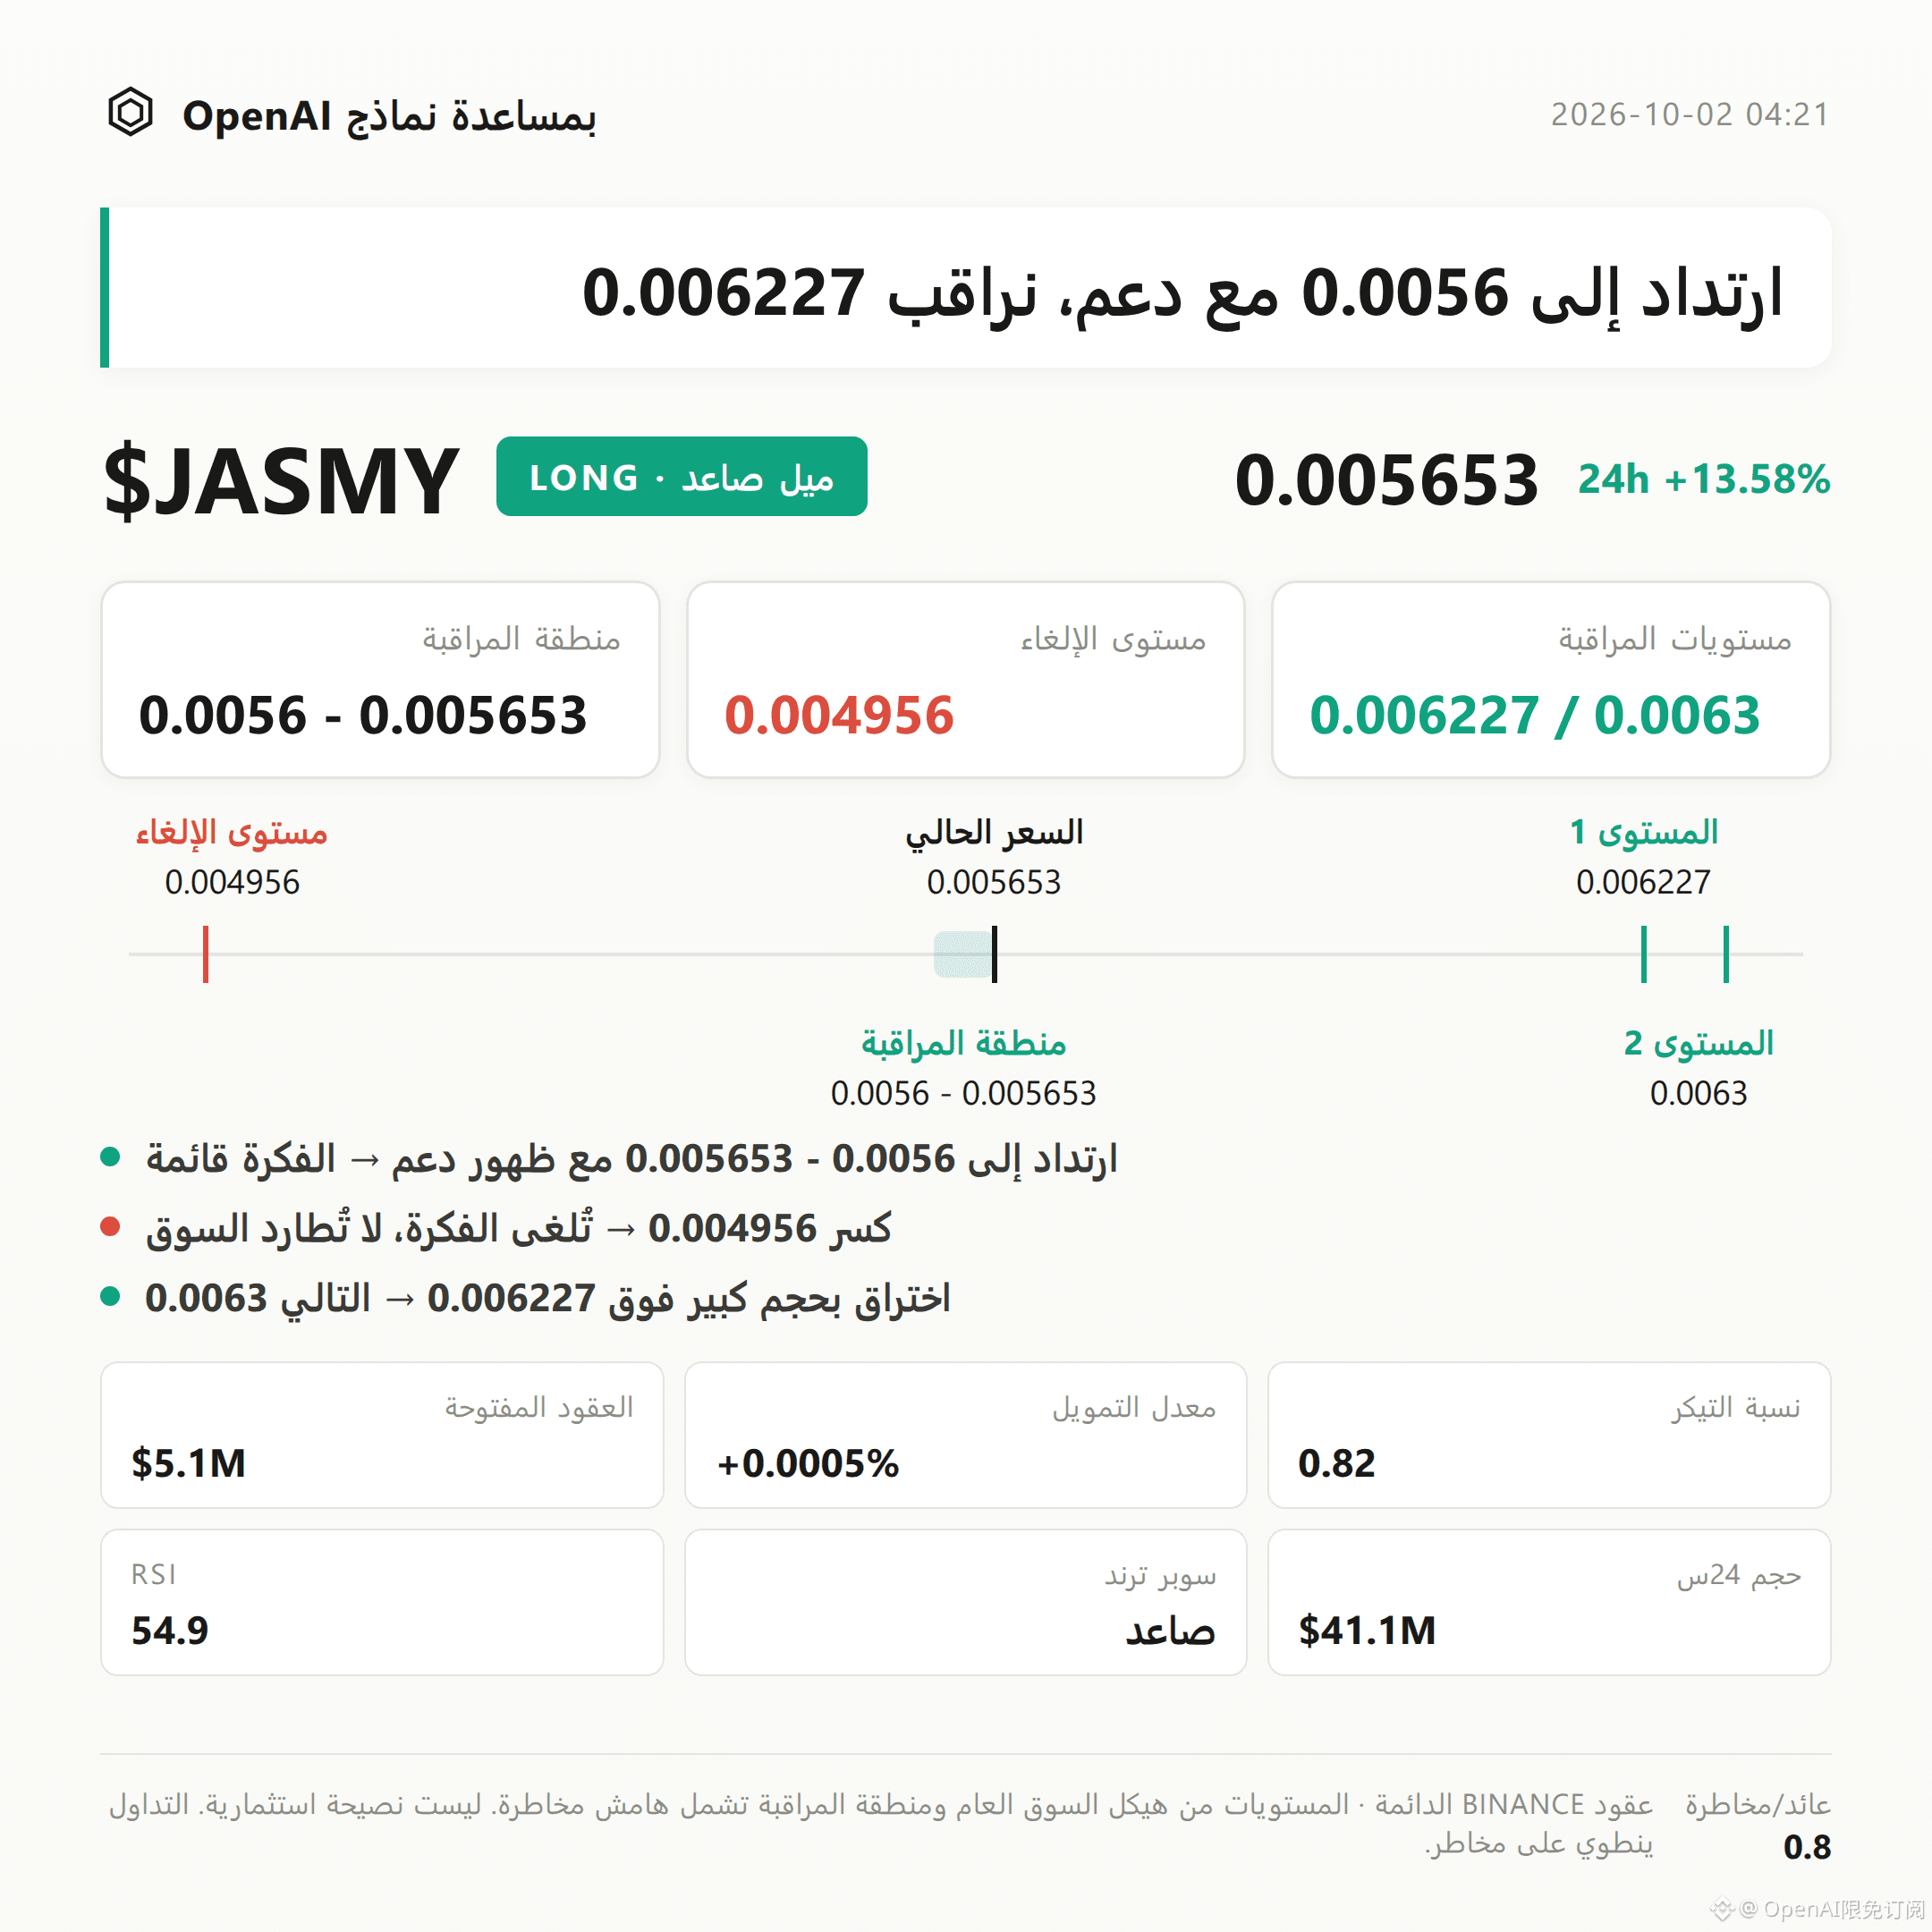
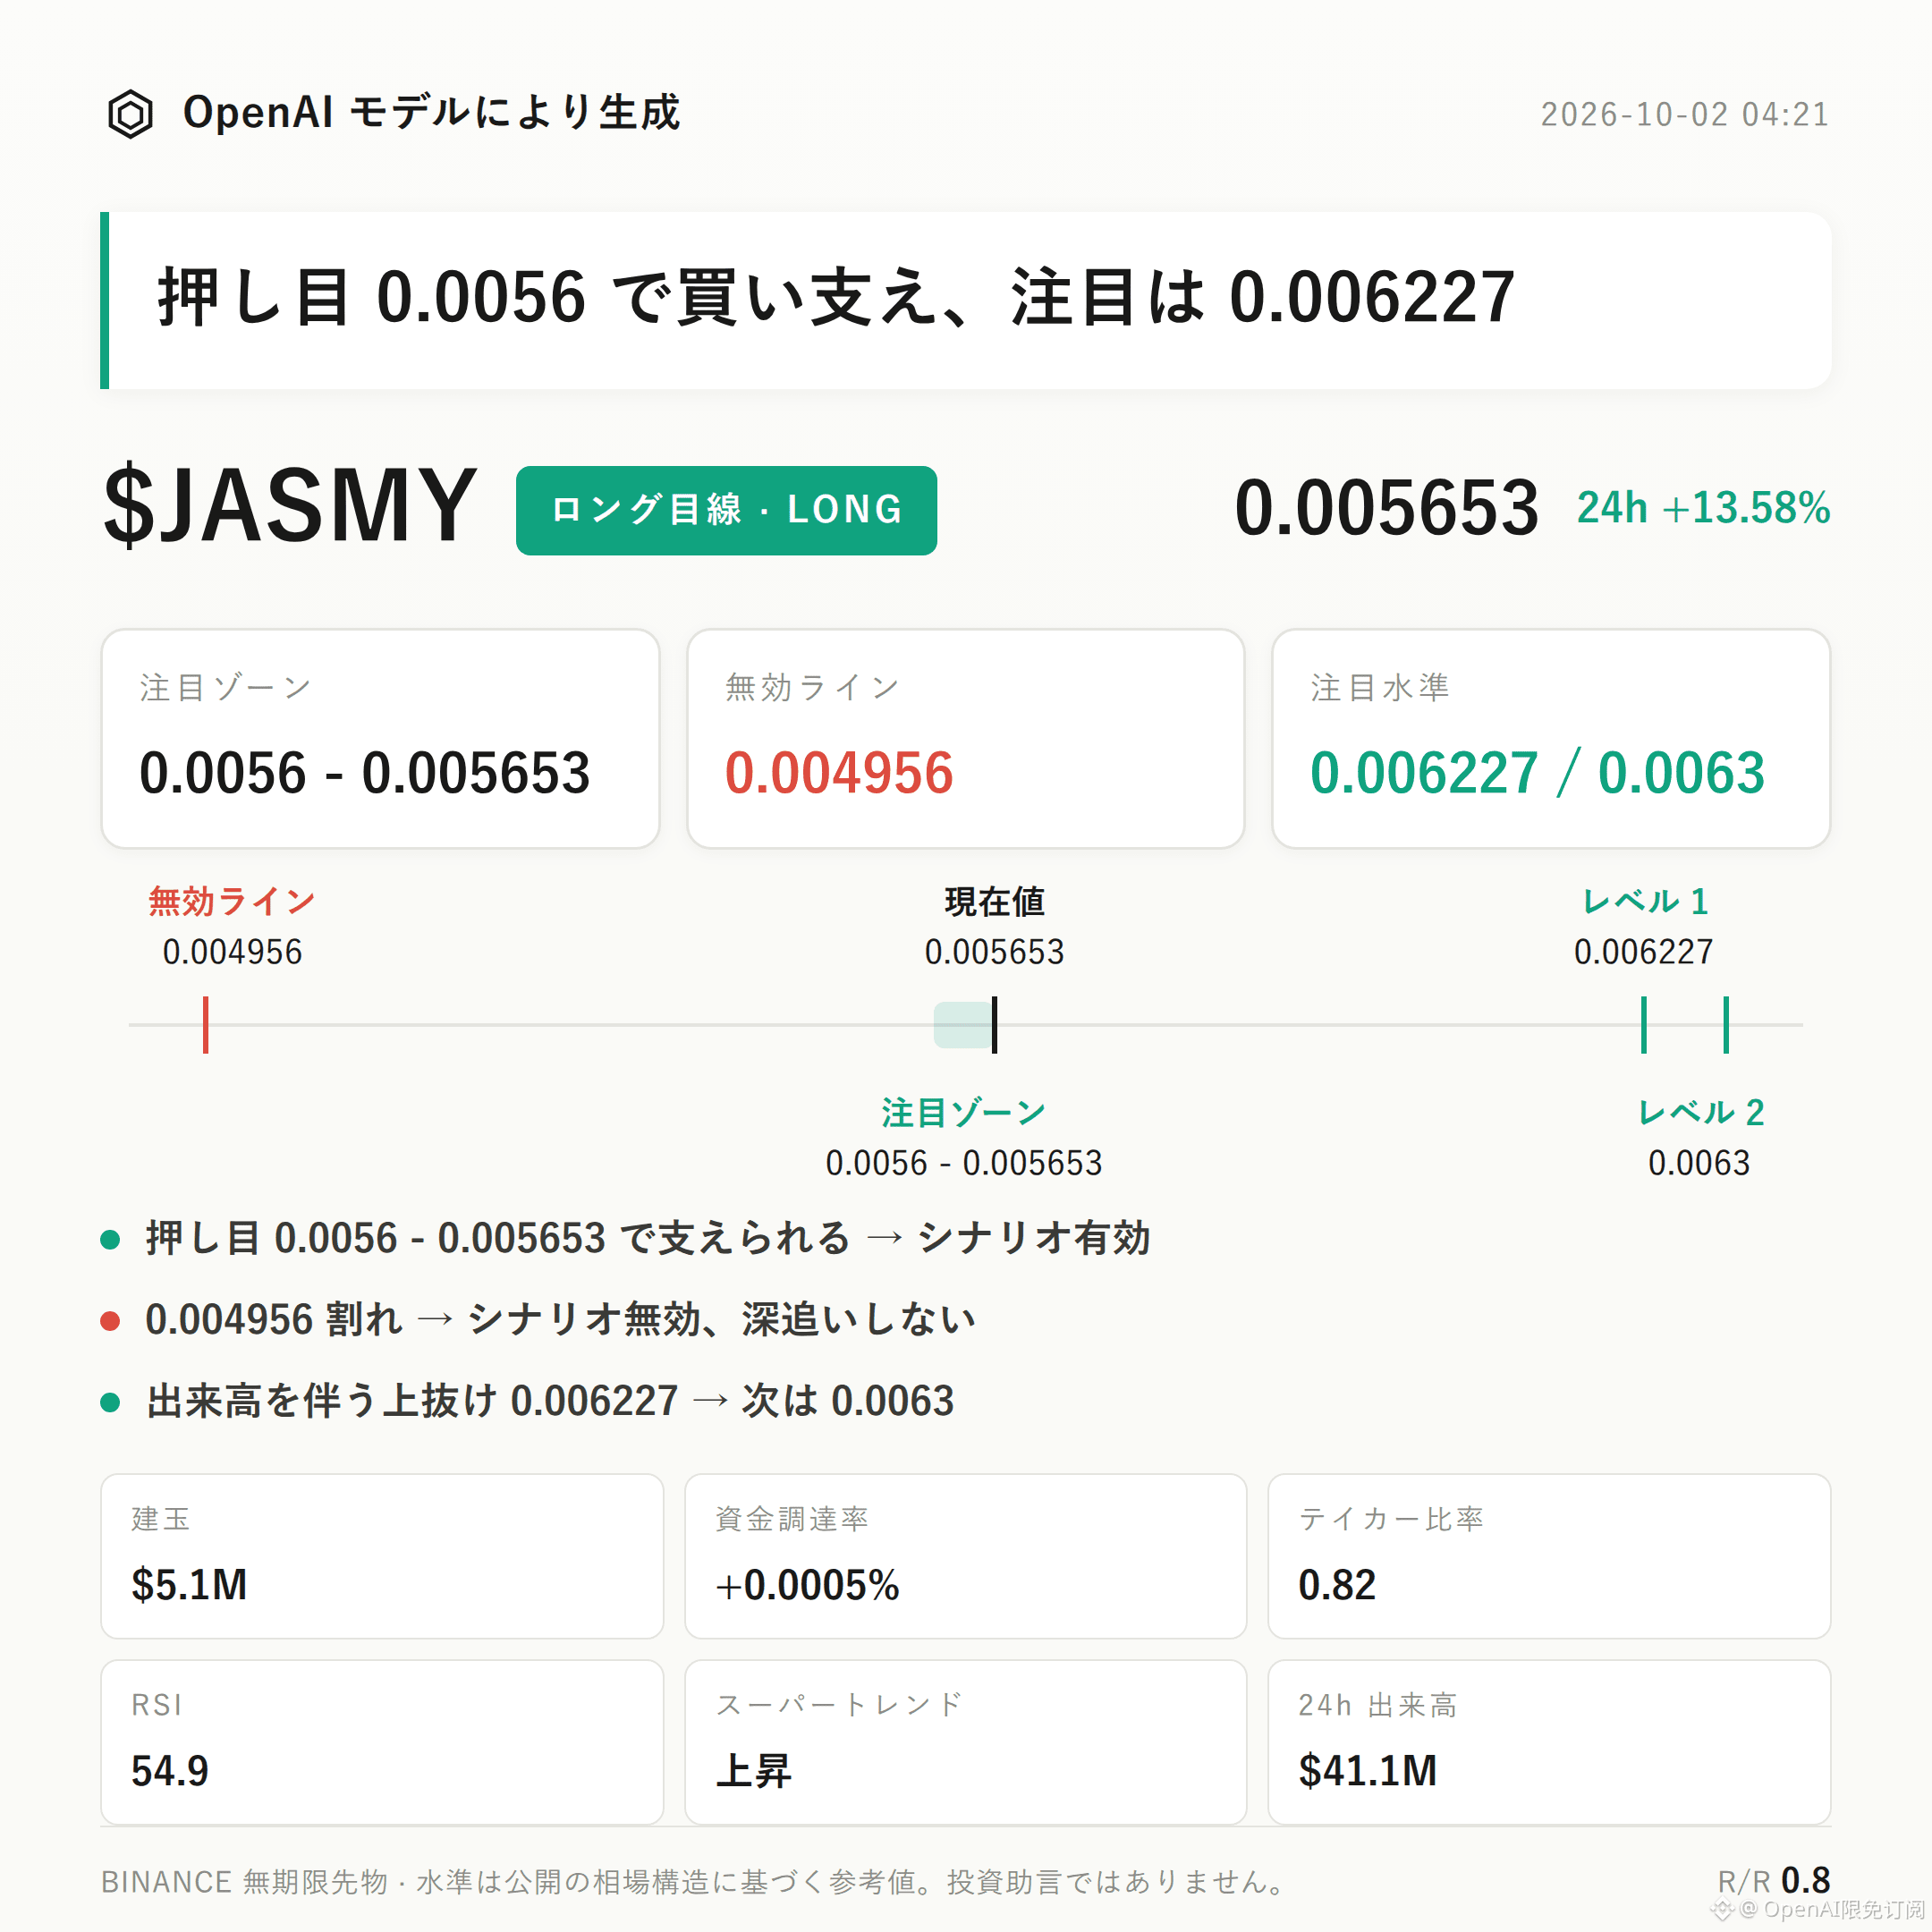
$JASMY Bias: Bullish | Focus Zone 0.0056 - 0.005653 | Invalidation Reference 0.004956 | Observation Levels 0.006227 / 0.0063
$JASMY The current bullish structure is unfolding.
The Supertrend is pointing up, MACD maintains bullish momentum, and open interest has increased by 48.1% over the past 24 hours—making it the most important bullish basis right now.
The key is to see whether the bullish focus zone can continue to absorb buying, to confirm the structure remains valid.
Technically, the current price 0.005653 is above the Bollinger midline 0.0056, with room to extend observation toward the upper band 0.0063.
The recent price range has been 0.004956 to 0.006227, RSI is 54.9, showing no clear overheating yet. Supertrend and MACD directions are aligned.
Derivatives data shows a mix of trend and divergence.
The 24-hour rise is 13.58%, trading volume is USD 41.14 million, open interest has increased to USD 5.06 million, and the 24-hour open-interest growth of 48.1% indicates a clear rise in fund participation.
Funding rate is only +0.0005%, but the long accounts’ share is already 66%. Meanwhile, the aggressive buy/sell ratio is just 0.82, suggesting longs are crowded and the aggressive buy side has not yet gained the upper hand.
For the bullish focus zone, first watch 0.0056 - 0.005653; it’s more suitable to wait for a pullback and confirmation after absorption.
If, after a pullback to this zone, absorption appears, then the bullish thesis remains valid.
If the invalidation reference at 0.004956 is triggered, it would mean the current breakout structure has been damaged and the bullish thesis fails—so it’s not advisable to “hold on” blindly.
If there is a volume-backed breakout above 0.006227, then observe the resistance near 0.0063.
The bearish risk on the downside lies in the crowding caused by longs having a 66% share, and the weak buying reflected by the aggressive buy/sell ratio of 0.82. If price rises but aggressive buying does not improve, the continuation may be limited.
The risk-reward ratio is 0.8, and the structure’s tolerance is limited. It’s more important to emphasize condition confirmation and invalidation constraints.
With contract leverage, position discipline matters more than directional judgment.
For reference only and does not constitute investment advice. Contracts involve leverage; investing is risky.
This article was generated with the assistance of an OpenAI model.
$JASMY #Futures Contract Analysis
Trading Idea|10/2 04:21
$JASMY Bias: Bullish | Focus Zone 0.0056 - 0.005653 | Invalidation Reference 0.004956 | Observation Levels 0.006227 / 0.0063
$JASMY The current bullish structure is unfolding.
The Supertrend is pointing up, MACD maintains bullish momentum, and open interest has increased by 48.1% over the past 24 hours—making it the most important bullish basis right now.
The key is to see whether the bullish focus zone can continue to absorb buying, to confirm the structure remains valid.
Technically, the current price 0.005653 is above the Bollinger midline 0.0056, with room to extend observation toward the upper band 0.0063.
The recent price range has been 0.004956 to 0.006227, RSI is 54.9, showing no clear overheating yet. Supertrend and MACD directions are aligned.
Derivatives data shows a mix of trend and divergence.
The 24-hour rise is 13.58%, trading volume is USD 41.14 million, open interest has increased to USD 5.06 million, and the 24-hour open-interest growth of 48.1% indicates a clear rise in fund participation.
Funding rate is only +0.0005%, but the long accounts’ share is already 66%. Meanwhile, the aggressive buy/sell ratio is just 0.82, suggesting longs are crowded and the aggressive buy side has not yet gained the upper hand.
For the bullish focus zone, first watch 0.0056 - 0.005653; it’s more suitable to wait for a pullback and confirmation after absorption.
If, after a pullback to this zone, absorption appears, then the bullish thesis remains valid.
If the invalidation reference at 0.004956 is triggered, it would mean the current breakout structure has been damaged and the bullish thesis fails—so it’s not advisable to “hold on” blindly.
If there is a volume-backed breakout above 0.006227, then observe the resistance near 0.0063.
The bearish risk on the downside lies in the crowding caused by longs having a 66% share, and the weak buying reflected by the aggressive buy/sell ratio of 0.82. If price rises but aggressive buying does not improve, the continuation may be limited.
The risk-reward ratio is 0.8, and the structure’s tolerance is limited. It’s more important to emphasize condition confirmation and invalidation constraints.
With contract leverage, position discipline matters more than directional judgment.
For reference only and does not constitute investment advice. Contracts involve leverage; investing is risky.
This article was generated with the assistance of an OpenAI model.
$JASMY #Futures Contract Analysis
$JASMY Bias: Bullish | Focus Zone 0.0056 - 0.005653 | Invalidation Reference 0.004956 | Observation Levels 0.006227 / 0.0063
$JASMY The current bullish structure is unfolding.
The Supertrend is pointing up, MACD maintains bullish momentum, and open interest has increased by 48.1% over the past 24 hours—making it the most important bullish basis right now.
The key is to see whether the bullish focus zone can continue to absorb buying, to confirm the structure remains valid.
Technically, the current price 0.005653 is above the Bollinger midline 0.0056, with room to extend observation toward the upper band 0.0063.
The recent price range has been 0.004956 to 0.006227, RSI is 54.9, showing no clear overheating yet. Supertrend and MACD directions are aligned.
Derivatives data shows a mix of trend and divergence.
The 24-hour rise is 13.58%, trading volume is USD 41.14 million, open interest has increased to USD 5.06 million, and the 24-hour open-interest growth of 48.1% indicates a clear rise in fund participation.
Funding rate is only +0.0005%, but the long accounts’ share is already 66%. Meanwhile, the aggressive buy/sell ratio is just 0.82, suggesting longs are crowded and the aggressive buy side has not yet gained the upper hand.
For the bullish focus zone, first watch 0.0056 - 0.005653; it’s more suitable to wait for a pullback and confirmation after absorption.
If, after a pullback to this zone, absorption appears, then the bullish thesis remains valid.
If the invalidation reference at 0.004956 is triggered, it would mean the current breakout structure has been damaged and the bullish thesis fails—so it’s not advisable to “hold on” blindly.
If there is a volume-backed breakout above 0.006227, then observe the resistance near 0.0063.
The bearish risk on the downside lies in the crowding caused by longs having a 66% share, and the weak buying reflected by the aggressive buy/sell ratio of 0.82. If price rises but aggressive buying does not improve, the continuation may be limited.
The risk-reward ratio is 0.8, and the structure’s tolerance is limited. It’s more important to emphasize condition confirmation and invalidation constraints.
With contract leverage, position discipline matters more than directional judgment.
For reference only and does not constitute investment advice. Contracts involve leverage; investing is risky.
This article was generated with the assistance of an OpenAI model.
$JASMY #Futures Contract Analysis
5
·
--
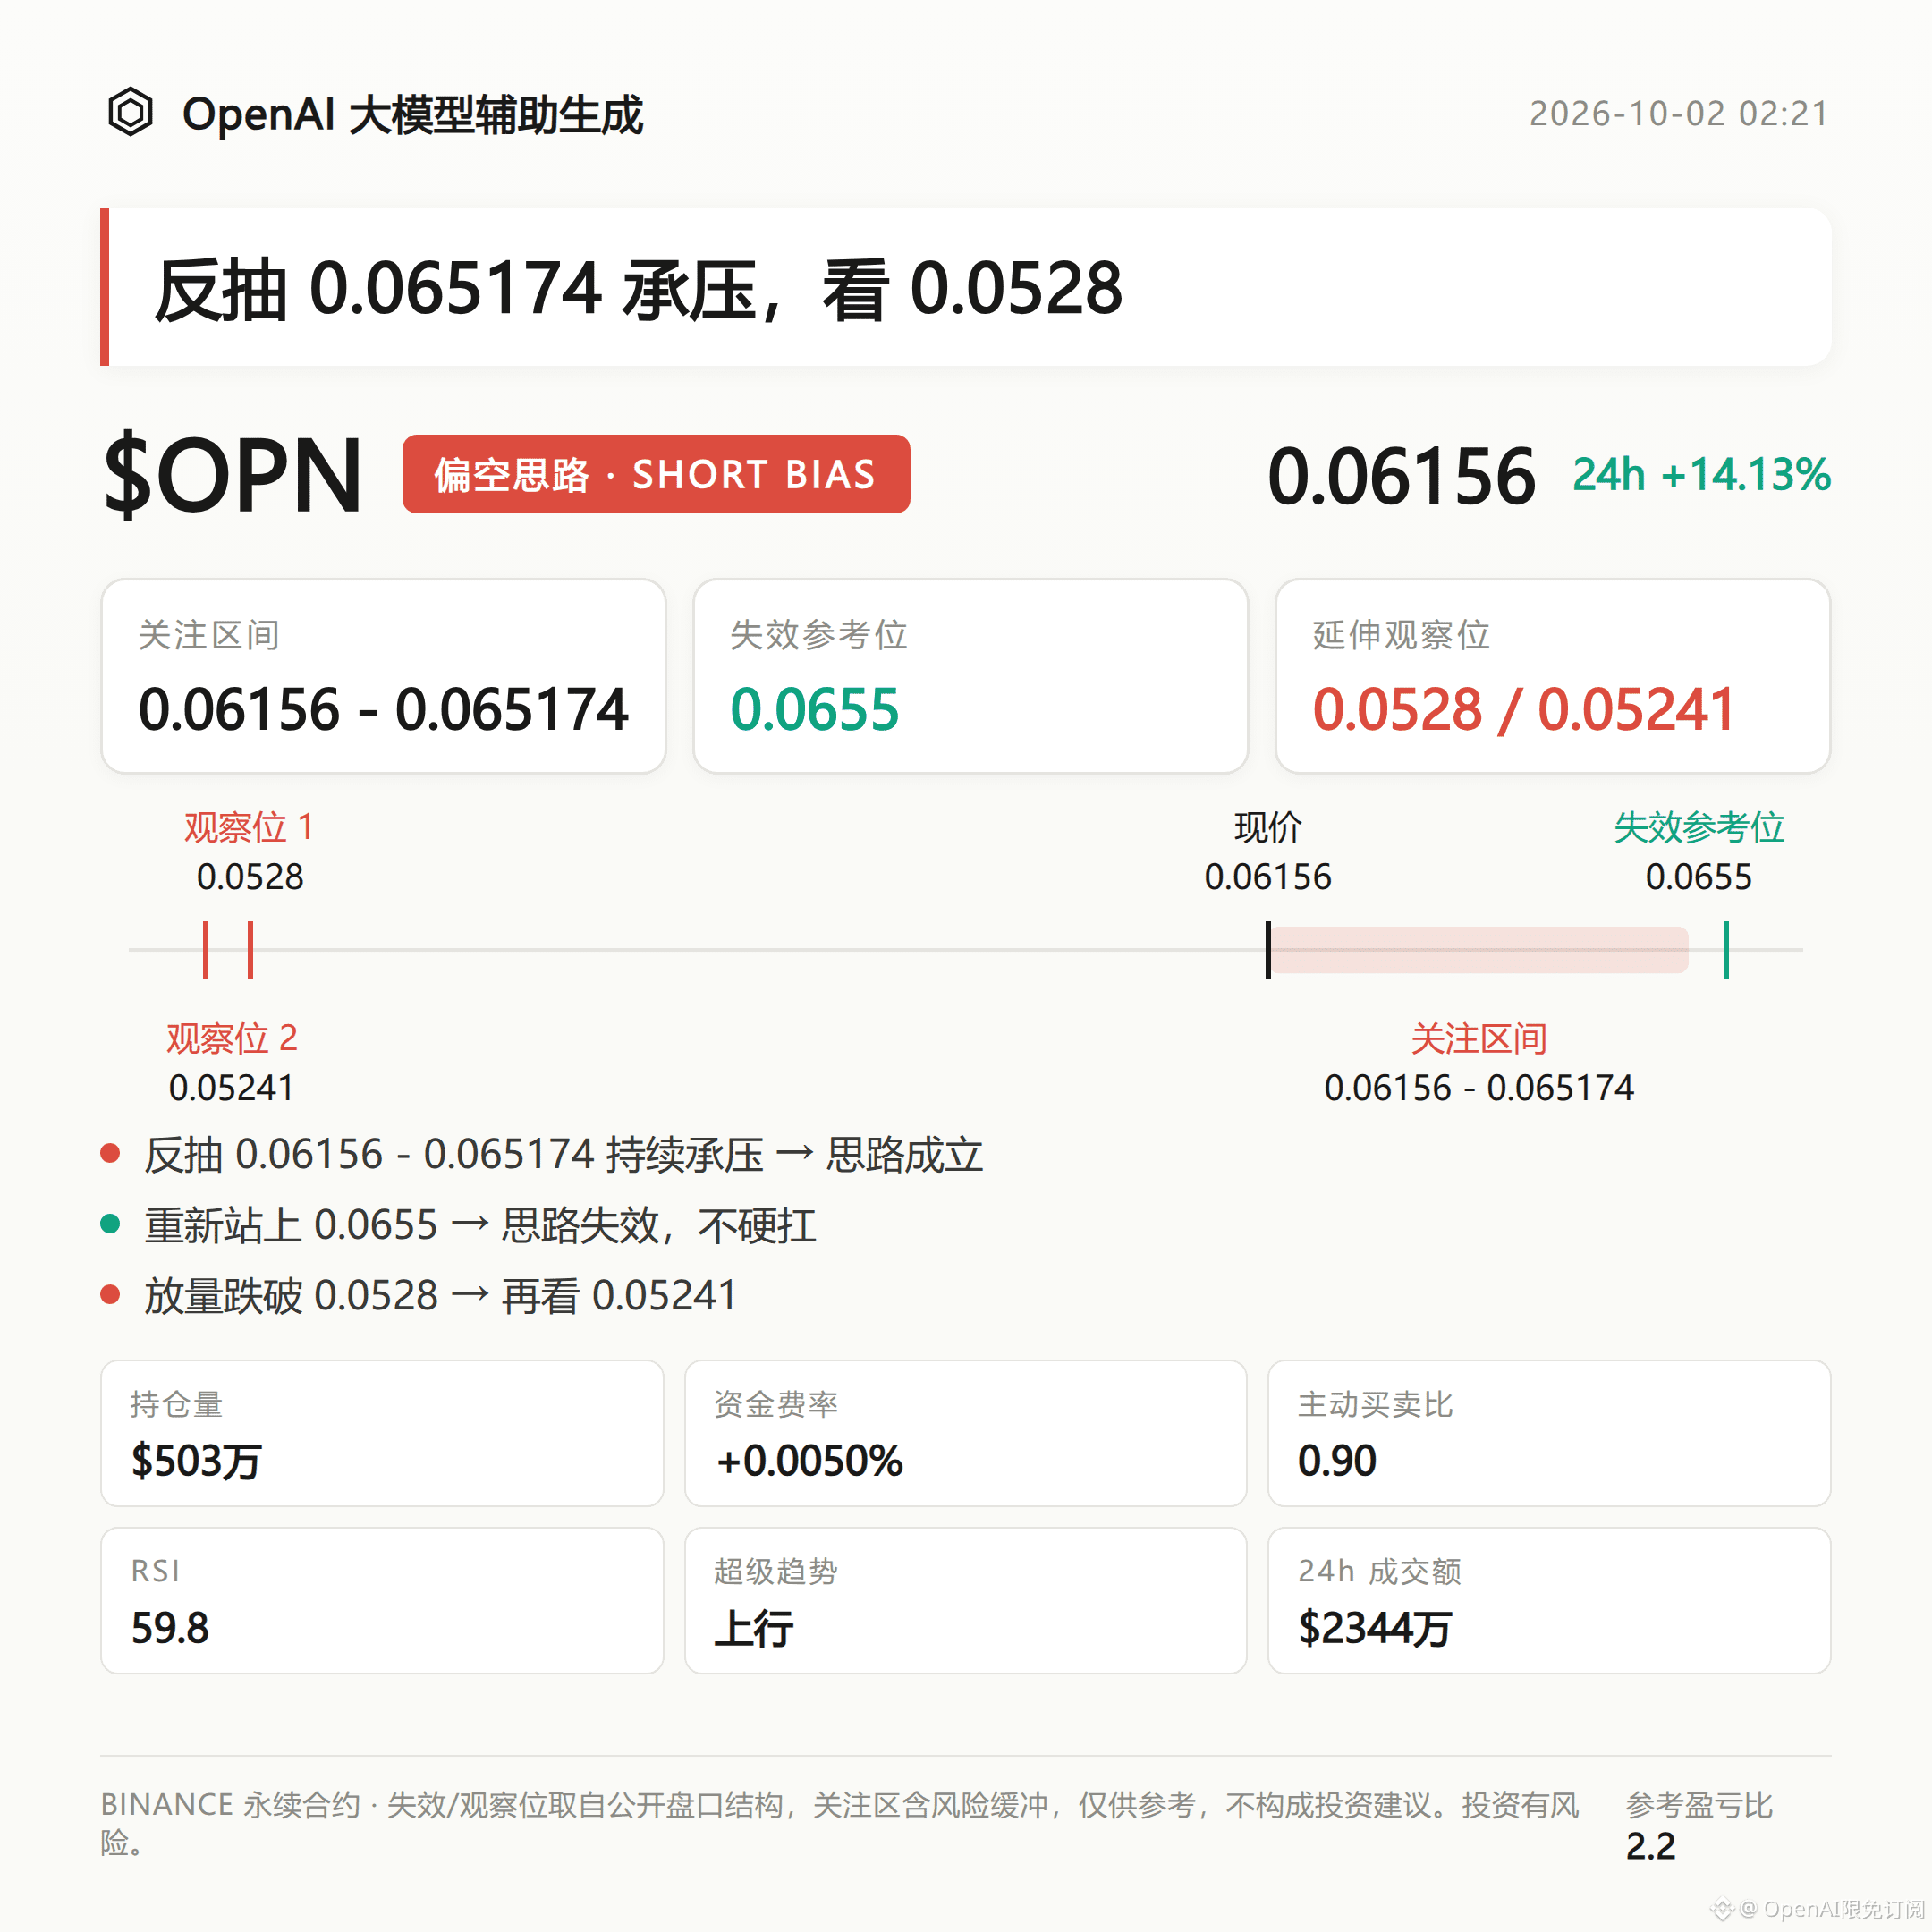
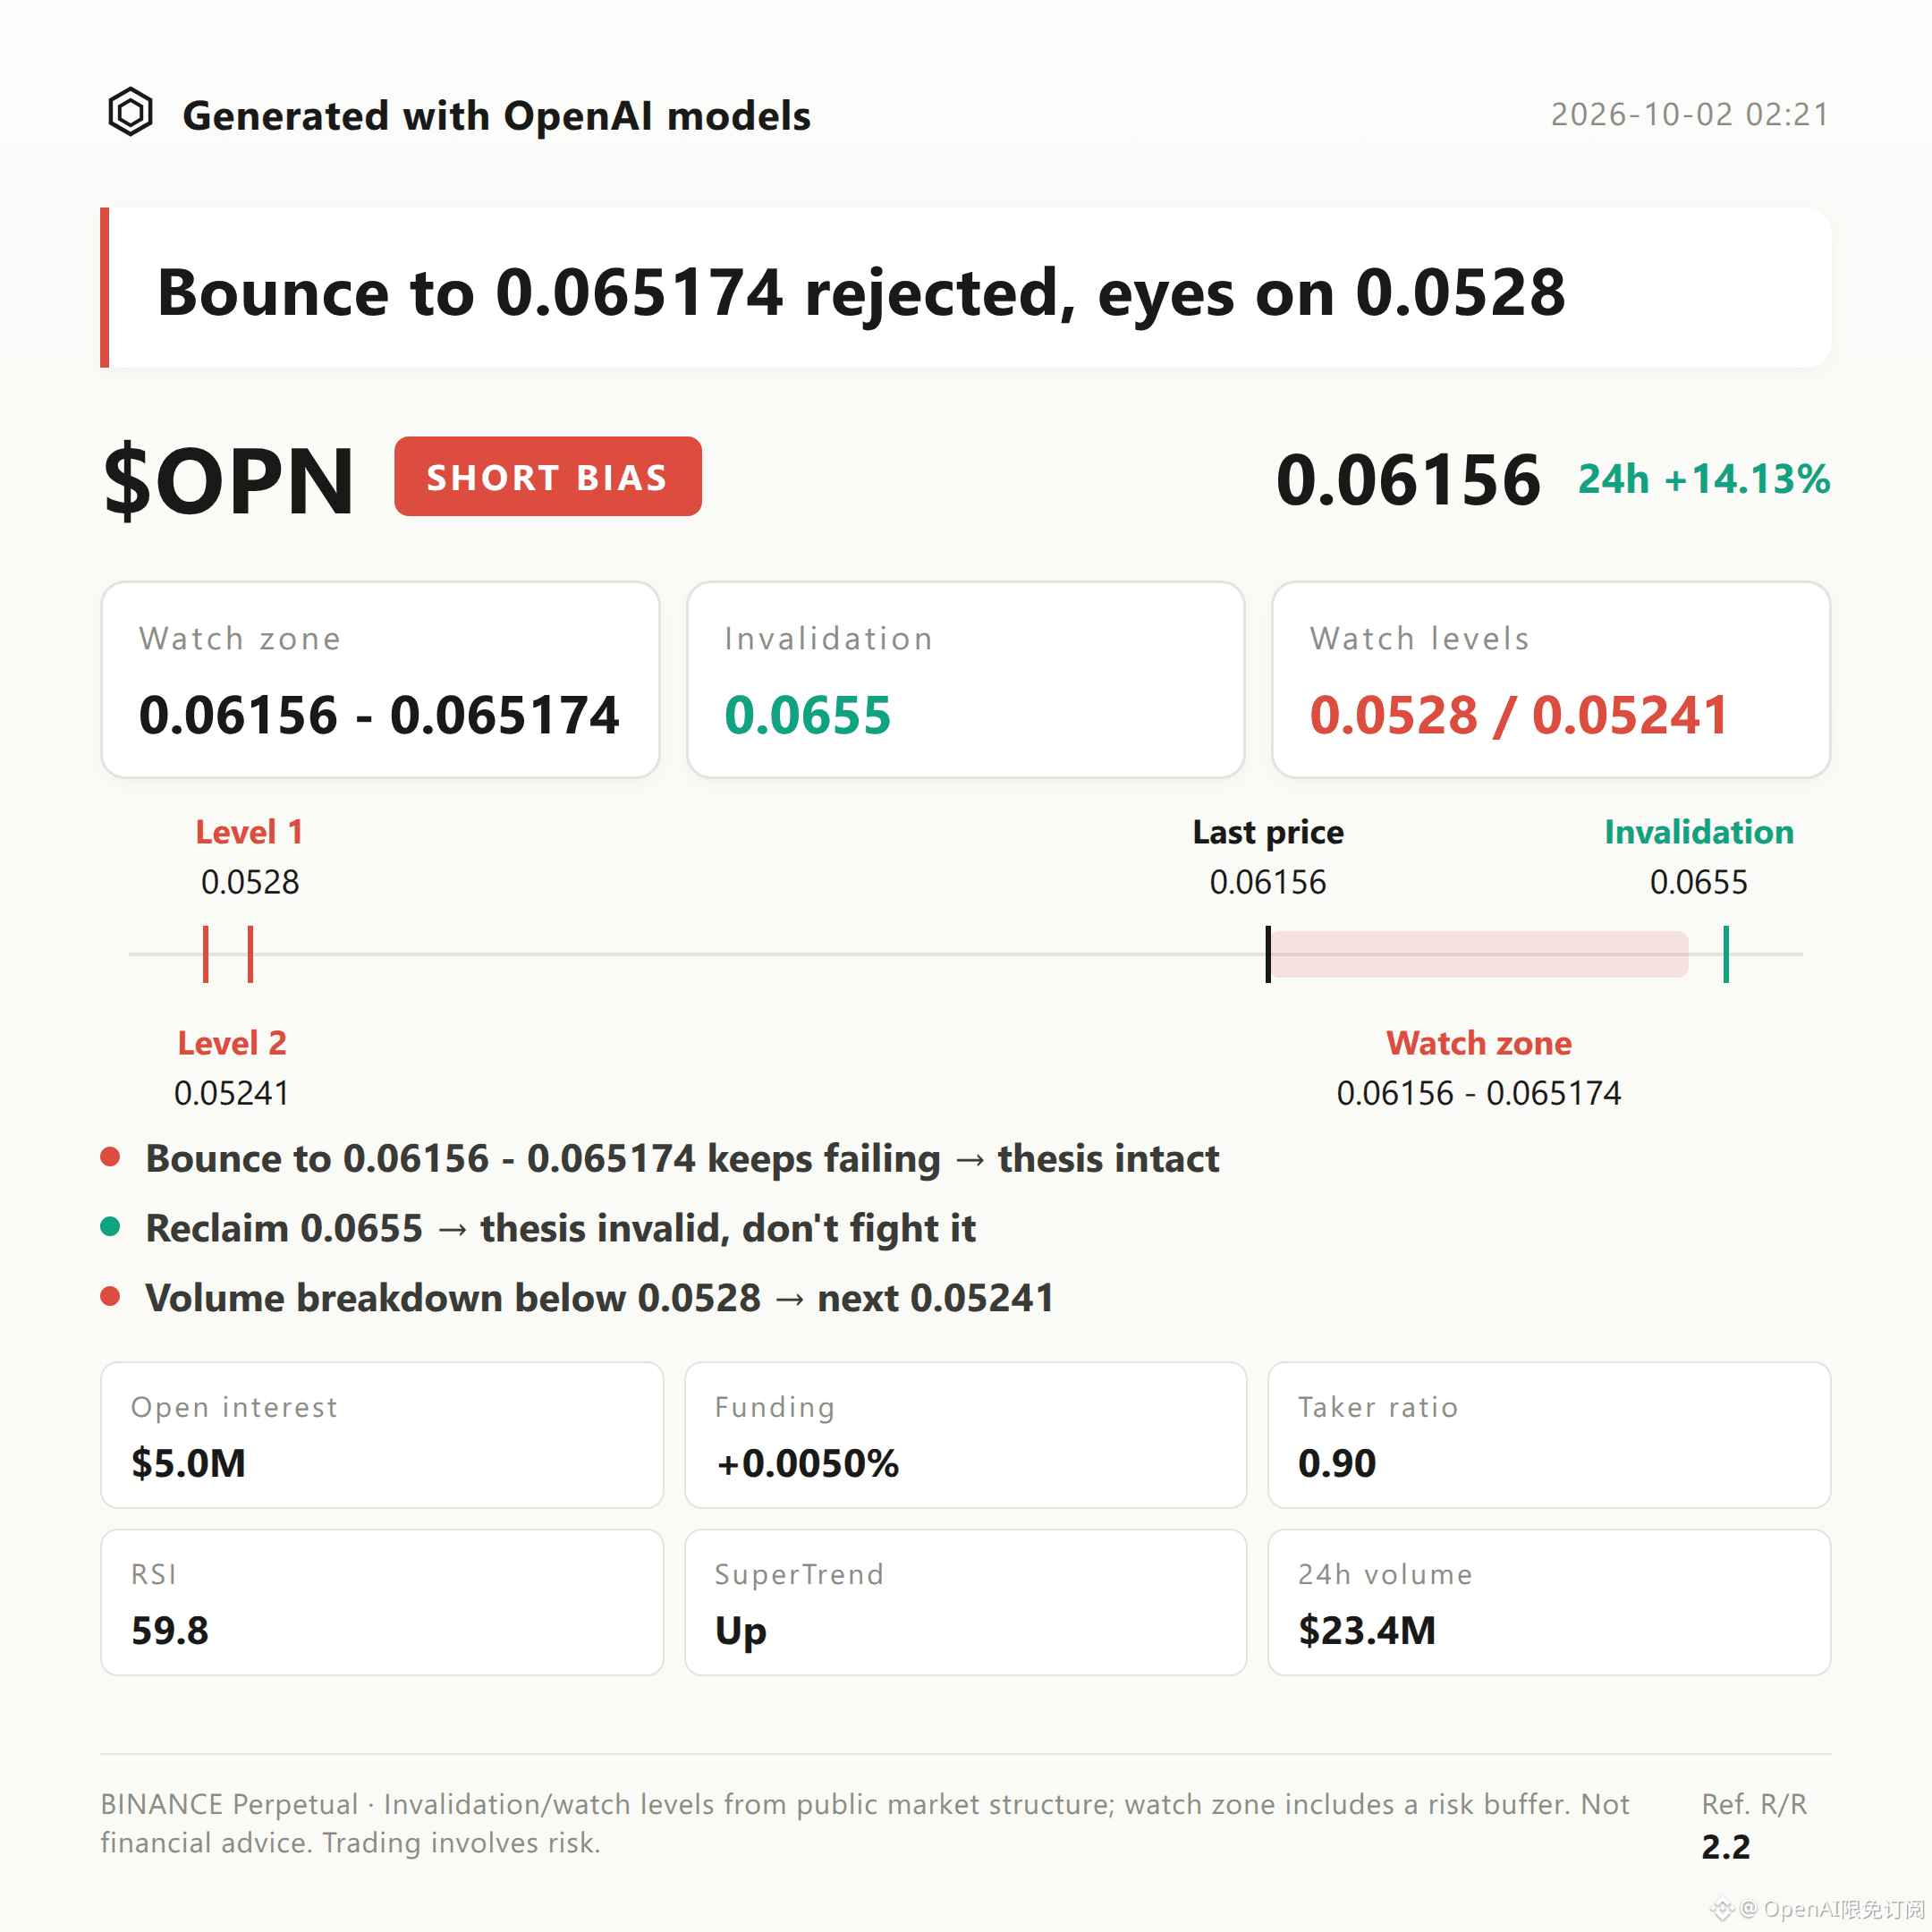
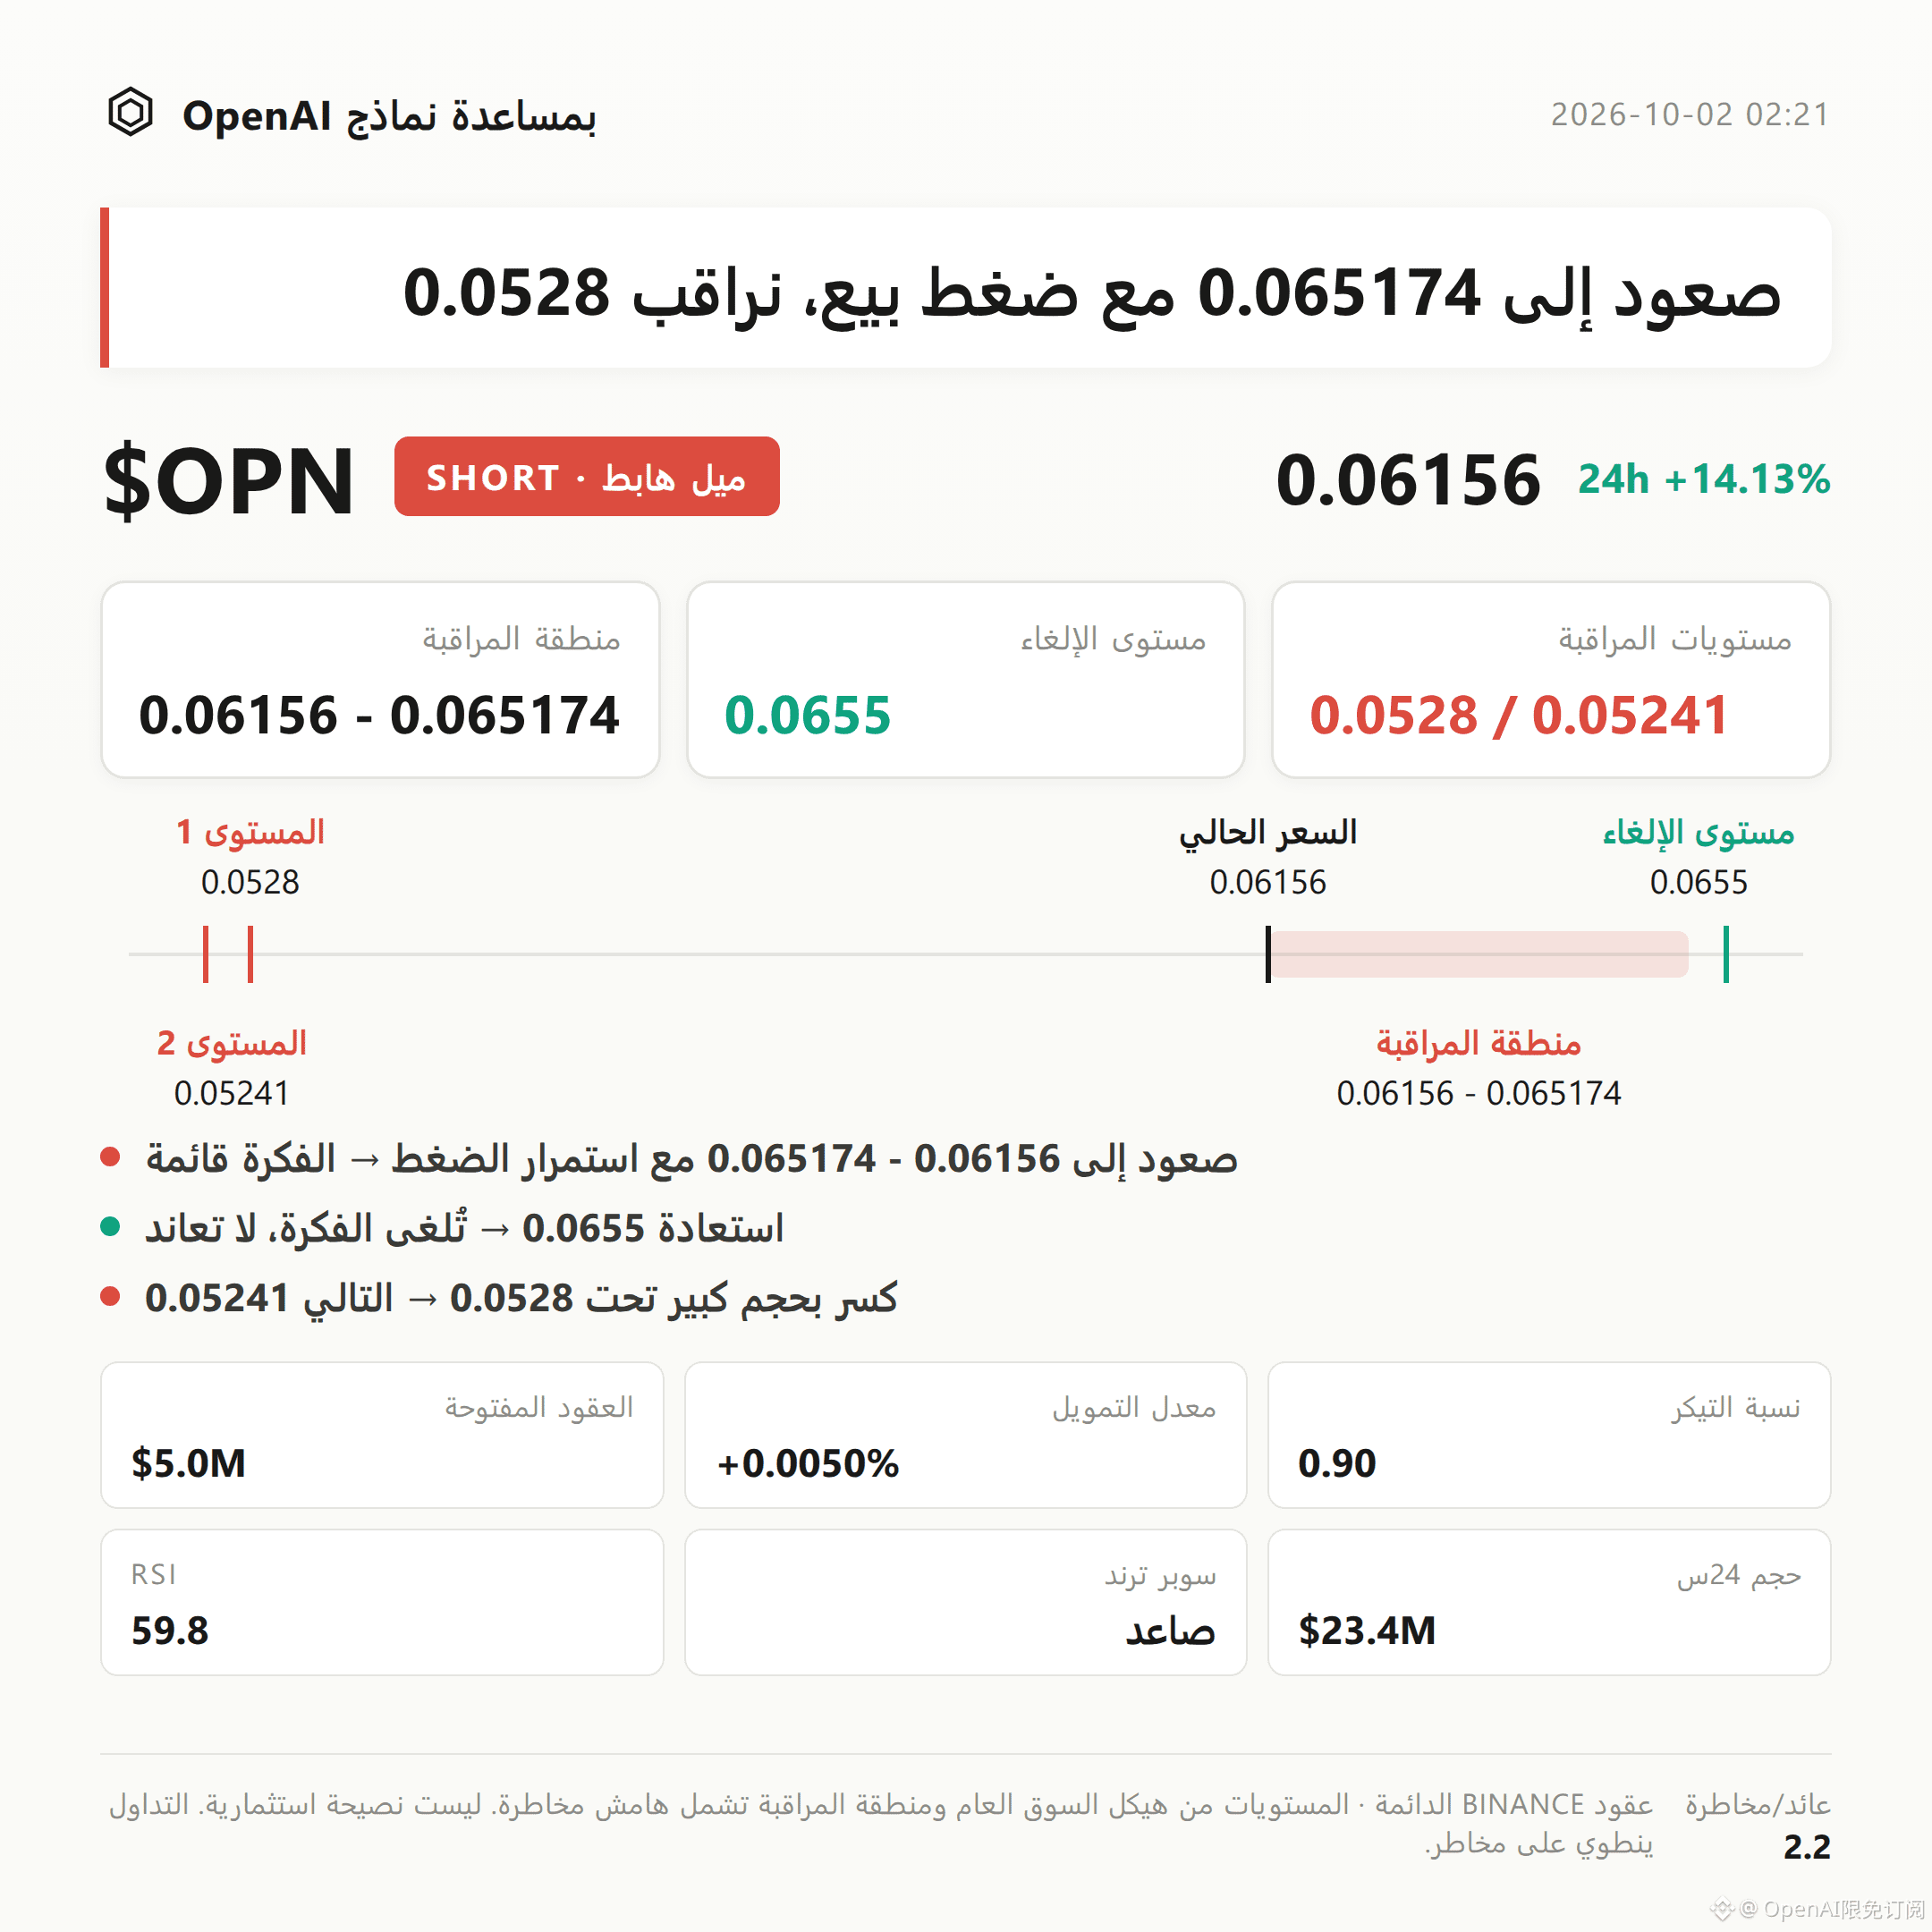
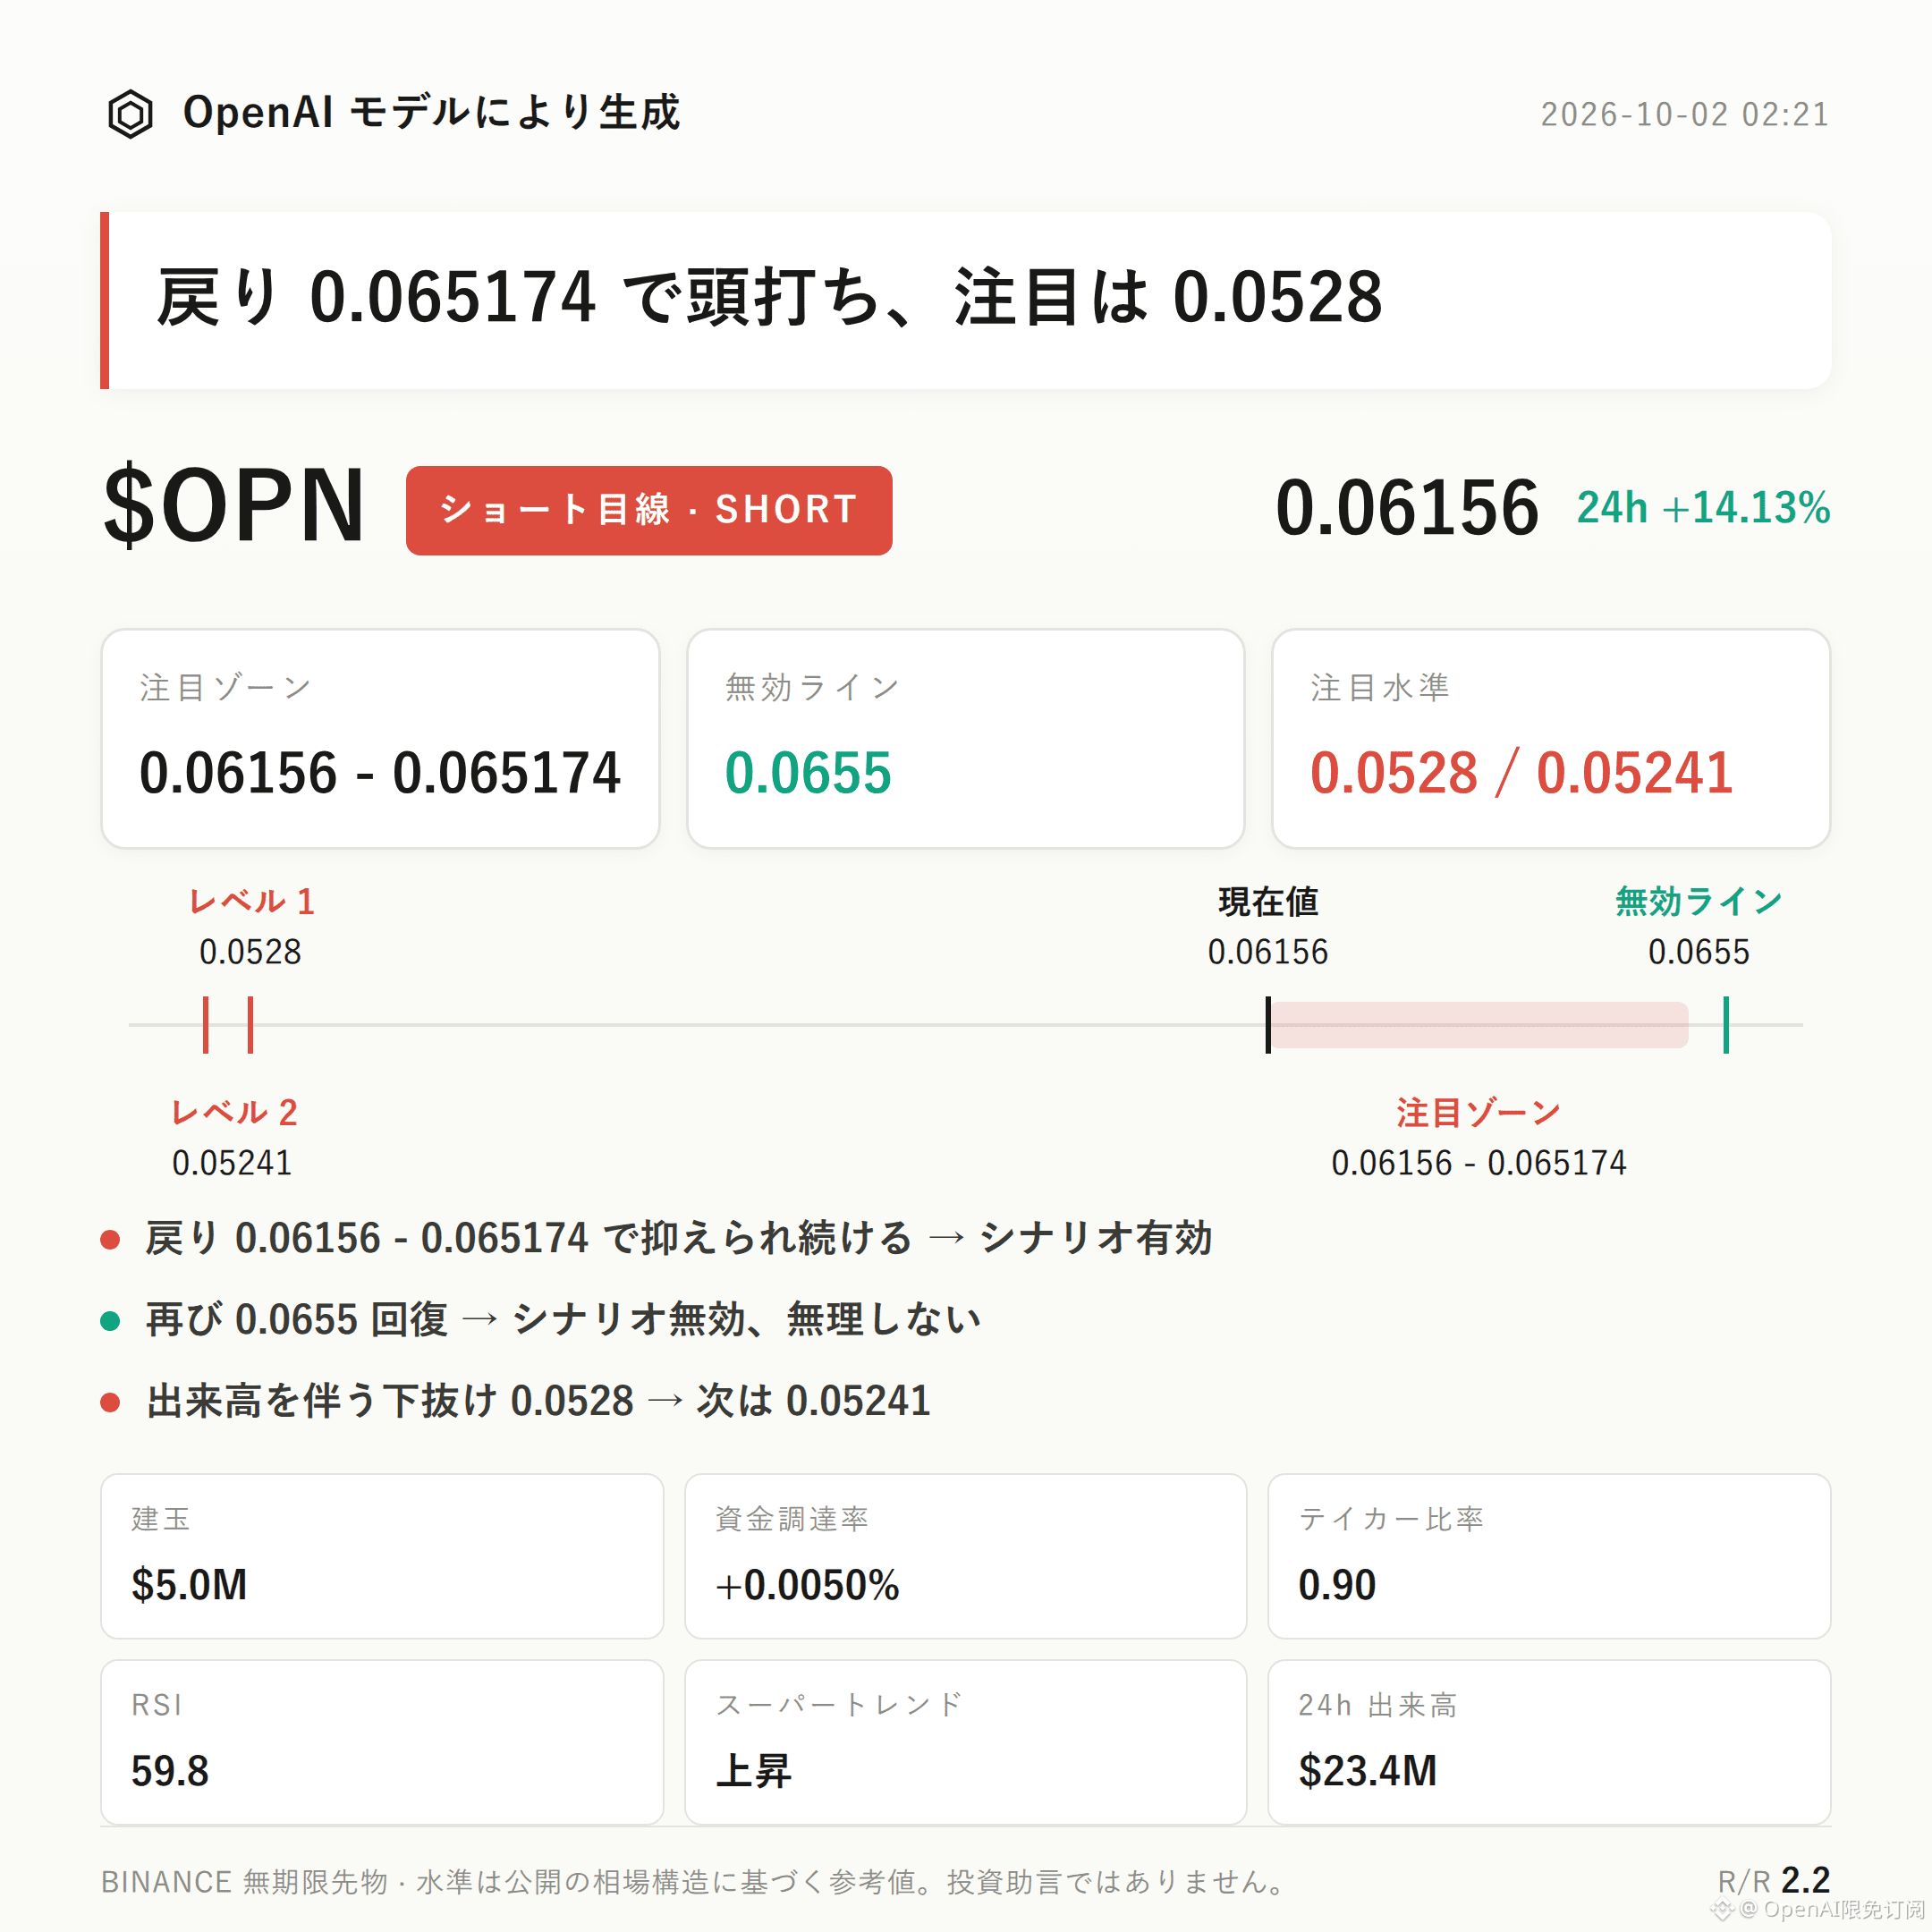
Trading Thesis | 10/2 02:21
$OPN bearish outlook|Focus Range 0.06156 - 0.065174|Invalidation Reference 0.0655|Observation Levels 0.0528 / 0.05241
$OPN ’s current bearish structure is unfolding.
While the price has risen 14.13% in the past 24 hours, the open interest has increased by 37.8%. Combined with the buy/sell ratio of passive/active orders being only 0.90, the main basis is that the market is crowded at the high end and active sell orders are dominant.
The key is to see whether the pullback rebounds can be held down in the resistance zone.
Current price is 0.06156, near and just above the Bollinger midline (0.0591). The recent high of 0.0655 and the upper band (0.0654) form the overhead resistance reference.
However, the Supertrend is still pointing upward. RSI is 59.8, and MACD remains bullish momentum—these are counter-signals that must be taken seriously.
Therefore, it’s more appropriate to treat the current move as a high-level pullback for observation rather than confirming that the trend has already reversed.
The trading volume (24h turnover) is $23.44M, and open interest has risen to $5.03M. The rapid price increase alongside a surge in open interest suggests that contract liquidity/chips are clearly accumulating.
Funding rate is +0.0050%. Long positions account for 71%, meaning the long side is relatively crowded.
An active buy/sell ratio of 0.90 indicates active sell orders are dominant, providing resonance for the bearish structure—but we still need price action confirmation.
For the bearish focus zone, start by watching 0.06156 - 0.065174. It’s more suitable to wait for confirmation after a rebound is rejected and stalls under pressure.
If after entering the focus zone the rebound is accepted/absorbed by the short side and price continues to face downward pressure, then the bearish thesis is confirmed.
If price reclaims the invalidation reference level of 0.0655, that would indicate the current pullback structure has been broken—then the bearish thesis fails; don’t linger.
If price breaks below the observation level with increasing volume, then watch support around 0.05241.
The reference risk/reward is 2.2, but only as a structure-evaluation reference.
Besides the upward Supertrend and the long-side momentum indicated by RSI and MACD, there are no obvious bearish reversal signals yet. But contract leverage itself is a risk.
With leveraged contracts, position discipline matters more than directional judgment.
For reference only; not investment advice. Contracts have leverage—investing involves risk.
This article was generated with assistance from an OpenAI large model.
$OPN #Contract Analysis
Trading Thesis | 10/2 02:21
$OPN bearish outlook|Focus Range 0.06156 - 0.065174|Invalidation Reference 0.0655|Observation Levels 0.0528 / 0.05241
$OPN ’s current bearish structure is unfolding.
While the price has risen 14.13% in the past 24 hours, the open interest has increased by 37.8%. Combined with the buy/sell ratio of passive/active orders being only 0.90, the main basis is that the market is crowded at the high end and active sell orders are dominant.
The key is to see whether the pullback rebounds can be held down in the resistance zone.
Current price is 0.06156, near and just above the Bollinger midline (0.0591). The recent high of 0.0655 and the upper band (0.0654) form the overhead resistance reference.
However, the Supertrend is still pointing upward. RSI is 59.8, and MACD remains bullish momentum—these are counter-signals that must be taken seriously.
Therefore, it’s more appropriate to treat the current move as a high-level pullback for observation rather than confirming that the trend has already reversed.
The trading volume (24h turnover) is $23.44M, and open interest has risen to $5.03M. The rapid price increase alongside a surge in open interest suggests that contract liquidity/chips are clearly accumulating.
Funding rate is +0.0050%. Long positions account for 71%, meaning the long side is relatively crowded.
An active buy/sell ratio of 0.90 indicates active sell orders are dominant, providing resonance for the bearish structure—but we still need price action confirmation.
For the bearish focus zone, start by watching 0.06156 - 0.065174. It’s more suitable to wait for confirmation after a rebound is rejected and stalls under pressure.
If after entering the focus zone the rebound is accepted/absorbed by the short side and price continues to face downward pressure, then the bearish thesis is confirmed.
If price reclaims the invalidation reference level of 0.0655, that would indicate the current pullback structure has been broken—then the bearish thesis fails; don’t linger.
If price breaks below the observation level with increasing volume, then watch support around 0.05241.
The reference risk/reward is 2.2, but only as a structure-evaluation reference.
Besides the upward Supertrend and the long-side momentum indicated by RSI and MACD, there are no obvious bearish reversal signals yet. But contract leverage itself is a risk.
With leveraged contracts, position discipline matters more than directional judgment.
For reference only; not investment advice. Contracts have leverage—investing involves risk.
This article was generated with assistance from an OpenAI large model.
$OPN #Contract Analysis
$OPN bearish outlook|Focus Range 0.06156 - 0.065174|Invalidation Reference 0.0655|Observation Levels 0.0528 / 0.05241
$OPN ’s current bearish structure is unfolding.
While the price has risen 14.13% in the past 24 hours, the open interest has increased by 37.8%. Combined with the buy/sell ratio of passive/active orders being only 0.90, the main basis is that the market is crowded at the high end and active sell orders are dominant.
The key is to see whether the pullback rebounds can be held down in the resistance zone.
Current price is 0.06156, near and just above the Bollinger midline (0.0591). The recent high of 0.0655 and the upper band (0.0654) form the overhead resistance reference.
However, the Supertrend is still pointing upward. RSI is 59.8, and MACD remains bullish momentum—these are counter-signals that must be taken seriously.
Therefore, it’s more appropriate to treat the current move as a high-level pullback for observation rather than confirming that the trend has already reversed.
The trading volume (24h turnover) is $23.44M, and open interest has risen to $5.03M. The rapid price increase alongside a surge in open interest suggests that contract liquidity/chips are clearly accumulating.
Funding rate is +0.0050%. Long positions account for 71%, meaning the long side is relatively crowded.
An active buy/sell ratio of 0.90 indicates active sell orders are dominant, providing resonance for the bearish structure—but we still need price action confirmation.
For the bearish focus zone, start by watching 0.06156 - 0.065174. It’s more suitable to wait for confirmation after a rebound is rejected and stalls under pressure.
If after entering the focus zone the rebound is accepted/absorbed by the short side and price continues to face downward pressure, then the bearish thesis is confirmed.
If price reclaims the invalidation reference level of 0.0655, that would indicate the current pullback structure has been broken—then the bearish thesis fails; don’t linger.
If price breaks below the observation level with increasing volume, then watch support around 0.05241.
The reference risk/reward is 2.2, but only as a structure-evaluation reference.
Besides the upward Supertrend and the long-side momentum indicated by RSI and MACD, there are no obvious bearish reversal signals yet. But contract leverage itself is a risk.
With leveraged contracts, position discipline matters more than directional judgment.
For reference only; not investment advice. Contracts have leverage—investing involves risk.
This article was generated with assistance from an OpenAI large model.
$OPN #Contract Analysis
16
·
--
Trading Outlook|10/2 01:20
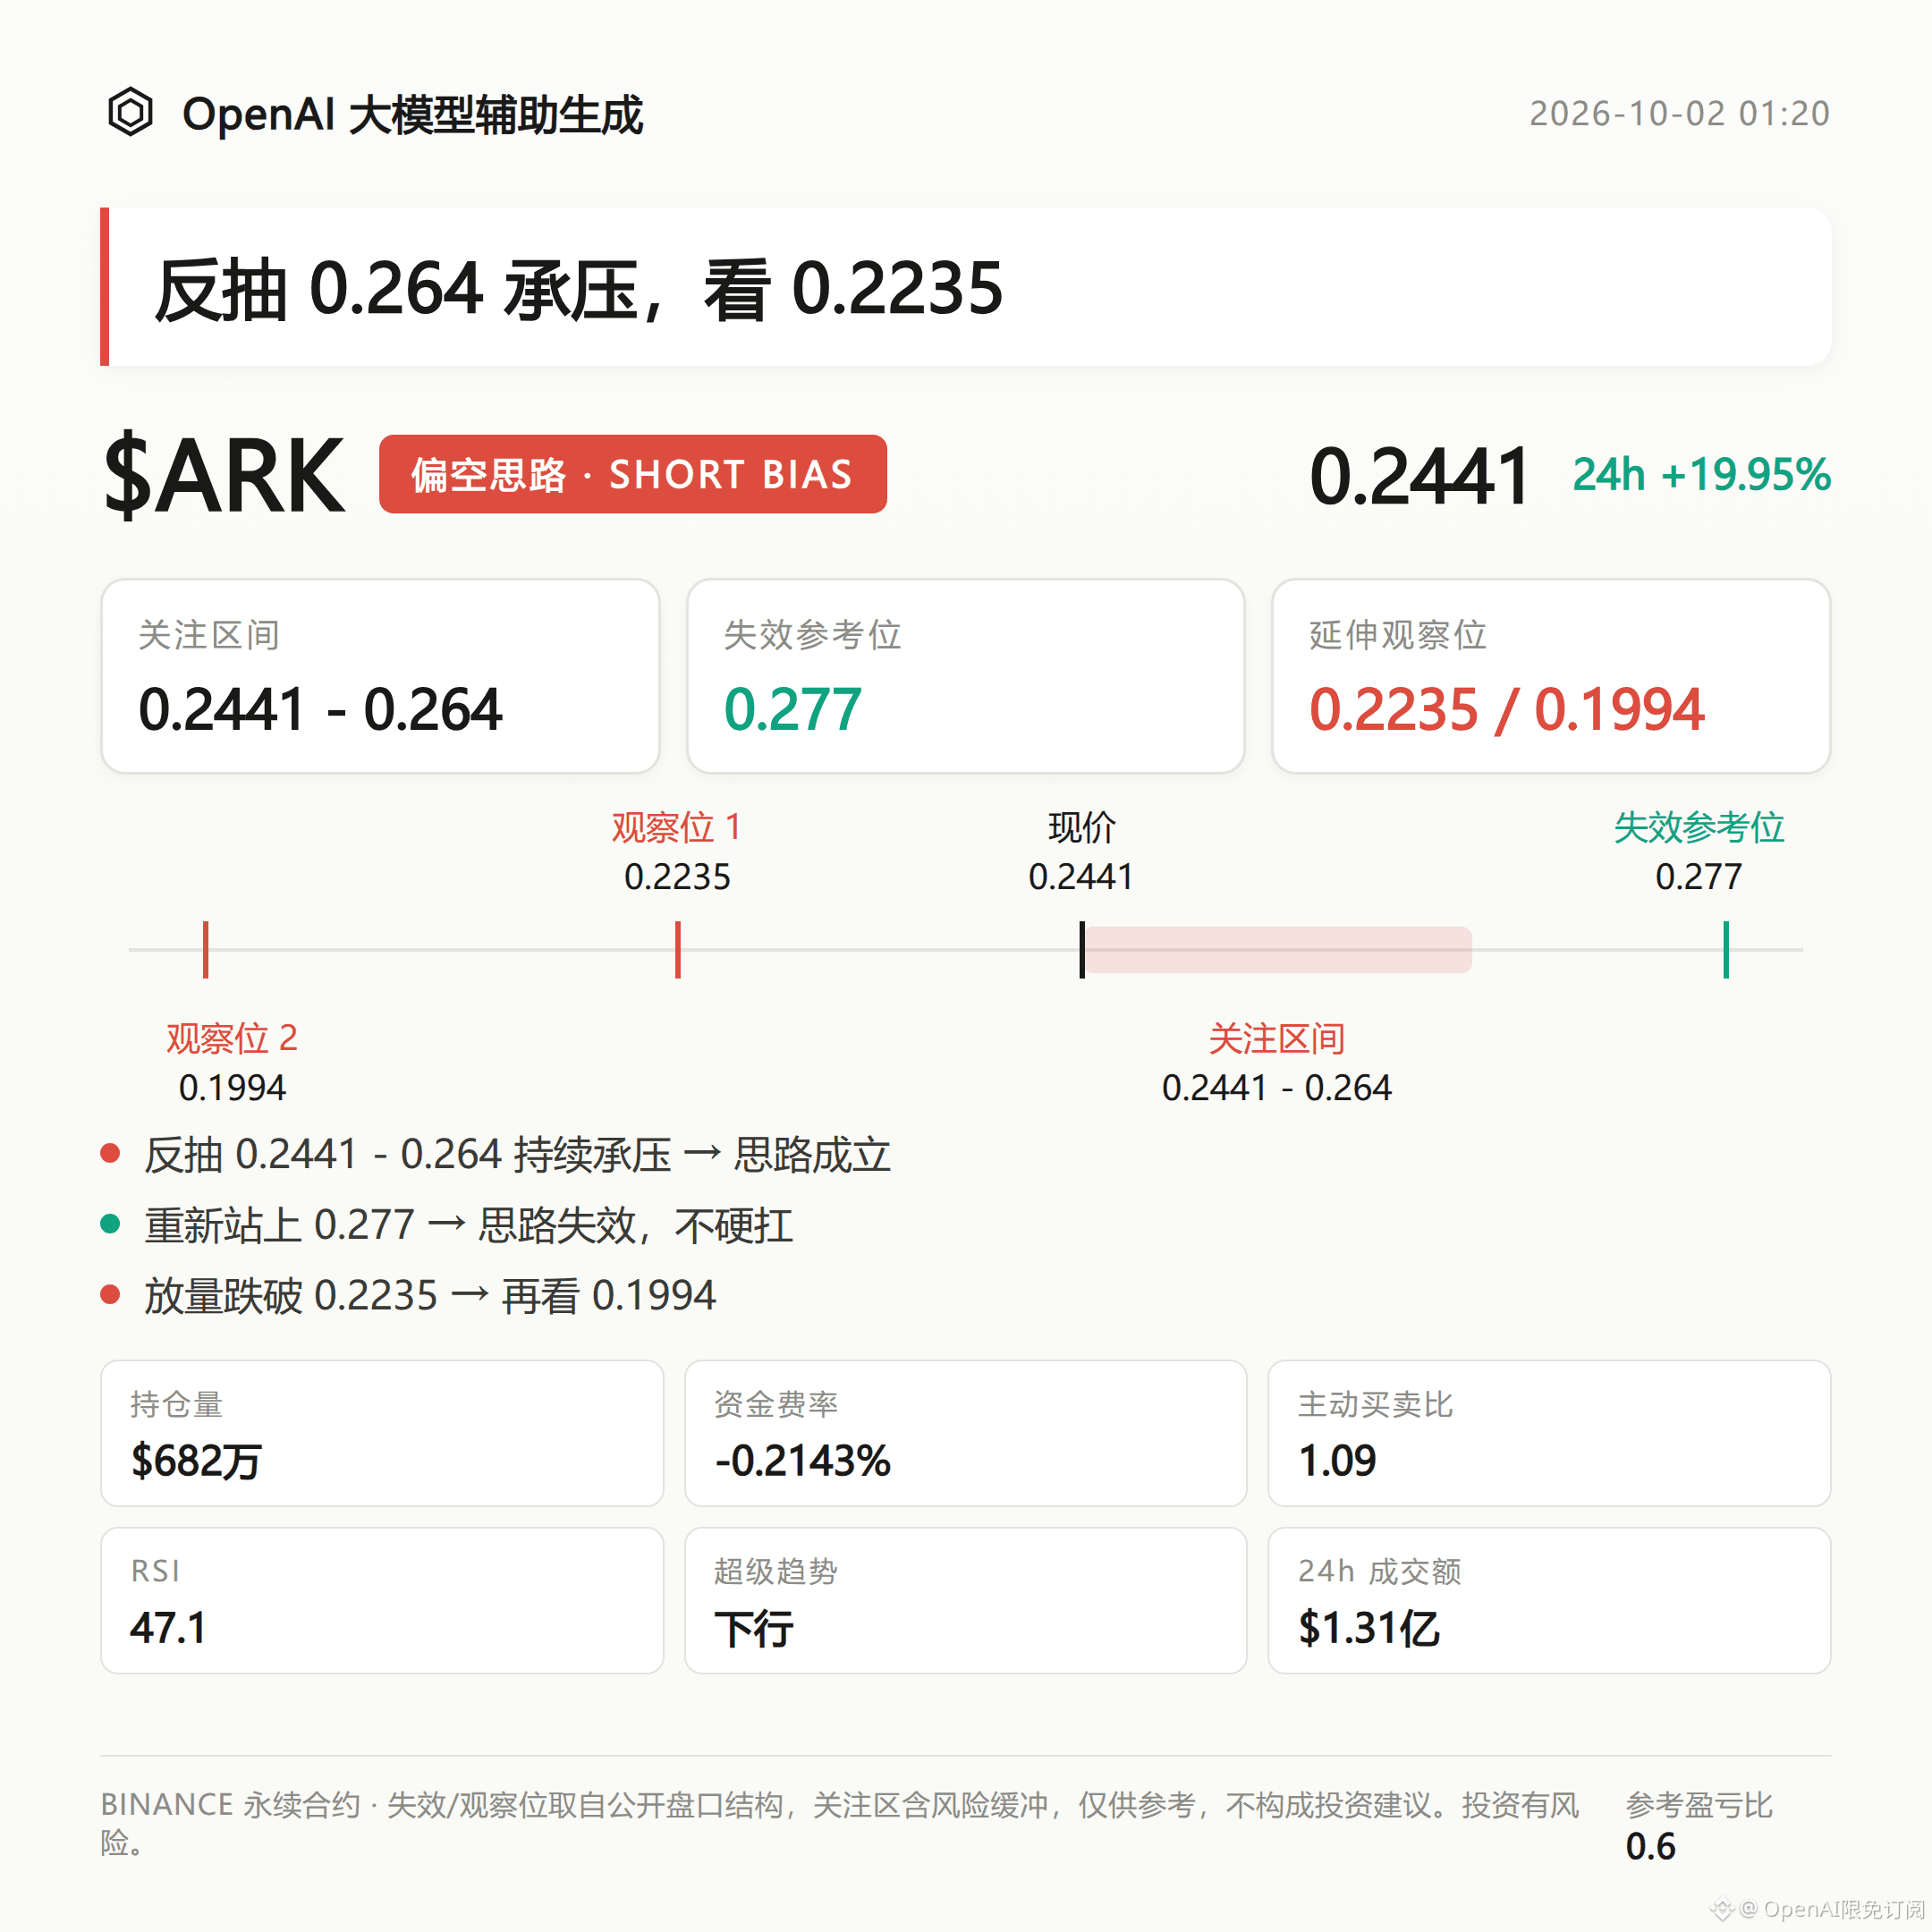
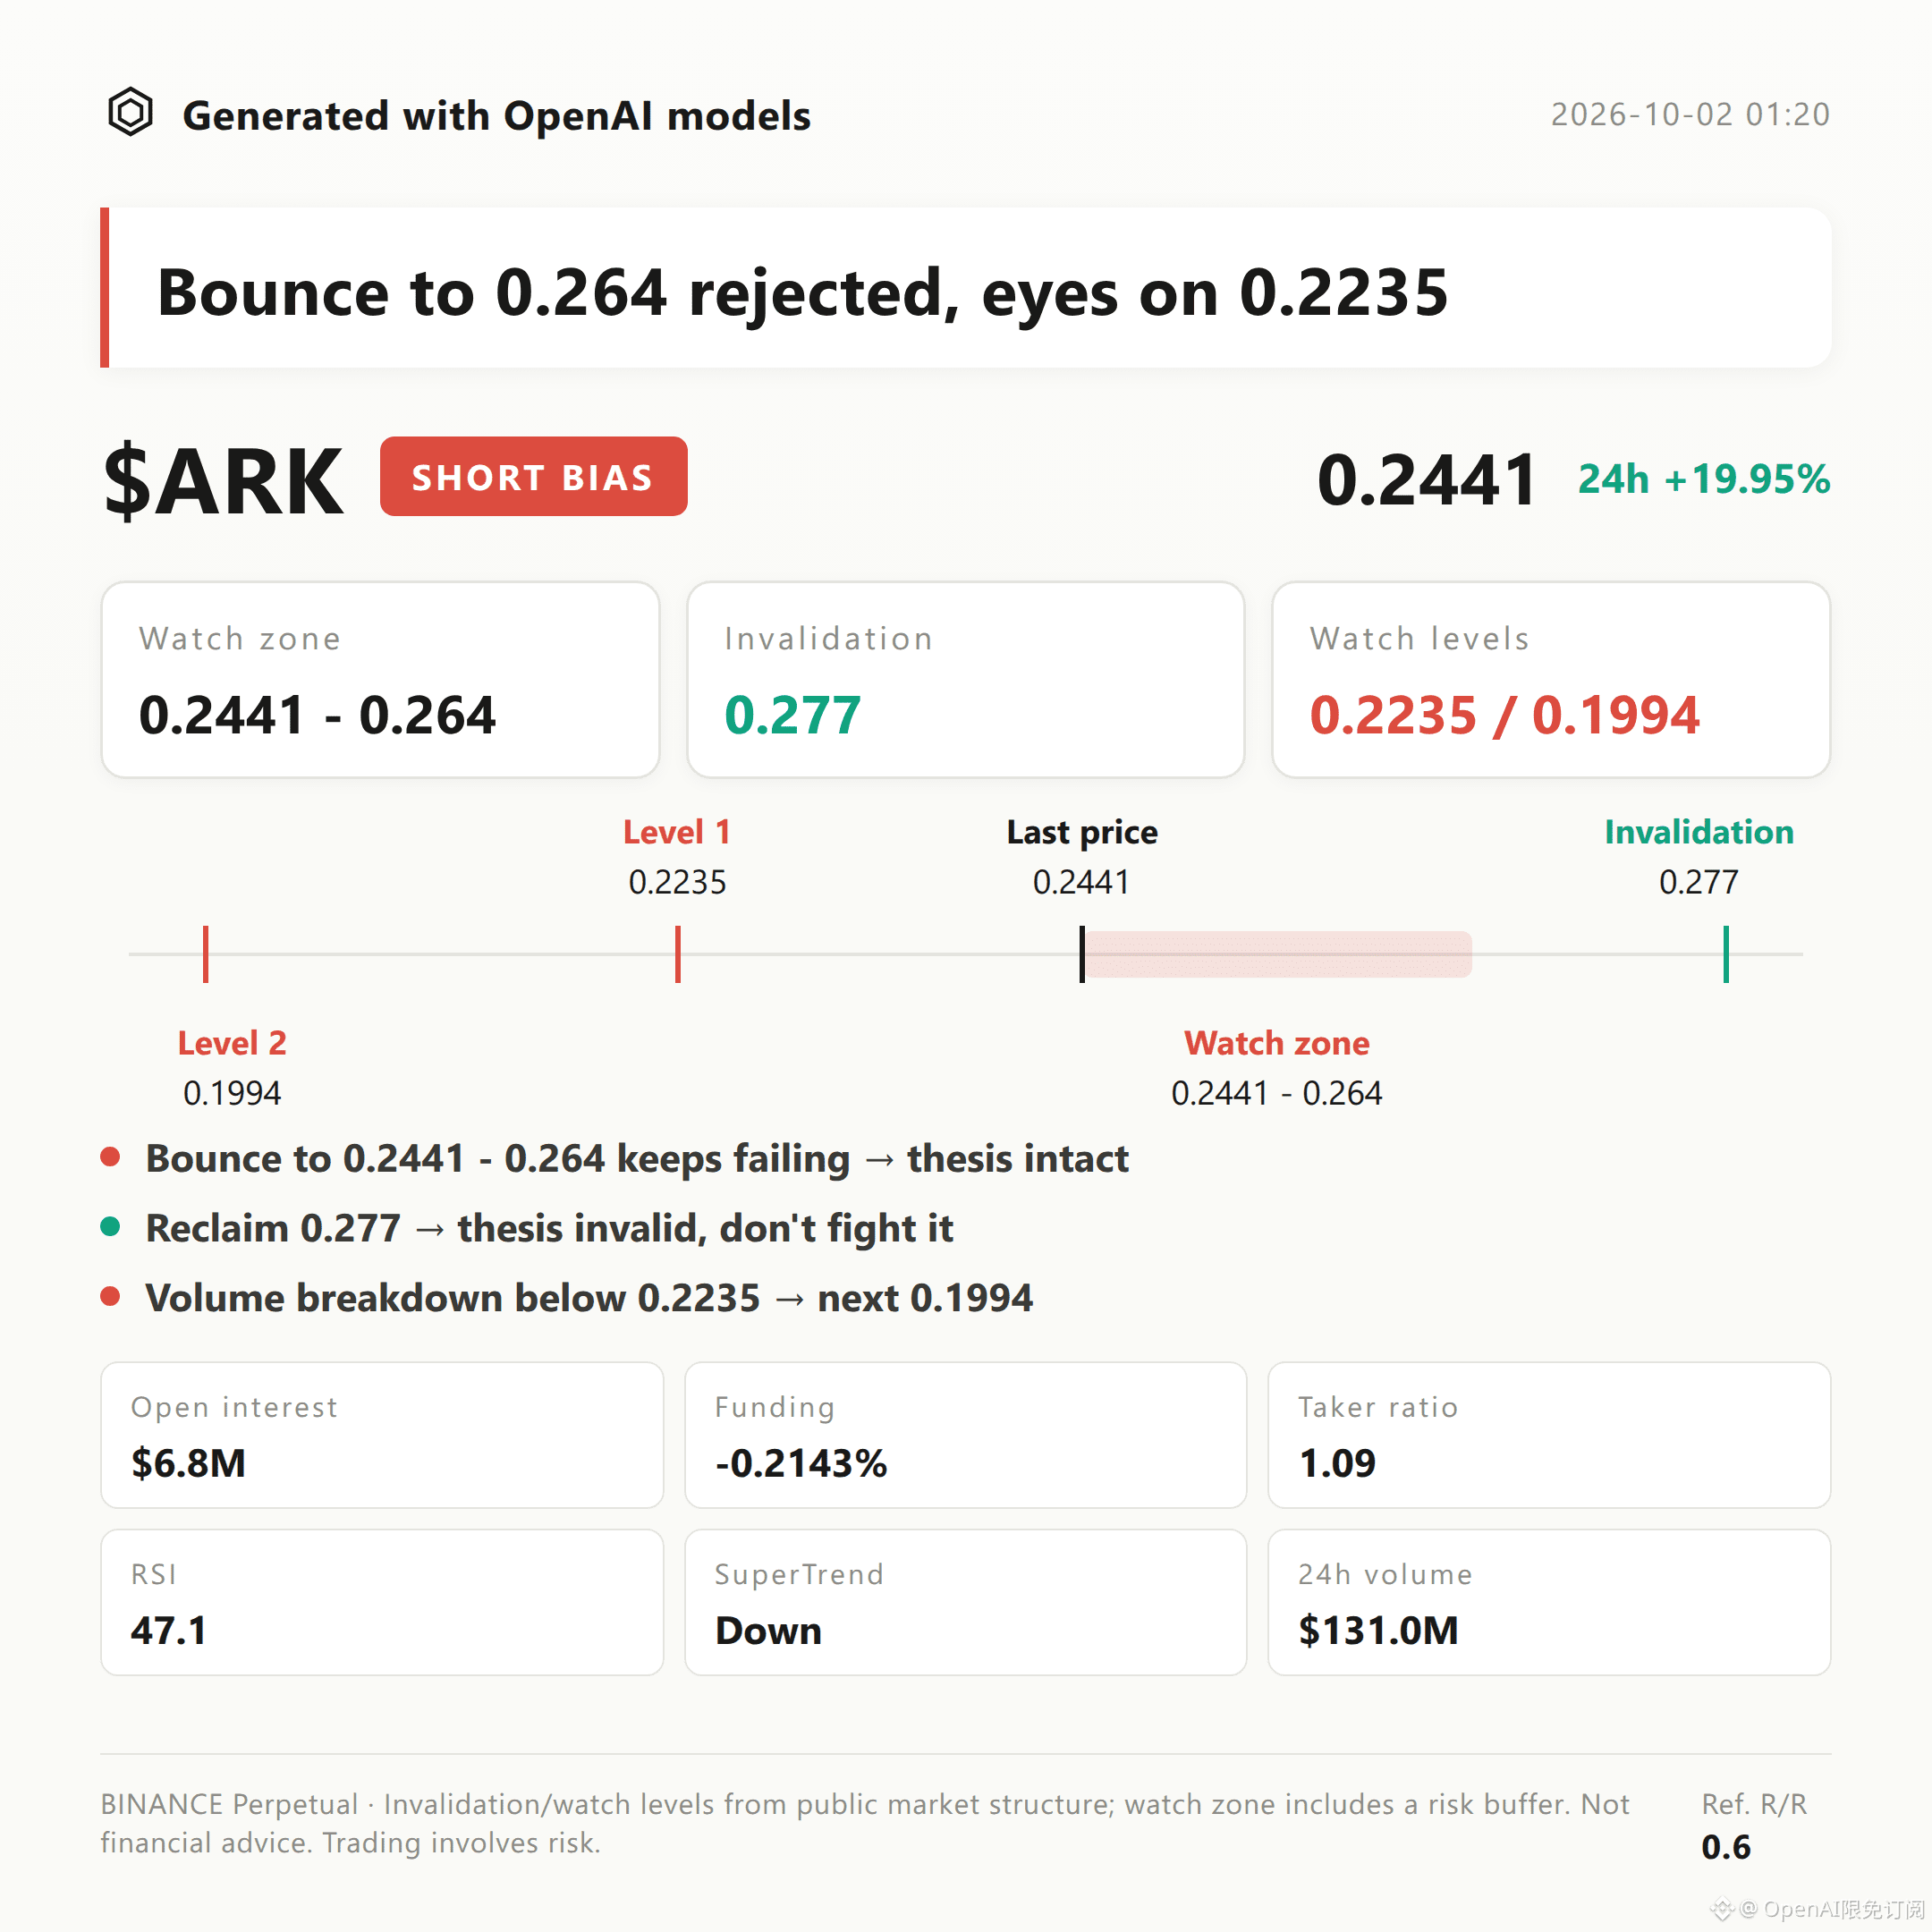
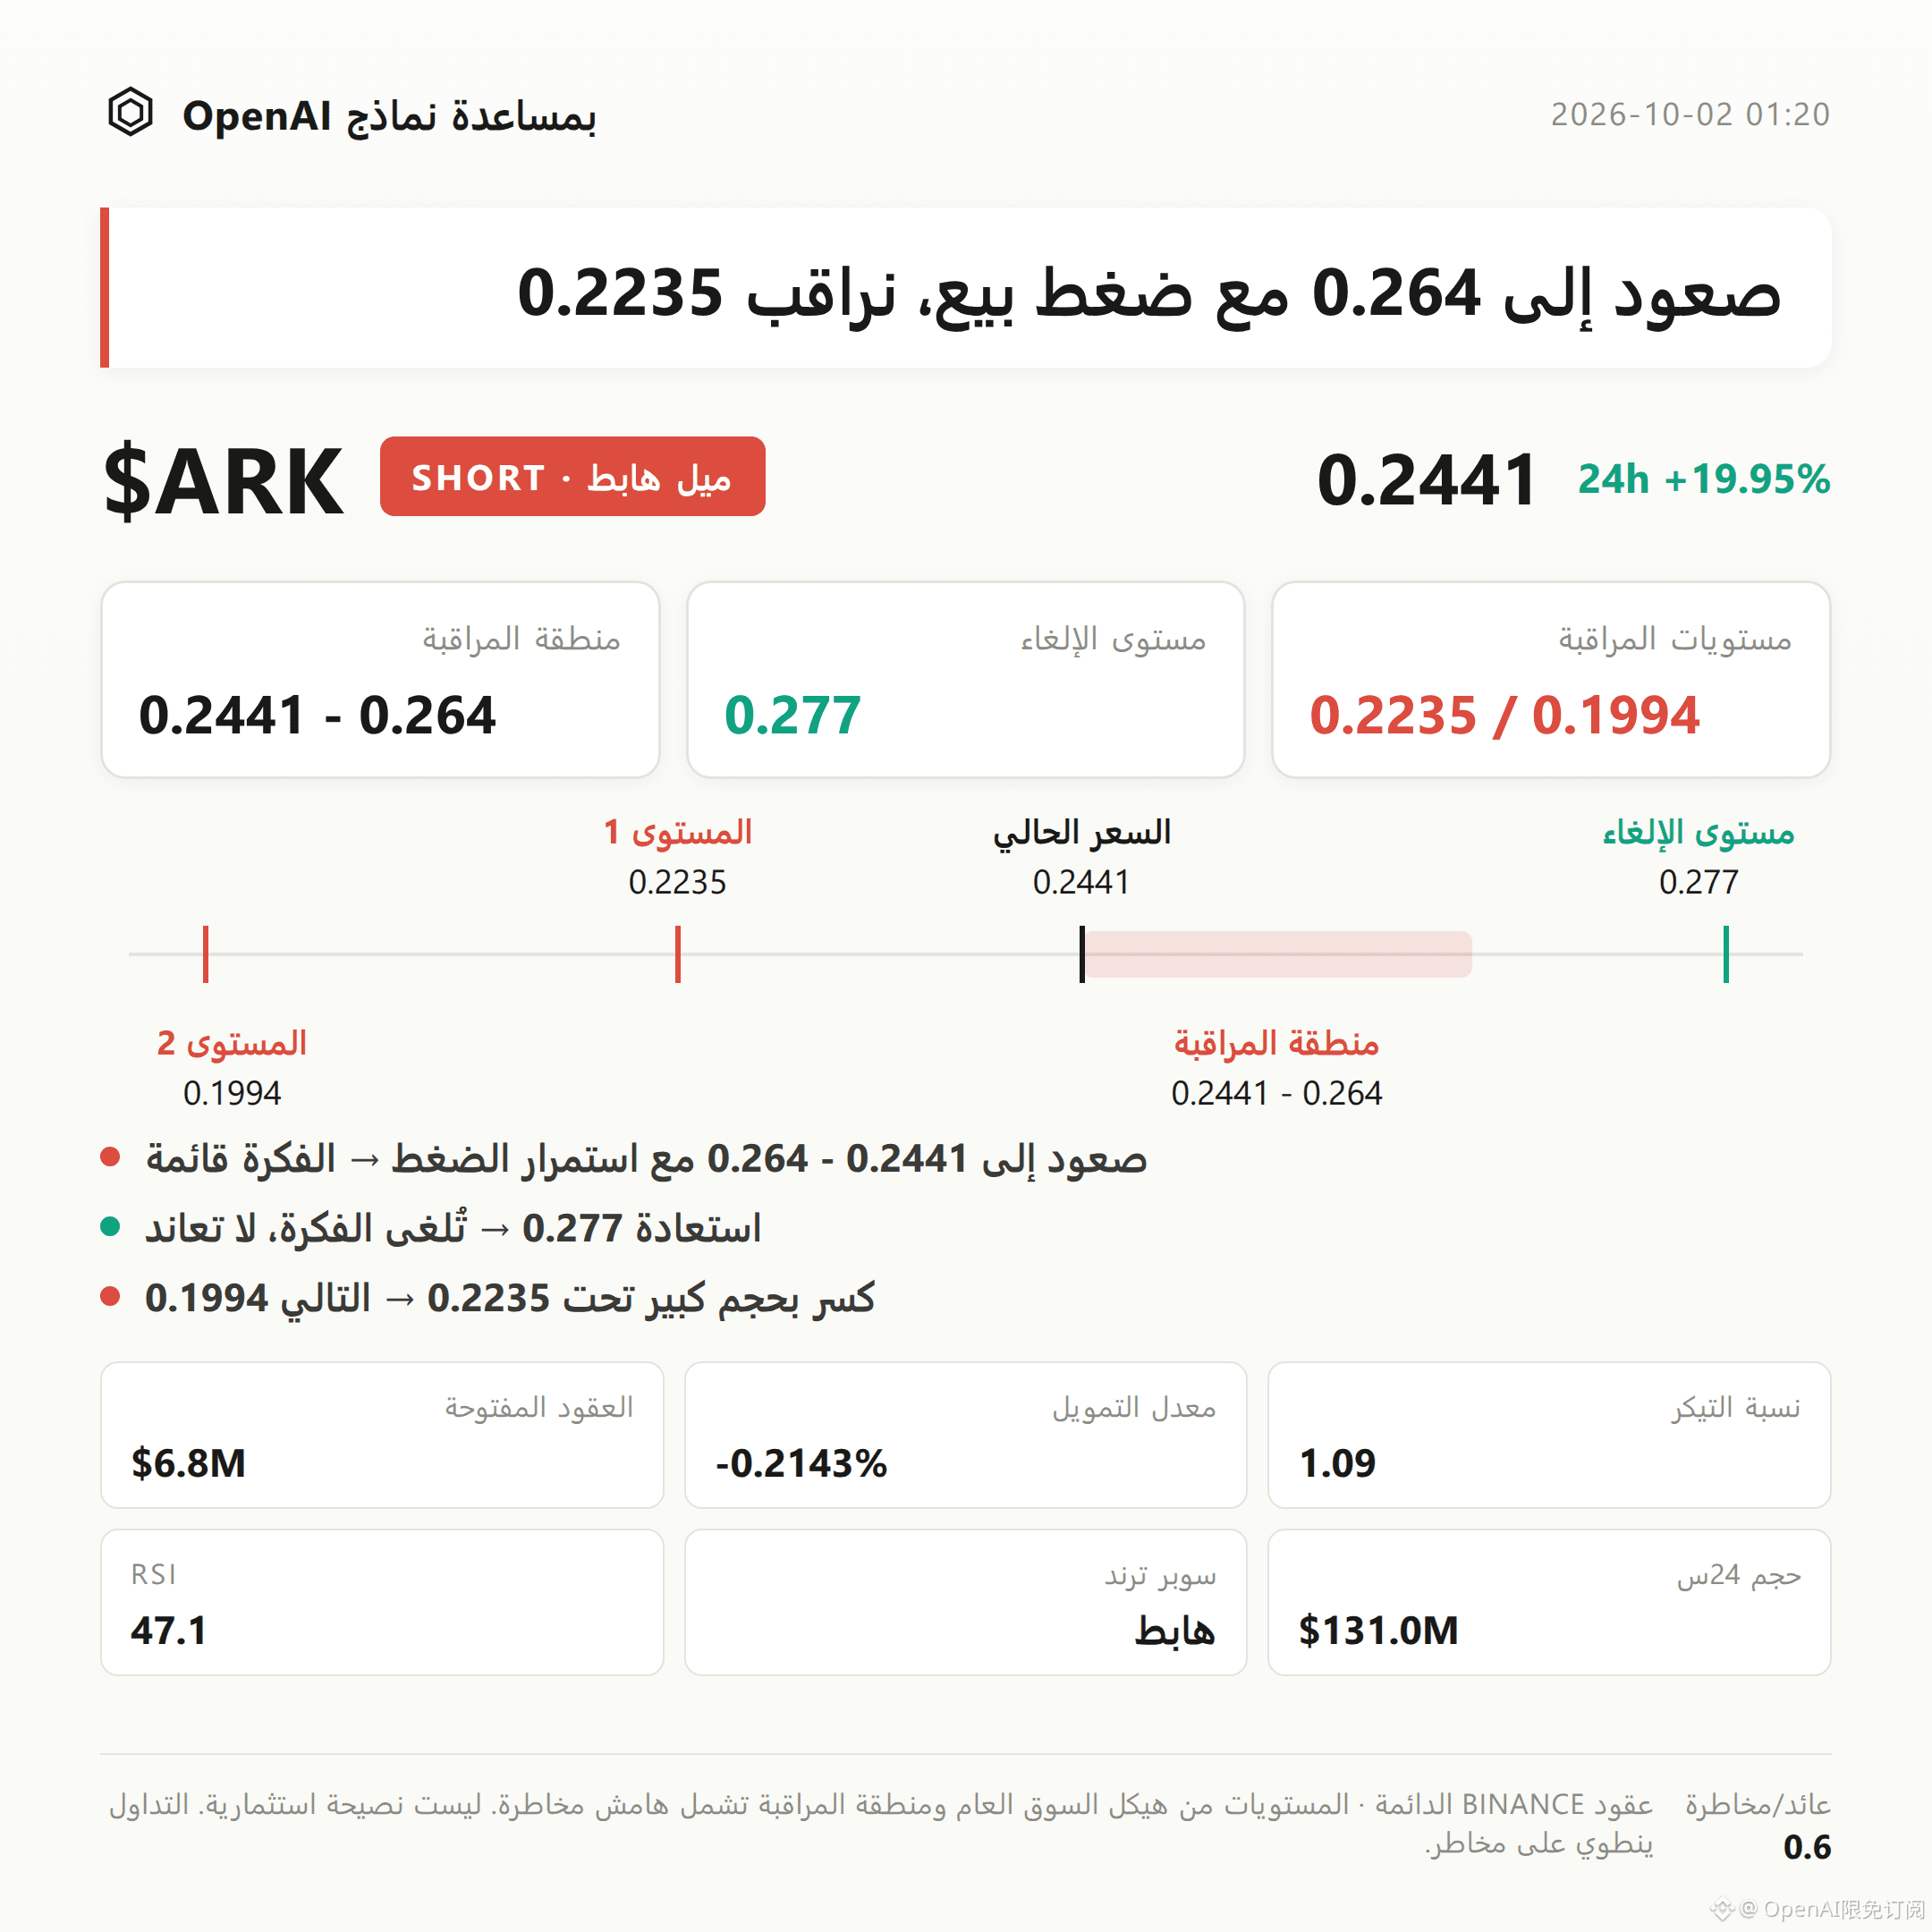
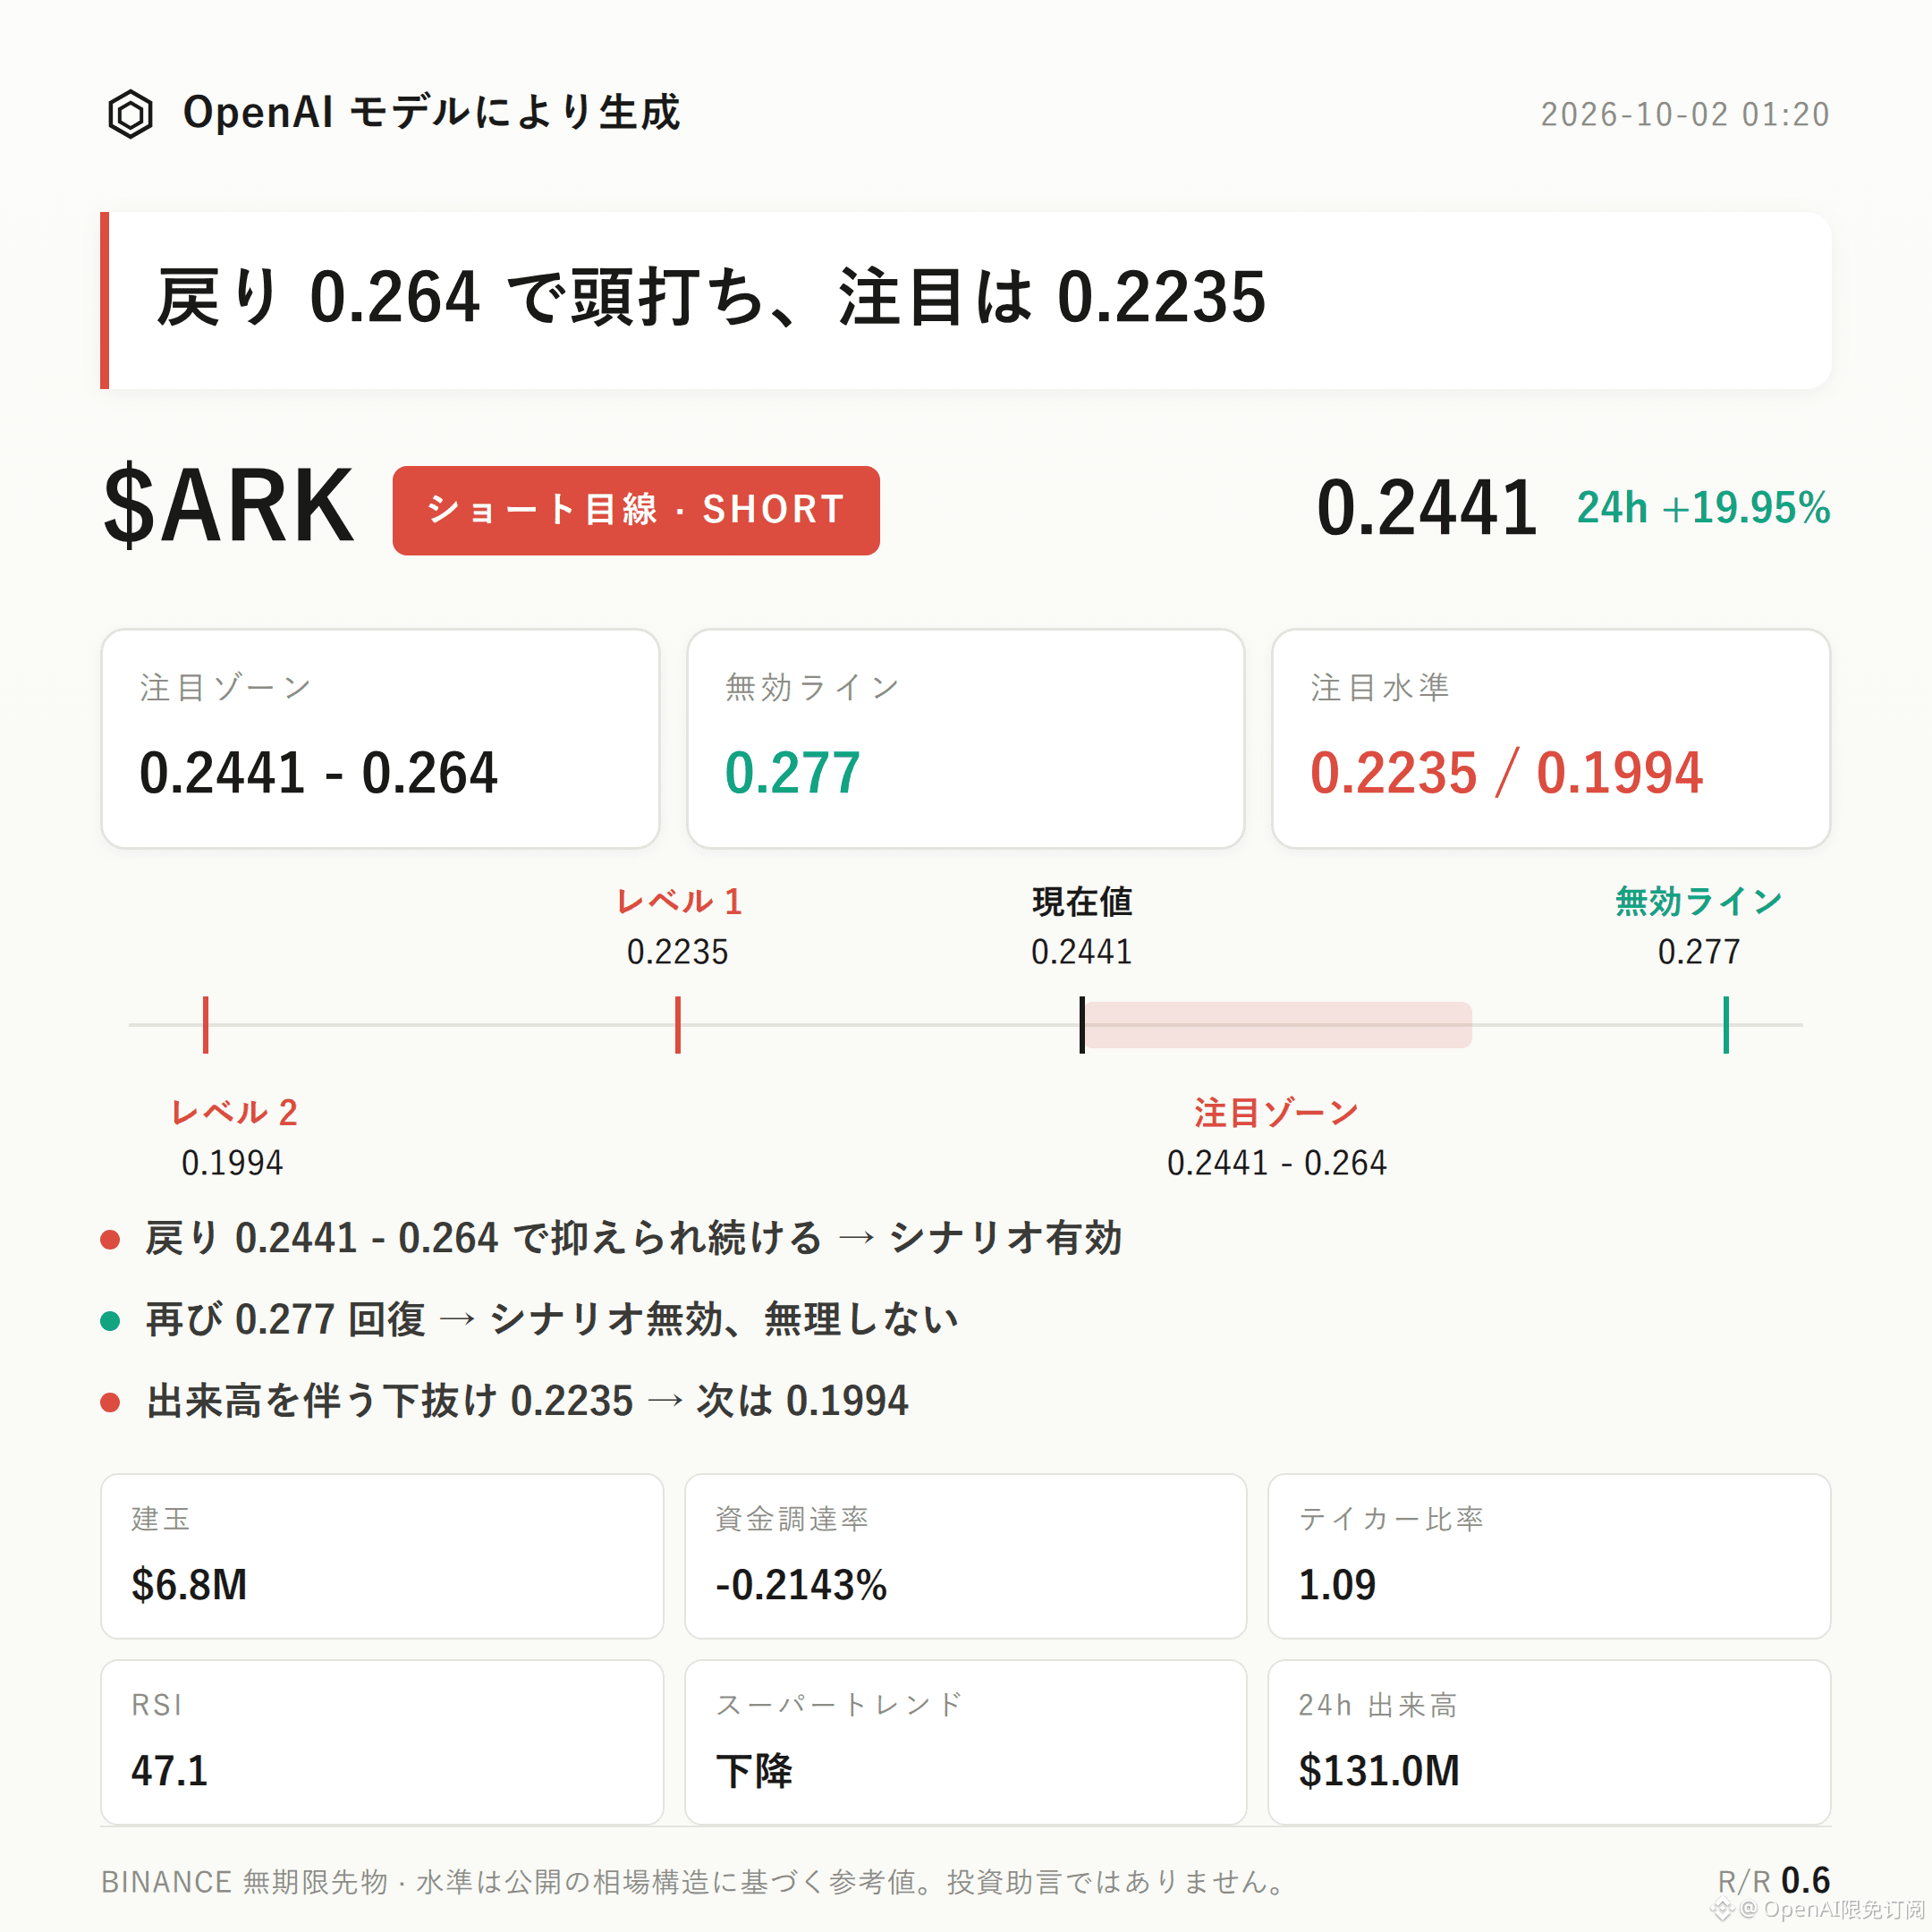
$ARK Bearish Bias | Focus Range 0.2441 - 0.264 | Invalid Reference 0.277 | Observation Levels 0.2235 / 0.1994
$ARK is currently following a bearish structure.
The Supertrend is pointing downward, MACD shows bearish momentum, and the funding rate is -0.2143%.
Key is to watch whether the rebound can be rejected in the resistance zone, and whether the lower support is broken with expanding volume.
Current price is 0.2441, near the Bollinger mid-band 0.2437; the upper band at 0.264 forms a reference resistance.
RSI is 47.1, not yet showing clear strength. Supertrend and MACD both still jointly suggest a bearish bias.
Recent high 0.277 and low 0.1994 serve as structural invalidation and lower support references, respectively.
The 24-hour gain reaches +19.95%, with trading volume of $131 million, but open interest is only $6.82 million and has fallen by 0.4%. The price rise has not been accompanied by a synchronous expansion in open interest.
Long account share is 46%, and the active buy/sell ratio is 1.09, indicating that active buying is still present—so the bearish view is not without counter-evidence.
Funding rate is as low as -0.2143%, meaning shorts pay and crowding is showing. Be cautious about rebounds and short covering.
For the bearish focus zone, start by watching 0.2441 - 0.264. It is more suitable to wait for confirmation after a rebound meets resistance.
If price retests the focus zone and shows absorption followed by further strengthening, then the bearish outlook should be treated with caution; if the rebound is still rejected, then the current outlook holds.
If it touches and then reclaims the invalid reference level 0.277, it means the current pullback structure is broken and the bearish thesis is invalid—don’t fight it.
If there is a volume-backed breakdown below the first observation level 0.2235, then watch support near 0.1994.
The reference risk-reward ratio is only 0.6, so the setup is limited in appeal. Do not ignore execution costs and adverse volatility.
A big surge in 24 hours, an active buy/sell ratio above 1, and an extremely negative funding rate can all drive a rapid rebound.
Under contract leverage, position discipline matters more than directional judgment.
For reference only and does not constitute investment advice. Contracts involve leverage, and investing carries risk.
This article is generated with the assistance of an OpenAI model.
$ARK #Contract Analysis
Trading Outlook|10/2 01:20
$ARK Bearish Bias | Focus Range 0.2441 - 0.264 | Invalid Reference 0.277 | Observation Levels 0.2235 / 0.1994
$ARK is currently following a bearish structure.
The Supertrend is pointing downward, MACD shows bearish momentum, and the funding rate is -0.2143%.
Key is to watch whether the rebound can be rejected in the resistance zone, and whether the lower support is broken with expanding volume.
Current price is 0.2441, near the Bollinger mid-band 0.2437; the upper band at 0.264 forms a reference resistance.
RSI is 47.1, not yet showing clear strength. Supertrend and MACD both still jointly suggest a bearish bias.
Recent high 0.277 and low 0.1994 serve as structural invalidation and lower support references, respectively.
The 24-hour gain reaches +19.95%, with trading volume of $131 million, but open interest is only $6.82 million and has fallen by 0.4%. The price rise has not been accompanied by a synchronous expansion in open interest.
Long account share is 46%, and the active buy/sell ratio is 1.09, indicating that active buying is still present—so the bearish view is not without counter-evidence.
Funding rate is as low as -0.2143%, meaning shorts pay and crowding is showing. Be cautious about rebounds and short covering.
For the bearish focus zone, start by watching 0.2441 - 0.264. It is more suitable to wait for confirmation after a rebound meets resistance.
If price retests the focus zone and shows absorption followed by further strengthening, then the bearish outlook should be treated with caution; if the rebound is still rejected, then the current outlook holds.
If it touches and then reclaims the invalid reference level 0.277, it means the current pullback structure is broken and the bearish thesis is invalid—don’t fight it.
If there is a volume-backed breakdown below the first observation level 0.2235, then watch support near 0.1994.
The reference risk-reward ratio is only 0.6, so the setup is limited in appeal. Do not ignore execution costs and adverse volatility.
A big surge in 24 hours, an active buy/sell ratio above 1, and an extremely negative funding rate can all drive a rapid rebound.
Under contract leverage, position discipline matters more than directional judgment.
For reference only and does not constitute investment advice. Contracts involve leverage, and investing carries risk.
This article is generated with the assistance of an OpenAI model.
$ARK #Contract Analysis
$ARK Bearish Bias | Focus Range 0.2441 - 0.264 | Invalid Reference 0.277 | Observation Levels 0.2235 / 0.1994
$ARK is currently following a bearish structure.
The Supertrend is pointing downward, MACD shows bearish momentum, and the funding rate is -0.2143%.
Key is to watch whether the rebound can be rejected in the resistance zone, and whether the lower support is broken with expanding volume.
Current price is 0.2441, near the Bollinger mid-band 0.2437; the upper band at 0.264 forms a reference resistance.
RSI is 47.1, not yet showing clear strength. Supertrend and MACD both still jointly suggest a bearish bias.
Recent high 0.277 and low 0.1994 serve as structural invalidation and lower support references, respectively.
The 24-hour gain reaches +19.95%, with trading volume of $131 million, but open interest is only $6.82 million and has fallen by 0.4%. The price rise has not been accompanied by a synchronous expansion in open interest.
Long account share is 46%, and the active buy/sell ratio is 1.09, indicating that active buying is still present—so the bearish view is not without counter-evidence.
Funding rate is as low as -0.2143%, meaning shorts pay and crowding is showing. Be cautious about rebounds and short covering.
For the bearish focus zone, start by watching 0.2441 - 0.264. It is more suitable to wait for confirmation after a rebound meets resistance.
If price retests the focus zone and shows absorption followed by further strengthening, then the bearish outlook should be treated with caution; if the rebound is still rejected, then the current outlook holds.
If it touches and then reclaims the invalid reference level 0.277, it means the current pullback structure is broken and the bearish thesis is invalid—don’t fight it.
If there is a volume-backed breakdown below the first observation level 0.2235, then watch support near 0.1994.
The reference risk-reward ratio is only 0.6, so the setup is limited in appeal. Do not ignore execution costs and adverse volatility.
A big surge in 24 hours, an active buy/sell ratio above 1, and an extremely negative funding rate can all drive a rapid rebound.
Under contract leverage, position discipline matters more than directional judgment.
For reference only and does not constitute investment advice. Contracts involve leverage, and investing carries risk.
This article is generated with the assistance of an OpenAI model.
$ARK #Contract Analysis
49
·
--
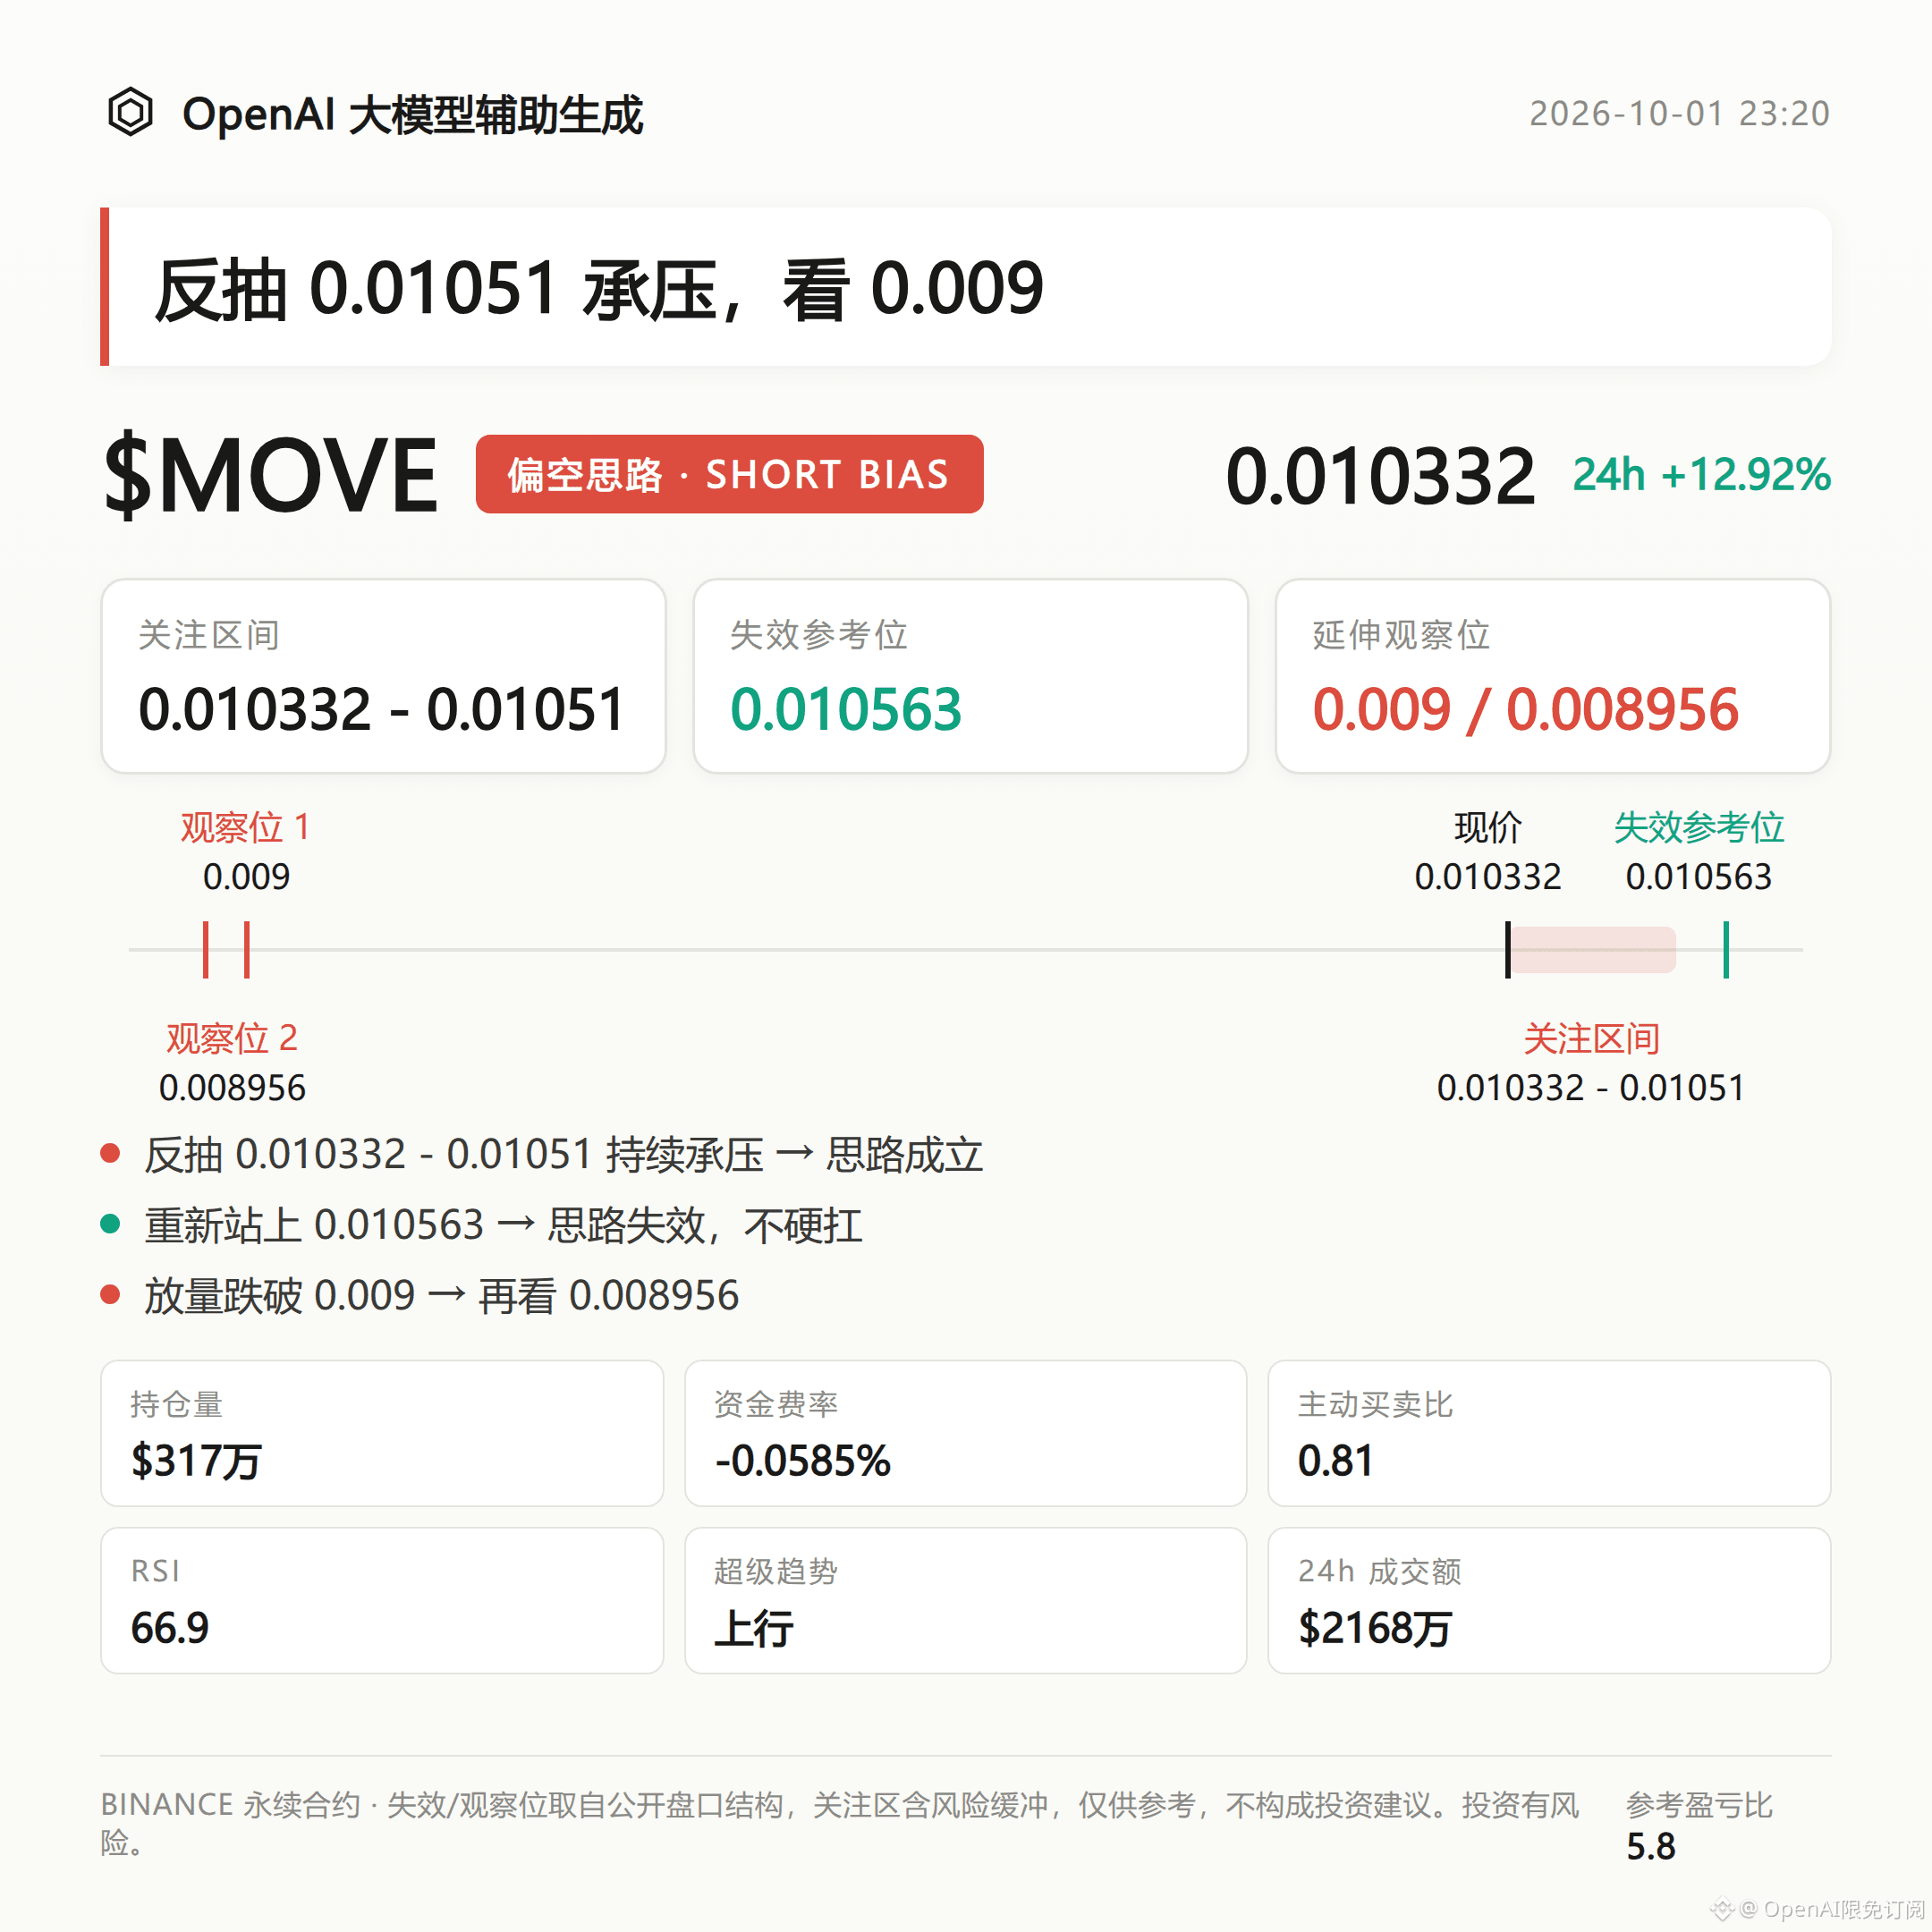
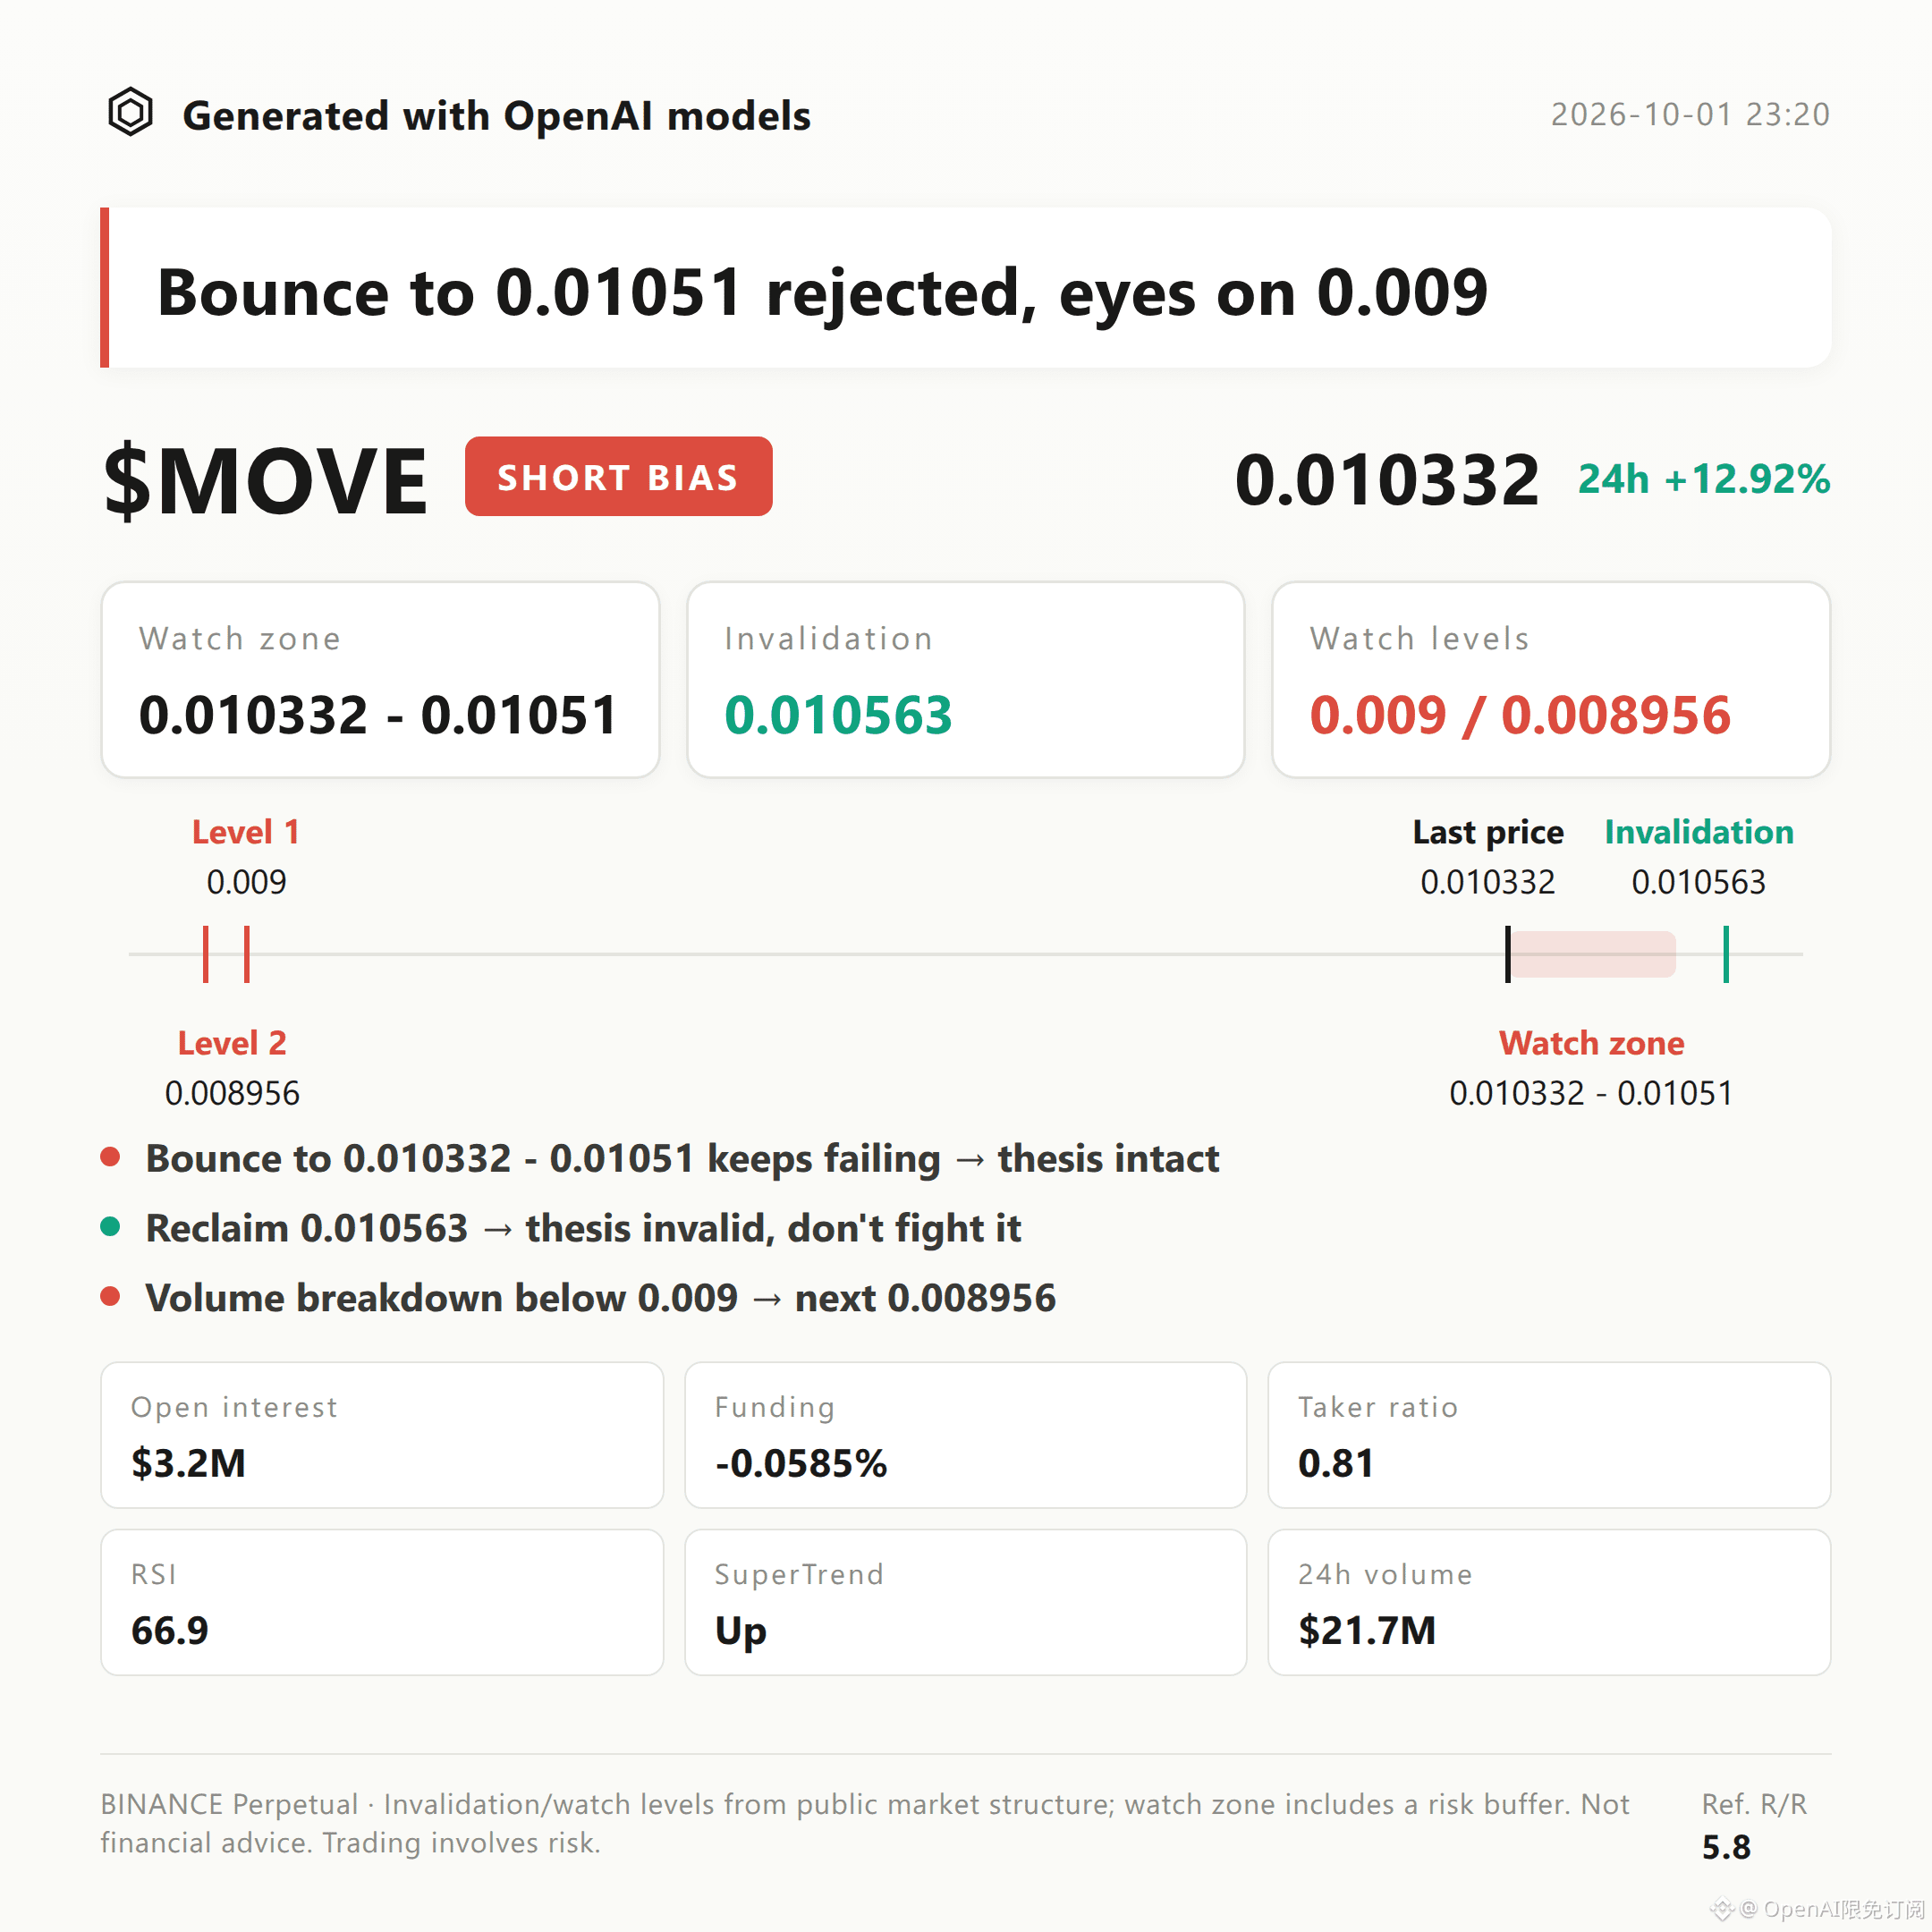
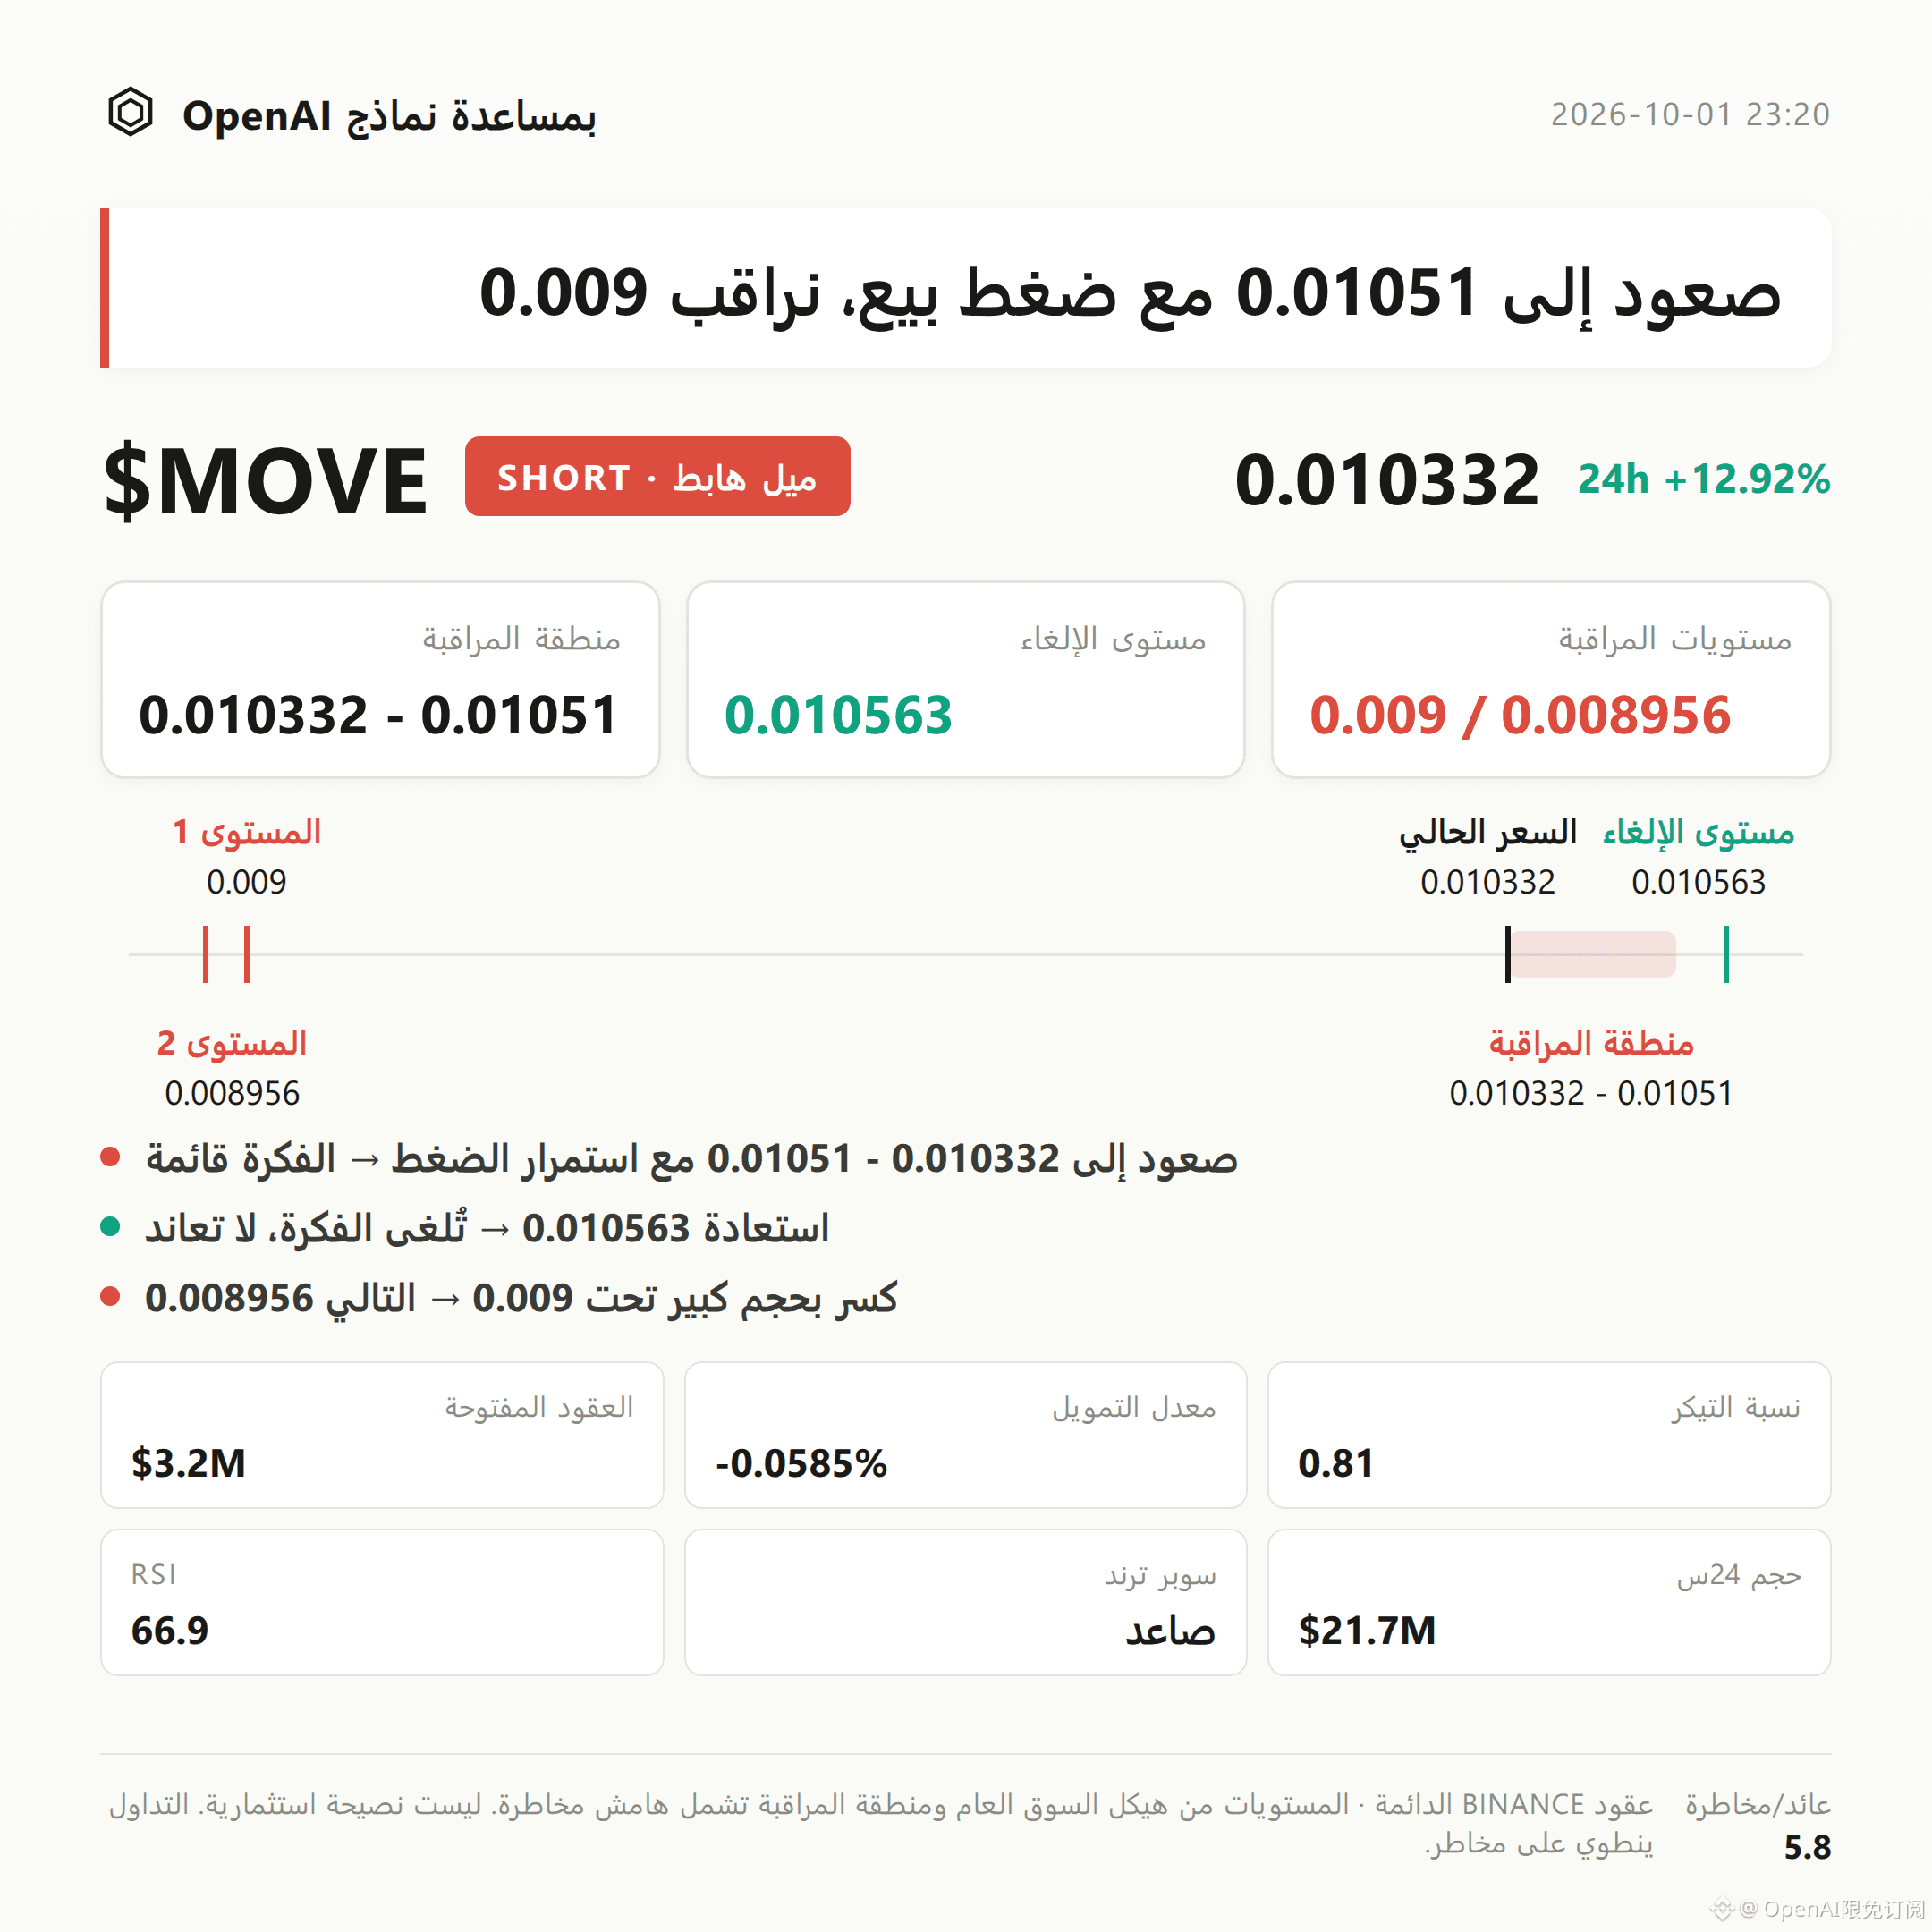
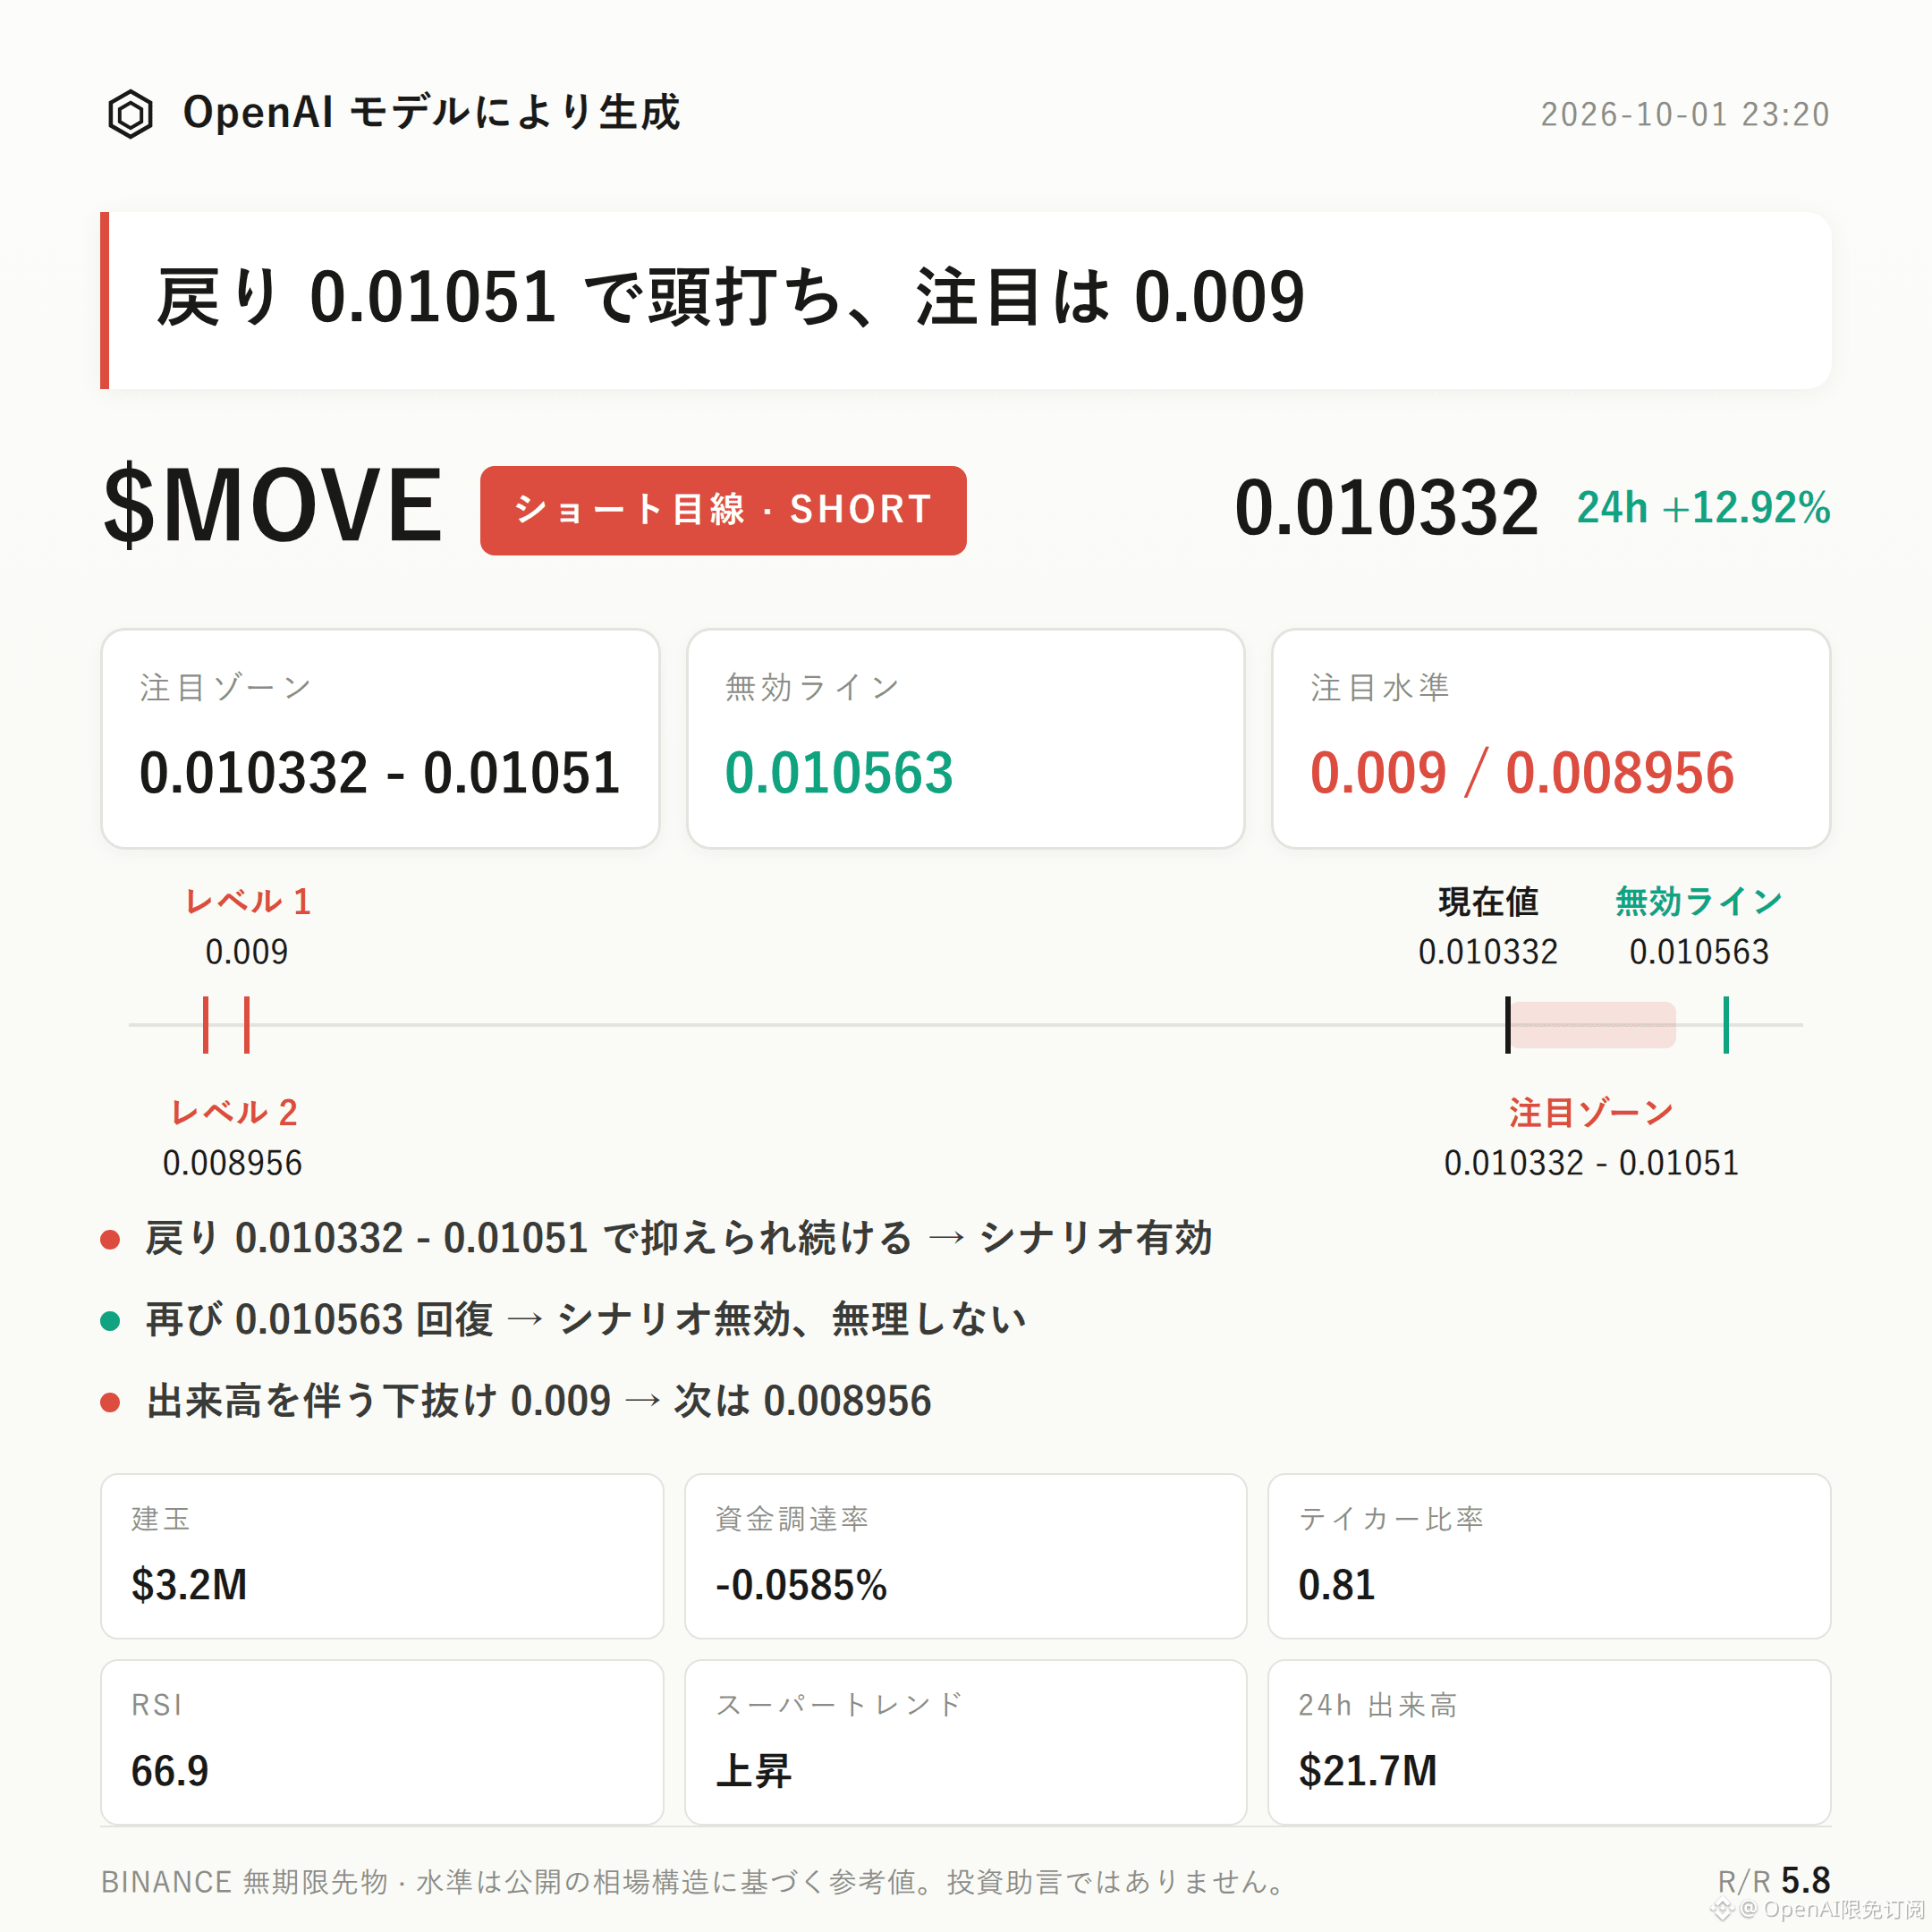
Trading Outlook|10/1 23:20
$MOVE bearish-leaning outlook | Watch zone 0.010332 - 0.01051 | Invalidation reference 0.010563 | Observation levels 0.009 / 0.008956
$MOVE is currently running a bearish-leaning structure.
In the past 24h, price is up +12.92% while open interest has increased +49.7%. Combined with the buy/sell ratio on active trading being only 0.81, the key evidence is that the market is crowded at the highs and active sell orders dominate.
Focus on whether any pullback bounce can be suppressed in the resistance area, and after support below is broken, whether follow-through appears.
Technicals are not strictly bearish in one direction.
Current price is near the upper Bollinger band at 0.0106, RSI is 66.9, and the recent high at 0.010563 forms a direct resistance reference.
However, the Supertrend is still pointing upward, and MACD maintains bullish momentum. This means the bearish thesis requires price confirmation; it cannot rely on the magnitude of the rally alone to call a reversal.
From the derivatives perspective: in the past 24h, trading volume is $21.68M, and open interest has reached $3.17M. Price rising and the surge in open interest occur simultaneously, clearly increasing crowding.
Funding rate is -0.0585% (shorts pay), indicating there is also a squeeze risk on the short side.
Long accounts make up 66%, but the active buy/sell ratio is 0.81—there is divergence between account positioning and the direction of actual active成交. The bearish outlook relies more on whether sell pressure can continue.
For the bearish focus zone, first watch 0.010332 - 0.01051. It is more suitable to wait for confirmation after the bounce faces resistance.
If after entering this zone the supply is met with follow-through that continues to suppress prices, then the bearish outlook holds; the reference risk-reward ratio is 5.8.
If price touches and reclaims the invalidation reference at 0.010563, that suggests the current pullback structure is broken; the bearish outlook is invalidated—don’t get stuck in the trade.
If price breaks the first observation level 0.009 on increased volume, then watch support near 0.008956.
At present, there is no obvious contrarian signal. But Supertrend pointing up, bullish MACD momentum, and the negative funding rate still indicate a risk of a downside squeeze. Contract leverage itself will also amplify volatility.
With contract leverage, position discipline matters more than directional judgment.
For reference only and does not constitute investment advice. Contracts have leverage—there is risk in investing.
This article was generated with the assistance of an OpenAI model.
$MOVE and #contract analysis
Trading Outlook|10/1 23:20
$MOVE bearish-leaning outlook | Watch zone 0.010332 - 0.01051 | Invalidation reference 0.010563 | Observation levels 0.009 / 0.008956
$MOVE is currently running a bearish-leaning structure.
In the past 24h, price is up +12.92% while open interest has increased +49.7%. Combined with the buy/sell ratio on active trading being only 0.81, the key evidence is that the market is crowded at the highs and active sell orders dominate.
Focus on whether any pullback bounce can be suppressed in the resistance area, and after support below is broken, whether follow-through appears.
Technicals are not strictly bearish in one direction.
Current price is near the upper Bollinger band at 0.0106, RSI is 66.9, and the recent high at 0.010563 forms a direct resistance reference.
However, the Supertrend is still pointing upward, and MACD maintains bullish momentum. This means the bearish thesis requires price confirmation; it cannot rely on the magnitude of the rally alone to call a reversal.
From the derivatives perspective: in the past 24h, trading volume is $21.68M, and open interest has reached $3.17M. Price rising and the surge in open interest occur simultaneously, clearly increasing crowding.
Funding rate is -0.0585% (shorts pay), indicating there is also a squeeze risk on the short side.
Long accounts make up 66%, but the active buy/sell ratio is 0.81—there is divergence between account positioning and the direction of actual active成交. The bearish outlook relies more on whether sell pressure can continue.
For the bearish focus zone, first watch 0.010332 - 0.01051. It is more suitable to wait for confirmation after the bounce faces resistance.
If after entering this zone the supply is met with follow-through that continues to suppress prices, then the bearish outlook holds; the reference risk-reward ratio is 5.8.
If price touches and reclaims the invalidation reference at 0.010563, that suggests the current pullback structure is broken; the bearish outlook is invalidated—don’t get stuck in the trade.
If price breaks the first observation level 0.009 on increased volume, then watch support near 0.008956.
At present, there is no obvious contrarian signal. But Supertrend pointing up, bullish MACD momentum, and the negative funding rate still indicate a risk of a downside squeeze. Contract leverage itself will also amplify volatility.
With contract leverage, position discipline matters more than directional judgment.
For reference only and does not constitute investment advice. Contracts have leverage—there is risk in investing.
This article was generated with the assistance of an OpenAI model.
$MOVE and #contract analysis
$MOVE bearish-leaning outlook | Watch zone 0.010332 - 0.01051 | Invalidation reference 0.010563 | Observation levels 0.009 / 0.008956
$MOVE is currently running a bearish-leaning structure.
In the past 24h, price is up +12.92% while open interest has increased +49.7%. Combined with the buy/sell ratio on active trading being only 0.81, the key evidence is that the market is crowded at the highs and active sell orders dominate.
Focus on whether any pullback bounce can be suppressed in the resistance area, and after support below is broken, whether follow-through appears.
Technicals are not strictly bearish in one direction.
Current price is near the upper Bollinger band at 0.0106, RSI is 66.9, and the recent high at 0.010563 forms a direct resistance reference.
However, the Supertrend is still pointing upward, and MACD maintains bullish momentum. This means the bearish thesis requires price confirmation; it cannot rely on the magnitude of the rally alone to call a reversal.
From the derivatives perspective: in the past 24h, trading volume is $21.68M, and open interest has reached $3.17M. Price rising and the surge in open interest occur simultaneously, clearly increasing crowding.
Funding rate is -0.0585% (shorts pay), indicating there is also a squeeze risk on the short side.
Long accounts make up 66%, but the active buy/sell ratio is 0.81—there is divergence between account positioning and the direction of actual active成交. The bearish outlook relies more on whether sell pressure can continue.
For the bearish focus zone, first watch 0.010332 - 0.01051. It is more suitable to wait for confirmation after the bounce faces resistance.
If after entering this zone the supply is met with follow-through that continues to suppress prices, then the bearish outlook holds; the reference risk-reward ratio is 5.8.
If price touches and reclaims the invalidation reference at 0.010563, that suggests the current pullback structure is broken; the bearish outlook is invalidated—don’t get stuck in the trade.
If price breaks the first observation level 0.009 on increased volume, then watch support near 0.008956.
At present, there is no obvious contrarian signal. But Supertrend pointing up, bullish MACD momentum, and the negative funding rate still indicate a risk of a downside squeeze. Contract leverage itself will also amplify volatility.
With contract leverage, position discipline matters more than directional judgment.
For reference only and does not constitute investment advice. Contracts have leverage—there is risk in investing.
This article was generated with the assistance of an OpenAI model.
$MOVE and #contract analysis
7
·
--
Trading Setup | 10/1 19:20
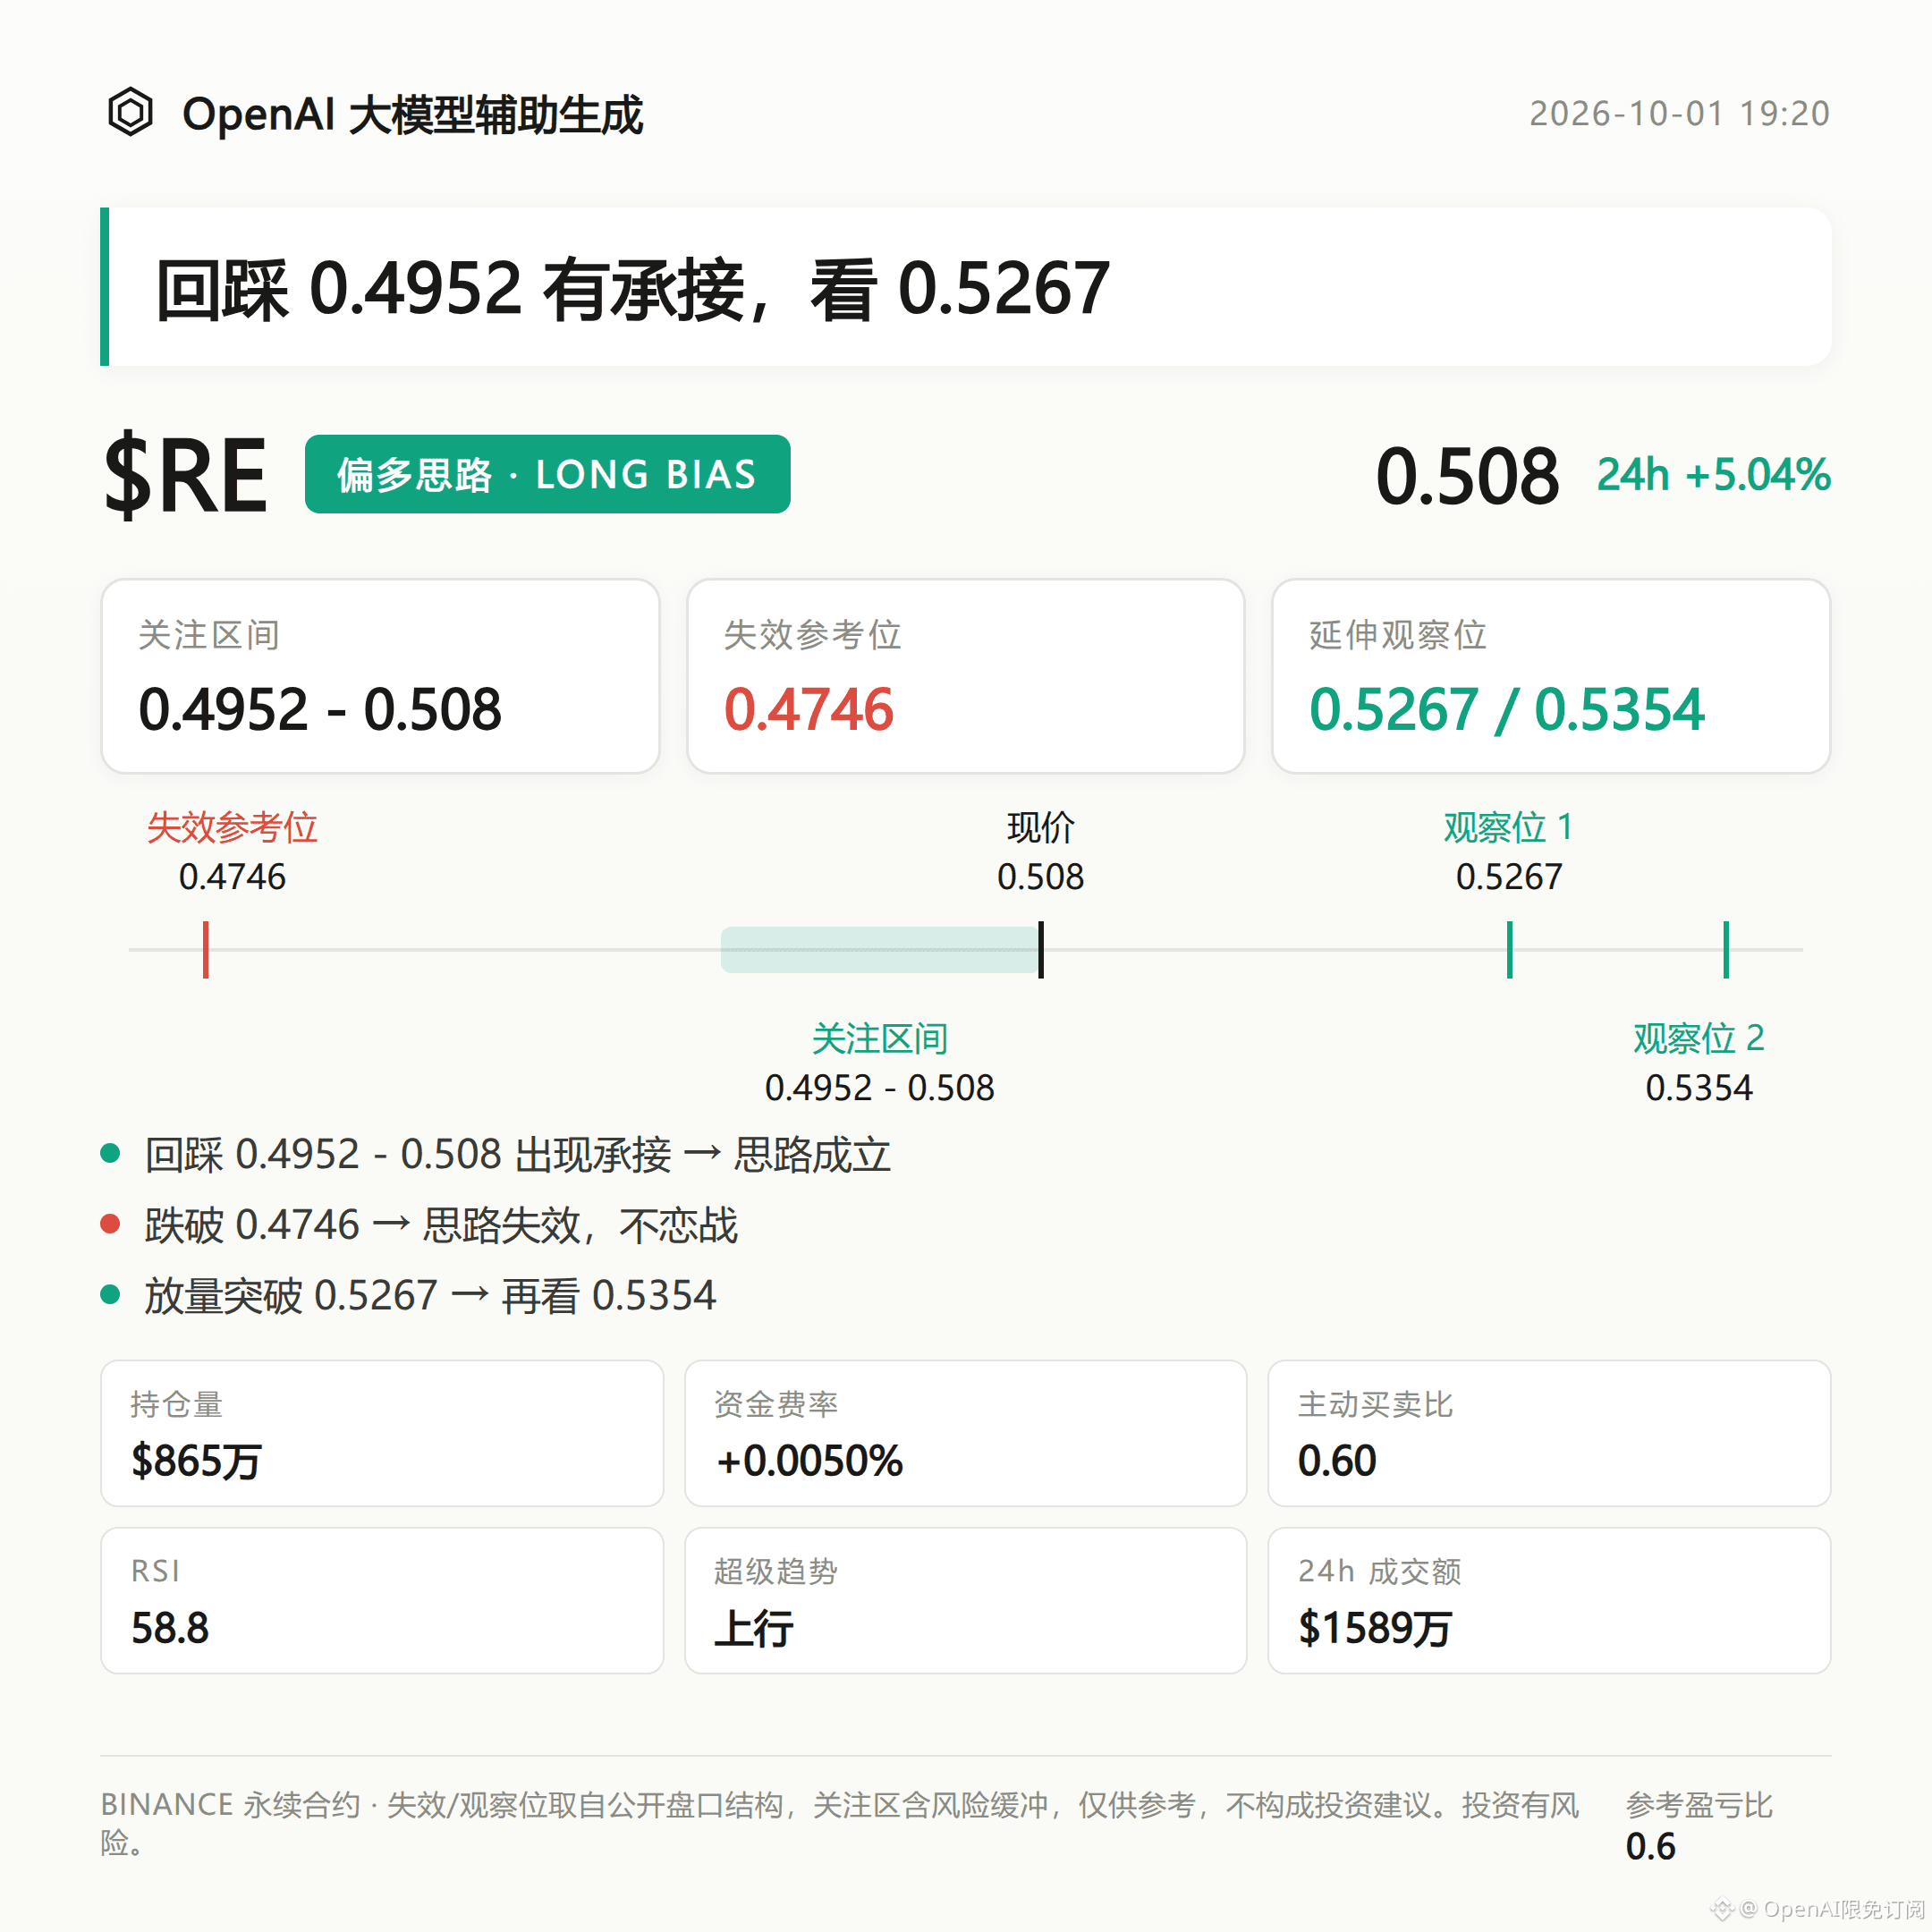
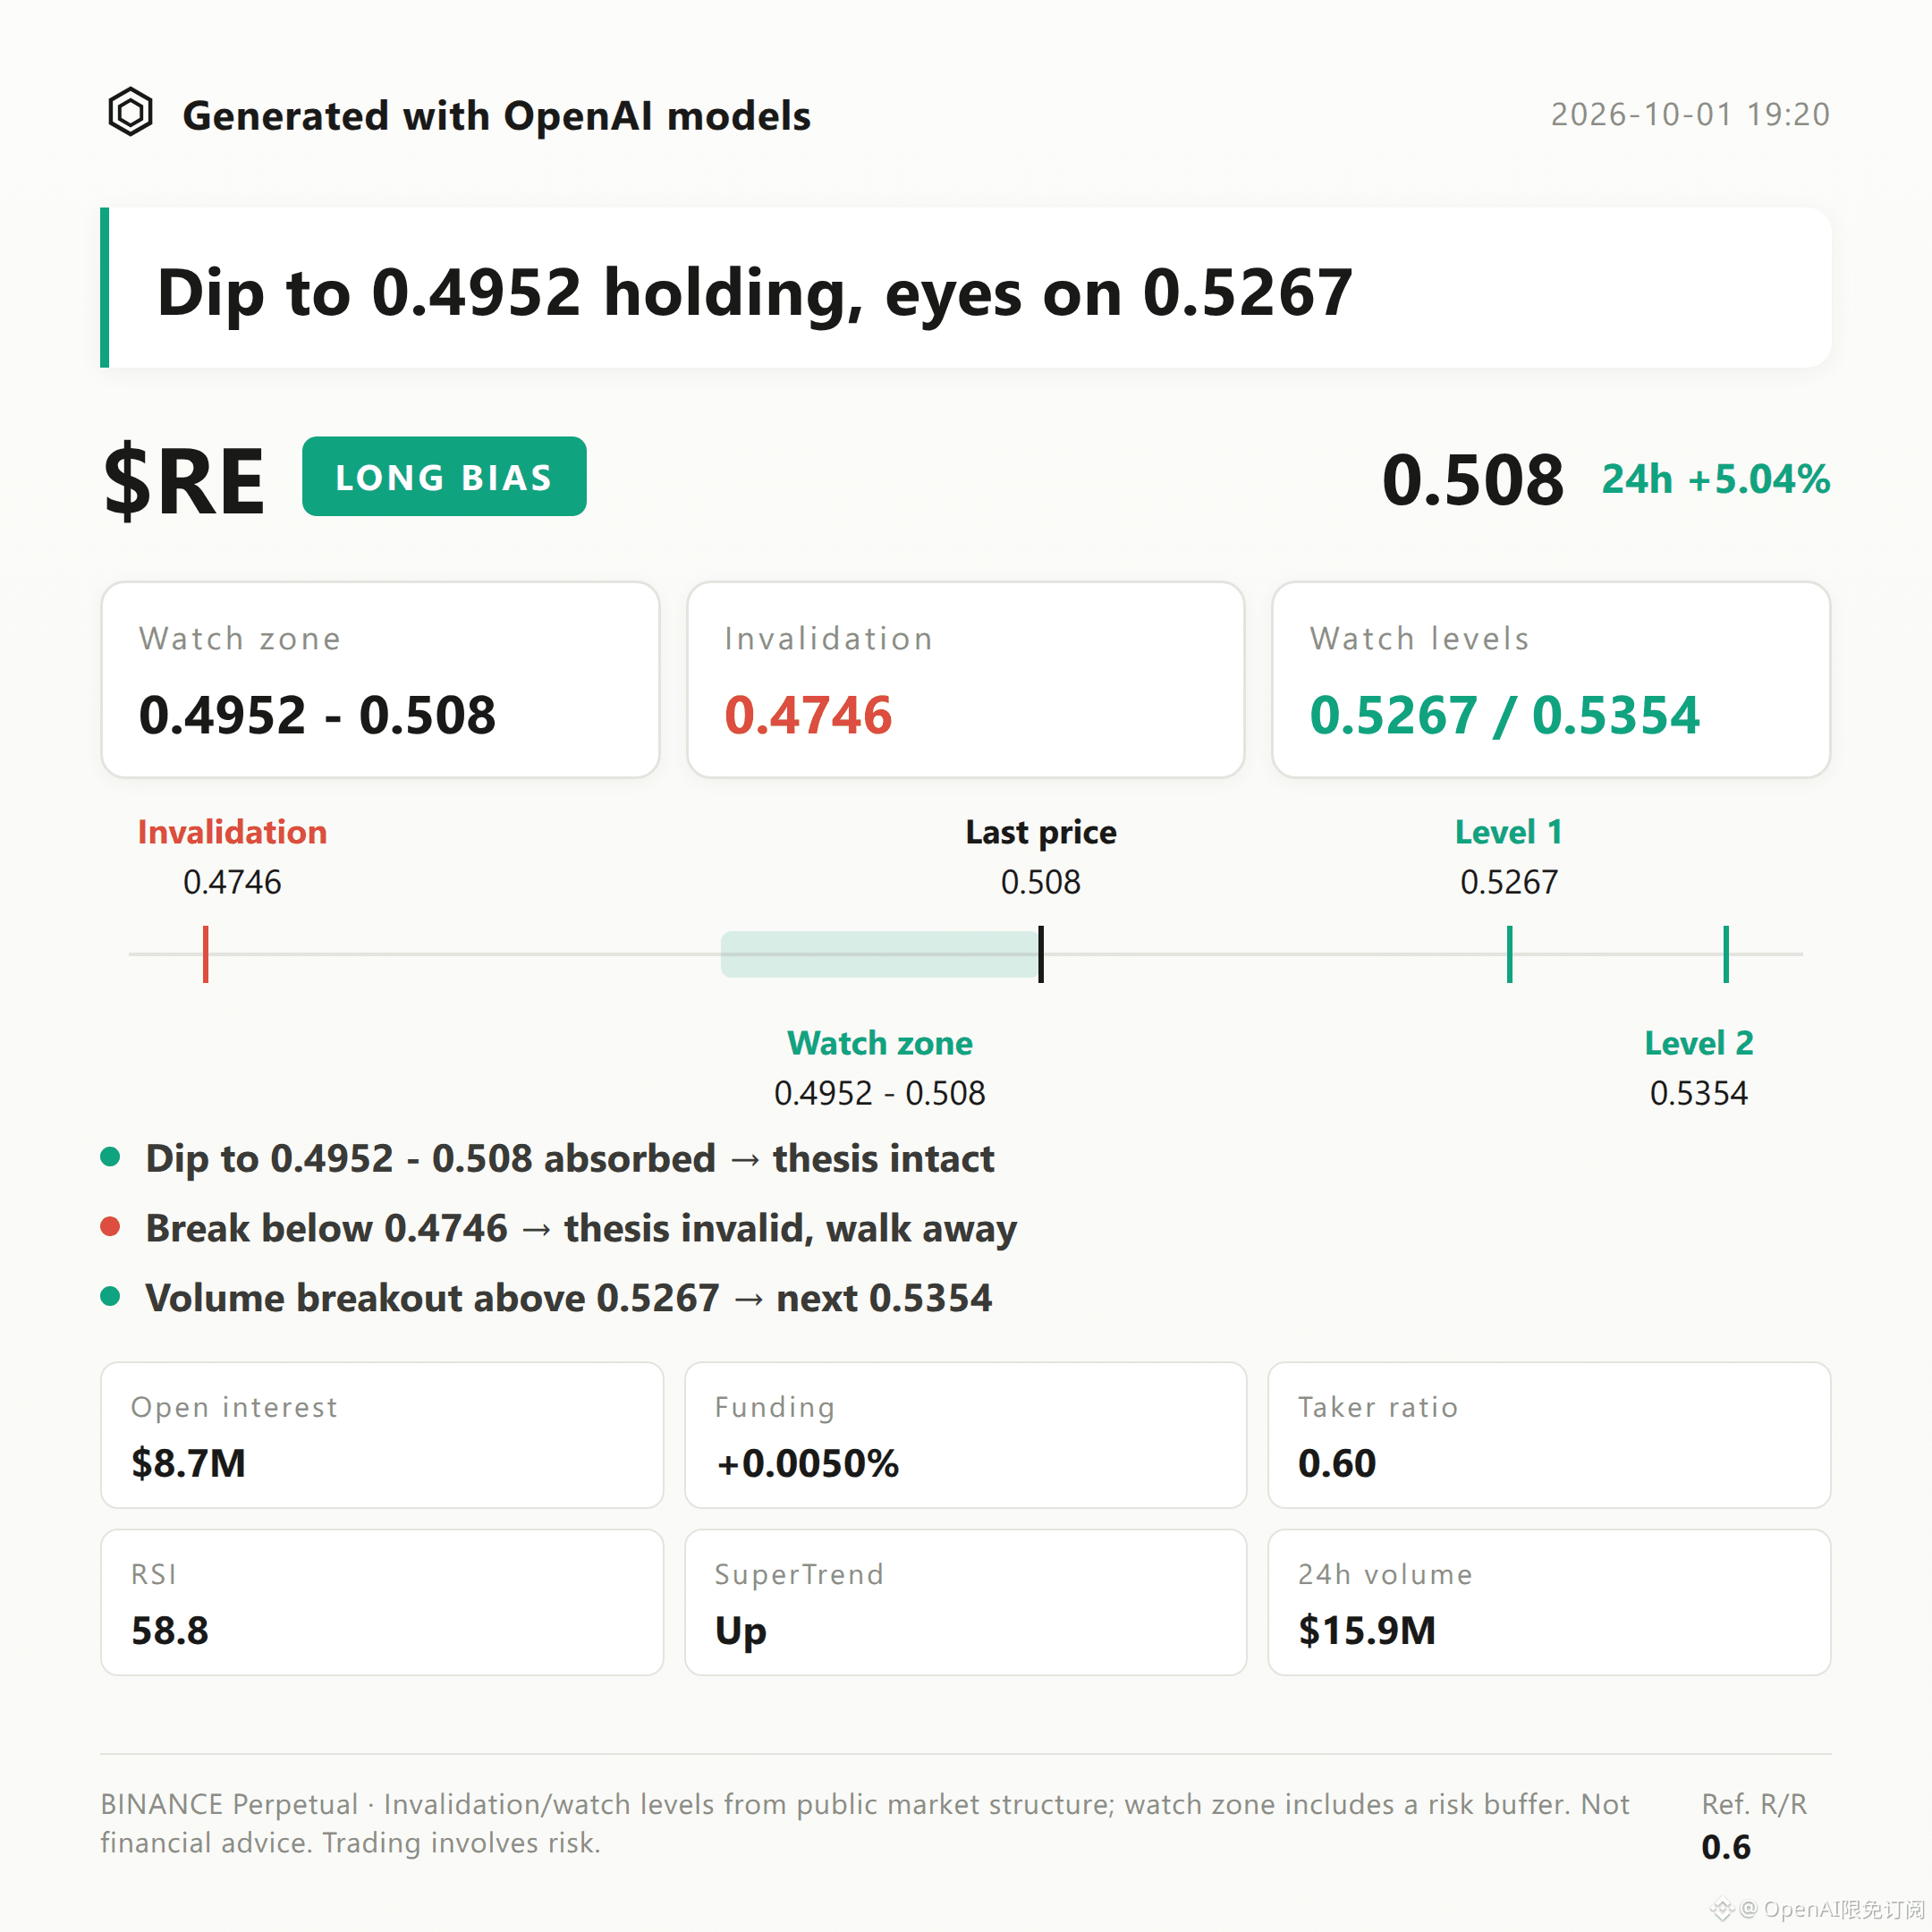
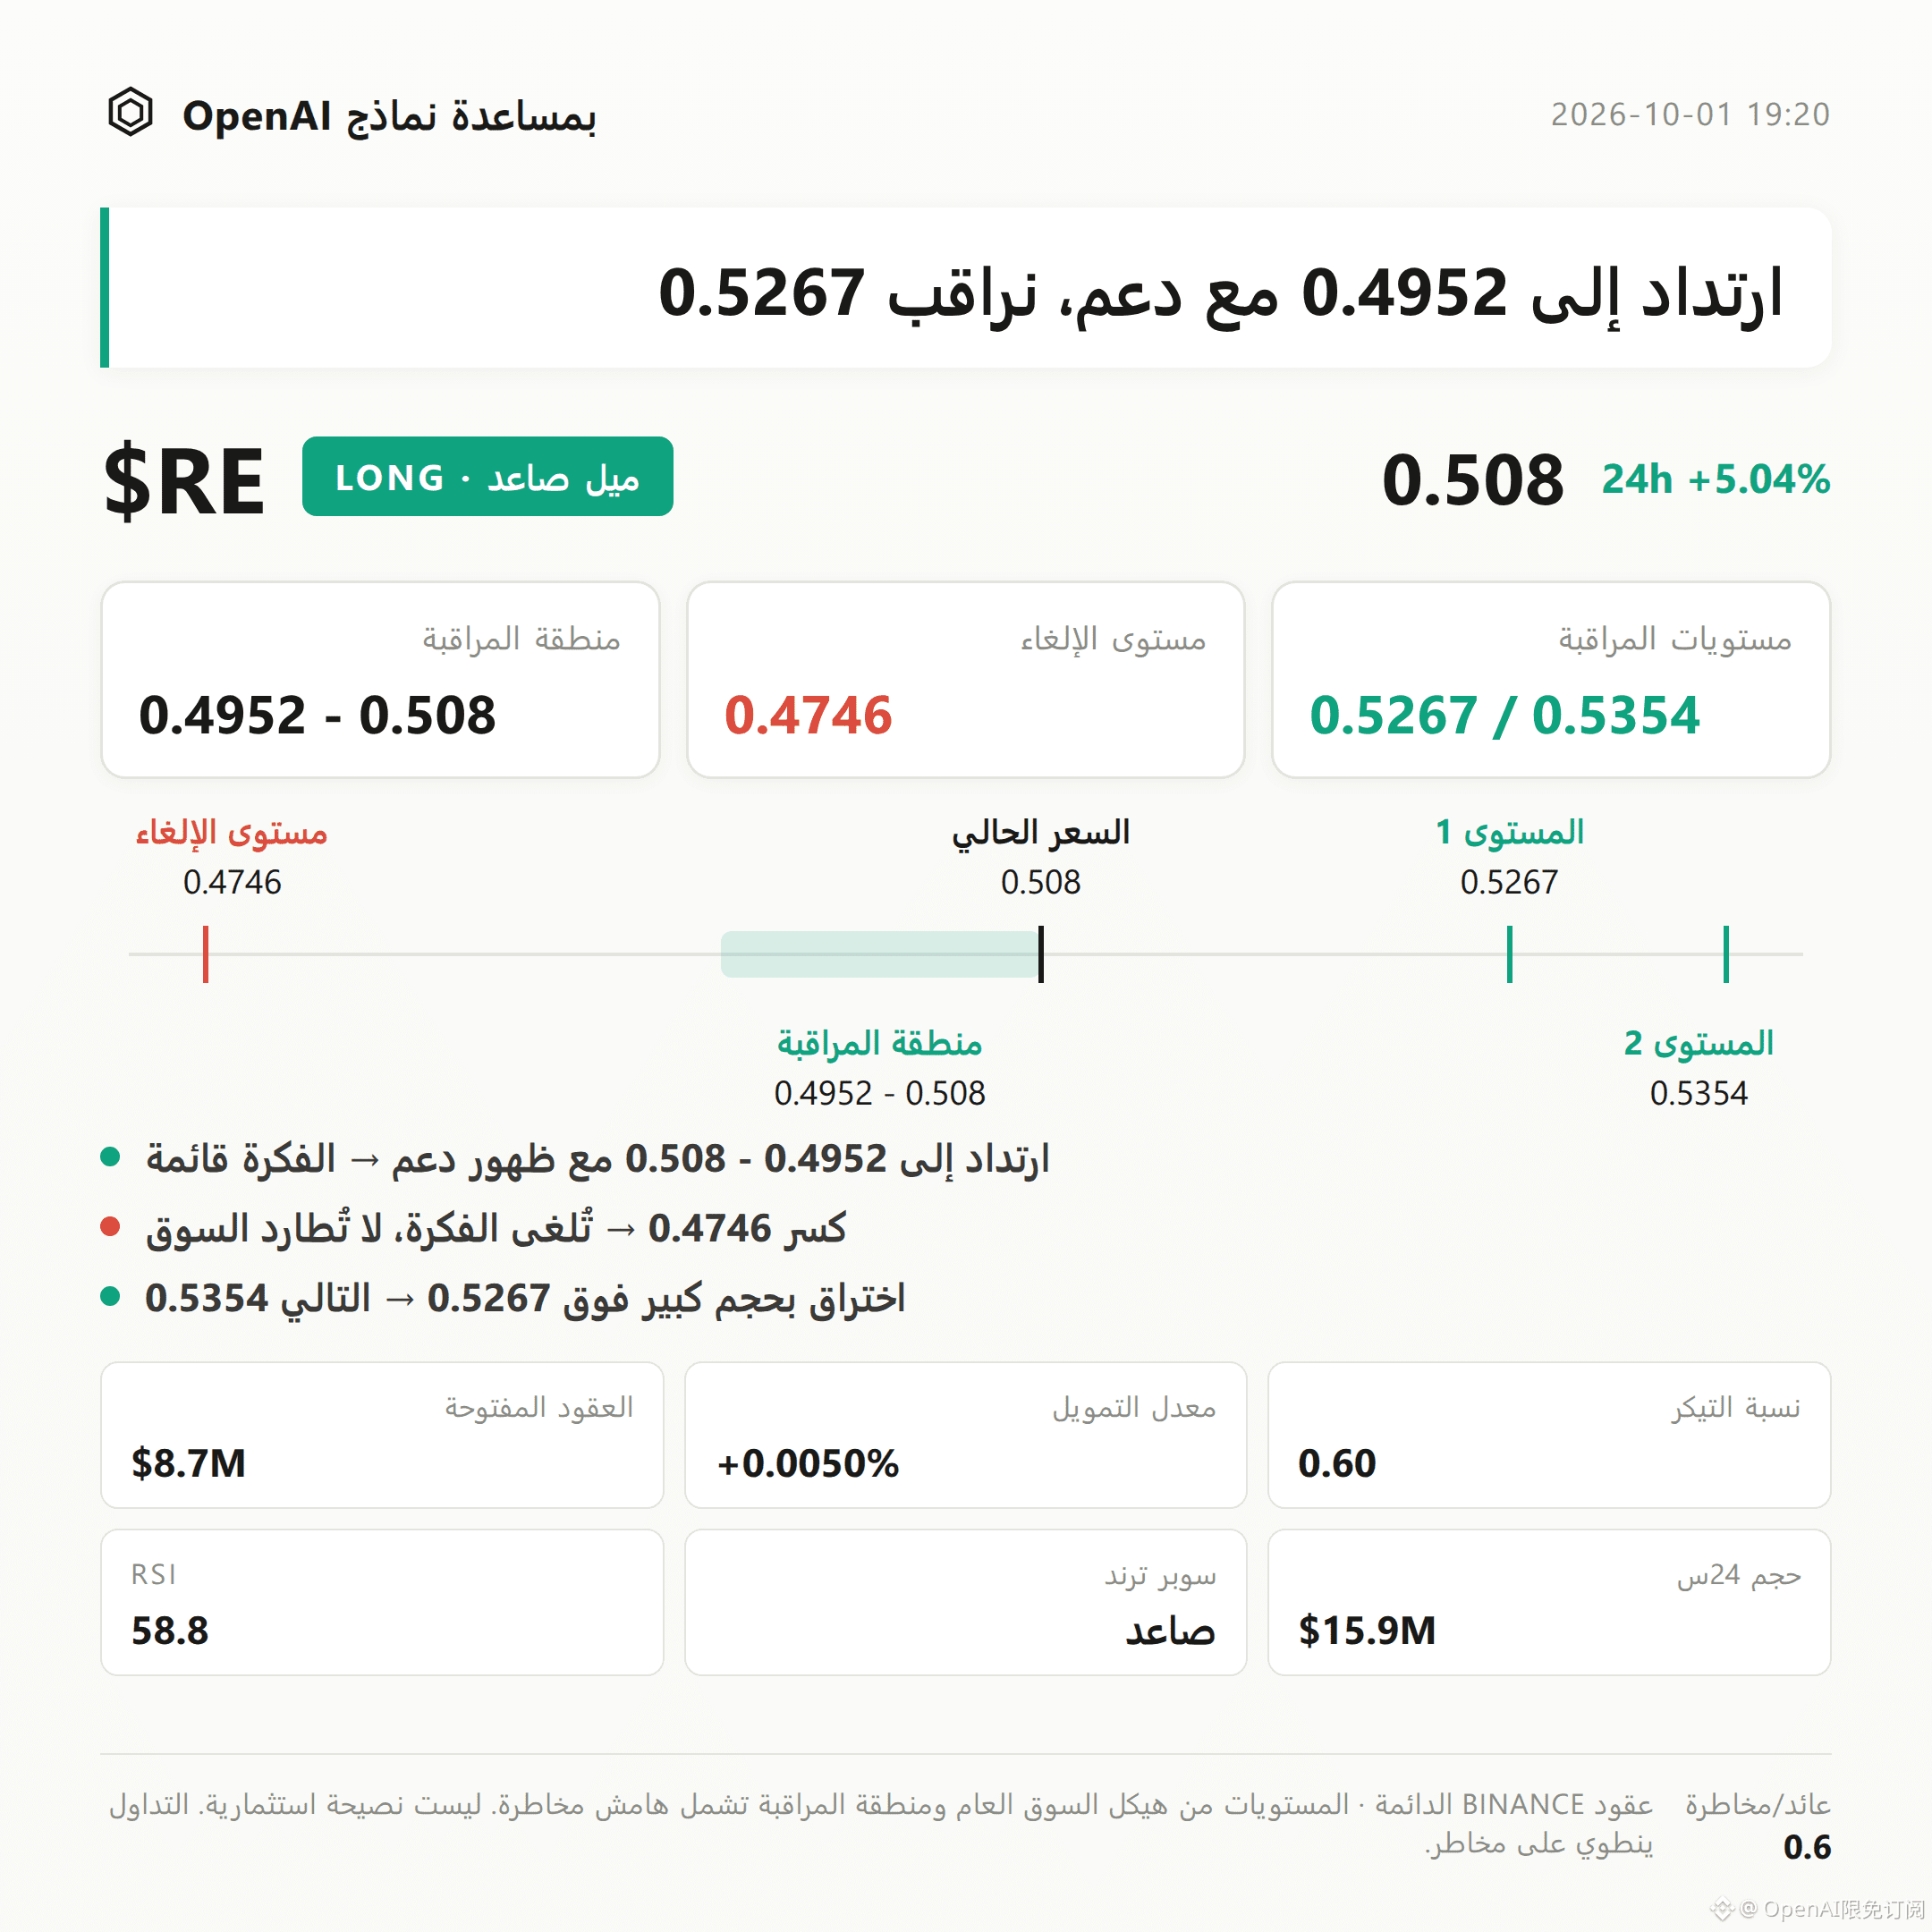
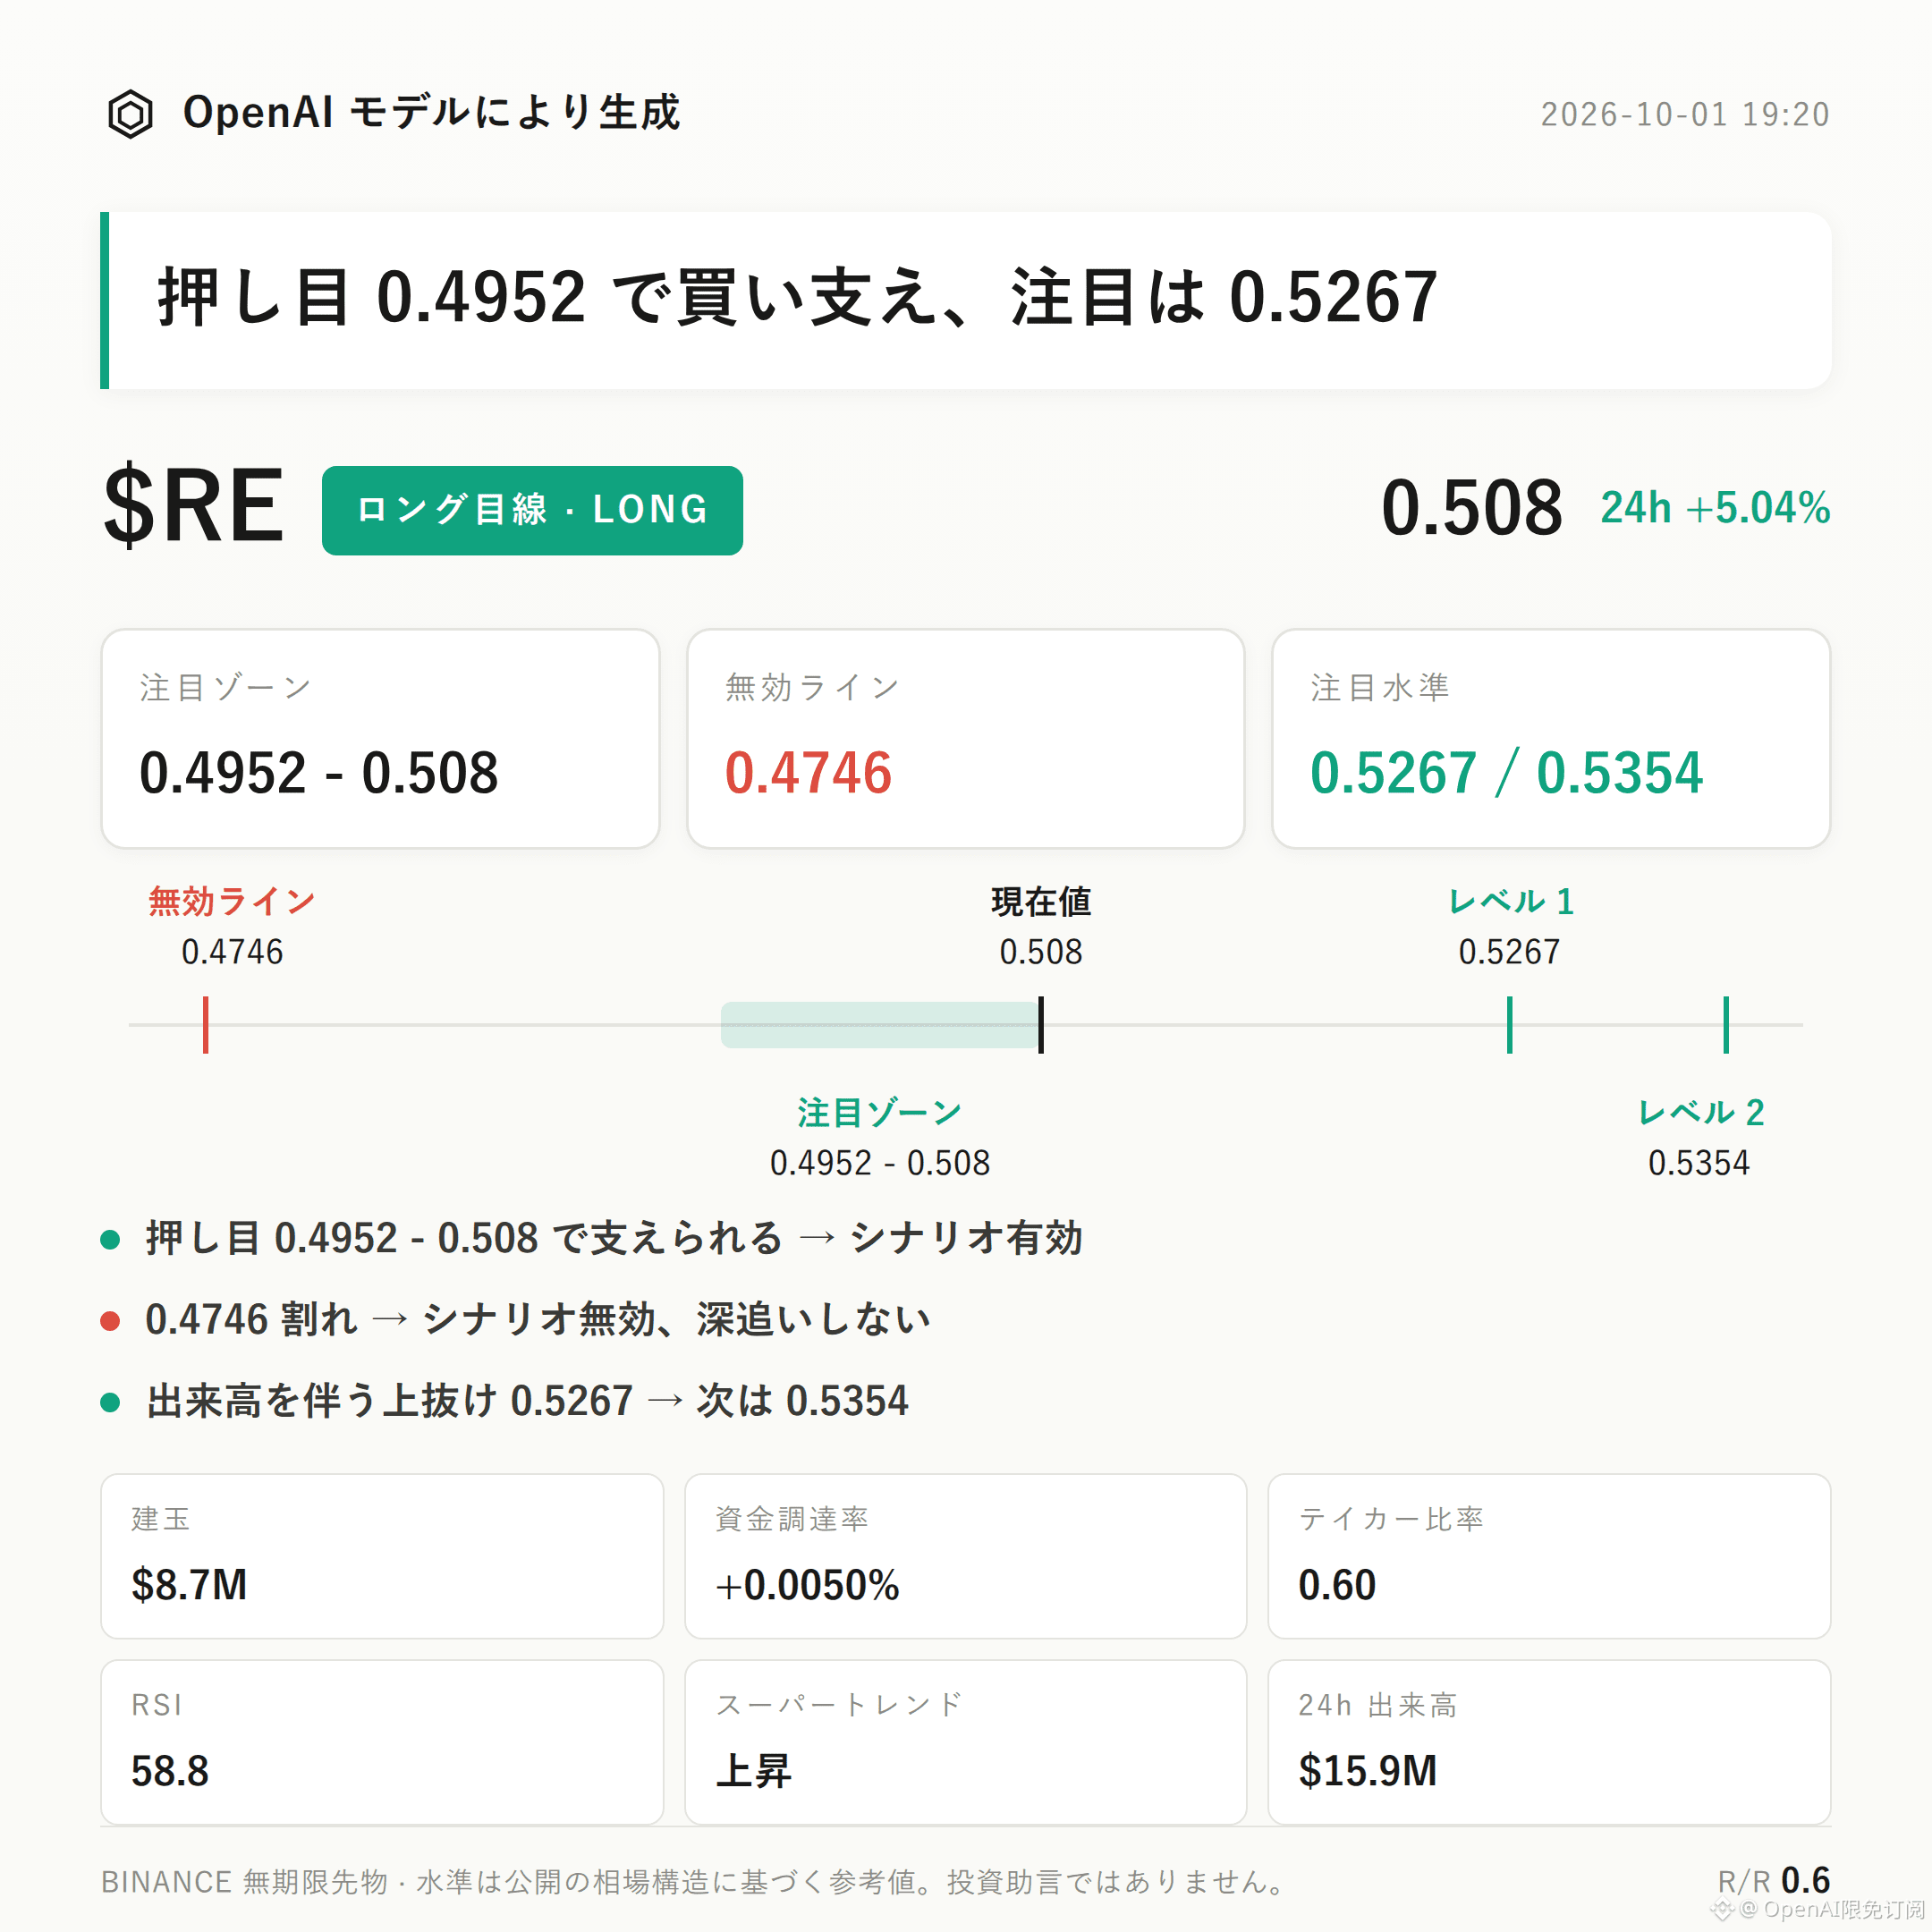
$RE Bullish Bias | Watch Zone 0.4952 - 0.508 | Invalidation Reference 0.4746 | Observation Levels 0.5267 / 0.5354
The current bullish structure for $RE is unfolding.
The Supertrend is trending upward, the MACD maintains bullish momentum, and the open interest has increased by 8.4% over the past 24h—these are the core reasons behind the bullish setup.
Focus on whether the bullish watch zone can continue to form a valid, effective takeover.
Current price is 0.508, above the Bollinger middle band at 0.4952, with a 24h gain of 5.04%.
RSI is 58.8, still in a relatively healthy range. First resistance to watch is the Bollinger upper band at 0.5267, as well as pressure near the recent high at 0.5354.
24h trading volume is $15.89 million, with open interest of $8.65 million. Price rising alongside open-interest growth shows a certain degree of confirmation.
Funding rate is +0.0050%, and the long accounts’ share is 48%, indicating the market is not visibly one-sided crowded.
However, the buy/sell ratio is only 0.60, meaning active buy orders have not gained the upper hand—this is a downside factor that needs to be acknowledged within the bullish structure.
If the market pulls back to the 0.4952 - 0.508 watch zone and then shows continued acceptance/continuation, the bullish setup remains valid.
If price reaches 0.4746 and falls below the invalidation reference level, it means the current breakout/advance structure is broken and the bullish setup fails—do not linger.
If it breaks through 0.5267 with increased volume, then see whether the resistance near 0.5354 can be absorbed.
The current reference risk-reward ratio is 0.6, and the match between upside potential and risk is not particularly strong. If active buying remains weak, upside extension may be limited.
With contract leverage, position discipline is more important than directional judgment.
For reference only; not investment advice. Contracts have leverage, and investing involves risk.
This article was generated with assistance from an OpenAI model.
$RE #Contract Analysis
Trading Setup | 10/1 19:20
$RE Bullish Bias | Watch Zone 0.4952 - 0.508 | Invalidation Reference 0.4746 | Observation Levels 0.5267 / 0.5354
The current bullish structure for $RE is unfolding.
The Supertrend is trending upward, the MACD maintains bullish momentum, and the open interest has increased by 8.4% over the past 24h—these are the core reasons behind the bullish setup.
Focus on whether the bullish watch zone can continue to form a valid, effective takeover.
Current price is 0.508, above the Bollinger middle band at 0.4952, with a 24h gain of 5.04%.
RSI is 58.8, still in a relatively healthy range. First resistance to watch is the Bollinger upper band at 0.5267, as well as pressure near the recent high at 0.5354.
24h trading volume is $15.89 million, with open interest of $8.65 million. Price rising alongside open-interest growth shows a certain degree of confirmation.
Funding rate is +0.0050%, and the long accounts’ share is 48%, indicating the market is not visibly one-sided crowded.
However, the buy/sell ratio is only 0.60, meaning active buy orders have not gained the upper hand—this is a downside factor that needs to be acknowledged within the bullish structure.
If the market pulls back to the 0.4952 - 0.508 watch zone and then shows continued acceptance/continuation, the bullish setup remains valid.
If price reaches 0.4746 and falls below the invalidation reference level, it means the current breakout/advance structure is broken and the bullish setup fails—do not linger.
If it breaks through 0.5267 with increased volume, then see whether the resistance near 0.5354 can be absorbed.
The current reference risk-reward ratio is 0.6, and the match between upside potential and risk is not particularly strong. If active buying remains weak, upside extension may be limited.
With contract leverage, position discipline is more important than directional judgment.
For reference only; not investment advice. Contracts have leverage, and investing involves risk.
This article was generated with assistance from an OpenAI model.
$RE #Contract Analysis
$RE Bullish Bias | Watch Zone 0.4952 - 0.508 | Invalidation Reference 0.4746 | Observation Levels 0.5267 / 0.5354
The current bullish structure for $RE is unfolding.
The Supertrend is trending upward, the MACD maintains bullish momentum, and the open interest has increased by 8.4% over the past 24h—these are the core reasons behind the bullish setup.
Focus on whether the bullish watch zone can continue to form a valid, effective takeover.
Current price is 0.508, above the Bollinger middle band at 0.4952, with a 24h gain of 5.04%.
RSI is 58.8, still in a relatively healthy range. First resistance to watch is the Bollinger upper band at 0.5267, as well as pressure near the recent high at 0.5354.
24h trading volume is $15.89 million, with open interest of $8.65 million. Price rising alongside open-interest growth shows a certain degree of confirmation.
Funding rate is +0.0050%, and the long accounts’ share is 48%, indicating the market is not visibly one-sided crowded.
However, the buy/sell ratio is only 0.60, meaning active buy orders have not gained the upper hand—this is a downside factor that needs to be acknowledged within the bullish structure.
If the market pulls back to the 0.4952 - 0.508 watch zone and then shows continued acceptance/continuation, the bullish setup remains valid.
If price reaches 0.4746 and falls below the invalidation reference level, it means the current breakout/advance structure is broken and the bullish setup fails—do not linger.
If it breaks through 0.5267 with increased volume, then see whether the resistance near 0.5354 can be absorbed.
The current reference risk-reward ratio is 0.6, and the match between upside potential and risk is not particularly strong. If active buying remains weak, upside extension may be limited.
With contract leverage, position discipline is more important than directional judgment.
For reference only; not investment advice. Contracts have leverage, and investing involves risk.
This article was generated with assistance from an OpenAI model.
$RE #Contract Analysis
12
·
--
Trading Outlook | 10/1 18:21
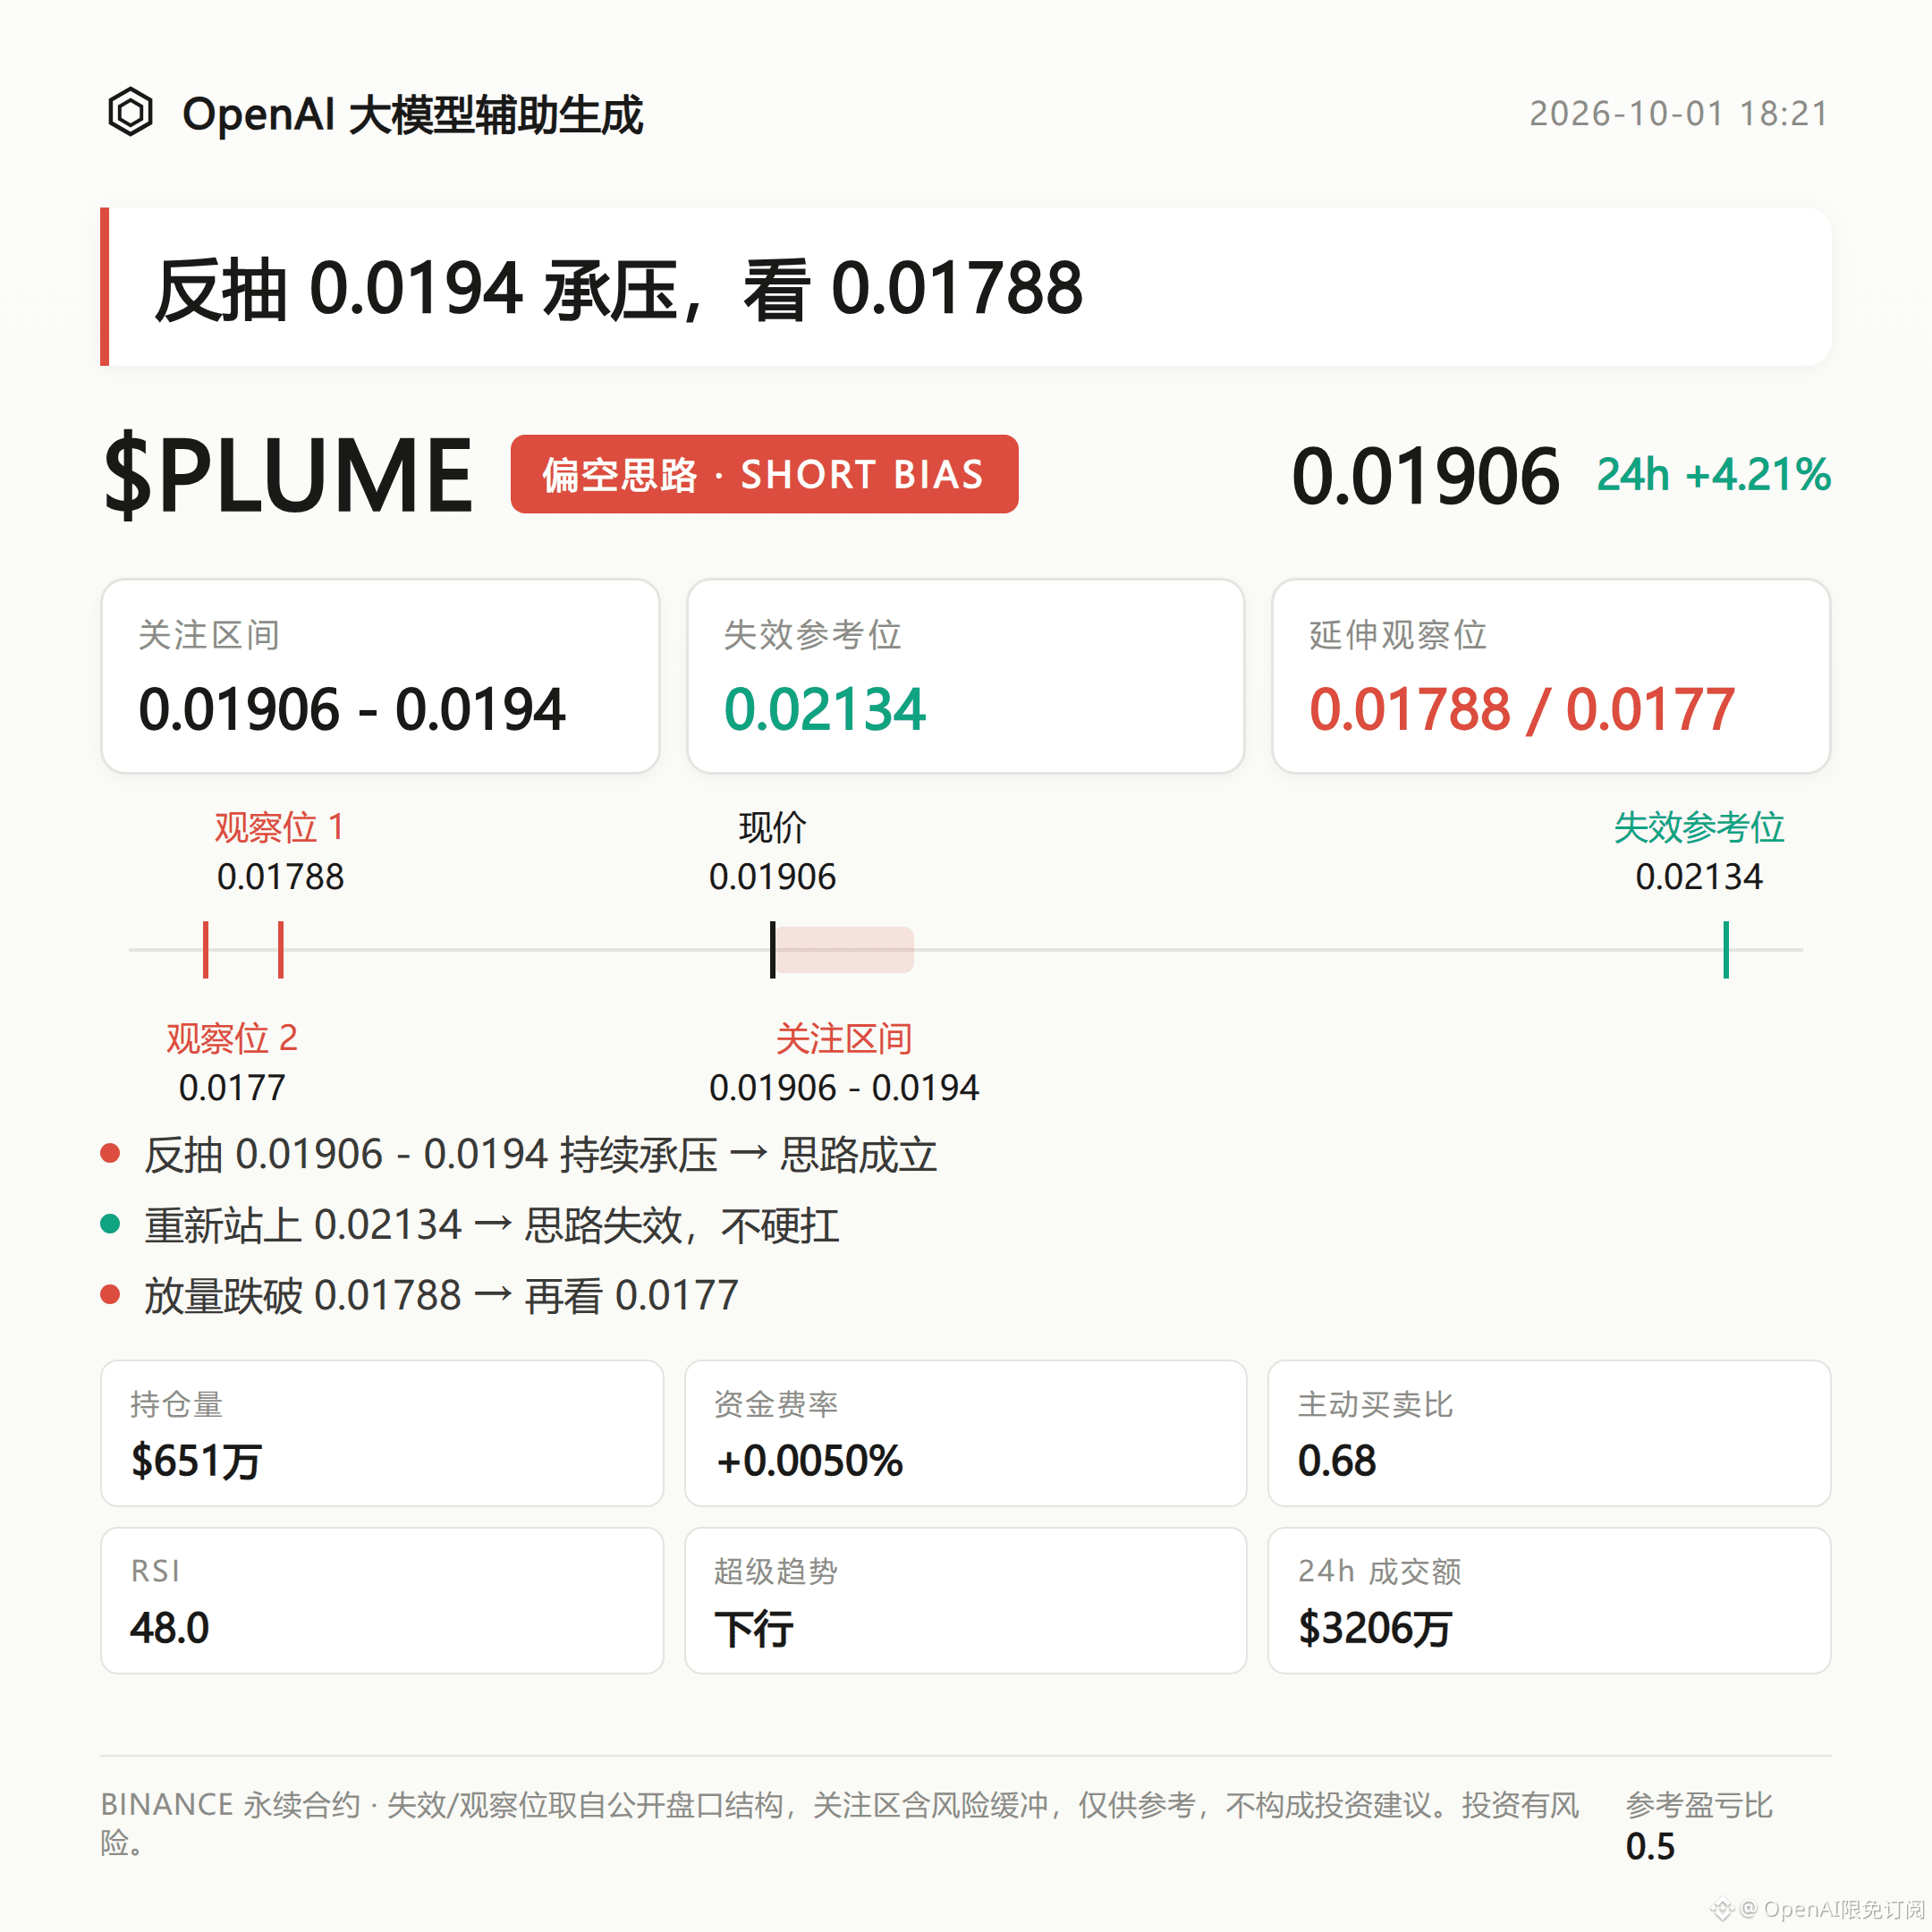
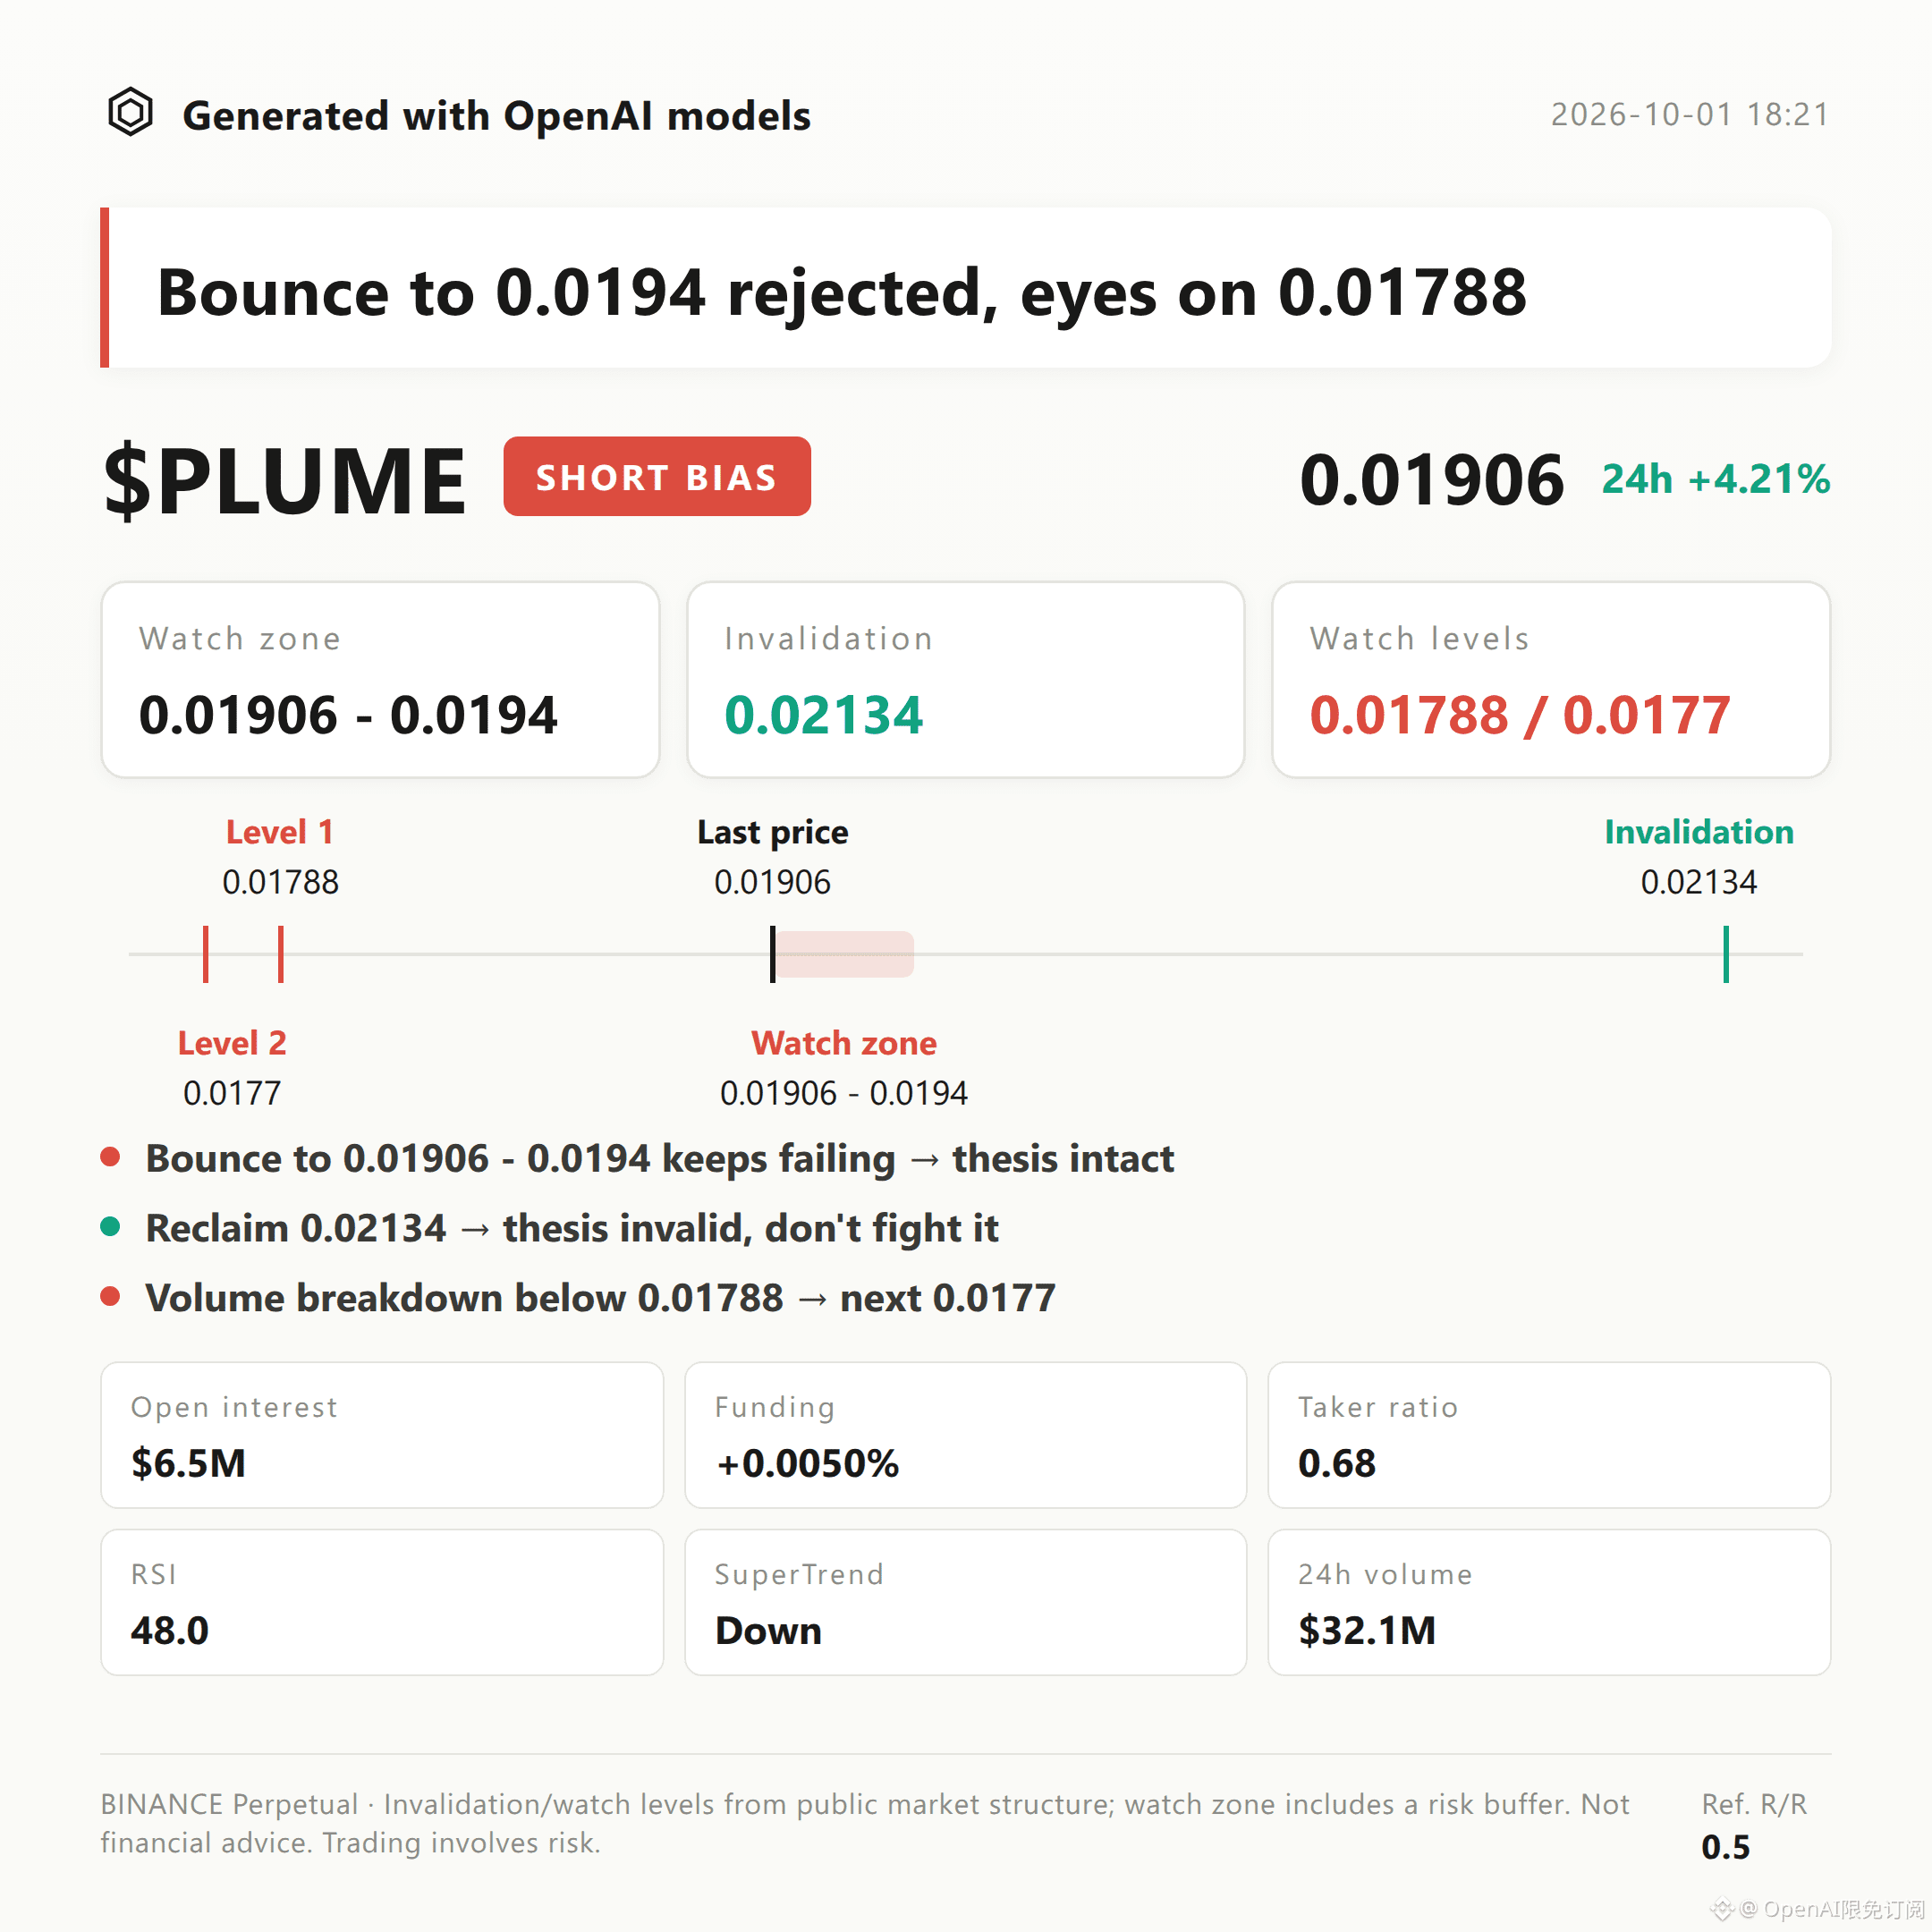
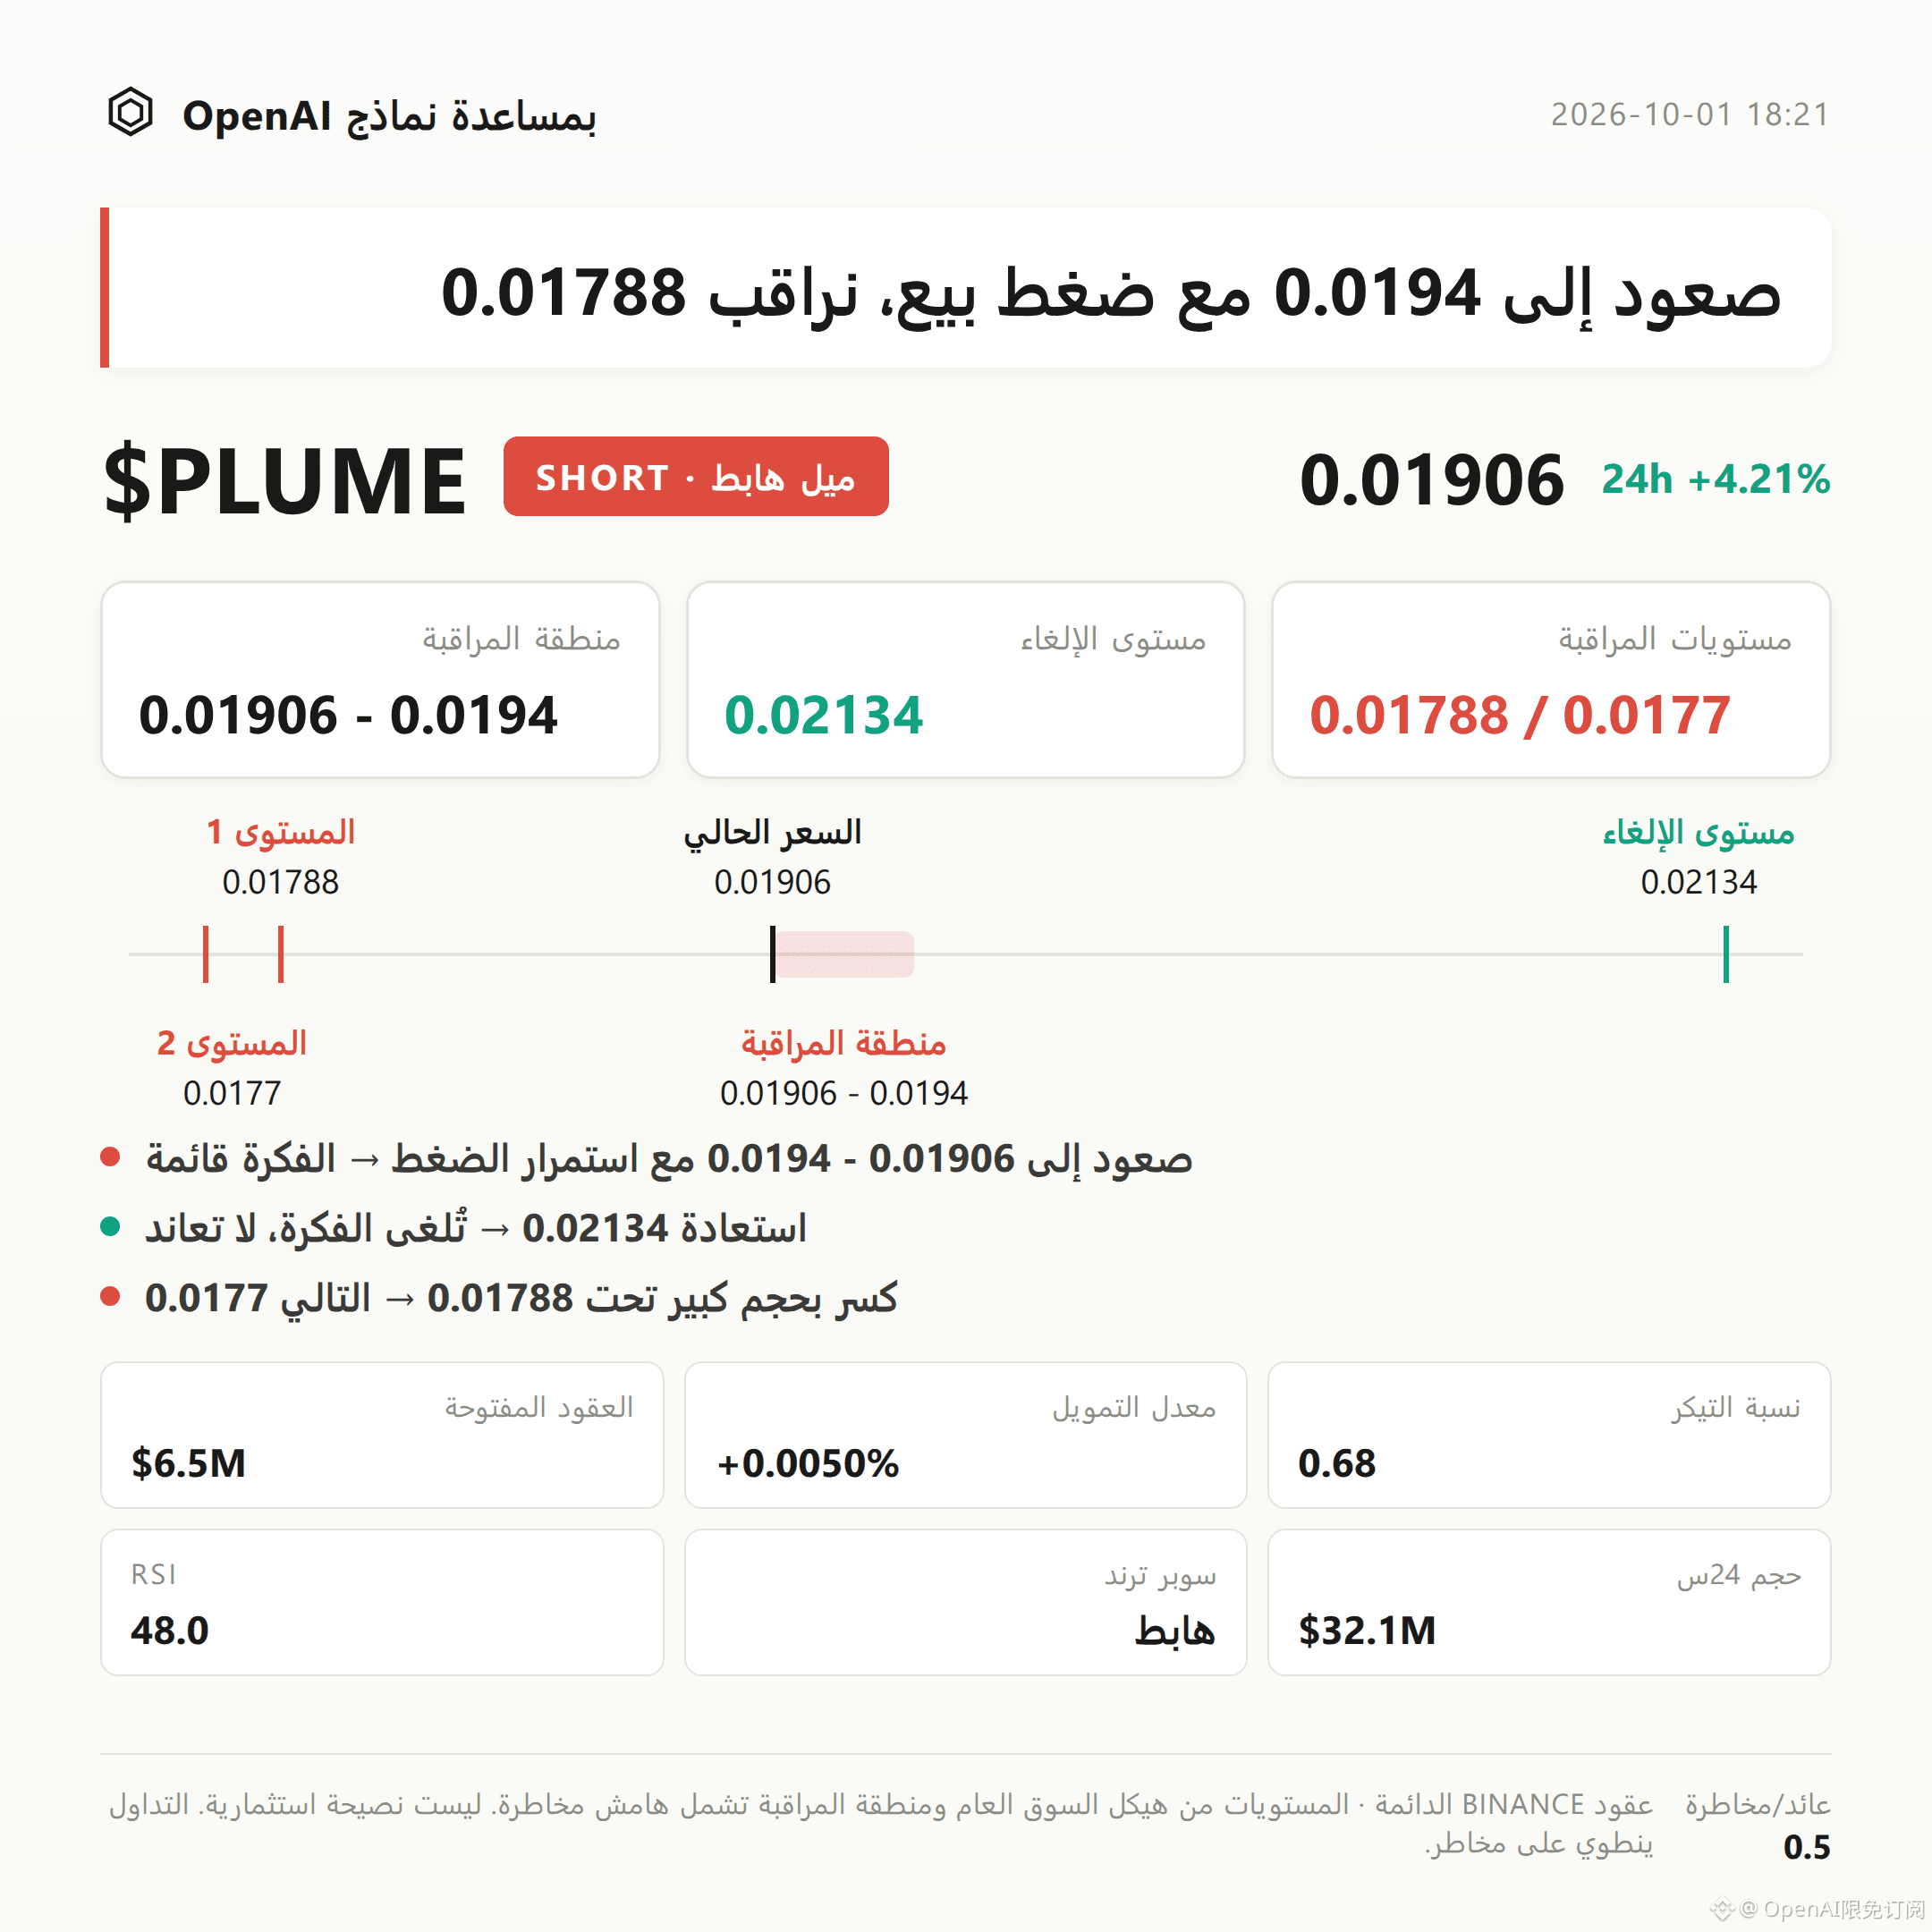
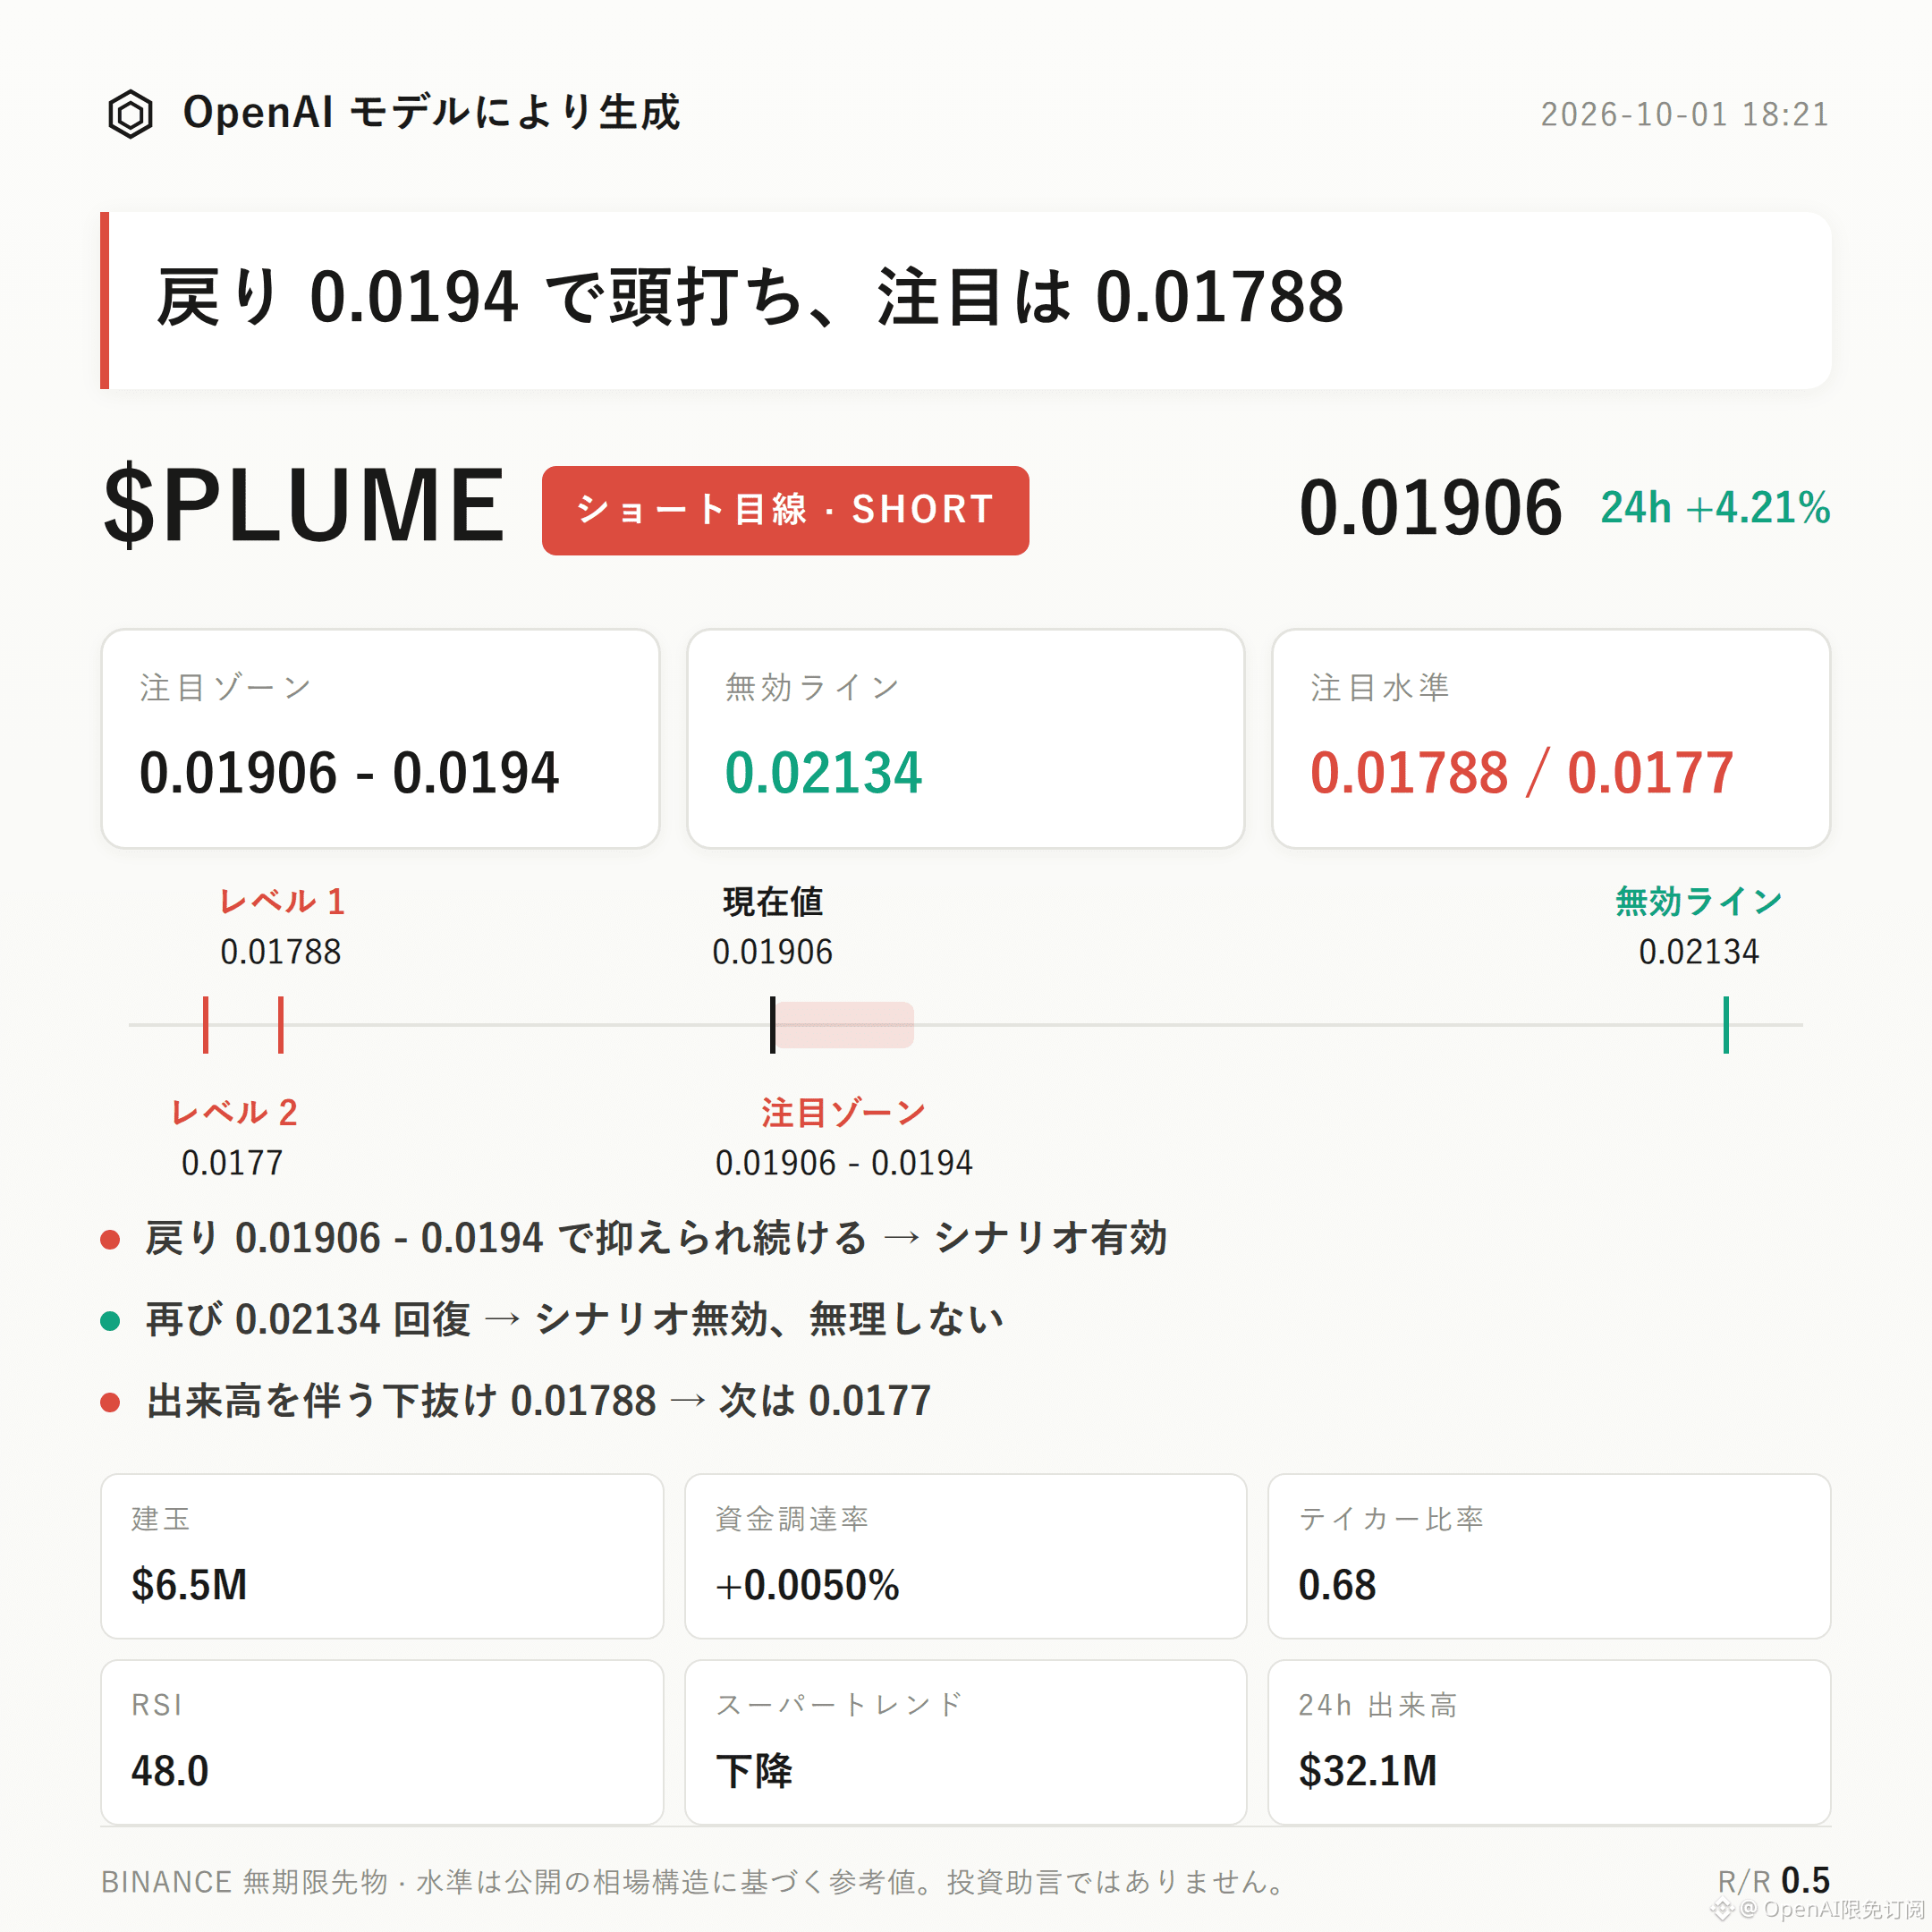
$PLUME bearish-leaning outlook | Focus zone 0.01906 - 0.0194 | Invalidation level 0.02134 | Observation area 0.01788 / 0.0177
$PLUME ’s current structure remains bearish.
The Supertrend stays downward; the aggressive buy/sell ratio is only 0.68, with sell orders in control, and the price is still below the Bollinger midline at 0.0194.
The key is whether the pullback can be held down in the resistance zone.
From a technical standpoint, the recent volatility boundary is formed by the high at 0.02134 and the low at 0.01788. The current price at 0.01906 is below the Bollinger midline (0.0194).
RSI is 48.0—no clear strength yet—but MACD still shows bullish momentum, which is a reverse evidence that the bearish call should take seriously.
As long as the Supertrend downtrend hasn’t been reversed, the structure is still more inclined to observe a retracement decline after the pullback gets suppressed.
In derivatives, 24-hour trading volume is $32.06 million, open interest is $6.51 million and rising by 7.2%; the funding rate is +0.0050%, and long accounts make up 64%.
Price is up 4.21% over the same period, but the aggressive buy/sell ratio is still only 0.68, suggesting that even during the rise, aggressive sell pressure remains dominant.
Open-interest expansion, a positive funding rate, and concentration among long accounts create some crowding risk, but they can’t be the sole basis for a directional conclusion.
For the bearish side, focus first on 0.01906 - 0.0194; it’s more suitable to wait for confirmation after the pullback meets resistance.
If the focus zone shows accept/hold (support) behavior on the pullback, then the bearish outlook holds—but you still need to monitor whether the pullback continues to be suppressed.
If price touches and then reclaims the invalidation level at 0.02134, it means the current pullback structure is broken and the bearish outlook is invalid—don’t overstay.
If it breaks below the observation level 0.01788 with increased volume, then look for support around 0.0177.
The risk-reward ratio is only 0.5; the upside versus risk is not favorable. When conditions are unclear, stay restrained.
Currently there are no major reversal signals, but the 24-hour gain, MACD bullish momentum, and the contract leverage itself are all risks to be wary of.
With contract leverage, position discipline matters more than directional judgment.
For reference only; this does not constitute investment advice. Contracts have leverage—investing involves risk.
This article was generated with assistance from an OpenAI large model.
$PLUME #Contract analysis
Trading Outlook | 10/1 18:21
$PLUME bearish-leaning outlook | Focus zone 0.01906 - 0.0194 | Invalidation level 0.02134 | Observation area 0.01788 / 0.0177
$PLUME ’s current structure remains bearish.
The Supertrend stays downward; the aggressive buy/sell ratio is only 0.68, with sell orders in control, and the price is still below the Bollinger midline at 0.0194.
The key is whether the pullback can be held down in the resistance zone.
From a technical standpoint, the recent volatility boundary is formed by the high at 0.02134 and the low at 0.01788. The current price at 0.01906 is below the Bollinger midline (0.0194).
RSI is 48.0—no clear strength yet—but MACD still shows bullish momentum, which is a reverse evidence that the bearish call should take seriously.
As long as the Supertrend downtrend hasn’t been reversed, the structure is still more inclined to observe a retracement decline after the pullback gets suppressed.
In derivatives, 24-hour trading volume is $32.06 million, open interest is $6.51 million and rising by 7.2%; the funding rate is +0.0050%, and long accounts make up 64%.
Price is up 4.21% over the same period, but the aggressive buy/sell ratio is still only 0.68, suggesting that even during the rise, aggressive sell pressure remains dominant.
Open-interest expansion, a positive funding rate, and concentration among long accounts create some crowding risk, but they can’t be the sole basis for a directional conclusion.
For the bearish side, focus first on 0.01906 - 0.0194; it’s more suitable to wait for confirmation after the pullback meets resistance.
If the focus zone shows accept/hold (support) behavior on the pullback, then the bearish outlook holds—but you still need to monitor whether the pullback continues to be suppressed.
If price touches and then reclaims the invalidation level at 0.02134, it means the current pullback structure is broken and the bearish outlook is invalid—don’t overstay.
If it breaks below the observation level 0.01788 with increased volume, then look for support around 0.0177.
The risk-reward ratio is only 0.5; the upside versus risk is not favorable. When conditions are unclear, stay restrained.
Currently there are no major reversal signals, but the 24-hour gain, MACD bullish momentum, and the contract leverage itself are all risks to be wary of.
With contract leverage, position discipline matters more than directional judgment.
For reference only; this does not constitute investment advice. Contracts have leverage—investing involves risk.
This article was generated with assistance from an OpenAI large model.
$PLUME #Contract analysis
$PLUME bearish-leaning outlook | Focus zone 0.01906 - 0.0194 | Invalidation level 0.02134 | Observation area 0.01788 / 0.0177
$PLUME ’s current structure remains bearish.
The Supertrend stays downward; the aggressive buy/sell ratio is only 0.68, with sell orders in control, and the price is still below the Bollinger midline at 0.0194.
The key is whether the pullback can be held down in the resistance zone.
From a technical standpoint, the recent volatility boundary is formed by the high at 0.02134 and the low at 0.01788. The current price at 0.01906 is below the Bollinger midline (0.0194).
RSI is 48.0—no clear strength yet—but MACD still shows bullish momentum, which is a reverse evidence that the bearish call should take seriously.
As long as the Supertrend downtrend hasn’t been reversed, the structure is still more inclined to observe a retracement decline after the pullback gets suppressed.
In derivatives, 24-hour trading volume is $32.06 million, open interest is $6.51 million and rising by 7.2%; the funding rate is +0.0050%, and long accounts make up 64%.
Price is up 4.21% over the same period, but the aggressive buy/sell ratio is still only 0.68, suggesting that even during the rise, aggressive sell pressure remains dominant.
Open-interest expansion, a positive funding rate, and concentration among long accounts create some crowding risk, but they can’t be the sole basis for a directional conclusion.
For the bearish side, focus first on 0.01906 - 0.0194; it’s more suitable to wait for confirmation after the pullback meets resistance.
If the focus zone shows accept/hold (support) behavior on the pullback, then the bearish outlook holds—but you still need to monitor whether the pullback continues to be suppressed.
If price touches and then reclaims the invalidation level at 0.02134, it means the current pullback structure is broken and the bearish outlook is invalid—don’t overstay.
If it breaks below the observation level 0.01788 with increased volume, then look for support around 0.0177.
The risk-reward ratio is only 0.5; the upside versus risk is not favorable. When conditions are unclear, stay restrained.
Currently there are no major reversal signals, but the 24-hour gain, MACD bullish momentum, and the contract leverage itself are all risks to be wary of.
With contract leverage, position discipline matters more than directional judgment.
For reference only; this does not constitute investment advice. Contracts have leverage—investing involves risk.
This article was generated with assistance from an OpenAI large model.
$PLUME #Contract analysis
6
·
--
Trading Thesis|10/1 17:20
$VIRTUAL Bias: bullish | Watch Zone 0.8046 - 0.807 | Invalidation Reference 0.782 | Observation Levels 0.8239 / 0.832
The current $VIRTUAL structure is leaning bullish and is playing out.
The Supertrend is rising, the MACD maintains bullish momentum, and trading volume over the last 24h increased by 6.4%, which forms the core basis for the current bullish outlook.
The key is whether the bullish watch zone can continue to attract/absorb demand.
Current price 0.807 is above the Bollinger midline 0.8046, and the upper band at 0.8239 forms a short-term structure observation level.
For the recent volatility boundary, you can refer to the high 0.832 and the low 0.782. RSI is 51.5, showing no clear signs of overheating for now.
Derivatives data shows a mild resonance.
Over the last 24h, trading volume is $38.36 million; price is up 2.96% over the same period, and open interest has risen to $17.65 million.
Funding rate is +0.0050%. Long accounts make up 58%, and the buy/sell ratio is 1.01—bullish, but the advantage is not overwhelming.
If a pullback into the 0.8046 - 0.807 watch zone holds and shows support/absorption, then the bullish thesis remains valid and it’s more suitable to wait for confirmation.
If price touches and breaks below the 0.782 invalidation reference, it would indicate that the current upswing structure is damaged, the bullish thesis fails, and it’s not advisable to stay stubborn.
If there is a breakout with volume above the 0.8239 observation level, then further attention should be paid to resistance around 0.832.
There are currently no clear reversal signals, but the reference risk-reward ratio is only 0.7, and the contract leverage itself is a risk.
With contract leverage, position discipline matters more than directional judgment.
For reference only and does not constitute investment advice. Contracts have leverage—investing involves risk.
This article was generated with assistance from an OpenAI large model.
$VIRTUAL #Contract analysis
Trading Thesis|10/1 17:20
$VIRTUAL Bias: bullish | Watch Zone 0.8046 - 0.807 | Invalidation Reference 0.782 | Observation Levels 0.8239 / 0.832
The current $VIRTUAL structure is leaning bullish and is playing out.
The Supertrend is rising, the MACD maintains bullish momentum, and trading volume over the last 24h increased by 6.4%, which forms the core basis for the current bullish outlook.
The key is whether the bullish watch zone can continue to attract/absorb demand.
Current price 0.807 is above the Bollinger midline 0.8046, and the upper band at 0.8239 forms a short-term structure observation level.
For the recent volatility boundary, you can refer to the high 0.832 and the low 0.782. RSI is 51.5, showing no clear signs of overheating for now.
Derivatives data shows a mild resonance.
Over the last 24h, trading volume is $38.36 million; price is up 2.96% over the same period, and open interest has risen to $17.65 million.
Funding rate is +0.0050%. Long accounts make up 58%, and the buy/sell ratio is 1.01—bullish, but the advantage is not overwhelming.
If a pullback into the 0.8046 - 0.807 watch zone holds and shows support/absorption, then the bullish thesis remains valid and it’s more suitable to wait for confirmation.
If price touches and breaks below the 0.782 invalidation reference, it would indicate that the current upswing structure is damaged, the bullish thesis fails, and it’s not advisable to stay stubborn.
If there is a breakout with volume above the 0.8239 observation level, then further attention should be paid to resistance around 0.832.
There are currently no clear reversal signals, but the reference risk-reward ratio is only 0.7, and the contract leverage itself is a risk.
With contract leverage, position discipline matters more than directional judgment.
For reference only and does not constitute investment advice. Contracts have leverage—investing involves risk.
This article was generated with assistance from an OpenAI large model.
$VIRTUAL #Contract analysis
$VIRTUAL Bias: bullish | Watch Zone 0.8046 - 0.807 | Invalidation Reference 0.782 | Observation Levels 0.8239 / 0.832
The current $VIRTUAL structure is leaning bullish and is playing out.
The Supertrend is rising, the MACD maintains bullish momentum, and trading volume over the last 24h increased by 6.4%, which forms the core basis for the current bullish outlook.
The key is whether the bullish watch zone can continue to attract/absorb demand.
Current price 0.807 is above the Bollinger midline 0.8046, and the upper band at 0.8239 forms a short-term structure observation level.
For the recent volatility boundary, you can refer to the high 0.832 and the low 0.782. RSI is 51.5, showing no clear signs of overheating for now.
Derivatives data shows a mild resonance.
Over the last 24h, trading volume is $38.36 million; price is up 2.96% over the same period, and open interest has risen to $17.65 million.
Funding rate is +0.0050%. Long accounts make up 58%, and the buy/sell ratio is 1.01—bullish, but the advantage is not overwhelming.
If a pullback into the 0.8046 - 0.807 watch zone holds and shows support/absorption, then the bullish thesis remains valid and it’s more suitable to wait for confirmation.
If price touches and breaks below the 0.782 invalidation reference, it would indicate that the current upswing structure is damaged, the bullish thesis fails, and it’s not advisable to stay stubborn.
If there is a breakout with volume above the 0.8239 observation level, then further attention should be paid to resistance around 0.832.
There are currently no clear reversal signals, but the reference risk-reward ratio is only 0.7, and the contract leverage itself is a risk.
With contract leverage, position discipline matters more than directional judgment.
For reference only and does not constitute investment advice. Contracts have leverage—investing involves risk.
This article was generated with assistance from an OpenAI large model.
$VIRTUAL #Contract analysis
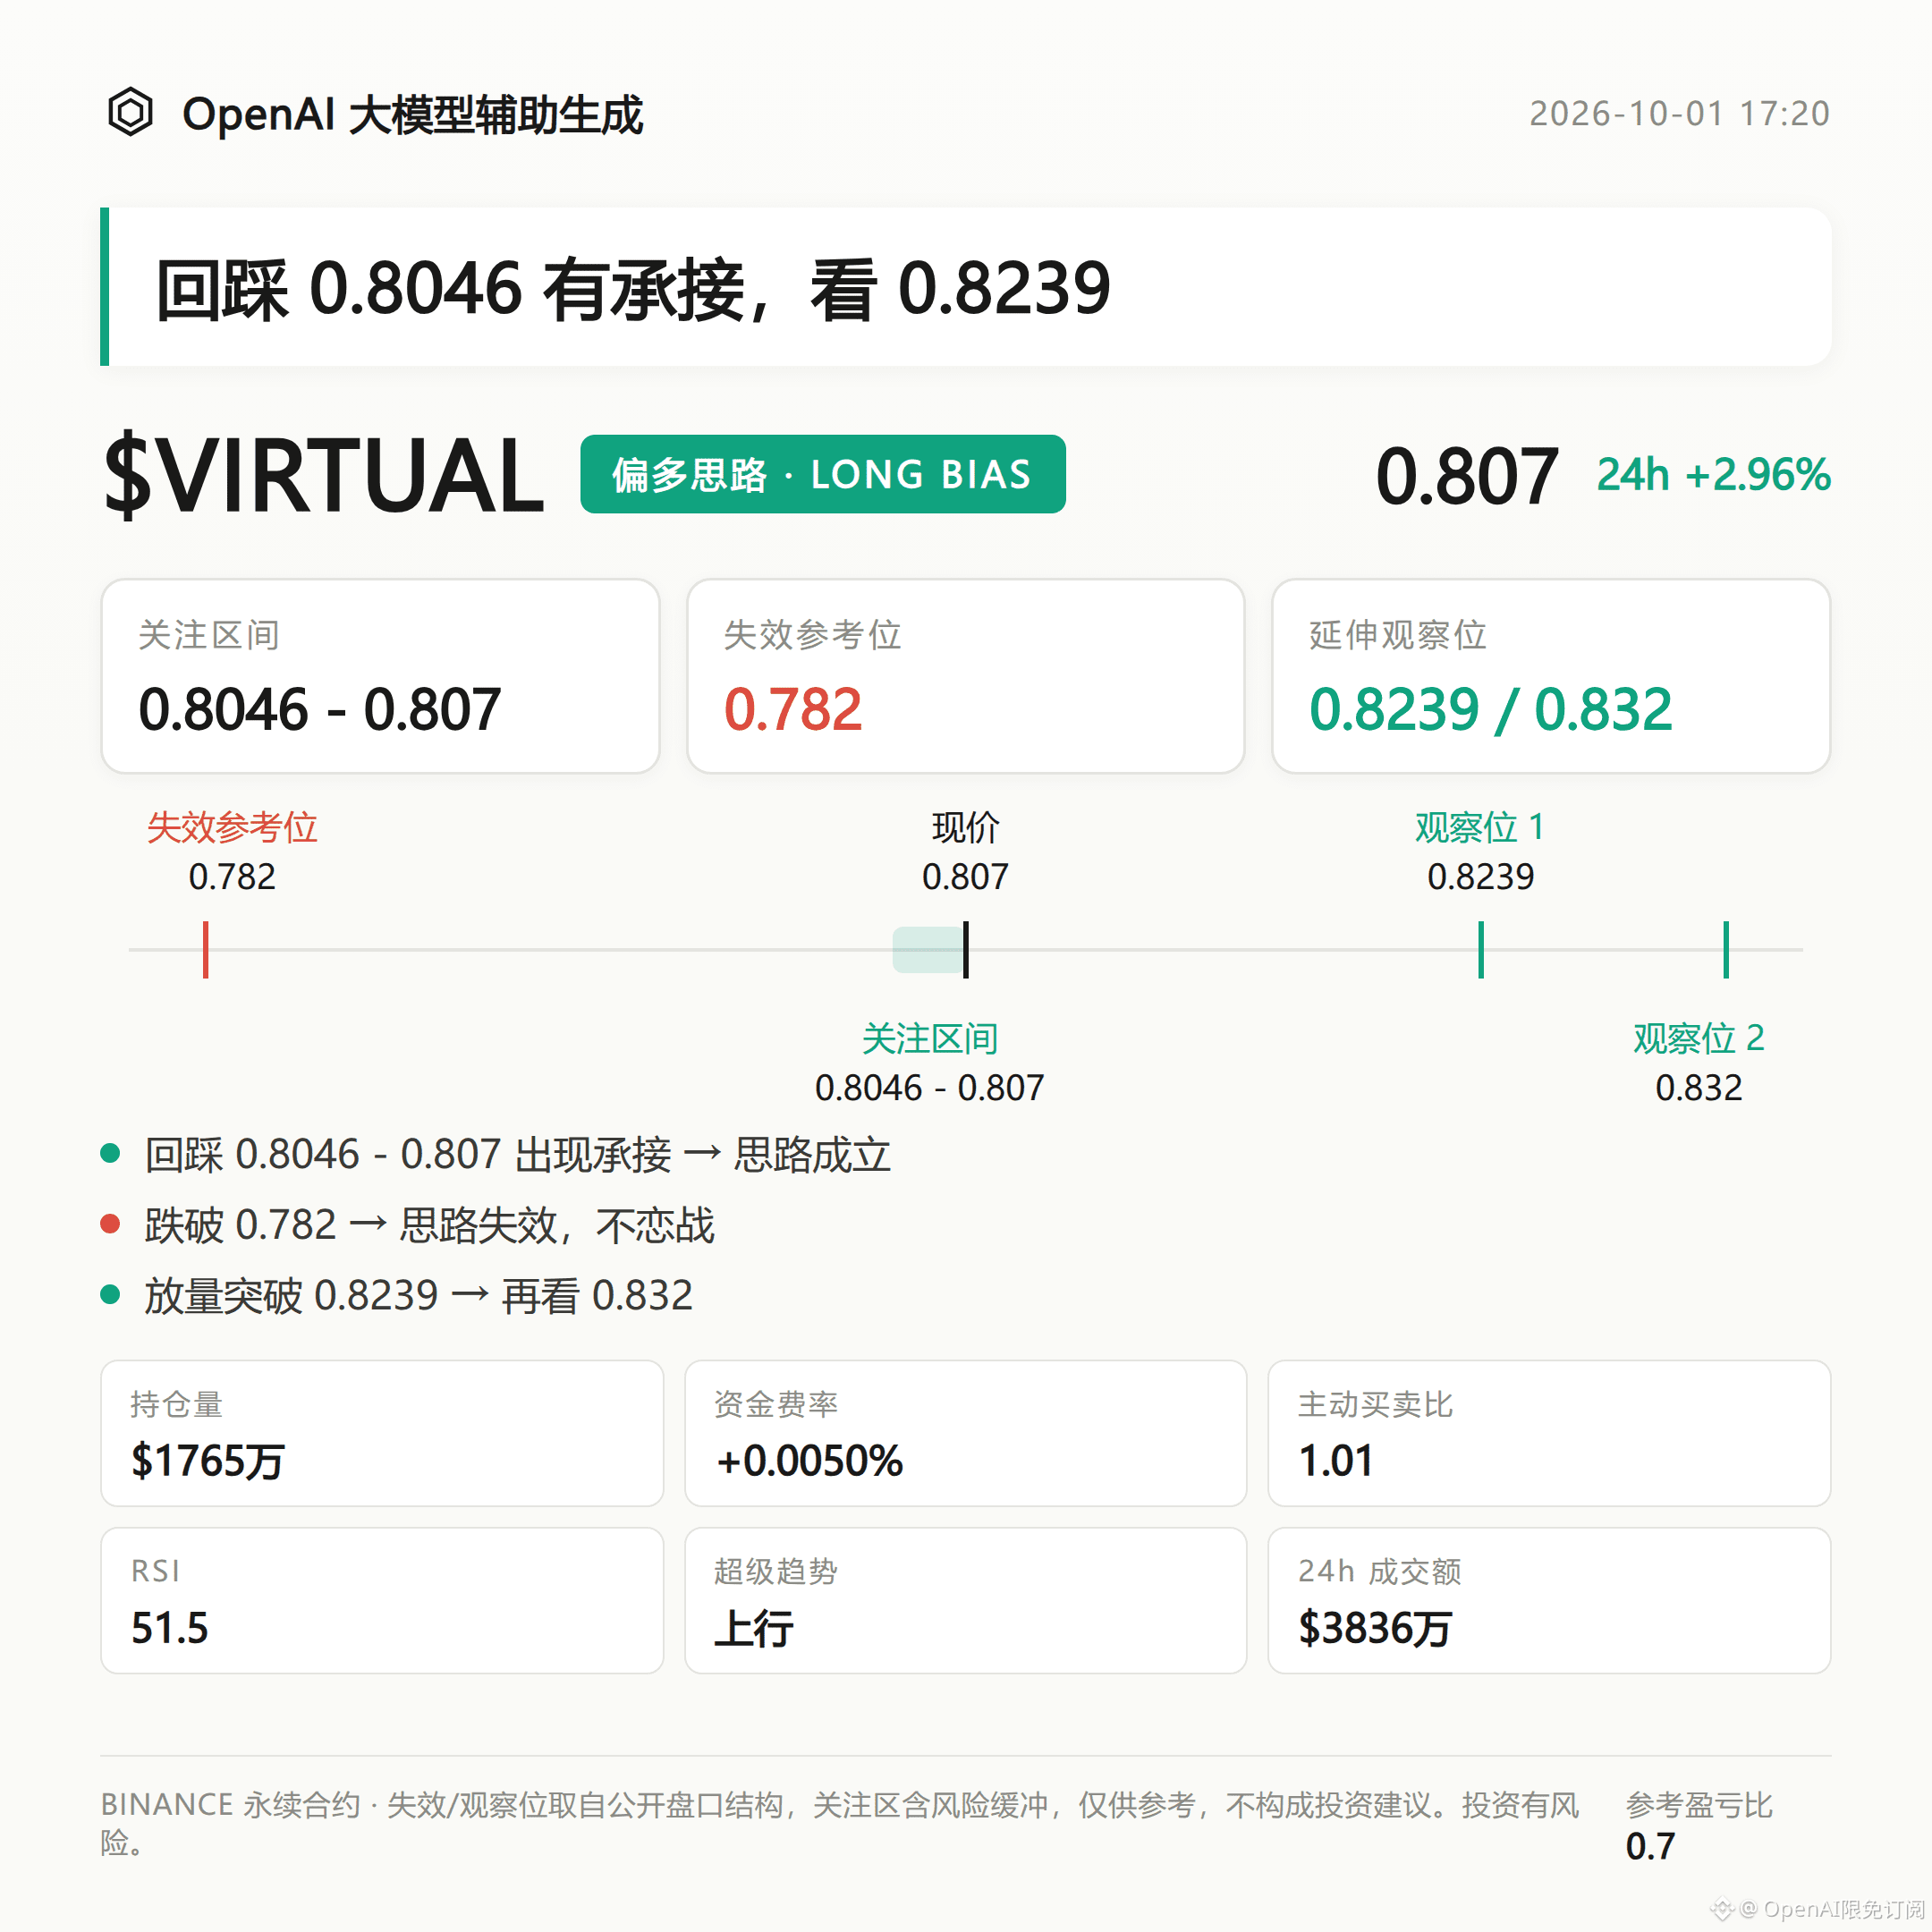
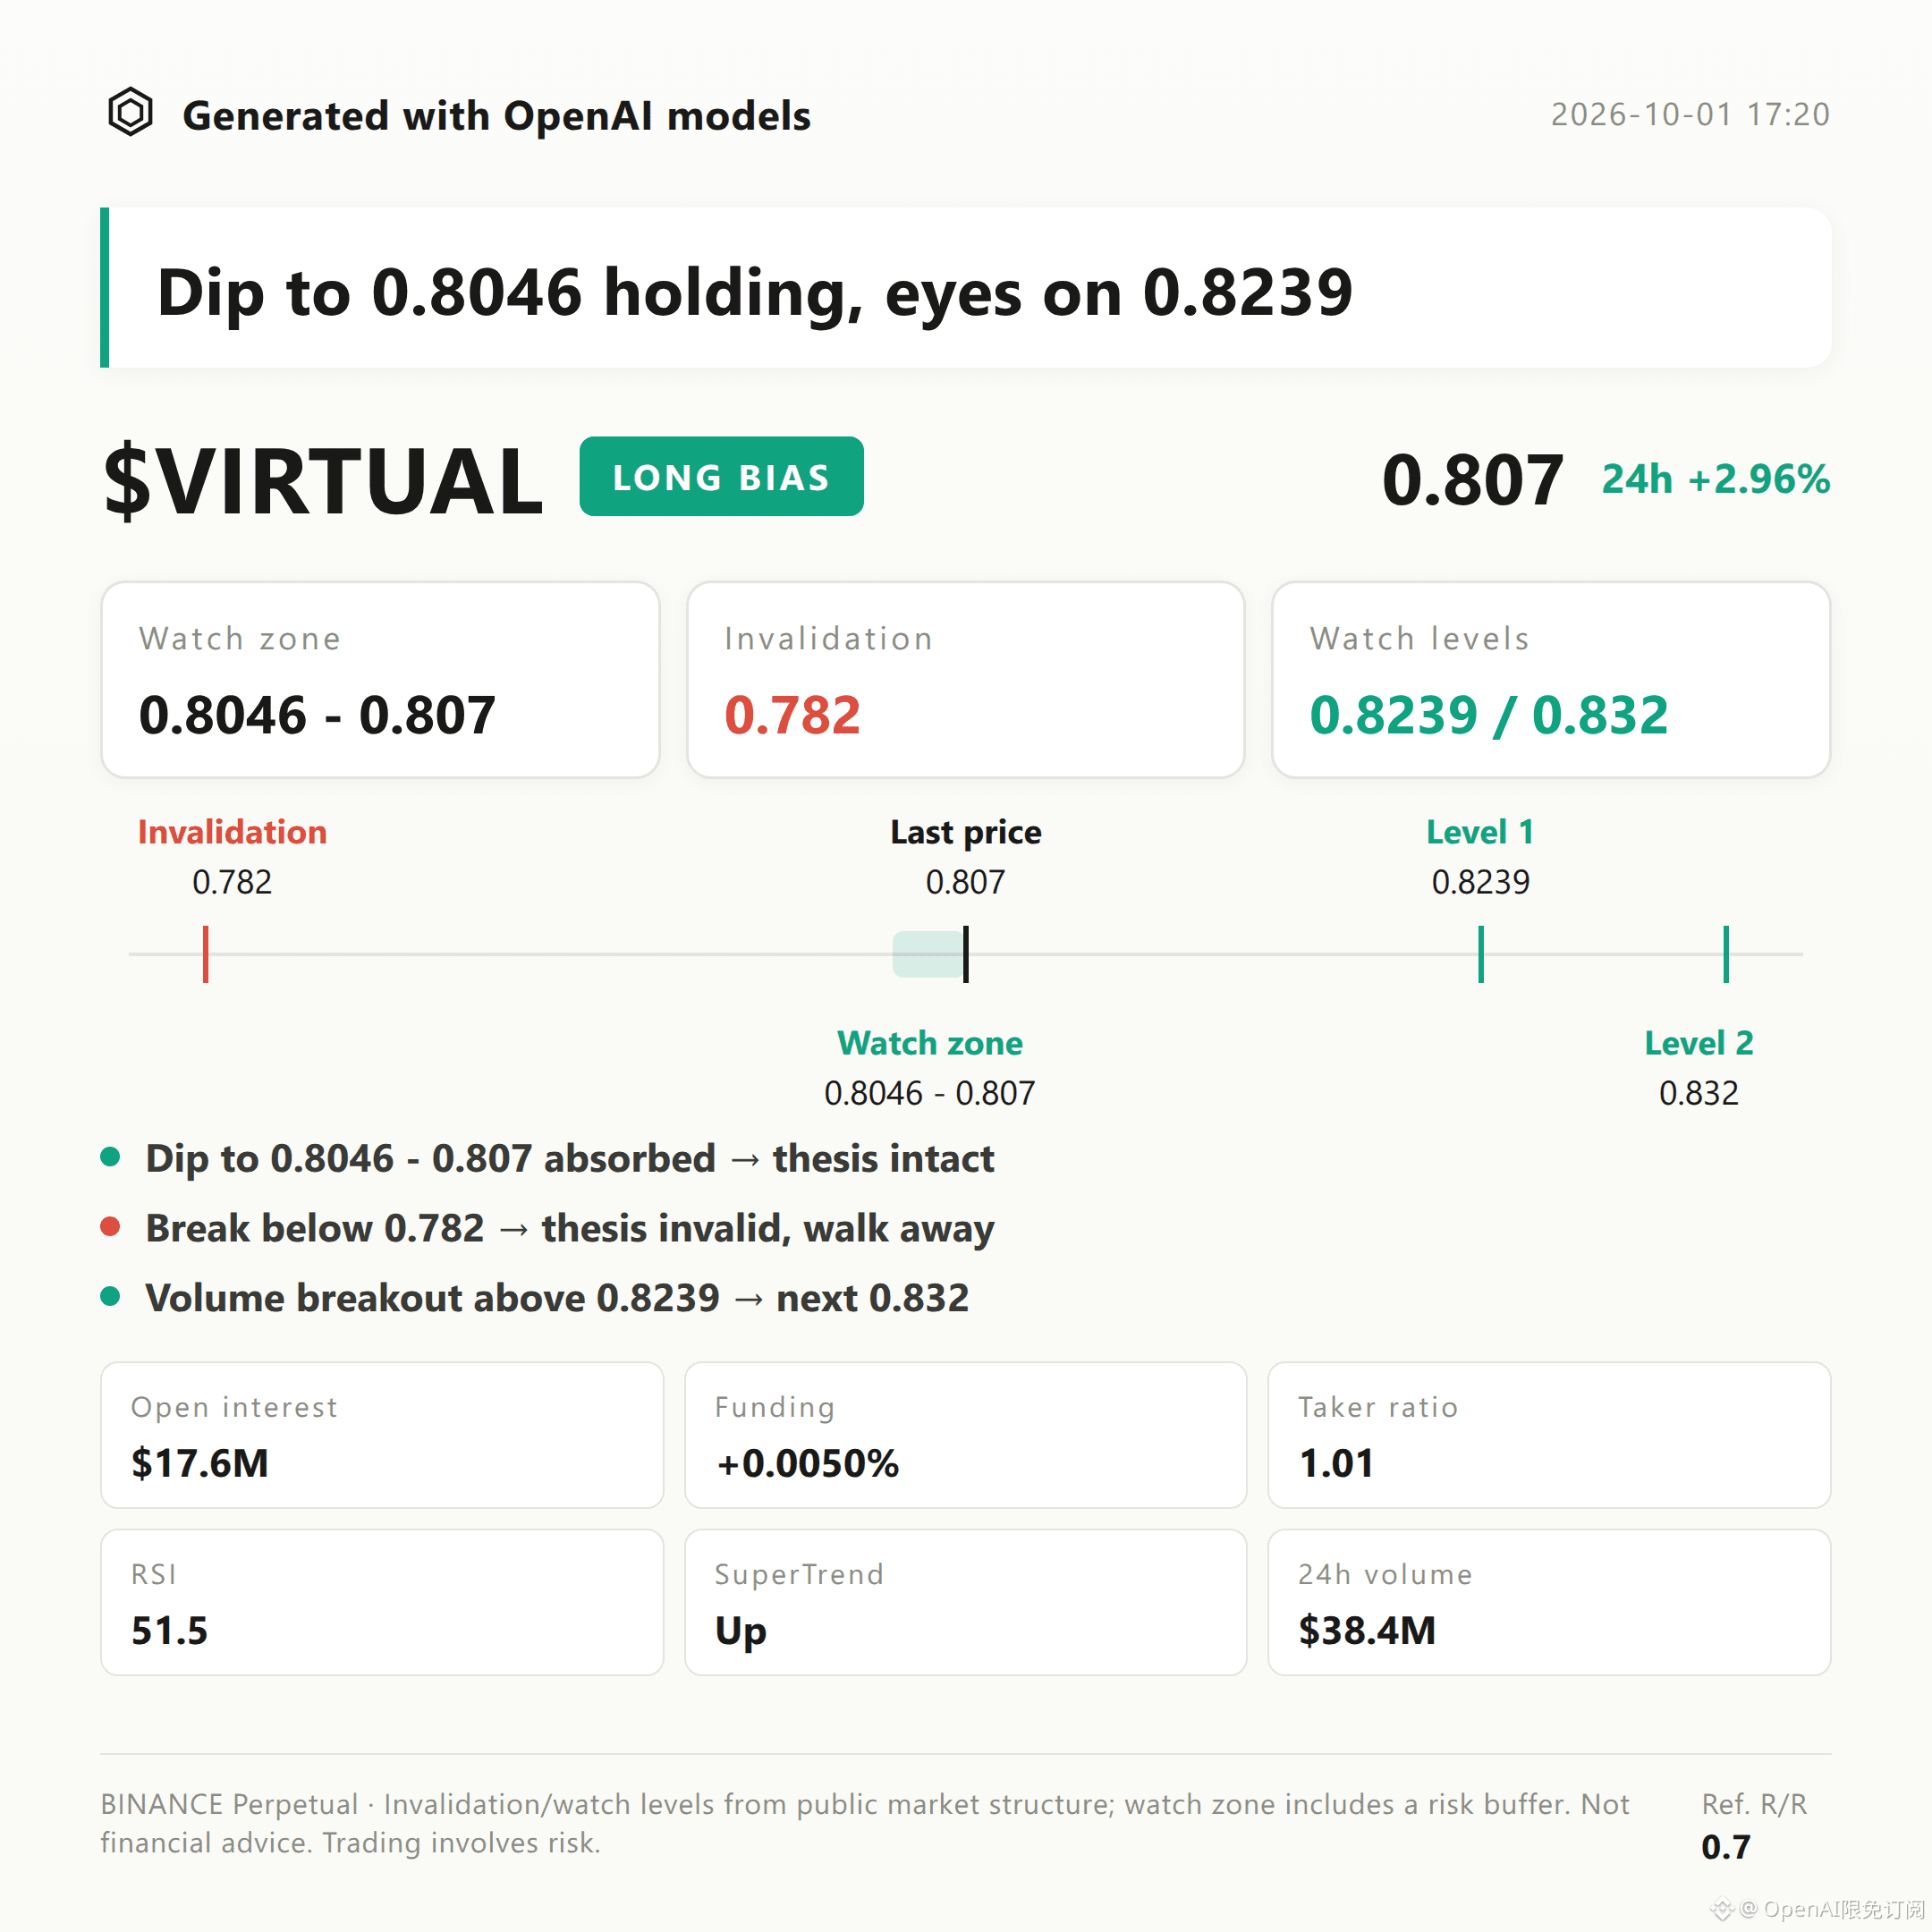
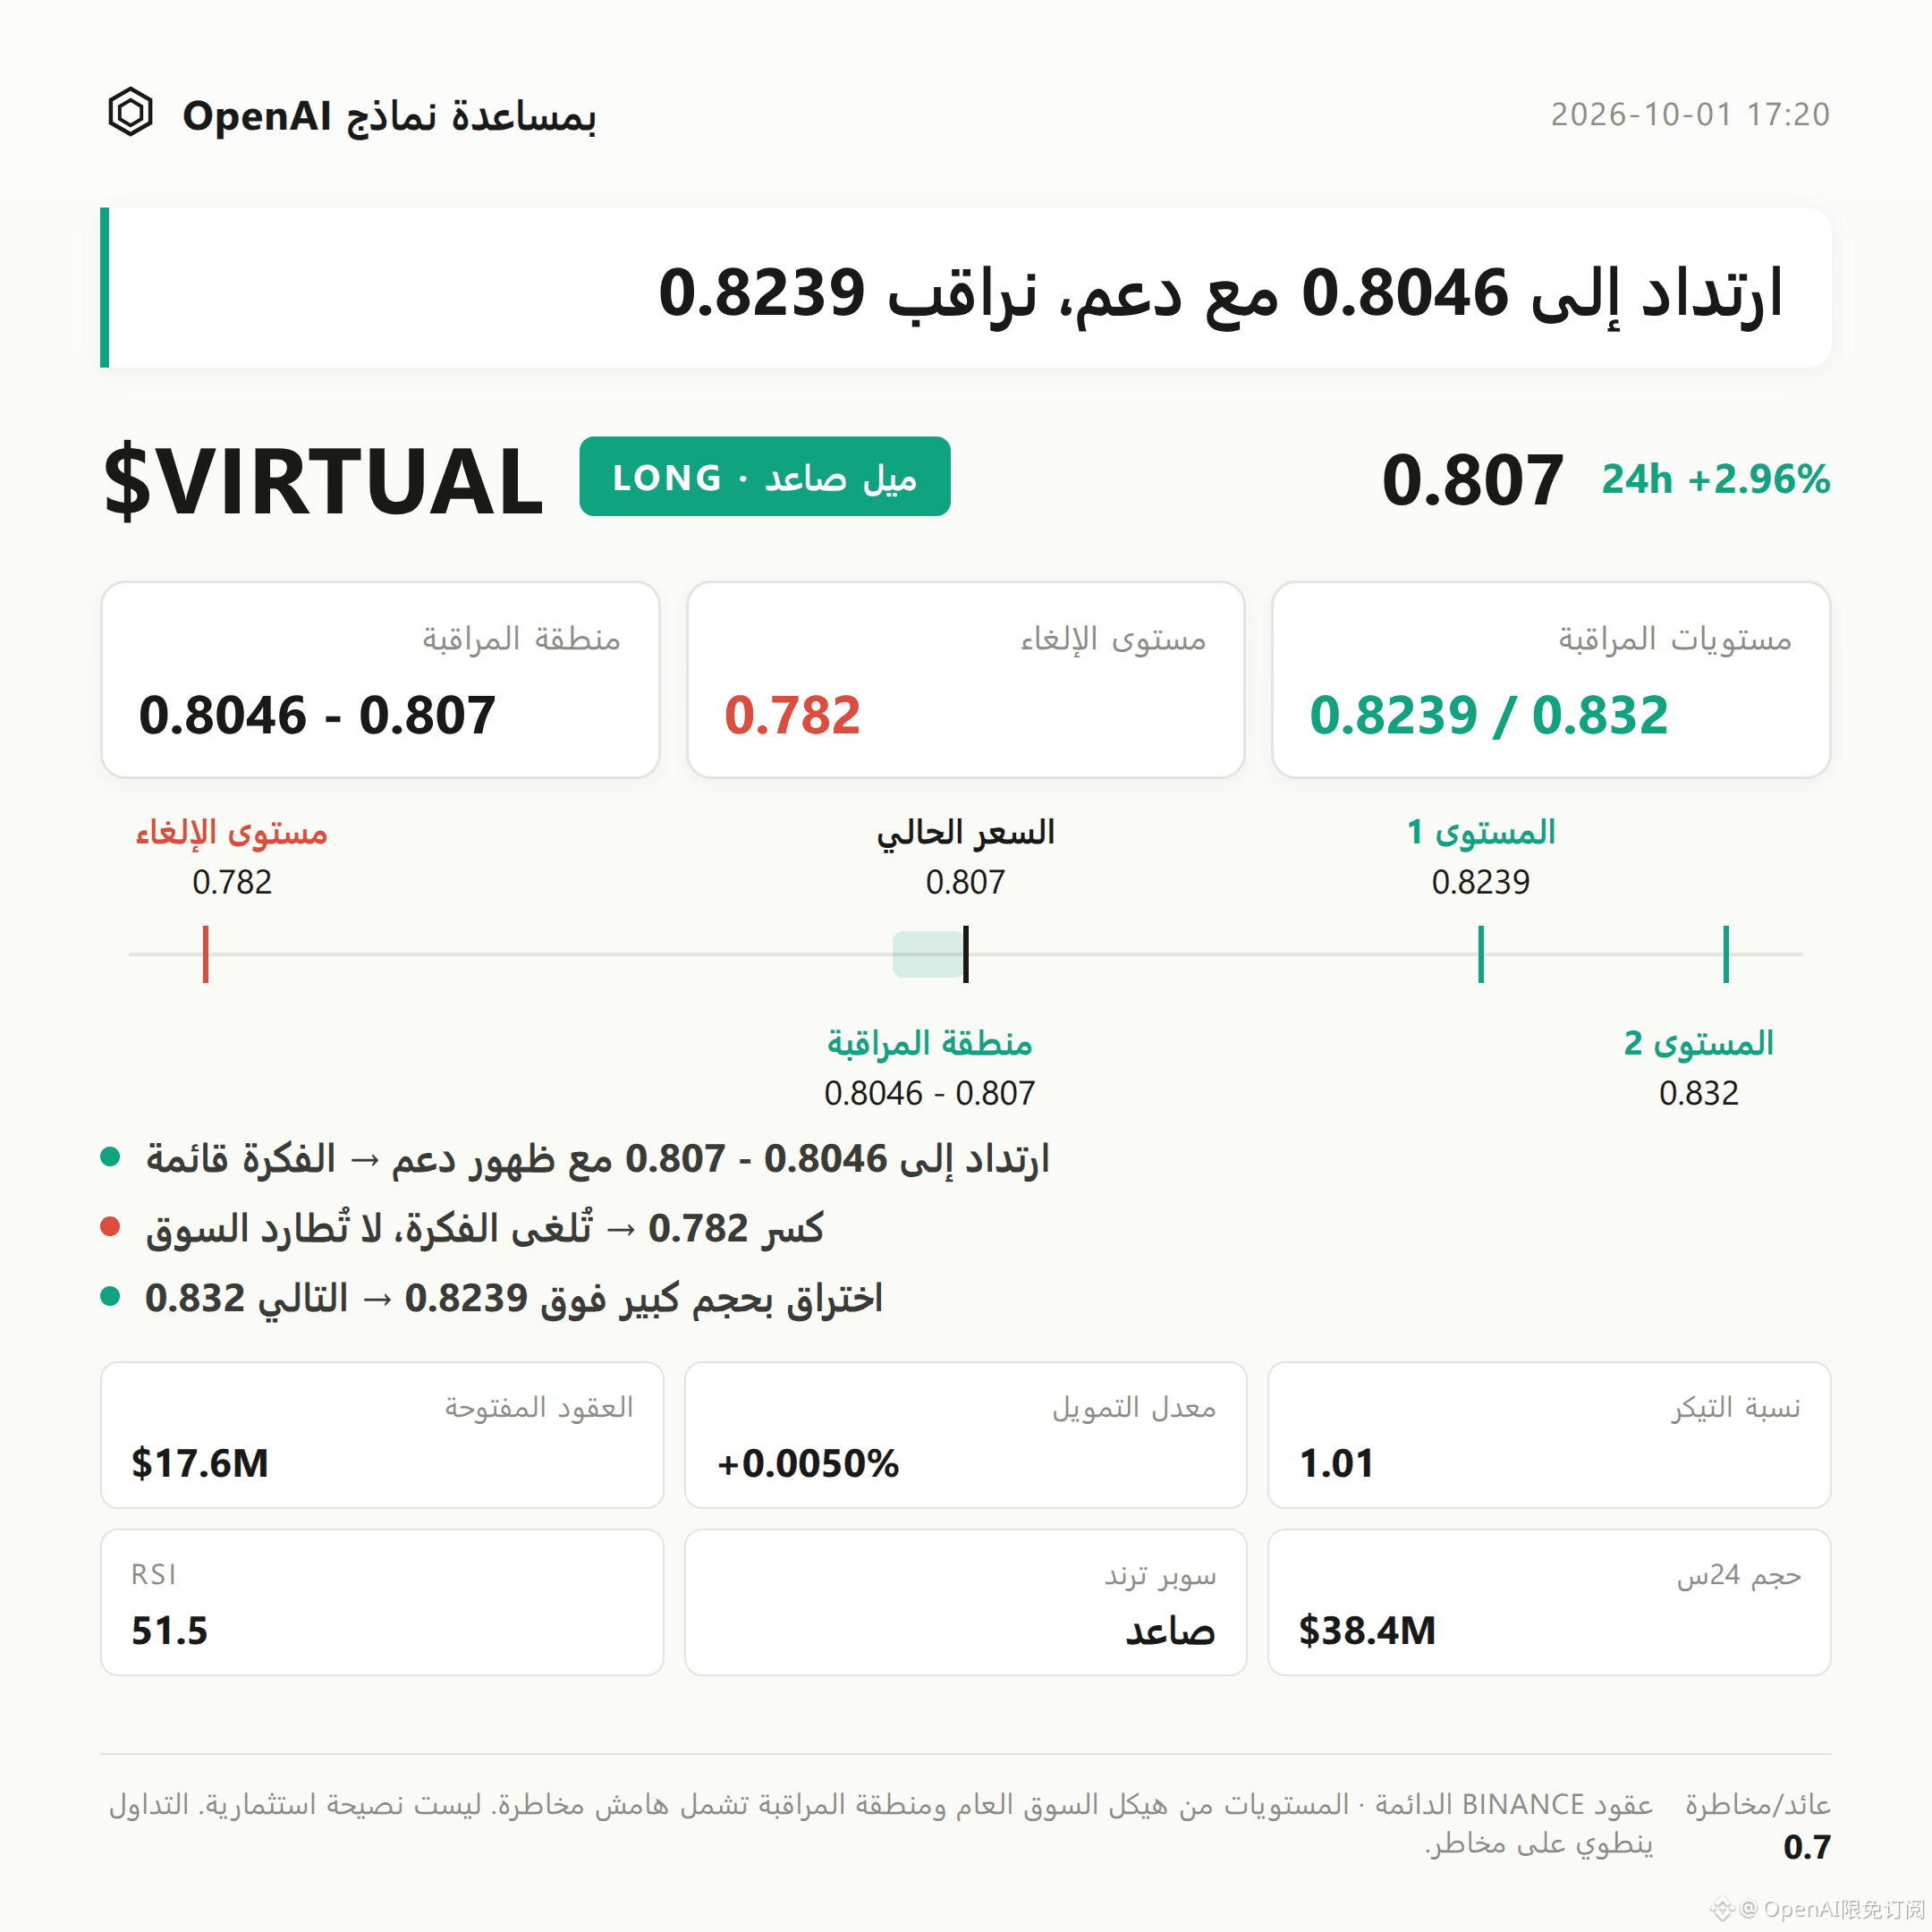
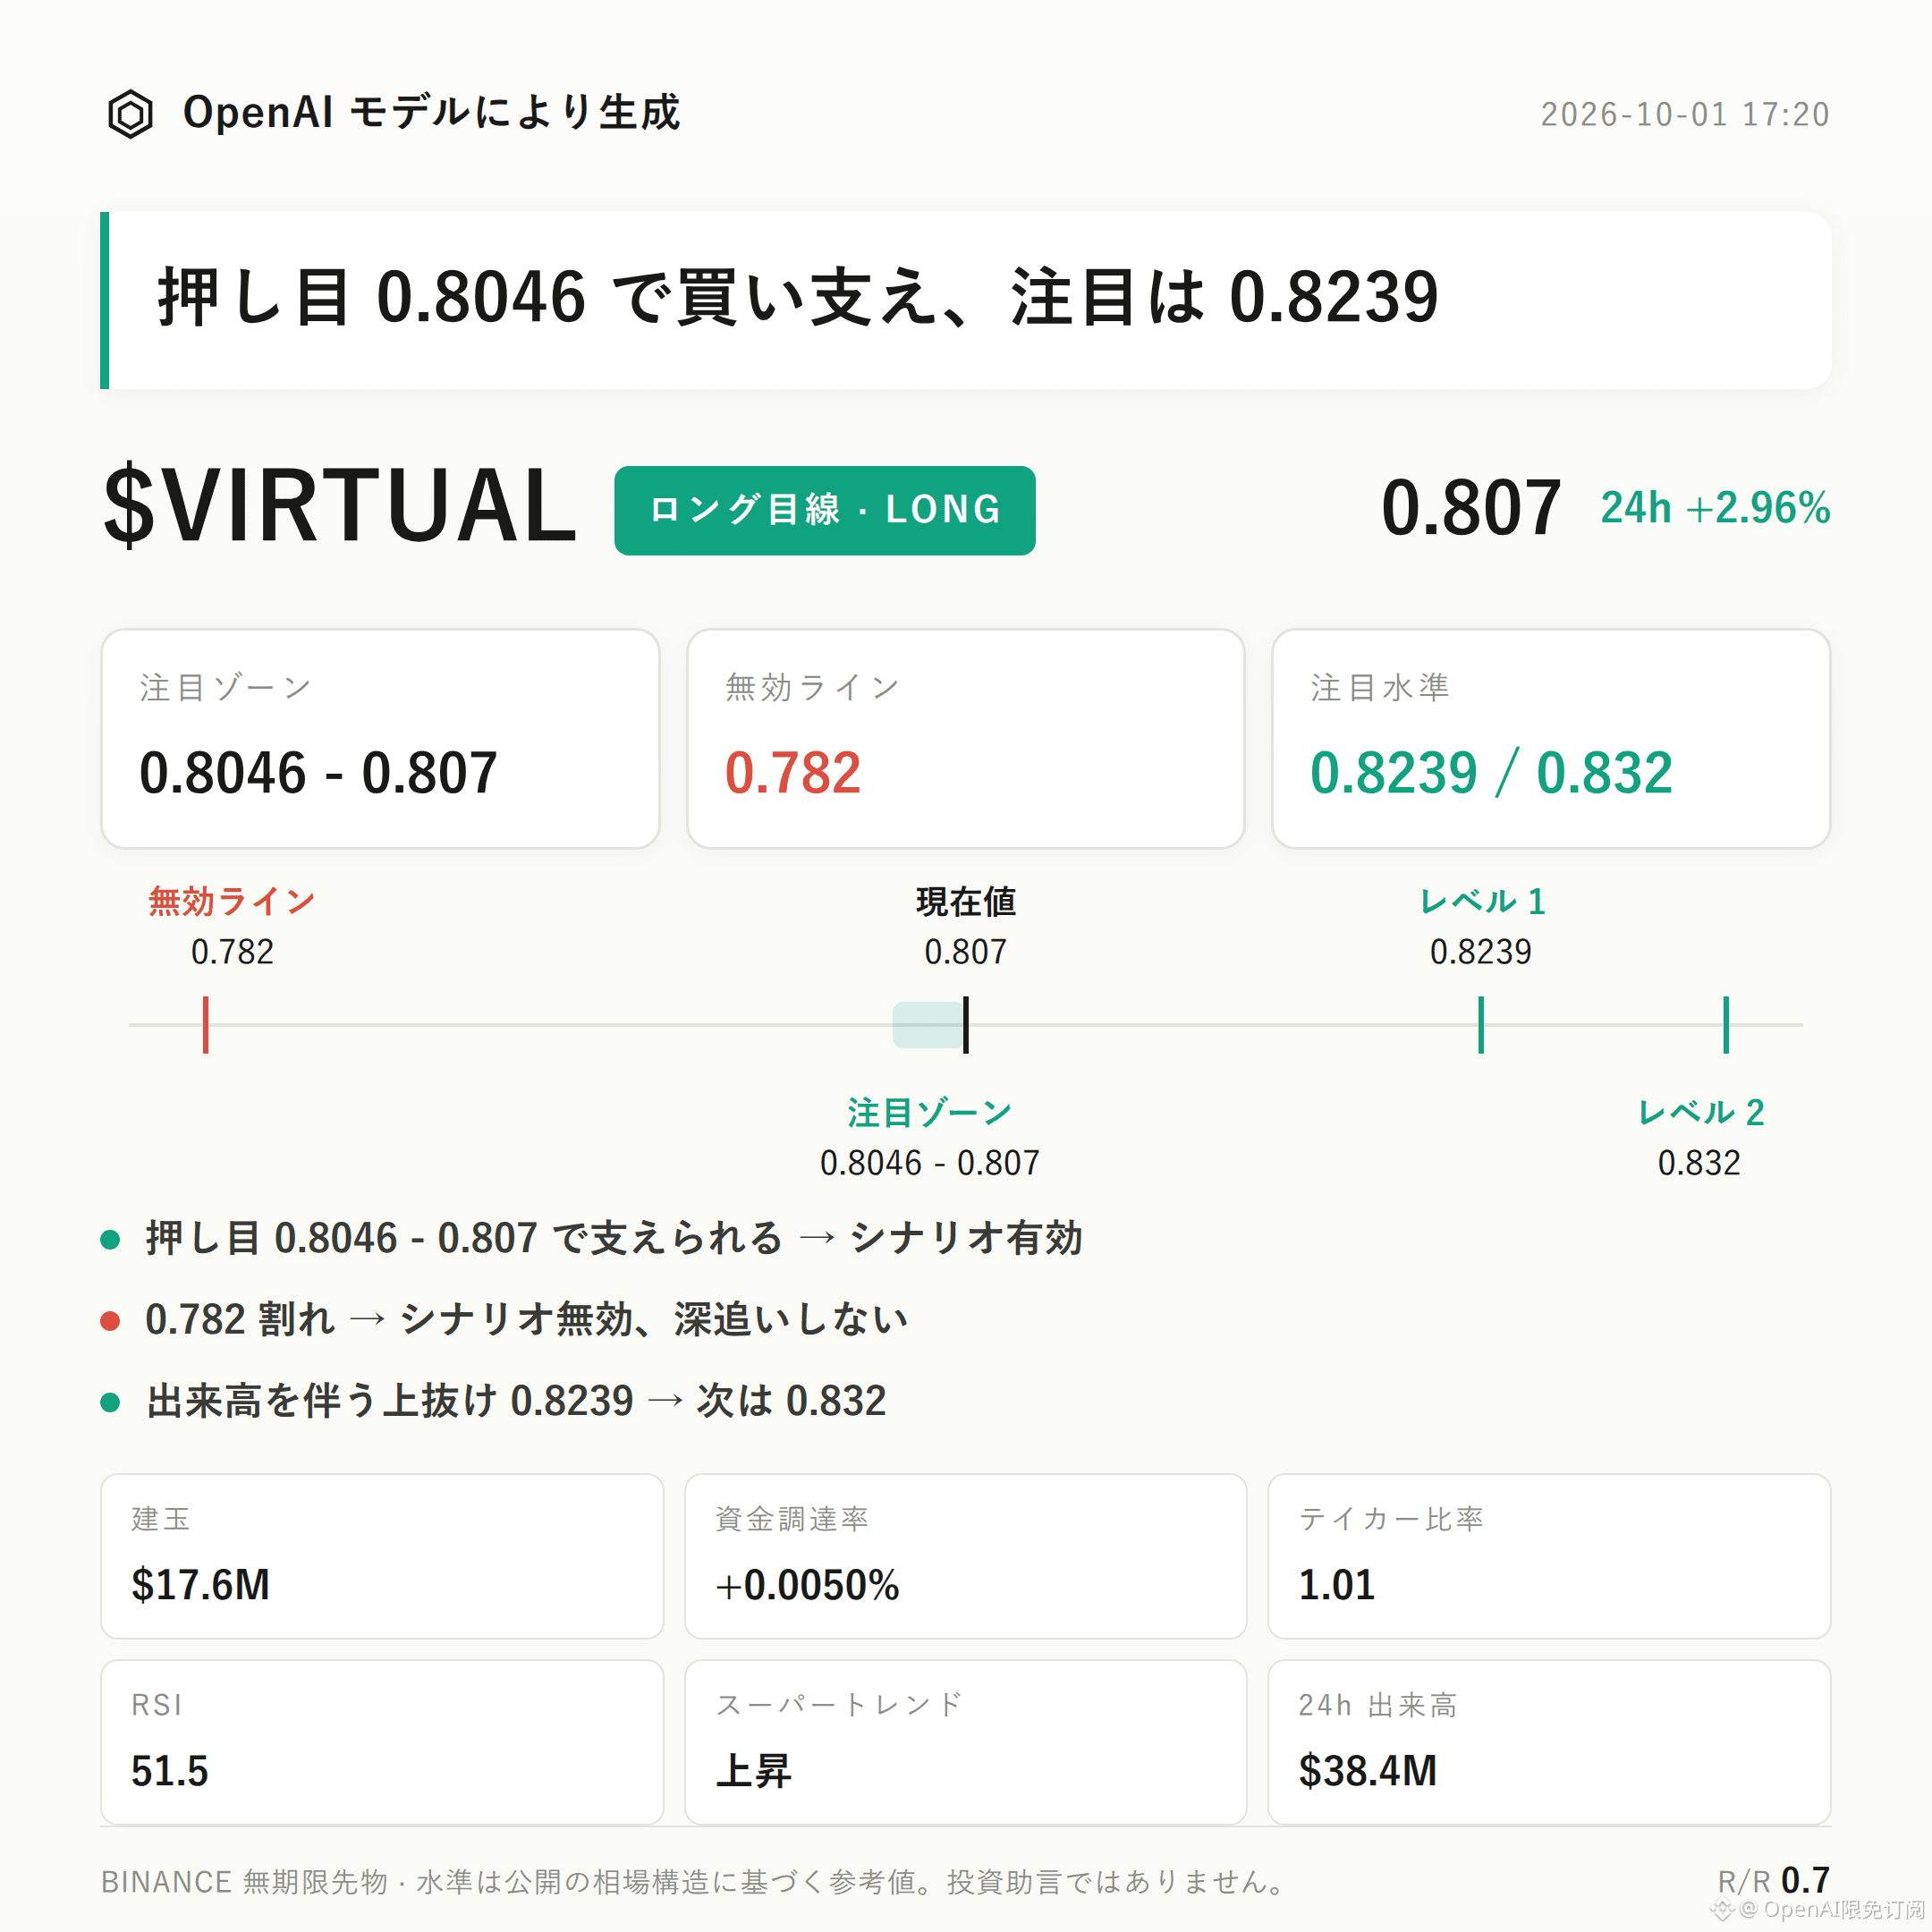
7
·
--
Trading Outlook|10/1 16:20
$ALGO Long-biased Outlook|Focus Zone: 0.1257 - 0.12631|Invalidation Reference: 0.12231|Observation Levels: 0.1294 / 0.13061
$ALGO ’s current long-biased structure is unfolding.
The Super Trend remains upward; the MACD continues to carry bullish momentum, with a 24-hour gain of +2.59%.
The key is whether buyers in the long focus zone can continue to absorb.
Current price is 0.12631, trading above the Bollinger Band midline at 0.1257; the upper band is at 0.1294.
Recent low is 0.12231, recent high is 0.13061. RSI is 50.3, currently in a healthy range.
As long as absorption near the midline persists, the short-term structure still has conditions to extend upward.
24-hour trading volume is $28.19M; open interest is $12.94M. The 24-hour change is +0.5%. While price is rising, open interest is increasing moderately.
Funding rate is +0.0077%; long positions account for 60%. Derivatives sentiment is somewhat bullish but not extreme.
However, the buy/sell ratio is only 0.83, indicating that the aggressive order flow has not yet taken the lead—this is the key counter-evidence that must be considered in the long-biased judgment.
For the long focus zone, first watch 0.1257 - 0.12631; it’s more suitable to wait for confirmation after a pullback and rebound.
If absorption appears after the pullback into this focus zone, the long-biased outlook remains valid.
If the price touches and breaks below the invalidation reference 0.12231, it means the current push-up structure is damaged; the long-bias outlook fails—no lingering.
If there is a volume-backed breakout above the observation level 0.1294, then look for resistance near 0.13061.
The reference risk-reward ratio is 0.8, and the match between upside potential and risk is not particularly strong. Be cautious: insufficient aggressive buying may limit the continuation of the breakout.
If volume can’t cooperate, the area from 0.1294 to 0.13061 may turn into a suppression zone.
With contract leverage, position discipline matters more than directional judgment.
For reference only; not investment advice. Contracts involve leverage—trading carries risk.
This article was generated with assistance from an OpenAI model.
$ALGO #Contract Analysis
Trading Outlook|10/1 16:20
$ALGO Long-biased Outlook|Focus Zone: 0.1257 - 0.12631|Invalidation Reference: 0.12231|Observation Levels: 0.1294 / 0.13061
$ALGO ’s current long-biased structure is unfolding.
The Super Trend remains upward; the MACD continues to carry bullish momentum, with a 24-hour gain of +2.59%.
The key is whether buyers in the long focus zone can continue to absorb.
Current price is 0.12631, trading above the Bollinger Band midline at 0.1257; the upper band is at 0.1294.
Recent low is 0.12231, recent high is 0.13061. RSI is 50.3, currently in a healthy range.
As long as absorption near the midline persists, the short-term structure still has conditions to extend upward.
24-hour trading volume is $28.19M; open interest is $12.94M. The 24-hour change is +0.5%. While price is rising, open interest is increasing moderately.
Funding rate is +0.0077%; long positions account for 60%. Derivatives sentiment is somewhat bullish but not extreme.
However, the buy/sell ratio is only 0.83, indicating that the aggressive order flow has not yet taken the lead—this is the key counter-evidence that must be considered in the long-biased judgment.
For the long focus zone, first watch 0.1257 - 0.12631; it’s more suitable to wait for confirmation after a pullback and rebound.
If absorption appears after the pullback into this focus zone, the long-biased outlook remains valid.
If the price touches and breaks below the invalidation reference 0.12231, it means the current push-up structure is damaged; the long-bias outlook fails—no lingering.
If there is a volume-backed breakout above the observation level 0.1294, then look for resistance near 0.13061.
The reference risk-reward ratio is 0.8, and the match between upside potential and risk is not particularly strong. Be cautious: insufficient aggressive buying may limit the continuation of the breakout.
If volume can’t cooperate, the area from 0.1294 to 0.13061 may turn into a suppression zone.
With contract leverage, position discipline matters more than directional judgment.
For reference only; not investment advice. Contracts involve leverage—trading carries risk.
This article was generated with assistance from an OpenAI model.
$ALGO #Contract Analysis
$ALGO Long-biased Outlook|Focus Zone: 0.1257 - 0.12631|Invalidation Reference: 0.12231|Observation Levels: 0.1294 / 0.13061
$ALGO ’s current long-biased structure is unfolding.
The Super Trend remains upward; the MACD continues to carry bullish momentum, with a 24-hour gain of +2.59%.
The key is whether buyers in the long focus zone can continue to absorb.
Current price is 0.12631, trading above the Bollinger Band midline at 0.1257; the upper band is at 0.1294.
Recent low is 0.12231, recent high is 0.13061. RSI is 50.3, currently in a healthy range.
As long as absorption near the midline persists, the short-term structure still has conditions to extend upward.
24-hour trading volume is $28.19M; open interest is $12.94M. The 24-hour change is +0.5%. While price is rising, open interest is increasing moderately.
Funding rate is +0.0077%; long positions account for 60%. Derivatives sentiment is somewhat bullish but not extreme.
However, the buy/sell ratio is only 0.83, indicating that the aggressive order flow has not yet taken the lead—this is the key counter-evidence that must be considered in the long-biased judgment.
For the long focus zone, first watch 0.1257 - 0.12631; it’s more suitable to wait for confirmation after a pullback and rebound.
If absorption appears after the pullback into this focus zone, the long-biased outlook remains valid.
If the price touches and breaks below the invalidation reference 0.12231, it means the current push-up structure is damaged; the long-bias outlook fails—no lingering.
If there is a volume-backed breakout above the observation level 0.1294, then look for resistance near 0.13061.
The reference risk-reward ratio is 0.8, and the match between upside potential and risk is not particularly strong. Be cautious: insufficient aggressive buying may limit the continuation of the breakout.
If volume can’t cooperate, the area from 0.1294 to 0.13061 may turn into a suppression zone.
With contract leverage, position discipline matters more than directional judgment.
For reference only; not investment advice. Contracts involve leverage—trading carries risk.
This article was generated with assistance from an OpenAI model.
$ALGO #Contract Analysis
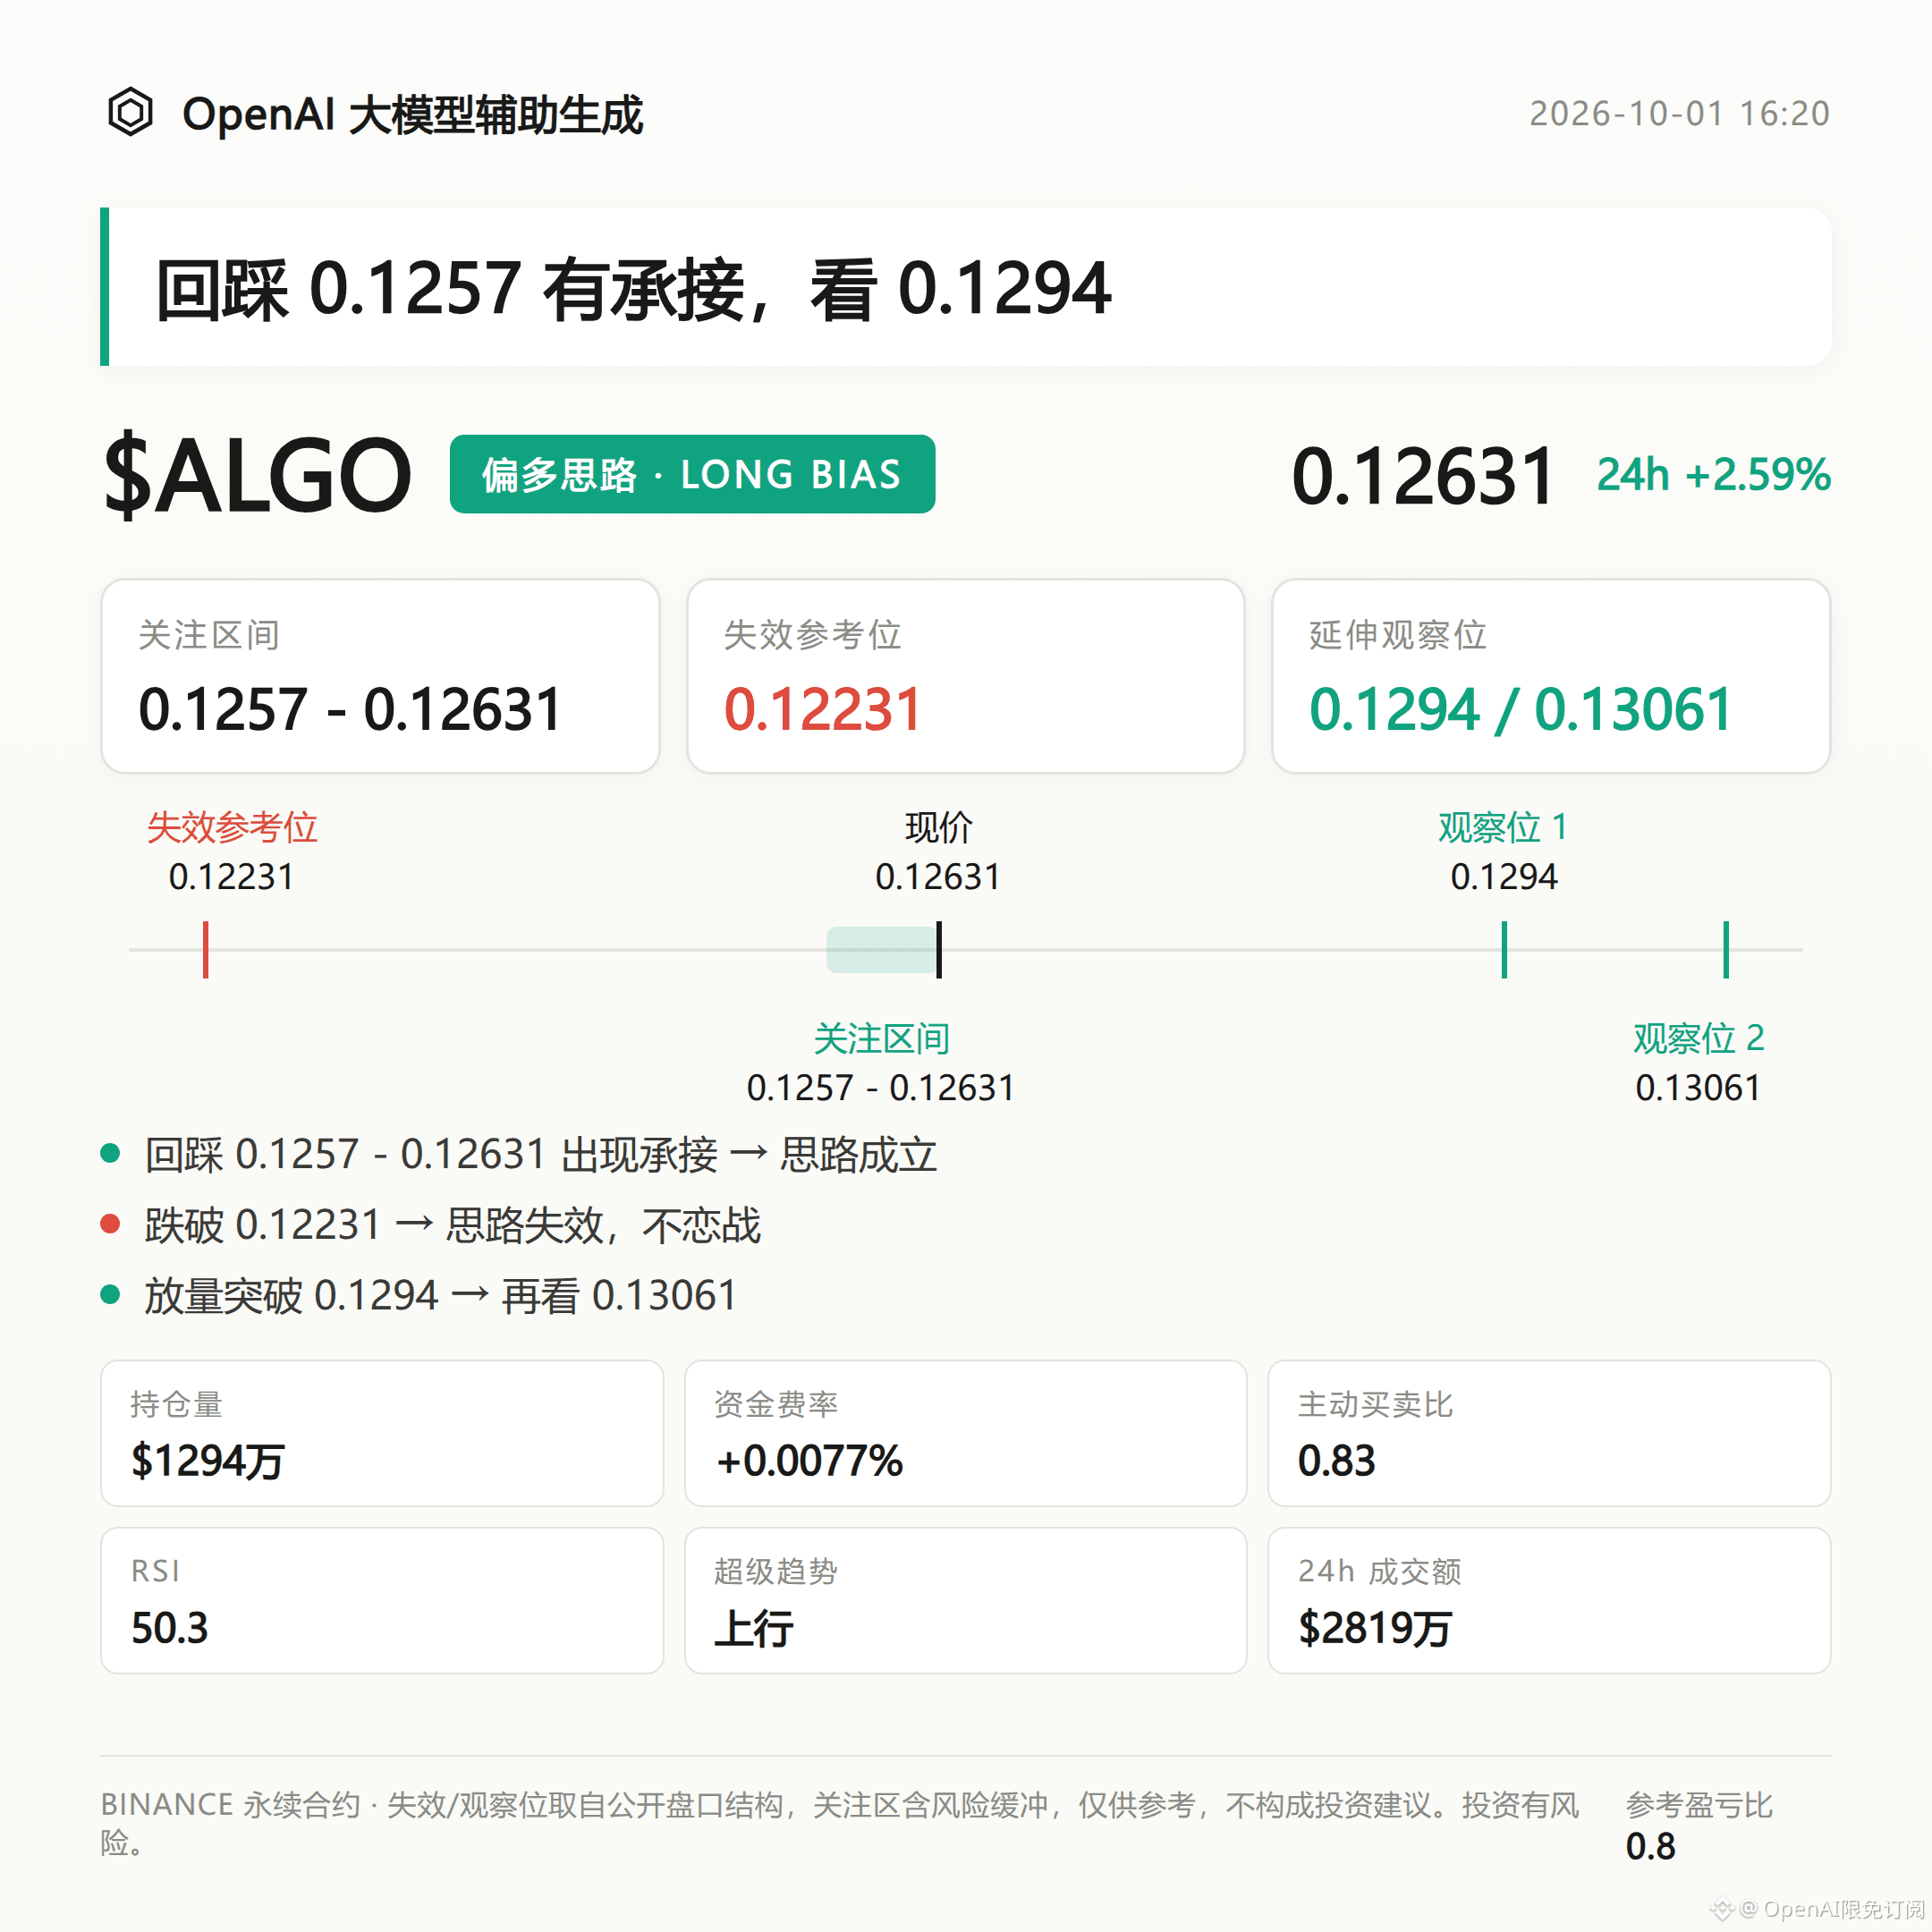
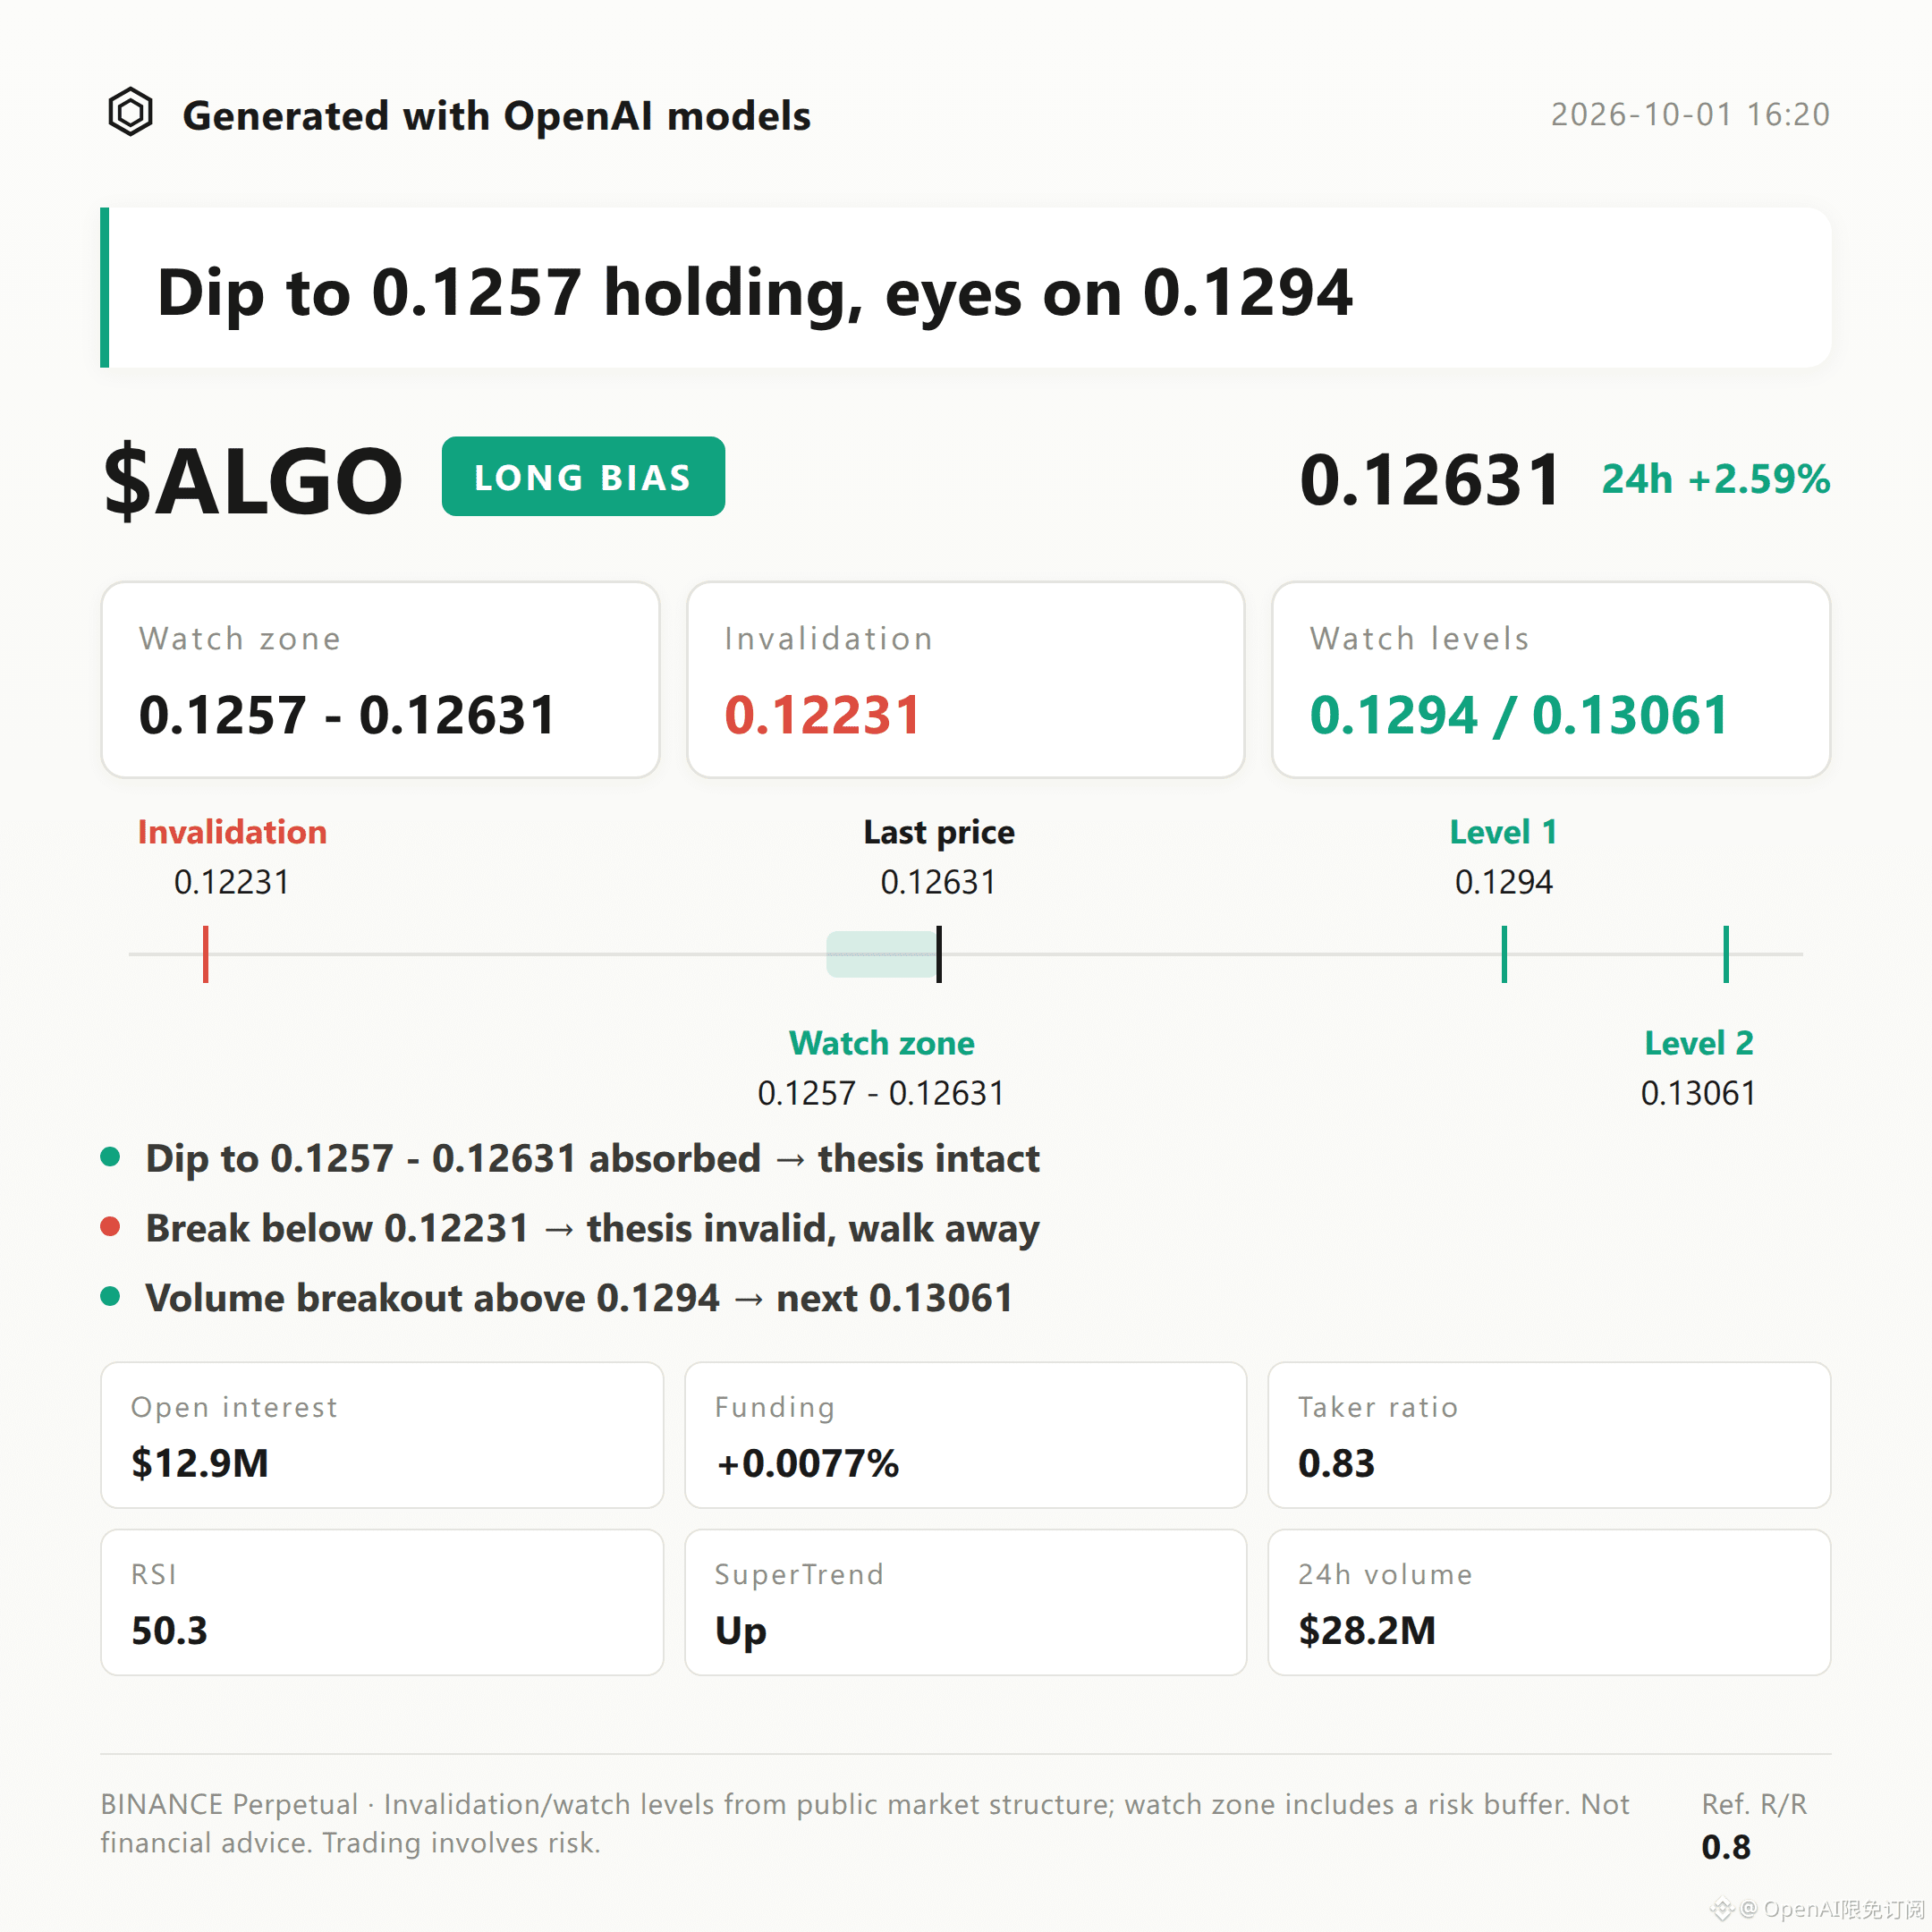
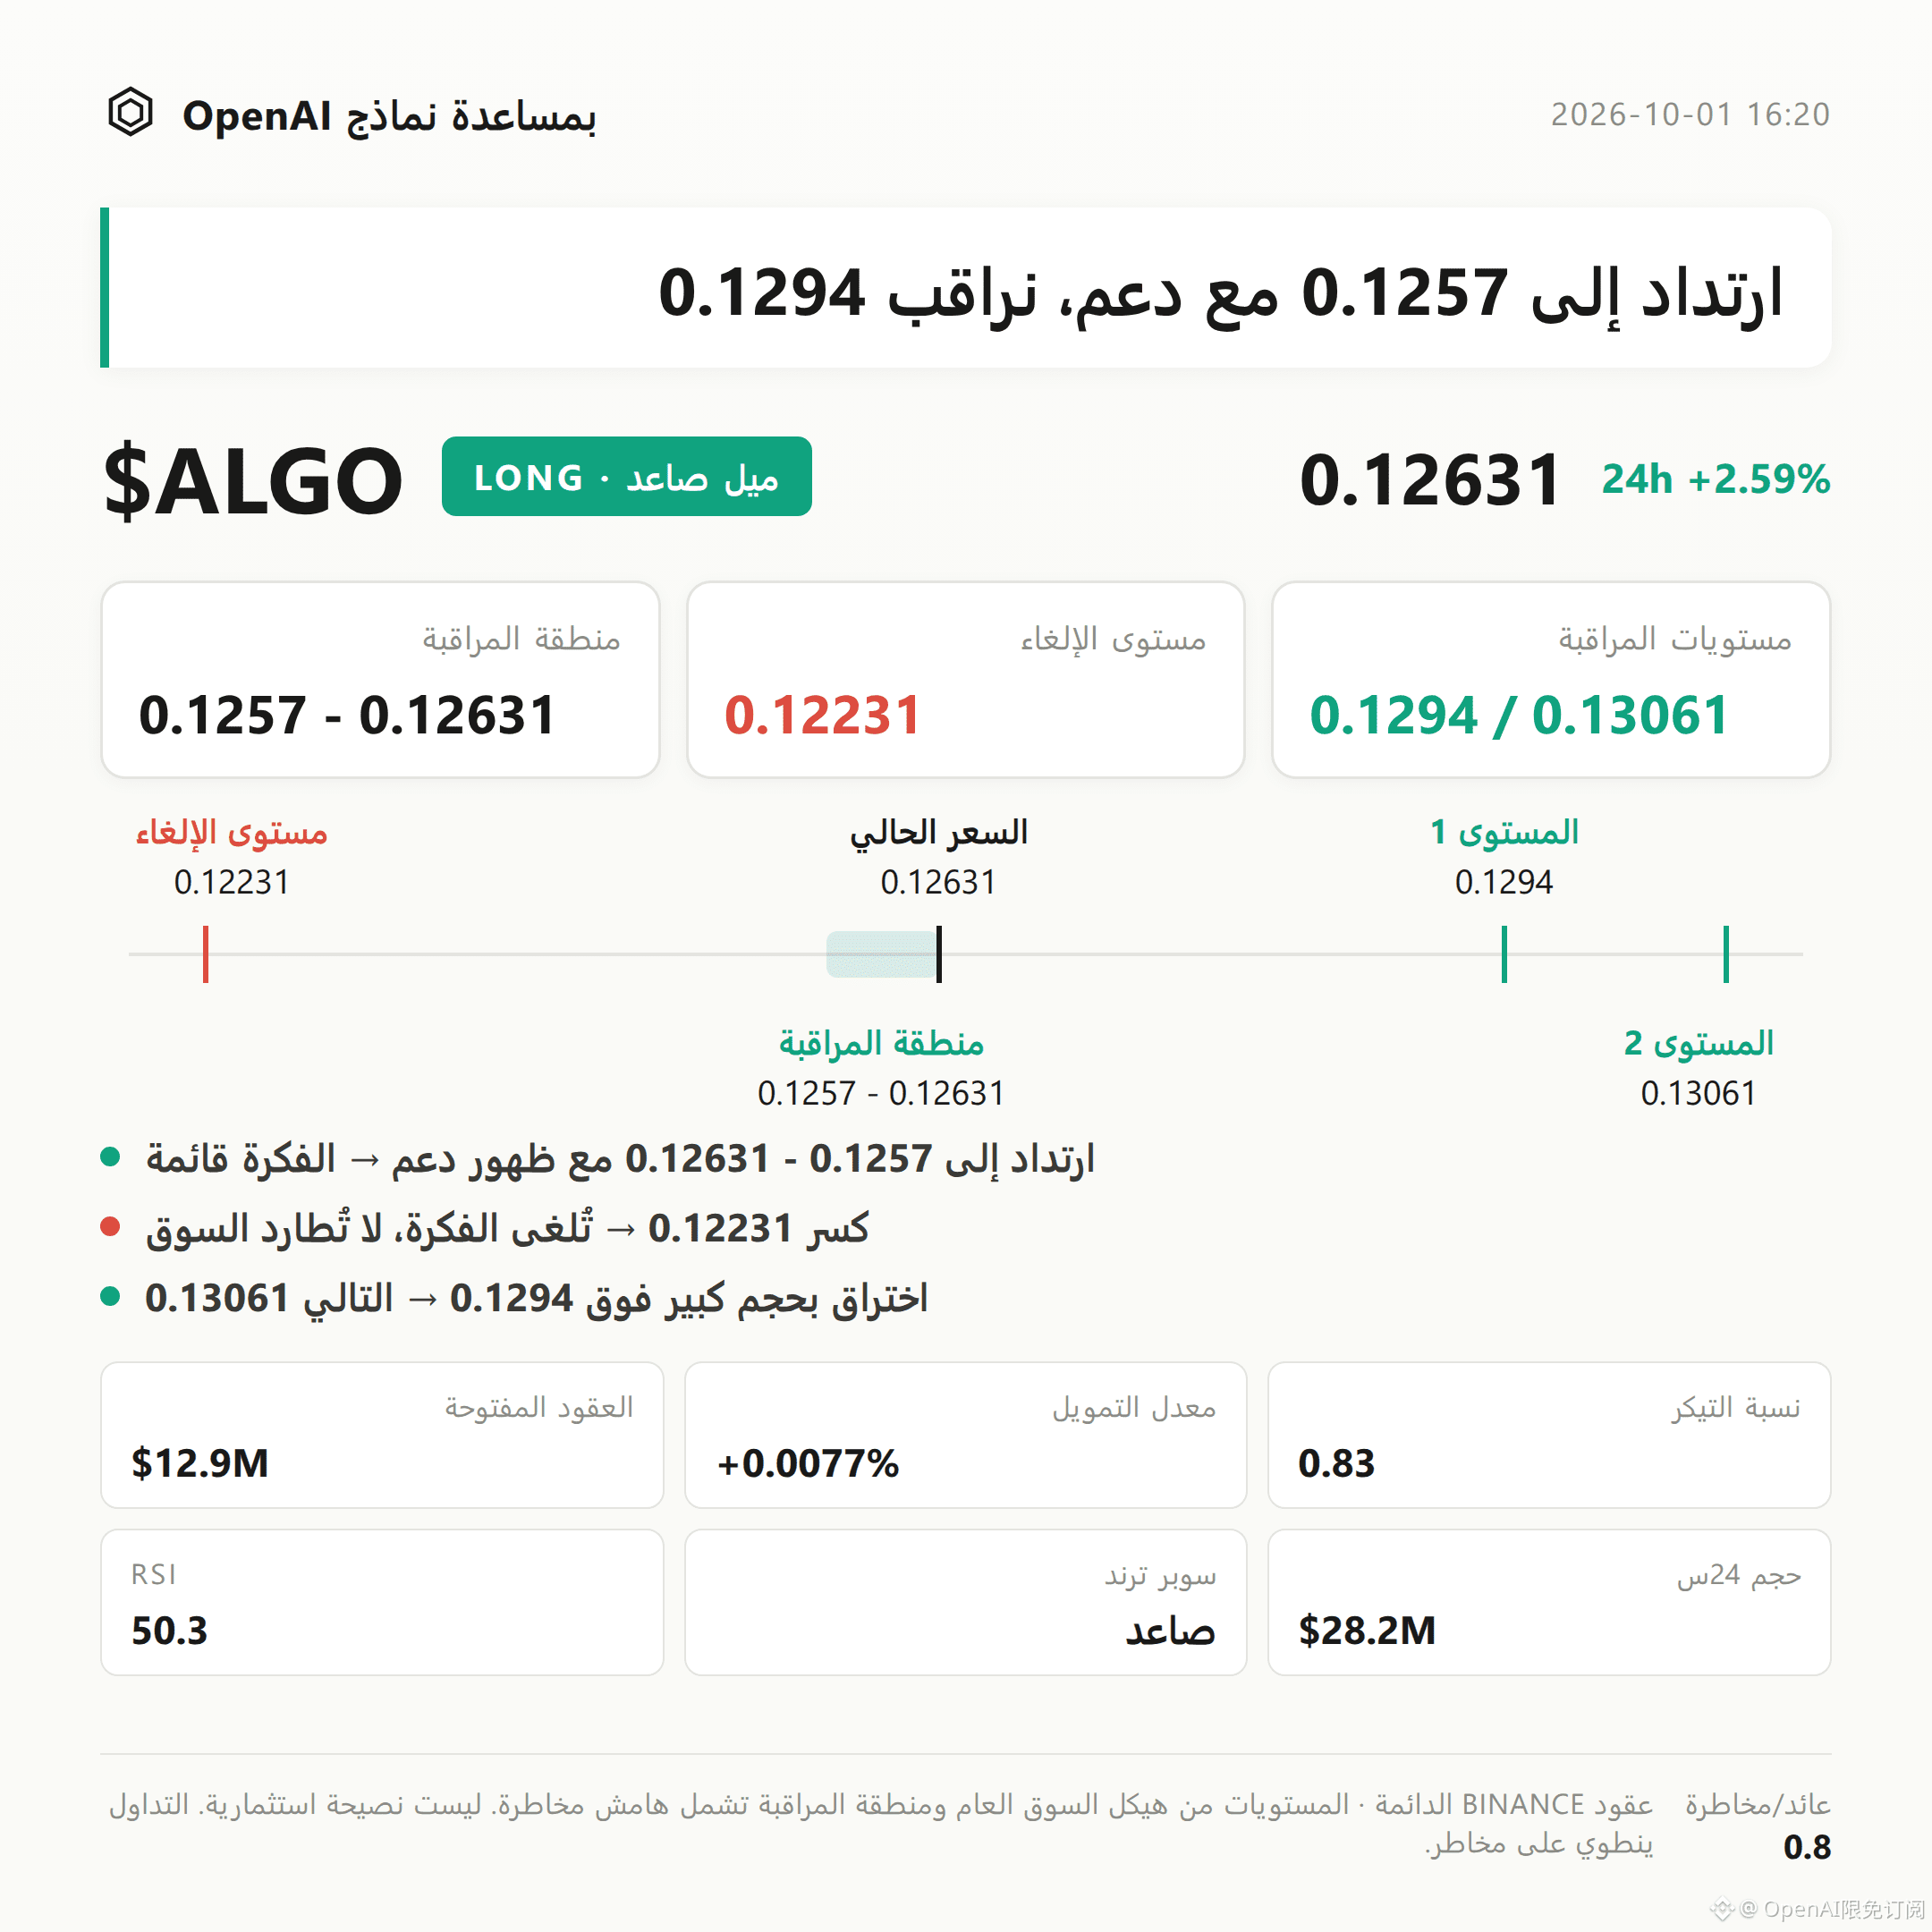
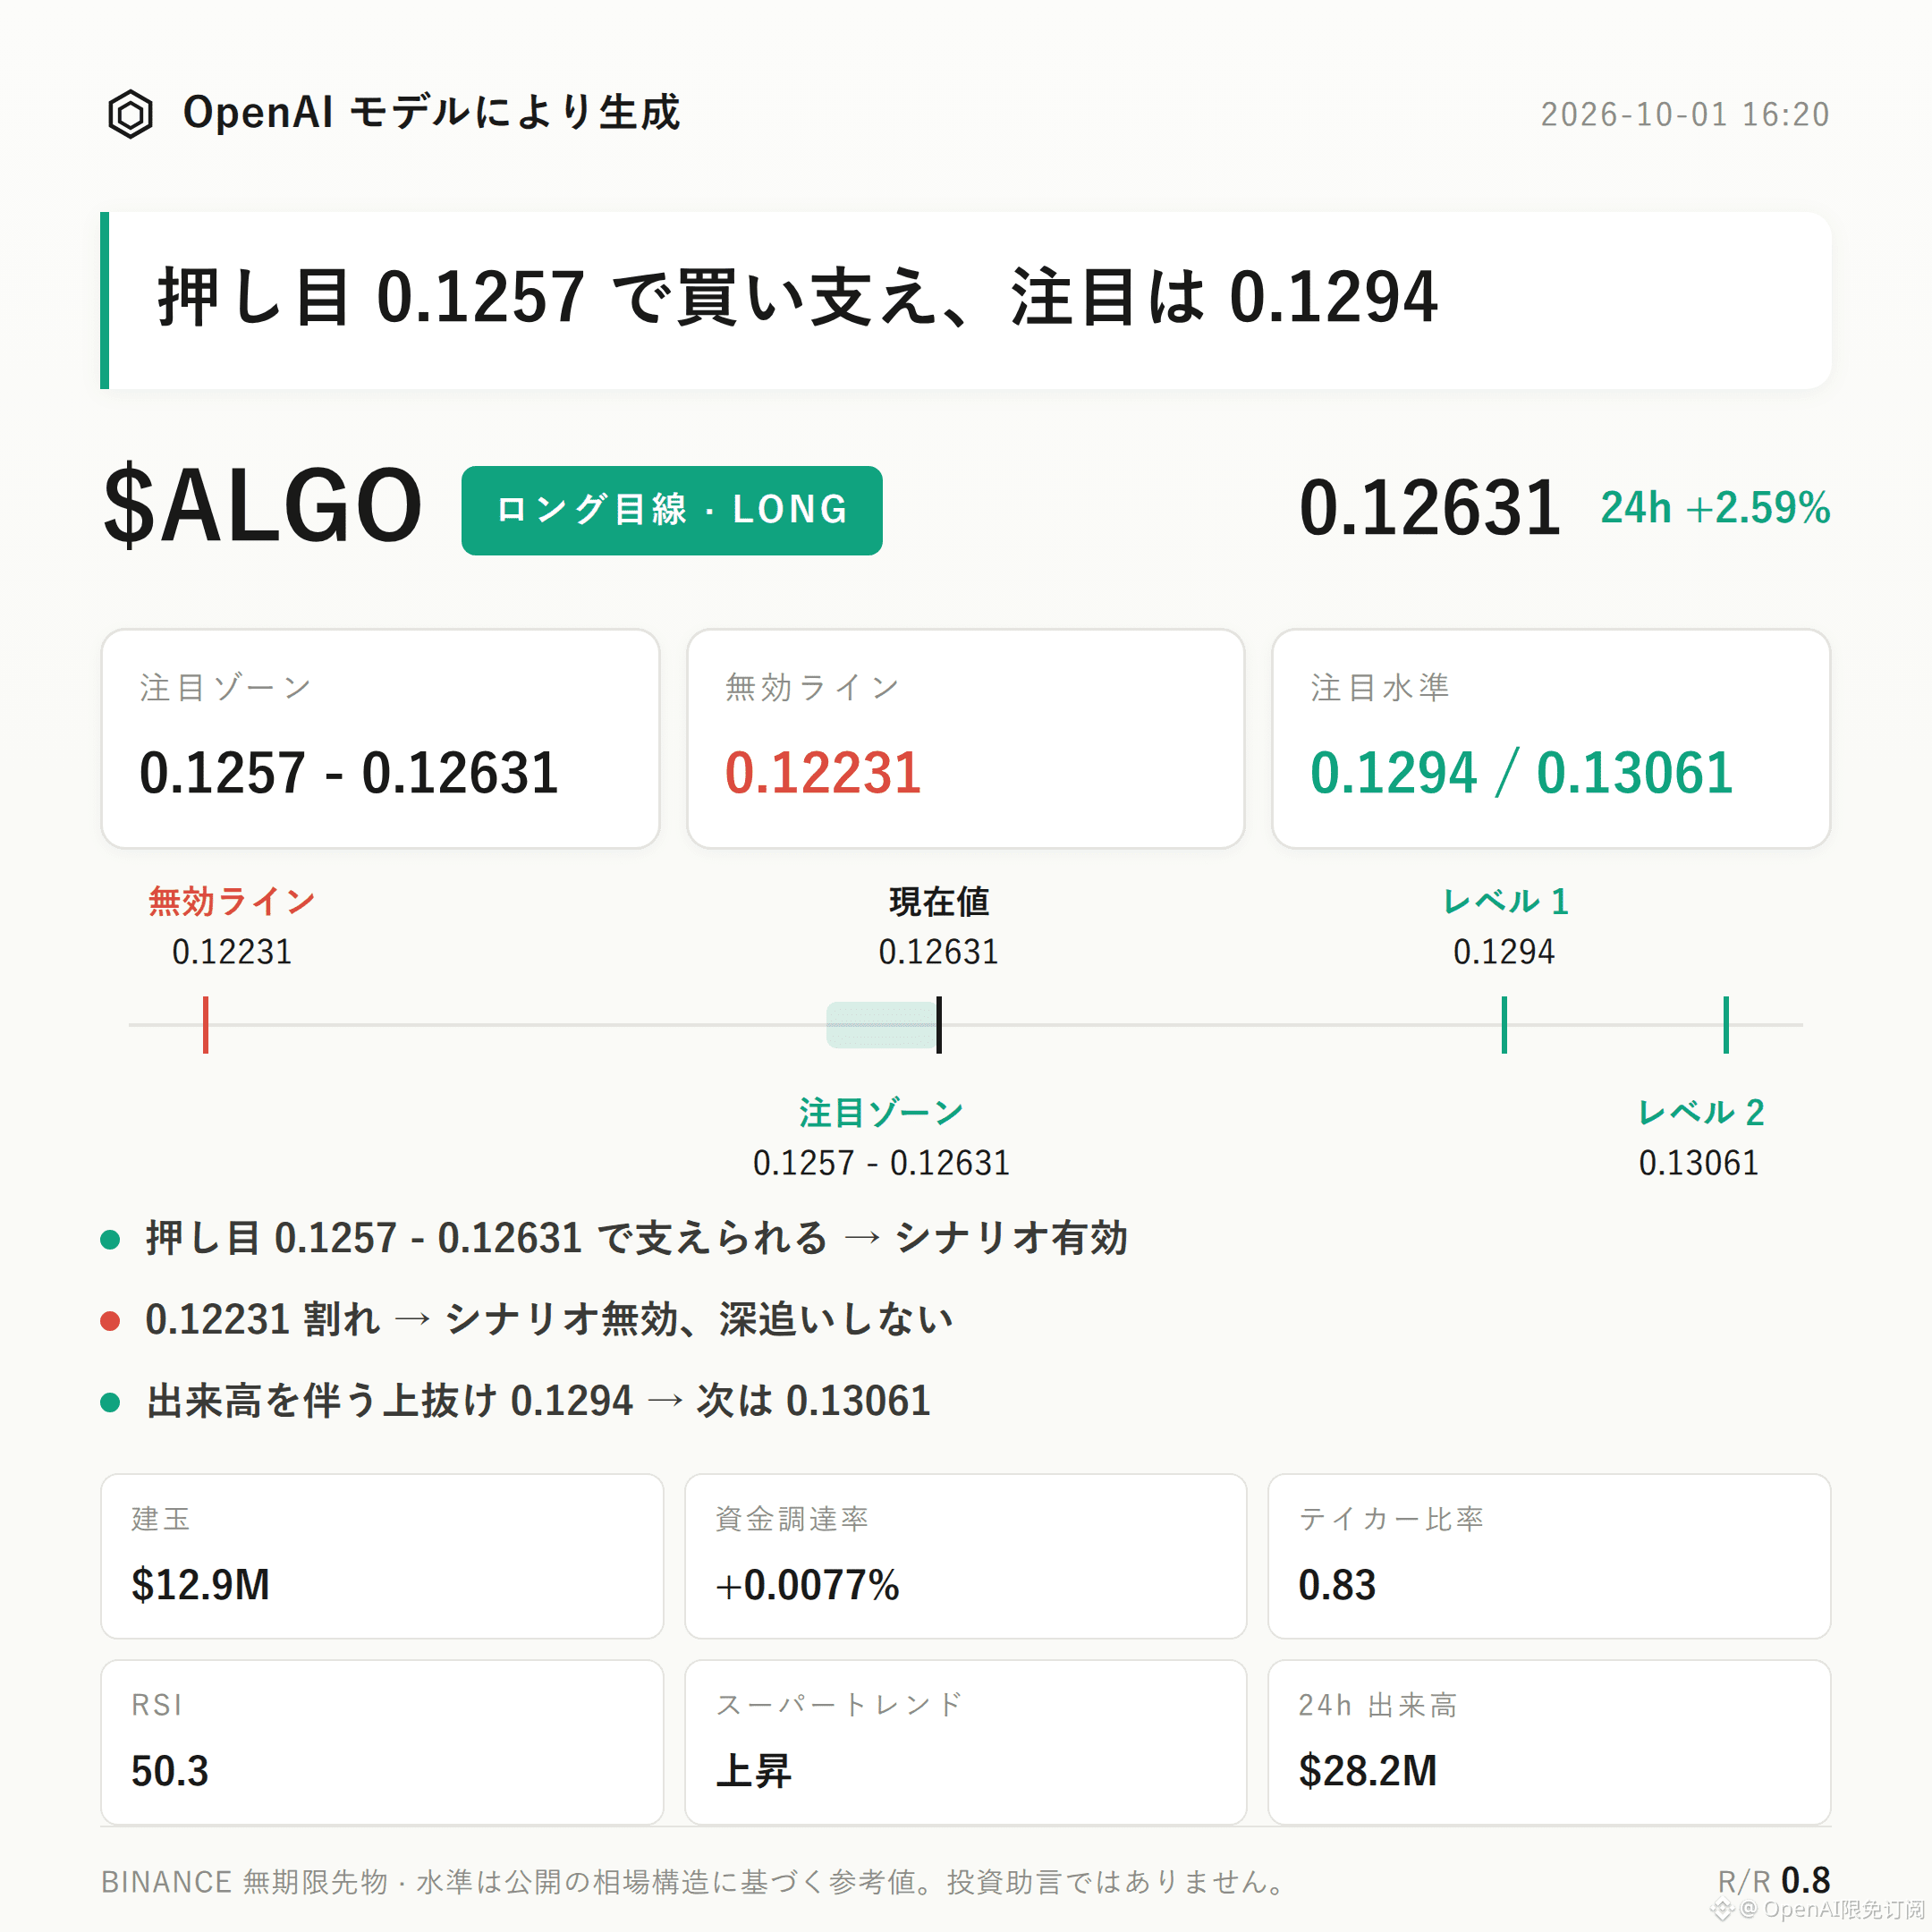
7
·
--
Trading Outlook|10/1 15:20
$REZ Bias: Bullish | Watch Zone 0.0046 - 0.004619 | Invalidation Reference 0.004308 | Key Observation Levels 0.0049 / 0.004957
$REZ The current bullish structure is in progress.
On the Supertrend, the trend is up; MACD maintains bullish momentum, with a +6.65% gain over the past 24h.
The key is to see whether the long side can continue to hold within the bullish watch zone.
Recently, price has been trading in the range 0.004308 to 0.004957, with the current price at 0.004619.
The Bollinger Bands show: lower band 0.0046, mid band 0.0047, upper band 0.0049. Price is currently in a structure-validation area near the lower band.
RSI is 48.8—still not in an overbought state. Supertrend and MACD continue to support a bullish observation bias.
24h trading volume is $19.21M, and open interest is $4.56M. Open interest increased by +2.6% over the past 24h, and during the rise, open interest is expanding in sync.
Funding rate is +0.0050%. Long-account share is 59%. Derivatives sentiment is mildly bullish, but there is no extreme crowding signal yet.
If there is a pullback to 0.0046 - 0.004619 and then acceptance/holding occurs, the bullish outlook remains valid.
If price reaches and breaks below the invalidation reference 0.004308, it means the current push-up structure has been damaged, and the bullish outlook is invalid—no fighting the market.
If there is a breakout with volume above 0.0049, then watch the resistance near 0.004957 more closely.
The contrarian evidence is that the buy/sell ratio is only 0.56, suggesting that buyers are not yet in control. Price rising and open-interest expansion still require active buyer confirmation.
The reference risk-reward ratio is 0.9, so the upside vs. risk is not standout. More importantly, wait for conditions to trigger rather than relying only on direction.
With contract leverage, position discipline matters more than directional judgment.
For reference only and does not constitute investment advice. Contracts have leverage—investing involves risk.
This article was generated with assistance from an OpenAI large model.
$REZ #Contract Analysis
Trading Outlook|10/1 15:20
$REZ Bias: Bullish | Watch Zone 0.0046 - 0.004619 | Invalidation Reference 0.004308 | Key Observation Levels 0.0049 / 0.004957
$REZ The current bullish structure is in progress.
On the Supertrend, the trend is up; MACD maintains bullish momentum, with a +6.65% gain over the past 24h.
The key is to see whether the long side can continue to hold within the bullish watch zone.
Recently, price has been trading in the range 0.004308 to 0.004957, with the current price at 0.004619.
The Bollinger Bands show: lower band 0.0046, mid band 0.0047, upper band 0.0049. Price is currently in a structure-validation area near the lower band.
RSI is 48.8—still not in an overbought state. Supertrend and MACD continue to support a bullish observation bias.
24h trading volume is $19.21M, and open interest is $4.56M. Open interest increased by +2.6% over the past 24h, and during the rise, open interest is expanding in sync.
Funding rate is +0.0050%. Long-account share is 59%. Derivatives sentiment is mildly bullish, but there is no extreme crowding signal yet.
If there is a pullback to 0.0046 - 0.004619 and then acceptance/holding occurs, the bullish outlook remains valid.
If price reaches and breaks below the invalidation reference 0.004308, it means the current push-up structure has been damaged, and the bullish outlook is invalid—no fighting the market.
If there is a breakout with volume above 0.0049, then watch the resistance near 0.004957 more closely.
The contrarian evidence is that the buy/sell ratio is only 0.56, suggesting that buyers are not yet in control. Price rising and open-interest expansion still require active buyer confirmation.
The reference risk-reward ratio is 0.9, so the upside vs. risk is not standout. More importantly, wait for conditions to trigger rather than relying only on direction.
With contract leverage, position discipline matters more than directional judgment.
For reference only and does not constitute investment advice. Contracts have leverage—investing involves risk.
This article was generated with assistance from an OpenAI large model.
$REZ #Contract Analysis
$REZ Bias: Bullish | Watch Zone 0.0046 - 0.004619 | Invalidation Reference 0.004308 | Key Observation Levels 0.0049 / 0.004957
$REZ The current bullish structure is in progress.
On the Supertrend, the trend is up; MACD maintains bullish momentum, with a +6.65% gain over the past 24h.
The key is to see whether the long side can continue to hold within the bullish watch zone.
Recently, price has been trading in the range 0.004308 to 0.004957, with the current price at 0.004619.
The Bollinger Bands show: lower band 0.0046, mid band 0.0047, upper band 0.0049. Price is currently in a structure-validation area near the lower band.
RSI is 48.8—still not in an overbought state. Supertrend and MACD continue to support a bullish observation bias.
24h trading volume is $19.21M, and open interest is $4.56M. Open interest increased by +2.6% over the past 24h, and during the rise, open interest is expanding in sync.
Funding rate is +0.0050%. Long-account share is 59%. Derivatives sentiment is mildly bullish, but there is no extreme crowding signal yet.
If there is a pullback to 0.0046 - 0.004619 and then acceptance/holding occurs, the bullish outlook remains valid.
If price reaches and breaks below the invalidation reference 0.004308, it means the current push-up structure has been damaged, and the bullish outlook is invalid—no fighting the market.
If there is a breakout with volume above 0.0049, then watch the resistance near 0.004957 more closely.
The contrarian evidence is that the buy/sell ratio is only 0.56, suggesting that buyers are not yet in control. Price rising and open-interest expansion still require active buyer confirmation.
The reference risk-reward ratio is 0.9, so the upside vs. risk is not standout. More importantly, wait for conditions to trigger rather than relying only on direction.
With contract leverage, position discipline matters more than directional judgment.
For reference only and does not constitute investment advice. Contracts have leverage—investing involves risk.
This article was generated with assistance from an OpenAI large model.
$REZ #Contract Analysis
4
·
--
Trading Outlook | 10/1 14:21
$ETHFI Bearish Bias | Watch Range 0.7796 - 0.7931 | Invalidation Reference 0.8164 | Observation Levels 0.7574 / 0.7477
The current bearish structure for $ETHFI is unfolding.
The buy/sell ratio is only 0.74, open interest is down 0.3%, and the long account share is at 65%—after a crowding of longs, there is downside pullback pressure in the short term.
The key is whether the rebound can be held down within the pressure zone.
Current price is 0.7796, above the Bollinger mid-band at 0.7752, but still relatively close to the upper band at 0.7931, so upside room faces a pressure test.
Be honest: the Super Trend is still pointing upward, RSI is 54.4, and MACD maintains bullish momentum. The technical structure has not yet formed a full reversal to bearish, so any bearish conclusion must wait for price confirmation.
In the last 24 hours, trading volume was $44.97 million, and price rose 2.34%, but open interest fell to $27.61 million and decreased by 0.3%. The rise did not come with new position accumulation.
Funding rate is positive at 0.0050%, long account share is 65%, and the buy/sell ratio of 0.74 indicates selling pressure dominates. This divergence further supports observing the pressure and selling behavior after the rebound.
For the short side, focus on the watch range 0.7796 - 0.7931 first; it’s more suitable to wait for confirmation after a rebound meets resistance.
If price pulls back into the watch range and shows acceptance/support, then the bearish observation idea holds—but you still need to verify whether the acceptance weakens and turns.
If it touches and reclaims the invalidation reference level at 0.8164, it would mean the current pullback structure is broken; the bearish thesis would be invalidated—no stubbornness.
For further downside observation levels, watch 0.7574. If it breaks down on increased volume, then look toward support around 0.7477.
At the moment there are no clear downside signals. However, with the Super Trend still rising, RSI at 54.4, and MACD holding bullish momentum, this is still the bearish framework evidence you cannot ignore.
The reference risk-reward ratio is only 0.6, so the tolerance is limited, and the contract leverage itself also amplifies volatility risk.
With contract leverage, position discipline matters more than direction judgment.
For reference only and does not constitute investment advice. Leverage in contracts means there are risks in investing.
This article was generated with the assistance of an OpenAI large model.
$ETHFI #Contract Analysis
Trading Outlook | 10/1 14:21
$ETHFI Bearish Bias | Watch Range 0.7796 - 0.7931 | Invalidation Reference 0.8164 | Observation Levels 0.7574 / 0.7477
The current bearish structure for $ETHFI is unfolding.
The buy/sell ratio is only 0.74, open interest is down 0.3%, and the long account share is at 65%—after a crowding of longs, there is downside pullback pressure in the short term.
The key is whether the rebound can be held down within the pressure zone.
Current price is 0.7796, above the Bollinger mid-band at 0.7752, but still relatively close to the upper band at 0.7931, so upside room faces a pressure test.
Be honest: the Super Trend is still pointing upward, RSI is 54.4, and MACD maintains bullish momentum. The technical structure has not yet formed a full reversal to bearish, so any bearish conclusion must wait for price confirmation.
In the last 24 hours, trading volume was $44.97 million, and price rose 2.34%, but open interest fell to $27.61 million and decreased by 0.3%. The rise did not come with new position accumulation.
Funding rate is positive at 0.0050%, long account share is 65%, and the buy/sell ratio of 0.74 indicates selling pressure dominates. This divergence further supports observing the pressure and selling behavior after the rebound.
For the short side, focus on the watch range 0.7796 - 0.7931 first; it’s more suitable to wait for confirmation after a rebound meets resistance.
If price pulls back into the watch range and shows acceptance/support, then the bearish observation idea holds—but you still need to verify whether the acceptance weakens and turns.
If it touches and reclaims the invalidation reference level at 0.8164, it would mean the current pullback structure is broken; the bearish thesis would be invalidated—no stubbornness.
For further downside observation levels, watch 0.7574. If it breaks down on increased volume, then look toward support around 0.7477.
At the moment there are no clear downside signals. However, with the Super Trend still rising, RSI at 54.4, and MACD holding bullish momentum, this is still the bearish framework evidence you cannot ignore.
The reference risk-reward ratio is only 0.6, so the tolerance is limited, and the contract leverage itself also amplifies volatility risk.
With contract leverage, position discipline matters more than direction judgment.
For reference only and does not constitute investment advice. Leverage in contracts means there are risks in investing.
This article was generated with the assistance of an OpenAI large model.
$ETHFI #Contract Analysis
$ETHFI Bearish Bias | Watch Range 0.7796 - 0.7931 | Invalidation Reference 0.8164 | Observation Levels 0.7574 / 0.7477
The current bearish structure for $ETHFI is unfolding.
The buy/sell ratio is only 0.74, open interest is down 0.3%, and the long account share is at 65%—after a crowding of longs, there is downside pullback pressure in the short term.
The key is whether the rebound can be held down within the pressure zone.
Current price is 0.7796, above the Bollinger mid-band at 0.7752, but still relatively close to the upper band at 0.7931, so upside room faces a pressure test.
Be honest: the Super Trend is still pointing upward, RSI is 54.4, and MACD maintains bullish momentum. The technical structure has not yet formed a full reversal to bearish, so any bearish conclusion must wait for price confirmation.
In the last 24 hours, trading volume was $44.97 million, and price rose 2.34%, but open interest fell to $27.61 million and decreased by 0.3%. The rise did not come with new position accumulation.
Funding rate is positive at 0.0050%, long account share is 65%, and the buy/sell ratio of 0.74 indicates selling pressure dominates. This divergence further supports observing the pressure and selling behavior after the rebound.
For the short side, focus on the watch range 0.7796 - 0.7931 first; it’s more suitable to wait for confirmation after a rebound meets resistance.
If price pulls back into the watch range and shows acceptance/support, then the bearish observation idea holds—but you still need to verify whether the acceptance weakens and turns.
If it touches and reclaims the invalidation reference level at 0.8164, it would mean the current pullback structure is broken; the bearish thesis would be invalidated—no stubbornness.
For further downside observation levels, watch 0.7574. If it breaks down on increased volume, then look toward support around 0.7477.
At the moment there are no clear downside signals. However, with the Super Trend still rising, RSI at 54.4, and MACD holding bullish momentum, this is still the bearish framework evidence you cannot ignore.
The reference risk-reward ratio is only 0.6, so the tolerance is limited, and the contract leverage itself also amplifies volatility risk.
With contract leverage, position discipline matters more than direction judgment.
For reference only and does not constitute investment advice. Leverage in contracts means there are risks in investing.
This article was generated with the assistance of an OpenAI large model.
$ETHFI #Contract Analysis
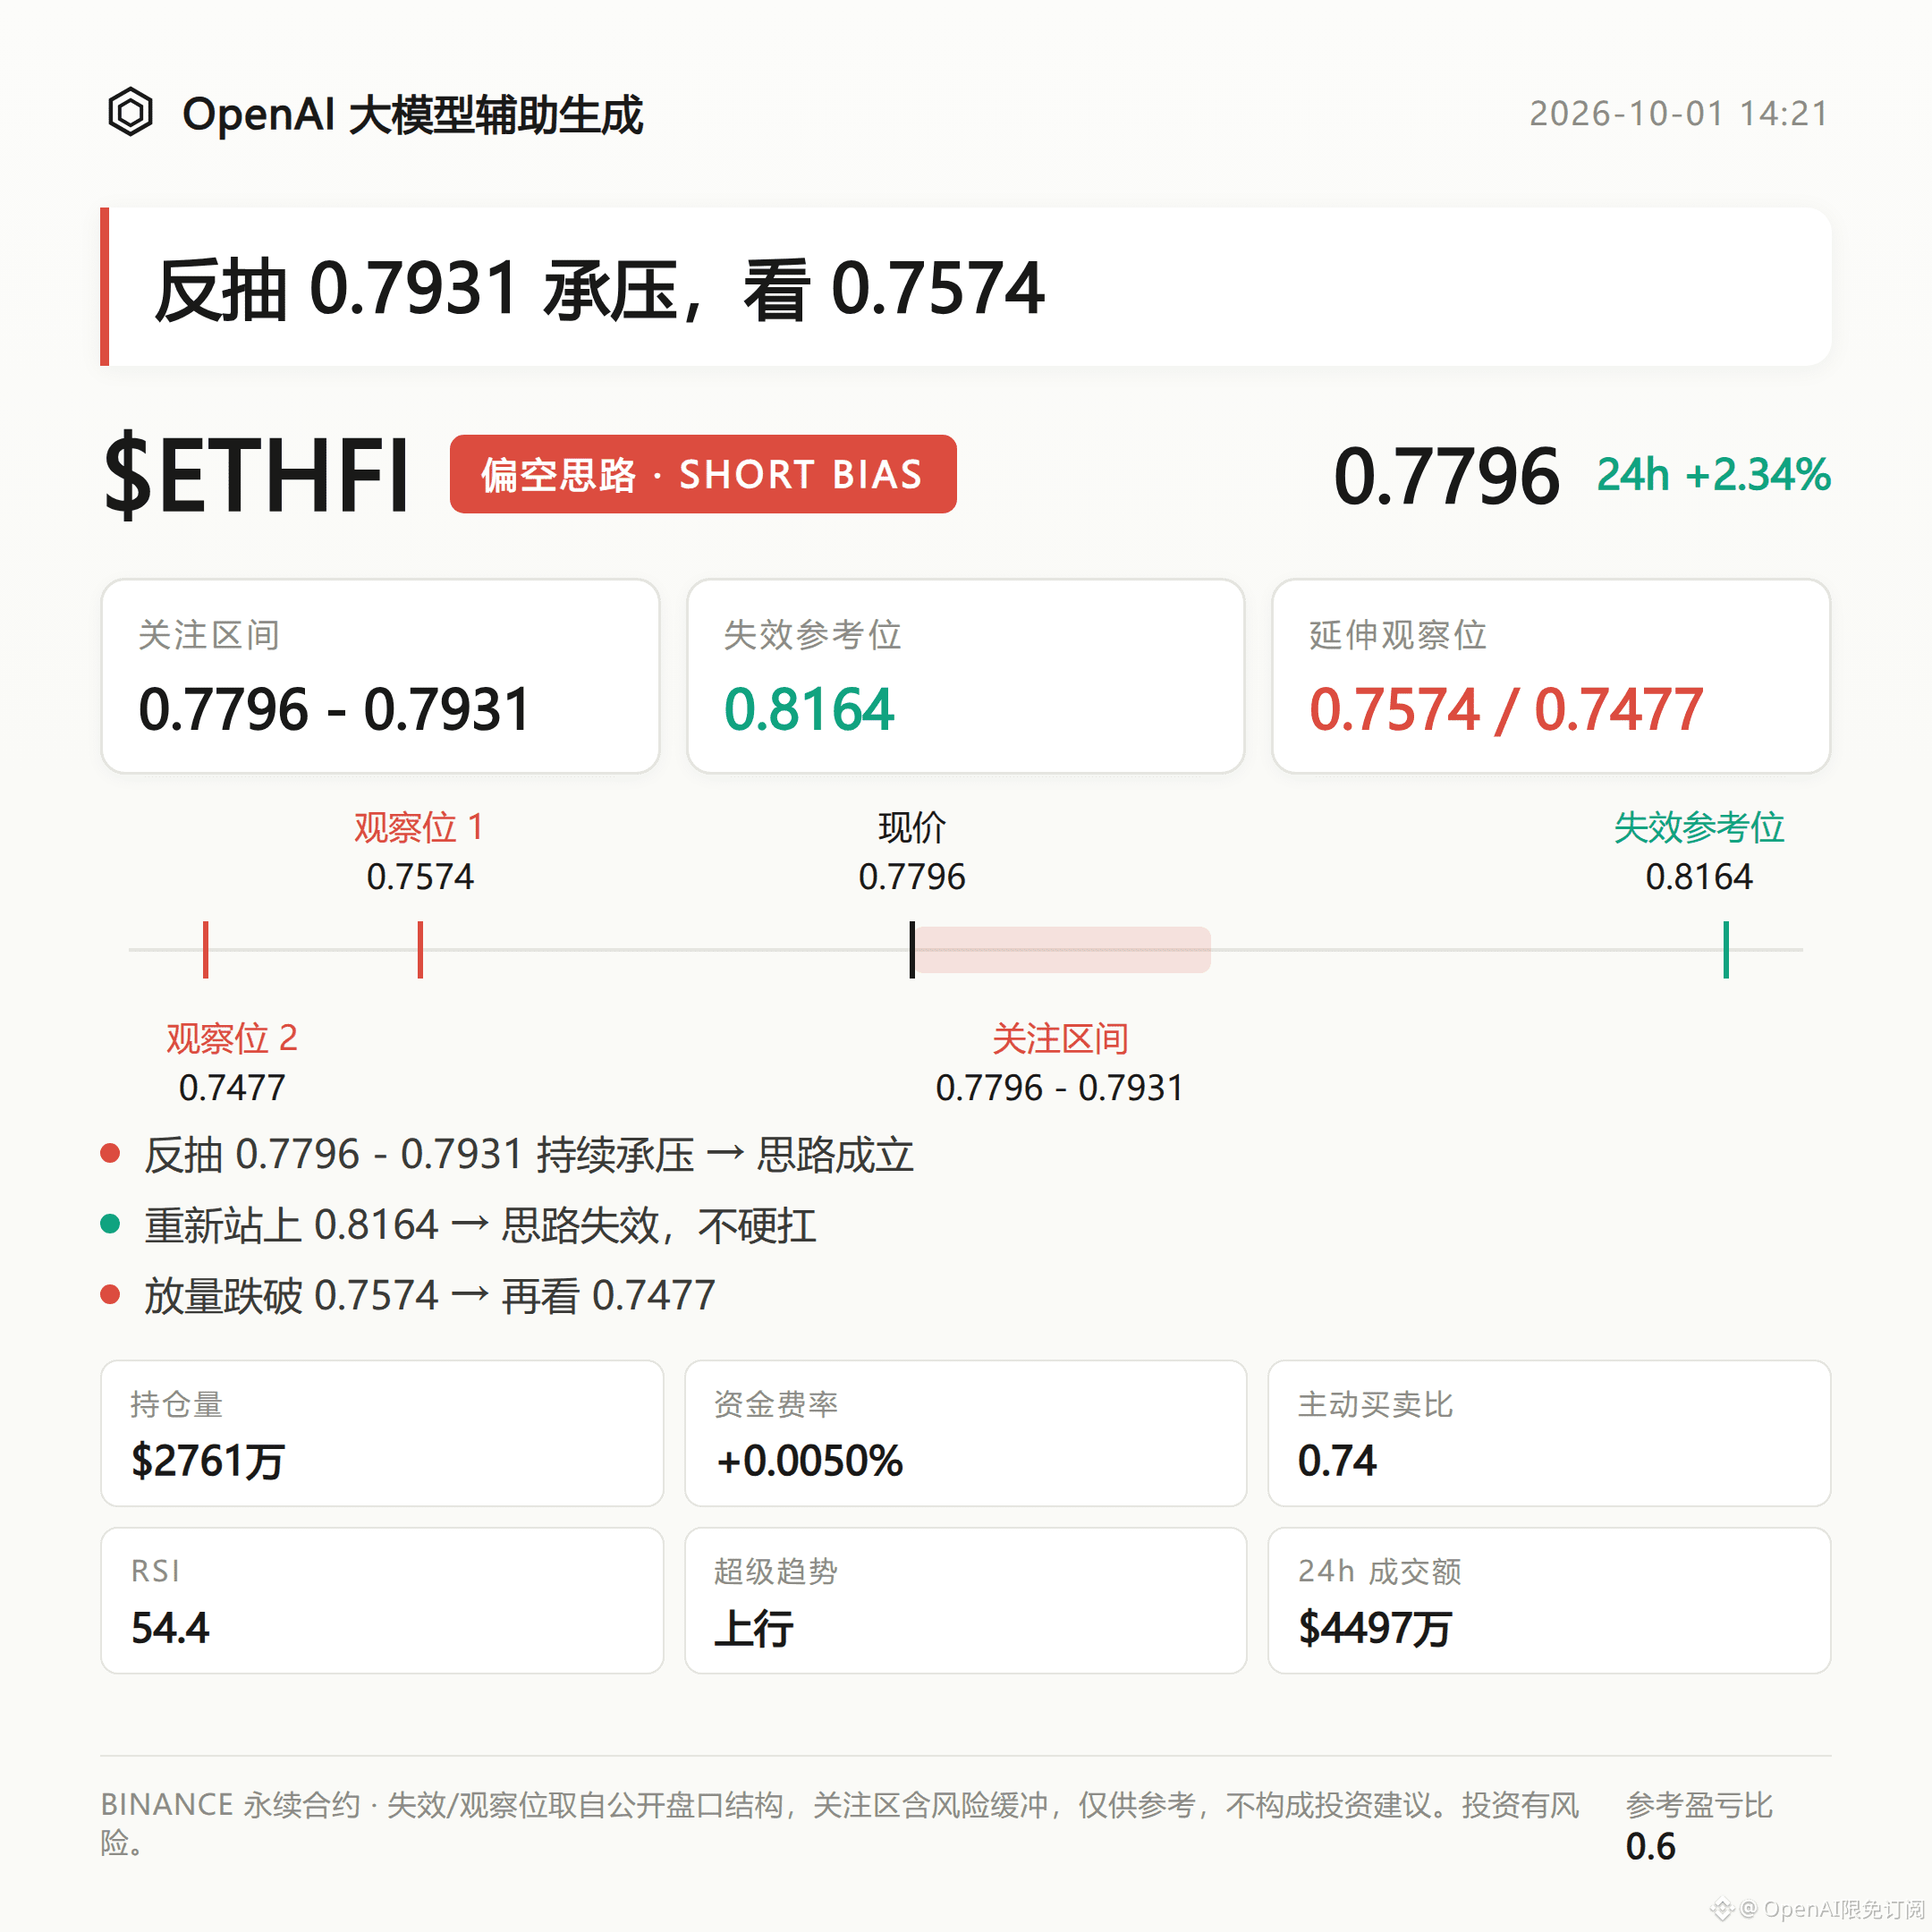
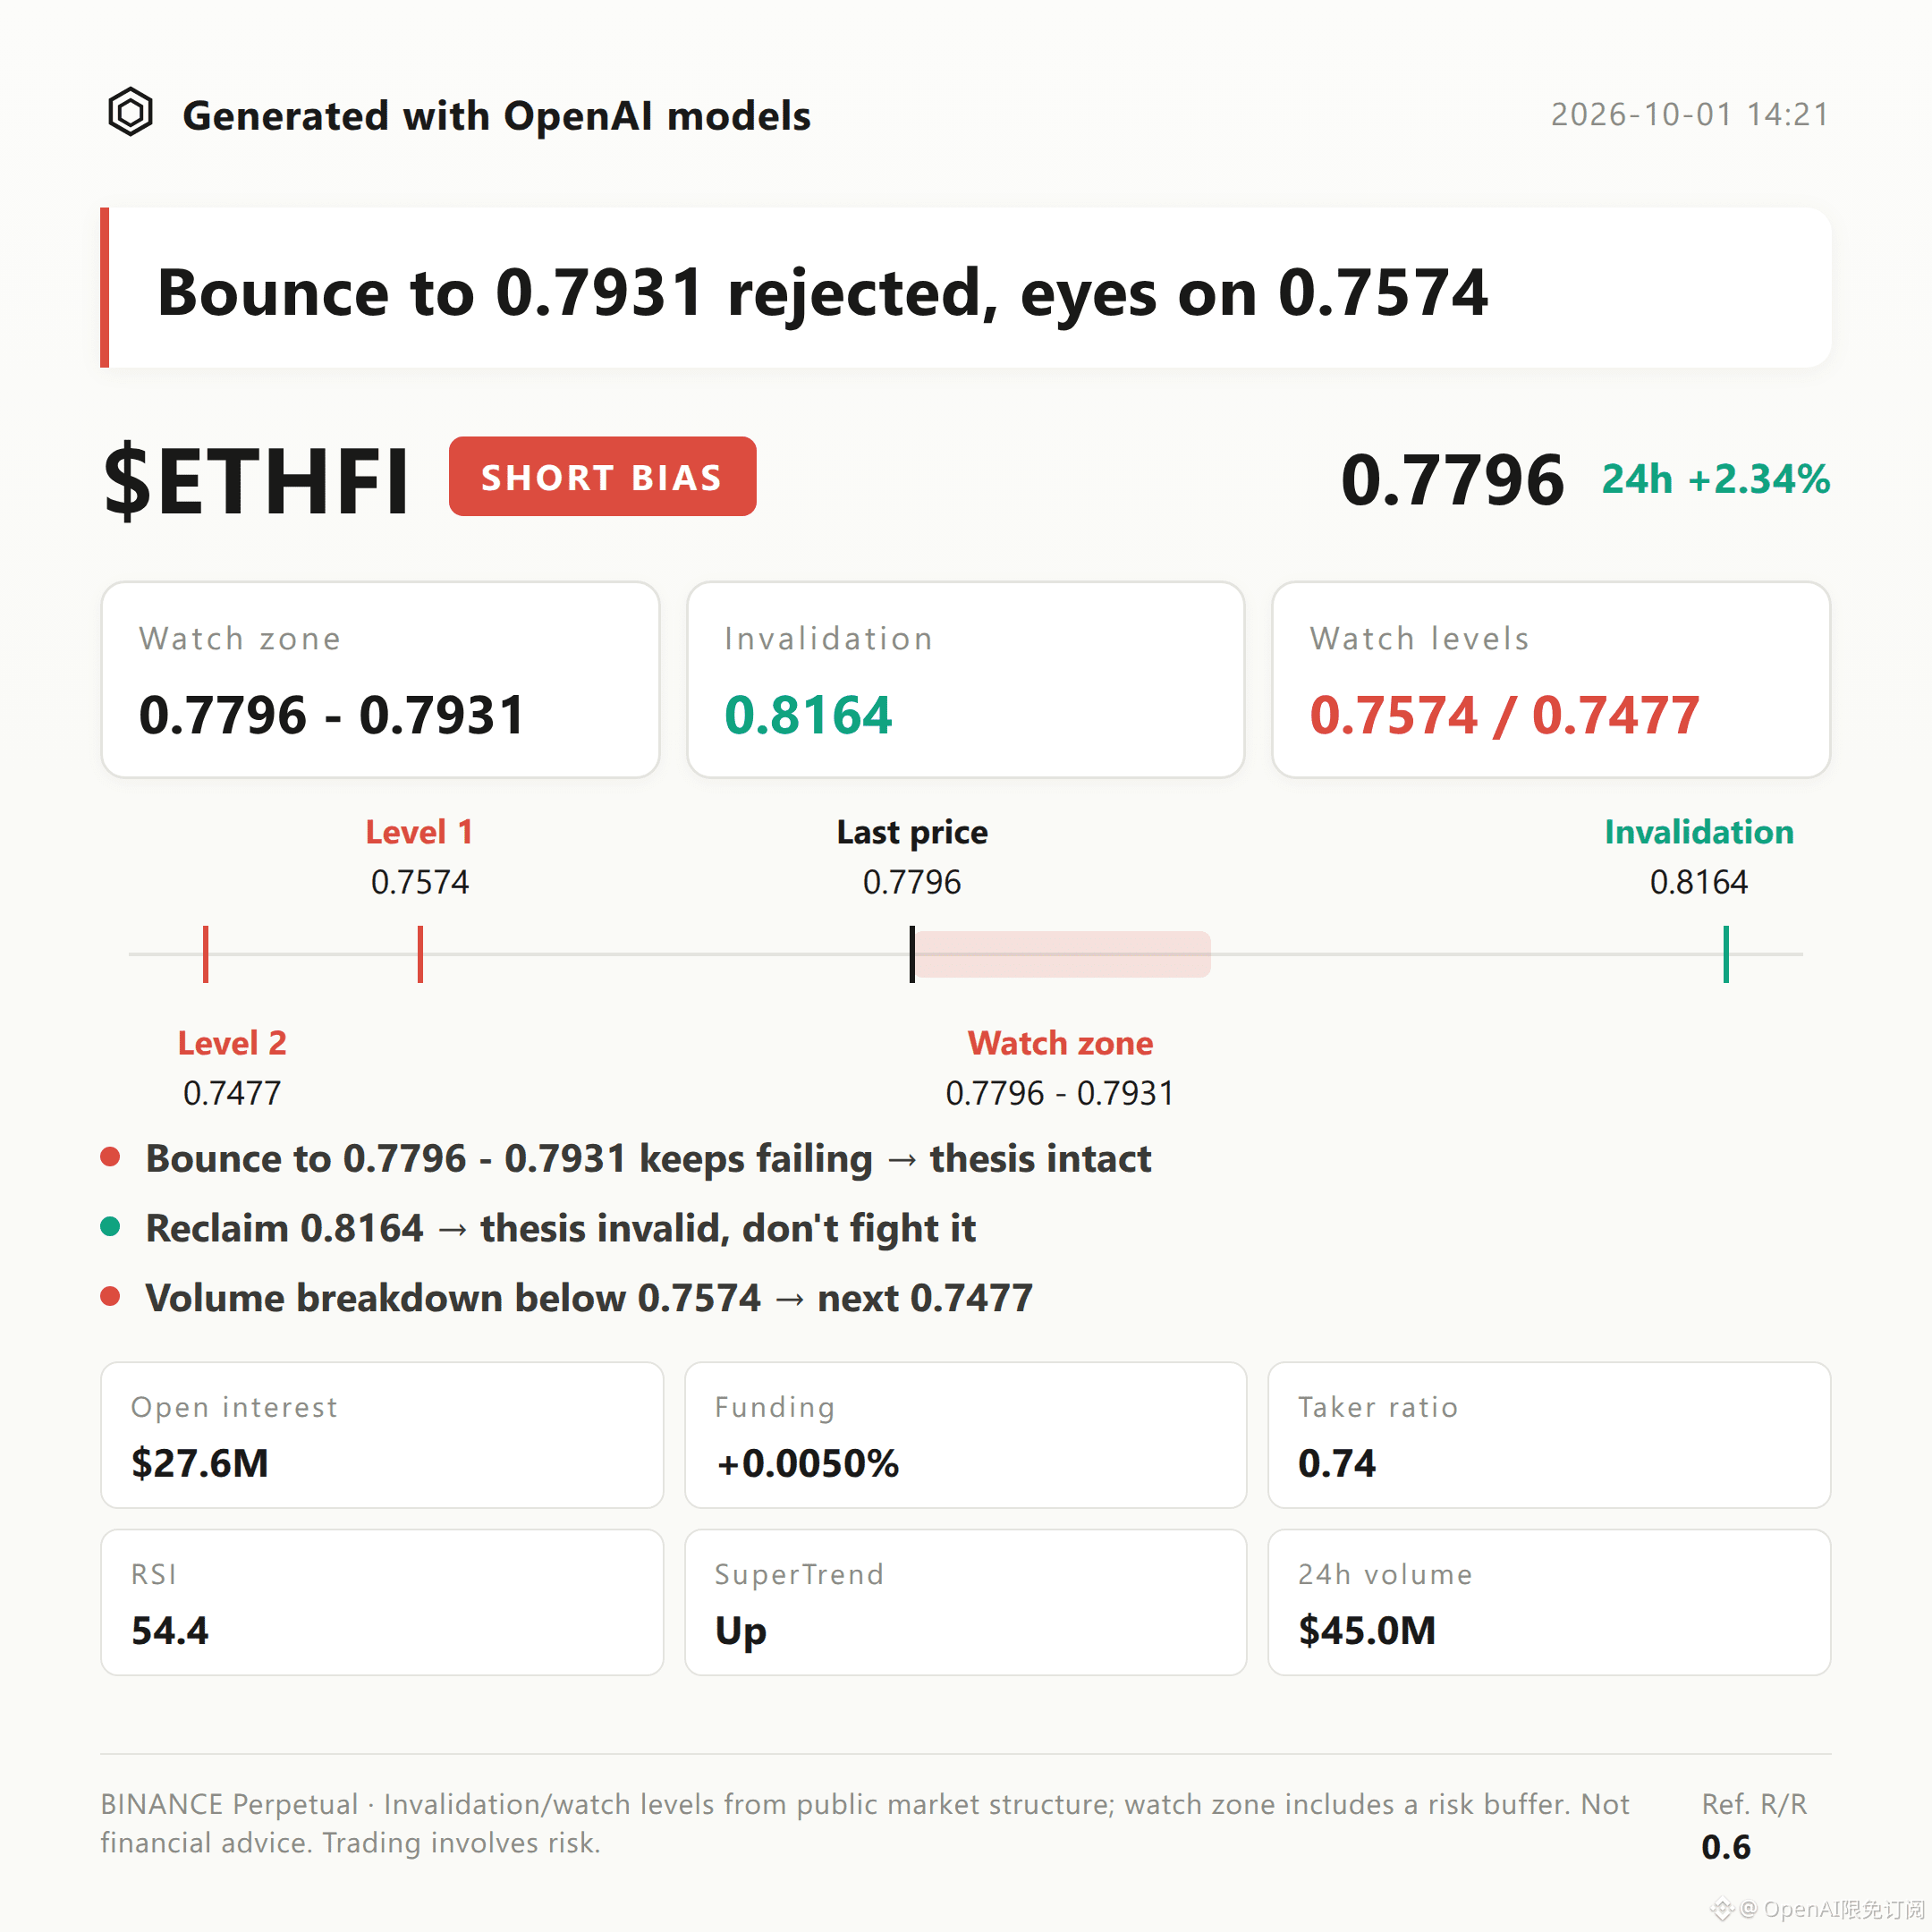
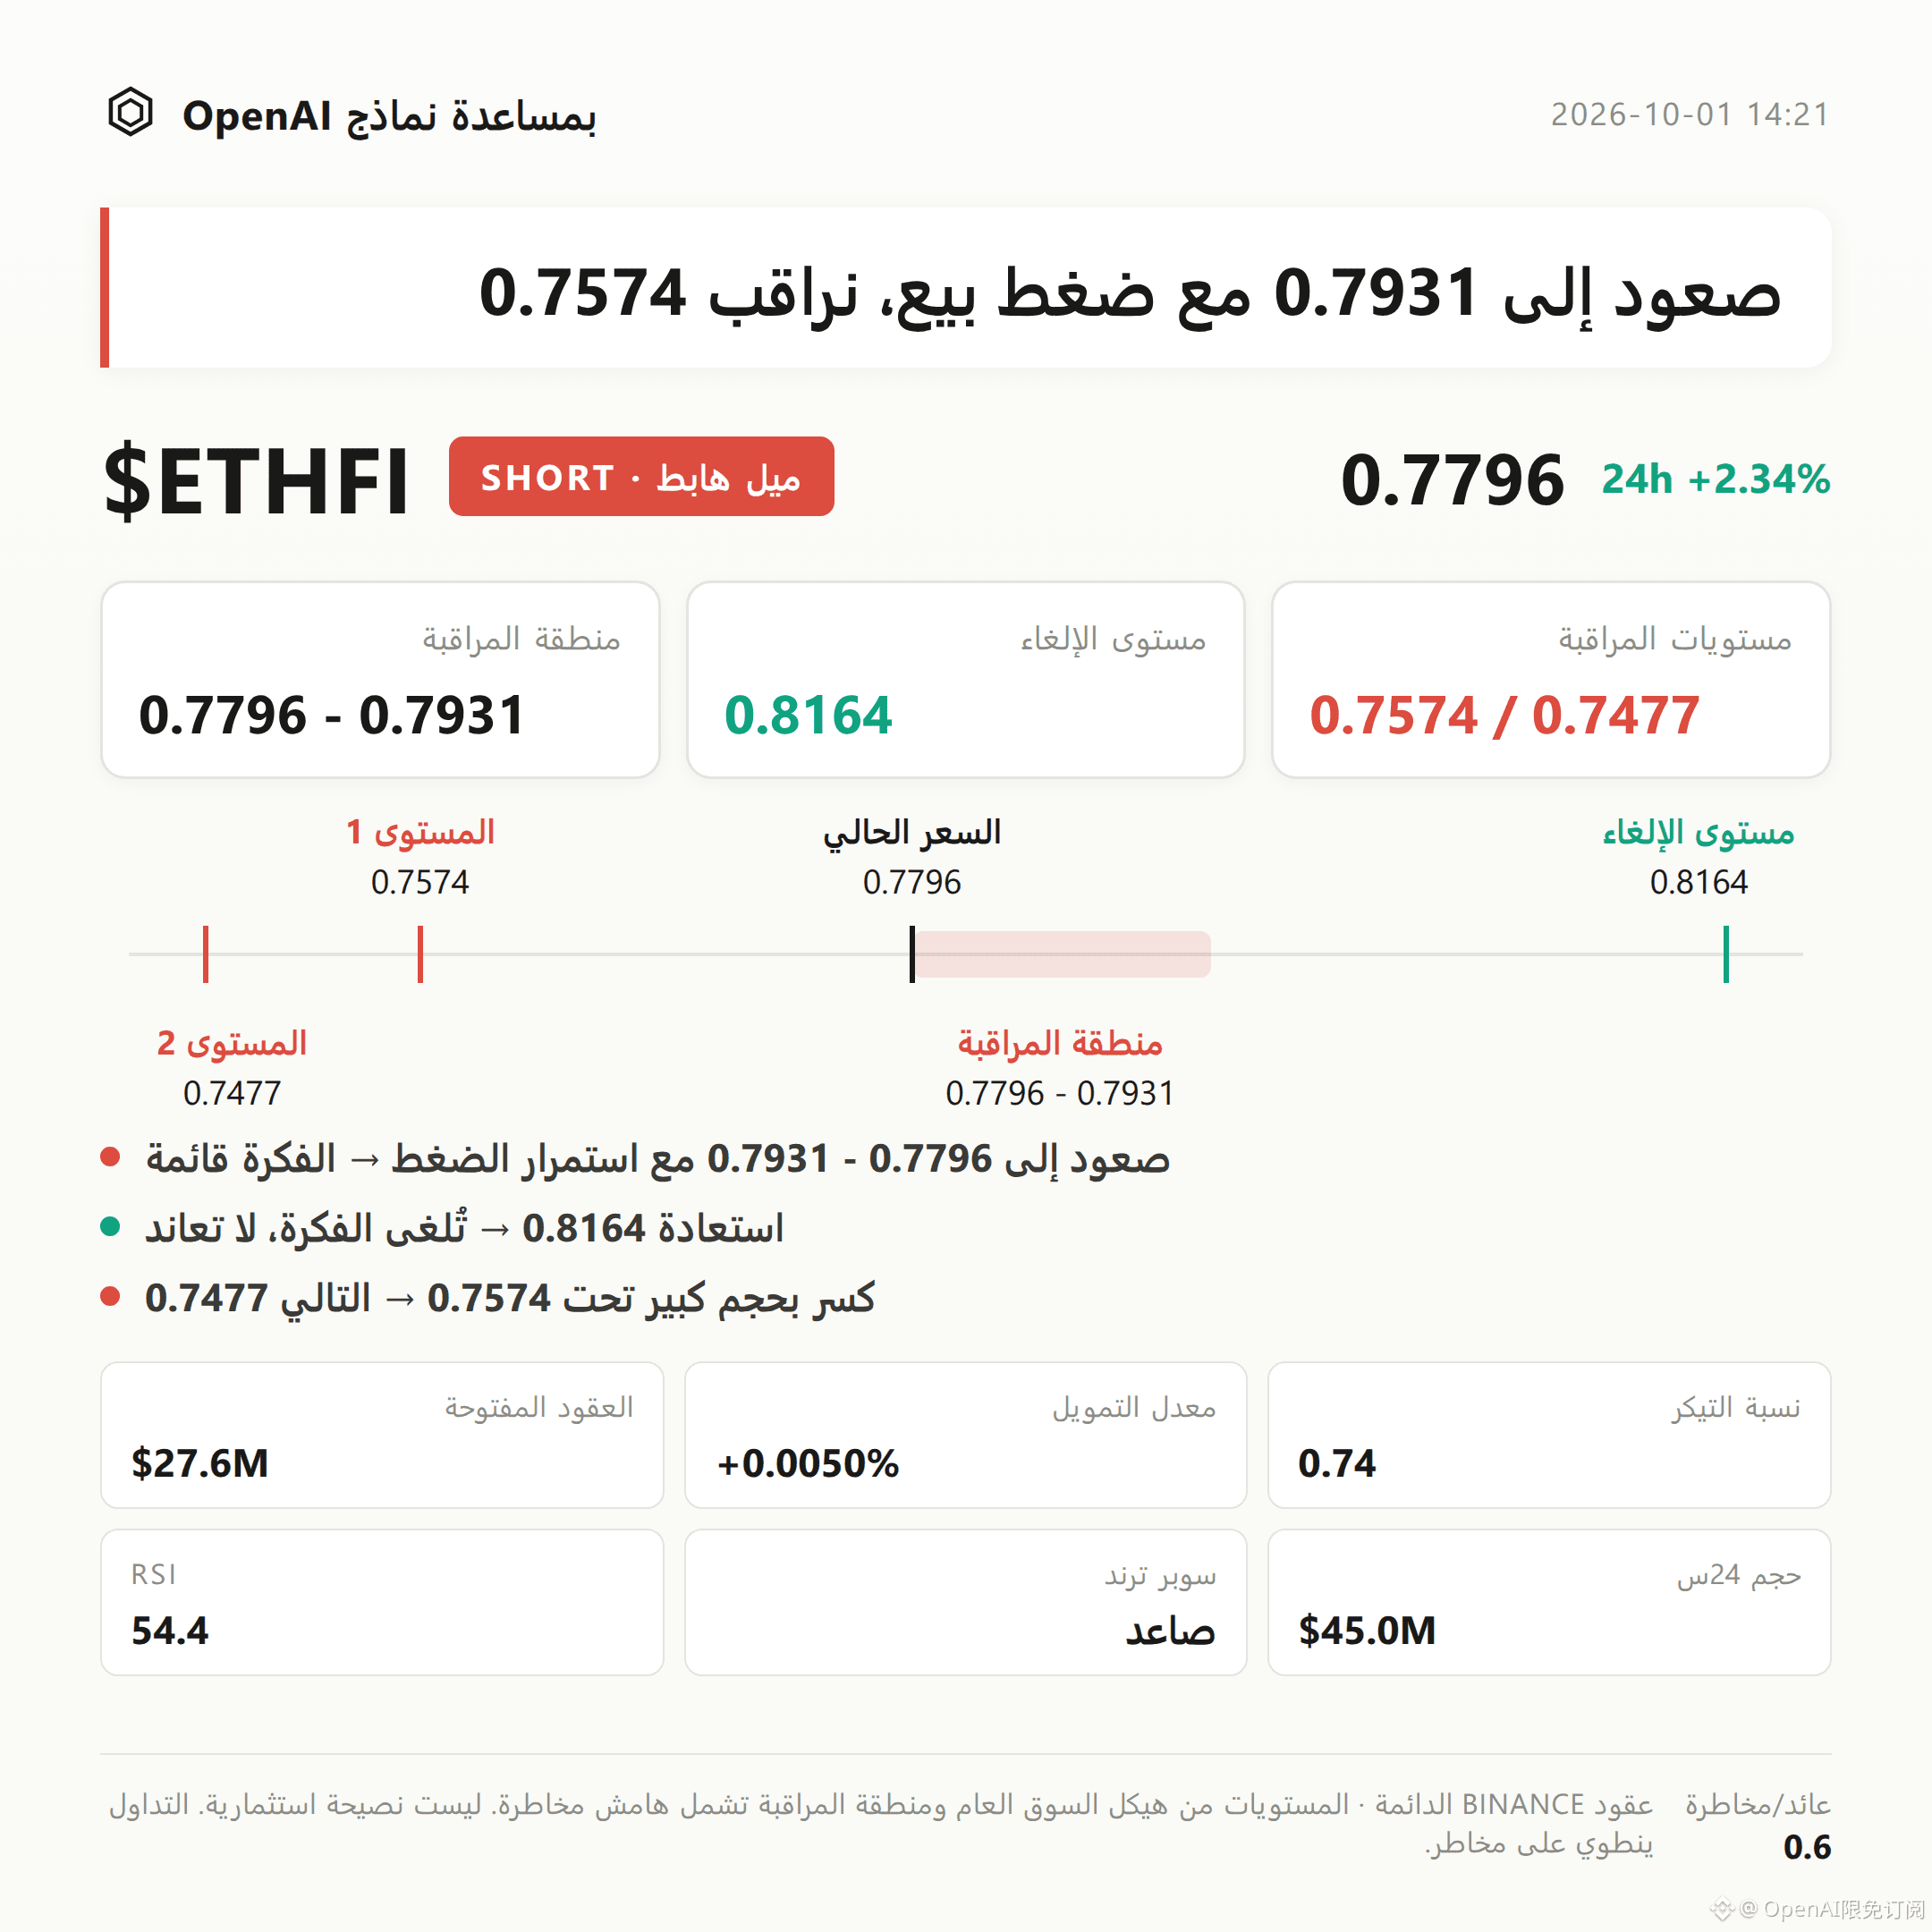
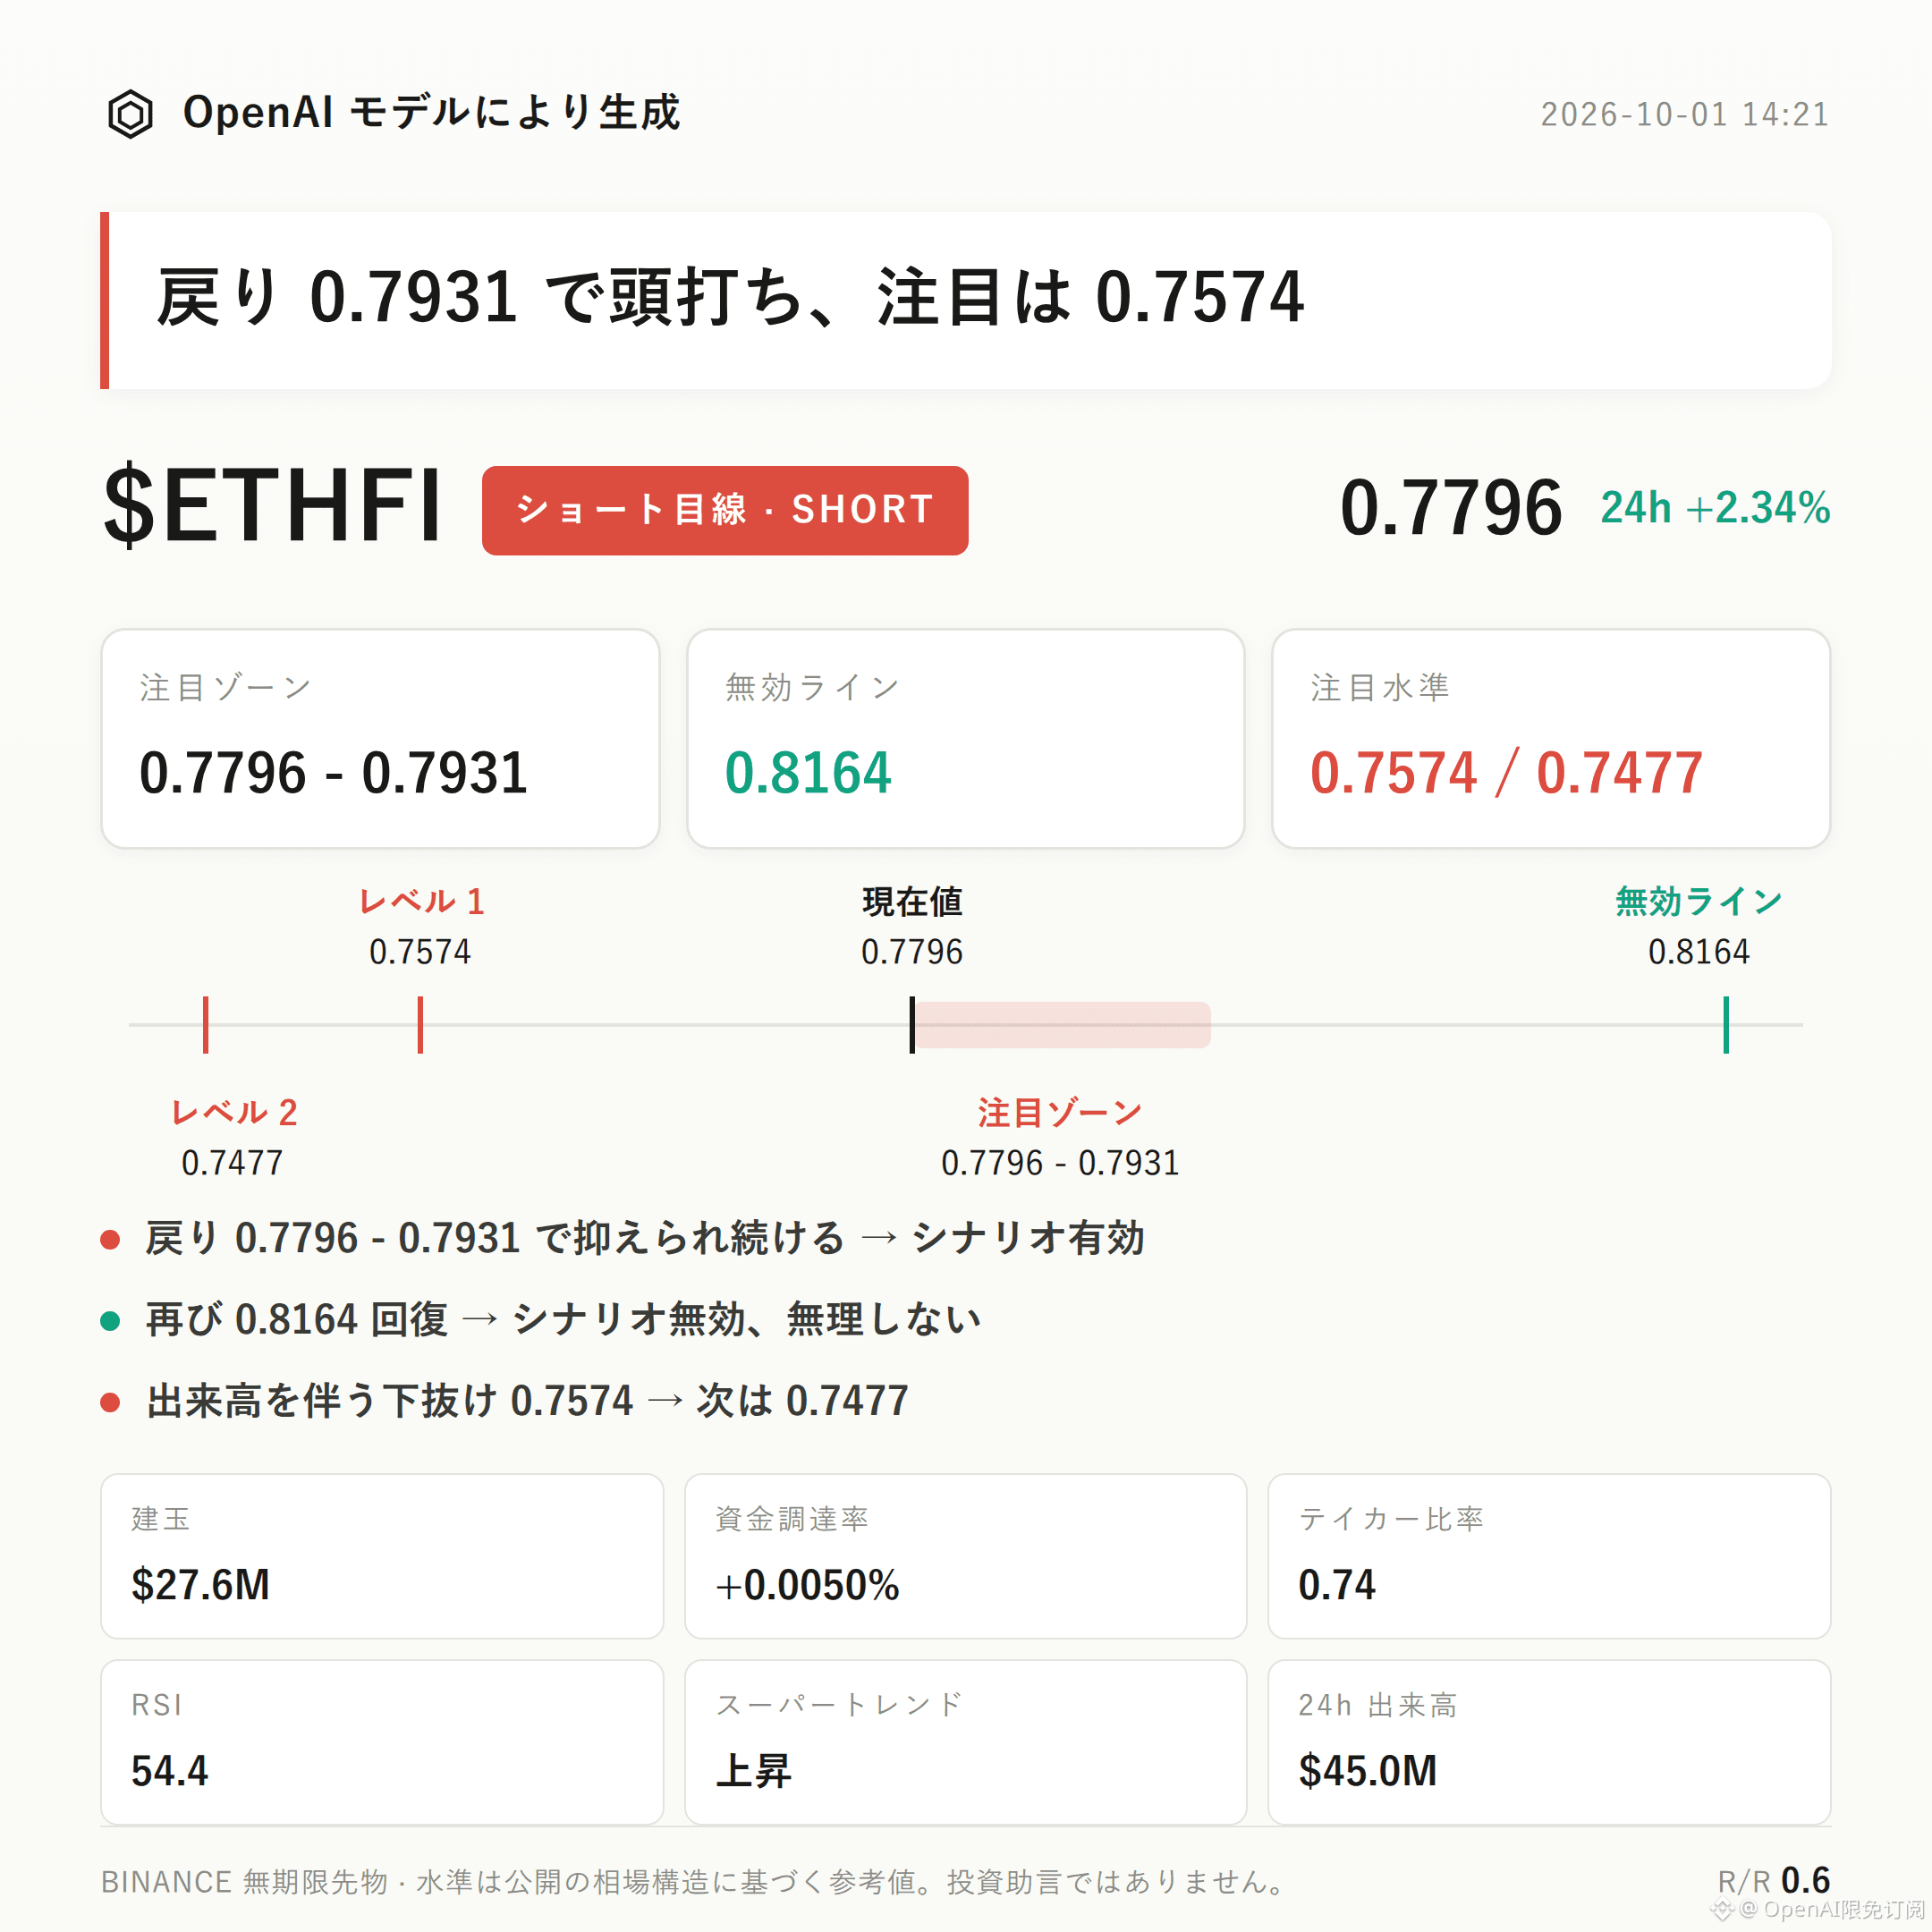
35
·
--
Trading View|10/1 13:21
$ONDO Bearish Bias|Focus Zone 0.5095 - 0.5186 | Invalidation Reference 0.5255 | Observation Levels 0.4883 / 0.4769
$ONDO The current structure remains bearish.
The Supertrend stays pointing downward; the buy/sell ratio (active trading ratio) is 0.91, with sell liquidity in advantage. Meanwhile, open interest has fallen by 10.6% within 24 hours.
The key is to watch whether the pullback can be capped in the resistance area, to confirm whether the bearish structure continues.
Current price is 0.5095, sitting between the Bollinger mid-band 0.5034 and the upper band 0.5186. The recent high is 0.5255.
RSI is 55.1, and MACD still shows bullish momentum—suggesting the strength of the short-term pullback has not fully faded, which is a constraining factor within the bearish structure.
However, the Supertrend is still trending down. Until price reclaims the recent high, the structure is more suitable to monitor for selling pressure on pullbacks.
The 24-hour trading volume is $223 million, and price is up 1.70%, but open interest has dropped to $77.95 million. The rebound is accompanied by shrinking open interest, so the sustainability still needs confirmation.
Funding rate is +0.0024%; long accounts make up 67%. Yet the active buy/sell ratio is only 0.91—accounts lean toward being long, but active execution is more sell-heavy. This raises the possibility of a long crowding effect coinciding with sell pressure.
For the bearish focus zone, start by watching 0.5095 - 0.5186, which is more suitable for waiting for confirmation after the pullback shows resistance.
If, during the retest of the focus zone, short-side selling pressure is absorbed, and the pullback continues to be capped, then the bearish bias holds.
If price reaches and then reclaims the invalidation reference 0.5255, it indicates the current decline structure is broken—the bearish thesis is invalidated. Don’t overstay the trade.
If there is a downside breakout with increased volume below the observation level 0.4883, then look for support around 0.4769.
There are currently no significant reversal signals, but RSI and MACD still retain short-term bullish characteristics, and contract leverage itself is a risk factor.
The risk/reward ratio is 1.3. Until conditions are met, do not assume the outcome in advance. With leveraged contracts, position discipline matters more than directional judgment.
For reference only and does not constitute investment advice. Contracts are leveraged—investing involves risk.
This article was generated with assistance from an OpenAI large model.
$ONDO #Contract Analysis
Trading View|10/1 13:21
$ONDO Bearish Bias|Focus Zone 0.5095 - 0.5186 | Invalidation Reference 0.5255 | Observation Levels 0.4883 / 0.4769
$ONDO The current structure remains bearish.
The Supertrend stays pointing downward; the buy/sell ratio (active trading ratio) is 0.91, with sell liquidity in advantage. Meanwhile, open interest has fallen by 10.6% within 24 hours.
The key is to watch whether the pullback can be capped in the resistance area, to confirm whether the bearish structure continues.
Current price is 0.5095, sitting between the Bollinger mid-band 0.5034 and the upper band 0.5186. The recent high is 0.5255.
RSI is 55.1, and MACD still shows bullish momentum—suggesting the strength of the short-term pullback has not fully faded, which is a constraining factor within the bearish structure.
However, the Supertrend is still trending down. Until price reclaims the recent high, the structure is more suitable to monitor for selling pressure on pullbacks.
The 24-hour trading volume is $223 million, and price is up 1.70%, but open interest has dropped to $77.95 million. The rebound is accompanied by shrinking open interest, so the sustainability still needs confirmation.
Funding rate is +0.0024%; long accounts make up 67%. Yet the active buy/sell ratio is only 0.91—accounts lean toward being long, but active execution is more sell-heavy. This raises the possibility of a long crowding effect coinciding with sell pressure.
For the bearish focus zone, start by watching 0.5095 - 0.5186, which is more suitable for waiting for confirmation after the pullback shows resistance.
If, during the retest of the focus zone, short-side selling pressure is absorbed, and the pullback continues to be capped, then the bearish bias holds.
If price reaches and then reclaims the invalidation reference 0.5255, it indicates the current decline structure is broken—the bearish thesis is invalidated. Don’t overstay the trade.
If there is a downside breakout with increased volume below the observation level 0.4883, then look for support around 0.4769.
There are currently no significant reversal signals, but RSI and MACD still retain short-term bullish characteristics, and contract leverage itself is a risk factor.
The risk/reward ratio is 1.3. Until conditions are met, do not assume the outcome in advance. With leveraged contracts, position discipline matters more than directional judgment.
For reference only and does not constitute investment advice. Contracts are leveraged—investing involves risk.
This article was generated with assistance from an OpenAI large model.
$ONDO #Contract Analysis
$ONDO Bearish Bias|Focus Zone 0.5095 - 0.5186 | Invalidation Reference 0.5255 | Observation Levels 0.4883 / 0.4769
$ONDO The current structure remains bearish.
The Supertrend stays pointing downward; the buy/sell ratio (active trading ratio) is 0.91, with sell liquidity in advantage. Meanwhile, open interest has fallen by 10.6% within 24 hours.
The key is to watch whether the pullback can be capped in the resistance area, to confirm whether the bearish structure continues.
Current price is 0.5095, sitting between the Bollinger mid-band 0.5034 and the upper band 0.5186. The recent high is 0.5255.
RSI is 55.1, and MACD still shows bullish momentum—suggesting the strength of the short-term pullback has not fully faded, which is a constraining factor within the bearish structure.
However, the Supertrend is still trending down. Until price reclaims the recent high, the structure is more suitable to monitor for selling pressure on pullbacks.
The 24-hour trading volume is $223 million, and price is up 1.70%, but open interest has dropped to $77.95 million. The rebound is accompanied by shrinking open interest, so the sustainability still needs confirmation.
Funding rate is +0.0024%; long accounts make up 67%. Yet the active buy/sell ratio is only 0.91—accounts lean toward being long, but active execution is more sell-heavy. This raises the possibility of a long crowding effect coinciding with sell pressure.
For the bearish focus zone, start by watching 0.5095 - 0.5186, which is more suitable for waiting for confirmation after the pullback shows resistance.
If, during the retest of the focus zone, short-side selling pressure is absorbed, and the pullback continues to be capped, then the bearish bias holds.
If price reaches and then reclaims the invalidation reference 0.5255, it indicates the current decline structure is broken—the bearish thesis is invalidated. Don’t overstay the trade.
If there is a downside breakout with increased volume below the observation level 0.4883, then look for support around 0.4769.
There are currently no significant reversal signals, but RSI and MACD still retain short-term bullish characteristics, and contract leverage itself is a risk factor.
The risk/reward ratio is 1.3. Until conditions are met, do not assume the outcome in advance. With leveraged contracts, position discipline matters more than directional judgment.
For reference only and does not constitute investment advice. Contracts are leveraged—investing involves risk.
This article was generated with assistance from an OpenAI large model.
$ONDO #Contract Analysis
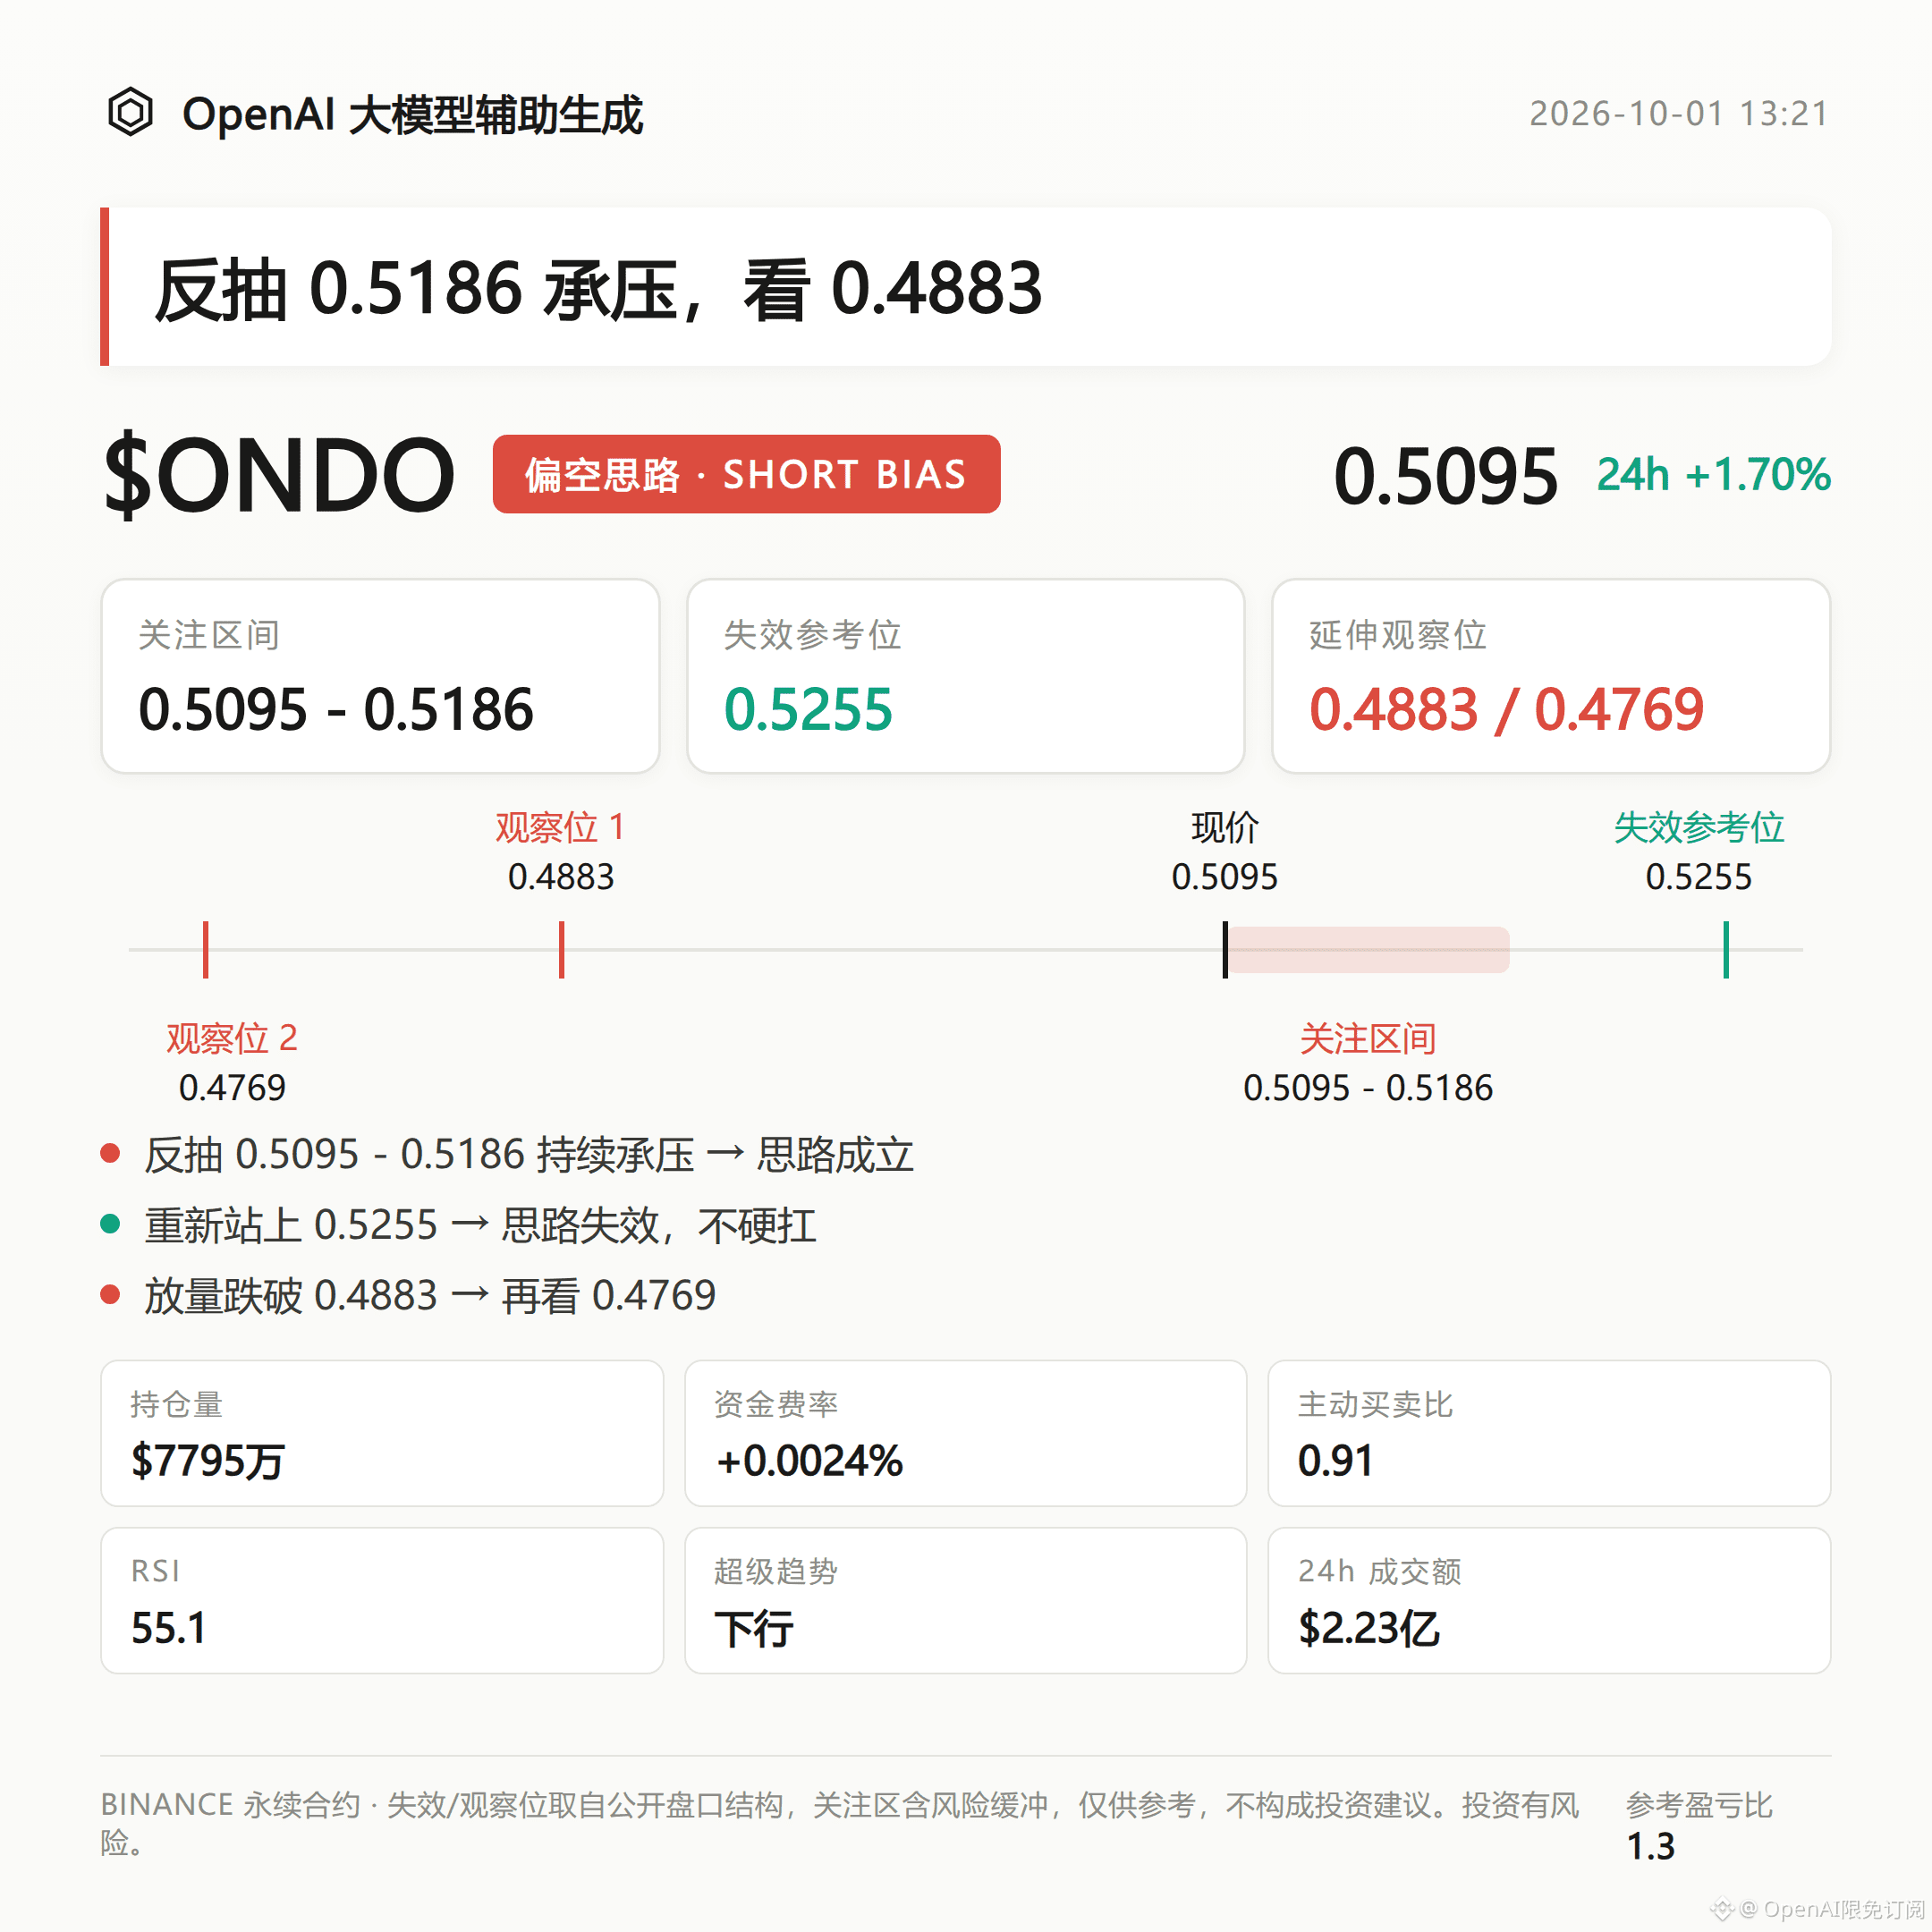
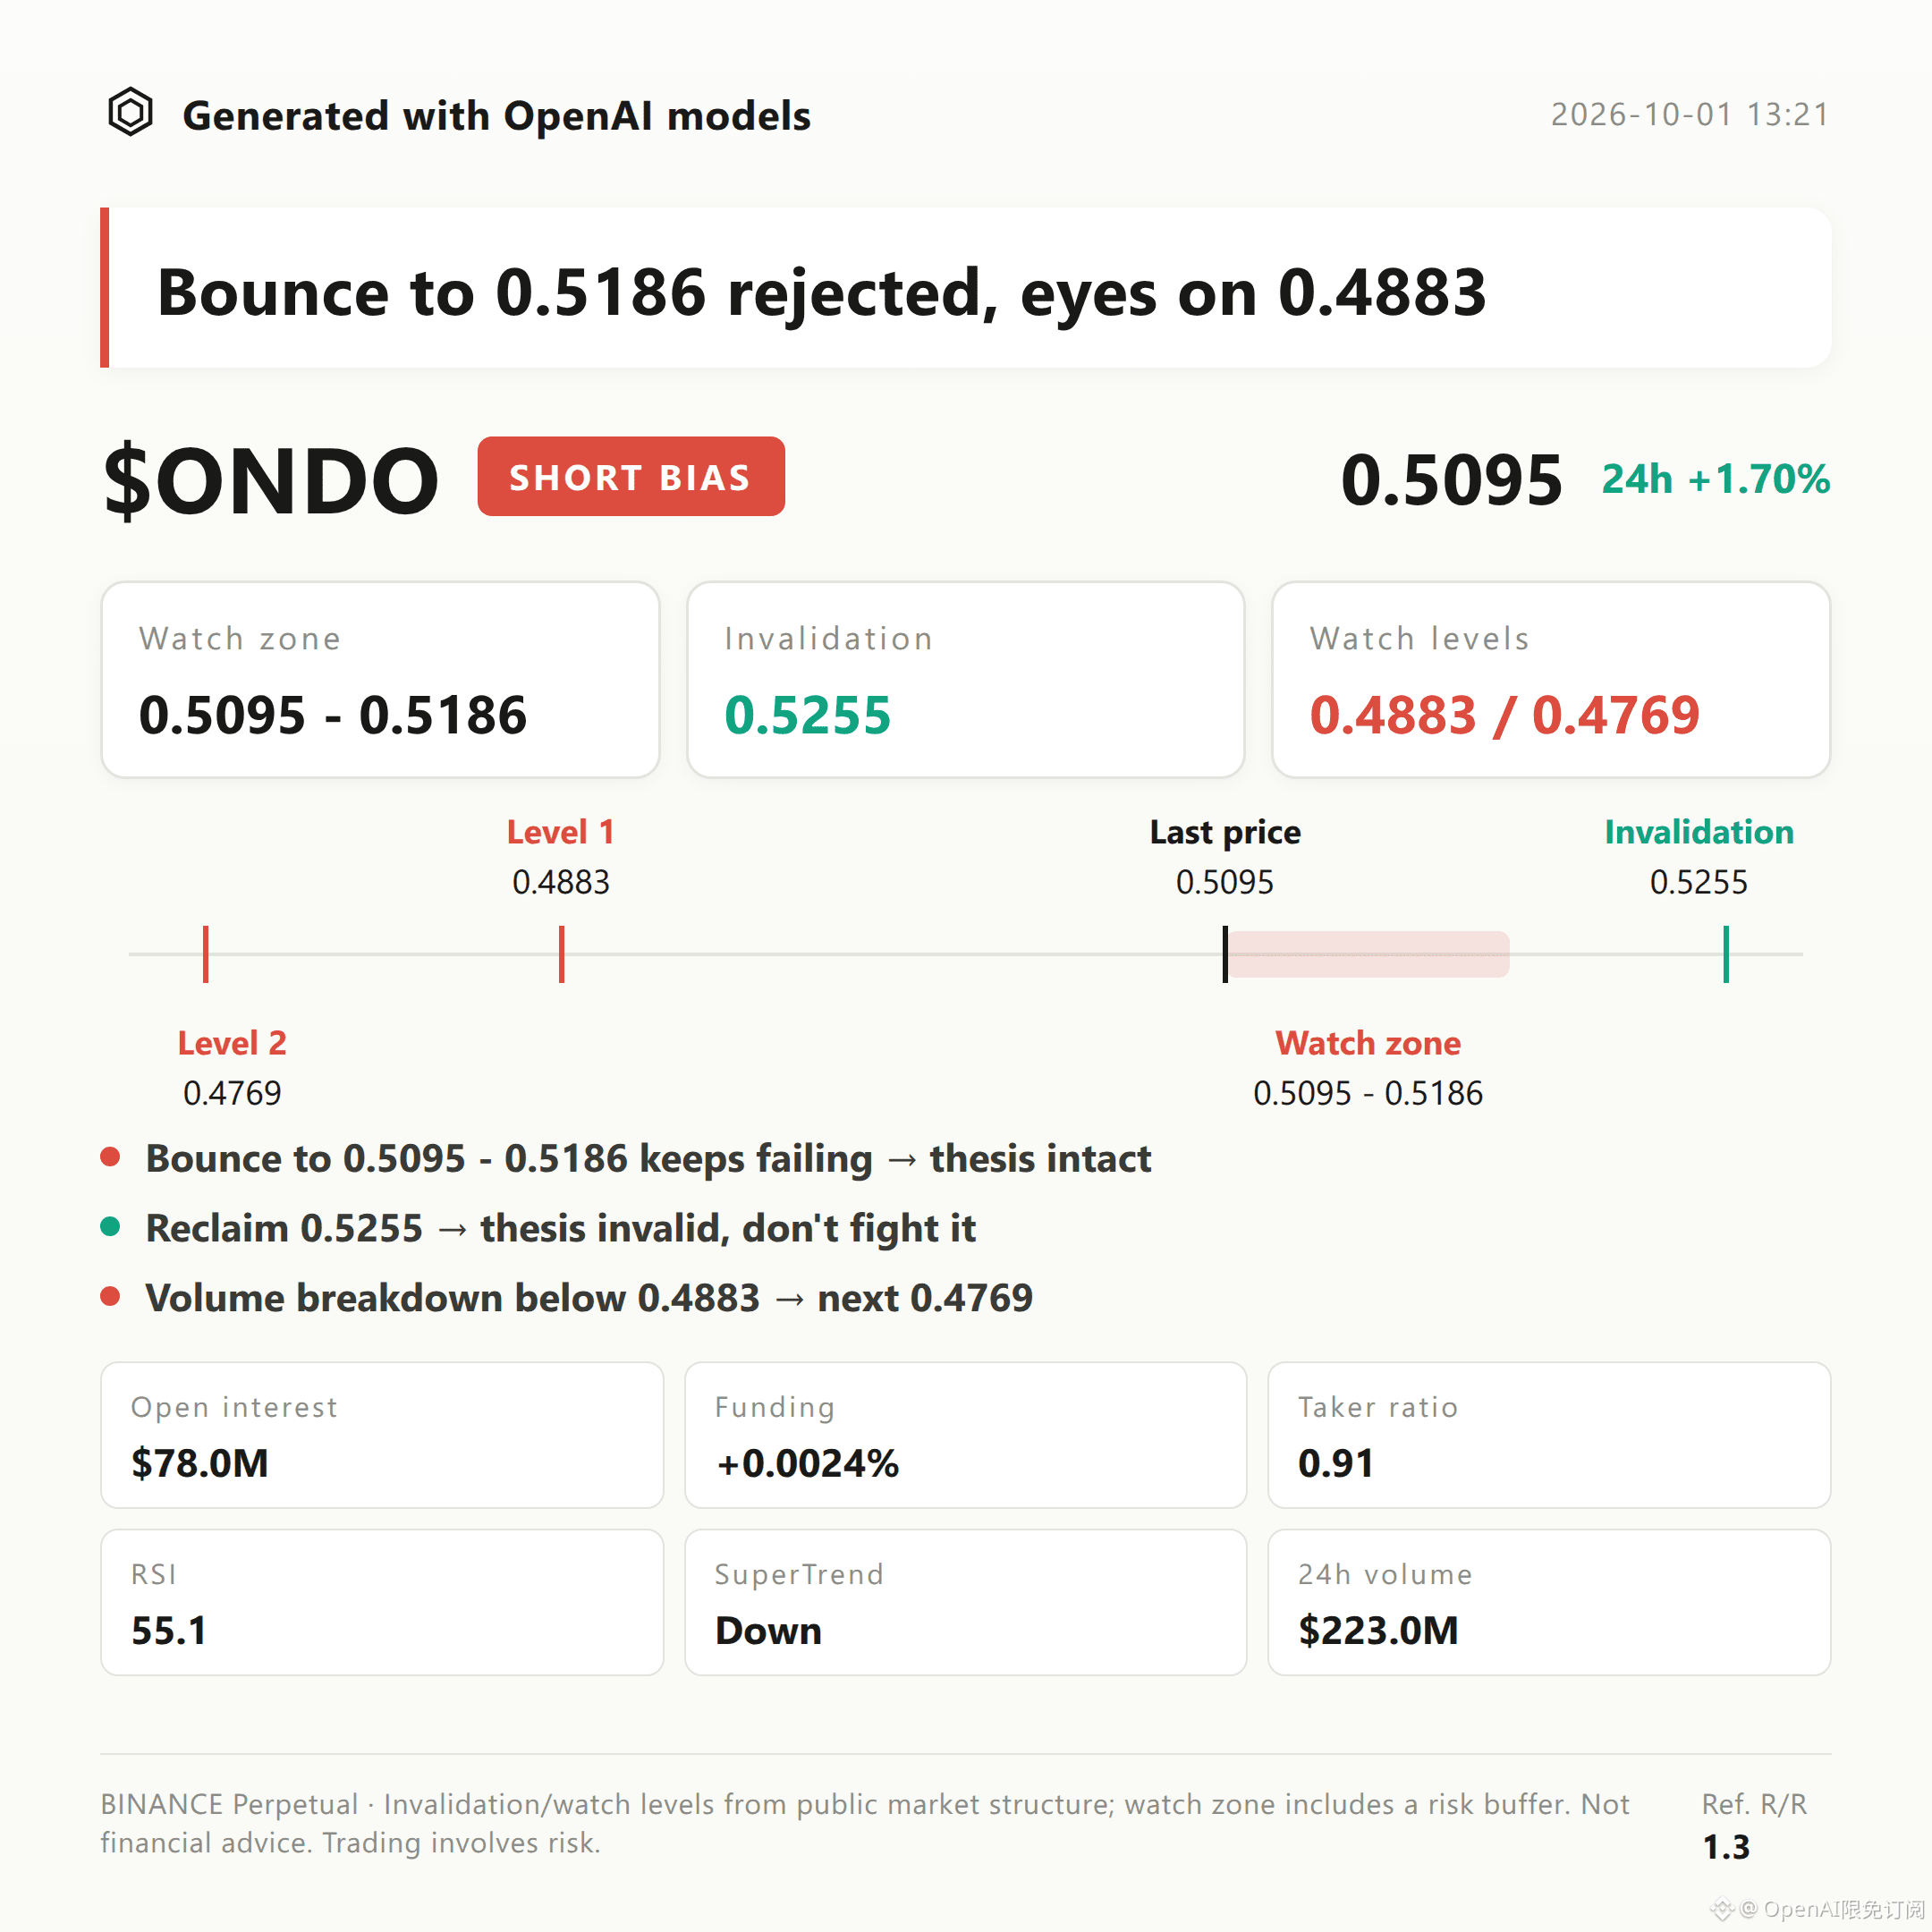
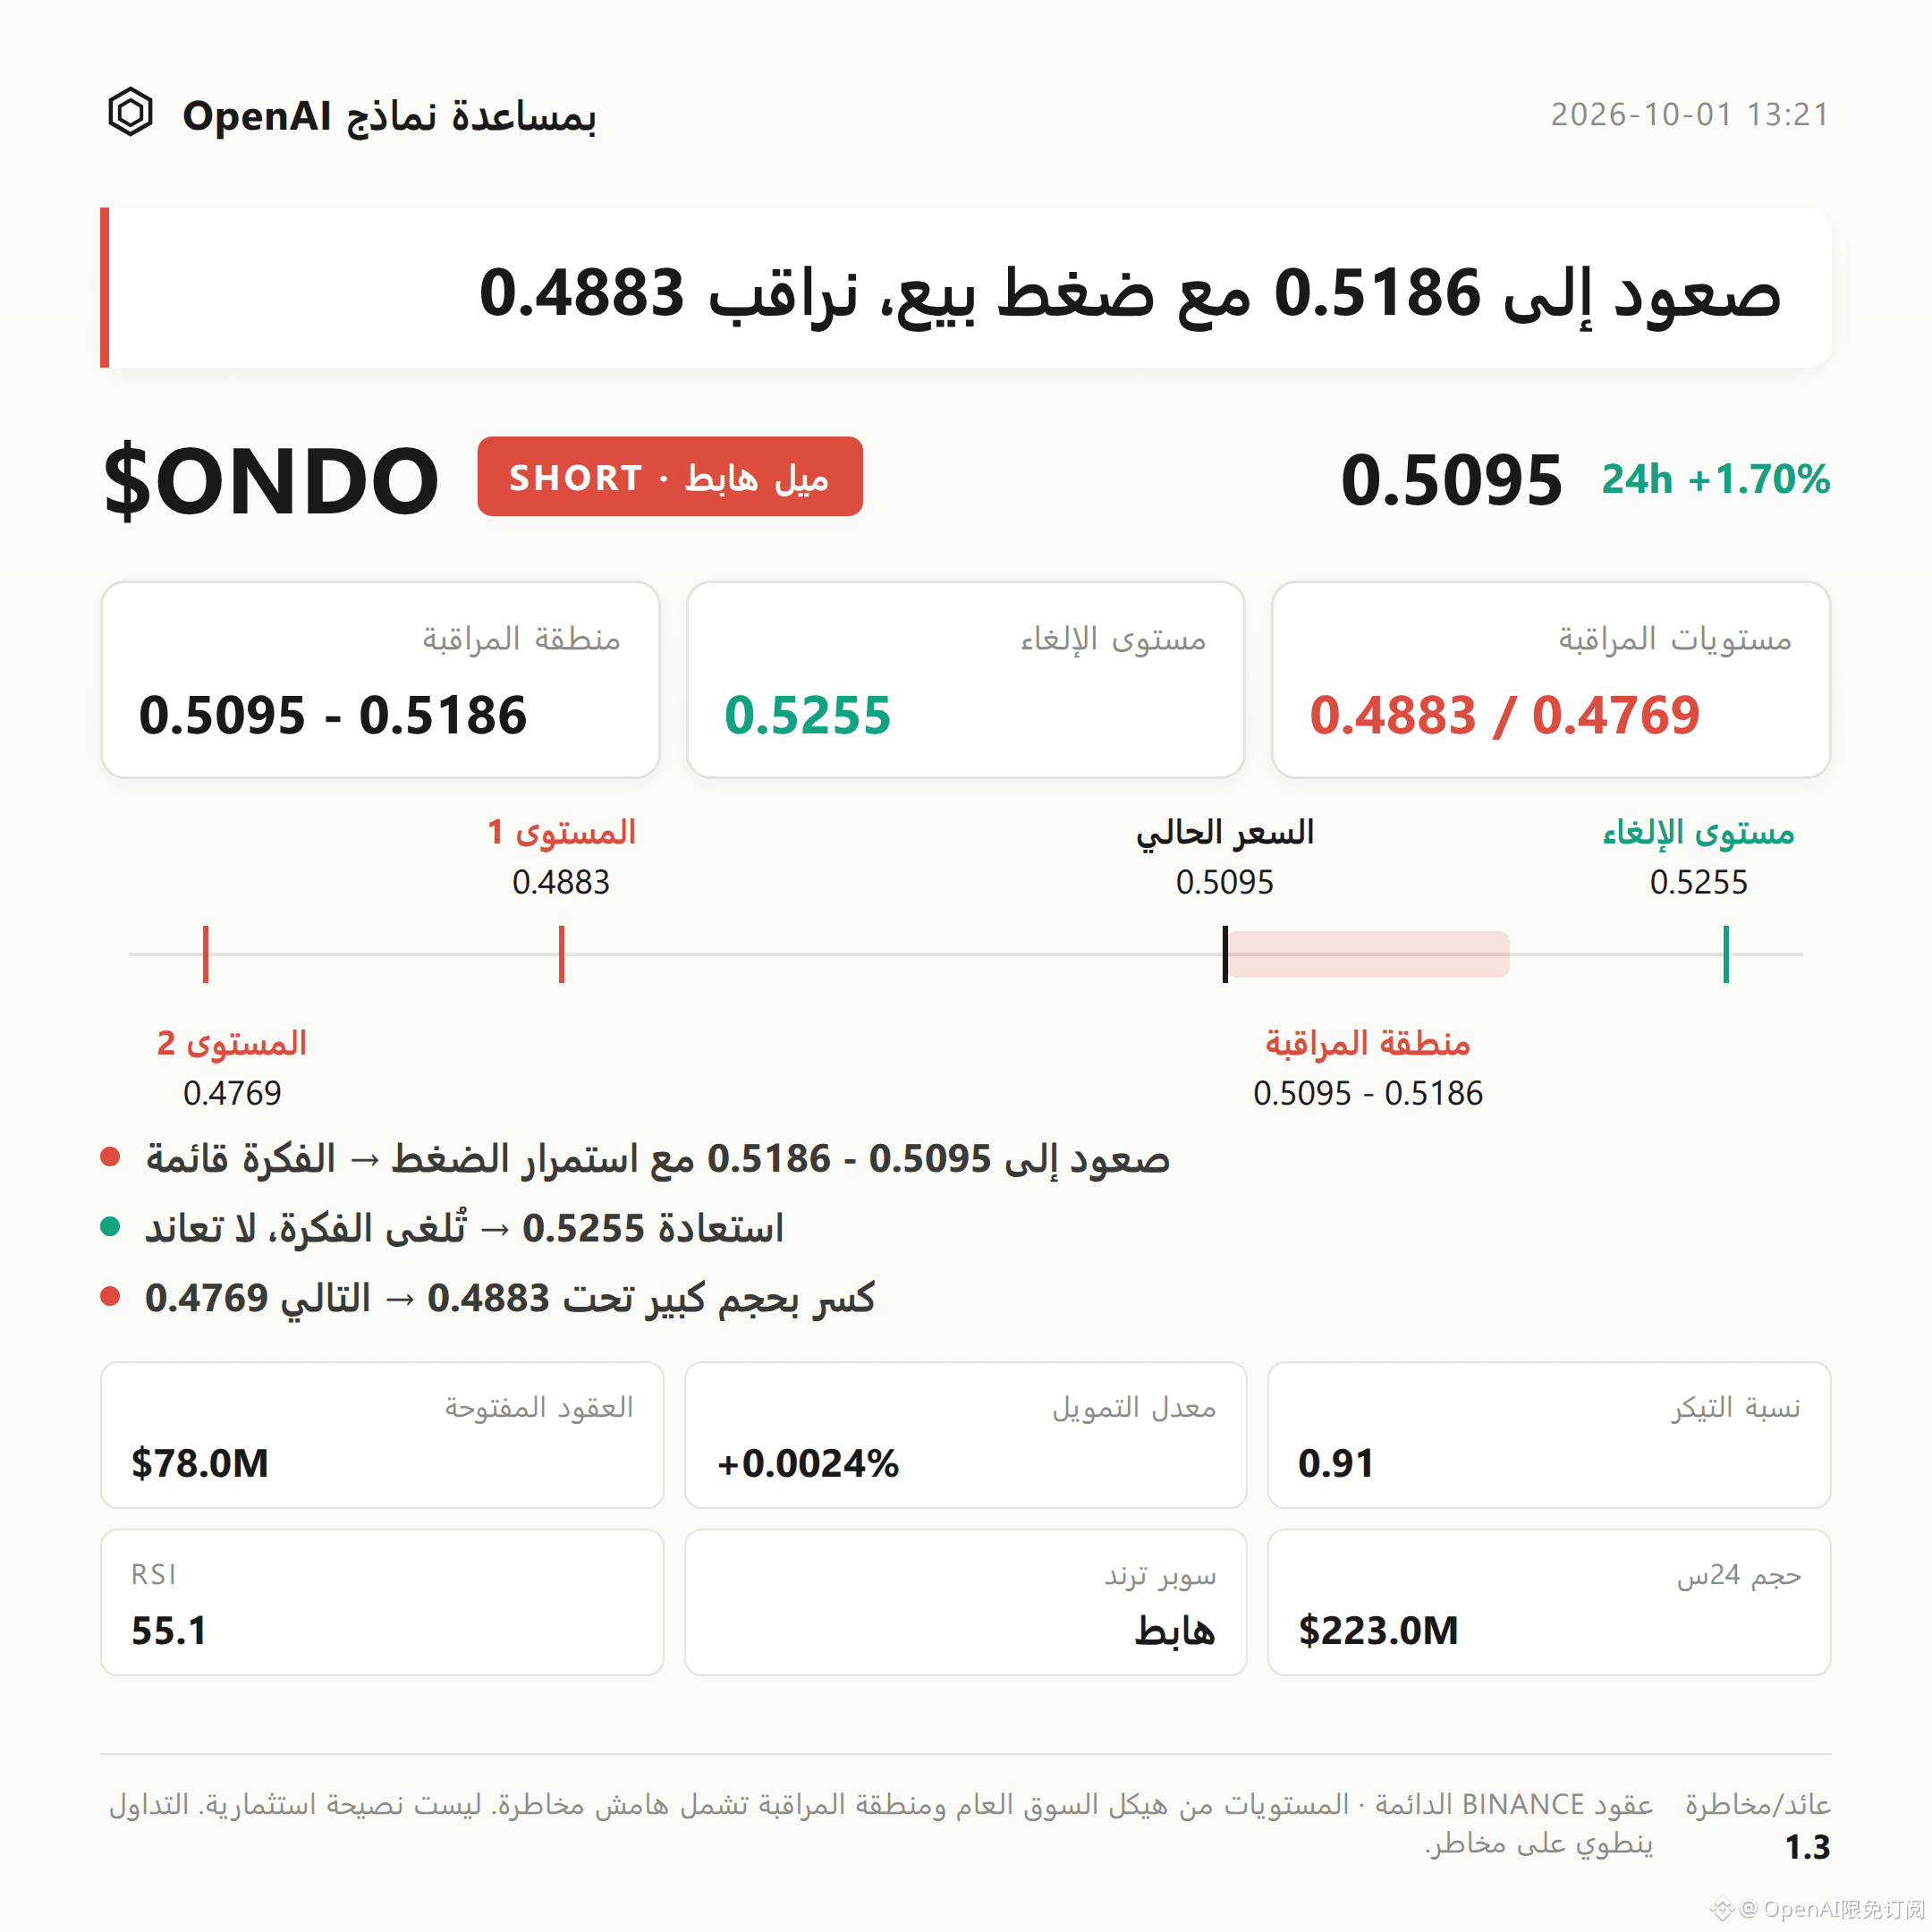
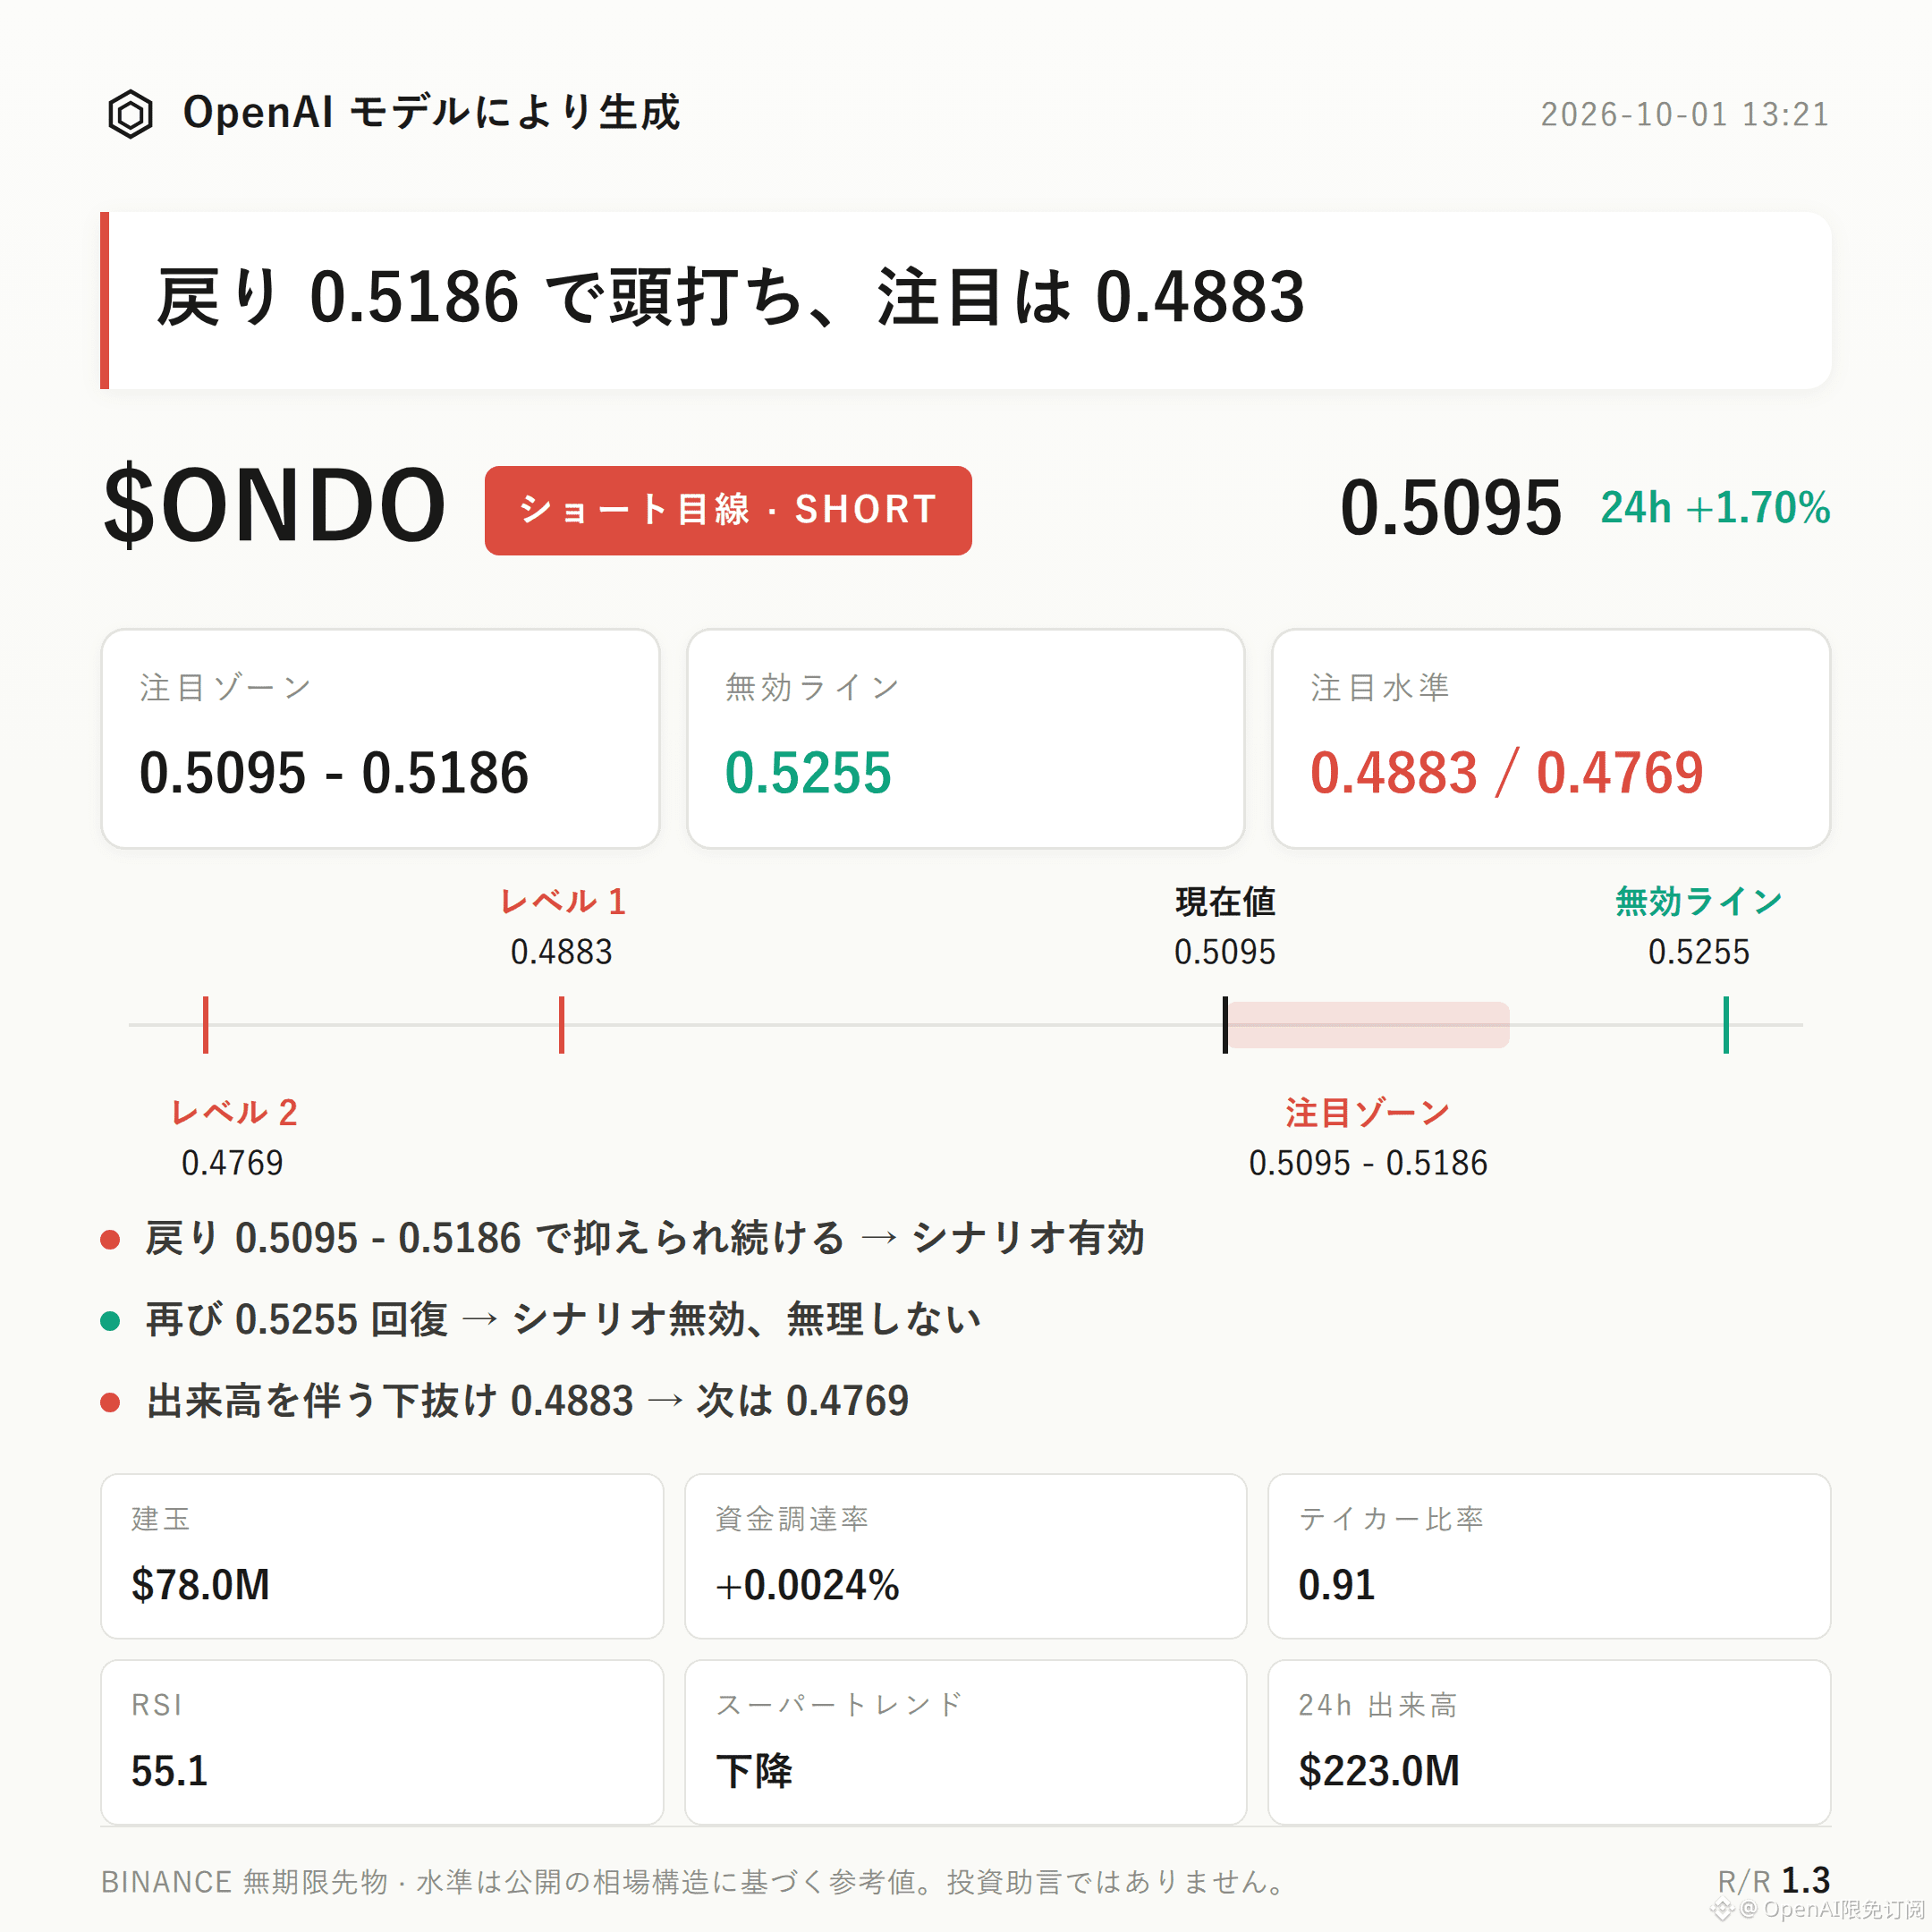
39
·
--
Trading Thesis|10/1 12:21
$STRK Bearish Bias Strategy | Watch Zone 0.04351 - 0.0441 | Invalidation Reference 0.04453 | Observation Levels 0.0412 / 0.04093
$STRK ’s current structure is moving with a bearish bias.
The buy/sell ratio is only 0.80, with sell-side orders in advantage; meanwhile, long accounts make up 52%, and the funding rate is +0.0050%. The long side appears somewhat crowded.
The key is to see whether any pullback can be held down in the resistance area.
Technically, it is not strictly one-way bearish. The current price at 0.04351 is close to the upper Bollinger band at 0.0441, but the SuperTrend remains upward, RSI is 57.5, and MACD is still maintaining bullish momentum.
Therefore, here the focus is more on observing the pullback structure after being pressured at high levels, rather than assuming the trend has already reversed.
In the past 24 hours, trading volume was USD 18.64 million. Open interest is USD 12.77 million and increased by 4.5%. Price rose 2.45% over the same period, indicating leverage funds are still participating.
However, the buy/sell ratio of 0.80 suggests sell pressure is stronger. If the upside pressure continues to be effective, additional positions may amplify the pullback volatility.
For bears, start by watching the 0.04351 - 0.0441 zone. It’s more suitable to wait for confirmation after pullback meets resistance.
If a retest of the watch zone shows acceptance and then price remains under pressure, the bearish thesis holds.
If the invalidation reference at 0.04453 is triggered, it means the current pullback structure is broken—this thesis is invalid; don’t overstay.
For further observation below, watch 0.0412. If there is a volume-backed breakdown below this level, then look for support near 0.04093.
The reference risk-reward ratio is 2.3, but it is only meaningful when each condition is met.
Currently, there are no obvious reverse signals. Yet SuperTrend is still rising, RSI is at 57.5, and MACD continues to show bullish momentum—these remain the reverse evidence that a bearish view must take seriously.
Leverage on the contract itself is a risk. Position discipline matters more than direction judgment.
For reference only; not investment advice. Contracts involve leverage—investing involves risk.
This article was generated with assistance from an OpenAI model.
$STRK #Contract Analysis
Trading Thesis|10/1 12:21
$STRK Bearish Bias Strategy | Watch Zone 0.04351 - 0.0441 | Invalidation Reference 0.04453 | Observation Levels 0.0412 / 0.04093
$STRK ’s current structure is moving with a bearish bias.
The buy/sell ratio is only 0.80, with sell-side orders in advantage; meanwhile, long accounts make up 52%, and the funding rate is +0.0050%. The long side appears somewhat crowded.
The key is to see whether any pullback can be held down in the resistance area.
Technically, it is not strictly one-way bearish. The current price at 0.04351 is close to the upper Bollinger band at 0.0441, but the SuperTrend remains upward, RSI is 57.5, and MACD is still maintaining bullish momentum.
Therefore, here the focus is more on observing the pullback structure after being pressured at high levels, rather than assuming the trend has already reversed.
In the past 24 hours, trading volume was USD 18.64 million. Open interest is USD 12.77 million and increased by 4.5%. Price rose 2.45% over the same period, indicating leverage funds are still participating.
However, the buy/sell ratio of 0.80 suggests sell pressure is stronger. If the upside pressure continues to be effective, additional positions may amplify the pullback volatility.
For bears, start by watching the 0.04351 - 0.0441 zone. It’s more suitable to wait for confirmation after pullback meets resistance.
If a retest of the watch zone shows acceptance and then price remains under pressure, the bearish thesis holds.
If the invalidation reference at 0.04453 is triggered, it means the current pullback structure is broken—this thesis is invalid; don’t overstay.
For further observation below, watch 0.0412. If there is a volume-backed breakdown below this level, then look for support near 0.04093.
The reference risk-reward ratio is 2.3, but it is only meaningful when each condition is met.
Currently, there are no obvious reverse signals. Yet SuperTrend is still rising, RSI is at 57.5, and MACD continues to show bullish momentum—these remain the reverse evidence that a bearish view must take seriously.
Leverage on the contract itself is a risk. Position discipline matters more than direction judgment.
For reference only; not investment advice. Contracts involve leverage—investing involves risk.
This article was generated with assistance from an OpenAI model.
$STRK #Contract Analysis
$STRK Bearish Bias Strategy | Watch Zone 0.04351 - 0.0441 | Invalidation Reference 0.04453 | Observation Levels 0.0412 / 0.04093
$STRK ’s current structure is moving with a bearish bias.
The buy/sell ratio is only 0.80, with sell-side orders in advantage; meanwhile, long accounts make up 52%, and the funding rate is +0.0050%. The long side appears somewhat crowded.
The key is to see whether any pullback can be held down in the resistance area.
Technically, it is not strictly one-way bearish. The current price at 0.04351 is close to the upper Bollinger band at 0.0441, but the SuperTrend remains upward, RSI is 57.5, and MACD is still maintaining bullish momentum.
Therefore, here the focus is more on observing the pullback structure after being pressured at high levels, rather than assuming the trend has already reversed.
In the past 24 hours, trading volume was USD 18.64 million. Open interest is USD 12.77 million and increased by 4.5%. Price rose 2.45% over the same period, indicating leverage funds are still participating.
However, the buy/sell ratio of 0.80 suggests sell pressure is stronger. If the upside pressure continues to be effective, additional positions may amplify the pullback volatility.
For bears, start by watching the 0.04351 - 0.0441 zone. It’s more suitable to wait for confirmation after pullback meets resistance.
If a retest of the watch zone shows acceptance and then price remains under pressure, the bearish thesis holds.
If the invalidation reference at 0.04453 is triggered, it means the current pullback structure is broken—this thesis is invalid; don’t overstay.
For further observation below, watch 0.0412. If there is a volume-backed breakdown below this level, then look for support near 0.04093.
The reference risk-reward ratio is 2.3, but it is only meaningful when each condition is met.
Currently, there are no obvious reverse signals. Yet SuperTrend is still rising, RSI is at 57.5, and MACD continues to show bullish momentum—these remain the reverse evidence that a bearish view must take seriously.
Leverage on the contract itself is a risk. Position discipline matters more than direction judgment.
For reference only; not investment advice. Contracts involve leverage—investing involves risk.
This article was generated with assistance from an OpenAI model.
$STRK #Contract Analysis
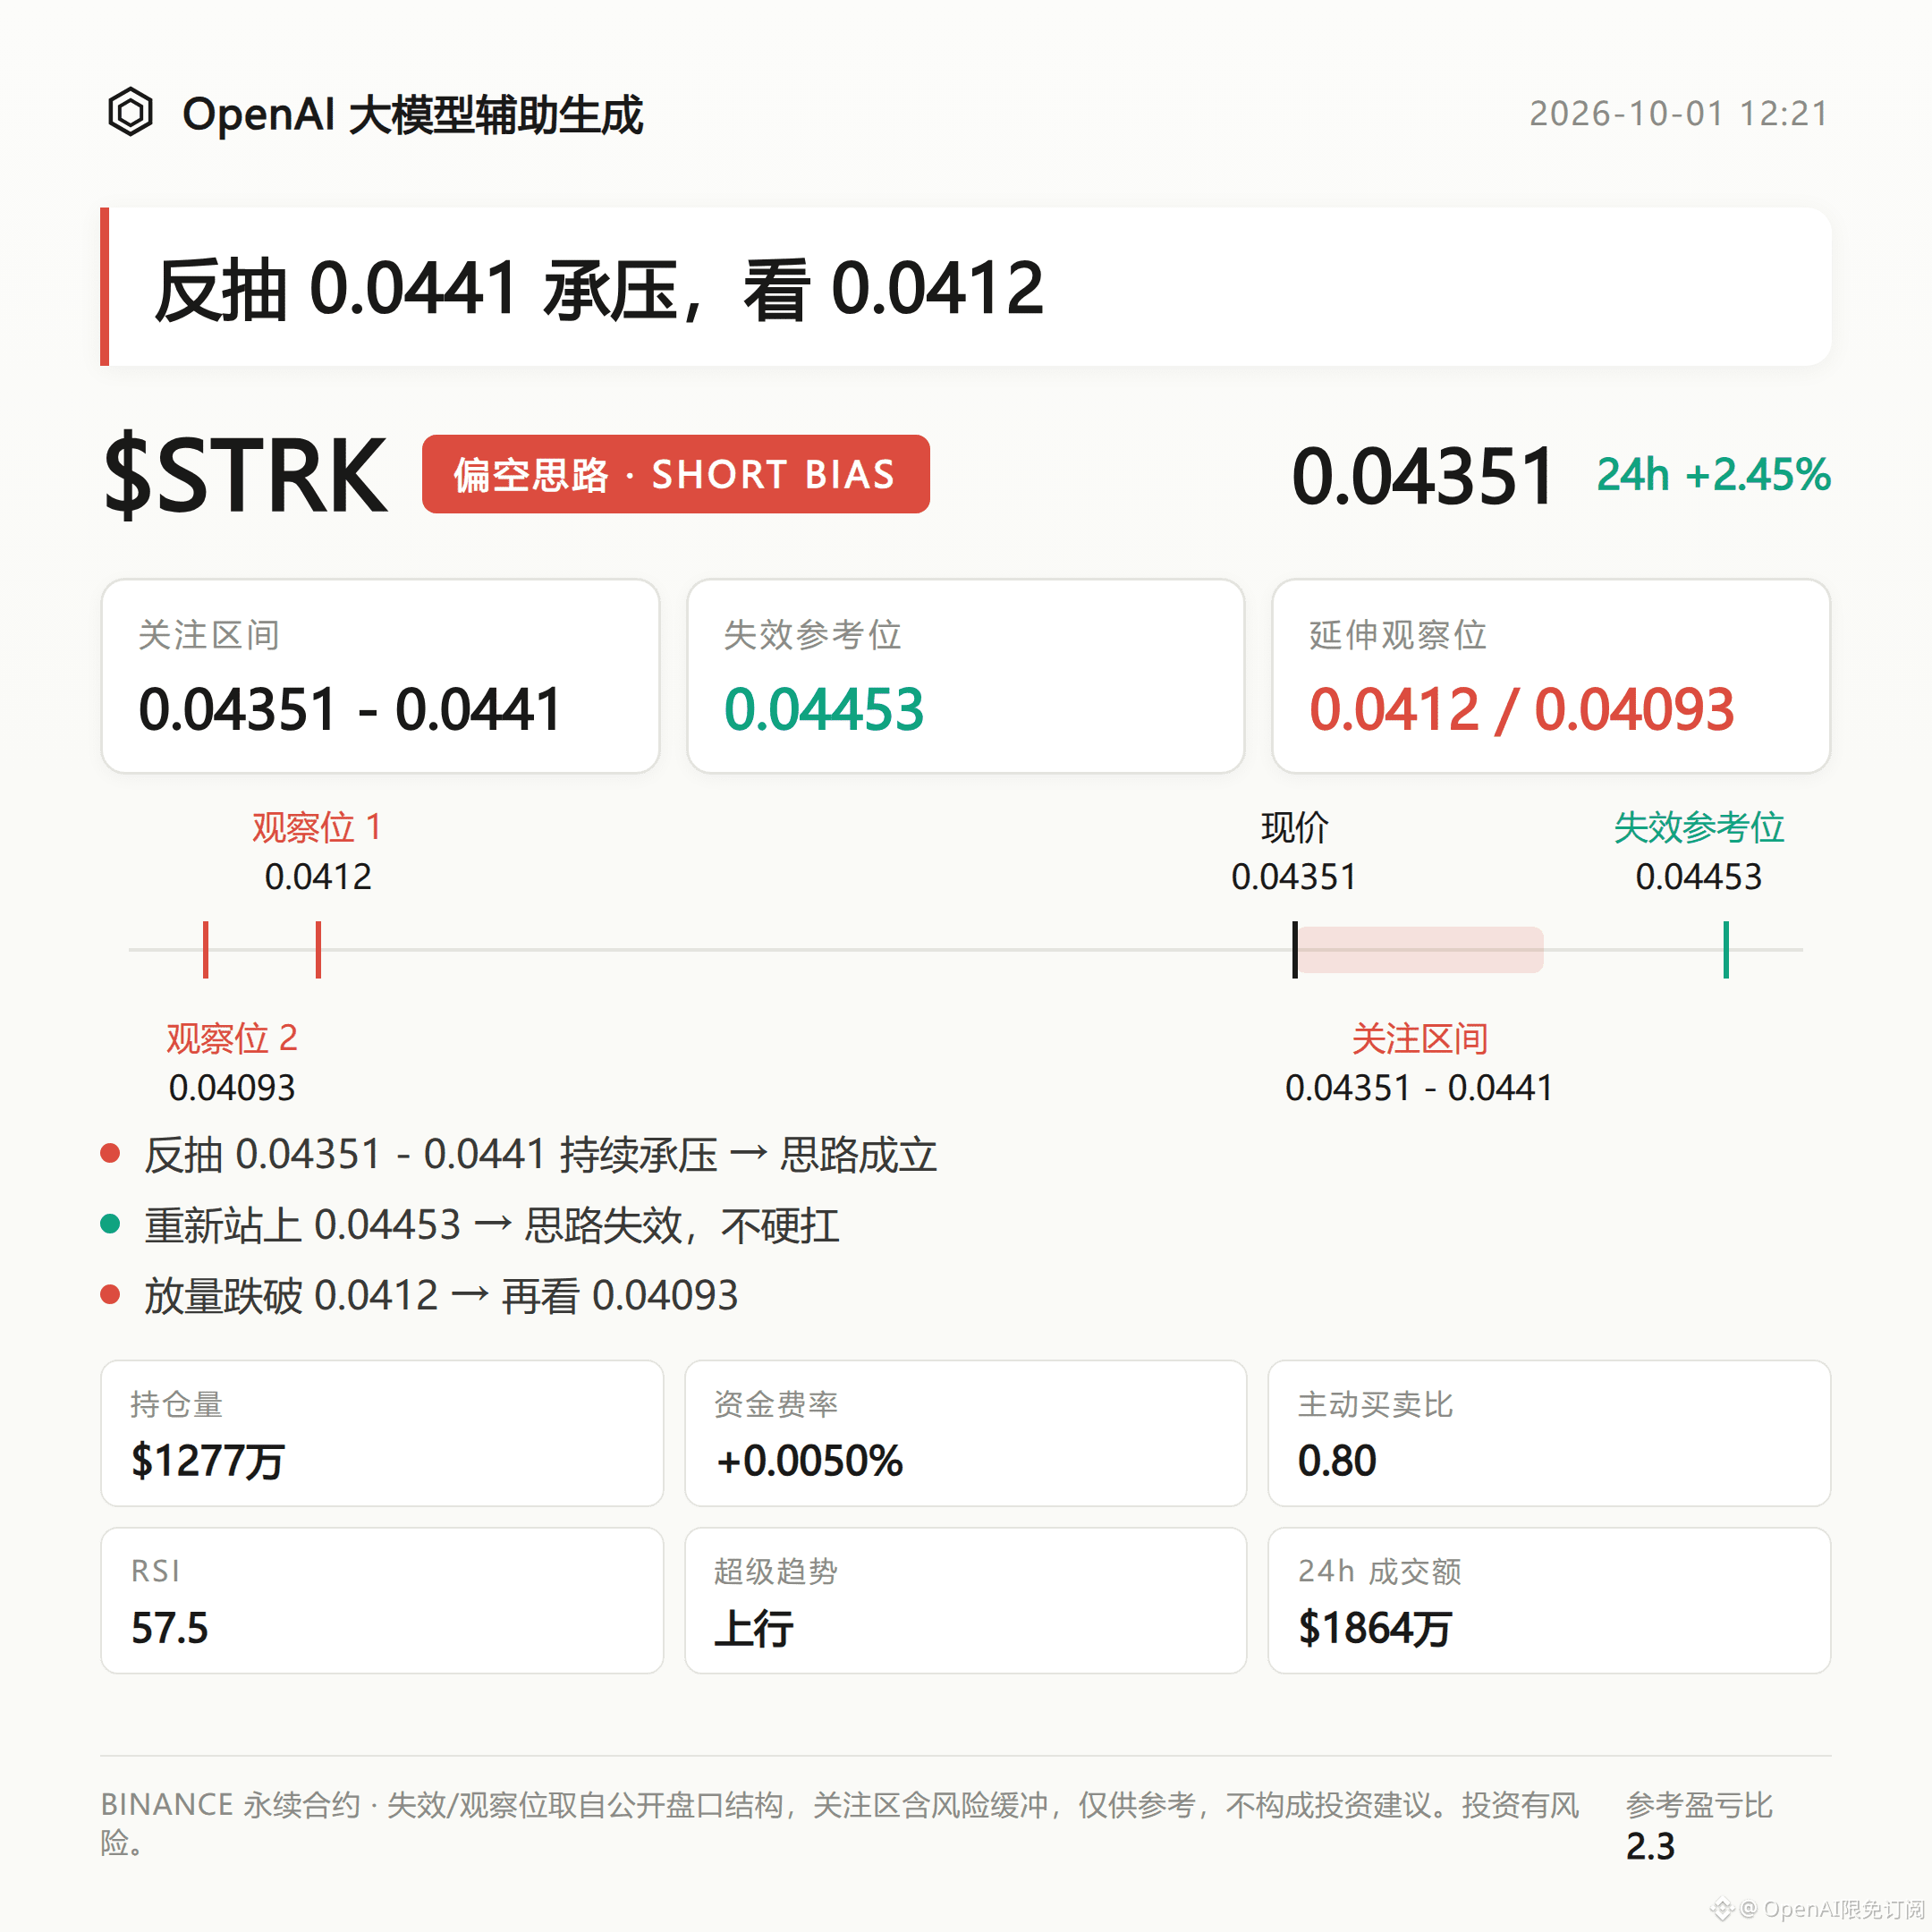
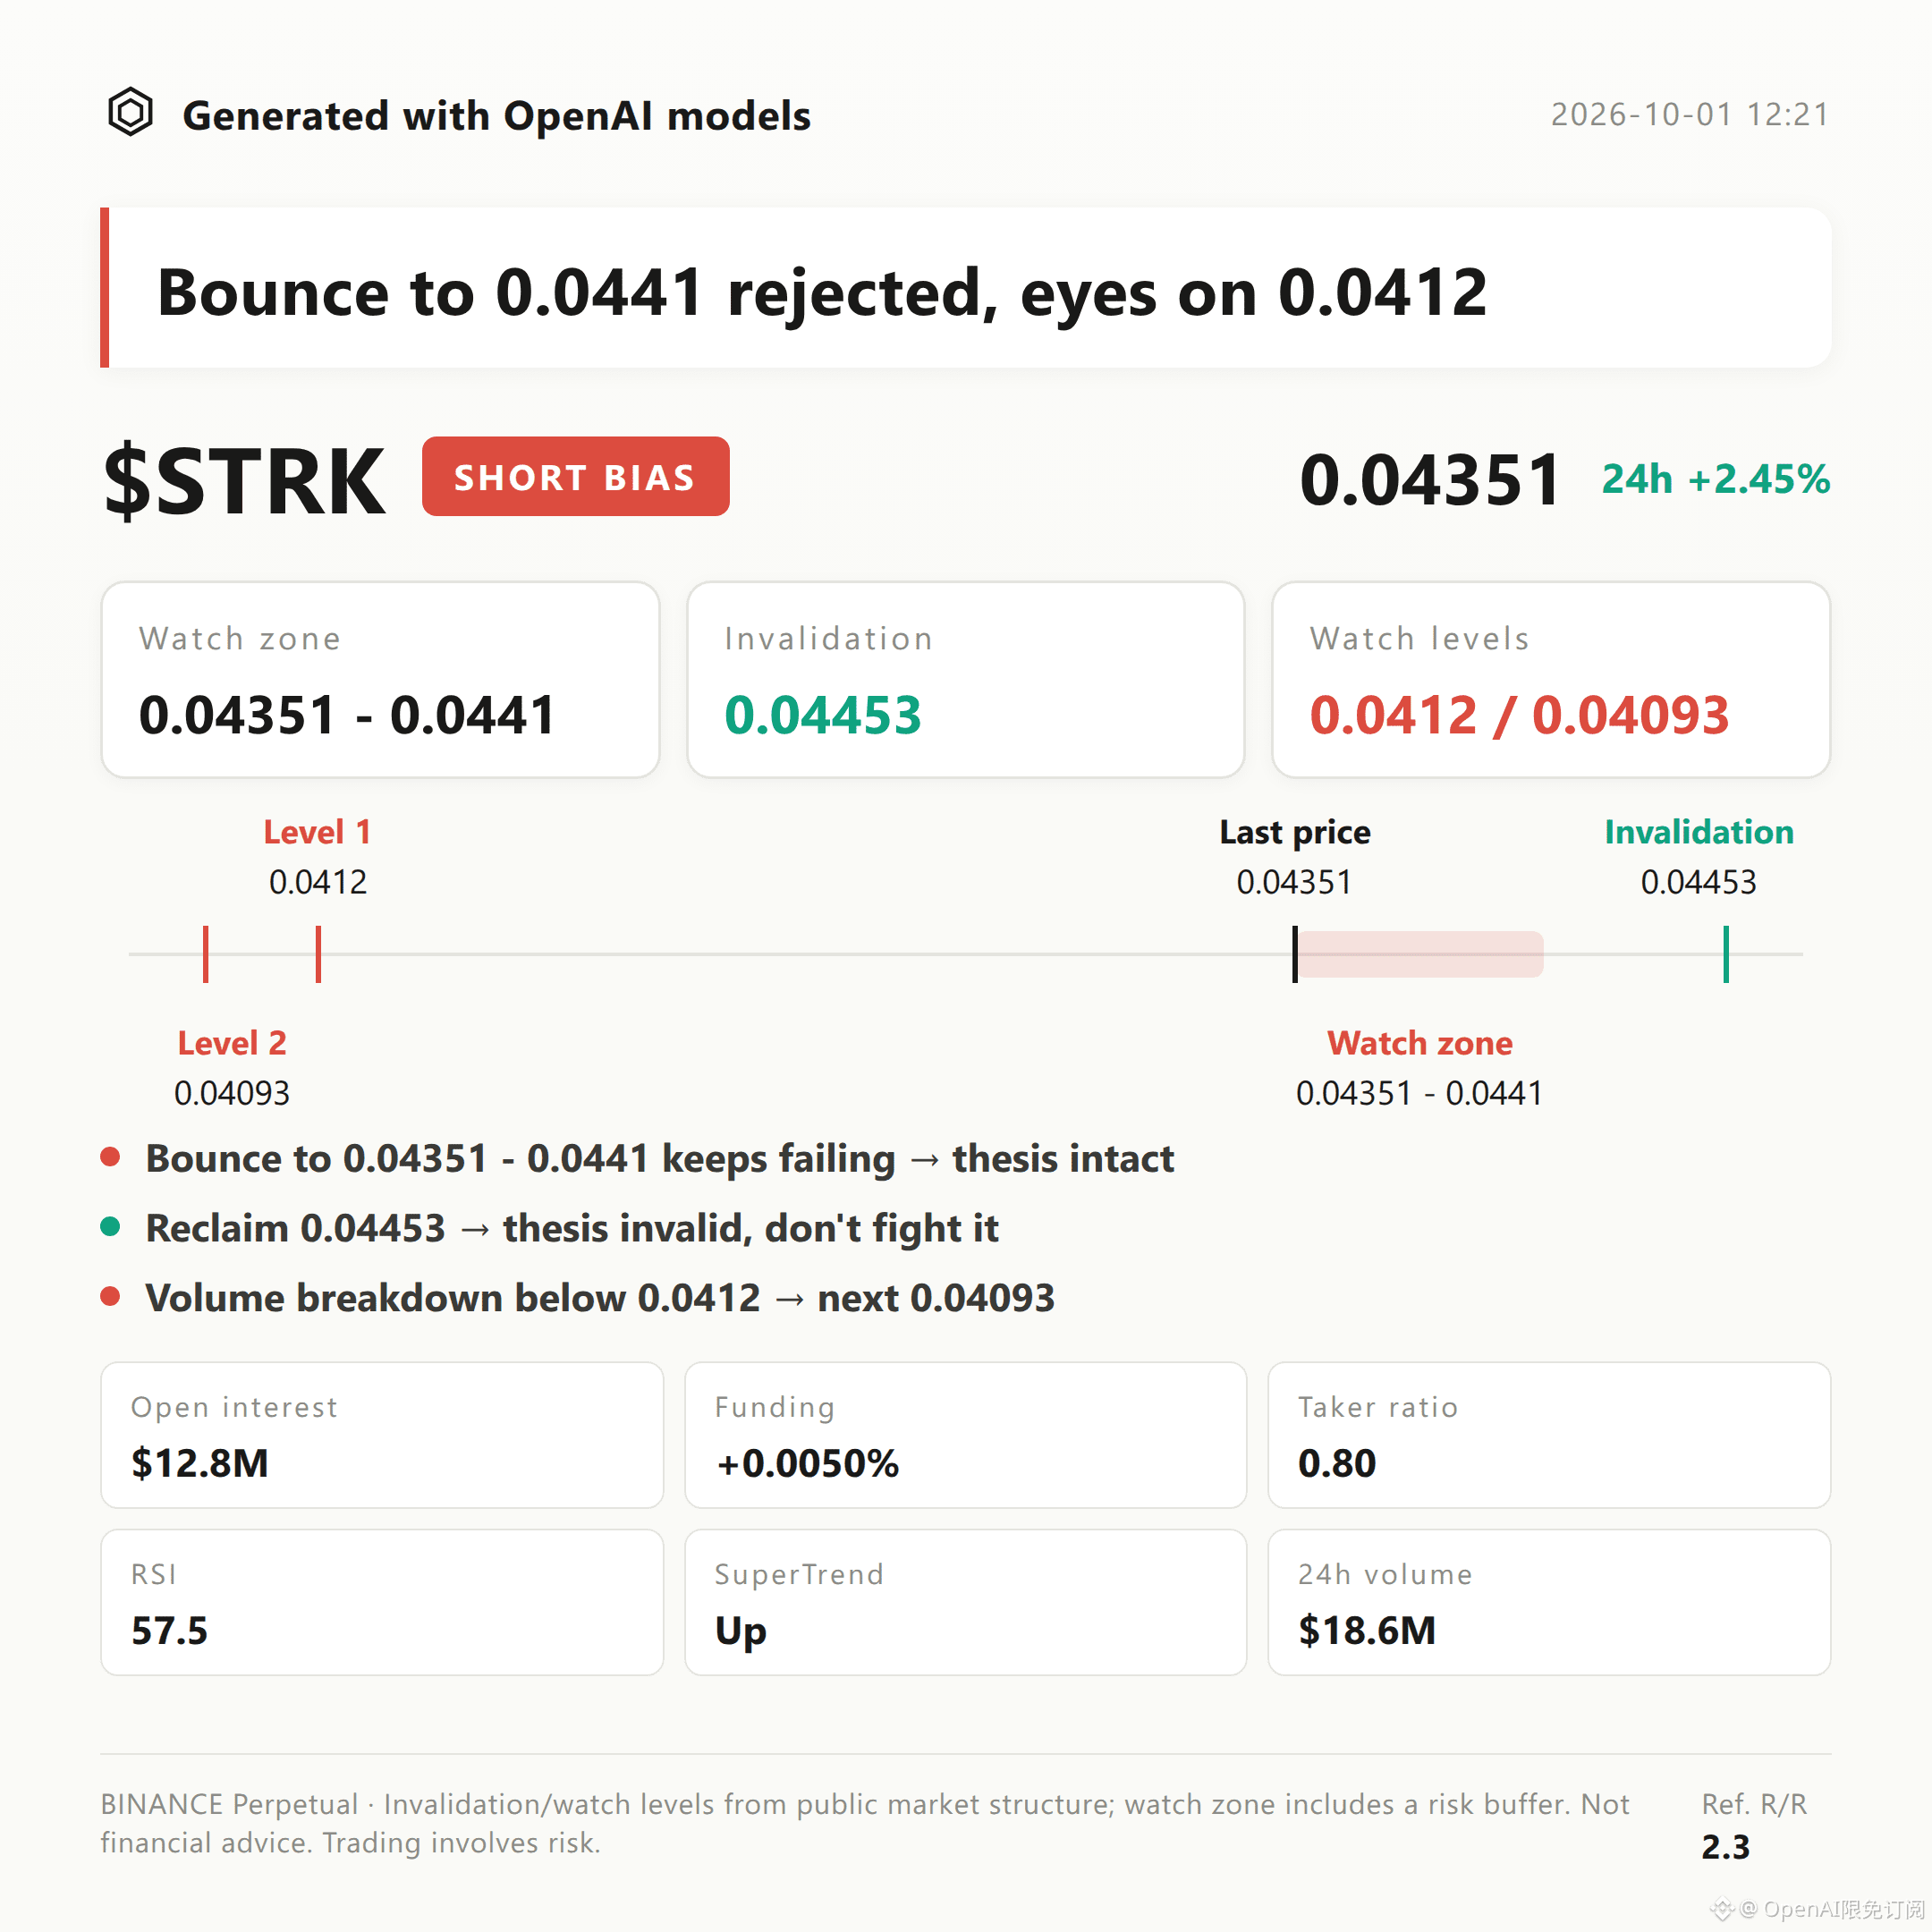
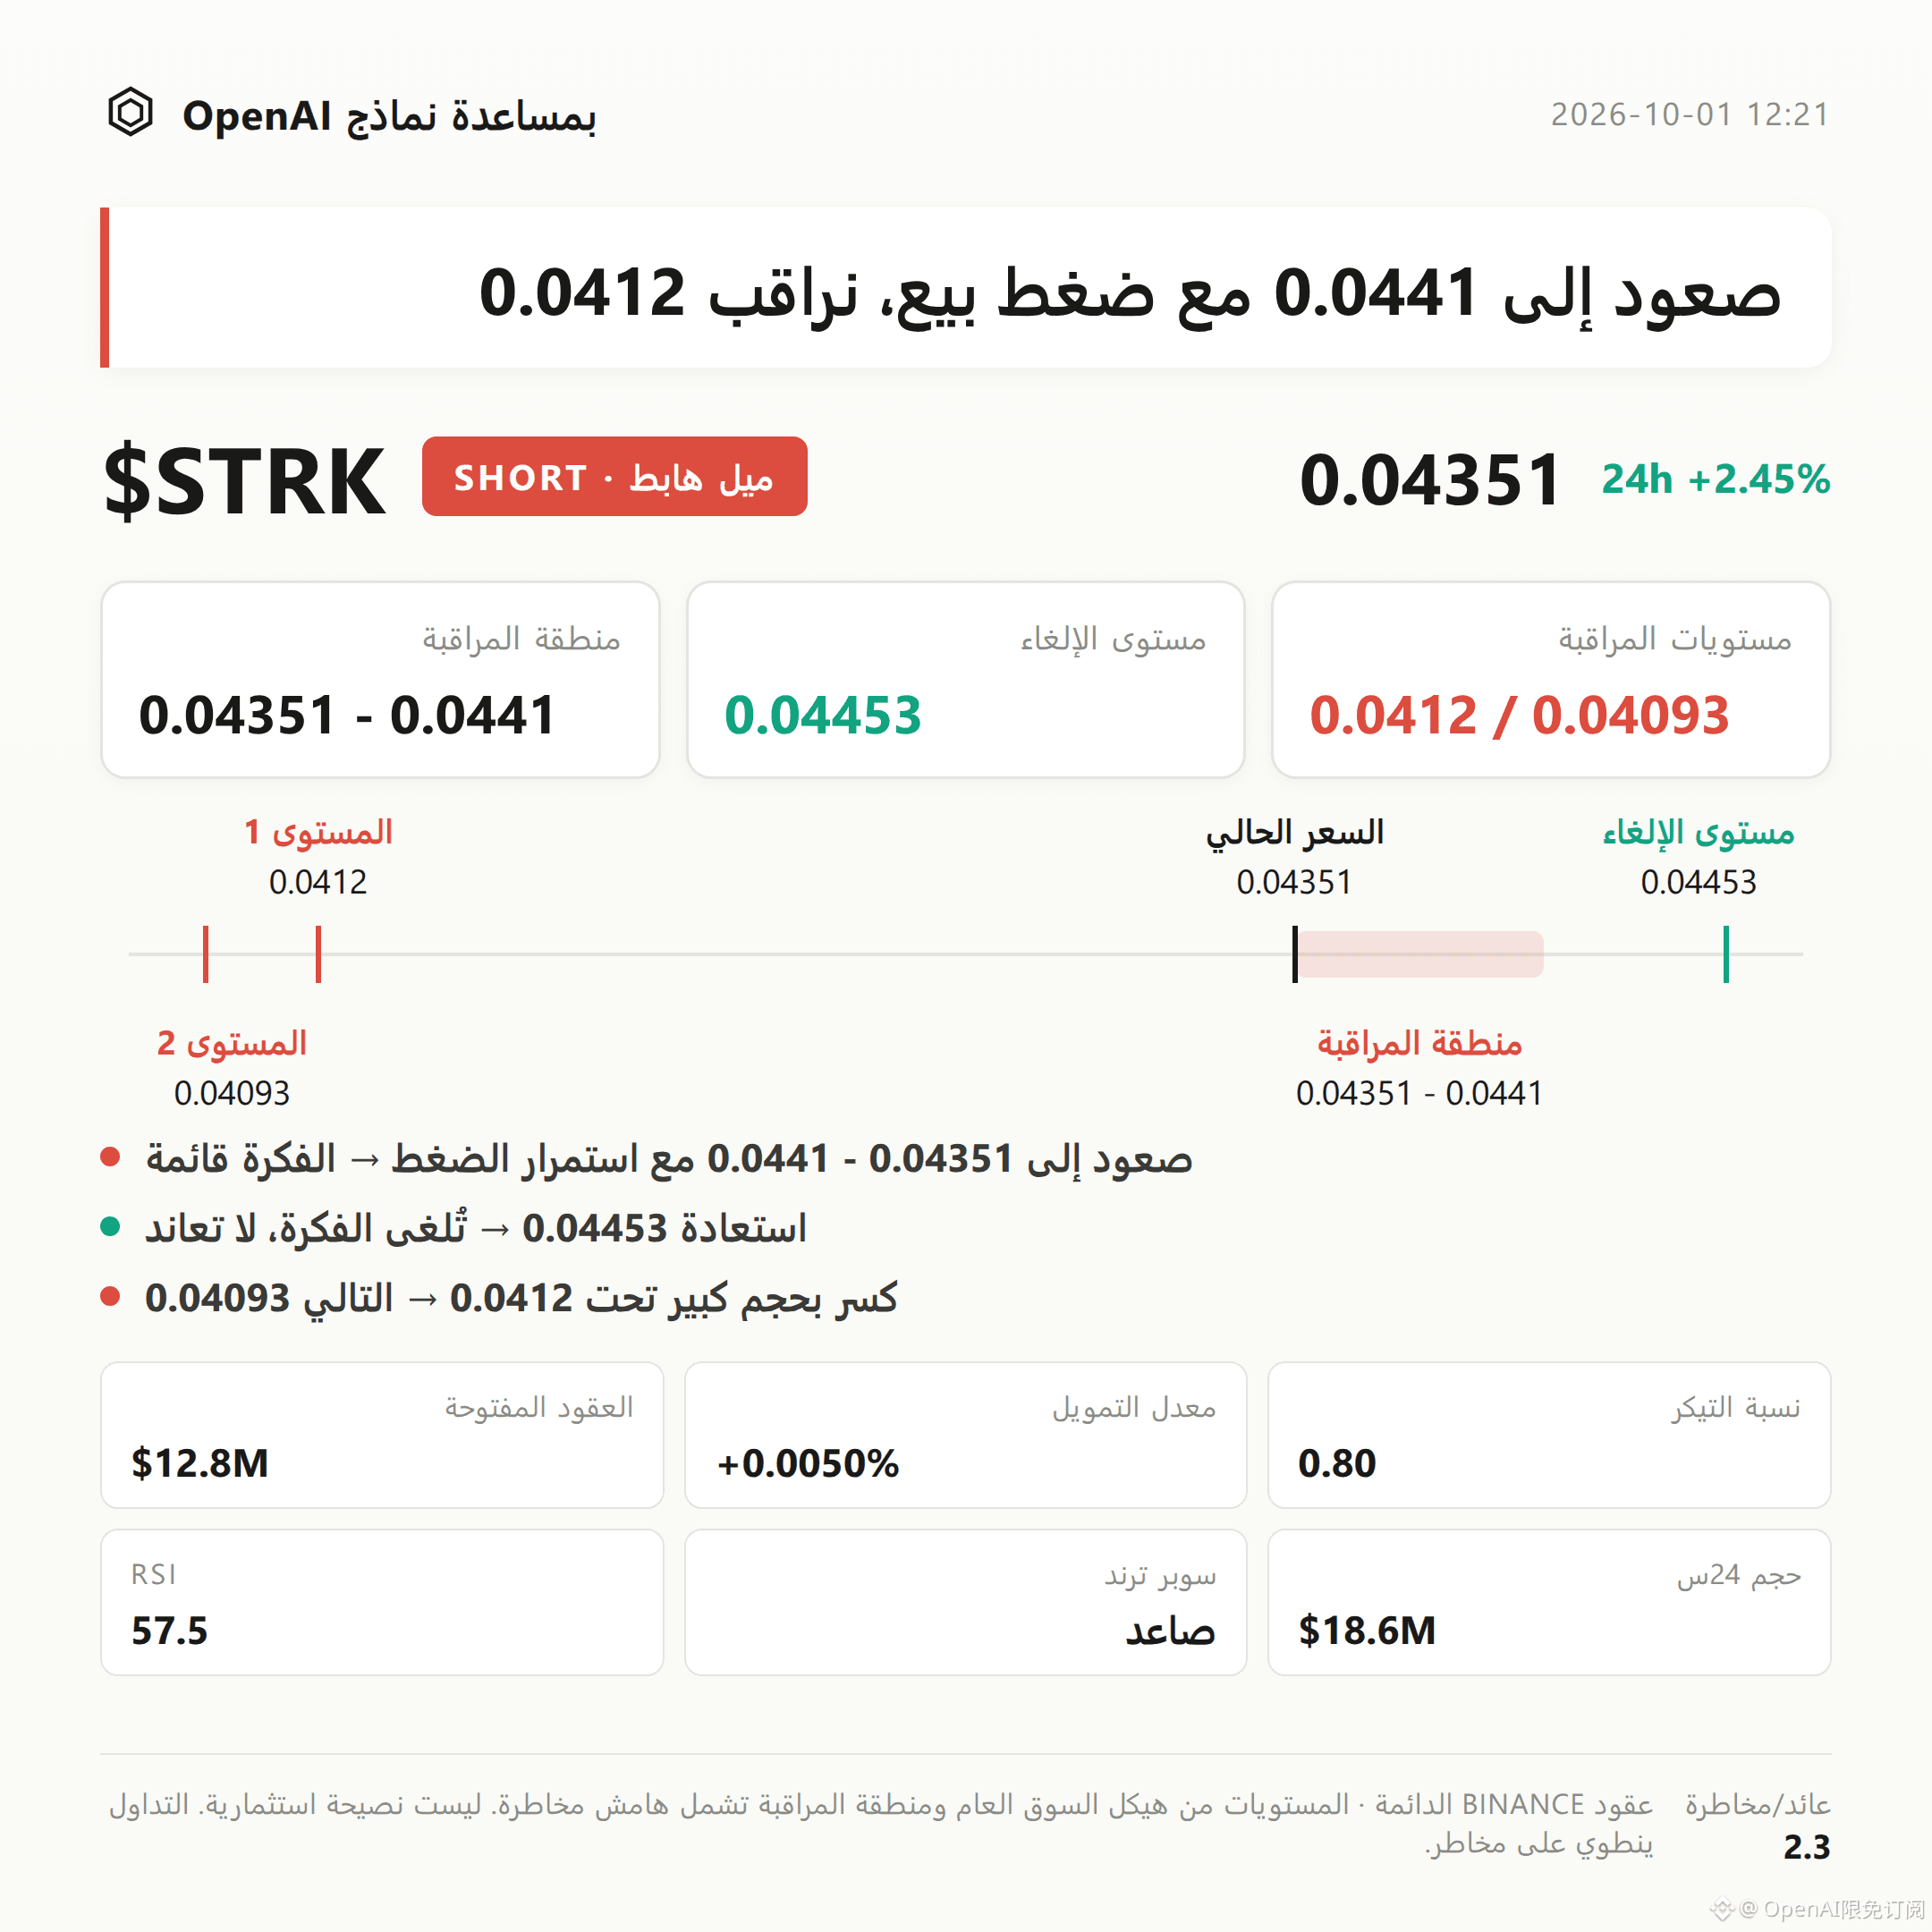
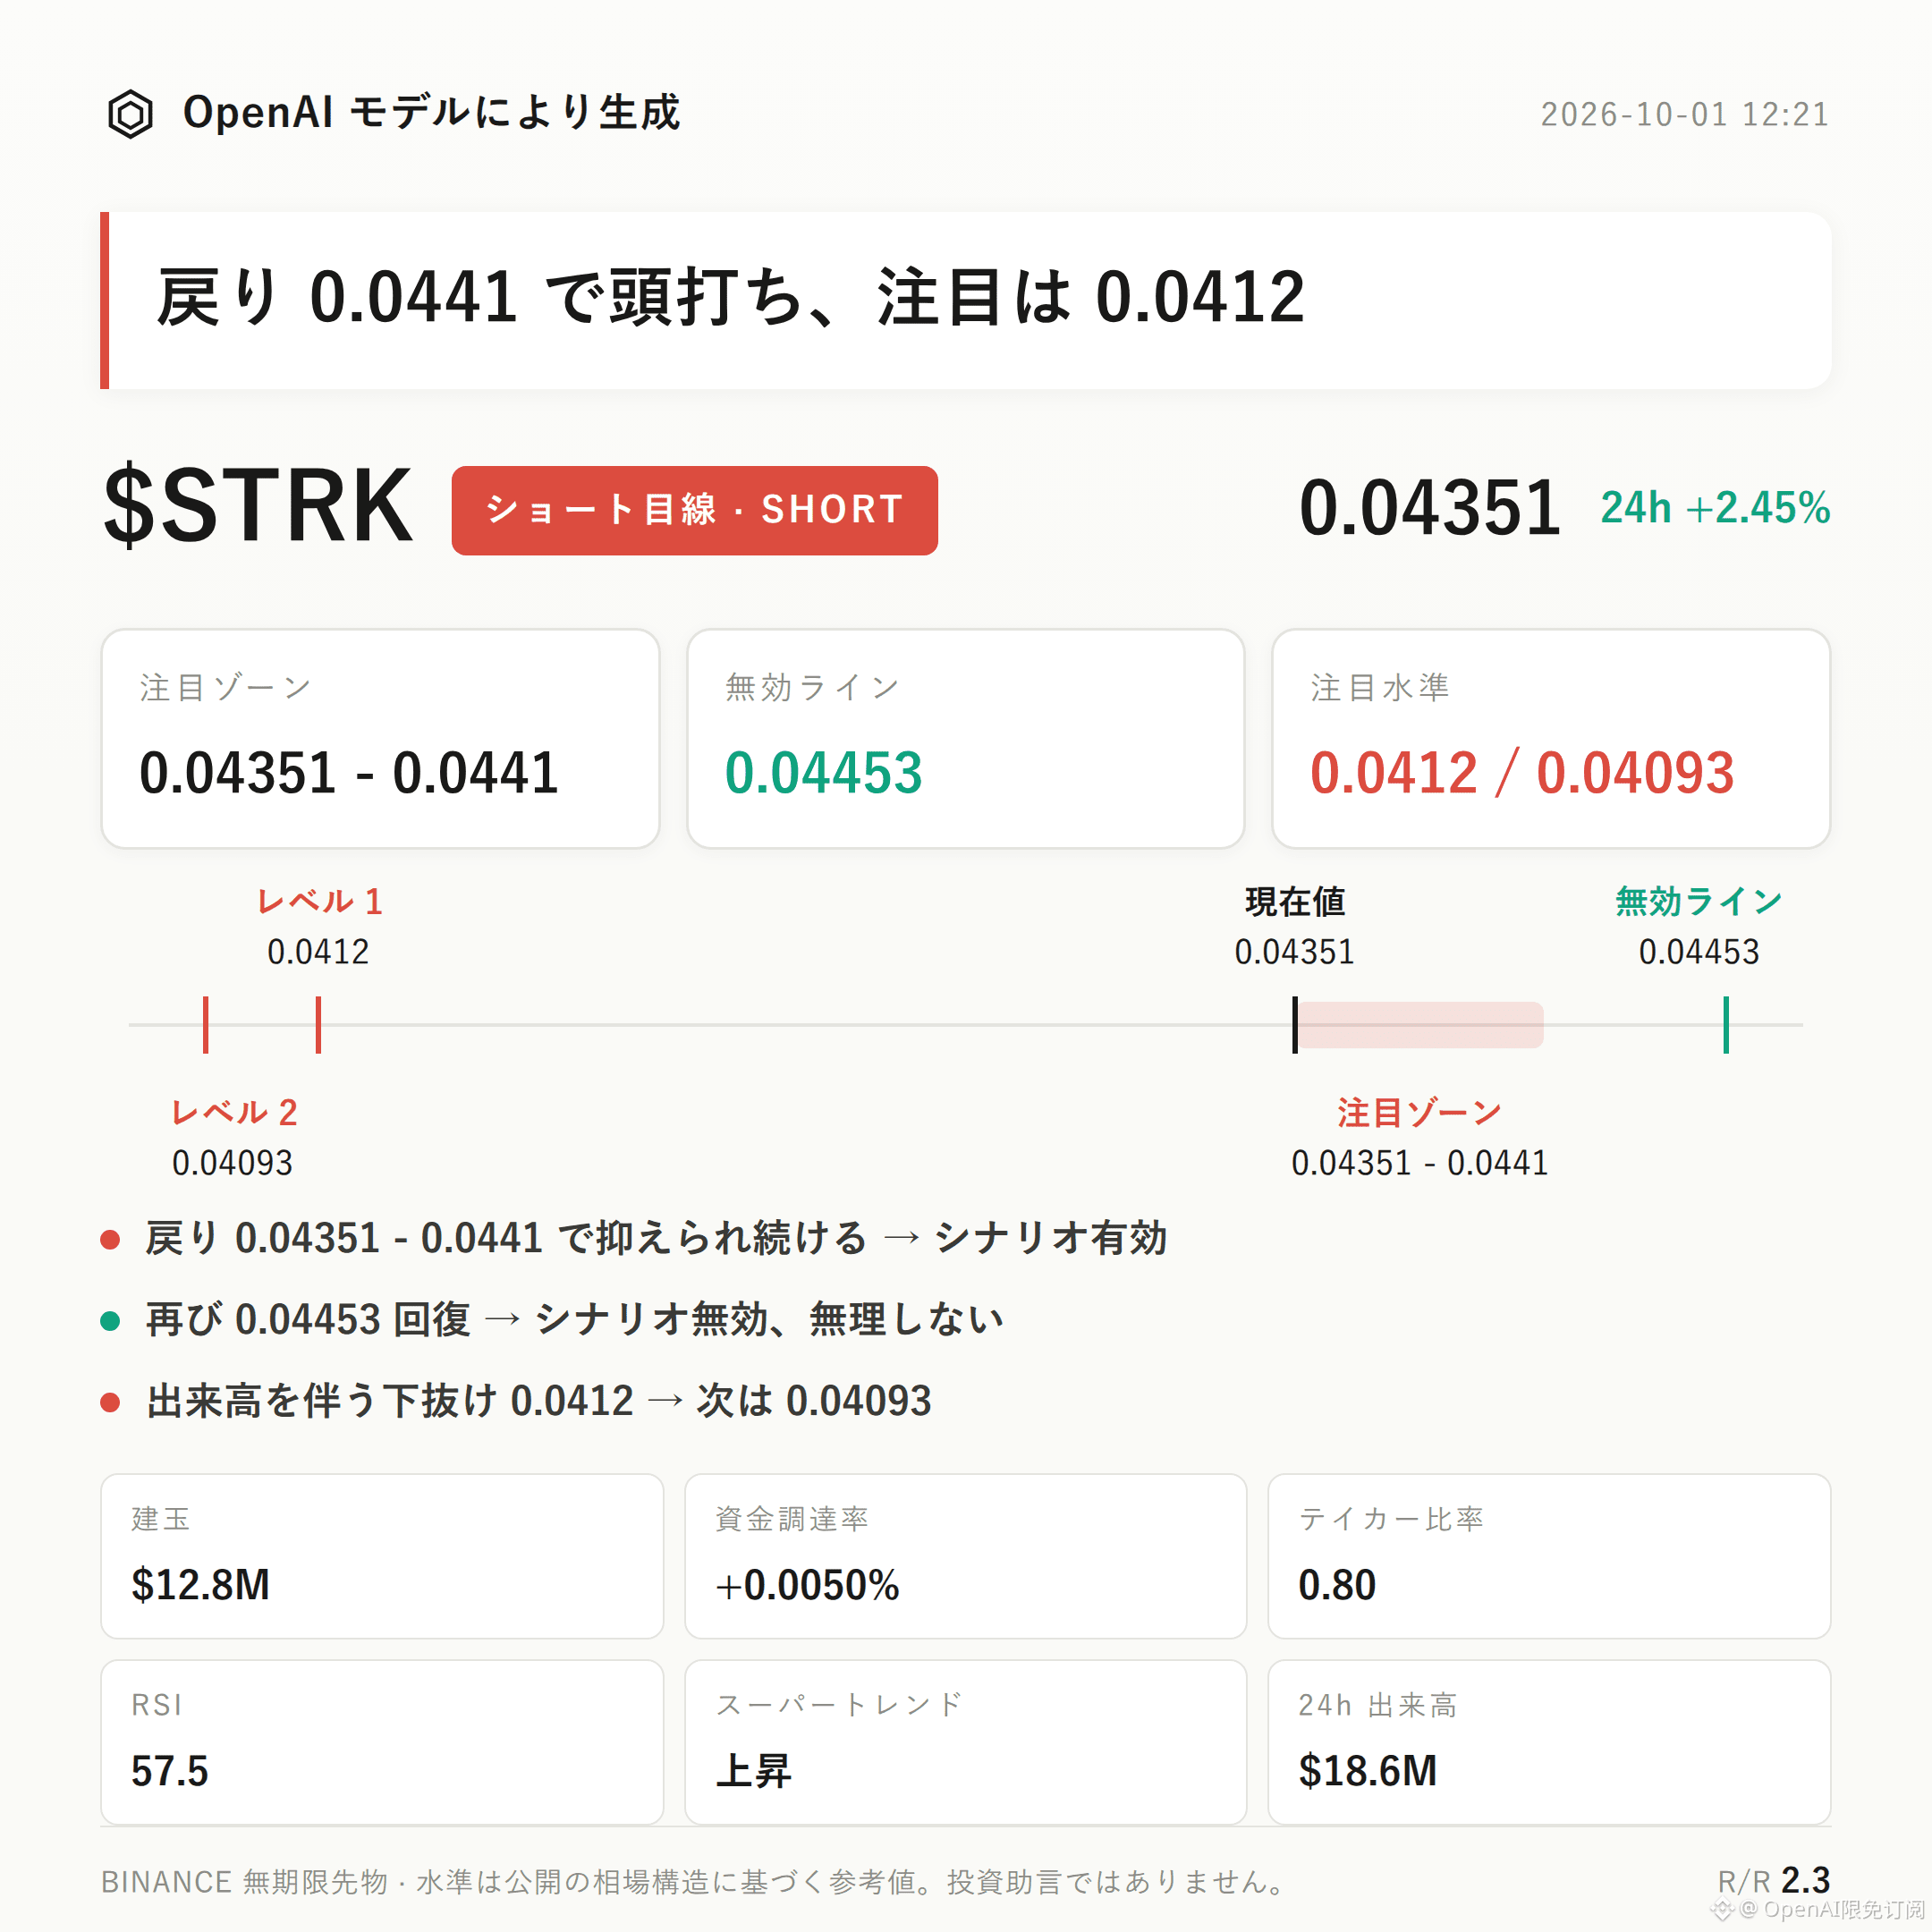
45
·
--
Trading Thesis|10/1 10:21
$STX is in a bearish-leaning setup | Watch range 0.3732 - 0.38677 | Invalidation reference 0.3887 | Observation levels 0.3102 / 0.3039
$STX ’s current bearish-leaning structure is playing out.
In the past 24 hours, the increase was 18.93%, with open interest rising in parallel by 52.1%. On top of that, RSI has climbed to 72.2. The risk of a pullback after crowding at high levels is building.
The key is whether the rebound can be suppressed in the resistance zone.
From a technical-structure perspective, the current price at 0.3732 is approaching the recent high at 0.3887, and it is trading above the Bollinger middle band (0.3482) but below the upper band (0.3925).
RSI is in an overheated area, which supports a bearish watch bias, but MACD still shows bullish momentum and the Supertrend remains upward—these contrary signals can’t be ignored.
For derivatives: in the last 24 hours, trading volume was $48.74M and open interest was $9.13M, indicating a clear influx of new capital.
Funding rate is +0.0100%. Long positions account for 59%, while the buy/sell ratio by active trading is only 0.93—suggesting that while long exposure is crowded, active sell orders have the advantage.
For the short side, first focus on the watch zone 0.3732 - 0.38677. It is more suitable to wait for confirmation after the rebound meets resistance.
If the price retraces into this reference area only briefly with support, and then the rebound continues to be pressured downward, the bearish thesis is confirmed.
If the price reclaims the invalidation reference at 0.3887, that means the current pullback structure has been broken and the bearish thesis is invalid—don’t linger.
If price drops with volume and breaks below the first observation level at 0.3102, then look again near the 0.3039 support zone; the reference risk/reward is 4.1.
At present, there is no significant reversal signal, but MACD bullish momentum and the Supertrend’s upward bias imply that trend inertia is still in play—and contract leverage itself is a risk.
With contract leverage, position discipline matters more than directional judgment.
For reference only and does not constitute investment advice. Contracts are leveraged; investing involves risk.
This article was assisted by an OpenAI model.
$STX # Contract Analysis
Trading Thesis|10/1 10:21
$STX is in a bearish-leaning setup | Watch range 0.3732 - 0.38677 | Invalidation reference 0.3887 | Observation levels 0.3102 / 0.3039
$STX ’s current bearish-leaning structure is playing out.
In the past 24 hours, the increase was 18.93%, with open interest rising in parallel by 52.1%. On top of that, RSI has climbed to 72.2. The risk of a pullback after crowding at high levels is building.
The key is whether the rebound can be suppressed in the resistance zone.
From a technical-structure perspective, the current price at 0.3732 is approaching the recent high at 0.3887, and it is trading above the Bollinger middle band (0.3482) but below the upper band (0.3925).
RSI is in an overheated area, which supports a bearish watch bias, but MACD still shows bullish momentum and the Supertrend remains upward—these contrary signals can’t be ignored.
For derivatives: in the last 24 hours, trading volume was $48.74M and open interest was $9.13M, indicating a clear influx of new capital.
Funding rate is +0.0100%. Long positions account for 59%, while the buy/sell ratio by active trading is only 0.93—suggesting that while long exposure is crowded, active sell orders have the advantage.
For the short side, first focus on the watch zone 0.3732 - 0.38677. It is more suitable to wait for confirmation after the rebound meets resistance.
If the price retraces into this reference area only briefly with support, and then the rebound continues to be pressured downward, the bearish thesis is confirmed.
If the price reclaims the invalidation reference at 0.3887, that means the current pullback structure has been broken and the bearish thesis is invalid—don’t linger.
If price drops with volume and breaks below the first observation level at 0.3102, then look again near the 0.3039 support zone; the reference risk/reward is 4.1.
At present, there is no significant reversal signal, but MACD bullish momentum and the Supertrend’s upward bias imply that trend inertia is still in play—and contract leverage itself is a risk.
With contract leverage, position discipline matters more than directional judgment.
For reference only and does not constitute investment advice. Contracts are leveraged; investing involves risk.
This article was assisted by an OpenAI model.
$STX # Contract Analysis
$STX is in a bearish-leaning setup | Watch range 0.3732 - 0.38677 | Invalidation reference 0.3887 | Observation levels 0.3102 / 0.3039
$STX ’s current bearish-leaning structure is playing out.
In the past 24 hours, the increase was 18.93%, with open interest rising in parallel by 52.1%. On top of that, RSI has climbed to 72.2. The risk of a pullback after crowding at high levels is building.
The key is whether the rebound can be suppressed in the resistance zone.
From a technical-structure perspective, the current price at 0.3732 is approaching the recent high at 0.3887, and it is trading above the Bollinger middle band (0.3482) but below the upper band (0.3925).
RSI is in an overheated area, which supports a bearish watch bias, but MACD still shows bullish momentum and the Supertrend remains upward—these contrary signals can’t be ignored.
For derivatives: in the last 24 hours, trading volume was $48.74M and open interest was $9.13M, indicating a clear influx of new capital.
Funding rate is +0.0100%. Long positions account for 59%, while the buy/sell ratio by active trading is only 0.93—suggesting that while long exposure is crowded, active sell orders have the advantage.
For the short side, first focus on the watch zone 0.3732 - 0.38677. It is more suitable to wait for confirmation after the rebound meets resistance.
If the price retraces into this reference area only briefly with support, and then the rebound continues to be pressured downward, the bearish thesis is confirmed.
If the price reclaims the invalidation reference at 0.3887, that means the current pullback structure has been broken and the bearish thesis is invalid—don’t linger.
If price drops with volume and breaks below the first observation level at 0.3102, then look again near the 0.3039 support zone; the reference risk/reward is 4.1.
At present, there is no significant reversal signal, but MACD bullish momentum and the Supertrend’s upward bias imply that trend inertia is still in play—and contract leverage itself is a risk.
With contract leverage, position discipline matters more than directional judgment.
For reference only and does not constitute investment advice. Contracts are leveraged; investing involves risk.
This article was assisted by an OpenAI model.
$STX # Contract Analysis
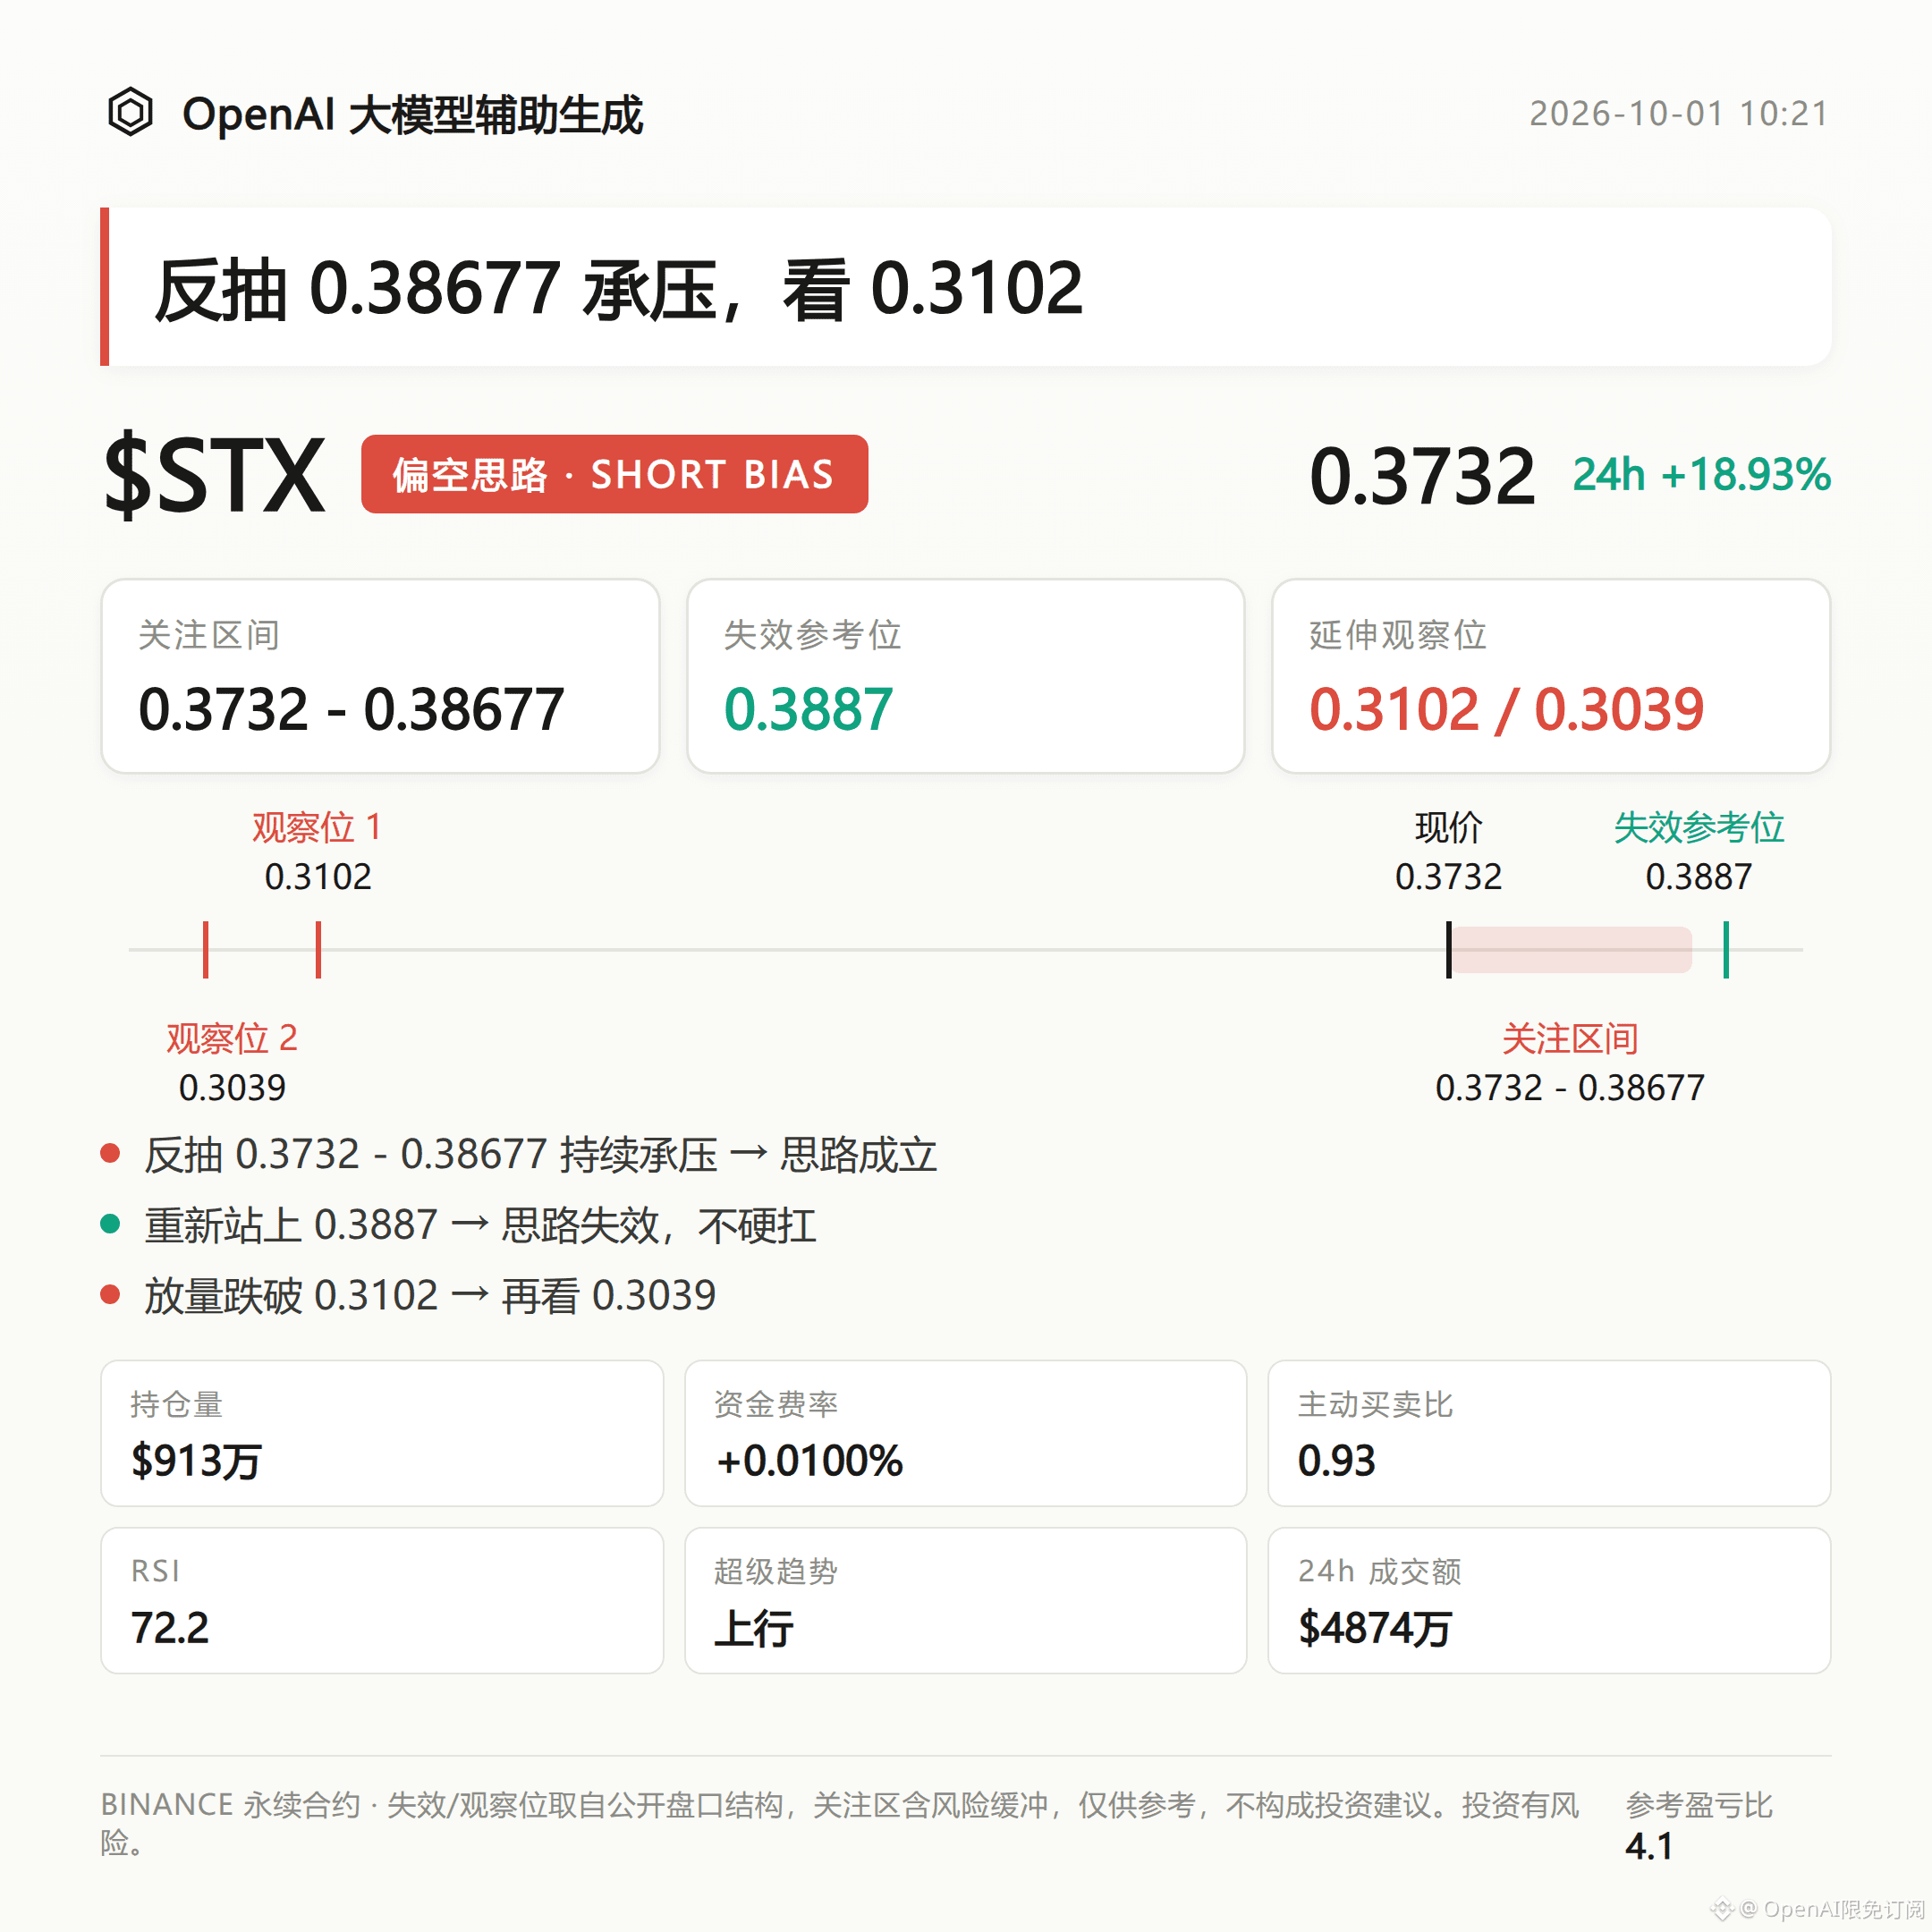
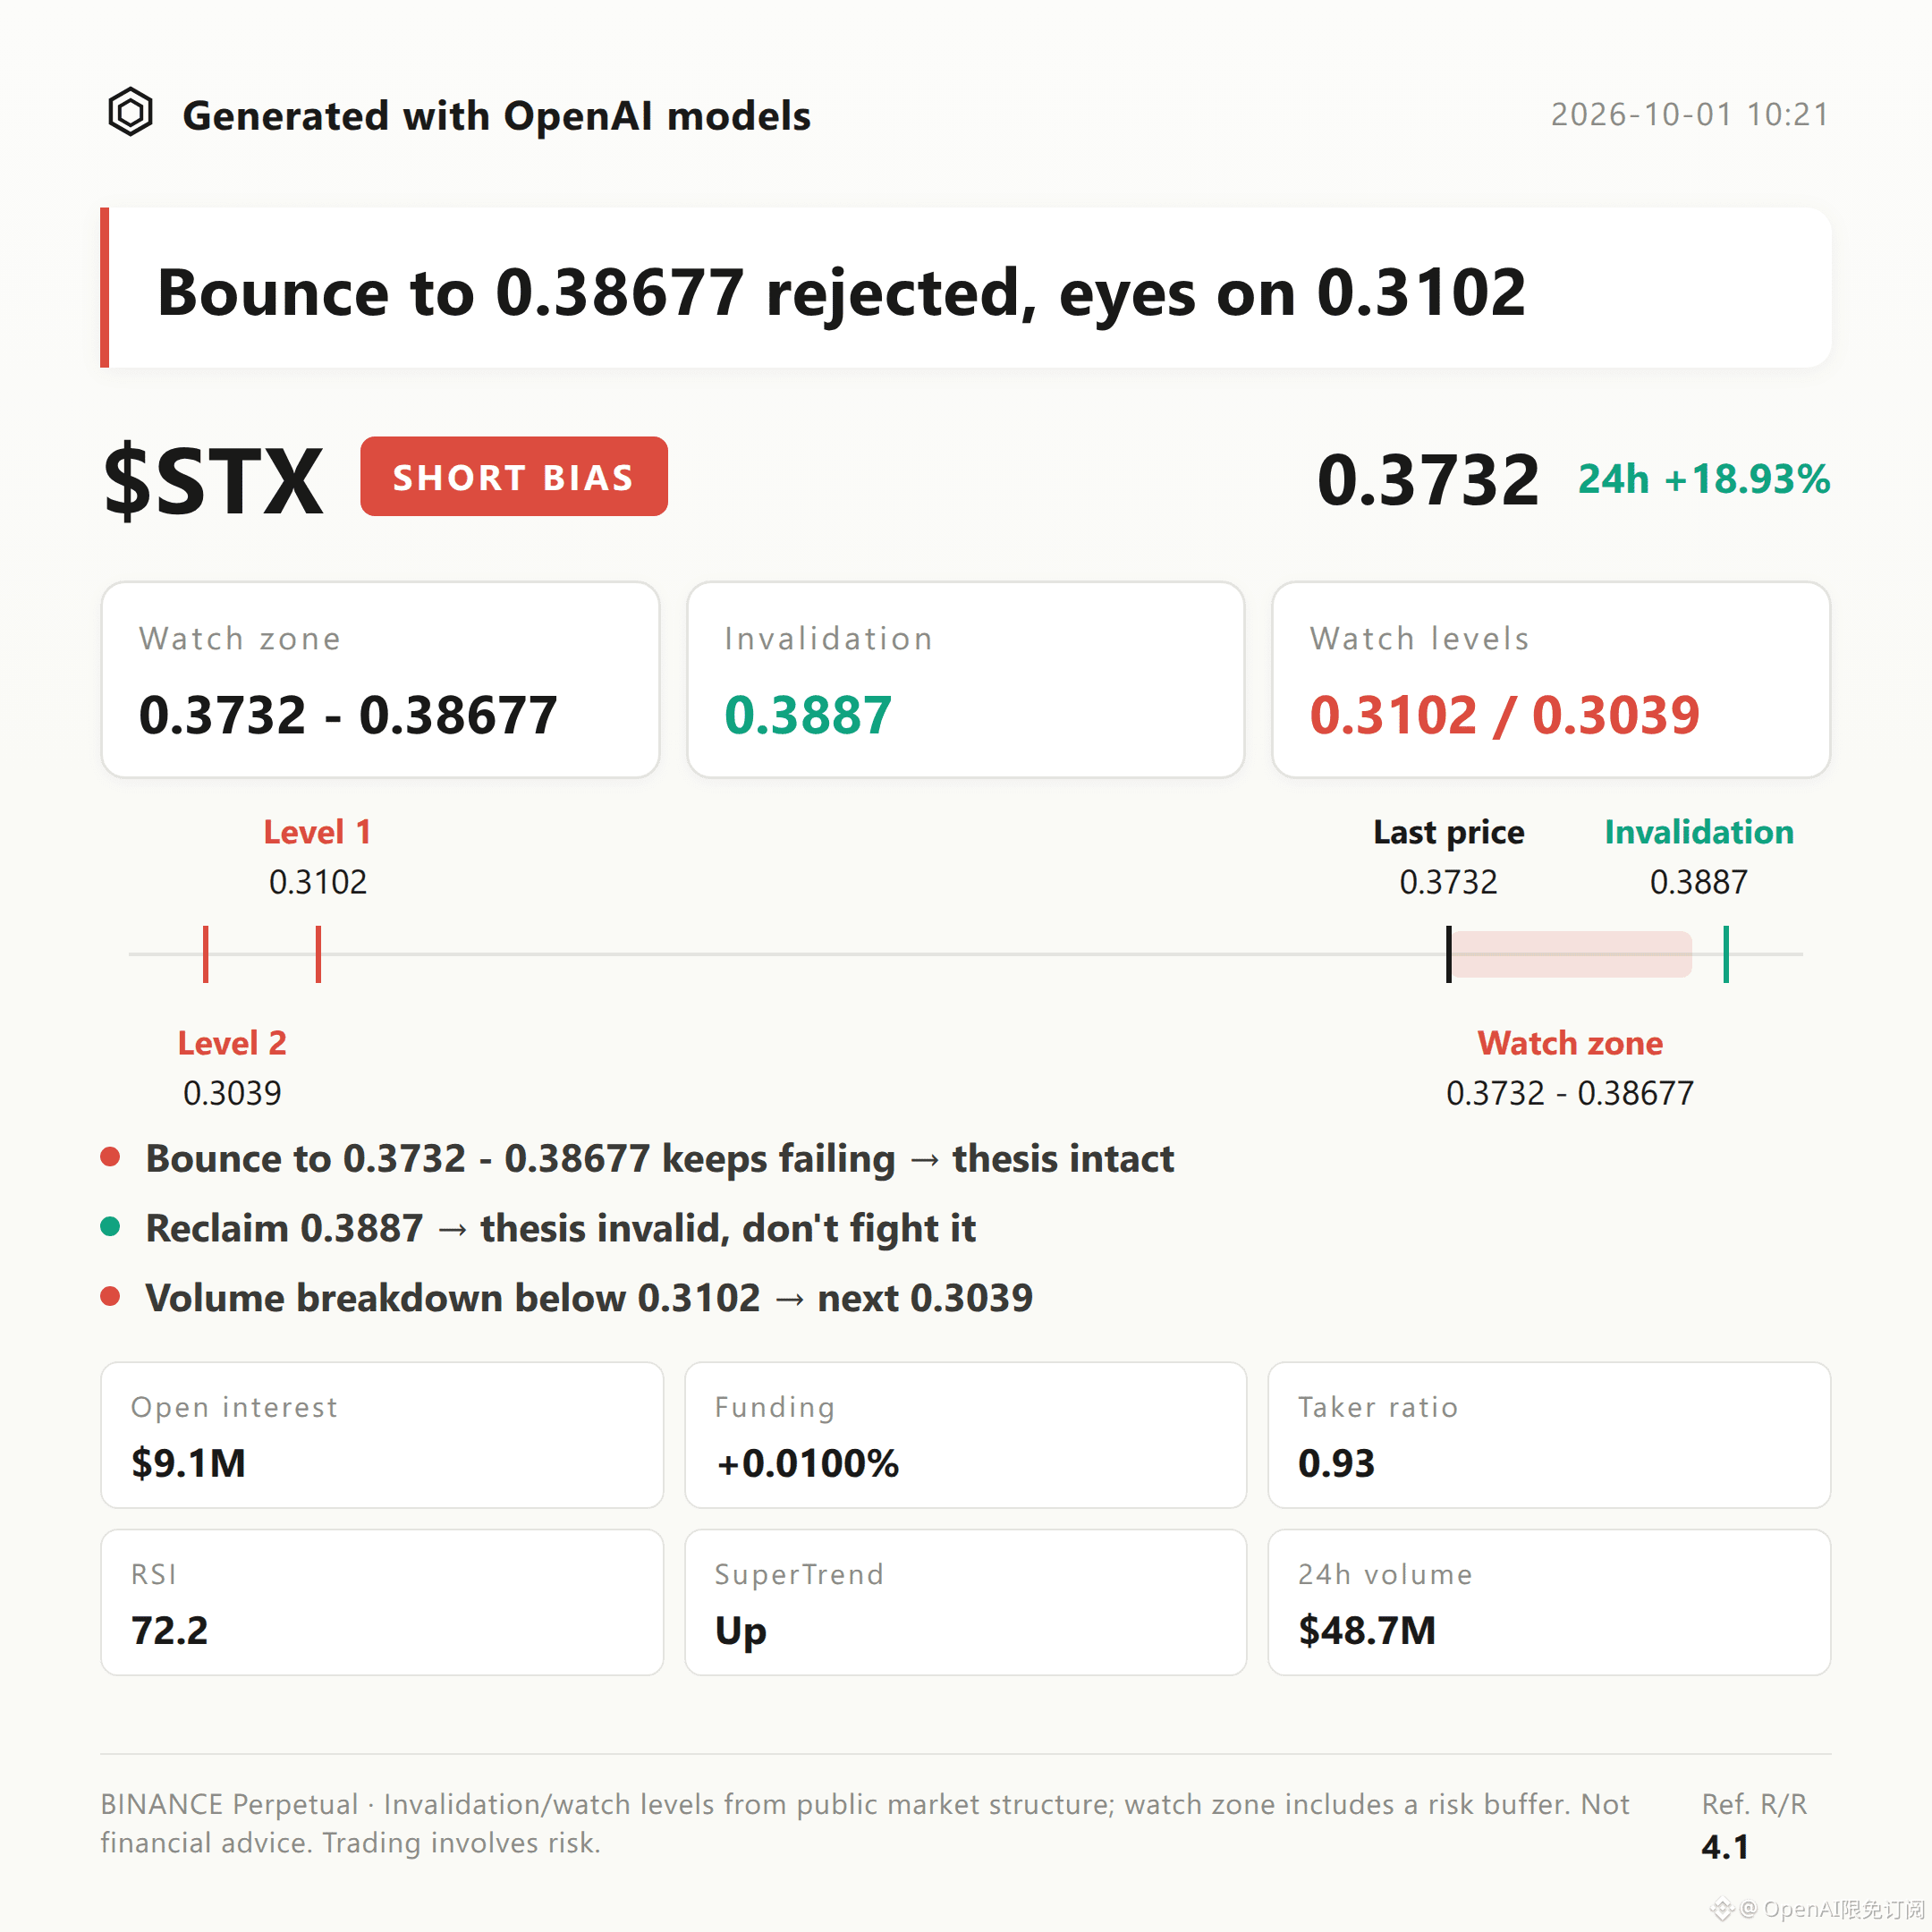
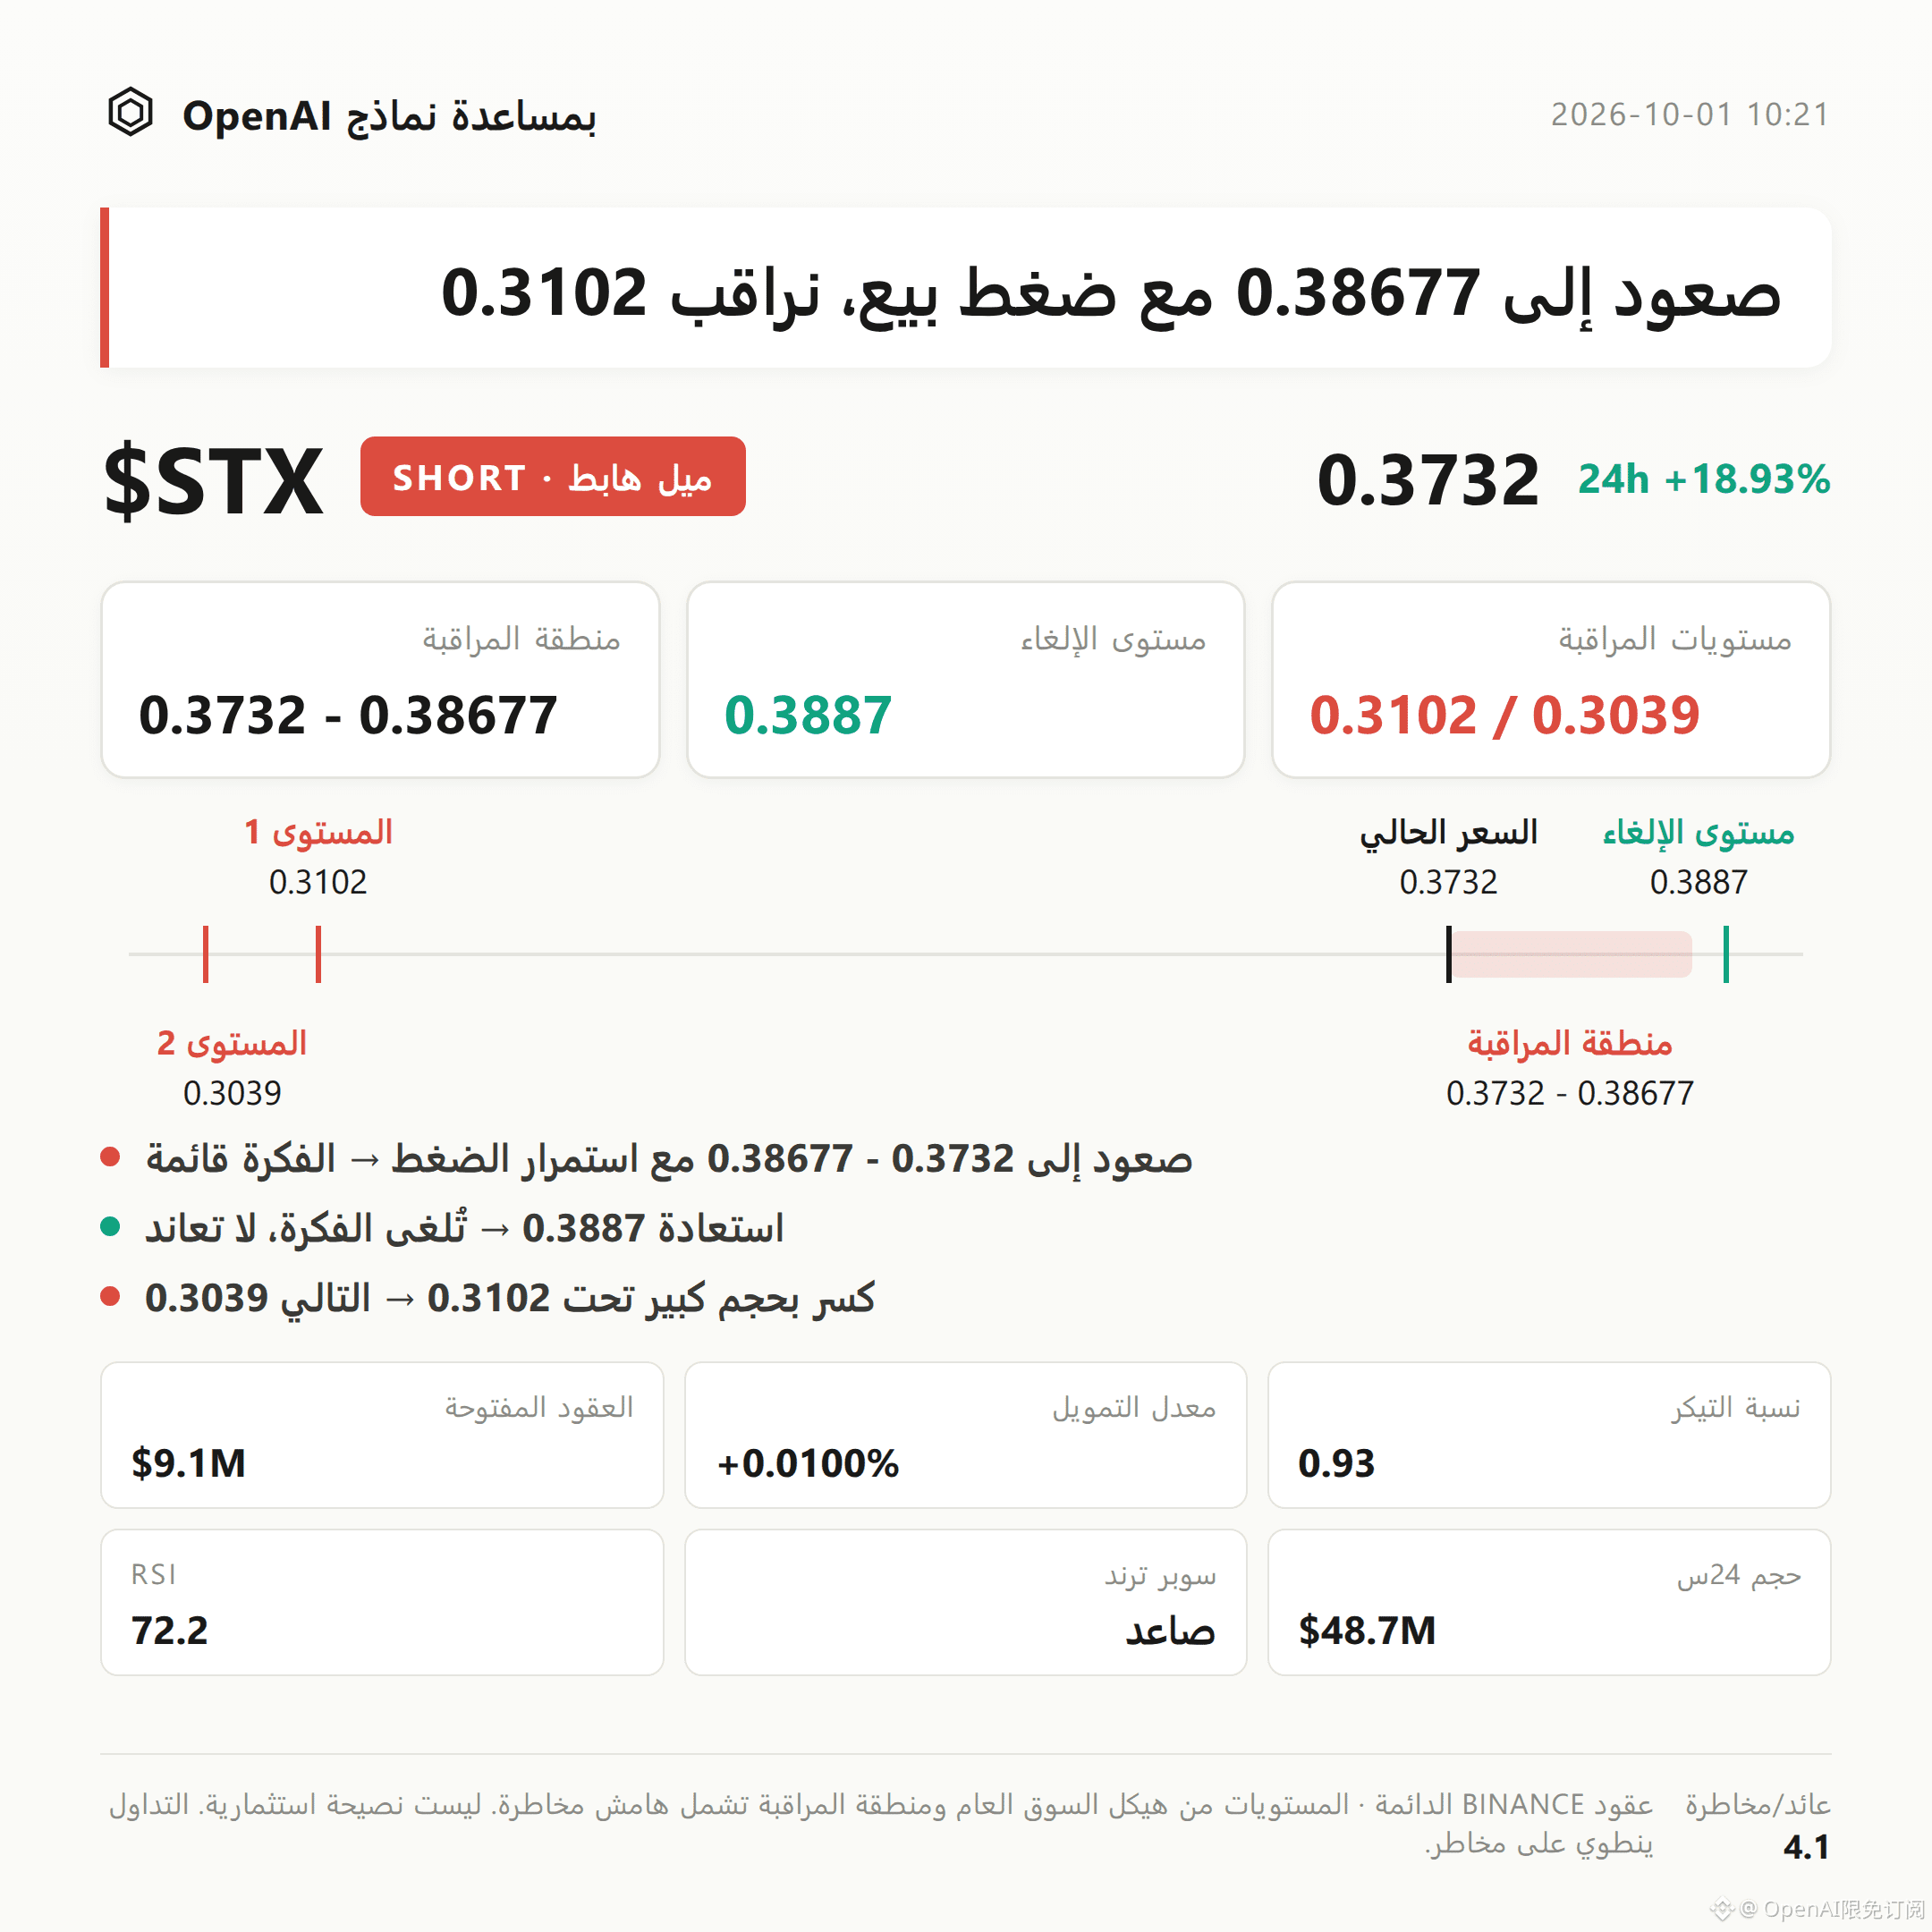
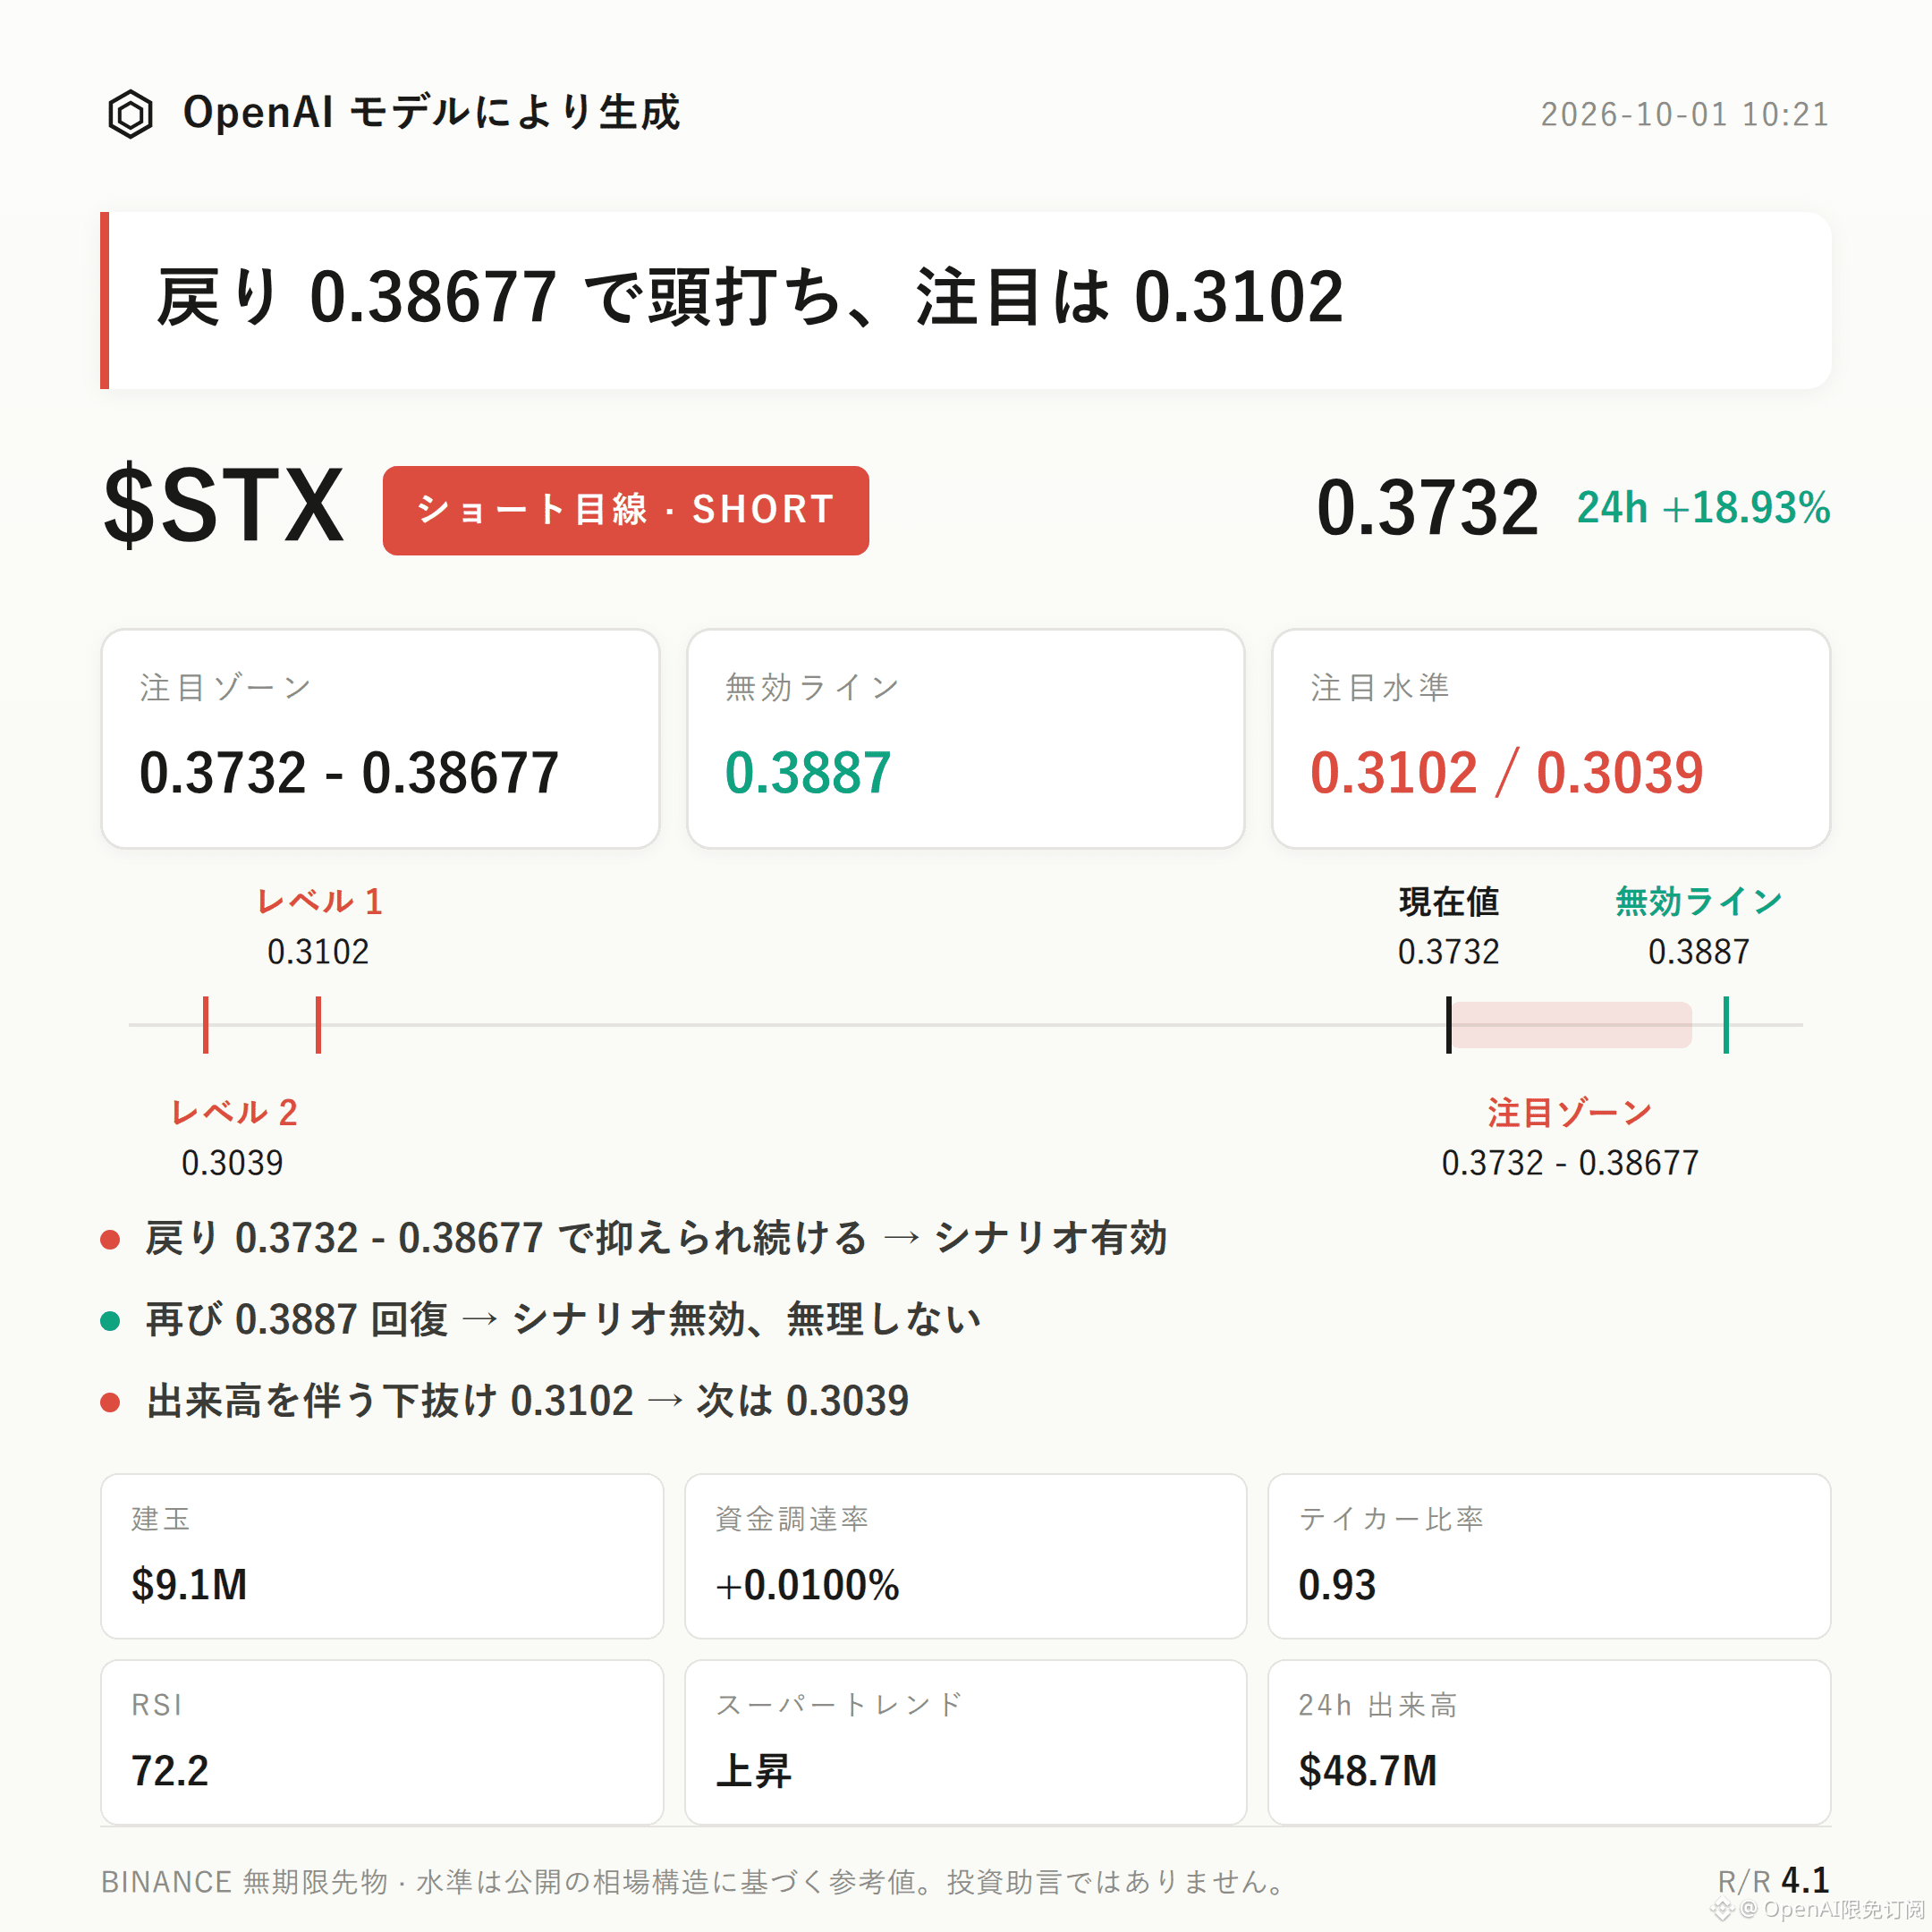
70
·
--
Trading Plan|10/1 09:21
$GRAM Bearish Bias | Focus on Range 1.508 - 1.5391 | Invalidation Reference 1.55 | Observation Levels 1.4758 / 1.468
$GRAM The current bearish structure is unfolding.
The Supertrend is pointing down, MACD maintains bearish momentum, and the aggressive buy/sell ratio is only 0.73, with sell orders dominating.
The key is whether pullbacks can be held down in the resistance zone.
Current price is 1.508, near the Bollinger middle band at 1.5074. The upper Bollinger band at 1.5391 forms a short-term resistance reference.
The recent high is 1.55, and the recent low is 1.468. The Supertrend is still trending downward.
RSI is 47.8, showing no clear strength yet. Bearish MACD momentum continues to support a bearish watch-and-wait stance.
The 24-hour trading volume is $31.14M and open interest is $30.50M. Open interest increased by 9.0% year-over-year, indicating rising participation of leveraged capital.
The funding rate is +0.0050%. Long accounts are 58%, while the aggressive buy/sell ratio is 0.73—accounts lean slightly bullish, but aggressive sell orders dominate. This suggests the possibility of pressure after long crowding.
However, the 24-hour price increase is still +2.24%, meaning the market has not formed one-way weakness yet; confirmation of the structure is still needed.
For the bears’ focus range, first look at 1.508 - 1.5391. It’s more suitable to wait for confirmation after a pullback is rejected in resistance.
If price returns to this zone and only shows brief acceptance, followed by another rejection, then the bearish thesis holds.
If price reclaims the invalidation reference at 1.55, it would mean the current pullback structure is broken and the bearish thesis is invalid—don’t linger.
If price breaks below the first observation level 1.4758 on increased volume, then watch support around 1.468.
The reference risk-reward ratio is only 0.8. Do not speculate on outcomes before the conditions are triggered.
There are currently no clear reverse signals, but contract leverage itself is a risk. Rising open interest may also amplify two-way volatility.
With contract leverage, position discipline is more important than directional judgment.
For reference only and does not constitute investment advice. Contracts have leverage—investing involves risk.
This article was generated with assistance from an OpenAI large model.
$GRAM # Contract Analysis
Trading Plan|10/1 09:21
$GRAM Bearish Bias | Focus on Range 1.508 - 1.5391 | Invalidation Reference 1.55 | Observation Levels 1.4758 / 1.468
$GRAM The current bearish structure is unfolding.
The Supertrend is pointing down, MACD maintains bearish momentum, and the aggressive buy/sell ratio is only 0.73, with sell orders dominating.
The key is whether pullbacks can be held down in the resistance zone.
Current price is 1.508, near the Bollinger middle band at 1.5074. The upper Bollinger band at 1.5391 forms a short-term resistance reference.
The recent high is 1.55, and the recent low is 1.468. The Supertrend is still trending downward.
RSI is 47.8, showing no clear strength yet. Bearish MACD momentum continues to support a bearish watch-and-wait stance.
The 24-hour trading volume is $31.14M and open interest is $30.50M. Open interest increased by 9.0% year-over-year, indicating rising participation of leveraged capital.
The funding rate is +0.0050%. Long accounts are 58%, while the aggressive buy/sell ratio is 0.73—accounts lean slightly bullish, but aggressive sell orders dominate. This suggests the possibility of pressure after long crowding.
However, the 24-hour price increase is still +2.24%, meaning the market has not formed one-way weakness yet; confirmation of the structure is still needed.
For the bears’ focus range, first look at 1.508 - 1.5391. It’s more suitable to wait for confirmation after a pullback is rejected in resistance.
If price returns to this zone and only shows brief acceptance, followed by another rejection, then the bearish thesis holds.
If price reclaims the invalidation reference at 1.55, it would mean the current pullback structure is broken and the bearish thesis is invalid—don’t linger.
If price breaks below the first observation level 1.4758 on increased volume, then watch support around 1.468.
The reference risk-reward ratio is only 0.8. Do not speculate on outcomes before the conditions are triggered.
There are currently no clear reverse signals, but contract leverage itself is a risk. Rising open interest may also amplify two-way volatility.
With contract leverage, position discipline is more important than directional judgment.
For reference only and does not constitute investment advice. Contracts have leverage—investing involves risk.
This article was generated with assistance from an OpenAI large model.
$GRAM # Contract Analysis
$GRAM Bearish Bias | Focus on Range 1.508 - 1.5391 | Invalidation Reference 1.55 | Observation Levels 1.4758 / 1.468
$GRAM The current bearish structure is unfolding.
The Supertrend is pointing down, MACD maintains bearish momentum, and the aggressive buy/sell ratio is only 0.73, with sell orders dominating.
The key is whether pullbacks can be held down in the resistance zone.
Current price is 1.508, near the Bollinger middle band at 1.5074. The upper Bollinger band at 1.5391 forms a short-term resistance reference.
The recent high is 1.55, and the recent low is 1.468. The Supertrend is still trending downward.
RSI is 47.8, showing no clear strength yet. Bearish MACD momentum continues to support a bearish watch-and-wait stance.
The 24-hour trading volume is $31.14M and open interest is $30.50M. Open interest increased by 9.0% year-over-year, indicating rising participation of leveraged capital.
The funding rate is +0.0050%. Long accounts are 58%, while the aggressive buy/sell ratio is 0.73—accounts lean slightly bullish, but aggressive sell orders dominate. This suggests the possibility of pressure after long crowding.
However, the 24-hour price increase is still +2.24%, meaning the market has not formed one-way weakness yet; confirmation of the structure is still needed.
For the bears’ focus range, first look at 1.508 - 1.5391. It’s more suitable to wait for confirmation after a pullback is rejected in resistance.
If price returns to this zone and only shows brief acceptance, followed by another rejection, then the bearish thesis holds.
If price reclaims the invalidation reference at 1.55, it would mean the current pullback structure is broken and the bearish thesis is invalid—don’t linger.
If price breaks below the first observation level 1.4758 on increased volume, then watch support around 1.468.
The reference risk-reward ratio is only 0.8. Do not speculate on outcomes before the conditions are triggered.
There are currently no clear reverse signals, but contract leverage itself is a risk. Rising open interest may also amplify two-way volatility.
With contract leverage, position discipline is more important than directional judgment.
For reference only and does not constitute investment advice. Contracts have leverage—investing involves risk.
This article was generated with assistance from an OpenAI large model.
$GRAM # Contract Analysis
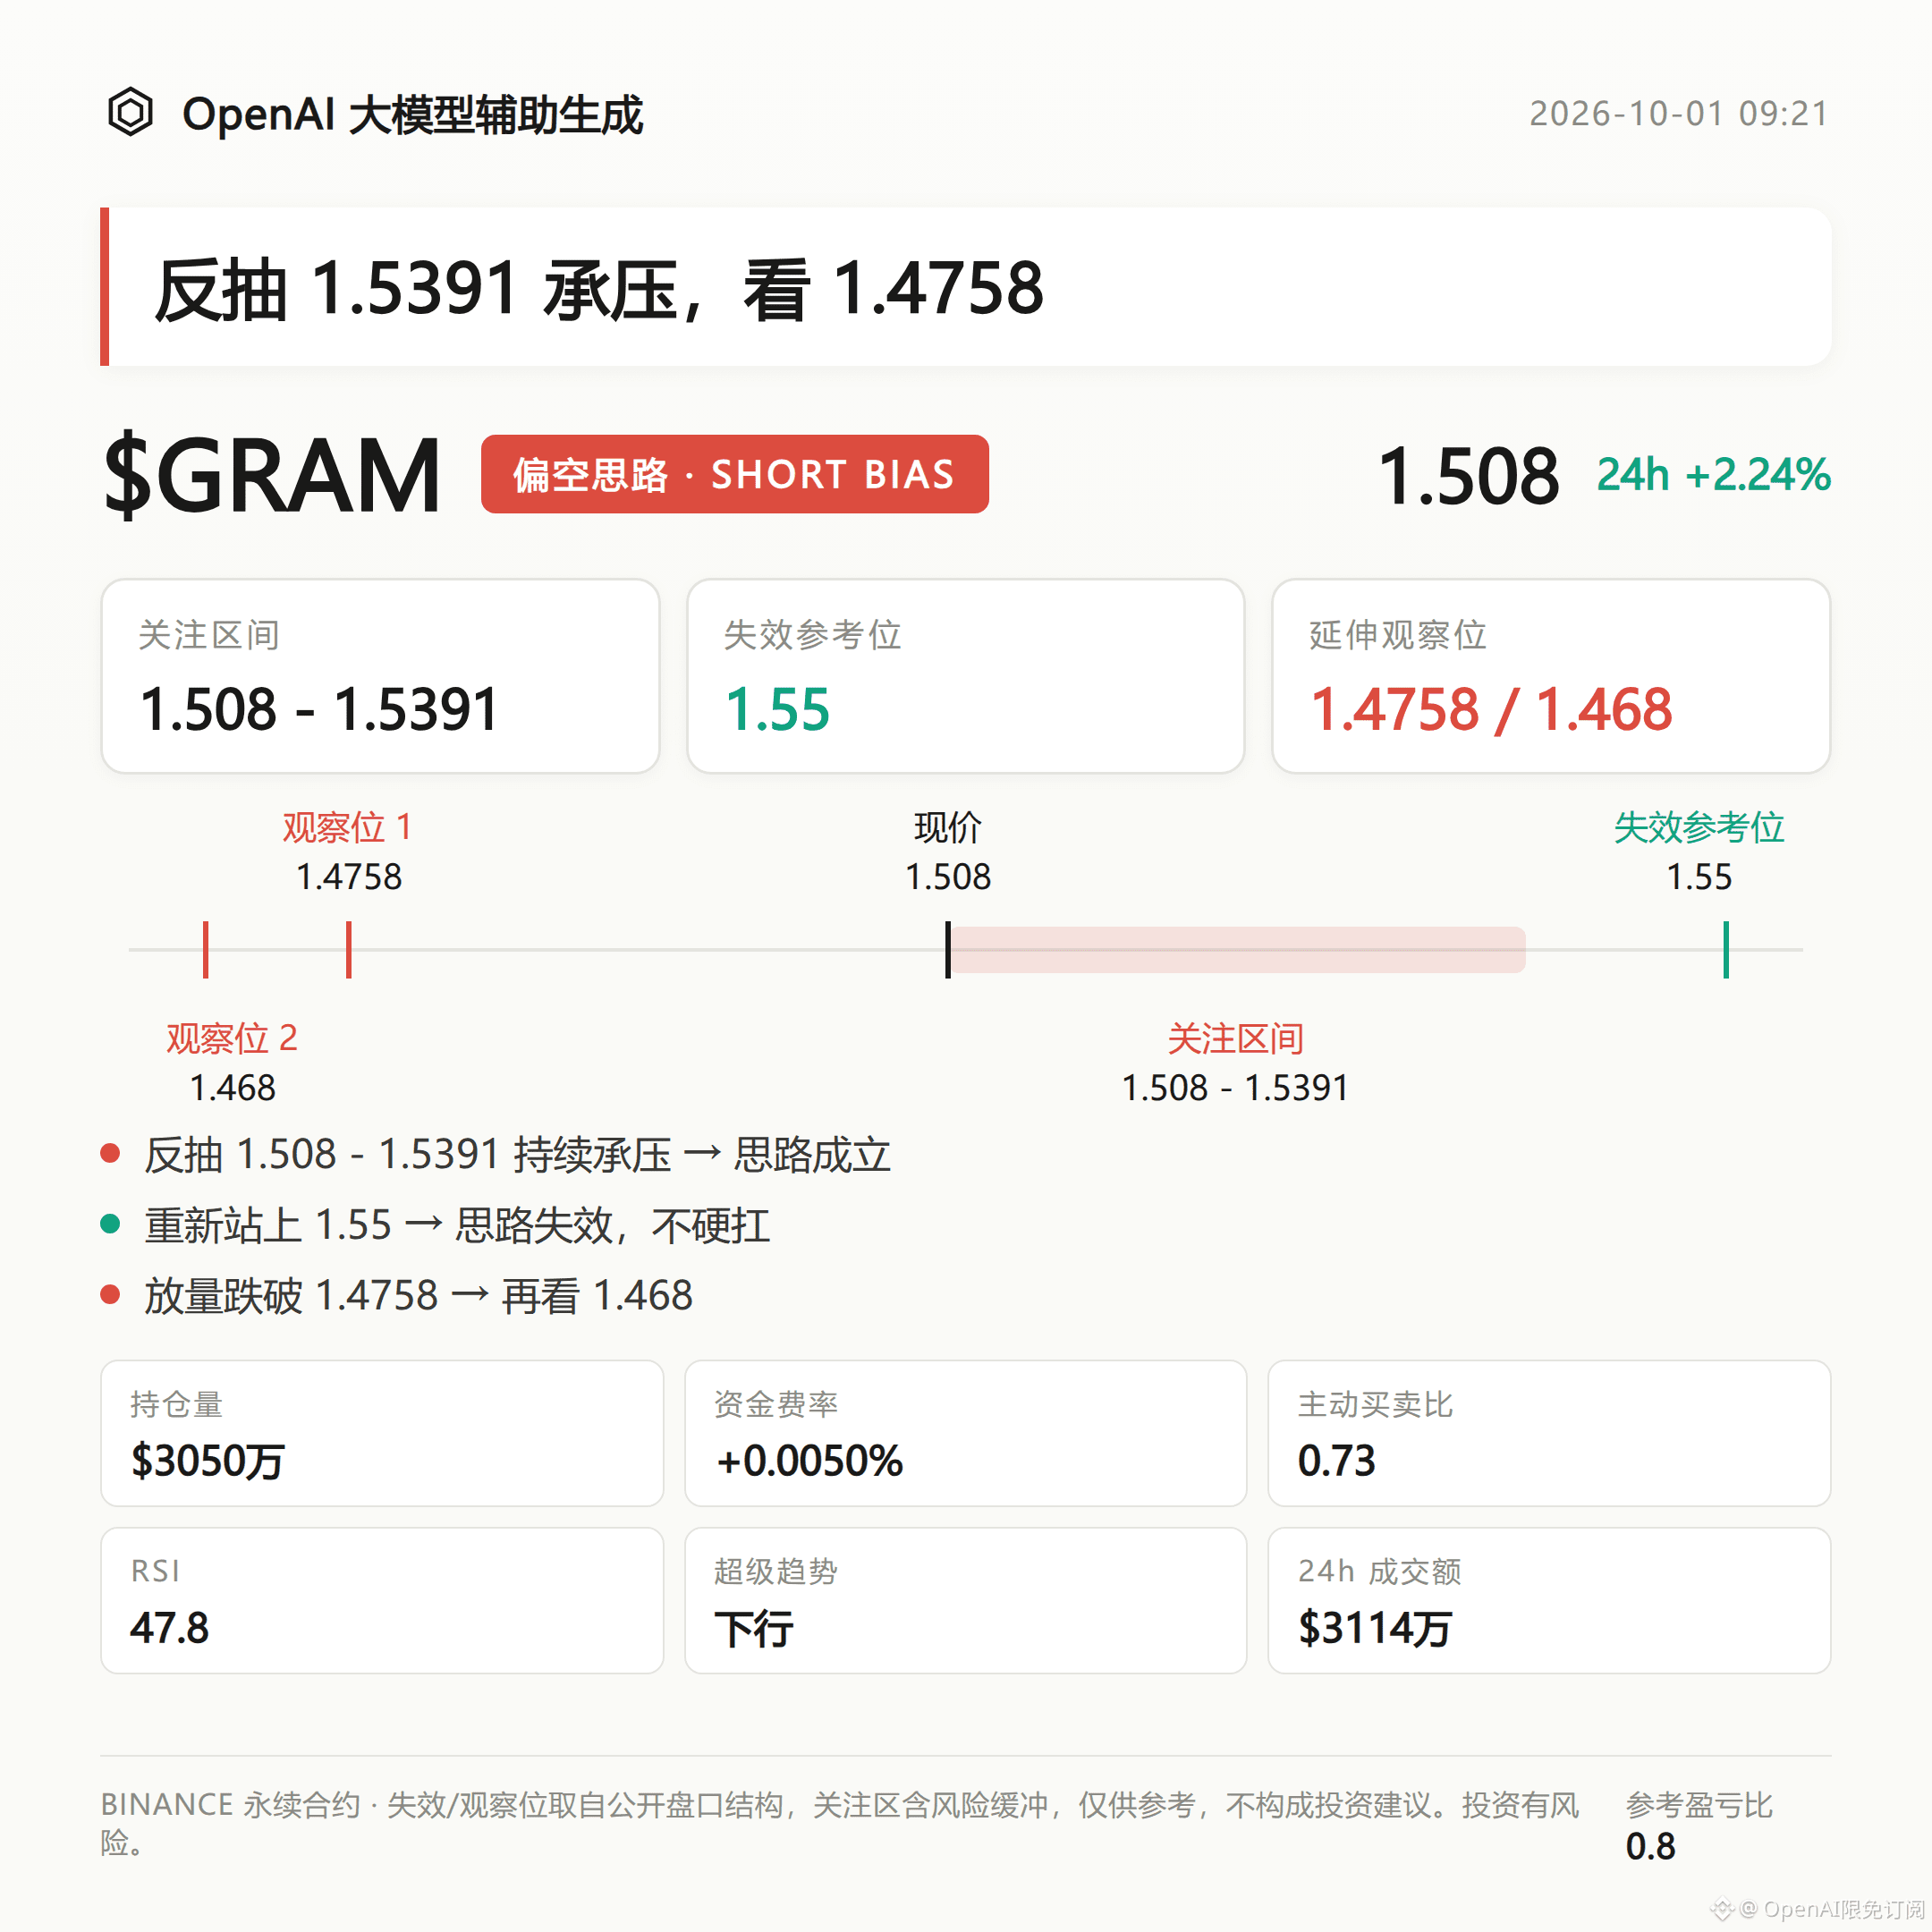
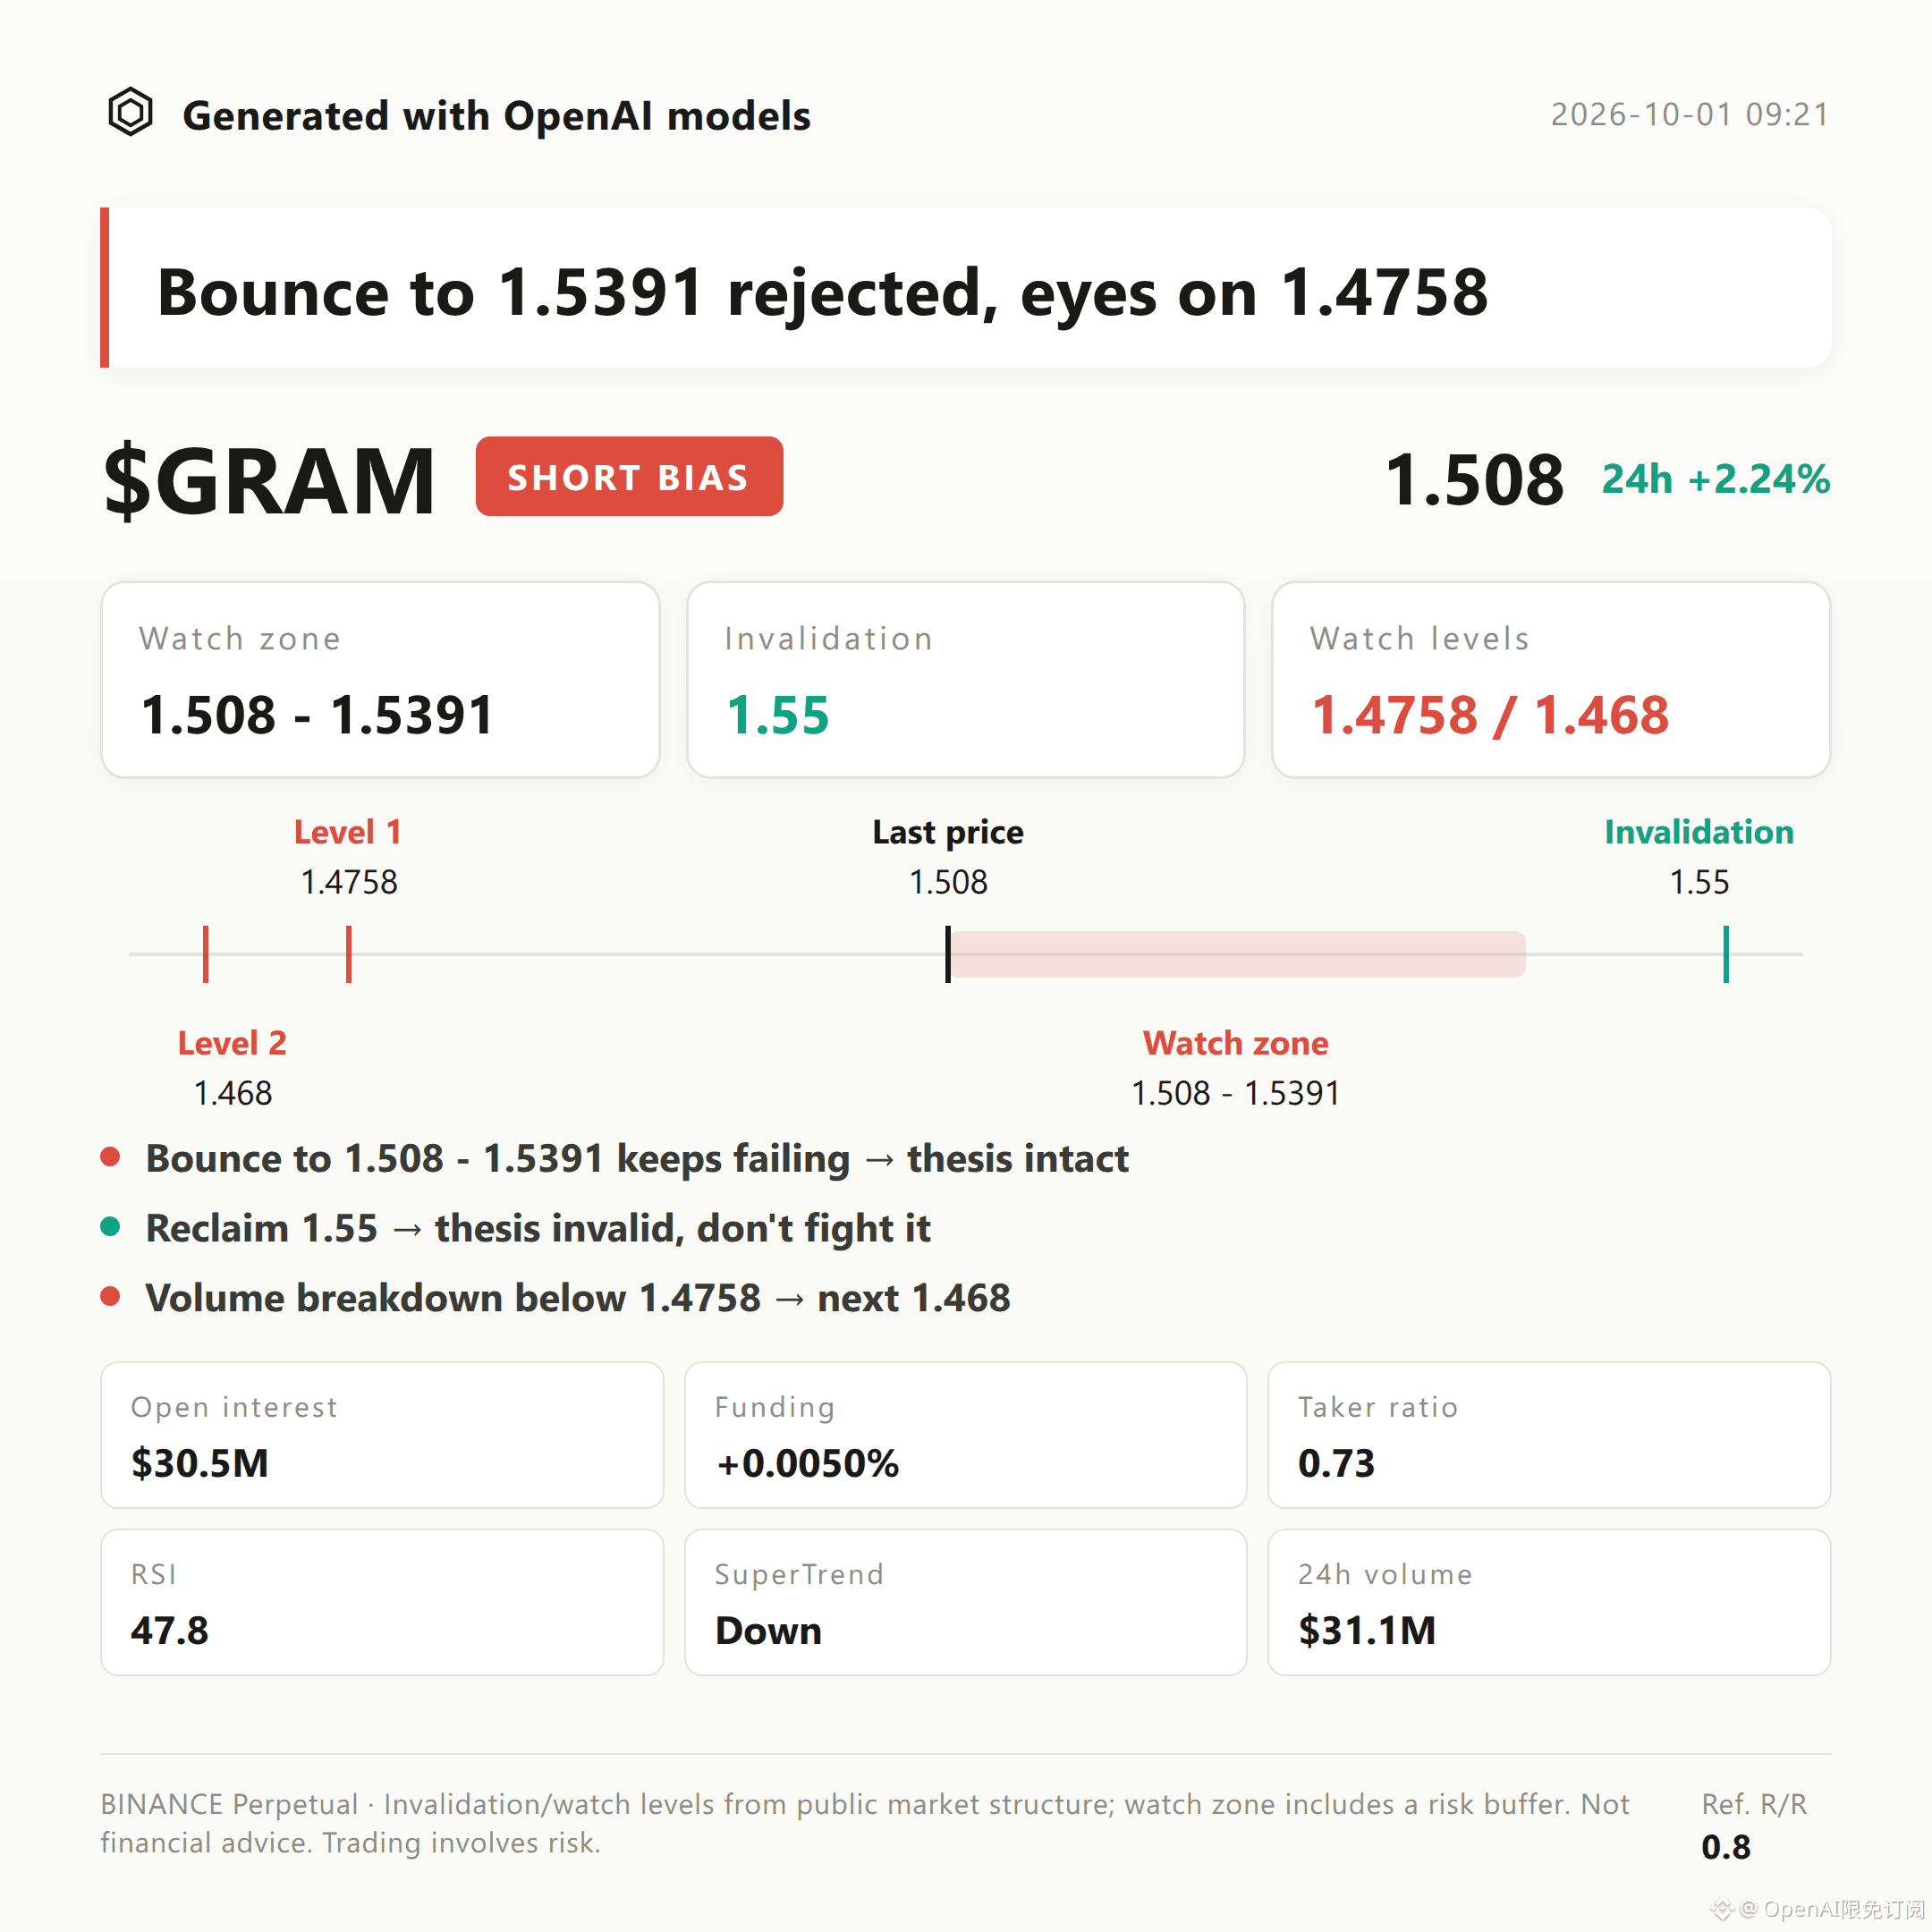
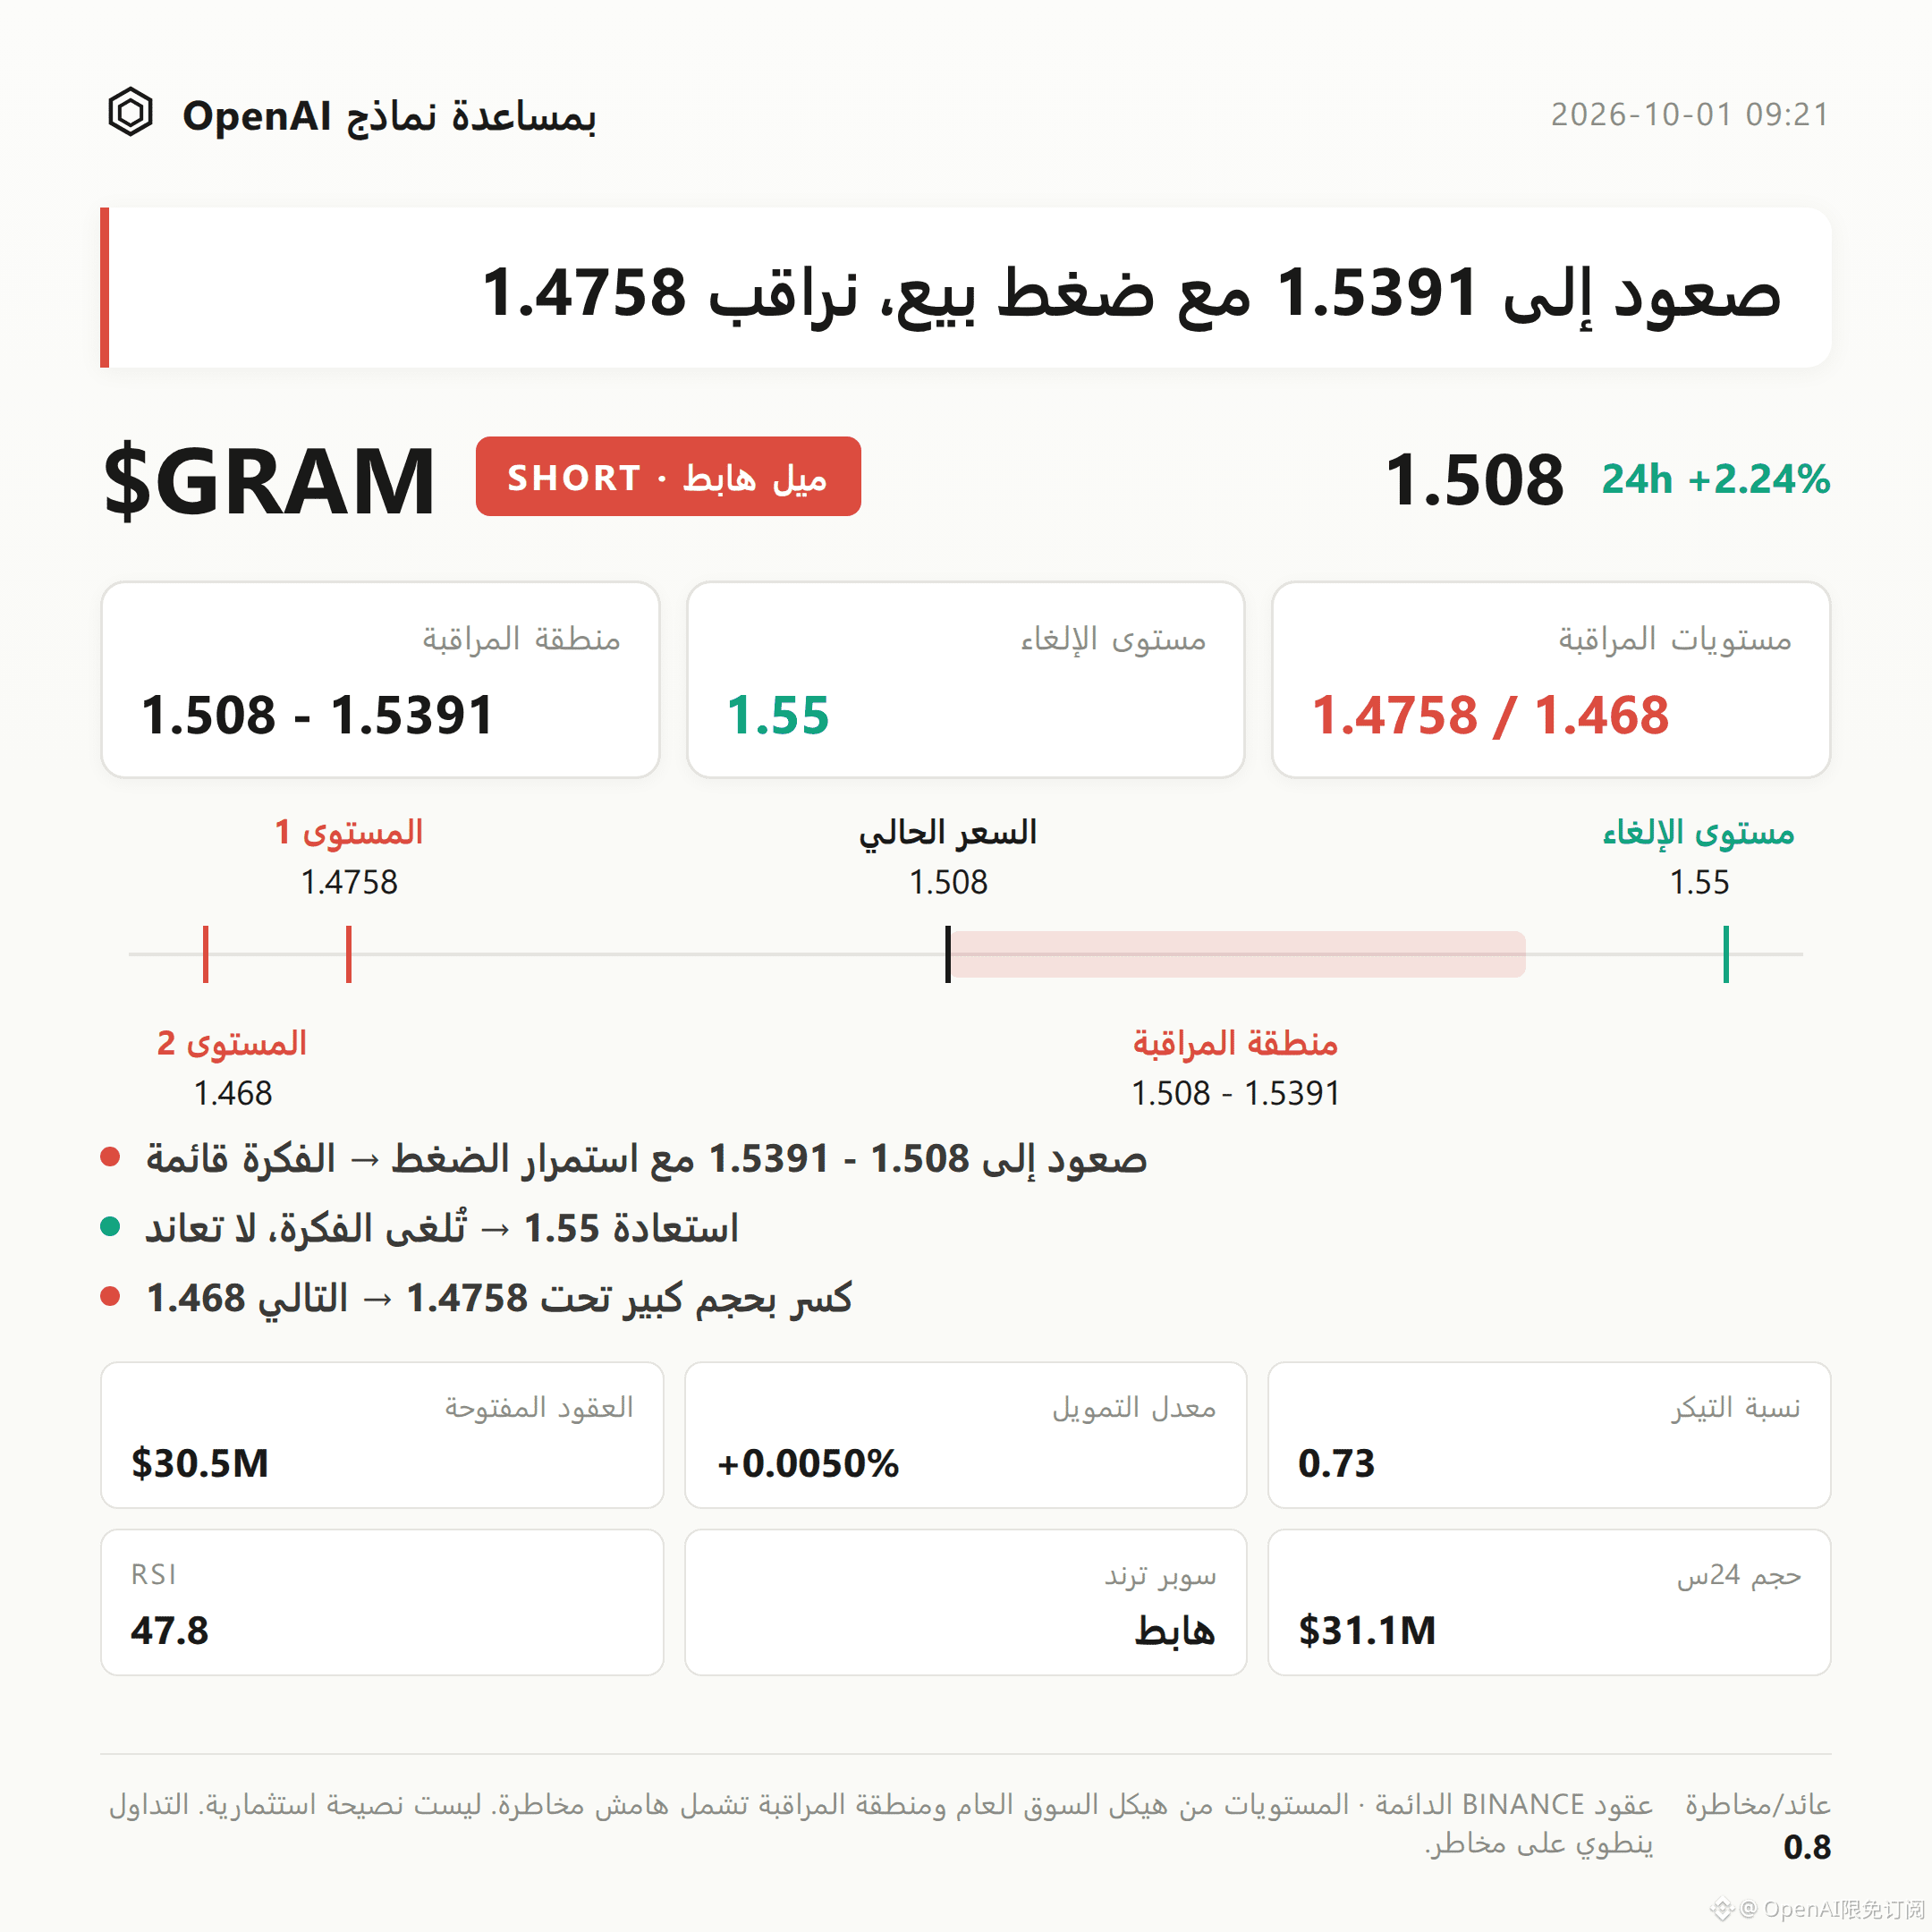
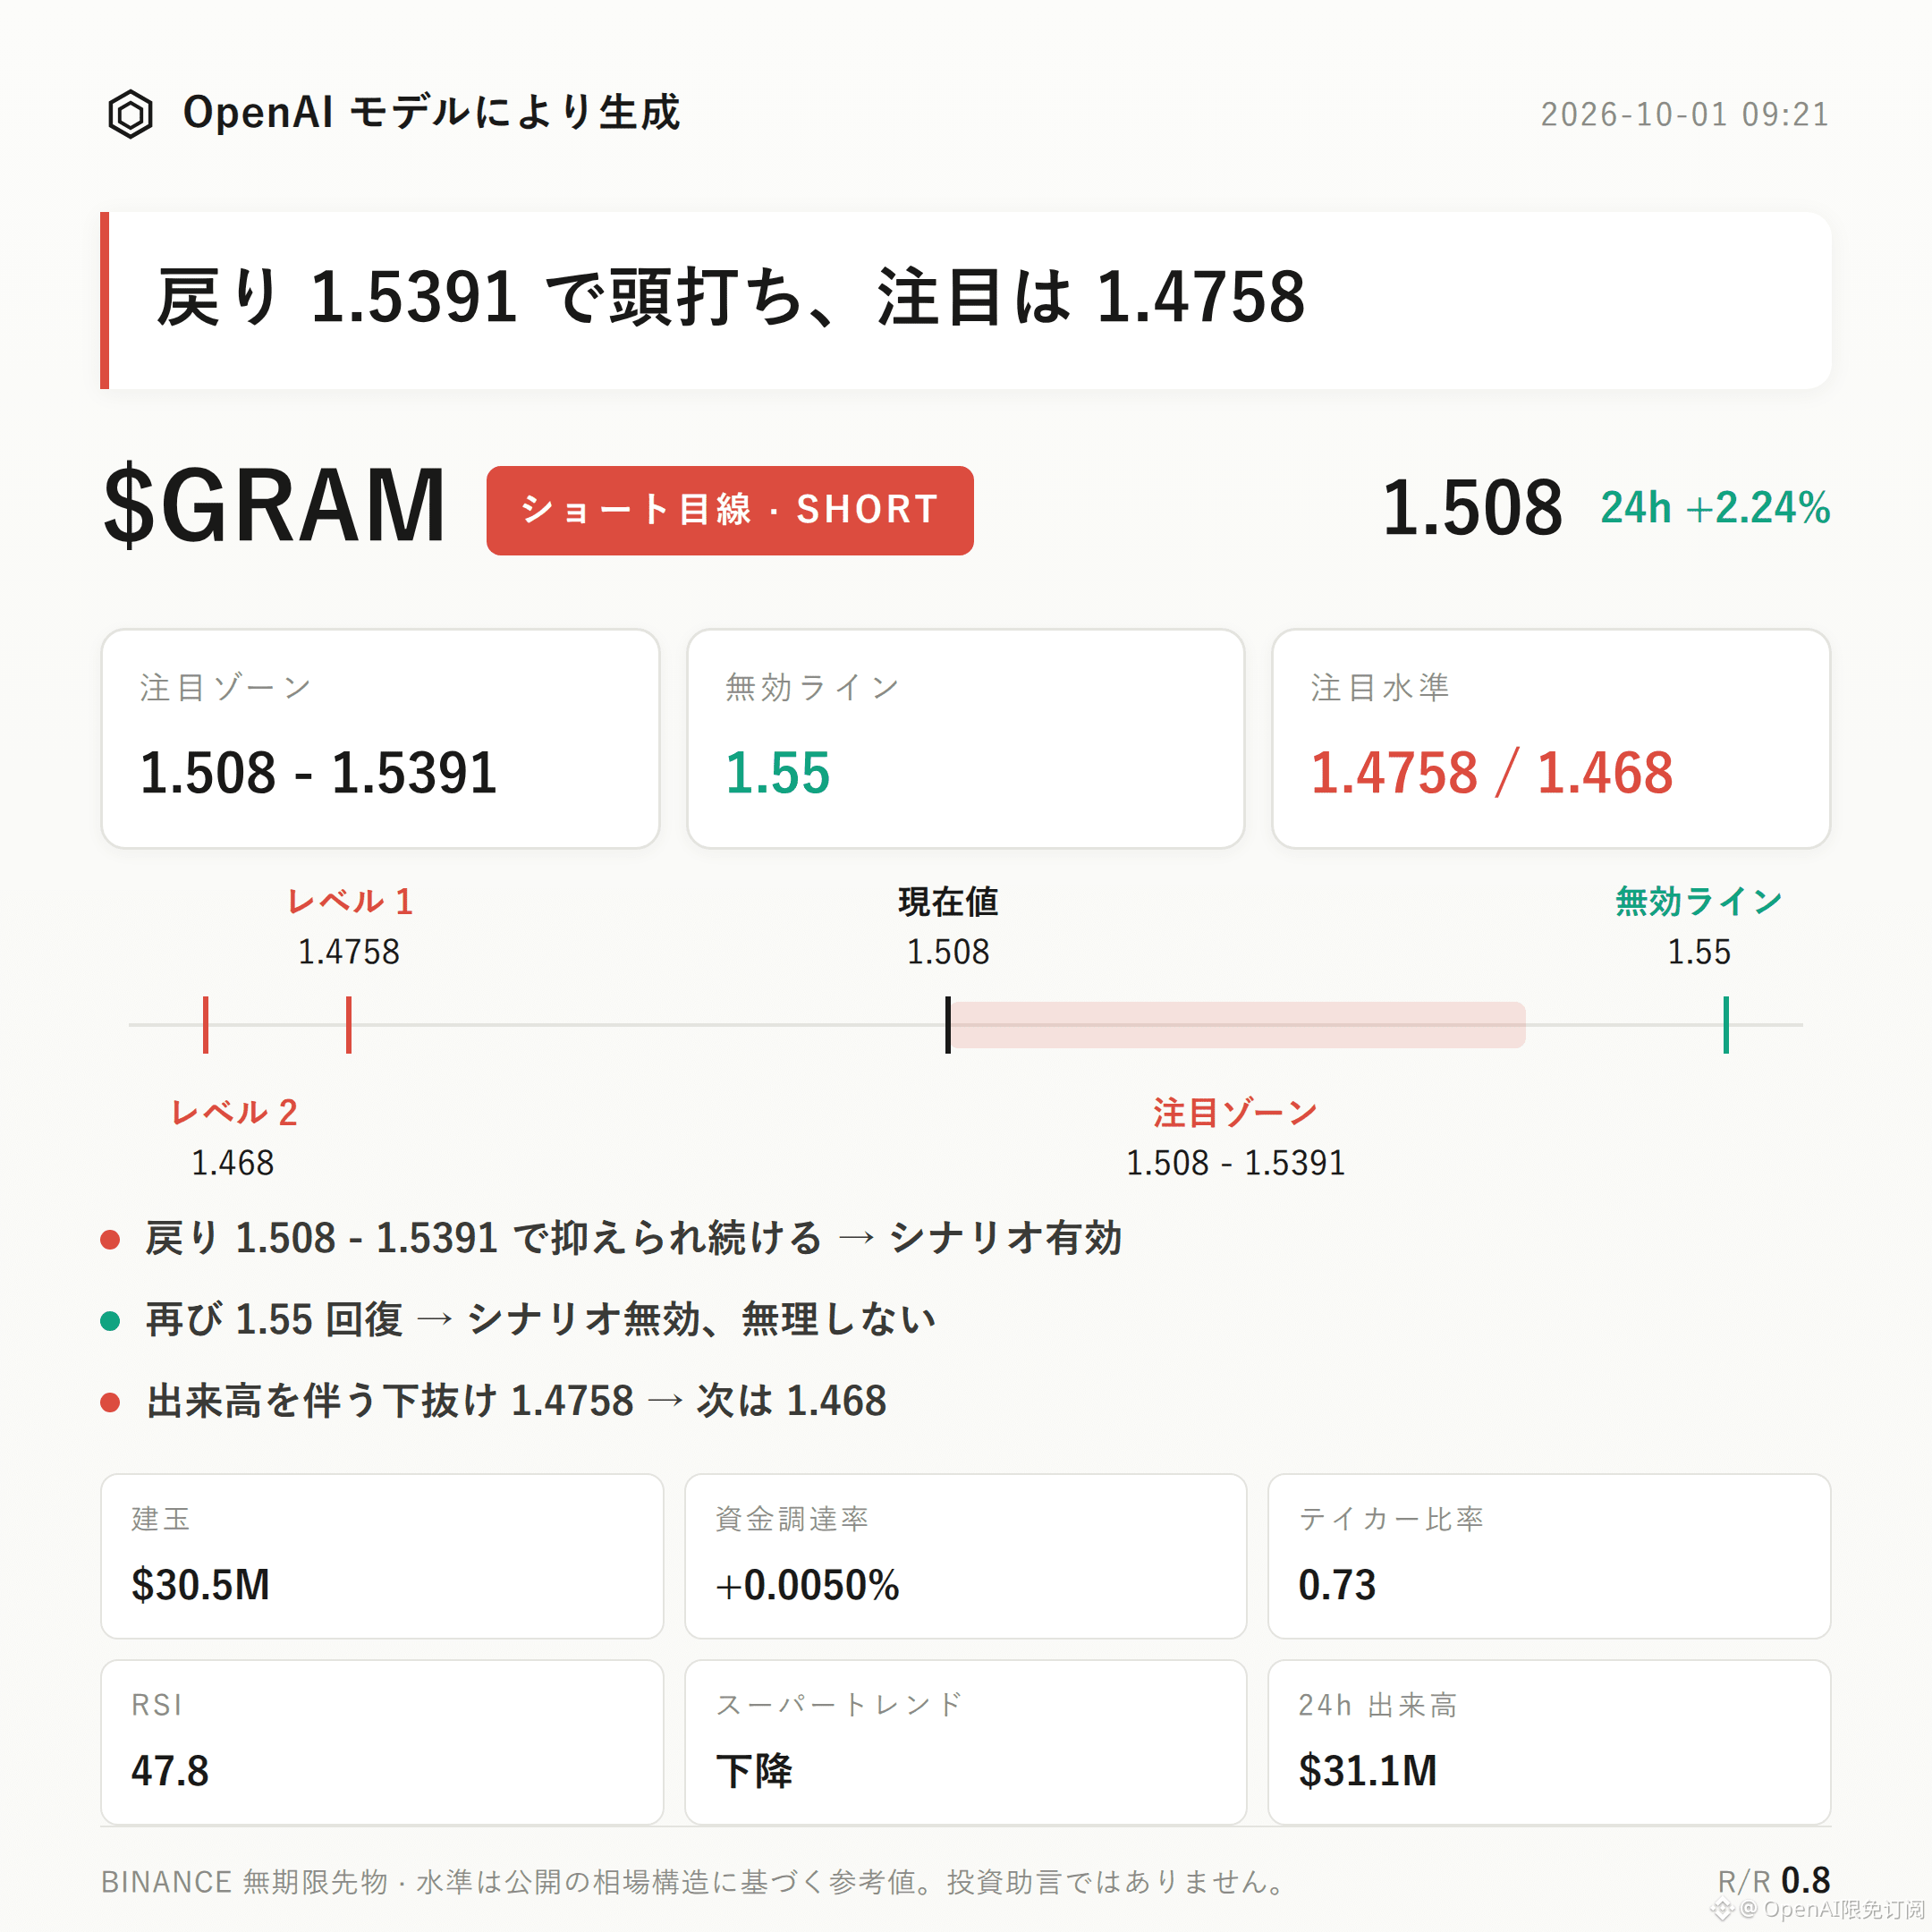
71
·
--
Trading Setup Ideas|10/1 07:20
$BERA Bearish Bias Focus | Watch Range 0.2563 - 0.2627 | Invalidation Reference 0.2675 | Observation Levels 0.244 / 0.2323
$BERA The current bearish-leaning structure is worth monitoring.
The buy-sell ratio for active orders is only 0.71—active sell orders are dominant. Meanwhile, the open interest over the past 24 hours has increased by 41.3%, and long account share is 62%. The combination of leverage and crowded longs brings a pullback risk.
The key is whether any rebound can be held down in the pressure zone.
Current price is 0.2563, sitting between the Bollinger middle band (0.2533) and the upper band (0.2627). Above it lies the recent high at 0.2675.
However, the super trend is still pointing upward. RSI is 58.1, and MACD continues to maintain bullish momentum—these are reverse-structure factors that bearish calls must take seriously.
Over the last 24 hours, trading volume is $52.5 million, with open interest at $7.18 million. Funding rate is +0.0050%.
While price is up 7.06% over 24 hours and open interest has risen significantly, active selling is dominant. This suggests the disagreement at higher levels is growing, but a clear and certain weakening has not yet formed.
For the short side, focus first on 0.2563 - 0.2627. It’s more suitable to wait for confirmation after a rebound meets resistance.
If, after retesting this watch zone, there is some support/absorption, but the subsequent rebound is still suppressed, then the bearish bias holds true.
If the invalidation reference at 0.2675 is triggered, it means the current pullback structure is broken—bearish bias is invalid. Don’t linger.
If price breaks down with increased volume through the observation level of 0.244, then watch support near 0.2323.
At present, there are no obvious bearish reversal signals. But since the super trend is still rising and MACD bullish momentum remains, and because contract leverage itself is a risk, caution is warranted.
The reference risk-reward ratio is 1.1, so upside/space advantage is limited. When conditions are not confirmed, it’s not advisable to amplify subjective judgment.
With contract leverage, position discipline matters more than directional calls.
For reference only and does not constitute investment advice. There is leverage in the contract, and investing involves risk.
This article was generated with assistance from an OpenAI large model.
$BERA #Contract Analysis
Trading Setup Ideas|10/1 07:20
$BERA Bearish Bias Focus | Watch Range 0.2563 - 0.2627 | Invalidation Reference 0.2675 | Observation Levels 0.244 / 0.2323
$BERA The current bearish-leaning structure is worth monitoring.
The buy-sell ratio for active orders is only 0.71—active sell orders are dominant. Meanwhile, the open interest over the past 24 hours has increased by 41.3%, and long account share is 62%. The combination of leverage and crowded longs brings a pullback risk.
The key is whether any rebound can be held down in the pressure zone.
Current price is 0.2563, sitting between the Bollinger middle band (0.2533) and the upper band (0.2627). Above it lies the recent high at 0.2675.
However, the super trend is still pointing upward. RSI is 58.1, and MACD continues to maintain bullish momentum—these are reverse-structure factors that bearish calls must take seriously.
Over the last 24 hours, trading volume is $52.5 million, with open interest at $7.18 million. Funding rate is +0.0050%.
While price is up 7.06% over 24 hours and open interest has risen significantly, active selling is dominant. This suggests the disagreement at higher levels is growing, but a clear and certain weakening has not yet formed.
For the short side, focus first on 0.2563 - 0.2627. It’s more suitable to wait for confirmation after a rebound meets resistance.
If, after retesting this watch zone, there is some support/absorption, but the subsequent rebound is still suppressed, then the bearish bias holds true.
If the invalidation reference at 0.2675 is triggered, it means the current pullback structure is broken—bearish bias is invalid. Don’t linger.
If price breaks down with increased volume through the observation level of 0.244, then watch support near 0.2323.
At present, there are no obvious bearish reversal signals. But since the super trend is still rising and MACD bullish momentum remains, and because contract leverage itself is a risk, caution is warranted.
The reference risk-reward ratio is 1.1, so upside/space advantage is limited. When conditions are not confirmed, it’s not advisable to amplify subjective judgment.
With contract leverage, position discipline matters more than directional calls.
For reference only and does not constitute investment advice. There is leverage in the contract, and investing involves risk.
This article was generated with assistance from an OpenAI large model.
$BERA #Contract Analysis
$BERA Bearish Bias Focus | Watch Range 0.2563 - 0.2627 | Invalidation Reference 0.2675 | Observation Levels 0.244 / 0.2323
$BERA The current bearish-leaning structure is worth monitoring.
The buy-sell ratio for active orders is only 0.71—active sell orders are dominant. Meanwhile, the open interest over the past 24 hours has increased by 41.3%, and long account share is 62%. The combination of leverage and crowded longs brings a pullback risk.
The key is whether any rebound can be held down in the pressure zone.
Current price is 0.2563, sitting between the Bollinger middle band (0.2533) and the upper band (0.2627). Above it lies the recent high at 0.2675.
However, the super trend is still pointing upward. RSI is 58.1, and MACD continues to maintain bullish momentum—these are reverse-structure factors that bearish calls must take seriously.
Over the last 24 hours, trading volume is $52.5 million, with open interest at $7.18 million. Funding rate is +0.0050%.
While price is up 7.06% over 24 hours and open interest has risen significantly, active selling is dominant. This suggests the disagreement at higher levels is growing, but a clear and certain weakening has not yet formed.
For the short side, focus first on 0.2563 - 0.2627. It’s more suitable to wait for confirmation after a rebound meets resistance.
If, after retesting this watch zone, there is some support/absorption, but the subsequent rebound is still suppressed, then the bearish bias holds true.
If the invalidation reference at 0.2675 is triggered, it means the current pullback structure is broken—bearish bias is invalid. Don’t linger.
If price breaks down with increased volume through the observation level of 0.244, then watch support near 0.2323.
At present, there are no obvious bearish reversal signals. But since the super trend is still rising and MACD bullish momentum remains, and because contract leverage itself is a risk, caution is warranted.
The reference risk-reward ratio is 1.1, so upside/space advantage is limited. When conditions are not confirmed, it’s not advisable to amplify subjective judgment.
With contract leverage, position discipline matters more than directional calls.
For reference only and does not constitute investment advice. There is leverage in the contract, and investing involves risk.
This article was generated with assistance from an OpenAI large model.
$BERA #Contract Analysis
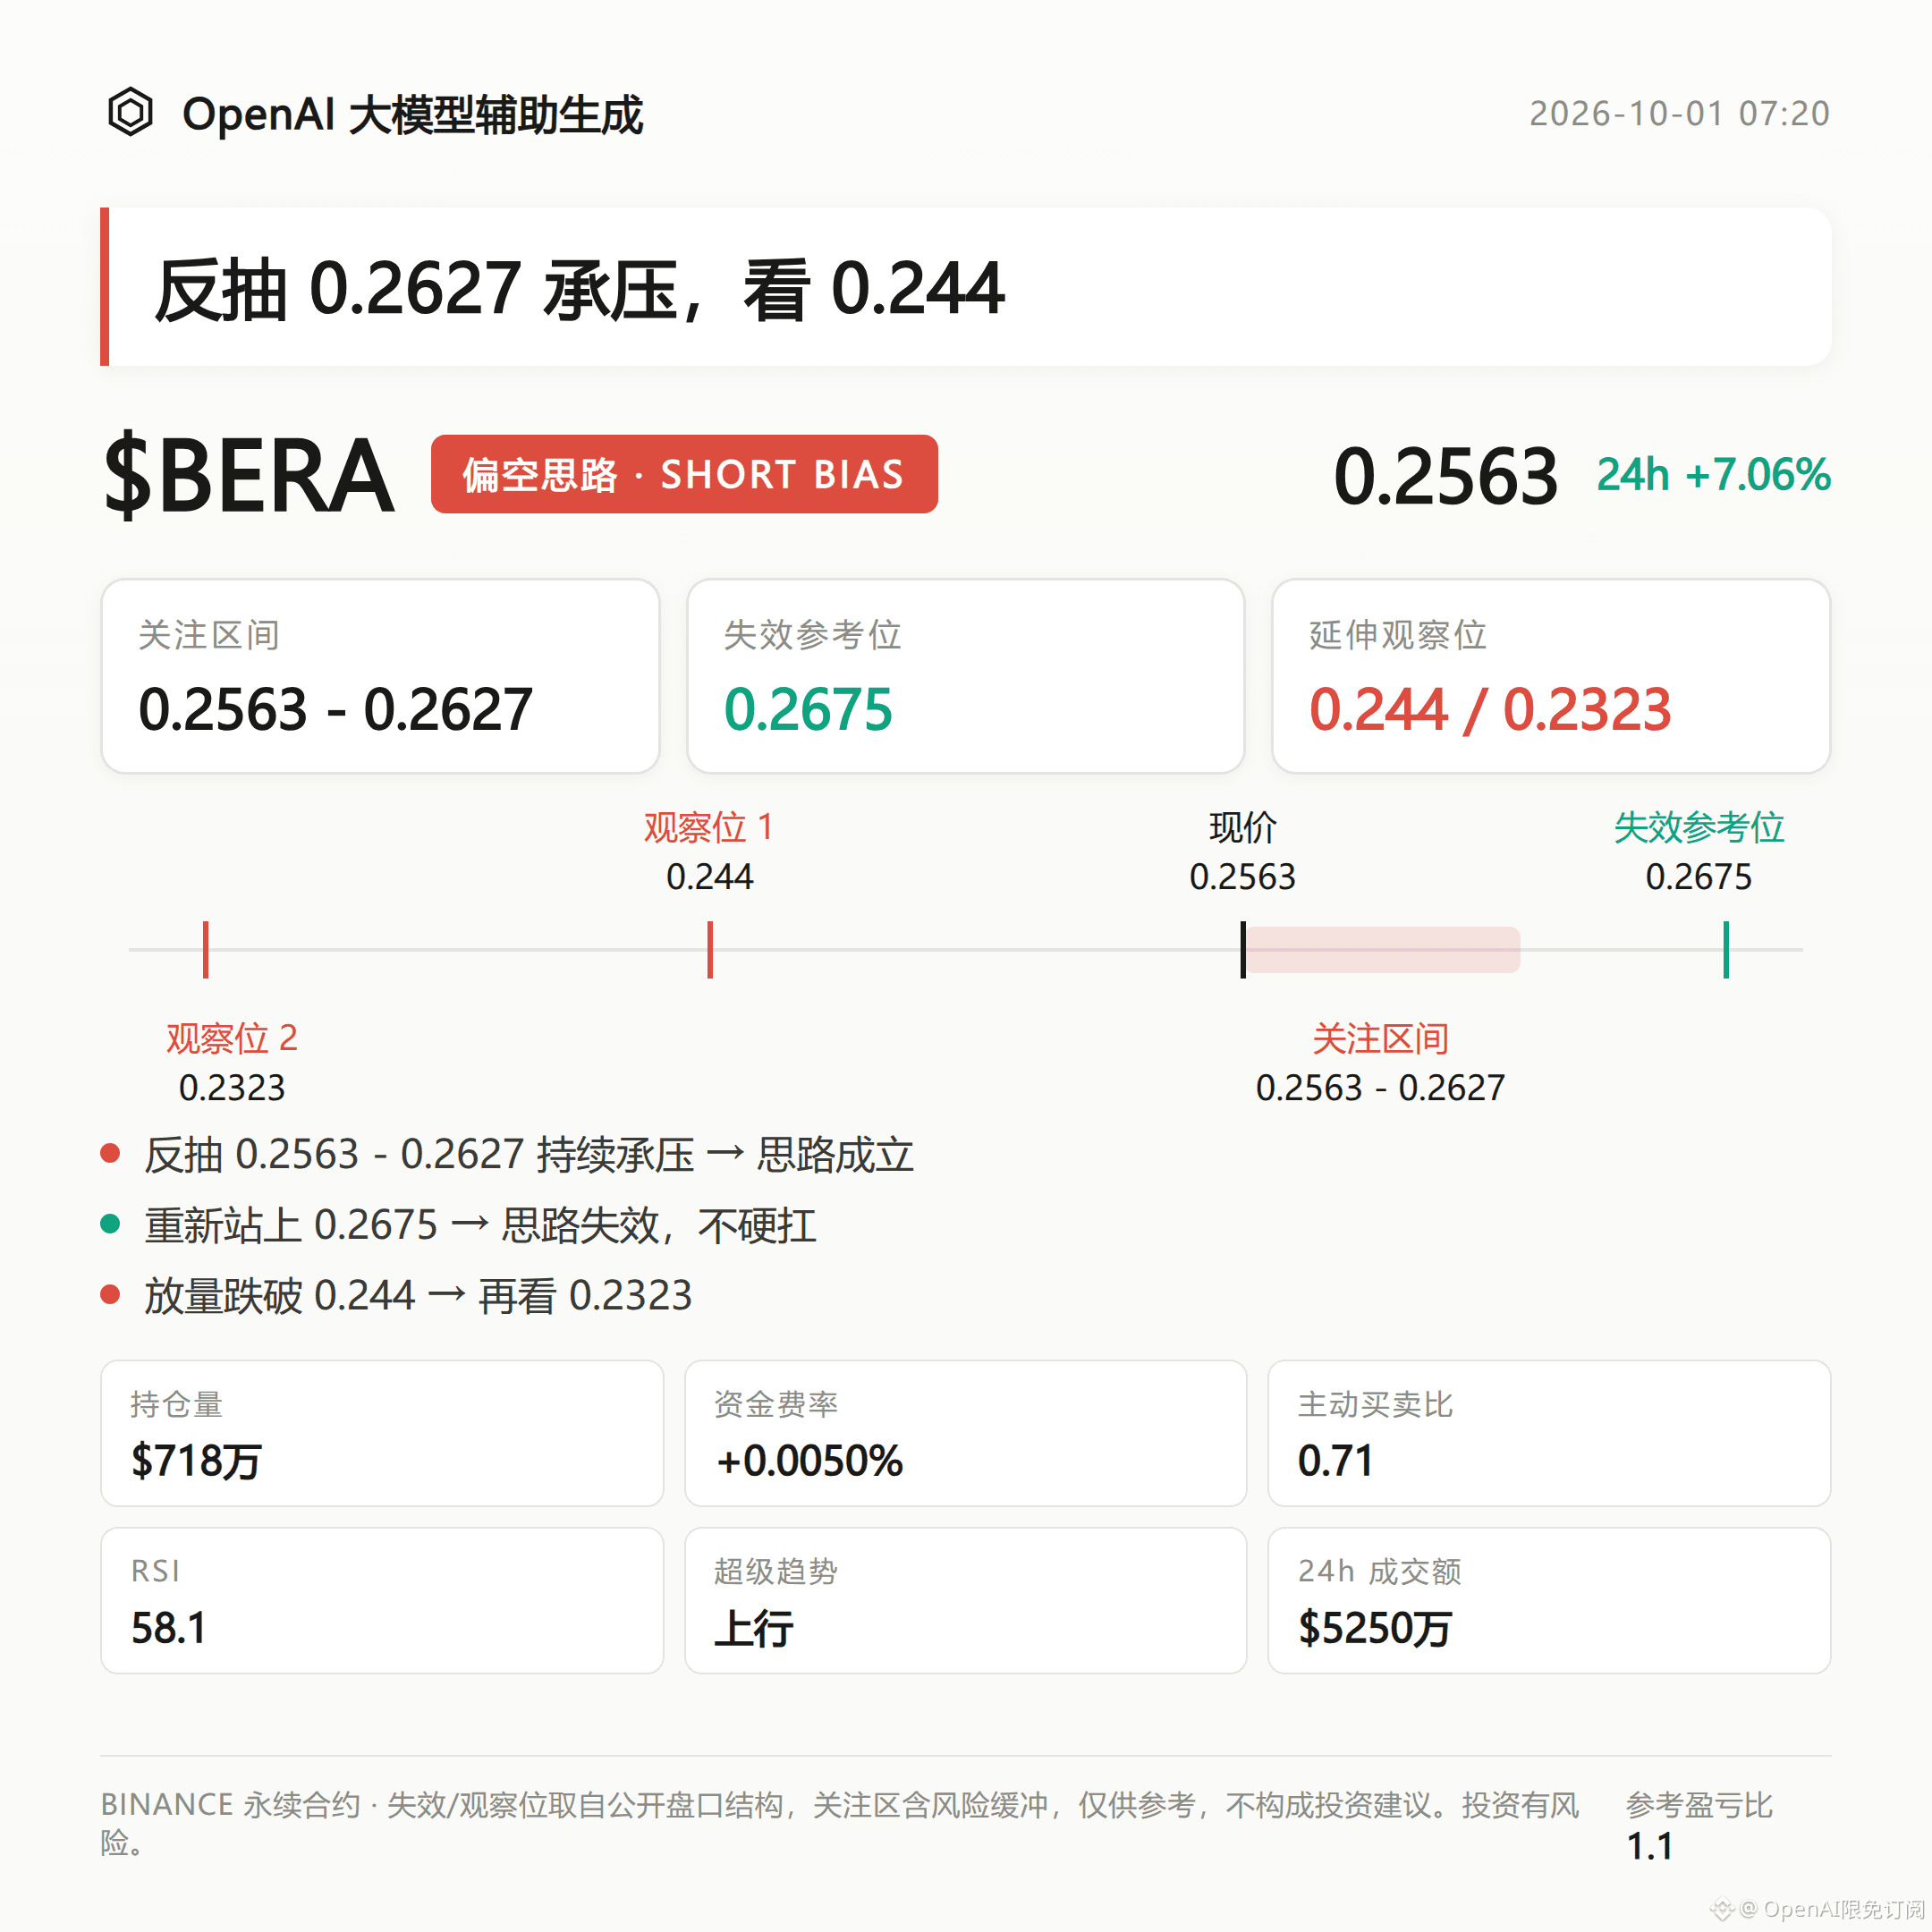
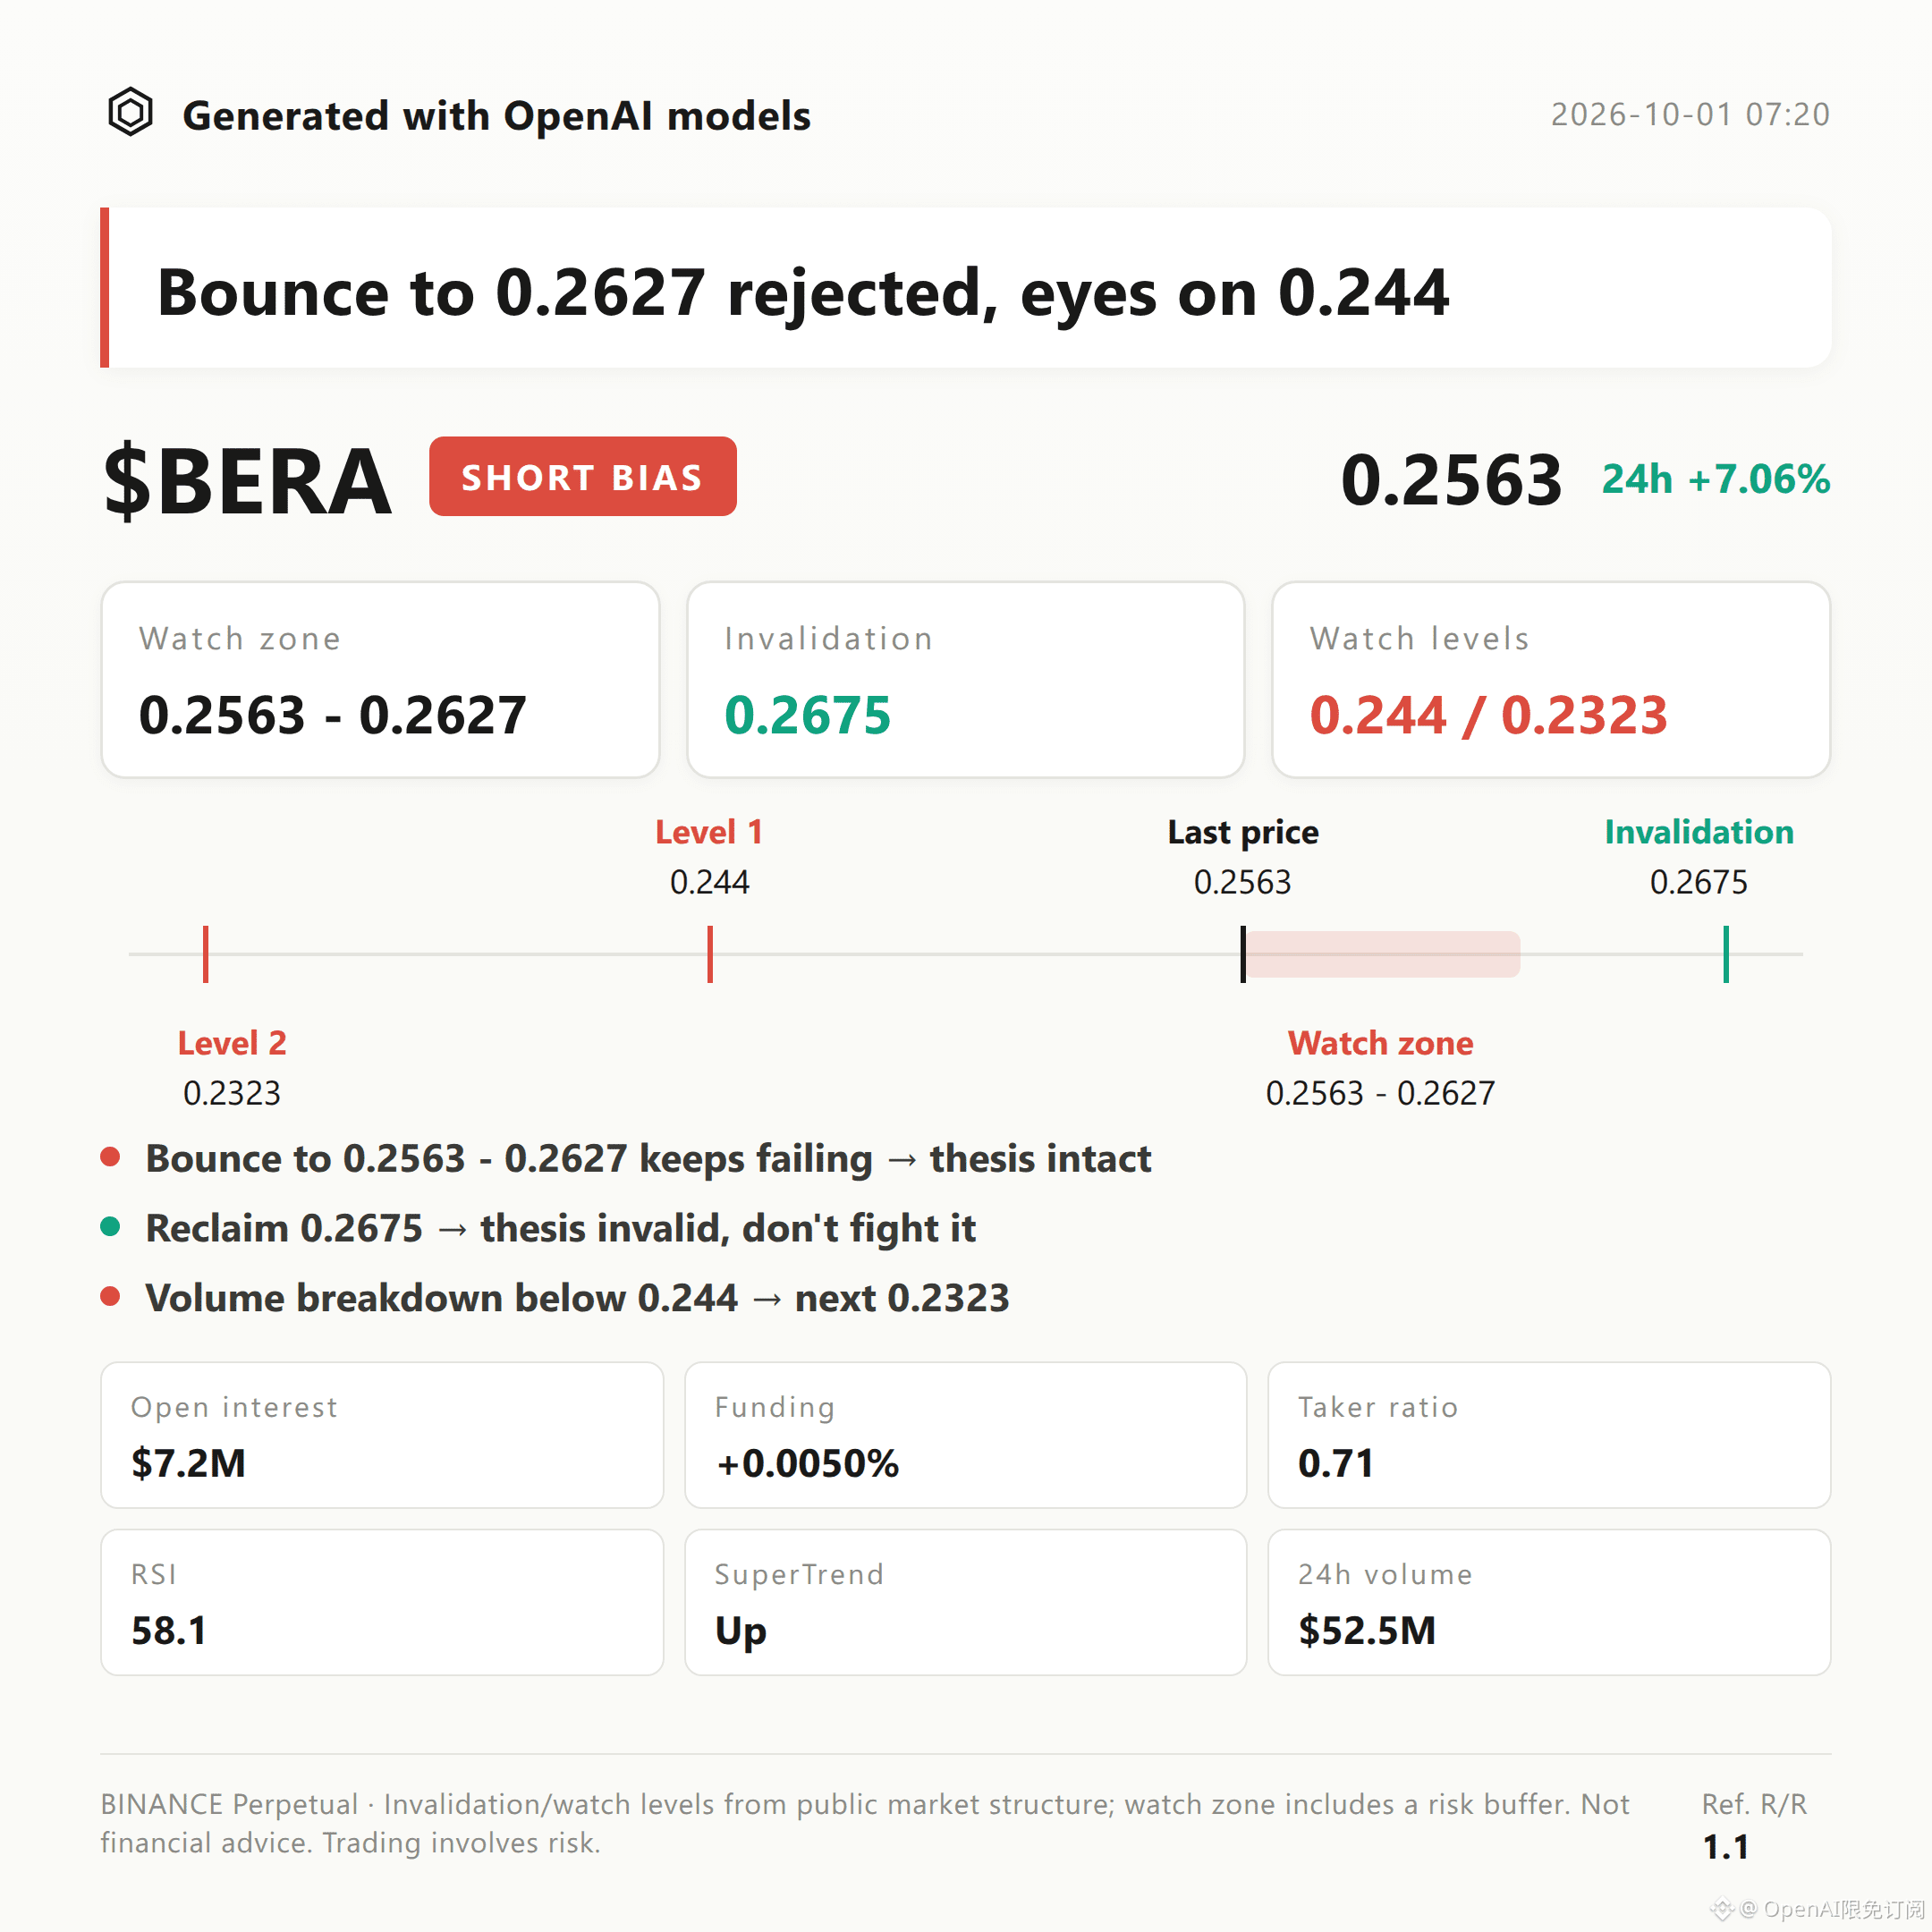
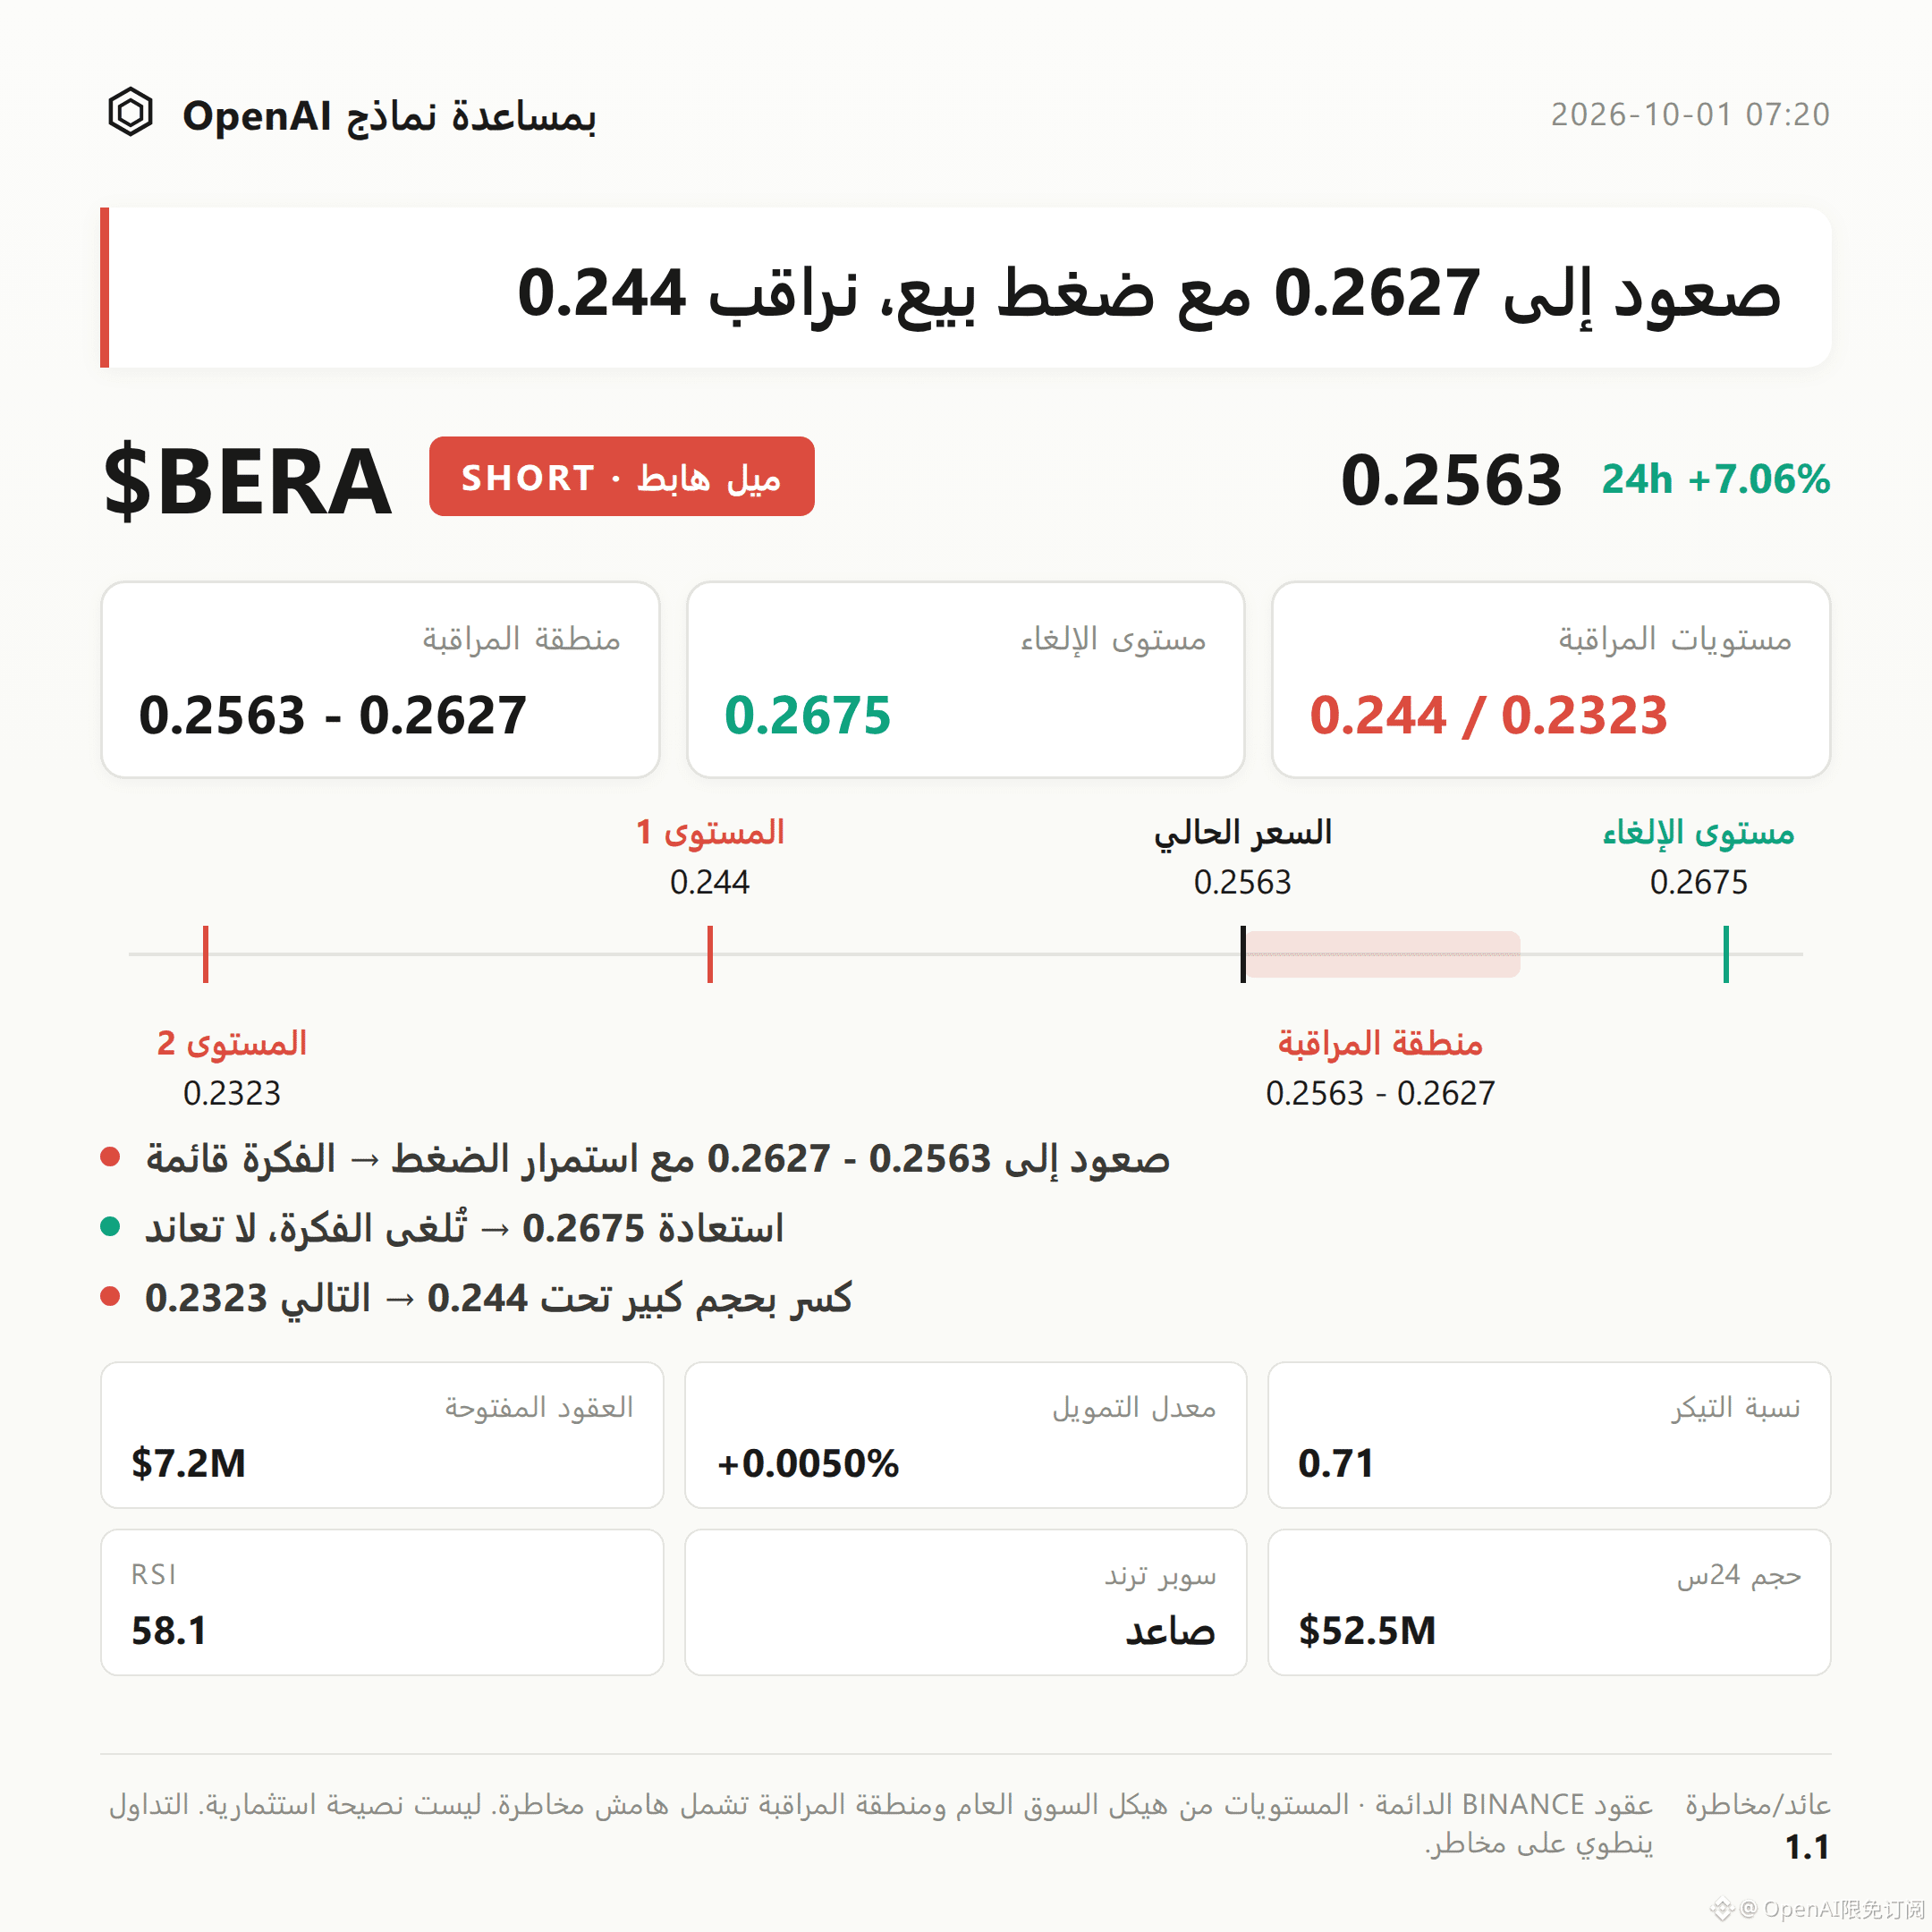
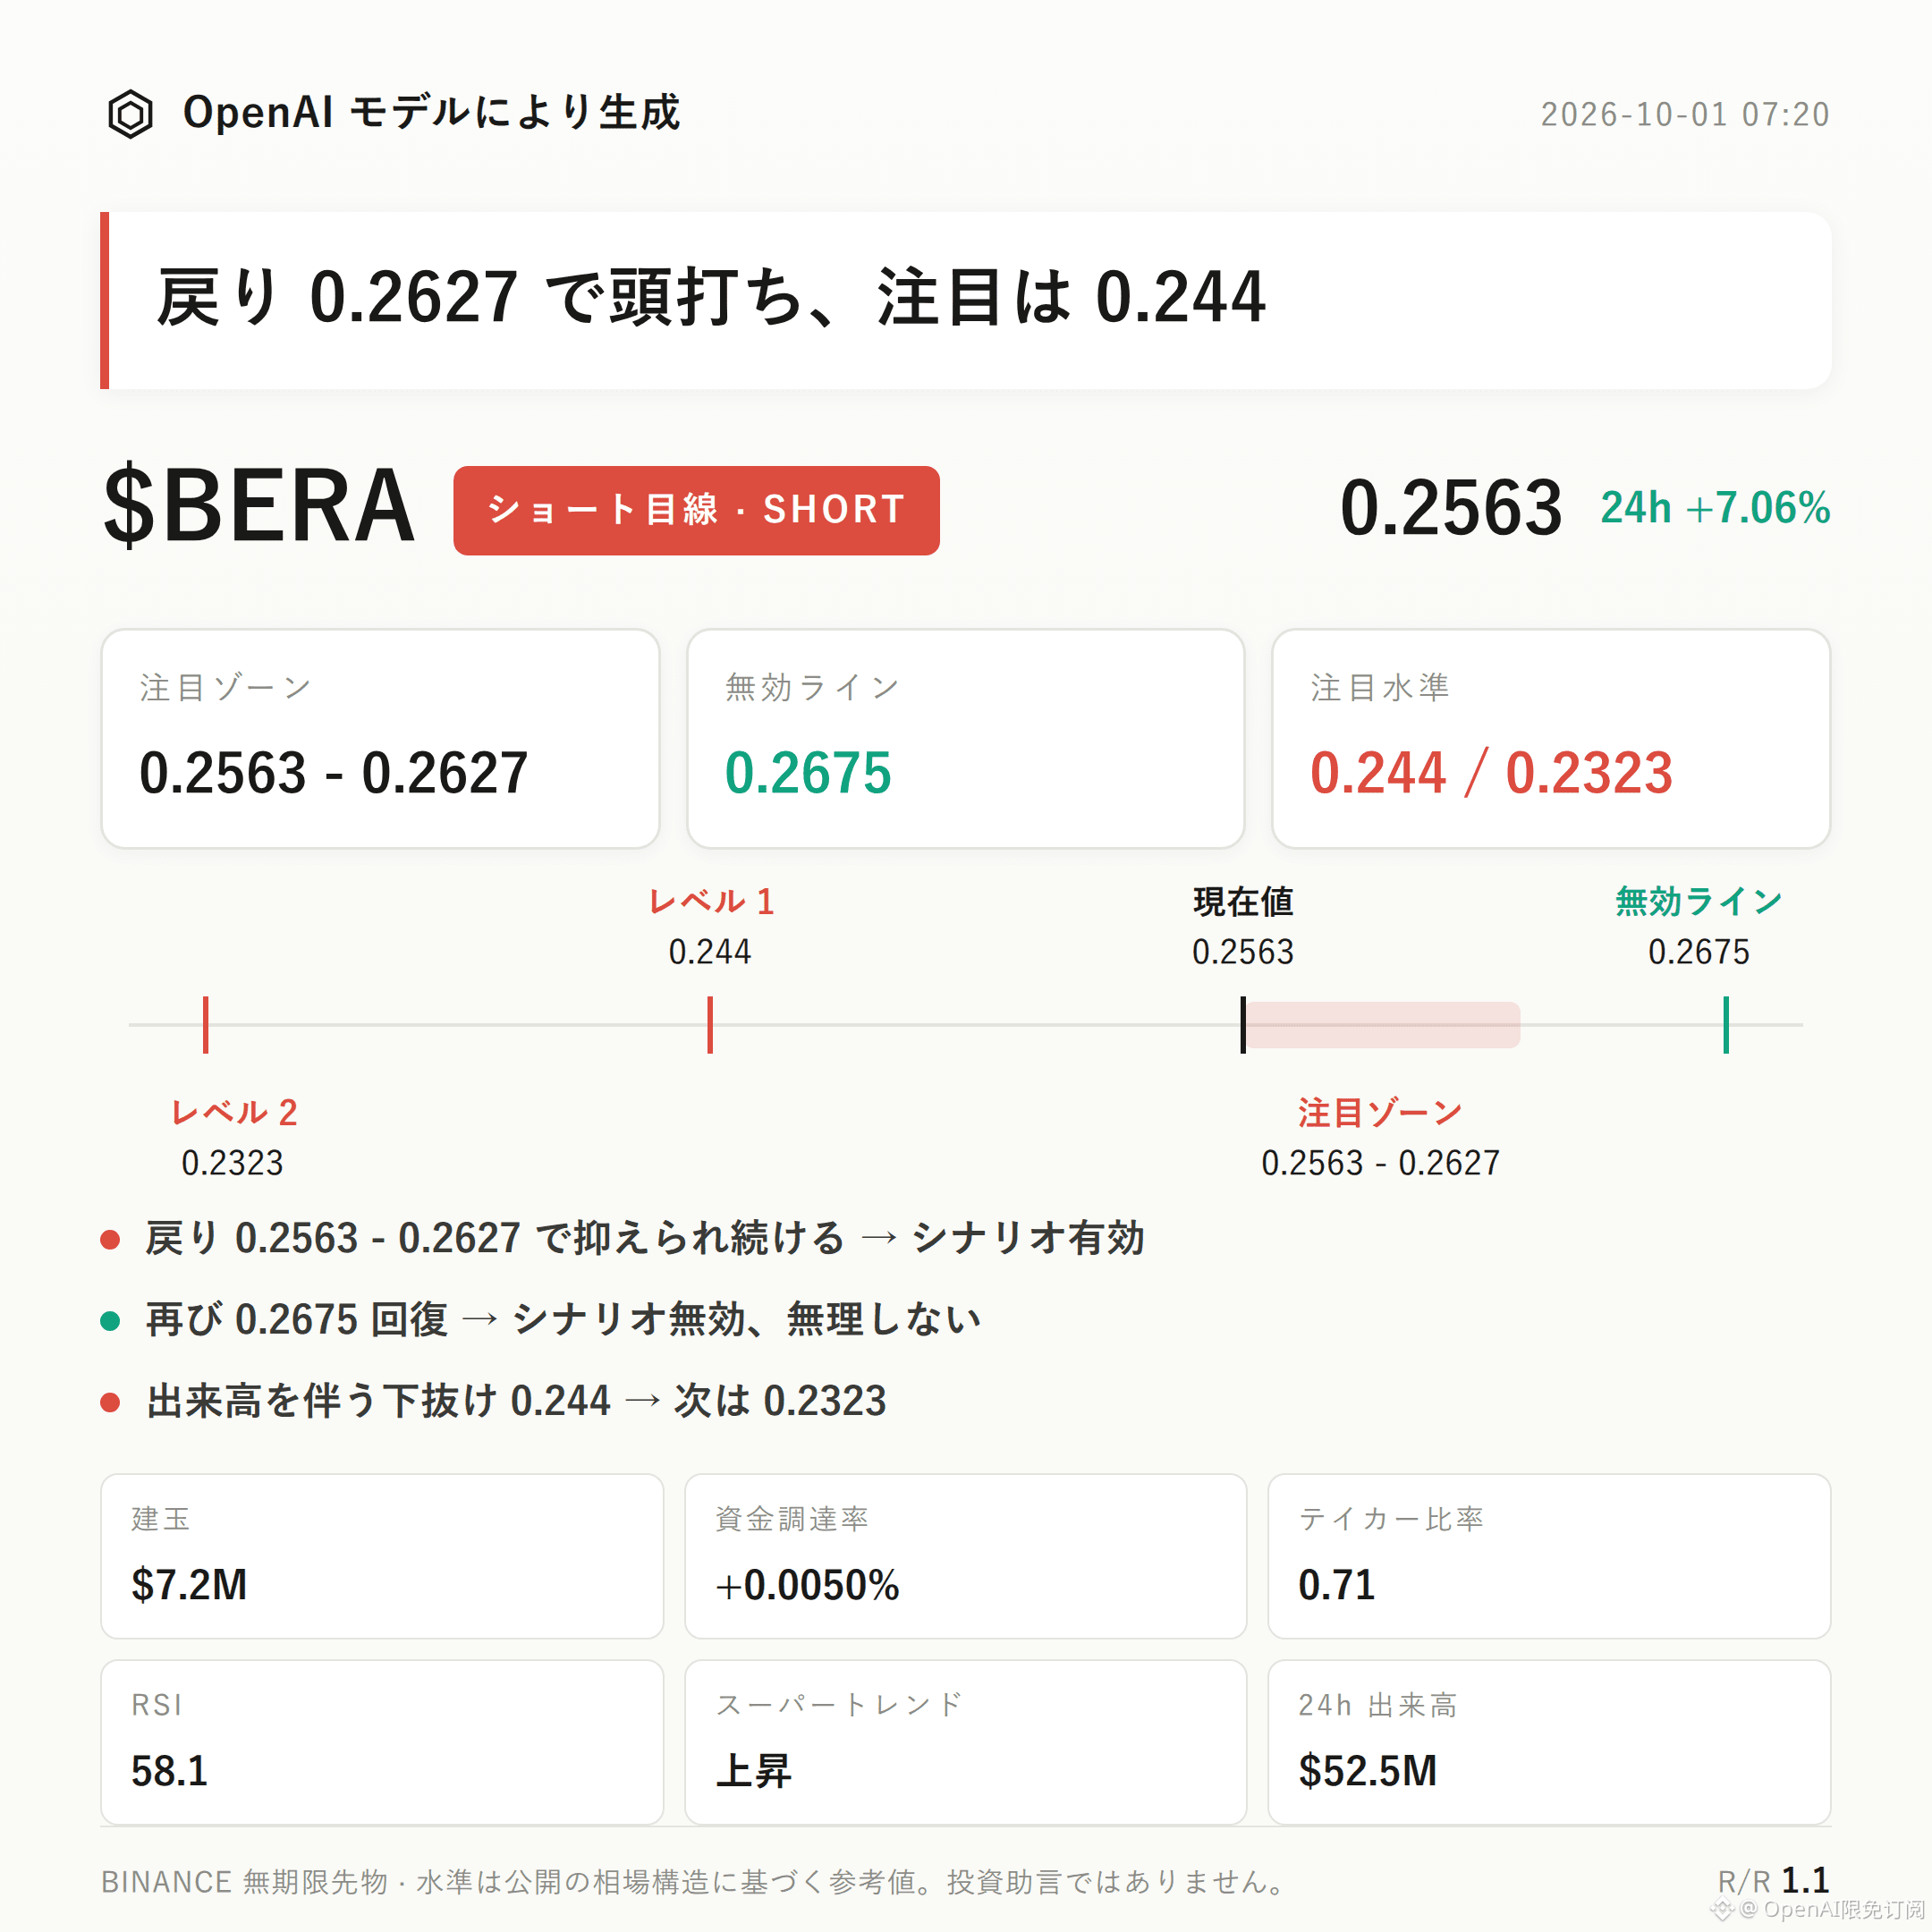
20
·
--
Trading Thesis|10/1 06:20
$1000BONK Bullish Bias|Focus Zone 0.0037 - 0.003744|Invalidation Reference 0.003603|Watch Levels 0.004 / 0.004034
$1000BONK is currently forming a bullish structure.
Supertrend is pointing upward, MACD maintains bullish momentum, and the 24h price change is +3.34%.
The key is whether the bullish focus zone can continue to form support.
Current price is 0.003744, below the Bollinger midline (0.0038), near the lower band (around 0.0037).
RSI is 47.0, still in a healthy range; recent highs and lows are 0.004034 and 0.003603 respectively.
Trend signals are bullish, but the price still needs to reclaim the midline to further strengthen the structure.
24h trading volume is $51.53M, open interest is $17.73M, with a +2.0% increase in 24h; price and open interest are rising together.
Funding rate is +0.0050%—the market is generally bullish, but it still cannot independently confirm continuation of the breakout.
For longs, first look at 0.0037 - 0.003744; it’s more suitable to wait for confirmation after a pullback and support.
If the pullback into this focus zone produces support, then the bullish thesis remains valid.
If the invalidation reference at 0.003603 is triggered, it means the current upward structure is broken—the bullish thesis is invalid; don’t linger.
If there is a breakout with volume above the first watch level at 0.004, then reassess near 0.004034 for resistance.
The reference risk-reward ratio is 1.8; still, it requires conditional confirmation.
The reverse evidence is also clear: long account share is 66%, implying a risk of crowded positioning. The active buy/sell ratio is 0.89, suggesting active buyers are not yet dominant.
If price cannot hold the focus zone, or if there is a lack of transaction support during the move upward, be wary of pullbacks caused by long crowding.
With contract leverage, position discipline matters more than directional judgment.
For reference only; not investment advice. Contracts involve leverage, and investing is risky.
This article is generated with the assistance of an OpenAI large model.
$1000BONK #Contract Analysis
Trading Thesis|10/1 06:20
$1000BONK Bullish Bias|Focus Zone 0.0037 - 0.003744|Invalidation Reference 0.003603|Watch Levels 0.004 / 0.004034
$1000BONK is currently forming a bullish structure.
Supertrend is pointing upward, MACD maintains bullish momentum, and the 24h price change is +3.34%.
The key is whether the bullish focus zone can continue to form support.
Current price is 0.003744, below the Bollinger midline (0.0038), near the lower band (around 0.0037).
RSI is 47.0, still in a healthy range; recent highs and lows are 0.004034 and 0.003603 respectively.
Trend signals are bullish, but the price still needs to reclaim the midline to further strengthen the structure.
24h trading volume is $51.53M, open interest is $17.73M, with a +2.0% increase in 24h; price and open interest are rising together.
Funding rate is +0.0050%—the market is generally bullish, but it still cannot independently confirm continuation of the breakout.
For longs, first look at 0.0037 - 0.003744; it’s more suitable to wait for confirmation after a pullback and support.
If the pullback into this focus zone produces support, then the bullish thesis remains valid.
If the invalidation reference at 0.003603 is triggered, it means the current upward structure is broken—the bullish thesis is invalid; don’t linger.
If there is a breakout with volume above the first watch level at 0.004, then reassess near 0.004034 for resistance.
The reference risk-reward ratio is 1.8; still, it requires conditional confirmation.
The reverse evidence is also clear: long account share is 66%, implying a risk of crowded positioning. The active buy/sell ratio is 0.89, suggesting active buyers are not yet dominant.
If price cannot hold the focus zone, or if there is a lack of transaction support during the move upward, be wary of pullbacks caused by long crowding.
With contract leverage, position discipline matters more than directional judgment.
For reference only; not investment advice. Contracts involve leverage, and investing is risky.
This article is generated with the assistance of an OpenAI large model.
$1000BONK #Contract Analysis
$1000BONK Bullish Bias|Focus Zone 0.0037 - 0.003744|Invalidation Reference 0.003603|Watch Levels 0.004 / 0.004034
$1000BONK is currently forming a bullish structure.
Supertrend is pointing upward, MACD maintains bullish momentum, and the 24h price change is +3.34%.
The key is whether the bullish focus zone can continue to form support.
Current price is 0.003744, below the Bollinger midline (0.0038), near the lower band (around 0.0037).
RSI is 47.0, still in a healthy range; recent highs and lows are 0.004034 and 0.003603 respectively.
Trend signals are bullish, but the price still needs to reclaim the midline to further strengthen the structure.
24h trading volume is $51.53M, open interest is $17.73M, with a +2.0% increase in 24h; price and open interest are rising together.
Funding rate is +0.0050%—the market is generally bullish, but it still cannot independently confirm continuation of the breakout.
For longs, first look at 0.0037 - 0.003744; it’s more suitable to wait for confirmation after a pullback and support.
If the pullback into this focus zone produces support, then the bullish thesis remains valid.
If the invalidation reference at 0.003603 is triggered, it means the current upward structure is broken—the bullish thesis is invalid; don’t linger.
If there is a breakout with volume above the first watch level at 0.004, then reassess near 0.004034 for resistance.
The reference risk-reward ratio is 1.8; still, it requires conditional confirmation.
The reverse evidence is also clear: long account share is 66%, implying a risk of crowded positioning. The active buy/sell ratio is 0.89, suggesting active buyers are not yet dominant.
If price cannot hold the focus zone, or if there is a lack of transaction support during the move upward, be wary of pullbacks caused by long crowding.
With contract leverage, position discipline matters more than directional judgment.
For reference only; not investment advice. Contracts involve leverage, and investing is risky.
This article is generated with the assistance of an OpenAI large model.
$1000BONK #Contract Analysis
12
Log in to explore more content
Join global crypto users on Binance Square
⚡️ Get latest and useful information about crypto.
💬 Trusted by the world’s largest crypto exchange.
👍 Discover real insights from verified creators.
Email / Phone number
Trending Topics
NEARFallsToAround$4.70Down14%
2,754 views
13 Discussing
🚨 $NEAR — FROM ETF HYPE TO A 14% SLAP IN THE FACE.
NEAR has dropped toward $4.70, giving back a big chunk of its recent run after briefly trading above $5.50. The selloff also came as NEAR Intents disclosed a security incident tied to its cross-chain infrastructure, with reported losses around $3.8M. The underlying NEAR blockchain itself was not reported as compromised.
Here’s the part traders should care about:
$4.69–$4.74 is now the key support zone.
Hold it, and this could simply be a violent retest after the September breakout.
Lose it?
The next downside references sit closer to $4.58, then ~$4.30.
And the irony?
The new Bitwise NEAR ETF was still seeing positive inflows around launch week.
So this isn’t a simple “nobody wants NEAR” story.
It’s a battle between:
fresh institutional access
vs.
post-rally profit-taking + security fear.
$NEAR doesn’t need hype right now. It needs $4.70 to hold. 👀
#NEARFallsToAround$4.70Down14% #EvernorthPlansNasdaqListingOct8 #SECProposesCryptoCustodyFramework #IMFApproves$139MDisbursementToElSalvador #AnthropicTargetsIPOAsSoonAsMidNovember
KimHotbae
·0 Likes
·221 views
EthereumFoundationLaunchesZkAPIOnMainnet
30 views
22 Discussing
EvernorthPlansNasdaqListingOct8
4,598 views
61 Discussing