
Siyam3678
3.5k Posts

Siyam3678
Report
Block User
🐳 Crypto Whale Tracker | 📊 Daily Market Analysis & Insights | 🚀 Spot & Futures Trading Tips | Helping you grow your portfolio safely.
High-Frequency Trader
7.1 Months
26 Following
155 Followers
491 Liked
Posts
All
Quotes
Live
PINNED
·
--
Bearish
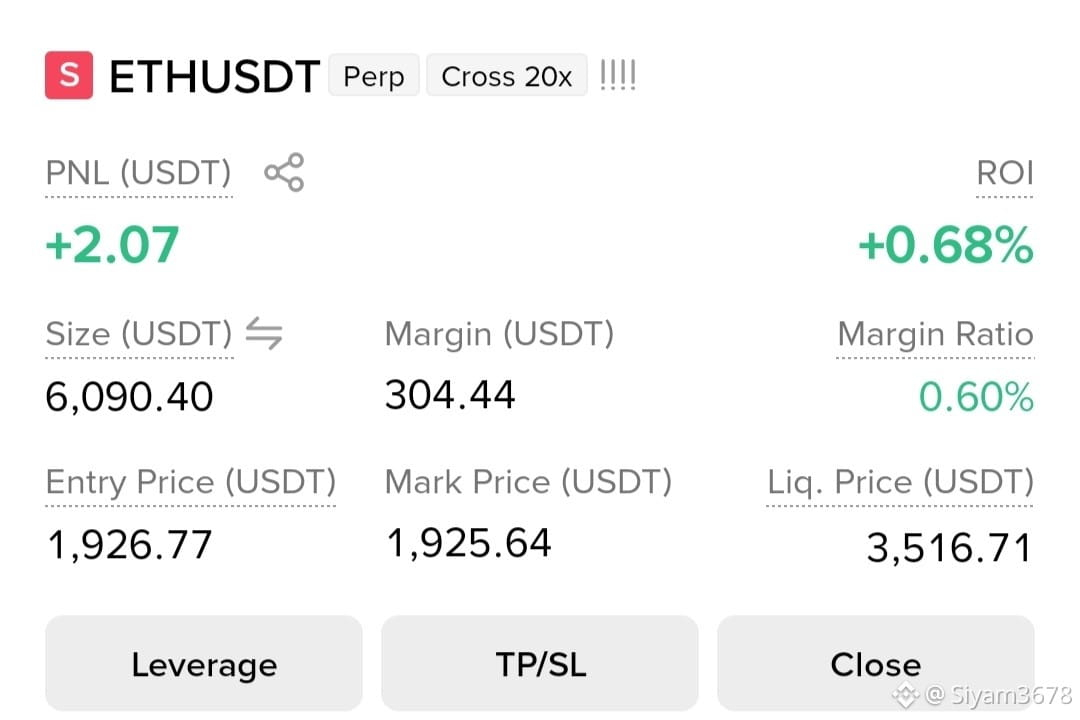
🔴 $ETH Ethereum has suffered a brutal breakdown on the 4H chart, smashing through support to hit a new low of 1,915.03 with heavy selling volume. The price is now trading well below the EMA(7) at 1,986 and the bearish Supertrend at 2,047, confirming strong downward momentum. While the RSI(6) is extremely oversold at 11.78, suggesting a potential dead cat bounce, the overall structure remains bearish, making any rally toward the 1,980-2,000 zone a prime opportunity to short.
Trade Setup
Entry: 1,930 - 1,921
Stop-Loss: 2,050
Targets: 1,915 - 1,850 - 1,800
Trade smart, protect your capital, and always manage your own risk. Personal analysis only not financial advice.
#ETH #ETHUSDT #CryptoSignals #BinanceSquare
{future}(ETHUSDT)
🔴 $ETH Ethereum has suffered a brutal breakdown on the 4H chart, smashing through support to hit a new low of 1,915.03 with heavy selling volume. The price is now trading well below the EMA(7) at 1,986 and the bearish Supertrend at 2,047, confirming strong downward momentum. While the RSI(6) is extremely oversold at 11.78, suggesting a potential dead cat bounce, the overall structure remains bearish, making any rally toward the 1,980-2,000 zone a prime opportunity to short.
Trade Setup
Entry: 1,930 - 1,921
Stop-Loss: 2,050
Targets: 1,915 - 1,850 - 1,800
Trade smart, protect your capital, and always manage your own risk. Personal analysis only not financial advice.
#ETH #ETHUSDT #CryptoSignals #BinanceSquare
Trade Setup
Entry: 1,930 - 1,921
Stop-Loss: 2,050
Targets: 1,915 - 1,850 - 1,800
Trade smart, protect your capital, and always manage your own risk. Personal analysis only not financial advice.
#ETH #ETHUSDT #CryptoSignals #BinanceSquare
1
1
·
--
Bullish
🟢 $BULLA The 4H chart shows a massive capitulation candle driving the price down to 0.04531, pushing the RSI(6) to an extremely oversold 6.14 and StochRSI to absolute zero, signaling a high-probability dead-cat bounce is imminent as sellers exhaust themselves. With price significantly deviated below the EMA(7) at 0.05348, a mean reversion move back toward the moving averages is highly likely before the broader downtrend resumes.
Trade Setup
Entry: 0.04630
Stop-Loss: 0.04450
Targets: 0.05050 - 0.05350 - 0.05820
Trade smart, protect your capital, and always manage your own risk. Personal analysis only not financial advice.
#BULLA #BULLAUSDT #CryptoSignals #BinanceSquare #AnthropicRejectsIPODelayValuationinQuestion
{future}(BULLAUSDT)
🟢 $BULLA The 4H chart shows a massive capitulation candle driving the price down to 0.04531, pushing the RSI(6) to an extremely oversold 6.14 and StochRSI to absolute zero, signaling a high-probability dead-cat bounce is imminent as sellers exhaust themselves. With price significantly deviated below the EMA(7) at 0.05348, a mean reversion move back toward the moving averages is highly likely before the broader downtrend resumes.
Trade Setup
Entry: 0.04630
Stop-Loss: 0.04450
Targets: 0.05050 - 0.05350 - 0.05820
Trade smart, protect your capital, and always manage your own risk. Personal analysis only not financial advice.
#BULLA #BULLAUSDT #CryptoSignals #BinanceSquare #AnthropicRejectsIPODelayValuationinQuestion
Trade Setup
Entry: 0.04630
Stop-Loss: 0.04450
Targets: 0.05050 - 0.05350 - 0.05820
Trade smart, protect your capital, and always manage your own risk. Personal analysis only not financial advice.
#BULLA #BULLAUSDT #CryptoSignals #BinanceSquare #AnthropicRejectsIPODelayValuationinQuestion
1
68
·
--
Bearish
🔴 $AGT Alaya Governance Token is experiencing a severe hangover after its parabolic run to 0.086, with the price crashing 25% and slicing through the short-term EMA(7). The Supertrend has flipped bearish at 0.08287, and while the RSI has cooled to 47, the structure suggests this current green candle is likely a dead cat bounce rather than a reversal. Traders should look to short any recovery that fails to break back above the 0.060 resistance level (EMA 7), targeting the EMA(25) support below.
Trade Setup
Entry: 0.05900 - 0.06100
Stop-Loss: 0.06600
Targets: 0.05000 - 0.04600 - 0.04000
Trade smart, protect your capital, and always manage your own risk. Personal analysis only not financial advice.
#AGT #AGTUSDT #CryptoSignals #BinanceSquare #AnthropicRejectsIPODelayValuationinQuestion
{future}(AGTUSDT)
🔴 $AGT Alaya Governance Token is experiencing a severe hangover after its parabolic run to 0.086, with the price crashing 25% and slicing through the short-term EMA(7). The Supertrend has flipped bearish at 0.08287, and while the RSI has cooled to 47, the structure suggests this current green candle is likely a dead cat bounce rather than a reversal. Traders should look to short any recovery that fails to break back above the 0.060 resistance level (EMA 7), targeting the EMA(25) support below.
Trade Setup
Entry: 0.05900 - 0.06100
Stop-Loss: 0.06600
Targets: 0.05000 - 0.04600 - 0.04000
Trade smart, protect your capital, and always manage your own risk. Personal analysis only not financial advice.
#AGT #AGTUSDT #CryptoSignals #BinanceSquare #AnthropicRejectsIPODelayValuationinQuestion
Trade Setup
Entry: 0.05900 - 0.06100
Stop-Loss: 0.06600
Targets: 0.05000 - 0.04600 - 0.04000
Trade smart, protect your capital, and always manage your own risk. Personal analysis only not financial advice.
#AGT #AGTUSDT #CryptoSignals #BinanceSquare #AnthropicRejectsIPODelayValuationinQuestion
1
266
·
--
Bearish
🔴 $JCT Jancction is experiencing a massive capitulation event, crashing nearly 50% as the price collapses well below the EMA(7) and EMA(25) with heavy selling volume. While the RSI(6) has hit an extreme low of 15.89, the Supertrend remains aggressively bearish at 0.005582, suggesting that any relief rally toward the 0.0027 resistance is likely a "dead cat bounce" and a prime opportunity for sellers to enter.
Trade Setup
Entry: 0.002100 - 0.002150
Stop-Loss: 0.003200
Targets: 0.002000 - 0.001800 - 0.001500
Trade smart, protect your capital, and always manage your own risk. Personal analysis only not financial advice.
#JCT #JCTUSDT #CryptoSignals #BinanceSquare #AnthropicRejectsIPODelayValuationinQuestion
{future}(JCTUSDT)
🔴 $JCT Jancction is experiencing a massive capitulation event, crashing nearly 50% as the price collapses well below the EMA(7) and EMA(25) with heavy selling volume. While the RSI(6) has hit an extreme low of 15.89, the Supertrend remains aggressively bearish at 0.005582, suggesting that any relief rally toward the 0.0027 resistance is likely a "dead cat bounce" and a prime opportunity for sellers to enter.
Trade Setup
Entry: 0.002100 - 0.002150
Stop-Loss: 0.003200
Targets: 0.002000 - 0.001800 - 0.001500
Trade smart, protect your capital, and always manage your own risk. Personal analysis only not financial advice.
#JCT #JCTUSDT #CryptoSignals #BinanceSquare #AnthropicRejectsIPODelayValuationinQuestion
Trade Setup
Entry: 0.002100 - 0.002150
Stop-Loss: 0.003200
Targets: 0.002000 - 0.001800 - 0.001500
Trade smart, protect your capital, and always manage your own risk. Personal analysis only not financial advice.
#JCT #JCTUSDT #CryptoSignals #BinanceSquare #AnthropicRejectsIPODelayValuationinQuestion
2
1
394
·
--
Bullish
🟢 $BWET Breakwave Tanker Shipping is staging a violent relief rally from the 515.00 bottom, driven by a massive volume spike that has propelled the price above the EMA(7) and EMA(25) resistance cluster. The Supertrend has flipped bullish at 526.89 to confirm the momentum shift, but with the StochRSI maxed out at 99, traders should look for a pullback to the 575-583 zone to enter safely before targeting the 24h high of 603.
Trade Setup
Entry: 585.00 - 587.00
Stop-Loss: 525.00
Targets: 603.00 - 650.00 - 715.00
Trade smart, protect your capital, and always manage your own risk. Personal analysis only not financial advice.
#BWET #BWETUSDT #CryptoSignals #BinanceSquare
{future}(BWETUSDT)
🟢 $BWET Breakwave Tanker Shipping is staging a violent relief rally from the 515.00 bottom, driven by a massive volume spike that has propelled the price above the EMA(7) and EMA(25) resistance cluster. The Supertrend has flipped bullish at 526.89 to confirm the momentum shift, but with the StochRSI maxed out at 99, traders should look for a pullback to the 575-583 zone to enter safely before targeting the 24h high of 603.
Trade Setup
Entry: 585.00 - 587.00
Stop-Loss: 525.00
Targets: 603.00 - 650.00 - 715.00
Trade smart, protect your capital, and always manage your own risk. Personal analysis only not financial advice.
#BWET #BWETUSDT #CryptoSignals #BinanceSquare
Trade Setup
Entry: 585.00 - 587.00
Stop-Loss: 525.00
Targets: 603.00 - 650.00 - 715.00
Trade smart, protect your capital, and always manage your own risk. Personal analysis only not financial advice.
#BWET #BWETUSDT #CryptoSignals #BinanceSquare
1
8
·
--
Bullish
🟢 $CBRS Cerebras has unleashed a massive bullish breakout on the 4H chart, surging with a huge volume spike that shattered the declining EMA(99) resistance and flipped the Supertrend green. Although the RSI is overheated at 85, this powerful move from the 77.93 bottom indicates strong momentum, suggesting any pullback to the EMA(7) around 108 will likely be bought up as traders target the previous high of 121.16.
Trade Setup
Entry: 114.00 - 114.50
Stop-Loss: 100.00
Targets: 121.16 - 130.00 - 140.00
Trade smart, protect your capital, and always manage your own risk. Personal analysis only not financial advice.
#CBRS #CBRSUSDT #CryptoSignals #BinanceSquare
{future}(CBRSUSDT)
🟢 $CBRS Cerebras has unleashed a massive bullish breakout on the 4H chart, surging with a huge volume spike that shattered the declining EMA(99) resistance and flipped the Supertrend green. Although the RSI is overheated at 85, this powerful move from the 77.93 bottom indicates strong momentum, suggesting any pullback to the EMA(7) around 108 will likely be bought up as traders target the previous high of 121.16.
Trade Setup
Entry: 114.00 - 114.50
Stop-Loss: 100.00
Targets: 121.16 - 130.00 - 140.00
Trade smart, protect your capital, and always manage your own risk. Personal analysis only not financial advice.
#CBRS #CBRSUSDT #CryptoSignals #BinanceSquare
Trade Setup
Entry: 114.00 - 114.50
Stop-Loss: 100.00
Targets: 121.16 - 130.00 - 140.00
Trade smart, protect your capital, and always manage your own risk. Personal analysis only not financial advice.
#CBRS #CBRSUSDT #CryptoSignals #BinanceSquare
1
105
·
--
Bearish
🔴 $HYPE is showing a broader bearish trend despite a short-term recovery, currently trading at $72.34 after bouncing from the $69.419 support. Price is slightly above EMA(7) at $72.071 but remains below EMA(25) at $73.316, EMA(99) at $78.171, and bearish Supertrend at $75.582. RSI(6) at 53.19 suggests neutral momentum, but weak volume and overhead resistance favor another rejection unless buyers reclaim $73.30–$75.60.
Trade Setup
Entry: $73.00 – $73.50
Stop-Loss: $76.00
Targets: $71.00 - $69.50 - $67.50
Trade smart, protect your capital, and always manage your own risk. Personal analysis only not financial advice.
#HYPE #HYPEUSDT #CryptoSignals #BinanceSquare
{future}(HYPEUSDT)
🔴 $HYPE is showing a broader bearish trend despite a short-term recovery, currently trading at $72.34 after bouncing from the $69.419 support. Price is slightly above EMA(7) at $72.071 but remains below EMA(25) at $73.316, EMA(99) at $78.171, and bearish Supertrend at $75.582. RSI(6) at 53.19 suggests neutral momentum, but weak volume and overhead resistance favor another rejection unless buyers reclaim $73.30–$75.60.
Trade Setup
Entry: $73.00 – $73.50
Stop-Loss: $76.00
Targets: $71.00 - $69.50 - $67.50
Trade smart, protect your capital, and always manage your own risk. Personal analysis only not financial advice.
#HYPE #HYPEUSDT #CryptoSignals #BinanceSquare
Trade Setup
Entry: $73.00 – $73.50
Stop-Loss: $76.00
Targets: $71.00 - $69.50 - $67.50
Trade smart, protect your capital, and always manage your own risk. Personal analysis only not financial advice.
#HYPE #HYPEUSDT #CryptoSignals #BinanceSquare
1
189
·
--
Bearish
🔴 $SOL is showing strong bearish momentum, currently trading at $80.19 and testing the recent support at $79.97. Price remains below EMA(7) at $81.81, EMA(25) at $84.15, EMA(99) at $90.98, and bearish Supertrend at $85.55, confirming continued selling pressure. RSI(6) at 14.51 and StochRSI at 9.51 indicate extreme oversold conditions, while negative MACD supports the bearish trend; a temporary bounce is possible, but a breakdown below $79.97 could accelerate further losses.
Trade Setup
Entry: $80.50 – $81.00
Stop-Loss: $83.00
Targets: $78.50 - $76.50 - $74.50
Trade smart, protect your capital, and always manage your own risk. Personal analysis only not financial advice.
#SOL #SOLUSDT #CryptoSignals #BinanceSquare
{future}(SOLUSDT)
🔴 $SOL is showing strong bearish momentum, currently trading at $80.19 and testing the recent support at $79.97. Price remains below EMA(7) at $81.81, EMA(25) at $84.15, EMA(99) at $90.98, and bearish Supertrend at $85.55, confirming continued selling pressure. RSI(6) at 14.51 and StochRSI at 9.51 indicate extreme oversold conditions, while negative MACD supports the bearish trend; a temporary bounce is possible, but a breakdown below $79.97 could accelerate further losses.
Trade Setup
Entry: $80.50 – $81.00
Stop-Loss: $83.00
Targets: $78.50 - $76.50 - $74.50
Trade smart, protect your capital, and always manage your own risk. Personal analysis only not financial advice.
#SOL #SOLUSDT #CryptoSignals #BinanceSquare
Trade Setup
Entry: $80.50 – $81.00
Stop-Loss: $83.00
Targets: $78.50 - $76.50 - $74.50
Trade smart, protect your capital, and always manage your own risk. Personal analysis only not financial advice.
#SOL #SOLUSDT #CryptoSignals #BinanceSquare
2
484
·
--
Bearish
🔴 $BTC is showing strong bearish momentum, trading at $70,263 after a sharp 4.64% decline and approaching the recent low of $70,123. Price is below EMA(7) at $71,847, EMA(25) at $73,467, EMA(99) at $76,354, and bearish Supertrend at $73,671, confirming strong selling pressure. RSI(6) at 8.4 and StochRSI near zero indicate extreme oversold conditions, while negative MACD confirms bearish momentum; a short-term relief bounce is possible, but a breakdown below $70,123 could trigger further downside.
Trade Setup
Entry: $70,500 – $71,200
Stop-Loss: $72,100
Targets: $69,500 - $68,500 - $67,000
Trade smart, protect your capital, and always manage your own risk. Personal analysis only not financial advice.
#BTC #BTCUSDC #CryptoSignals #BinanceSquare
{future}(BTCUSDT)
🔴 $BTC is showing strong bearish momentum, trading at $70,263 after a sharp 4.64% decline and approaching the recent low of $70,123. Price is below EMA(7) at $71,847, EMA(25) at $73,467, EMA(99) at $76,354, and bearish Supertrend at $73,671, confirming strong selling pressure. RSI(6) at 8.4 and StochRSI near zero indicate extreme oversold conditions, while negative MACD confirms bearish momentum; a short-term relief bounce is possible, but a breakdown below $70,123 could trigger further downside.
Trade Setup
Entry: $70,500 – $71,200
Stop-Loss: $72,100
Targets: $69,500 - $68,500 - $67,000
Trade smart, protect your capital, and always manage your own risk. Personal analysis only not financial advice.
#BTC #BTCUSDC #CryptoSignals #BinanceSquare
Trade Setup
Entry: $70,500 – $71,200
Stop-Loss: $72,100
Targets: $69,500 - $68,500 - $67,000
Trade smart, protect your capital, and always manage your own risk. Personal analysis only not financial advice.
#BTC #BTCUSDC #CryptoSignals #BinanceSquare
2
275
·
--
Bullish
🟢 $CBRS is showing explosive bullish momentum, currently trading at $116.74 after a 16.81% surge and breaking above the previous resistance zone near $101.93. Price is well above EMA(7) at $107.05, EMA(25) at $99.69, EMA(99) at $101.75, and bullish Supertrend at $99.83, with a massive volume spike confirming strong buying pressure. However, RSI(6) at 86.21 and StochRSI at 84.82 indicate extreme overbought conditions, so a pullback toward $110–$107 is possible before another attempt to break the $117.28 resistance.
Trade Setup
Entry: $108.00 – $112.00
Stop-Loss: $103.00
Targets: $122.00 - $128.00 - $135.00
Trade smart, protect your capital, and always manage your own risk. Personal analysis only not financial advice.
#CBRS #CBRSUSDT #CryptoSignals #BinanceSquare
{future}(CBRSUSDT)
🟢 $CBRS is showing explosive bullish momentum, currently trading at $116.74 after a 16.81% surge and breaking above the previous resistance zone near $101.93. Price is well above EMA(7) at $107.05, EMA(25) at $99.69, EMA(99) at $101.75, and bullish Supertrend at $99.83, with a massive volume spike confirming strong buying pressure. However, RSI(6) at 86.21 and StochRSI at 84.82 indicate extreme overbought conditions, so a pullback toward $110–$107 is possible before another attempt to break the $117.28 resistance.
Trade Setup
Entry: $108.00 – $112.00
Stop-Loss: $103.00
Targets: $122.00 - $128.00 - $135.00
Trade smart, protect your capital, and always manage your own risk. Personal analysis only not financial advice.
#CBRS #CBRSUSDT #CryptoSignals #BinanceSquare
Trade Setup
Entry: $108.00 – $112.00
Stop-Loss: $103.00
Targets: $122.00 - $128.00 - $135.00
Trade smart, protect your capital, and always manage your own risk. Personal analysis only not financial advice.
#CBRS #CBRSUSDT #CryptoSignals #BinanceSquare
1
161
·
--
Bearish
🔴 $ZEC is maintaining a strong bearish trend, currently trading at $958.98 after dropping to a recent low of $930.21. Price remains below MA(7) at $967.61, MA(25) at $1,062.30, MA(99) at $1,213.08, and bearish Supertrend at $1,080.21, confirming continued selling pressure. RSI(6) at 26.28 indicates oversold conditions, while StochRSI is recovering, suggesting a possible temporary bounce; however, failure to reclaim $967–$1,000 could trigger another decline.
Trade Setup
Entry: $965 – $975
Stop-Loss: $1,010
Targets: $940 - $920 - $890
Trade smart, protect your capital, and always manage your own risk. Personal analysis only not financial advice.
#ZEC #ZECUSDT #CryptoSignals #BinanceSquare
{future}(ZECUSDT)
🔴 $ZEC is maintaining a strong bearish trend, currently trading at $958.98 after dropping to a recent low of $930.21. Price remains below MA(7) at $967.61, MA(25) at $1,062.30, MA(99) at $1,213.08, and bearish Supertrend at $1,080.21, confirming continued selling pressure. RSI(6) at 26.28 indicates oversold conditions, while StochRSI is recovering, suggesting a possible temporary bounce; however, failure to reclaim $967–$1,000 could trigger another decline.
Trade Setup
Entry: $965 – $975
Stop-Loss: $1,010
Targets: $940 - $920 - $890
Trade smart, protect your capital, and always manage your own risk. Personal analysis only not financial advice.
#ZEC #ZECUSDT #CryptoSignals #BinanceSquare
Trade Setup
Entry: $965 – $975
Stop-Loss: $1,010
Targets: $940 - $920 - $890
Trade smart, protect your capital, and always manage your own risk. Personal analysis only not financial advice.
#ZEC #ZECUSDT #CryptoSignals #BinanceSquare
2
427
·
--
Bullish
🟢 $MAGMA is showing a strong bullish reversal, currently trading at $0.33360 with a 25.39% gain after recovering from the $0.22252 low. Price has broken above MA(7) at $0.28466 and MA(25) at $0.25315 and is now testing MA(99) at $0.32671, while Supertrend remains bullish at $0.24468. RSI(6) at 82.11 signals overbought conditions, but the strong volume spike confirms aggressive buying; a breakout above $0.33736 could open the way toward higher resistance levels.
Trade Setup
Entry: $0.31500 – $0.32800
Stop-Loss: $0.29800
Targets: $0.35000 - $0.37500 - $0.40000
Trade smart, protect your capital, and always manage your own risk. Personal analysis only not financial advice.
#MAGMA #MAGMAUSDT #CryptoSignals #BinanceSquare
{future}(MAGMAUSDT)
🟢 $MAGMA is showing a strong bullish reversal, currently trading at $0.33360 with a 25.39% gain after recovering from the $0.22252 low. Price has broken above MA(7) at $0.28466 and MA(25) at $0.25315 and is now testing MA(99) at $0.32671, while Supertrend remains bullish at $0.24468. RSI(6) at 82.11 signals overbought conditions, but the strong volume spike confirms aggressive buying; a breakout above $0.33736 could open the way toward higher resistance levels.
Trade Setup
Entry: $0.31500 – $0.32800
Stop-Loss: $0.29800
Targets: $0.35000 - $0.37500 - $0.40000
Trade smart, protect your capital, and always manage your own risk. Personal analysis only not financial advice.
#MAGMA #MAGMAUSDT #CryptoSignals #BinanceSquare
Trade Setup
Entry: $0.31500 – $0.32800
Stop-Loss: $0.29800
Targets: $0.35000 - $0.37500 - $0.40000
Trade smart, protect your capital, and always manage your own risk. Personal analysis only not financial advice.
#MAGMA #MAGMAUSDT #CryptoSignals #BinanceSquare
1
169
·
--
Bullish
🟢$BARD is showing a powerful bullish breakout, surging 40.21% to $0.1198 after breaking above the previous consolidation zone and all major moving averages. Price is above MA(7) at $0.0891, MA(25) at $0.0952, MA(99) at $0.1063, with bullish Supertrend at $0.0838 and massive volume confirming strong buying pressure. However, RSI(6) at 89.03 indicates extreme overbought conditions, so a pullback toward $0.1090–$0.1060 is possible before another bullish continuation toward $0.1280.
Trade Setup
Entry: $0.1080 – $0.1130
Stop-Loss: $0.1030
Targets: $0.1280 - $0.1350 - $0.1450
Trade smart, protect your capital, and always manage your own risk. Personal analysis only not financial advice.
#BARD #BARDUSDT #CryptoSignals #BinanceSquare
{future}(BARDUSDT)
🟢$BARD is showing a powerful bullish breakout, surging 40.21% to $0.1198 after breaking above the previous consolidation zone and all major moving averages. Price is above MA(7) at $0.0891, MA(25) at $0.0952, MA(99) at $0.1063, with bullish Supertrend at $0.0838 and massive volume confirming strong buying pressure. However, RSI(6) at 89.03 indicates extreme overbought conditions, so a pullback toward $0.1090–$0.1060 is possible before another bullish continuation toward $0.1280.
Trade Setup
Entry: $0.1080 – $0.1130
Stop-Loss: $0.1030
Targets: $0.1280 - $0.1350 - $0.1450
Trade smart, protect your capital, and always manage your own risk. Personal analysis only not financial advice.
#BARD #BARDUSDT #CryptoSignals #BinanceSquare
Trade Setup
Entry: $0.1080 – $0.1130
Stop-Loss: $0.1030
Targets: $0.1280 - $0.1350 - $0.1450
Trade smart, protect your capital, and always manage your own risk. Personal analysis only not financial advice.
#BARD #BARDUSDT #CryptoSignals #BinanceSquare
1
355
·
--
Bearish
🔴 $SOL is showing strong bearish momentum, trading at $81.28 after breaking down toward the recent low of $80.42. Price is below MA(7) at $82.82, MA(25) at $84.65, MA(99) at $92.22, and the bearish Supertrend at $86.49, confirming downside pressure. RSI(6) at 19.92 indicates oversold conditions, so a temporary bounce is possible, but weak buying volume and bearish StochRSI favor further downside unless SOL reclaims $82.80–$84.65.
Trade Setup
Entry: $81.50 – $82.50
Stop-Loss: $84.00
Targets: $80.40 - $78.50 - $76.50
Trade smart, protect your capital, and always manage your own risk. Personal analysis only not financial advice.
#SOL #SOLUSDT #CryptoSignals #BinanceSquare
{future}(SOLUSDT)
🔴 $SOL is showing strong bearish momentum, trading at $81.28 after breaking down toward the recent low of $80.42. Price is below MA(7) at $82.82, MA(25) at $84.65, MA(99) at $92.22, and the bearish Supertrend at $86.49, confirming downside pressure. RSI(6) at 19.92 indicates oversold conditions, so a temporary bounce is possible, but weak buying volume and bearish StochRSI favor further downside unless SOL reclaims $82.80–$84.65.
Trade Setup
Entry: $81.50 – $82.50
Stop-Loss: $84.00
Targets: $80.40 - $78.50 - $76.50
Trade smart, protect your capital, and always manage your own risk. Personal analysis only not financial advice.
#SOL #SOLUSDT #CryptoSignals #BinanceSquare
Trade Setup
Entry: $81.50 – $82.50
Stop-Loss: $84.00
Targets: $80.40 - $78.50 - $76.50
Trade smart, protect your capital, and always manage your own risk. Personal analysis only not financial advice.
#SOL #SOLUSDT #CryptoSignals #BinanceSquare
2
358
·
--
Bullish
🟢 $AGT is showing a strong bullish trend after a massive breakout from $0.02272 to $0.08299, with the current price around $0.06671. Price is trading below MA(7) at $0.07188 but remains above MA(25) at $0.03915 and MA(99) at $0.03575, while Supertrend remains bullish at $0.04887. RSI(6) at 68.44 and declining volume suggest a short-term pullback, but holding the $0.05950 support could trigger another upward move toward $0.08300 resistance.
Trade Setup
Entry: $0.06400 – $0.06700
Stop-Loss: $0.05800
Targets: $0.07300 - $0.07800 - $0.08300
Trade smart, protect your capital, and always manage your own risk. Personal analysis only not financial advice.
#AGT #AGTUSDT #CryptoSignals #BinanceSquare #AnthropicRejectsIPODelayValuationinQuestion
{future}(AGTUSDT)
🟢 $AGT is showing a strong bullish trend after a massive breakout from $0.02272 to $0.08299, with the current price around $0.06671. Price is trading below MA(7) at $0.07188 but remains above MA(25) at $0.03915 and MA(99) at $0.03575, while Supertrend remains bullish at $0.04887. RSI(6) at 68.44 and declining volume suggest a short-term pullback, but holding the $0.05950 support could trigger another upward move toward $0.08300 resistance.
Trade Setup
Entry: $0.06400 – $0.06700
Stop-Loss: $0.05800
Targets: $0.07300 - $0.07800 - $0.08300
Trade smart, protect your capital, and always manage your own risk. Personal analysis only not financial advice.
#AGT #AGTUSDT #CryptoSignals #BinanceSquare #AnthropicRejectsIPODelayValuationinQuestion
Trade Setup
Entry: $0.06400 – $0.06700
Stop-Loss: $0.05800
Targets: $0.07300 - $0.07800 - $0.08300
Trade smart, protect your capital, and always manage your own risk. Personal analysis only not financial advice.
#AGT #AGTUSDT #CryptoSignals #BinanceSquare #AnthropicRejectsIPODelayValuationinQuestion
1
518
·
--
Bullish
🟢 $ERA is showing strong bullish momentum with a massive breakout above all major moving averages, supported by high volume and a bullish Supertrend. Although the RSI is extremely overbought, indicating a potential short-term pullback, the overall trend remains strongly upward as the price challenges the recent resistance high. A successful hold above the breakout zone confirms continuation toward higher targets.
Trade Setup
Entry: 0.09500 - 0.09850
Stop-Loss: 0.08800
Targets: 0.10226 - 0.11000 - 0.12500
Trade smart, protect your capital, and always manage your own risk. Personal analysis only not financial advice.
#ERA #ERAUSDT #CryptoSignals #BinanceSquare #AnthropicRejectsIPODelayValuationinQuestion
{future}(ERAUSDT)
🟢 $ERA is showing strong bullish momentum with a massive breakout above all major moving averages, supported by high volume and a bullish Supertrend. Although the RSI is extremely overbought, indicating a potential short-term pullback, the overall trend remains strongly upward as the price challenges the recent resistance high. A successful hold above the breakout zone confirms continuation toward higher targets.
Trade Setup
Entry: 0.09500 - 0.09850
Stop-Loss: 0.08800
Targets: 0.10226 - 0.11000 - 0.12500
Trade smart, protect your capital, and always manage your own risk. Personal analysis only not financial advice.
#ERA #ERAUSDT #CryptoSignals #BinanceSquare #AnthropicRejectsIPODelayValuationinQuestion
Trade Setup
Entry: 0.09500 - 0.09850
Stop-Loss: 0.08800
Targets: 0.10226 - 0.11000 - 0.12500
Trade smart, protect your capital, and always manage your own risk. Personal analysis only not financial advice.
#ERA #ERAUSDT #CryptoSignals #BinanceSquare #AnthropicRejectsIPODelayValuationinQuestion
1
154
·
--
Bullish
🟢$DJT is showing strong bullish recovery after bouncing from the 3.800 bottom and holding firmly above the MA(99) support at 5.088 and Supertrend (4.611). With RSI(6) at 59.16 and solid buying volume backing the move, a clean push above MA(7) (5.223) can trigger the next upward leg toward recent highs.
Trade Setup
Entry: 5.080 – 5.120
Stop-Loss: 4.850
Targets: 5.350 - 5.650 - 6.000
Trade smart, protect your capital, and always manage your own risk. Personal analysis only not financial advice.
#DJT #DJTUSDT #CryptoSignals #BinanceSquare #AnthropicRejectsIPODelayValuationinQuestion
{future}(DJTUSDT)
🟢$DJT is showing strong bullish recovery after bouncing from the 3.800 bottom and holding firmly above the MA(99) support at 5.088 and Supertrend (4.611). With RSI(6) at 59.16 and solid buying volume backing the move, a clean push above MA(7) (5.223) can trigger the next upward leg toward recent highs.
Trade Setup
Entry: 5.080 – 5.120
Stop-Loss: 4.850
Targets: 5.350 - 5.650 - 6.000
Trade smart, protect your capital, and always manage your own risk. Personal analysis only not financial advice.
#DJT #DJTUSDT #CryptoSignals #BinanceSquare #AnthropicRejectsIPODelayValuationinQuestion
Trade Setup
Entry: 5.080 – 5.120
Stop-Loss: 4.850
Targets: 5.350 - 5.650 - 6.000
Trade smart, protect your capital, and always manage your own risk. Personal analysis only not financial advice.
#DJT #DJTUSDT #CryptoSignals #BinanceSquare #AnthropicRejectsIPODelayValuationinQuestion
1
183
·
--
Bearish
🔴 $JCT is showing signs of a weak recovery within a broader bearish market structure on the 4-hour timeframe. Despite gaining approximately 11.08%, the price is still trading below the major VWAP and MA(25) resistance levels. The Supertrend remains bearish at 0.012284 USDT, while the Parabolic SAR is also positioned well above the current price, confirming that the broader bearish pressure has not yet disappeared. RSI(6) is currently at 41.39, indicating that bullish momentum remains relatively weak. Additionally, OBV is declining, suggesting that buying pressure is not yet strong enough to confirm a genuine trend reversal. After the massive spike toward 0.021344 USDT and the subsequent sharp correction, JCT is consolidating near its recent lows. If the current recovery fails near resistance, another downward move toward 0.00500 USDT and potentially 0.00450 USDT could follow.
Entry: 0.00650 – 0.00720 USDT (SHORT on confirmed rejection)
Stop: 0.00860 USDT
Target: 0.00500 USDT - 0.00450 USDT
This is strictly my personal technical analysis based on the available 4-hour chart. Take my view only as an idea. Wait for proper bearish confirmation before entering any trade. Think for yourself, manage your risk carefully, and trade strictly at your own risk!
Only smart decisions win! 🎁💲
#JCTUpdate #JCTUSDT #BinancePick #CryptoSignals #AltcoinAnalysis
{future}(JCTUSDT)
🔴 $JCT is showing signs of a weak recovery within a broader bearish market structure on the 4-hour timeframe. Despite gaining approximately 11.08%, the price is still trading below the major VWAP and MA(25) resistance levels. The Supertrend remains bearish at 0.012284 USDT, while the Parabolic SAR is also positioned well above the current price, confirming that the broader bearish pressure has not yet disappeared. RSI(6) is currently at 41.39, indicating that bullish momentum remains relatively weak. Additionally, OBV is declining, suggesting that buying pressure is not yet strong enough to confirm a genuine trend reversal. After the massive spike toward 0.021344 USDT and the subsequent sharp correction, JCT is consolidating near its recent lows. If the current recovery fails near resistance, another downward move toward 0.00500 USDT and potentially 0.00450 USDT could follow.
Entry: 0.00650 – 0.00720 USDT (SHORT on confirmed rejection)
Stop: 0.00860 USDT
Target: 0.00500 USDT - 0.00450 USDT
This is strictly my personal technical analysis based on the available 4-hour chart. Take my view only as an idea. Wait for proper bearish confirmation before entering any trade. Think for yourself, manage your risk carefully, and trade strictly at your own risk!
Only smart decisions win! 🎁💲
#JCTUpdate #JCTUSDT #BinancePick #CryptoSignals #AltcoinAnalysis
Entry: 0.00650 – 0.00720 USDT (SHORT on confirmed rejection)
Stop: 0.00860 USDT
Target: 0.00500 USDT - 0.00450 USDT
This is strictly my personal technical analysis based on the available 4-hour chart. Take my view only as an idea. Wait for proper bearish confirmation before entering any trade. Think for yourself, manage your risk carefully, and trade strictly at your own risk!
Only smart decisions win! 🎁💲
#JCTUpdate #JCTUSDT #BinancePick #CryptoSignals #AltcoinAnalysis
1
297
·
--
Bearish
🔴 $KAS is facing continued bearish pressure on the 4-hour timeframe, with the price currently trading around 0.02892 USDT. The Supertrend remains bearish at 0.03072 USDT, while the Parabolic SAR is also positioned above the current price, confirming that sellers are still controlling the short-term trend. The price is trading below VWAP and all major moving averages, indicating weak bullish momentum. Additionally, the OBV indicator continues to decline, suggesting persistent selling pressure and a lack of strong buying support. RSI(6) is currently at 31.61, approaching oversold territory. The recent support at 0.02810 USDT is now a critical level. A decisive breakdown below this support could trigger another downward move toward 0.02750 USDT.
Entry: 0.02940 – 0.02980 USDT (SHORT on bearish rejection)
Stop: 0.03090 USDT
Target: 0.02810 USDT - 0.02750 USDT
This is strictly my personal technical analysis based on the available 4-hour chart. Take my view only as an idea. Wait for proper confirmation before entering any trade. Think for yourself, manage your risk carefully, and trade strictly at your own risk!
Only smart decisions win! 🎁💲
#KASUpdate #KASUSDT #Kaspa #BinancePick #CryptoSignals
{future}(KASUSDT)
🔴 $KAS is facing continued bearish pressure on the 4-hour timeframe, with the price currently trading around 0.02892 USDT. The Supertrend remains bearish at 0.03072 USDT, while the Parabolic SAR is also positioned above the current price, confirming that sellers are still controlling the short-term trend. The price is trading below VWAP and all major moving averages, indicating weak bullish momentum. Additionally, the OBV indicator continues to decline, suggesting persistent selling pressure and a lack of strong buying support. RSI(6) is currently at 31.61, approaching oversold territory. The recent support at 0.02810 USDT is now a critical level. A decisive breakdown below this support could trigger another downward move toward 0.02750 USDT.
Entry: 0.02940 – 0.02980 USDT (SHORT on bearish rejection)
Stop: 0.03090 USDT
Target: 0.02810 USDT - 0.02750 USDT
This is strictly my personal technical analysis based on the available 4-hour chart. Take my view only as an idea. Wait for proper confirmation before entering any trade. Think for yourself, manage your risk carefully, and trade strictly at your own risk!
Only smart decisions win! 🎁💲
#KASUpdate #KASUSDT #Kaspa #BinancePick #CryptoSignals
Entry: 0.02940 – 0.02980 USDT (SHORT on bearish rejection)
Stop: 0.03090 USDT
Target: 0.02810 USDT - 0.02750 USDT
This is strictly my personal technical analysis based on the available 4-hour chart. Take my view only as an idea. Wait for proper confirmation before entering any trade. Think for yourself, manage your risk carefully, and trade strictly at your own risk!
Only smart decisions win! 🎁💲
#KASUpdate #KASUSDT #Kaspa #BinancePick #CryptoSignals
1
46
·
--
Bearish
🔴 $H is experiencing extremely strong selling pressure, with the price dropping approximately 23.74% on the 4-hour timeframe. The chart shows a clear bearish breakdown, with price trading significantly below all major moving averages and the Supertrend resistance at 0.03937 USDT. The OBV indicator is declining sharply, confirming heavy distribution and increasing selling activity. Trading volume has also surged during the recent price decline, indicating strong participation from sellers. RSI(6) has fallen to an extremely oversold level of 7.55, suggesting that a temporary relief bounce may occur. The price is currently approaching its recent low of 0.02983 USDT. If this support breaks decisively, further downside toward 0.02850 USDT could be possible.
Entry: 0.03200 – 0.03400 USDT (SHORT on bearish rejection)
Stop: 0.03750 USDT
Target: 0.02980 USDT - 0.02850 USDT
This is strictly my personal technical analysis based on the available 4-hour chart. Take my view only as an idea. Wait for proper confirmation before entering any trade. Think for yourself, manage your risk carefully, and trade strictly at your own risk!
Only smart decisions win! 🎁💲
#HUpdate #HUSDT #StrongSellingPressure #BearishBreakdown #MarketAnalysis
{future}(HUSDT)
🔴 $H is experiencing extremely strong selling pressure, with the price dropping approximately 23.74% on the 4-hour timeframe. The chart shows a clear bearish breakdown, with price trading significantly below all major moving averages and the Supertrend resistance at 0.03937 USDT. The OBV indicator is declining sharply, confirming heavy distribution and increasing selling activity. Trading volume has also surged during the recent price decline, indicating strong participation from sellers. RSI(6) has fallen to an extremely oversold level of 7.55, suggesting that a temporary relief bounce may occur. The price is currently approaching its recent low of 0.02983 USDT. If this support breaks decisively, further downside toward 0.02850 USDT could be possible.
Entry: 0.03200 – 0.03400 USDT (SHORT on bearish rejection)
Stop: 0.03750 USDT
Target: 0.02980 USDT - 0.02850 USDT
This is strictly my personal technical analysis based on the available 4-hour chart. Take my view only as an idea. Wait for proper confirmation before entering any trade. Think for yourself, manage your risk carefully, and trade strictly at your own risk!
Only smart decisions win! 🎁💲
#HUpdate #HUSDT #StrongSellingPressure #BearishBreakdown #MarketAnalysis
Entry: 0.03200 – 0.03400 USDT (SHORT on bearish rejection)
Stop: 0.03750 USDT
Target: 0.02980 USDT - 0.02850 USDT
This is strictly my personal technical analysis based on the available 4-hour chart. Take my view only as an idea. Wait for proper confirmation before entering any trade. Think for yourself, manage your risk carefully, and trade strictly at your own risk!
Only smart decisions win! 🎁💲
#HUpdate #HUSDT #StrongSellingPressure #BearishBreakdown #MarketAnalysis
1
628
Log in to explore more content
Join global crypto users on Binance Square
⚡️ Get latest and useful information about crypto.
💬 Trusted by the world’s largest crypto exchange.
👍 Discover real insights from verified creators.
Email / Phone number
Trending Topics
WhatWillDriveCryptoandStocks’NextRebound?
21,370 views
380 Discussing
Bitcoin Slips Below $70,000 as Dollar Index Hits 19-Month High
Binance News
·11 Likes
·23.7k views
Anthropic’s6xIPODemandSignalsPotentialRecordRaise
6,487 views
165 Discussing
HuangExitNvidiaStrategyInFocus
163,000 views
1,498 Discussing