
#cbrs
cbrs
141,449 views
1,013 Discussing
Hot
Latest

·
--
Risk is defined before the trade even begins. We have established our exact defensive lines for a $CBRS position.
⚡ $CBRS — SHORT SETUP
📍 Entry: 194.19 – 195.35
🎯 TP1: 191.87
🎯 TP2: 190.33
🎯 TP3: 188.0
🛑 Stop Loss: 196.51
Trade here 👇
📌 Trade management rules: see pinned post.
Are you trading this range or waiting for a macro shift? Drop your thoughts below and follow for the next update.
#WriteToEarn #CBRS #CryptoTrading #BinanceSquare #Crypto
Risk is defined before the trade even begins. We have established our exact defensive lines for a $CBRS position.
⚡ $CBRS — SHORT SETUP
📍 Entry: 194.19 – 195.35
🎯 TP1: 191.87
🎯 TP2: 190.33
🎯 TP3: 188.0
🛑 Stop Loss: 196.51
Trade here 👇
📌 Trade management rules: see pinned post.
Are you trading this range or waiting for a macro shift? Drop your thoughts below and follow for the next update.
#WriteToEarn #CBRS #CryptoTrading #BinanceSquare #Crypto
⚡ $CBRS — SHORT SETUP
📍 Entry: 194.19 – 195.35
🎯 TP1: 191.87
🎯 TP2: 190.33
🎯 TP3: 188.0
🛑 Stop Loss: 196.51
Trade here 👇
📌 Trade management rules: see pinned post.
Are you trading this range or waiting for a macro shift? Drop your thoughts below and follow for the next update.
#WriteToEarn #CBRS #CryptoTrading #BinanceSquare #Crypto
1
102

·
--
$CBRS 24 hours, price up 5%, but the perpetual futures funding rate remains at 0. This kind of structure—prices rising while the funding rate stays flat—is usually not common in the futures market.
Typically, an upswing comes with a positive funding rate, because long demand pushes the funding rate higher. Now the rate is 0, meaning longs are paying no carry cost for their positions, and shorts are not being squeezed into paying. This suggests the current rally may not be continuously driven by leveraged longs on the derivatives side; it’s more like a one-off spot or sentiment shock, with long and short forces relatively balanced on the contract side.
Open interest of 61,000 contracts is the other key observation point. With price up, OI not surging significantly, and the funding rate staying the same, this combination points to a rise that lacks additional leverage being piled on. If prices pull back later, longs may face direct sell pressure without a funding-rate buffer.
The strongest counterevidence: if, next, there are consecutive large spot buys and open interest increases rapidly in sync, then even if the funding rate stays flat for the moment, it could still indicate an upcoming round of moves driven by spot, with leverage following afterward.
My view is based on a single signal, mainly driven by the divergence between price and funding rate. The invalidation condition is very clear: if the funding rate turns positive and is accompanied by a significant expansion in open interest, then this inference would be invalid—meaning leveraged longs are starting to enter.
Action: wait and observe; don’t chase the price.
Trading tag: #TradFi #链上美股 #CBRS
Where do you think this setup is most likely to be wrong?
$CBRS 24 hours, price up 5%, but the perpetual futures funding rate remains at 0. This kind of structure—prices rising while the funding rate stays flat—is usually not common in the futures market.
Typically, an upswing comes with a positive funding rate, because long demand pushes the funding rate higher. Now the rate is 0, meaning longs are paying no carry cost for their positions, and shorts are not being squeezed into paying. This suggests the current rally may not be continuously driven by leveraged longs on the derivatives side; it’s more like a one-off spot or sentiment shock, with long and short forces relatively balanced on the contract side.
Open interest of 61,000 contracts is the other key observation point. With price up, OI not surging significantly, and the funding rate staying the same, this combination points to a rise that lacks additional leverage being piled on. If prices pull back later, longs may face direct sell pressure without a funding-rate buffer.
The strongest counterevidence: if, next, there are consecutive large spot buys and open interest increases rapidly in sync, then even if the funding rate stays flat for the moment, it could still indicate an upcoming round of moves driven by spot, with leverage following afterward.
My view is based on a single signal, mainly driven by the divergence between price and funding rate. The invalidation condition is very clear: if the funding rate turns positive and is accompanied by a significant expansion in open interest, then this inference would be invalid—meaning leveraged longs are starting to enter.
Action: wait and observe; don’t chase the price.
Trading tag: #TradFi #链上美股 #CBRS
Where do you think this setup is most likely to be wrong?
Typically, an upswing comes with a positive funding rate, because long demand pushes the funding rate higher. Now the rate is 0, meaning longs are paying no carry cost for their positions, and shorts are not being squeezed into paying. This suggests the current rally may not be continuously driven by leveraged longs on the derivatives side; it’s more like a one-off spot or sentiment shock, with long and short forces relatively balanced on the contract side.
Open interest of 61,000 contracts is the other key observation point. With price up, OI not surging significantly, and the funding rate staying the same, this combination points to a rise that lacks additional leverage being piled on. If prices pull back later, longs may face direct sell pressure without a funding-rate buffer.
The strongest counterevidence: if, next, there are consecutive large spot buys and open interest increases rapidly in sync, then even if the funding rate stays flat for the moment, it could still indicate an upcoming round of moves driven by spot, with leverage following afterward.
My view is based on a single signal, mainly driven by the divergence between price and funding rate. The invalidation condition is very clear: if the funding rate turns positive and is accompanied by a significant expansion in open interest, then this inference would be invalid—meaning leveraged longs are starting to enter.
Action: wait and observe; don’t chase the price.
Trading tag: #TradFi #链上美股 #CBRS
Where do you think this setup is most likely to be wrong?
9

·
--
Over the past 24 hours, $CBRS has risen 3.891%, with the price tracking around 192.8 USD. The funding rate is stuck at zero, so neither longs nor shorts are paying the other side right now. Open interest is reported at 61847.26, and trading volume is a bit over 36.68 million USD; these two figures are not converted into the same unit, so there is no fair way to compare them directly. But with the funding rate at zero and price moving up, at least it suggests this rally was not driven by leveraged longs paying to keep the move going.
The angle is tied to the semiconductor AI chain, but the secondary data section is empty, so I can’t use MU, NVDA, or AMD for an instant comparison. I can only focus on $CBRS 's own order book. Funding at zero is a neutral signal: there is neither overcrowded long positioning nor pressure from squeezed shorts, so the upward momentum has to be coming from somewhere else. If open interest of 61847.26 is a contract count, then at 192.8 the notional value is roughly over ten million USD, but since the input does not specify the OI denomination, I won't guess. From funding being flat alone, this 3.891% gain looks more like spot-driven buying or a tentative probe than a result of concentrated leveraged bets.
My view: with the current price near 192.8 and funding at zero, the market is in a wait-and-see balance. If I had to act, I’d wait for two signals: first, if funding turns positive above 0.01%, that means longs are starting to pay and crowding is increasing, so I would consider a small short; second, if price breaks below 190 USD while open interest rises at the same time, that could mean shorts are entering aggressively, and I would either follow the short side or exit immediately. Conversely, if funding stays flat but price can hold above 192.8, I would add a small long position and bet on an upside impulse when the balance breaks. For now, I choose to do nothing, neither chasing the upside nor calling a top, and wait for the market to pick a direction on its own.
This analysis is most likely wrong in two ways: one, if funding keeps returning to zero and price stays range-bound, then my wait-and-see approach becomes a waste of time and the judgment fails; two, if $CBRS suddenly announces a concrete partnership with a semiconductor giant, fundamental news will overpower the funding-rate signal and I’ll need to reassess. Since there is no such announcement in the input, I’m treating this purely as a flow-driven setup.
Trading tags: #BinanceFutures #TradFi #USDⓈM #CBRS #CBRSUSDT $CBRS
Over the past 24 hours, $CBRS has risen 3.891%, with the price tracking around 192.8 USD. The funding rate is stuck at zero, so neither longs nor shorts are paying the other side right now. Open interest is reported at 61847.26, and trading volume is a bit over 36.68 million USD; these two figures are not converted into the same unit, so there is no fair way to compare them directly. But with the funding rate at zero and price moving up, at least it suggests this rally was not driven by leveraged longs paying to keep the move going.
The angle is tied to the semiconductor AI chain, but the secondary data section is empty, so I can’t use MU, NVDA, or AMD for an instant comparison. I can only focus on $CBRS 's own order book. Funding at zero is a neutral signal: there is neither overcrowded long positioning nor pressure from squeezed shorts, so the upward momentum has to be coming from somewhere else. If open interest of 61847.26 is a contract count, then at 192.8 the notional value is roughly over ten million USD, but since the input does not specify the OI denomination, I won't guess. From funding being flat alone, this 3.891% gain looks more like spot-driven buying or a tentative probe than a result of concentrated leveraged bets.
My view: with the current price near 192.8 and funding at zero, the market is in a wait-and-see balance. If I had to act, I’d wait for two signals: first, if funding turns positive above 0.01%, that means longs are starting to pay and crowding is increasing, so I would consider a small short; second, if price breaks below 190 USD while open interest rises at the same time, that could mean shorts are entering aggressively, and I would either follow the short side or exit immediately. Conversely, if funding stays flat but price can hold above 192.8, I would add a small long position and bet on an upside impulse when the balance breaks. For now, I choose to do nothing, neither chasing the upside nor calling a top, and wait for the market to pick a direction on its own.
This analysis is most likely wrong in two ways: one, if funding keeps returning to zero and price stays range-bound, then my wait-and-see approach becomes a waste of time and the judgment fails; two, if $CBRS suddenly announces a concrete partnership with a semiconductor giant, fundamental news will overpower the funding-rate signal and I’ll need to reassess. Since there is no such announcement in the input, I’m treating this purely as a flow-driven setup.
Trading tags: #BinanceFutures #TradFi #USDⓈM #CBRS #CBRSUSDT $CBRS
The angle is tied to the semiconductor AI chain, but the secondary data section is empty, so I can’t use MU, NVDA, or AMD for an instant comparison. I can only focus on $CBRS 's own order book. Funding at zero is a neutral signal: there is neither overcrowded long positioning nor pressure from squeezed shorts, so the upward momentum has to be coming from somewhere else. If open interest of 61847.26 is a contract count, then at 192.8 the notional value is roughly over ten million USD, but since the input does not specify the OI denomination, I won't guess. From funding being flat alone, this 3.891% gain looks more like spot-driven buying or a tentative probe than a result of concentrated leveraged bets.
My view: with the current price near 192.8 and funding at zero, the market is in a wait-and-see balance. If I had to act, I’d wait for two signals: first, if funding turns positive above 0.01%, that means longs are starting to pay and crowding is increasing, so I would consider a small short; second, if price breaks below 190 USD while open interest rises at the same time, that could mean shorts are entering aggressively, and I would either follow the short side or exit immediately. Conversely, if funding stays flat but price can hold above 192.8, I would add a small long position and bet on an upside impulse when the balance breaks. For now, I choose to do nothing, neither chasing the upside nor calling a top, and wait for the market to pick a direction on its own.
This analysis is most likely wrong in two ways: one, if funding keeps returning to zero and price stays range-bound, then my wait-and-see approach becomes a waste of time and the judgment fails; two, if $CBRS suddenly announces a concrete partnership with a semiconductor giant, fundamental news will overpower the funding-rate signal and I’ll need to reassess. Since there is no such announcement in the input, I’m treating this purely as a flow-driven setup.
Trading tags: #BinanceFutures #TradFi #USDⓈM #CBRS #CBRSUSDT $CBRS
51

·
--
$CBRS #CBRS
Momentum Alert: Long Alert | CBRS
CBRS 15m shows more than 1h bullish deviation; watch for further follow-through, with 1h volume beginning to rise.
Key signals: 1h turnover 1.6x / 4h turnover 2.5x / Break above 1h high 20 / Break above 1h high 55 / 1h closes above VWAP / 1h closes above EMA8/20
1h turnover: 1.6x
24h turnover: 35.6M USDT
Funding rate: +0.0290% (longs pay, shorts receive)
Score: 9/12
Short-term key level: Breakout level 192.16
Support level: 184.62
Resistance to watch: 211.38 / 230.59
After trigger, you can execute in the corresponding direction; if it fails, use the invalidation level as the stop-loss.
$CBRS #CBRS
Momentum Alert: Long Alert | CBRS
CBRS 15m shows more than 1h bullish deviation; watch for further follow-through, with 1h volume beginning to rise.
Key signals: 1h turnover 1.6x / 4h turnover 2.5x / Break above 1h high 20 / Break above 1h high 55 / 1h closes above VWAP / 1h closes above EMA8/20
1h turnover: 1.6x
24h turnover: 35.6M USDT
Funding rate: +0.0290% (longs pay, shorts receive)
Score: 9/12
Short-term key level: Breakout level 192.16
Support level: 184.62
Resistance to watch: 211.38 / 230.59
After trigger, you can execute in the corresponding direction; if it fails, use the invalidation level as the stop-loss.
Momentum Alert: Long Alert | CBRS
CBRS 15m shows more than 1h bullish deviation; watch for further follow-through, with 1h volume beginning to rise.
Key signals: 1h turnover 1.6x / 4h turnover 2.5x / Break above 1h high 20 / Break above 1h high 55 / 1h closes above VWAP / 1h closes above EMA8/20
1h turnover: 1.6x
24h turnover: 35.6M USDT
Funding rate: +0.0290% (longs pay, shorts receive)
Score: 9/12
Short-term key level: Breakout level 192.16
Support level: 184.62
Resistance to watch: 211.38 / 230.59
After trigger, you can execute in the corresponding direction; if it fails, use the invalidation level as the stop-loss.
873

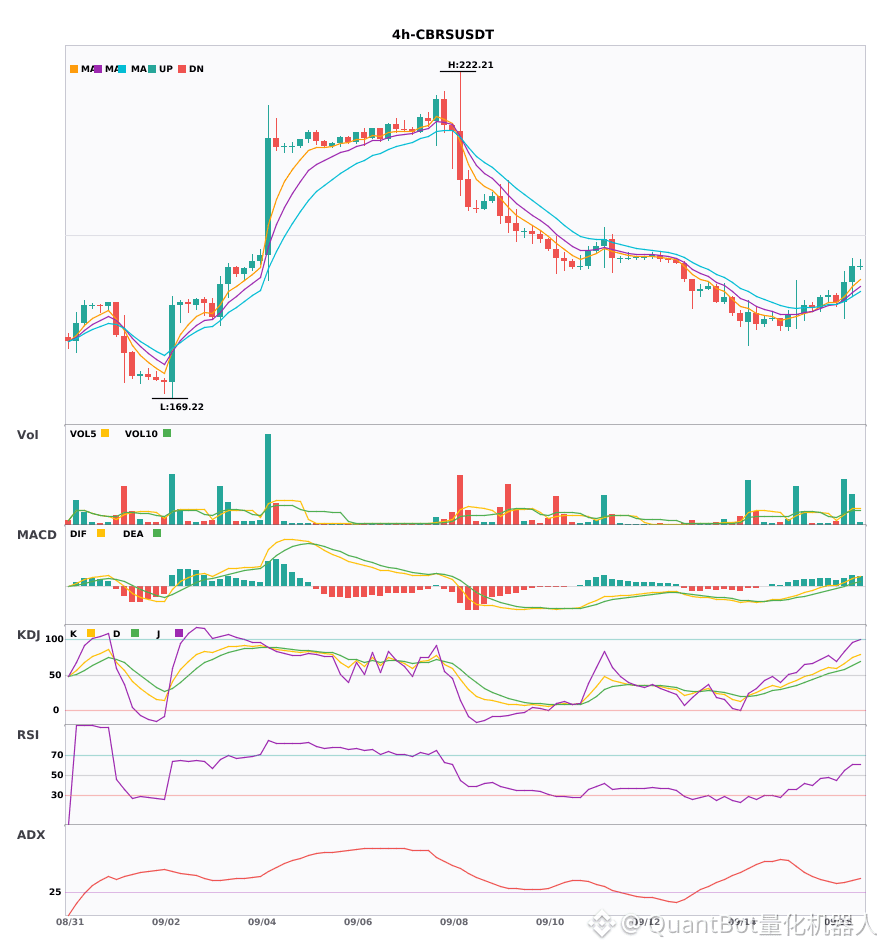
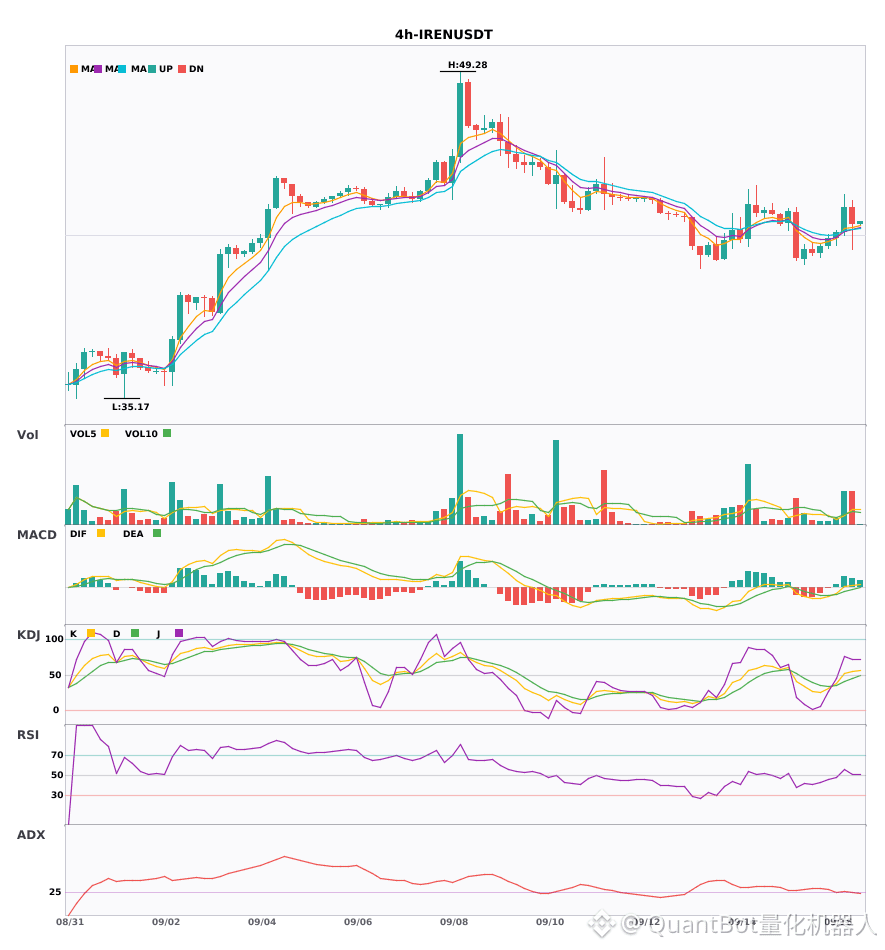
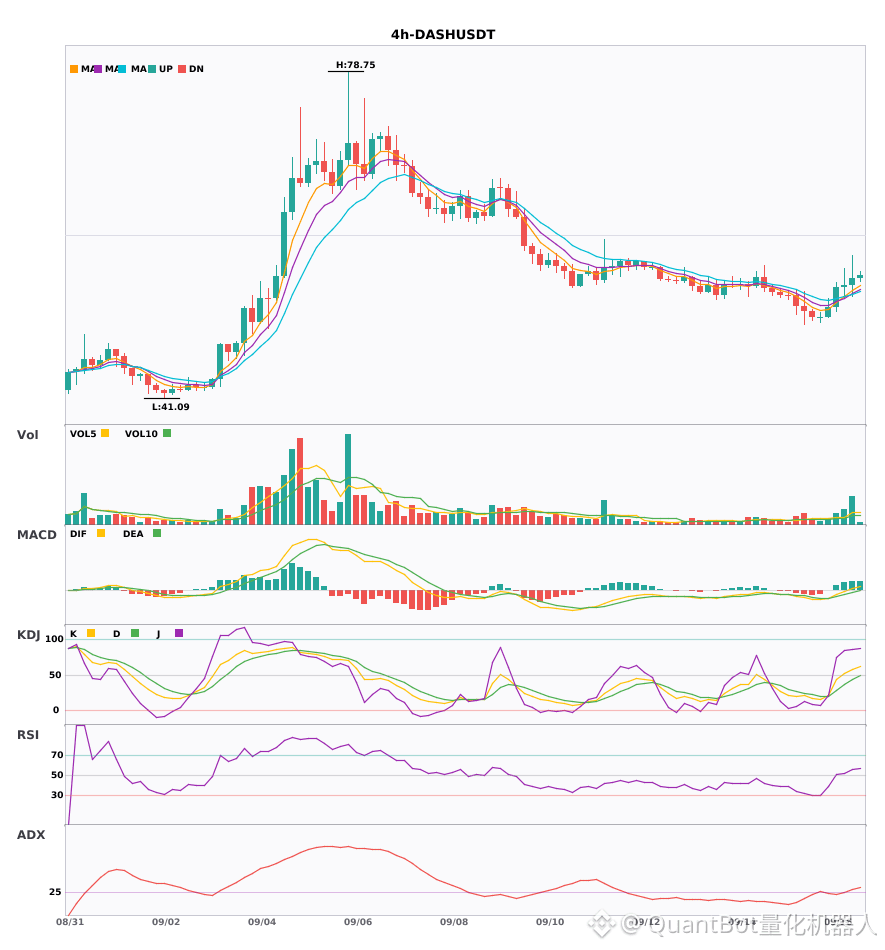
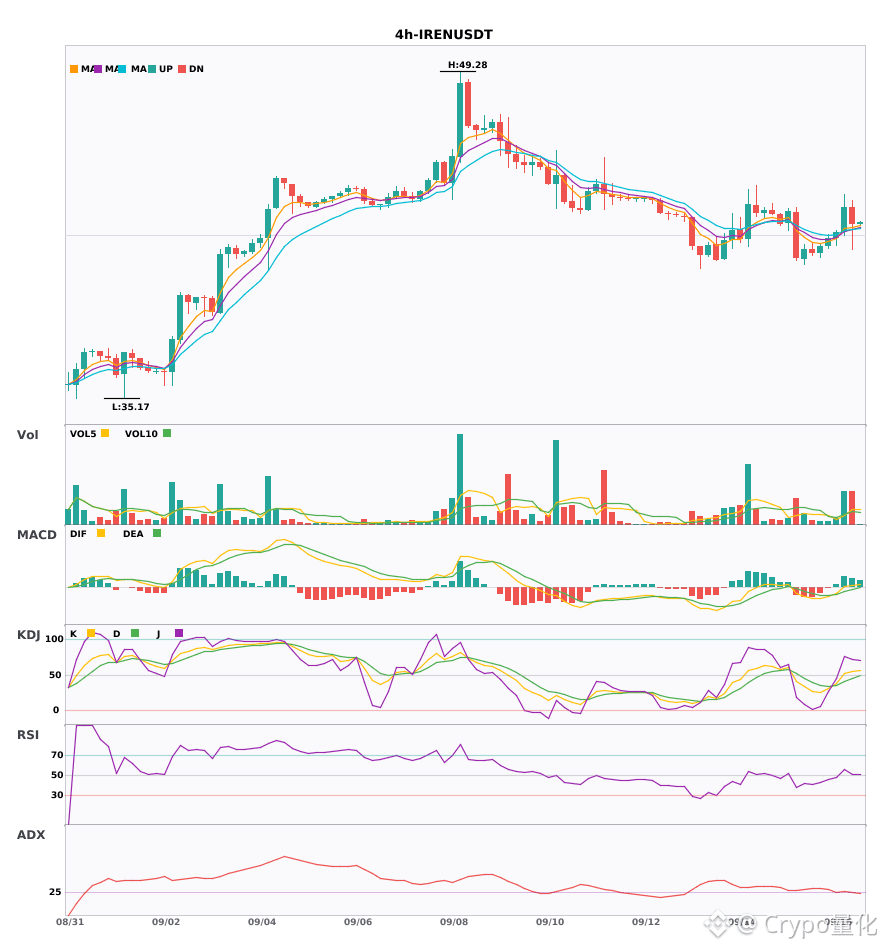
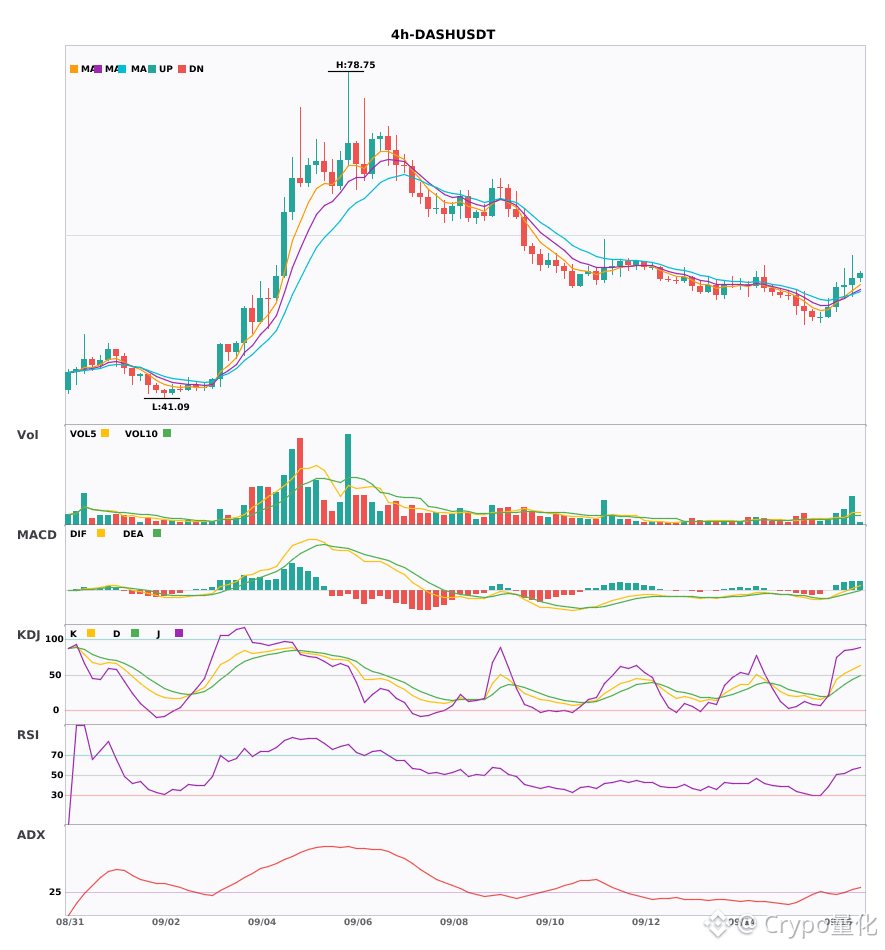
$CBRS $IREN $DASH 4 hour-cycle resonance transition to multiple synchronization triggers multi-head signals
📈 $CBRS | 4-hour multi-head signal
━━━━━━━━━━━━━━━━━━
Technical analysis: ADX(40) clearly indicates a trending market | MACD is running bullish; the trend is strong and momentum is increasing | EMA5 > EMA8 > EMA13, bullish alignment | KDJ is running strongly; bulls are dominant (K is 66.3, D is 58.4) | Volume explodes (3.9x)
Price movement: 1.6900%
📈 $IREN | 4-hour multi-head signal
━━━━━━━━━━━━━━━━━━
Technical analysis: ADX(27) suggests the trend is taking shape and is suitable to participate; MACD is bullish-leaning but momentum is weakening; EMA5/8/13 are in bullish order, and volume increases by 3.2x.
Price movement: -1.6400%
📈 $DASH | 4-hour multi-head signal
━━━━━━━━━━━━━━━━━━
Technical analysis: ADX(32) shows the trend is clear; MACD DIF breaks above the zero line and turns bullish; EMA5 > EMA8 > EMA13 is in bullish order; volume expands to 3.0x.
Price movement: 1.5200%
━━━━━━━━━━━━━━━━━━
#技术分析 #CBRS #IREN #DASH
📌 The above content is for reference only and does not constitute investment advice
$CBRS $IREN $DASH 4 hour-cycle resonance transition to multiple synchronization triggers multi-head signals
📈 $CBRS | 4-hour multi-head signal
━━━━━━━━━━━━━━━━━━
Technical analysis: ADX(40) clearly indicates a trending market | MACD is running bullish; the trend is strong and momentum is increasing | EMA5 > EMA8 > EMA13, bullish alignment | KDJ is running strongly; bulls are dominant (K is 66.3, D is 58.4) | Volume explodes (3.9x)
Price movement: 1.6900%
📈 $IREN | 4-hour multi-head signal
━━━━━━━━━━━━━━━━━━
Technical analysis: ADX(27) suggests the trend is taking shape and is suitable to participate; MACD is bullish-leaning but momentum is weakening; EMA5/8/13 are in bullish order, and volume increases by 3.2x.
Price movement: -1.6400%
📈 $DASH | 4-hour multi-head signal
━━━━━━━━━━━━━━━━━━
Technical analysis: ADX(32) shows the trend is clear; MACD DIF breaks above the zero line and turns bullish; EMA5 > EMA8 > EMA13 is in bullish order; volume expands to 3.0x.
Price movement: 1.5200%
━━━━━━━━━━━━━━━━━━
#技术分析 #CBRS #IREN #DASH
📌 The above content is for reference only and does not constitute investment advice
📈 $CBRS | 4-hour multi-head signal
━━━━━━━━━━━━━━━━━━
Technical analysis: ADX(40) clearly indicates a trending market | MACD is running bullish; the trend is strong and momentum is increasing | EMA5 > EMA8 > EMA13, bullish alignment | KDJ is running strongly; bulls are dominant (K is 66.3, D is 58.4) | Volume explodes (3.9x)
Price movement: 1.6900%
📈 $IREN | 4-hour multi-head signal
━━━━━━━━━━━━━━━━━━
Technical analysis: ADX(27) suggests the trend is taking shape and is suitable to participate; MACD is bullish-leaning but momentum is weakening; EMA5/8/13 are in bullish order, and volume increases by 3.2x.
Price movement: -1.6400%
📈 $DASH | 4-hour multi-head signal
━━━━━━━━━━━━━━━━━━
Technical analysis: ADX(32) shows the trend is clear; MACD DIF breaks above the zero line and turns bullish; EMA5 > EMA8 > EMA13 is in bullish order; volume expands to 3.0x.
Price movement: 1.5200%
━━━━━━━━━━━━━━━━━━
#技术分析 #CBRS #IREN #DASH
📌 The above content is for reference only and does not constitute investment advice
40

·
--
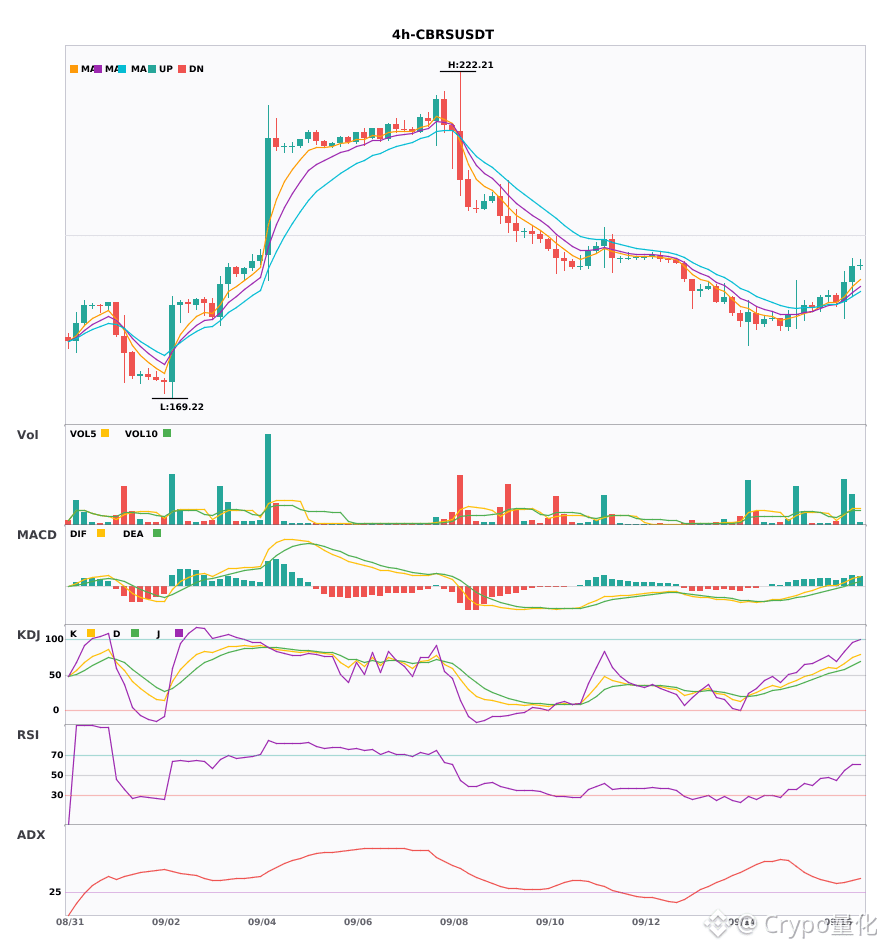
$CBRS / $IREN / $DASH 4 hours resonance to many, bullish signals appear at the same time 🔥
════════════════════
🔴 $CBRS 4 hours bullish signal
⚠️ Technical analysis: ADX40 trend is clear. MACD golden cross with expanding red histogram. Moving averages are aligned bullish and pointing upward. KDJ’s K crosses above D without being overbought, and trading volume surged 3.9x.
════════════════════
🔴 $IREN 4 hours bullish signal
⚠️ Technical analysis: ADX is around 27 and the uptrend is forming, suitable for entering. MACD bullish momentum is weakening. 5/8/13 EMA are aligned bullish. Volume increased 3.2x.
════════════════════
🔴 $DASH 4 hours bullish signal
⚠️ Technical analysis: ADX reaches 32 and the trend is clear. MACD DIF breaks above the zero axis to turn bullish. 5/8/13 EMA are aligned bullish. Trading volume exploded 3x.
════════════════════
🔔 Follow to get first-hand market updates on unusual moves 🔔
#技术分析 #CBRS #IREN #DASH
📌 When trading, pay attention to whether the candlestick patterns match
$CBRS / $IREN / $DASH 4 hours resonance to many, bullish signals appear at the same time 🔥
════════════════════
🔴 $CBRS 4 hours bullish signal
⚠️ Technical analysis: ADX40 trend is clear. MACD golden cross with expanding red histogram. Moving averages are aligned bullish and pointing upward. KDJ’s K crosses above D without being overbought, and trading volume surged 3.9x.
════════════════════
🔴 $IREN 4 hours bullish signal
⚠️ Technical analysis: ADX is around 27 and the uptrend is forming, suitable for entering. MACD bullish momentum is weakening. 5/8/13 EMA are aligned bullish. Volume increased 3.2x.
════════════════════
🔴 $DASH 4 hours bullish signal
⚠️ Technical analysis: ADX reaches 32 and the trend is clear. MACD DIF breaks above the zero axis to turn bullish. 5/8/13 EMA are aligned bullish. Trading volume exploded 3x.
════════════════════
🔔 Follow to get first-hand market updates on unusual moves 🔔
#技术分析 #CBRS #IREN #DASH
📌 When trading, pay attention to whether the candlestick patterns match
════════════════════
🔴 $CBRS 4 hours bullish signal
⚠️ Technical analysis: ADX40 trend is clear. MACD golden cross with expanding red histogram. Moving averages are aligned bullish and pointing upward. KDJ’s K crosses above D without being overbought, and trading volume surged 3.9x.
════════════════════
🔴 $IREN 4 hours bullish signal
⚠️ Technical analysis: ADX is around 27 and the uptrend is forming, suitable for entering. MACD bullish momentum is weakening. 5/8/13 EMA are aligned bullish. Volume increased 3.2x.
════════════════════
🔴 $DASH 4 hours bullish signal
⚠️ Technical analysis: ADX reaches 32 and the trend is clear. MACD DIF breaks above the zero axis to turn bullish. 5/8/13 EMA are aligned bullish. Trading volume exploded 3x.
════════════════════
🔔 Follow to get first-hand market updates on unusual moves 🔔
#技术分析 #CBRS #IREN #DASH
📌 When trading, pay attention to whether the candlestick patterns match
15
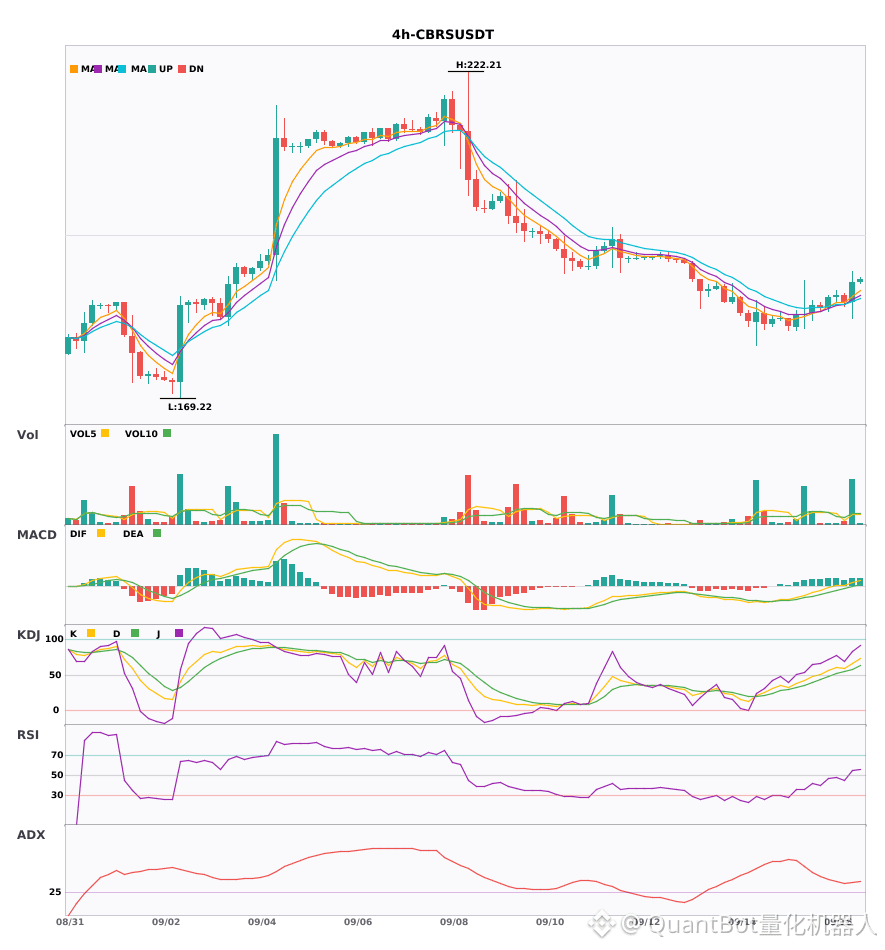
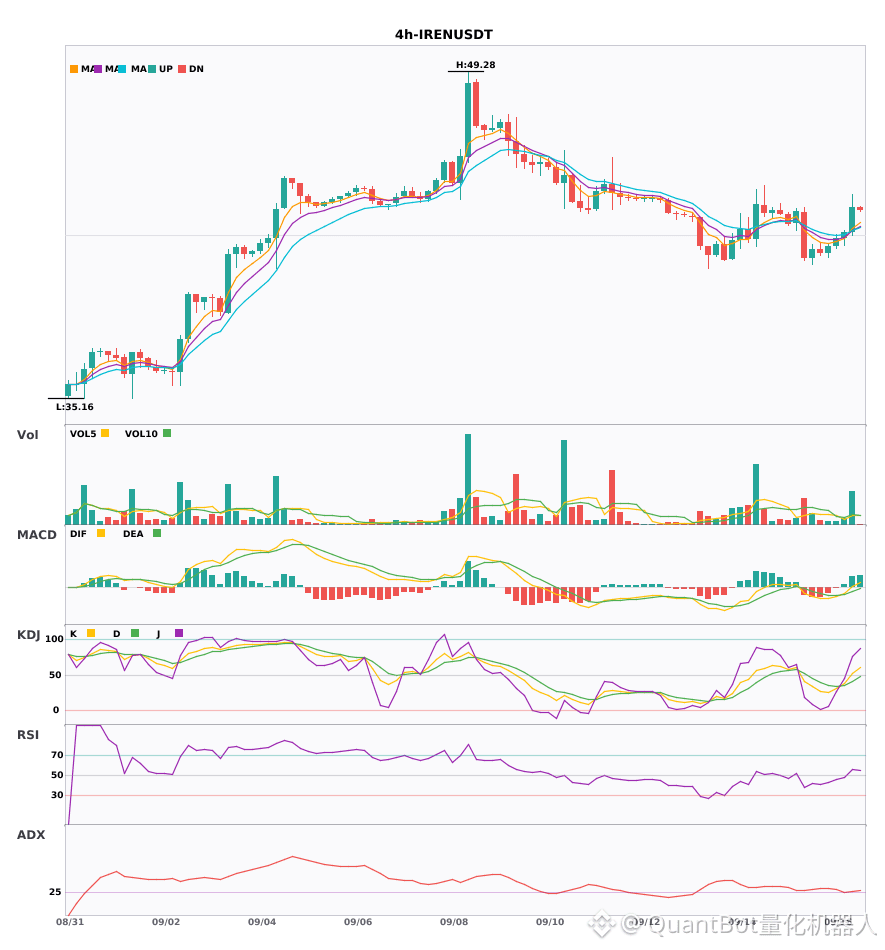
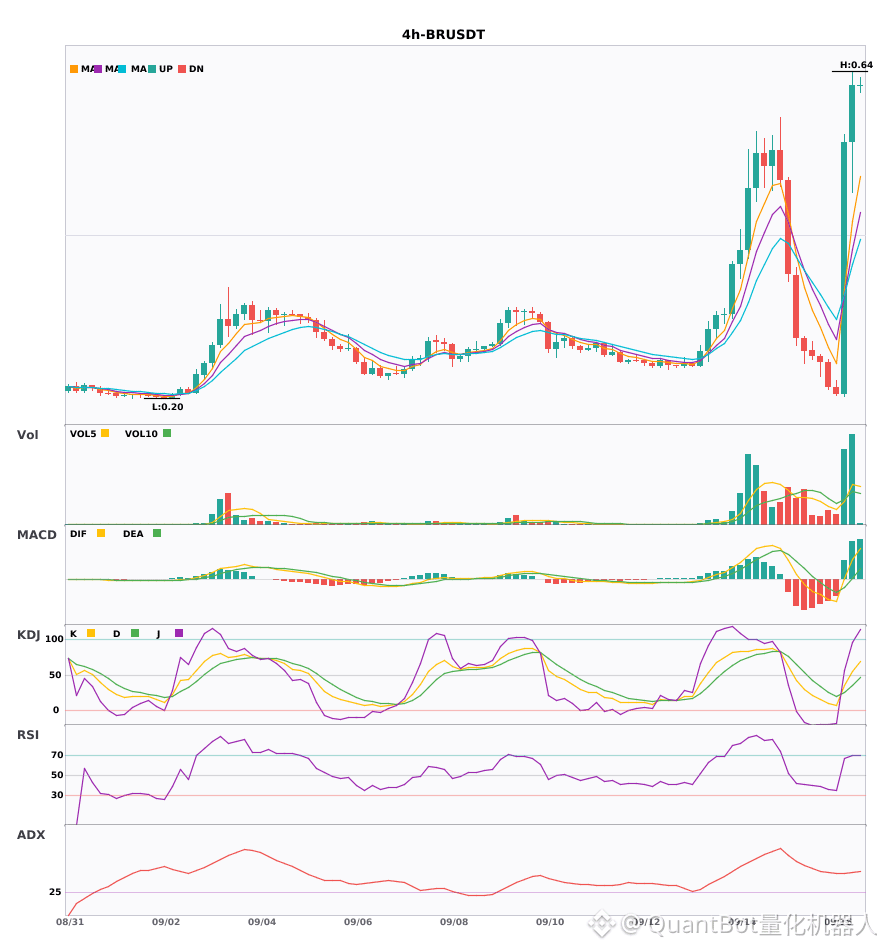
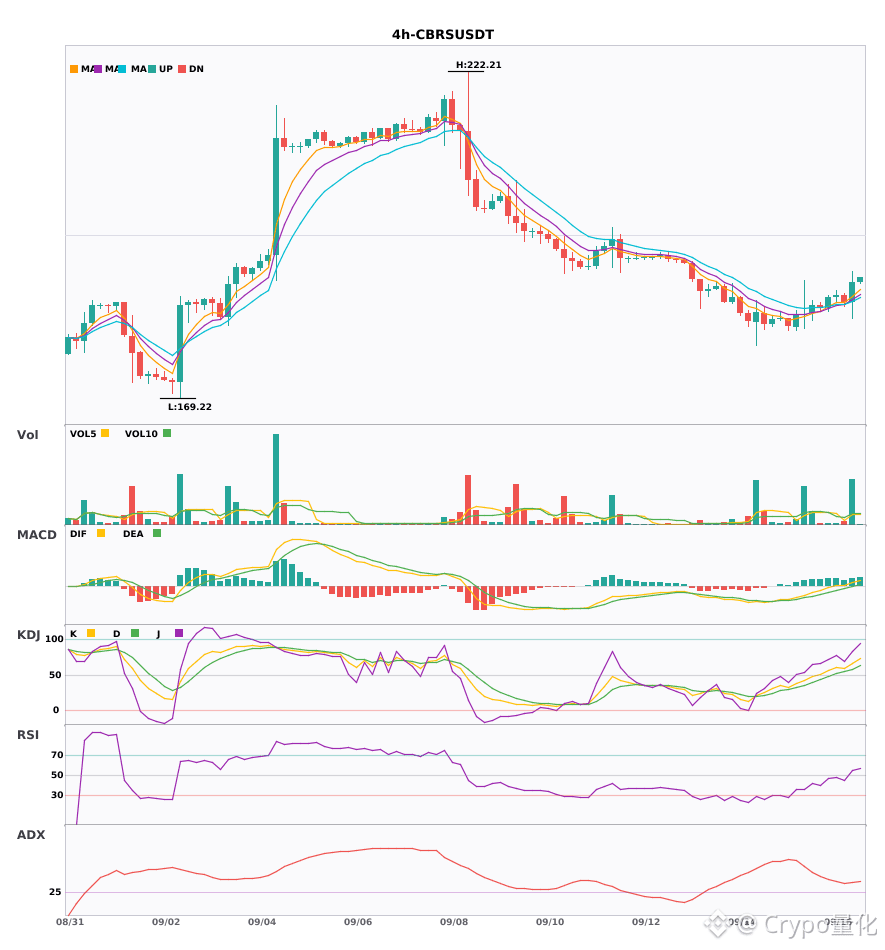
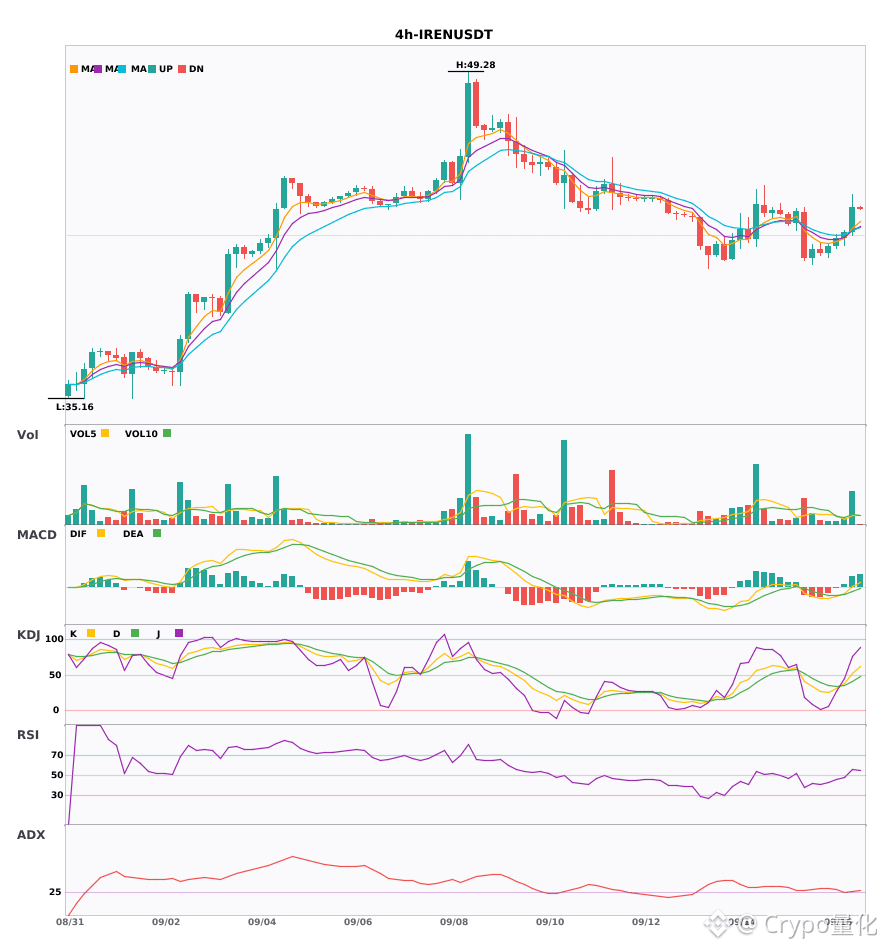
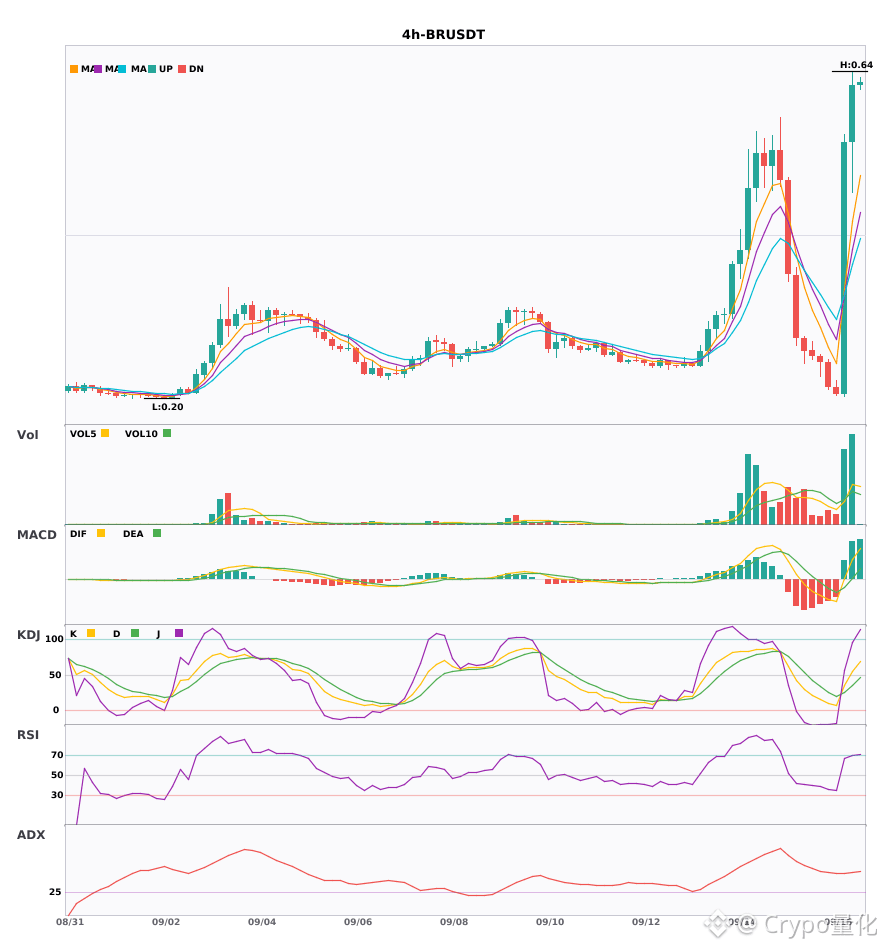
$CBRS / $IREN / $BR 4 Hours of technical strength sync—who has the stronger breakout potential?
📈 $CBRS | 4-hour Bullish Signal
━━━━━━━━━━━━━━━━━━
Technical Analysis: ADX(40) clearly indicates a trending market | MACD is running bullish; trend is relatively strong and momentum is increasing | EMA5 > EMA8 > EMA13, bullish alignment | KDJ is in a strong uptrend; bulls dominate (K=66.3, D=58.4) | Volume surge (3.9x)
Price Movement: 1.6900%
📈 $IREN | 4-hour Bullish Signal
━━━━━━━━━━━━━━━━━━
Technical Analysis: ADX(29) trend is forming; can participate | MACD DIF breaks above the zero line; trend turns bullish | EMA5 crosses above EMA8; short-term turns bullish | Volume surge (3.2x)
Price Movement: 2.5000%
📈 $BR | 4-hour Bullish Signal
━━━━━━━━━━━━━━━━━━
Technical Analysis: ADX(50) is extremely strong—be cautious of an overheated pullback; MACD is running bullish, trend is strong and momentum is increasing; EMA5/8/13 show bullish alignment, and volume expands by 2.9x.
Price Movement: 13.8000%
━━━━━━━━━━━━━━━━━━
#技术分析 #CBRS #IREN #BR
📌 The content above is for reference only and does not constitute investment advice
$CBRS / $IREN / $BR 4 Hours of technical strength sync—who has the stronger breakout potential?
📈 $CBRS | 4-hour Bullish Signal
━━━━━━━━━━━━━━━━━━
Technical Analysis: ADX(40) clearly indicates a trending market | MACD is running bullish; trend is relatively strong and momentum is increasing | EMA5 > EMA8 > EMA13, bullish alignment | KDJ is in a strong uptrend; bulls dominate (K=66.3, D=58.4) | Volume surge (3.9x)
Price Movement: 1.6900%
📈 $IREN | 4-hour Bullish Signal
━━━━━━━━━━━━━━━━━━
Technical Analysis: ADX(29) trend is forming; can participate | MACD DIF breaks above the zero line; trend turns bullish | EMA5 crosses above EMA8; short-term turns bullish | Volume surge (3.2x)
Price Movement: 2.5000%
📈 $BR | 4-hour Bullish Signal
━━━━━━━━━━━━━━━━━━
Technical Analysis: ADX(50) is extremely strong—be cautious of an overheated pullback; MACD is running bullish, trend is strong and momentum is increasing; EMA5/8/13 show bullish alignment, and volume expands by 2.9x.
Price Movement: 13.8000%
━━━━━━━━━━━━━━━━━━
#技术分析 #CBRS #IREN #BR
📌 The content above is for reference only and does not constitute investment advice
📈 $CBRS | 4-hour Bullish Signal
━━━━━━━━━━━━━━━━━━
Technical Analysis: ADX(40) clearly indicates a trending market | MACD is running bullish; trend is relatively strong and momentum is increasing | EMA5 > EMA8 > EMA13, bullish alignment | KDJ is in a strong uptrend; bulls dominate (K=66.3, D=58.4) | Volume surge (3.9x)
Price Movement: 1.6900%
📈 $IREN | 4-hour Bullish Signal
━━━━━━━━━━━━━━━━━━
Technical Analysis: ADX(29) trend is forming; can participate | MACD DIF breaks above the zero line; trend turns bullish | EMA5 crosses above EMA8; short-term turns bullish | Volume surge (3.2x)
Price Movement: 2.5000%
📈 $BR | 4-hour Bullish Signal
━━━━━━━━━━━━━━━━━━
Technical Analysis: ADX(50) is extremely strong—be cautious of an overheated pullback; MACD is running bullish, trend is strong and momentum is increasing; EMA5/8/13 show bullish alignment, and volume expands by 2.9x.
Price Movement: 13.8000%
━━━━━━━━━━━━━━━━━━
#技术分析 #CBRS #IREN #BR
📌 The content above is for reference only and does not constitute investment advice
19
·
--
$CBRS / $IREN / $BR 4 hours resonance to a rebound; multiple-head (bullish) signals appear at the same time 🔥
════════════════════
🔴 $CBRS 4 hours bullish signal
⚠️ Technicals: ADX reaches 40—trend is very clear. MACD golden cross with expanding volume; red histogram bars keep enlarging. EMA5/8/13 are aligned upward in a bullish formation. KDJ: K crosses above D but has not entered the overbought zone. Trading volume is 3.9x.
════════════════════
🔴 $IREN 4 hours bullish signal
⚠️ Technicals: ADX (29) is forming a trend—can participate. MACD DIF breaks above the zero line; the trend turns bullish. EMA5 crosses above EMA8—short-term turns bullish. Volume surges (3.2x)
════════════════════
🔴 $BR 4 hours bullish signal
⚠️ Technicals: ADX reaches 50—trend is very strong. Be careful of an overheated pullback. MACD golden cross with expanding volume; red histogram bars expand. Moving averages in a bullish alignment upward. Volume up 2.9x
════════════════════
🔔 Follow to get first-hand market moves and anomalies 🔔
#技术分析 #CBRS #IREN #BR
📌 When trading, pay attention to whether the candlestick pattern matches
$CBRS / $IREN / $BR 4 hours resonance to a rebound; multiple-head (bullish) signals appear at the same time 🔥
════════════════════
🔴 $CBRS 4 hours bullish signal
⚠️ Technicals: ADX reaches 40—trend is very clear. MACD golden cross with expanding volume; red histogram bars keep enlarging. EMA5/8/13 are aligned upward in a bullish formation. KDJ: K crosses above D but has not entered the overbought zone. Trading volume is 3.9x.
════════════════════
🔴 $IREN 4 hours bullish signal
⚠️ Technicals: ADX (29) is forming a trend—can participate. MACD DIF breaks above the zero line; the trend turns bullish. EMA5 crosses above EMA8—short-term turns bullish. Volume surges (3.2x)
════════════════════
🔴 $BR 4 hours bullish signal
⚠️ Technicals: ADX reaches 50—trend is very strong. Be careful of an overheated pullback. MACD golden cross with expanding volume; red histogram bars expand. Moving averages in a bullish alignment upward. Volume up 2.9x
════════════════════
🔔 Follow to get first-hand market moves and anomalies 🔔
#技术分析 #CBRS #IREN #BR
📌 When trading, pay attention to whether the candlestick pattern matches
════════════════════
🔴 $CBRS 4 hours bullish signal
⚠️ Technicals: ADX reaches 40—trend is very clear. MACD golden cross with expanding volume; red histogram bars keep enlarging. EMA5/8/13 are aligned upward in a bullish formation. KDJ: K crosses above D but has not entered the overbought zone. Trading volume is 3.9x.
════════════════════
🔴 $IREN 4 hours bullish signal
⚠️ Technicals: ADX (29) is forming a trend—can participate. MACD DIF breaks above the zero line; the trend turns bullish. EMA5 crosses above EMA8—short-term turns bullish. Volume surges (3.2x)
════════════════════
🔴 $BR 4 hours bullish signal
⚠️ Technicals: ADX reaches 50—trend is very strong. Be careful of an overheated pullback. MACD golden cross with expanding volume; red histogram bars expand. Moving averages in a bullish alignment upward. Volume up 2.9x
════════════════════
🔔 Follow to get first-hand market moves and anomalies 🔔
#技术分析 #CBRS #IREN #BR
📌 When trading, pay attention to whether the candlestick pattern matches
174

5-minute trend scan, 3 clear opportunities.
Go long on $CBRS . A volume breakout within a choppy structure: both the 15-minute and 1-hour charts have turned upward, confirmed by multi-timeframe resonance. On the 5-minute chart it is choppy; on the 15-minute it is rising; on the 1-hour it is rising. Entry score 68, structure score 80. High-timeframe room 0.13%.
Current price 186.50. Entry 185.80-187.00, stop loss 184.50, target 191.00, risk-reward 2.3:1.
Conclusion: You can buy. A volume breakout aligned with a higher-level trend turning bullish, with an exceptionally high structure score.
Go long on $SNXX . The 5-minute chart is strongly rising, supported by a 2.86x volume surge; after breaking the prior high, momentum continues to expand. 5-minute rising, 15-minute rising, 1-hour consolidating. Entry score 68, structure score 88. High-timeframe room 2.87%.
Current price 13.58. Entry 13.48-13.65, stop loss 13.25, target 14.20, risk-reward 1.9:1.
Conclusion: You can buy. Strong entry score, volume nearly 3x, and structure score at an A+ level.
Go short on $BZ . Volume breakdown continuation within a choppy structure: volume at 1.16x confirms selling pressure, and all three-tier cycles are slightly weak in a range. 5-minute choppy, 15-minute choppy, 1-hour choppy. Entry score 62, structure score 66. High-timeframe room 0.06%.
Current price 102.17. Entry 102.00-102.40, stop loss 103.00, target 100.20, risk-reward 2.4:1.
Conclusion: You can short. Volume breakdown continuation with an excellent risk-reward ratio.
Position suggestion: no more than 10% per coin.
#CBRS #SNXX #BZ
5-minute trend scan, 3 clear opportunities.
Go long on $CBRS . A volume breakout within a choppy structure: both the 15-minute and 1-hour charts have turned upward, confirmed by multi-timeframe resonance. On the 5-minute chart it is choppy; on the 15-minute it is rising; on the 1-hour it is rising. Entry score 68, structure score 80. High-timeframe room 0.13%.
Current price 186.50. Entry 185.80-187.00, stop loss 184.50, target 191.00, risk-reward 2.3:1.
Conclusion: You can buy. A volume breakout aligned with a higher-level trend turning bullish, with an exceptionally high structure score.
Go long on $SNXX . The 5-minute chart is strongly rising, supported by a 2.86x volume surge; after breaking the prior high, momentum continues to expand. 5-minute rising, 15-minute rising, 1-hour consolidating. Entry score 68, structure score 88. High-timeframe room 2.87%.
Current price 13.58. Entry 13.48-13.65, stop loss 13.25, target 14.20, risk-reward 1.9:1.
Conclusion: You can buy. Strong entry score, volume nearly 3x, and structure score at an A+ level.
Go short on $BZ . Volume breakdown continuation within a choppy structure: volume at 1.16x confirms selling pressure, and all three-tier cycles are slightly weak in a range. 5-minute choppy, 15-minute choppy, 1-hour choppy. Entry score 62, structure score 66. High-timeframe room 0.06%.
Current price 102.17. Entry 102.00-102.40, stop loss 103.00, target 100.20, risk-reward 2.4:1.
Conclusion: You can short. Volume breakdown continuation with an excellent risk-reward ratio.
Position suggestion: no more than 10% per coin.
#CBRS #SNXX #BZ
Go long on $CBRS . A volume breakout within a choppy structure: both the 15-minute and 1-hour charts have turned upward, confirmed by multi-timeframe resonance. On the 5-minute chart it is choppy; on the 15-minute it is rising; on the 1-hour it is rising. Entry score 68, structure score 80. High-timeframe room 0.13%.
Current price 186.50. Entry 185.80-187.00, stop loss 184.50, target 191.00, risk-reward 2.3:1.
Conclusion: You can buy. A volume breakout aligned with a higher-level trend turning bullish, with an exceptionally high structure score.
Go long on $SNXX . The 5-minute chart is strongly rising, supported by a 2.86x volume surge; after breaking the prior high, momentum continues to expand. 5-minute rising, 15-minute rising, 1-hour consolidating. Entry score 68, structure score 88. High-timeframe room 2.87%.
Current price 13.58. Entry 13.48-13.65, stop loss 13.25, target 14.20, risk-reward 1.9:1.
Conclusion: You can buy. Strong entry score, volume nearly 3x, and structure score at an A+ level.
Go short on $BZ . Volume breakdown continuation within a choppy structure: volume at 1.16x confirms selling pressure, and all three-tier cycles are slightly weak in a range. 5-minute choppy, 15-minute choppy, 1-hour choppy. Entry score 62, structure score 66. High-timeframe room 0.06%.
Current price 102.17. Entry 102.00-102.40, stop loss 103.00, target 100.20, risk-reward 2.4:1.
Conclusion: You can short. Volume breakdown continuation with an excellent risk-reward ratio.
Position suggestion: no more than 10% per coin.
#CBRS #SNXX #BZ
5
5-minute trend scan, 3 clear opportunities.
$CBRS go long. In a ranging structure, a volume breakout occurs; the 15-minute and 1-hour trends turn upward, and multi-timeframe resonance confirms. The 5-minute is ranging, the 15-minute is rising, and the 1-hour is rising. Entry score 68, structure score 80. High-timeframe upside 0.13%.
Current price 186.50. Entry 185.80-187.00, stop loss 184.50, target 191.00, risk-reward 2.3:1.
Conclusion: You can buy. The volume breakout aligns with the higher-timeframe trend turning bullish, with an extremely high structure score.
$SNXX go long. The 5-minute shows a strong up move supported by a 2.86x volume expansion; after breaking the prior high, momentum keeps expanding. 5-minute rising, 15-minute rising, 1-hour consolidating. Entry score 68, structure score 88. High-timeframe upside 2.87%.
Current price 13.58. Entry 13.48-13.65, stop loss 13.25, target 14.20, risk-reward 1.9:1.
Conclusion: You can buy. High entry score, volume near 3x, and a structure score at the A+ level.
$BZ go short. In a ranging structure, a volume expansion continues downward; the volume at 1.16x confirms selling pressure, and all three lower cycles remain weak and range-bound. 5-minute ranging, 15-minute ranging, 1-hour ranging. Entry score 62, structure score 66. High-timeframe upside 0.06%.
Current price 102.17. Entry 102.00-102.40, stop loss 103.00, target 100.20, risk-reward 2.4:1.
Conclusion: You can short. Volume continues downward, with an excellent risk-reward ratio.
Suggested position sizing: no more than 10% per coin.
#CBRS #SNXX #BZ
5-minute trend scan, 3 clear opportunities.
$CBRS go long. In a ranging structure, a volume breakout occurs; the 15-minute and 1-hour trends turn upward, and multi-timeframe resonance confirms. The 5-minute is ranging, the 15-minute is rising, and the 1-hour is rising. Entry score 68, structure score 80. High-timeframe upside 0.13%.
Current price 186.50. Entry 185.80-187.00, stop loss 184.50, target 191.00, risk-reward 2.3:1.
Conclusion: You can buy. The volume breakout aligns with the higher-timeframe trend turning bullish, with an extremely high structure score.
$SNXX go long. The 5-minute shows a strong up move supported by a 2.86x volume expansion; after breaking the prior high, momentum keeps expanding. 5-minute rising, 15-minute rising, 1-hour consolidating. Entry score 68, structure score 88. High-timeframe upside 2.87%.
Current price 13.58. Entry 13.48-13.65, stop loss 13.25, target 14.20, risk-reward 1.9:1.
Conclusion: You can buy. High entry score, volume near 3x, and a structure score at the A+ level.
$BZ go short. In a ranging structure, a volume expansion continues downward; the volume at 1.16x confirms selling pressure, and all three lower cycles remain weak and range-bound. 5-minute ranging, 15-minute ranging, 1-hour ranging. Entry score 62, structure score 66. High-timeframe upside 0.06%.
Current price 102.17. Entry 102.00-102.40, stop loss 103.00, target 100.20, risk-reward 2.4:1.
Conclusion: You can short. Volume continues downward, with an excellent risk-reward ratio.
Suggested position sizing: no more than 10% per coin.
#CBRS #SNXX #BZ
$CBRS go long. In a ranging structure, a volume breakout occurs; the 15-minute and 1-hour trends turn upward, and multi-timeframe resonance confirms. The 5-minute is ranging, the 15-minute is rising, and the 1-hour is rising. Entry score 68, structure score 80. High-timeframe upside 0.13%.
Current price 186.50. Entry 185.80-187.00, stop loss 184.50, target 191.00, risk-reward 2.3:1.
Conclusion: You can buy. The volume breakout aligns with the higher-timeframe trend turning bullish, with an extremely high structure score.
$SNXX go long. The 5-minute shows a strong up move supported by a 2.86x volume expansion; after breaking the prior high, momentum keeps expanding. 5-minute rising, 15-minute rising, 1-hour consolidating. Entry score 68, structure score 88. High-timeframe upside 2.87%.
Current price 13.58. Entry 13.48-13.65, stop loss 13.25, target 14.20, risk-reward 1.9:1.
Conclusion: You can buy. High entry score, volume near 3x, and a structure score at the A+ level.
$BZ go short. In a ranging structure, a volume expansion continues downward; the volume at 1.16x confirms selling pressure, and all three lower cycles remain weak and range-bound. 5-minute ranging, 15-minute ranging, 1-hour ranging. Entry score 62, structure score 66. High-timeframe upside 0.06%.
Current price 102.17. Entry 102.00-102.40, stop loss 103.00, target 100.20, risk-reward 2.4:1.
Conclusion: You can short. Volume continues downward, with an excellent risk-reward ratio.
Suggested position sizing: no more than 10% per coin.
#CBRS #SNXX #BZ
4
·
--
$CBRS #CBRS
<b>Movement Alert:</b> Short-Sell Warning | CBRS
15m not triggered, but 1h short-side activity strong
Structure: GMMA short
Reason: 1h turnover 7.3x / 4h turnover 2.1x / 1h body weak and closing lower / 1h breaks below VWAP / 1h capped below EMA8/20 / GMMA short
Current price 181.65
Breakdown level 177.87
Invalidation level 184.95
Watch below 163.49 / 145.32
Funding rate +0.0621% (long pays short)
For chart observation only, not investment advice.
$CBRS #CBRS
<b>Movement Alert:</b> Short-Sell Warning | CBRS
15m not triggered, but 1h short-side activity strong
Structure: GMMA short
Reason: 1h turnover 7.3x / 4h turnover 2.1x / 1h body weak and closing lower / 1h breaks below VWAP / 1h capped below EMA8/20 / GMMA short
Current price 181.65
Breakdown level 177.87
Invalidation level 184.95
Watch below 163.49 / 145.32
Funding rate +0.0621% (long pays short)
For chart observation only, not investment advice.
<b>Movement Alert:</b> Short-Sell Warning | CBRS
15m not triggered, but 1h short-side activity strong
Structure: GMMA short
Reason: 1h turnover 7.3x / 4h turnover 2.1x / 1h body weak and closing lower / 1h breaks below VWAP / 1h capped below EMA8/20 / GMMA short
Current price 181.65
Breakdown level 177.87
Invalidation level 184.95
Watch below 163.49 / 145.32
Funding rate +0.0621% (long pays short)
For chart observation only, not investment advice.
1
1.2k
5-minute trend scan, 2 clear opportunities.
$CBRS goes short. During a downtrend, it breaks support on increased volume; the volume is 1.54x, and the price is trading below the EMA. 5-minute timeframe: down. 15-minute timeframe: ranging. 1-hour timeframe: down. Entry score: 63, structure score: 69. High-timeframe room: 0.13%.
Current price: 180.49. Entry: 180.00-180.50. Stop loss: 181.50. Target: 177.50. Risk-reward: 2.5:1.
Conclusion: You can short. The downtrend continues; volume-backed breakdown confirms, with bears in control.
$LIT goes long. In a consolidation structure, it breaks upward on increased volume. Follow-up confirmation is expected; the volume is 1.55x. 5-minute timeframe: ranging. 15-minute timeframe: ranging. 1-hour timeframe: ranging. Entry score: 62, structure score: 56. High-timeframe room: 1.28%.
Current price: 4.538. Entry: 4.48-4.56. Stop loss: 4.40. Target: 4.75. Risk-reward: 2.5:1.
Conclusion: You can buy. After the volume breakout, follow-up confirmation is expected; multi-timeframe alignment is mildly bullish.
Recommended position size: no more than 10% per coin.
#CBRS #LIT #做空 #做多 #with increased volume
5-minute trend scan, 2 clear opportunities.
$CBRS goes short. During a downtrend, it breaks support on increased volume; the volume is 1.54x, and the price is trading below the EMA. 5-minute timeframe: down. 15-minute timeframe: ranging. 1-hour timeframe: down. Entry score: 63, structure score: 69. High-timeframe room: 0.13%.
Current price: 180.49. Entry: 180.00-180.50. Stop loss: 181.50. Target: 177.50. Risk-reward: 2.5:1.
Conclusion: You can short. The downtrend continues; volume-backed breakdown confirms, with bears in control.
$LIT goes long. In a consolidation structure, it breaks upward on increased volume. Follow-up confirmation is expected; the volume is 1.55x. 5-minute timeframe: ranging. 15-minute timeframe: ranging. 1-hour timeframe: ranging. Entry score: 62, structure score: 56. High-timeframe room: 1.28%.
Current price: 4.538. Entry: 4.48-4.56. Stop loss: 4.40. Target: 4.75. Risk-reward: 2.5:1.
Conclusion: You can buy. After the volume breakout, follow-up confirmation is expected; multi-timeframe alignment is mildly bullish.
Recommended position size: no more than 10% per coin.
#CBRS #LIT #做空 #做多 #with increased volume
$CBRS goes short. During a downtrend, it breaks support on increased volume; the volume is 1.54x, and the price is trading below the EMA. 5-minute timeframe: down. 15-minute timeframe: ranging. 1-hour timeframe: down. Entry score: 63, structure score: 69. High-timeframe room: 0.13%.
Current price: 180.49. Entry: 180.00-180.50. Stop loss: 181.50. Target: 177.50. Risk-reward: 2.5:1.
Conclusion: You can short. The downtrend continues; volume-backed breakdown confirms, with bears in control.
$LIT goes long. In a consolidation structure, it breaks upward on increased volume. Follow-up confirmation is expected; the volume is 1.55x. 5-minute timeframe: ranging. 15-minute timeframe: ranging. 1-hour timeframe: ranging. Entry score: 62, structure score: 56. High-timeframe room: 1.28%.
Current price: 4.538. Entry: 4.48-4.56. Stop loss: 4.40. Target: 4.75. Risk-reward: 2.5:1.
Conclusion: You can buy. After the volume breakout, follow-up confirmation is expected; multi-timeframe alignment is mildly bullish.
Recommended position size: no more than 10% per coin.
#CBRS #LIT #做空 #做多 #with increased volume
1
·
--
The old dog swept across the order book. In the past 24 hours, $CBRS fell 3.294%, and the quote is 184.98. The funding rate is hanging at a clean, neat 0. The position size is 58294. Just looking at these numbers, you want to tell me this is a resonance between Crypto and TradFi? Spare me—this looks more like a signal vacuum.
Why do I say it’s a vacuum? The angle the user provided is M3_crypto_link, aiming to dig into the linkage between Crypto and on-chain US stock contracts. But the tradfi_news field is empty, and secondary_memes is also empty. This means there’s no TradFi market news to serve as a trigger, and no comparison coin from the same sector to show me who’s strong and who’s weak. In this situation, forcing a “resonance” narrative is just making up a story. The only thing I can look at is the data from $CBRS’s own chart. The funding rate is 0.00000000, meaning there’s neither longs paying shorts money nor shorts paying longs money. It’s down more than 3 points, but the funding rate hasn’t moved. This setup is completely different from the classic pattern of “falling + positive funding rate = longs stubbornly holding.” Either this asset’s position size is inherently not big, so neither side bothers to fight; or this bearish candle came a bit suddenly, and the funding rate hasn’t reacted yet.
My judgment is that this isn’t a time to act. For my move to trigger, I need a clear signal: either after the price breaks below 184.98, it continues to sell off with rising volume—I might take a small short to try to catch a wave of panic selling; or it rebounds and holds firmly, and the funding rate turns clearly positive, indicating new longs are willing to pay to hold, in which case I might observe for a bit. In this current state—funding rate at 0, position size not high but not low, and a slight bearish candle—I choose to stand still. This is a blurry-signal zone; hard trading here is basically betting.
The strongest counterpoint is: if tonight some TradFi big news I didn’t see suddenly breaks out—say Coinbase earnings beat expectations, or the Fed suddenly makes remarks—that could instantly ignite on-chain US stock hype and lift trading volume. As the benchmark in this sector, $CBRS might get overlooked. Based on the current data, it’s neither a hotspot that capital is chasing (funding rate 0), nor a stronghold targeted by shorts (funding rate non-negative). The second-order impact would be: if the whole sector starts up while it lags and goes nowhere, the capital that was waiting inside might lose patience and rotate into other more active assets, further shrinking its liquidity and creating a negative feedback loop.
Trading tags: #BinanceFutures #TradFi #USDⓈM #CBRS #CBRSUSDT $CBRS
The old dog swept across the order book. In the past 24 hours, $CBRS fell 3.294%, and the quote is 184.98. The funding rate is hanging at a clean, neat 0. The position size is 58294. Just looking at these numbers, you want to tell me this is a resonance between Crypto and TradFi? Spare me—this looks more like a signal vacuum.
Why do I say it’s a vacuum? The angle the user provided is M3_crypto_link, aiming to dig into the linkage between Crypto and on-chain US stock contracts. But the tradfi_news field is empty, and secondary_memes is also empty. This means there’s no TradFi market news to serve as a trigger, and no comparison coin from the same sector to show me who’s strong and who’s weak. In this situation, forcing a “resonance” narrative is just making up a story. The only thing I can look at is the data from $CBRS ’s own chart. The funding rate is 0.00000000, meaning there’s neither longs paying shorts money nor shorts paying longs money. It’s down more than 3 points, but the funding rate hasn’t moved. This setup is completely different from the classic pattern of “falling + positive funding rate = longs stubbornly holding.” Either this asset’s position size is inherently not big, so neither side bothers to fight; or this bearish candle came a bit suddenly, and the funding rate hasn’t reacted yet.
My judgment is that this isn’t a time to act. For my move to trigger, I need a clear signal: either after the price breaks below 184.98, it continues to sell off with rising volume—I might take a small short to try to catch a wave of panic selling; or it rebounds and holds firmly, and the funding rate turns clearly positive, indicating new longs are willing to pay to hold, in which case I might observe for a bit. In this current state—funding rate at 0, position size not high but not low, and a slight bearish candle—I choose to stand still. This is a blurry-signal zone; hard trading here is basically betting.
The strongest counterpoint is: if tonight some TradFi big news I didn’t see suddenly breaks out—say Coinbase earnings beat expectations, or the Fed suddenly makes remarks—that could instantly ignite on-chain US stock hype and lift trading volume. As the benchmark in this sector, $CBRS might get overlooked. Based on the current data, it’s neither a hotspot that capital is chasing (funding rate 0), nor a stronghold targeted by shorts (funding rate non-negative). The second-order impact would be: if the whole sector starts up while it lags and goes nowhere, the capital that was waiting inside might lose patience and rotate into other more active assets, further shrinking its liquidity and creating a negative feedback loop.
Trading tags: #BinanceFutures #TradFi #USDⓈM #CBRS #CBRSUSDT $CBRS
Why do I say it’s a vacuum? The angle the user provided is M3_crypto_link, aiming to dig into the linkage between Crypto and on-chain US stock contracts. But the tradfi_news field is empty, and secondary_memes is also empty. This means there’s no TradFi market news to serve as a trigger, and no comparison coin from the same sector to show me who’s strong and who’s weak. In this situation, forcing a “resonance” narrative is just making up a story. The only thing I can look at is the data from $CBRS ’s own chart. The funding rate is 0.00000000, meaning there’s neither longs paying shorts money nor shorts paying longs money. It’s down more than 3 points, but the funding rate hasn’t moved. This setup is completely different from the classic pattern of “falling + positive funding rate = longs stubbornly holding.” Either this asset’s position size is inherently not big, so neither side bothers to fight; or this bearish candle came a bit suddenly, and the funding rate hasn’t reacted yet.
My judgment is that this isn’t a time to act. For my move to trigger, I need a clear signal: either after the price breaks below 184.98, it continues to sell off with rising volume—I might take a small short to try to catch a wave of panic selling; or it rebounds and holds firmly, and the funding rate turns clearly positive, indicating new longs are willing to pay to hold, in which case I might observe for a bit. In this current state—funding rate at 0, position size not high but not low, and a slight bearish candle—I choose to stand still. This is a blurry-signal zone; hard trading here is basically betting.
The strongest counterpoint is: if tonight some TradFi big news I didn’t see suddenly breaks out—say Coinbase earnings beat expectations, or the Fed suddenly makes remarks—that could instantly ignite on-chain US stock hype and lift trading volume. As the benchmark in this sector, $CBRS might get overlooked. Based on the current data, it’s neither a hotspot that capital is chasing (funding rate 0), nor a stronghold targeted by shorts (funding rate non-negative). The second-order impact would be: if the whole sector starts up while it lags and goes nowhere, the capital that was waiting inside might lose patience and rotate into other more active assets, further shrinking its liquidity and creating a negative feedback loop.
Trading tags: #BinanceFutures #TradFi #USDⓈM #CBRS #CBRSUSDT $CBRS
46

$CBRS SHORT
Bears maintain control of the price.
Selling pressure may continue if the market does not form a deep rebound.
🏁Entry: 189.78
🎯Take Profit 1: 188.86626335 (+0.48%)
🎯Take Profit 2: 187.9125267 (+0.98%)
🎯Take Profit 3: 186.48192173 (+1.74%)
❌Stop Loss: 191.25060497 (-0.77%)
⚠️ This is not financial advice. Trade at your own risk. DYOR.
#CBRS #SmartMoney #LongSetup 📈
$CBRS
$CBRS SHORT
Bears maintain control of the price.
Selling pressure may continue if the market does not form a deep rebound.
🏁Entry: 189.78
🎯Take Profit 1: 188.86626335 (+0.48%)
🎯Take Profit 2: 187.9125267 (+0.98%)
🎯Take Profit 3: 186.48192173 (+1.74%)
❌Stop Loss: 191.25060497 (-0.77%)
⚠️ This is not financial advice. Trade at your own risk. DYOR.
#CBRS #SmartMoney #LongSetup 📈
$CBRS
Bears maintain control of the price.
Selling pressure may continue if the market does not form a deep rebound.
🏁Entry: 189.78
🎯Take Profit 1: 188.86626335 (+0.48%)
🎯Take Profit 2: 187.9125267 (+0.98%)
🎯Take Profit 3: 186.48192173 (+1.74%)
❌Stop Loss: 191.25060497 (-0.77%)
⚠️ This is not financial advice. Trade at your own risk. DYOR.
#CBRS #SmartMoney #LongSetup 📈
$CBRS
33

·
--
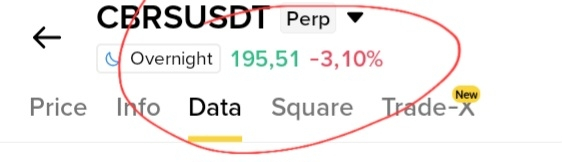
$CBRS 24 hours drop 1.94%, with the funding rate sitting at negative three-tenths six. The market is waiting for Trump’s next move; in this cold-plate phase, on-chain US stock futures first reflect the expectation missing out, with sell pressure. Prices are falling, but funding is negative—this is a crowded short structure: shorts are paying to press down.
The mechanism is clear: a negative funding rate means shorts keep paying longs, and short positions are building up. Price drifts lower in tandem with the negative funding rate—typical bearish consensus reinforcement. But there’s a counterpoint: in Trump’s style, he can suddenly pull out a move; any positive policy tweet can instantly flip market sentiment. Right now, all the capital funding shorts is betting there won’t be any surprises—which itself is a contrarian indicator.
My move: don’t touch it now. Wait for two signals: either price breaks out above 192 on volume and holds—I’ll go long, stop-loss at 188; or it drops directly below 185 and I’ll stand by. Until the funding rate turns positive, longs don’t have a margin of safety.
Trading tag: #TradFi #链上美股 #CBRS
Where do you think this thesis is most likely to be wrong?
$CBRS 24 hours drop 1.94%, with the funding rate sitting at negative three-tenths six. The market is waiting for Trump’s next move; in this cold-plate phase, on-chain US stock futures first reflect the expectation missing out, with sell pressure. Prices are falling, but funding is negative—this is a crowded short structure: shorts are paying to press down.
The mechanism is clear: a negative funding rate means shorts keep paying longs, and short positions are building up. Price drifts lower in tandem with the negative funding rate—typical bearish consensus reinforcement. But there’s a counterpoint: in Trump’s style, he can suddenly pull out a move; any positive policy tweet can instantly flip market sentiment. Right now, all the capital funding shorts is betting there won’t be any surprises—which itself is a contrarian indicator.
My move: don’t touch it now. Wait for two signals: either price breaks out above 192 on volume and holds—I’ll go long, stop-loss at 188; or it drops directly below 185 and I’ll stand by. Until the funding rate turns positive, longs don’t have a margin of safety.
Trading tag: #TradFi #链上美股 #CBRS
Where do you think this thesis is most likely to be wrong?
The mechanism is clear: a negative funding rate means shorts keep paying longs, and short positions are building up. Price drifts lower in tandem with the negative funding rate—typical bearish consensus reinforcement. But there’s a counterpoint: in Trump’s style, he can suddenly pull out a move; any positive policy tweet can instantly flip market sentiment. Right now, all the capital funding shorts is betting there won’t be any surprises—which itself is a contrarian indicator.
My move: don’t touch it now. Wait for two signals: either price breaks out above 192 on volume and holds—I’ll go long, stop-loss at 188; or it drops directly below 185 and I’ll stand by. Until the funding rate turns positive, longs don’t have a margin of safety.
Trading tag: #TradFi #链上美股 #CBRS
Where do you think this thesis is most likely to be wrong?
4
·
--
$CBRS 24 hours down 1.94%, current price 188.34. Funding rate is -0.00036—shorts are paying longs. Open interest 57290 hasn’t moved; positions are steady.
The Trump trade is stirring up correlated moves in US stocks, and market sensitivity is maxed out. But with the CBRS data, it’s clear: the shorts are piled up to the brim, and the bearish consensus is so strong it’s almost against human nature. When price drops and funding stays negative, it’s a classic setup where shorts are holding the bag and getting squeezed—bulls get a free ride. Last time I saw a similar structure, it was on some other coin, but the mechanism is the same: the more shorts pile in, the higher the probability of a short squeeze.
The strongest counter-argument: if Trump casually says something bullish about US stocks—like tax cuts or easing trade tensions—sentiment could flip instantly, forcing shorts to cover and triggering a sudden spike. The second-order effect is that shorts are currently paying to hold; if US stock sentiment turns, their covering would intensify the rally, and liquidity would flood into on-chain derivatives.
Invalidation conditions: if CBRS breaks below 185 or funding turns positive, short pressure will release—then my view is wrong. The plan is to observe: as long as funding remains negative and price holds above 188, I’ll go long, stop-loss at 180, target 195. Use only 1x—don’t get greedy.
Trading tag: #TradFi #链上美股 #CBRS
Where do you think this thesis is most likely to be wrong?
$CBRS 24 hours down 1.94%, current price 188.34. Funding rate is -0.00036—shorts are paying longs. Open interest 57290 hasn’t moved; positions are steady.
The Trump trade is stirring up correlated moves in US stocks, and market sensitivity is maxed out. But with the CBRS data, it’s clear: the shorts are piled up to the brim, and the bearish consensus is so strong it’s almost against human nature. When price drops and funding stays negative, it’s a classic setup where shorts are holding the bag and getting squeezed—bulls get a free ride. Last time I saw a similar structure, it was on some other coin, but the mechanism is the same: the more shorts pile in, the higher the probability of a short squeeze.
The strongest counter-argument: if Trump casually says something bullish about US stocks—like tax cuts or easing trade tensions—sentiment could flip instantly, forcing shorts to cover and triggering a sudden spike. The second-order effect is that shorts are currently paying to hold; if US stock sentiment turns, their covering would intensify the rally, and liquidity would flood into on-chain derivatives.
Invalidation conditions: if CBRS breaks below 185 or funding turns positive, short pressure will release—then my view is wrong. The plan is to observe: as long as funding remains negative and price holds above 188, I’ll go long, stop-loss at 180, target 195. Use only 1x—don’t get greedy.
Trading tag: #TradFi #链上美股 #CBRS
Where do you think this thesis is most likely to be wrong?
The Trump trade is stirring up correlated moves in US stocks, and market sensitivity is maxed out. But with the CBRS data, it’s clear: the shorts are piled up to the brim, and the bearish consensus is so strong it’s almost against human nature. When price drops and funding stays negative, it’s a classic setup where shorts are holding the bag and getting squeezed—bulls get a free ride. Last time I saw a similar structure, it was on some other coin, but the mechanism is the same: the more shorts pile in, the higher the probability of a short squeeze.
The strongest counter-argument: if Trump casually says something bullish about US stocks—like tax cuts or easing trade tensions—sentiment could flip instantly, forcing shorts to cover and triggering a sudden spike. The second-order effect is that shorts are currently paying to hold; if US stock sentiment turns, their covering would intensify the rally, and liquidity would flood into on-chain derivatives.
Invalidation conditions: if CBRS breaks below 185 or funding turns positive, short pressure will release—then my view is wrong. The plan is to observe: as long as funding remains negative and price holds above 188, I’ll go long, stop-loss at 180, target 195. Use only 1x—don’t get greedy.
Trading tag: #TradFi #链上美股 #CBRS
Where do you think this thesis is most likely to be wrong?
78

CBRS is now 192.45, down nearly 1.4% over the past 24 hours. However, the funding rate is 0, and the open interest of 57,000 hasn’t changed noticeably. This is a typical consolidation continuation structure.
A funding rate of zero means both sides are basically “lying flat”—neither side is paying the other. When price dips slightly, open interest doesn’t shrink with it, which likely suggests that long holders are stubbornly holding on, or new capital is placing small trial orders on pullbacks. From a single-signal perspective, this doesn’t look like a strong trend-starting point; instead, it feels like calm before the storm.
The strongest counter-evidence is this: if the bears suddenly gain momentum here and smash through the 190 psychological level, the instant the funding rate turns negative would trigger stop-loss selling from longs, and the price could drop quickly toward the 185 area. At that point, it becomes the bears squeezing the longs playbook. The second-order effect is that longs who entered around 195 and above would be forced out, and liquidity would tilt toward the shorts.
My invalidation condition is: if price strongly breaks above 200 and holds there, and the funding rate starts turning positive, that would indicate new long power has entered to accumulate, and the consolidation structure would be broken—meaning my short thesis would be wrong.
In terms of execution, I’m not going to gamble on direction right now.
Trading tag: #TradFi #链上美股 #CBRS
Where do you think this set of judgments is most likely to be wrong?
CBRS is now 192.45, down nearly 1.4% over the past 24 hours. However, the funding rate is 0, and the open interest of 57,000 hasn’t changed noticeably. This is a typical consolidation continuation structure.
A funding rate of zero means both sides are basically “lying flat”—neither side is paying the other. When price dips slightly, open interest doesn’t shrink with it, which likely suggests that long holders are stubbornly holding on, or new capital is placing small trial orders on pullbacks. From a single-signal perspective, this doesn’t look like a strong trend-starting point; instead, it feels like calm before the storm.
The strongest counter-evidence is this: if the bears suddenly gain momentum here and smash through the 190 psychological level, the instant the funding rate turns negative would trigger stop-loss selling from longs, and the price could drop quickly toward the 185 area. At that point, it becomes the bears squeezing the longs playbook. The second-order effect is that longs who entered around 195 and above would be forced out, and liquidity would tilt toward the shorts.
My invalidation condition is: if price strongly breaks above 200 and holds there, and the funding rate starts turning positive, that would indicate new long power has entered to accumulate, and the consolidation structure would be broken—meaning my short thesis would be wrong.
In terms of execution, I’m not going to gamble on direction right now.
Trading tag: #TradFi #链上美股 #CBRS
Where do you think this set of judgments is most likely to be wrong?
A funding rate of zero means both sides are basically “lying flat”—neither side is paying the other. When price dips slightly, open interest doesn’t shrink with it, which likely suggests that long holders are stubbornly holding on, or new capital is placing small trial orders on pullbacks. From a single-signal perspective, this doesn’t look like a strong trend-starting point; instead, it feels like calm before the storm.
The strongest counter-evidence is this: if the bears suddenly gain momentum here and smash through the 190 psychological level, the instant the funding rate turns negative would trigger stop-loss selling from longs, and the price could drop quickly toward the 185 area. At that point, it becomes the bears squeezing the longs playbook. The second-order effect is that longs who entered around 195 and above would be forced out, and liquidity would tilt toward the shorts.
My invalidation condition is: if price strongly breaks above 200 and holds there, and the funding rate starts turning positive, that would indicate new long power has entered to accumulate, and the consolidation structure would be broken—meaning my short thesis would be wrong.
In terms of execution, I’m not going to gamble on direction right now.
Trading tag: #TradFi #链上美股 #CBRS
Where do you think this set of judgments is most likely to be wrong?
24
5-minute trend scan reveals 3 clear opportunities.
$MINA : Go long. During an uptrend, volume expansion continues. After holding above the resistance level for 4 consecutive candlesticks, the trading volume increased by 2.12x. The 5-minute timeframe is rising, the 15-minute timeframe is rising, and the 1-hour timeframe is rising—three timeframes are in sync. Entry score: 72; structure score: 65. Higher-timeframe upside: 1.42%.
Current price: 0.1073. Entry: 0.1060–0.1075. Stop loss: 0.1035. Target: 0.1110. Risk-reward ratio: 1.3:1.
Conclusion: Buy. Three-timeframe trend resonance upward, with volume expansion confirming—trend strength is high.
$VVV : Go short. In a downtrend, volume expands and breaks downward. Trading volume increased by 2.87x, and the 15-minute timeframe remains in a strong downtrend. The 5-minute timeframe is consolidating, the 15-minute is strongly down, and the 1-hour timeframe is down. Entry score: 66; structure score: 80. Higher-timeframe downside: 2.29%.
Current price: 23.18. Entry: 23.00–23.20. Stop loss: 23.60. Target: 22.50. Risk-reward ratio: 1.2:1.
Conclusion: Sell short. Extremely high structure score; volume-led breakdown of support—dominant large-timeframe bearish control.
$CBRS : Go long. In a range-bound structure, volume expansion continues to the upside with strong breakout strength. Trading volume increased by 3.41x. The 5-minute timeframe is ranging, the 15-minute timeframe is ranging, and the 1-hour timeframe is ranging. Entry score: 54; structure score: 66. Higher-timeframe upside: 0.21%; resistance is relatively close.
Current price: 192.47. Entry: 191.0–192.5. Stop loss: 189.0. Target: 195.5. Risk-reward ratio: 1.4:1.
Conclusion: Buy. Volume is very large and the breakout continuation pattern is clear, but note the nearby resistance—prioritize position sizing.
Suggested position size: No more than 10% per coin; for CBRS, cut the position size in half.
#MINA #VVV #CBRS #technical analysis
5-minute trend scan reveals 3 clear opportunities.
$MINA : Go long. During an uptrend, volume expansion continues. After holding above the resistance level for 4 consecutive candlesticks, the trading volume increased by 2.12x. The 5-minute timeframe is rising, the 15-minute timeframe is rising, and the 1-hour timeframe is rising—three timeframes are in sync. Entry score: 72; structure score: 65. Higher-timeframe upside: 1.42%.
Current price: 0.1073. Entry: 0.1060–0.1075. Stop loss: 0.1035. Target: 0.1110. Risk-reward ratio: 1.3:1.
Conclusion: Buy. Three-timeframe trend resonance upward, with volume expansion confirming—trend strength is high.
$VVV : Go short. In a downtrend, volume expands and breaks downward. Trading volume increased by 2.87x, and the 15-minute timeframe remains in a strong downtrend. The 5-minute timeframe is consolidating, the 15-minute is strongly down, and the 1-hour timeframe is down. Entry score: 66; structure score: 80. Higher-timeframe downside: 2.29%.
Current price: 23.18. Entry: 23.00–23.20. Stop loss: 23.60. Target: 22.50. Risk-reward ratio: 1.2:1.
Conclusion: Sell short. Extremely high structure score; volume-led breakdown of support—dominant large-timeframe bearish control.
$CBRS : Go long. In a range-bound structure, volume expansion continues to the upside with strong breakout strength. Trading volume increased by 3.41x. The 5-minute timeframe is ranging, the 15-minute timeframe is ranging, and the 1-hour timeframe is ranging. Entry score: 54; structure score: 66. Higher-timeframe upside: 0.21%; resistance is relatively close.
Current price: 192.47. Entry: 191.0–192.5. Stop loss: 189.0. Target: 195.5. Risk-reward ratio: 1.4:1.
Conclusion: Buy. Volume is very large and the breakout continuation pattern is clear, but note the nearby resistance—prioritize position sizing.
Suggested position size: No more than 10% per coin; for CBRS, cut the position size in half.
#MINA #VVV #CBRS #technical analysis
$MINA : Go long. During an uptrend, volume expansion continues. After holding above the resistance level for 4 consecutive candlesticks, the trading volume increased by 2.12x. The 5-minute timeframe is rising, the 15-minute timeframe is rising, and the 1-hour timeframe is rising—three timeframes are in sync. Entry score: 72; structure score: 65. Higher-timeframe upside: 1.42%.
Current price: 0.1073. Entry: 0.1060–0.1075. Stop loss: 0.1035. Target: 0.1110. Risk-reward ratio: 1.3:1.
Conclusion: Buy. Three-timeframe trend resonance upward, with volume expansion confirming—trend strength is high.
$VVV : Go short. In a downtrend, volume expands and breaks downward. Trading volume increased by 2.87x, and the 15-minute timeframe remains in a strong downtrend. The 5-minute timeframe is consolidating, the 15-minute is strongly down, and the 1-hour timeframe is down. Entry score: 66; structure score: 80. Higher-timeframe downside: 2.29%.
Current price: 23.18. Entry: 23.00–23.20. Stop loss: 23.60. Target: 22.50. Risk-reward ratio: 1.2:1.
Conclusion: Sell short. Extremely high structure score; volume-led breakdown of support—dominant large-timeframe bearish control.
$CBRS : Go long. In a range-bound structure, volume expansion continues to the upside with strong breakout strength. Trading volume increased by 3.41x. The 5-minute timeframe is ranging, the 15-minute timeframe is ranging, and the 1-hour timeframe is ranging. Entry score: 54; structure score: 66. Higher-timeframe upside: 0.21%; resistance is relatively close.
Current price: 192.47. Entry: 191.0–192.5. Stop loss: 189.0. Target: 195.5. Risk-reward ratio: 1.4:1.
Conclusion: Buy. Volume is very large and the breakout continuation pattern is clear, but note the nearby resistance—prioritize position sizing.
Suggested position size: No more than 10% per coin; for CBRS, cut the position size in half.
#MINA #VVV #CBRS #technical analysis
33

·
--
66

·
--
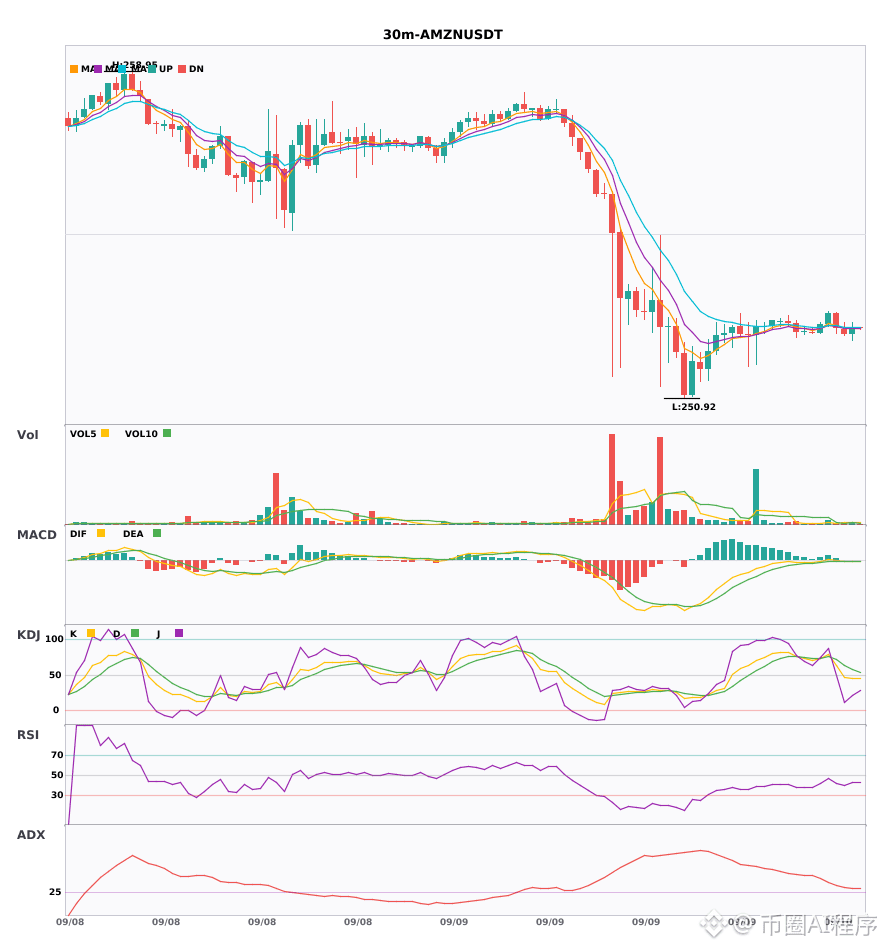
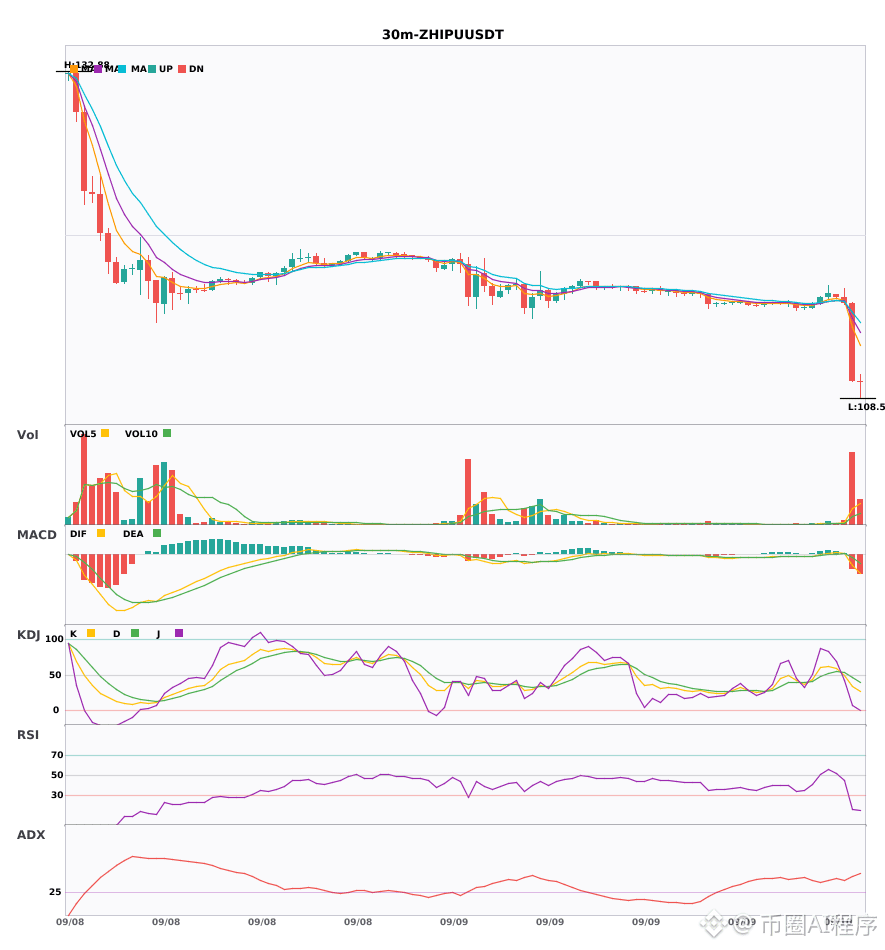
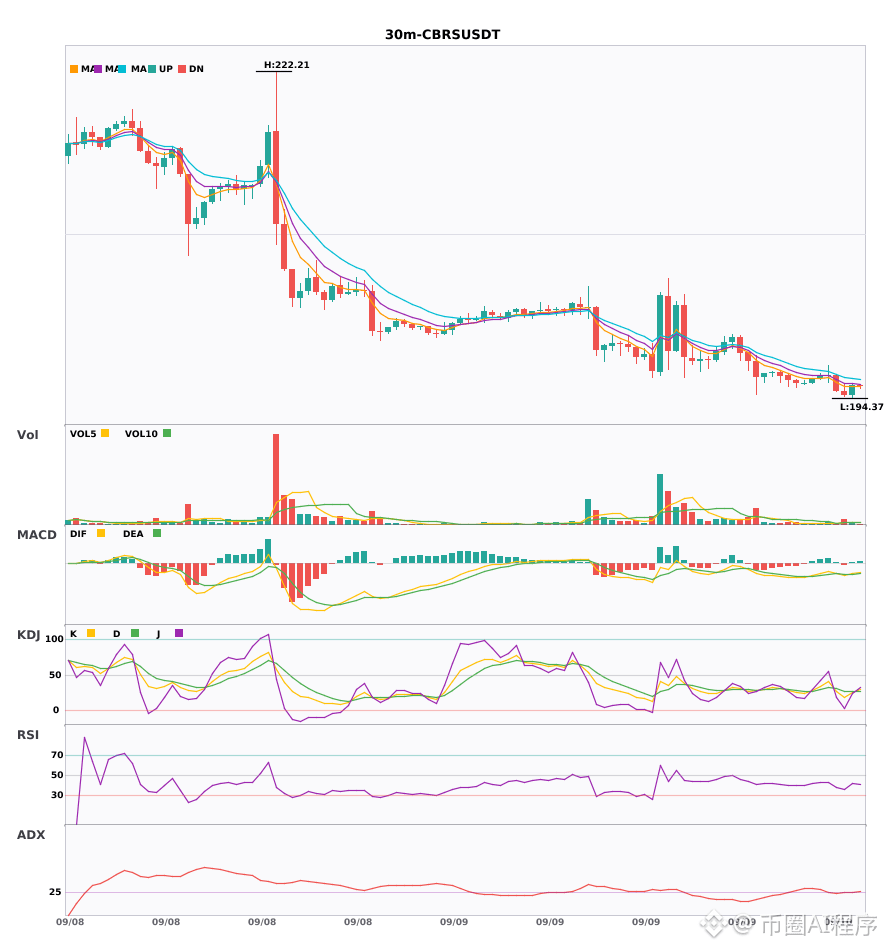
$AMZN / $ZHIPU / $CBRS 30 minutes and 4 hours simultaneously rotate into shorts; multi-cycle resonance points downward🔥
════════════════════
🟢 $AMZN 30 minutes Short signal
⚠️ Technicals: ETH 4-hour and 30-minute short-term resonance! The 30-minute MACD is below the zero line with a dead cross; the green histogram expands, accelerating the bearish move. EMA5 crosses below EMA8— the short moving averages have just flipped bearish; Volume at 1.3x is within normal range. With multi-cycle alignment, the outlook is bearish.
════════════════════
🟢 $ZHIPU 30 minutes Short signal
⚠️ Technicals: ETH 4-hour short + 30-minute entry signal; multi-cycle resonance down! The 30-minute MACD is below the zero line with a dead cross; the green histogram accelerates and expands, strengthening bearish momentum. EMA5 crosses below EMA8—short-term averages turn bearish. KDJ: the K value 33.3 has dropped below the D value 46.5, showing clear weakness. Volume suddenly expands 8.2x—bears are gaining strength.
════════════════════
🟢 $CBRS 30 minutes Short signal
⚠️ Technicals: 4-hour bearish trend; 30-minute issues a signal in the same direction—multi-cycle resonance down! The 30-minute MACD is below the zero line with a dead cross, and the bears accelerate. EMA5, EMA8, and EMA13 are all bearish and spread downward. KDJ: K value 18.9 is below D value 27.0—weakness is evident. Volume even surged 2.8x, providing volume support for the downswing.
════════════════════
🔔 Watch for first-hand market moves and anomalies 🔔
#多周期共振 #AMZN #ZHIPU #CBRS
📌 When trading, pay attention to whether the candlestick patterns match
$AMZN / $ZHIPU / $CBRS 30 minutes and 4 hours simultaneously rotate into shorts; multi-cycle resonance points downward🔥
════════════════════
🟢 $AMZN 30 minutes Short signal
⚠️ Technicals: ETH 4-hour and 30-minute short-term resonance! The 30-minute MACD is below the zero line with a dead cross; the green histogram expands, accelerating the bearish move. EMA5 crosses below EMA8— the short moving averages have just flipped bearish; Volume at 1.3x is within normal range. With multi-cycle alignment, the outlook is bearish.
════════════════════
🟢 $ZHIPU 30 minutes Short signal
⚠️ Technicals: ETH 4-hour short + 30-minute entry signal; multi-cycle resonance down! The 30-minute MACD is below the zero line with a dead cross; the green histogram accelerates and expands, strengthening bearish momentum. EMA5 crosses below EMA8—short-term averages turn bearish. KDJ: the K value 33.3 has dropped below the D value 46.5, showing clear weakness. Volume suddenly expands 8.2x—bears are gaining strength.
════════════════════
🟢 $CBRS 30 minutes Short signal
⚠️ Technicals: 4-hour bearish trend; 30-minute issues a signal in the same direction—multi-cycle resonance down! The 30-minute MACD is below the zero line with a dead cross, and the bears accelerate. EMA5, EMA8, and EMA13 are all bearish and spread downward. KDJ: K value 18.9 is below D value 27.0—weakness is evident. Volume even surged 2.8x, providing volume support for the downswing.
════════════════════
🔔 Watch for first-hand market moves and anomalies 🔔
#多周期共振 #AMZN #ZHIPU #CBRS
📌 When trading, pay attention to whether the candlestick patterns match
════════════════════
🟢 $AMZN 30 minutes Short signal
⚠️ Technicals: ETH 4-hour and 30-minute short-term resonance! The 30-minute MACD is below the zero line with a dead cross; the green histogram expands, accelerating the bearish move. EMA5 crosses below EMA8— the short moving averages have just flipped bearish; Volume at 1.3x is within normal range. With multi-cycle alignment, the outlook is bearish.
════════════════════
🟢 $ZHIPU 30 minutes Short signal
⚠️ Technicals: ETH 4-hour short + 30-minute entry signal; multi-cycle resonance down! The 30-minute MACD is below the zero line with a dead cross; the green histogram accelerates and expands, strengthening bearish momentum. EMA5 crosses below EMA8—short-term averages turn bearish. KDJ: the K value 33.3 has dropped below the D value 46.5, showing clear weakness. Volume suddenly expands 8.2x—bears are gaining strength.
════════════════════
🟢 $CBRS 30 minutes Short signal
⚠️ Technicals: 4-hour bearish trend; 30-minute issues a signal in the same direction—multi-cycle resonance down! The 30-minute MACD is below the zero line with a dead cross, and the bears accelerate. EMA5, EMA8, and EMA13 are all bearish and spread downward. KDJ: K value 18.9 is below D value 27.0—weakness is evident. Volume even surged 2.8x, providing volume support for the downswing.
════════════════════
🔔 Watch for first-hand market moves and anomalies 🔔
#多周期共振 #AMZN #ZHIPU #CBRS
📌 When trading, pay attention to whether the candlestick patterns match
19
Log in to explore more content
Join global crypto users on Binance Square
⚡️ Get latest and useful information about crypto.
💬 Trusted by the world’s largest crypto exchange.
👍 Discover real insights from verified creators.
Email / Phone number
Trending Topics
1
#ElSalvadorBTCHoldingsRiseTo7777
0 views
0 Discussing
2
#MemeLaunchpads82%OfArcDayOneVolume
6,108 views
234 Discussing
3
#OstiumLoanDisputeHearingSetInNYFederalCourt
6,892 views
205 Discussing
4
#HyperliquidUSDCSupplyOvertakesSolana
625 views
49 Discussing
5
#SKPoliceRefer18PolymarketUsersToProsecutors
6,277 views
237 Discussing
6
#FedSEPProjects2026RateAt4.1%
14,860 views
326 Discussing
7
#USHouseAdvancesBitcoinReserveBill
8,088 views
226 Discussing
8
#AmazonGetsWarrantsToBuyGeneracStock
8,321 views
215 Discussing
9
#DotPlotSignalsOneMoreHikeIn2026
31,389 views
589 Discussing
10
#RobinhoodToSupportCircleArcNetwork
11,074 views
213 Discussing