

Neel_Proshun_DXC
8.1k Posts

Neel_Proshun_DXC
Report
Block User
Binance Square Content Creator | Crypto Lover | Learning Trading | Friendly | Altcoins | X- @Neel_Proshun
444 Following
19.2K+ Followers
6.5K+ Liked
Posts
All
Quotes
🚨 BLACKROCK IS BUYING THE DIP? 👀
BlackRock’s iShares Bitcoin Trust (IBIT) has reportedly added 656.661 BTC, worth around $BTC.
That’s another major institutional flow into Bitcoin, and IBIT’s holdings are already around 795K BTC based on recent disclosed data.
The interesting part? October is just around the corner. 📈
Bitcoin has historically performed strongly in October, while recent ETF flows have also shown renewed institutional demand.
🔥 BTC Setup
Bias: Bullish above key support
Confirmation: Continued ETF inflows + reclaim of major resistance
Upside: A breakout could open the door toward the next major resistance zones
Invalidation: Losing key support with strong selling volume could trigger another correction
BlackRock buying is a bullish demand signal, but it doesn’t guarantee an October rally. Traders should watch spot ETF flows, BTC volume, liquidity and market structure before chasing.
UPTOBER loading? 👀🚀
#Bitcoin #BTC #blackRock #IBIT #Crypto $BTC
🚨 BLACKROCK IS BUYING THE DIP? 👀
BlackRock’s iShares Bitcoin Trust (IBIT) has reportedly added 656.661 BTC, worth around $BTC .
That’s another major institutional flow into Bitcoin, and IBIT’s holdings are already around 795K BTC based on recent disclosed data.
The interesting part? October is just around the corner. 📈
Bitcoin has historically performed strongly in October, while recent ETF flows have also shown renewed institutional demand.
🔥 BTC Setup
Bias: Bullish above key support
Confirmation: Continued ETF inflows + reclaim of major resistance
Upside: A breakout could open the door toward the next major resistance zones
Invalidation: Losing key support with strong selling volume could trigger another correction
BlackRock buying is a bullish demand signal, but it doesn’t guarantee an October rally. Traders should watch spot ETF flows, BTC volume, liquidity and market structure before chasing.
UPTOBER loading? 👀🚀
#Bitcoin #BTC #blackRock #IBIT #Crypto $BTC
BlackRock’s iShares Bitcoin Trust (IBIT) has reportedly added 656.661 BTC, worth around $BTC .
That’s another major institutional flow into Bitcoin, and IBIT’s holdings are already around 795K BTC based on recent disclosed data.
The interesting part? October is just around the corner. 📈
Bitcoin has historically performed strongly in October, while recent ETF flows have also shown renewed institutional demand.
🔥 BTC Setup
Bias: Bullish above key support
Confirmation: Continued ETF inflows + reclaim of major resistance
Upside: A breakout could open the door toward the next major resistance zones
Invalidation: Losing key support with strong selling volume could trigger another correction
BlackRock buying is a bullish demand signal, but it doesn’t guarantee an October rally. Traders should watch spot ETF flows, BTC volume, liquidity and market structure before chasing.
UPTOBER loading? 👀🚀
#Bitcoin #BTC #blackRock #IBIT #Crypto $BTC
120
Bitget’s hot wallet was reportedly compromised in an attack involving around $350M in assets.
What makes this incident particularly notable is that the attacker reportedly did not obtain private keys. Instead, a critical wallet backend was compromised, allowing fraudulent transfer data to be created and the signing process to be triggered.
Bitget says its cold wallets remain unaffected, while its $464M+ User Protection Fund is intended to cover the affected amount.
The bigger lesson is clear: crypto security doesn’t end with private keys. The infrastructure connecting wallets, backend systems, transaction data, and signing mechanisms can become a critical attack surface too.
For users, it’s another reminder to think carefully about exchange custody and avoid keeping all of your crypto on a single CEX.
Not your keys, not your crypto. Stay safe.
Bitget’s hot wallet was reportedly compromised in an attack involving around $350M in assets.
What makes this incident particularly notable is that the attacker reportedly did not obtain private keys. Instead, a critical wallet backend was compromised, allowing fraudulent transfer data to be created and the signing process to be triggered.
Bitget says its cold wallets remain unaffected, while its $464M+ User Protection Fund is intended to cover the affected amount.
The bigger lesson is clear: crypto security doesn’t end with private keys. The infrastructure connecting wallets, backend systems, transaction data, and signing mechanisms can become a critical attack surface too.
For users, it’s another reminder to think carefully about exchange custody and avoid keeping all of your crypto on a single CEX.
Not your keys, not your crypto. Stay safe.
What makes this incident particularly notable is that the attacker reportedly did not obtain private keys. Instead, a critical wallet backend was compromised, allowing fraudulent transfer data to be created and the signing process to be triggered.
Bitget says its cold wallets remain unaffected, while its $464M+ User Protection Fund is intended to cover the affected amount.
The bigger lesson is clear: crypto security doesn’t end with private keys. The infrastructure connecting wallets, backend systems, transaction data, and signing mechanisms can become a critical attack surface too.
For users, it’s another reminder to think carefully about exchange custody and avoid keeping all of your crypto on a single CEX.
Not your keys, not your crypto. Stay safe.
68
Nvidia CEO Jensen Huang says we’re heading into a “low‑IQ era,” arguing that children won’t need to learn basic math.
Now can we send $NVDA.US to $300?
$NVDAB
{spot}(NVDABUSDT)
Nvidia CEO Jensen Huang says we’re heading into a “low‑IQ era,” arguing that children won’t need to learn basic math.
Now can we send $NVDA.US to $300?
$NVDAB
Now can we send $NVDA.US to $300?
$NVDAB
NVDAB+0.86%
NVDAUS+1.22%
1
126
Bitcoin Whale Activity: An On-Chain Update
$BTC 100–1,000 BTC wallet cohort has shown notable activity in recent months.
According to data attributed to Santiment, this group has increased its combined Bitcoin holdings since mid-July, with total holdings reaching around 5.24 million BTC.
This type of on-chain data can provide useful insight into how Bitcoin supply is distributed across different wallet sizes. However, wallet accumulation by itself does not confirm a future price direction or guarantee that the market will move higher.
Bitcoin’s broader market structure is influenced by multiple factors, including liquidity, ETF flows, trading activity, derivatives positioning and overall market demand.
For traders and investors, whale-wallet activity can therefore be viewed as one data point among many, rather than a standalone market signal.
On-chain data shows what is happening with wallet balances the market decides how that information is ultimately reflected in price.
Educational content only. Not financial advice.
#BTCShortTermPullback $BTC $SOL
#ShareWeekly
Bitcoin Whale Activity: An On-Chain Update
$BTC 100–1,000 BTC wallet cohort has shown notable activity in recent months.
According to data attributed to Santiment, this group has increased its combined Bitcoin holdings since mid-July, with total holdings reaching around 5.24 million BTC.
This type of on-chain data can provide useful insight into how Bitcoin supply is distributed across different wallet sizes. However, wallet accumulation by itself does not confirm a future price direction or guarantee that the market will move higher.
Bitcoin’s broader market structure is influenced by multiple factors, including liquidity, ETF flows, trading activity, derivatives positioning and overall market demand.
For traders and investors, whale-wallet activity can therefore be viewed as one data point among many, rather than a standalone market signal.
On-chain data shows what is happening with wallet balances the market decides how that information is ultimately reflected in price.
Educational content only. Not financial advice.
#BTCShortTermPullback $BTC $SOL
#ShareWeekly
$BTC 100–1,000 BTC wallet cohort has shown notable activity in recent months.
According to data attributed to Santiment, this group has increased its combined Bitcoin holdings since mid-July, with total holdings reaching around 5.24 million BTC.
This type of on-chain data can provide useful insight into how Bitcoin supply is distributed across different wallet sizes. However, wallet accumulation by itself does not confirm a future price direction or guarantee that the market will move higher.
Bitcoin’s broader market structure is influenced by multiple factors, including liquidity, ETF flows, trading activity, derivatives positioning and overall market demand.
For traders and investors, whale-wallet activity can therefore be viewed as one data point among many, rather than a standalone market signal.
On-chain data shows what is happening with wallet balances the market decides how that information is ultimately reflected in price.
Educational content only. Not financial advice.
#BTCShortTermPullback $BTC $SOL
#ShareWeekly
68
I enjoyed most about the summer camp was the practical, hands-on approach to building a secure and sustainable investment strategy especially learning how to balance a core spot portfolio, utilize Earn products safely and maintain discipline against online scams and FOMO.
#BinanceSummerCamp
I enjoyed most about the summer camp was the practical, hands-on approach to building a secure and sustainable investment strategy especially learning how to balance a core spot portfolio, utilize Earn products safely and maintain discipline against online scams and FOMO.
#BinanceSummerCamp
#BinanceSummerCamp

93
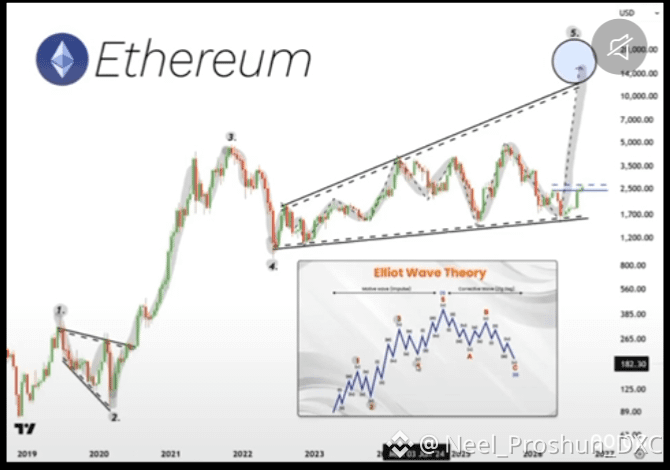
$ETH IS EYEING FIVE DIGITS
Waves 1-4 are reportedly complete. Now Wave 5 could be the move that changes everything.
$BTCUSDT is also showing strength, while $ETH USDT continues to attract attention as the broader crypto market enters another major expansion phase.
$5,000 could become just another level.
$10,000 could be left behind.
The bullish chart structure is pointing toward the $14,000-$20,000 zone if the final expansion plays out.
With $BTC leading the market and $ETHpotentially entering its final expansion, the next major move could be absolutely explosive.
Are you bullish enough?
$ETH IS EYEING FIVE DIGITS
Waves 1-4 are reportedly complete. Now Wave 5 could be the move that changes everything.
$BTCUSDT is also showing strength, while $ETH USDT continues to attract attention as the broader crypto market enters another major expansion phase.
$5,000 could become just another level.
$10,000 could be left behind.
The bullish chart structure is pointing toward the $14,000-$20,000 zone if the final expansion plays out.
With $BTC leading the market and $ETHpotentially entering its final expansion, the next major move could be absolutely explosive.
Are you bullish enough?
Waves 1-4 are reportedly complete. Now Wave 5 could be the move that changes everything.
$BTCUSDT is also showing strength, while $ETH USDT continues to attract attention as the broader crypto market enters another major expansion phase.
$5,000 could become just another level.
$10,000 could be left behind.
The bullish chart structure is pointing toward the $14,000-$20,000 zone if the final expansion plays out.
With $BTC leading the market and $ETHpotentially entering its final expansion, the next major move could be absolutely explosive.
Are you bullish enough?
97
Bitcoin’s latest move above the 50-week average is giving bulls a signal worth watching.
Since 2011, there have been 13 weekly closes back above the 50-week average during completed bear markets. In 11 of those cases, Bitcoin never returned to take out the prior cycle low. Sunday’s close at $BTCmarks the 14th reclaim, coming after 45 weeks below the average, which now sits near $78.8K. The four reclaims that began major new cycles came in January 2012, October 2015, May 2019, and March 2023. Each preceded a much larger advance, despite looking late at the time.
Timing is also important. Galaxy’s data shows confirmed reclaims historically appeared 130 to 284 days after the cycle bottom, with $BTC already up roughly 63% to 80%. This signal arrived just 82 days after the June 30 low near $58,525,with Bitcoin up about 39%.
That leaves the current setup less extended than previous clean reclaims.
Bitcoin is now around $85,150, while $89.6K marks the 2.0 Fibonacci extension of the $74.9K–$82.3K move. The two-year average sits near $88.8K making $90K a key technical magnet.
The big test now is whether the $78.8K–$82K zone can become support.
#BTC #bitcoin #bitcoinwarm $BTC #Write2Earn
{future}(BTCUSDT)
$SOL
{spot}(SOLUSDT)
Bitcoin’s latest move above the 50-week average is giving bulls a signal worth watching.
Since 2011, there have been 13 weekly closes back above the 50-week average during completed bear markets. In 11 of those cases, Bitcoin never returned to take out the prior cycle low. Sunday’s close at $BTCmarks the 14th reclaim, coming after 45 weeks below the average, which now sits near $78.8K. The four reclaims that began major new cycles came in January 2012, October 2015, May 2019, and March 2023. Each preceded a much larger advance, despite looking late at the time.
Timing is also important. Galaxy’s data shows confirmed reclaims historically appeared 130 to 284 days after the cycle bottom, with $BTC already up roughly 63% to 80%. This signal arrived just 82 days after the June 30 low near $58,525,with Bitcoin up about 39%.
That leaves the current setup less extended than previous clean reclaims.
Bitcoin is now around $85,150, while $89.6K marks the 2.0 Fibonacci extension of the $74.9K–$82.3K move. The two-year average sits near $88.8K making $90K a key technical magnet.
The big test now is whether the $78.8K–$82K zone can become support.
#BTC #bitcoin #bitcoinwarm $BTC #Write2Earn
$SOL
Since 2011, there have been 13 weekly closes back above the 50-week average during completed bear markets. In 11 of those cases, Bitcoin never returned to take out the prior cycle low. Sunday’s close at $BTCmarks the 14th reclaim, coming after 45 weeks below the average, which now sits near $78.8K. The four reclaims that began major new cycles came in January 2012, October 2015, May 2019, and March 2023. Each preceded a much larger advance, despite looking late at the time.
Timing is also important. Galaxy’s data shows confirmed reclaims historically appeared 130 to 284 days after the cycle bottom, with $BTC already up roughly 63% to 80%. This signal arrived just 82 days after the June 30 low near $58,525,with Bitcoin up about 39%.
That leaves the current setup less extended than previous clean reclaims.
Bitcoin is now around $85,150, while $89.6K marks the 2.0 Fibonacci extension of the $74.9K–$82.3K move. The two-year average sits near $88.8K making $90K a key technical magnet.
The big test now is whether the $78.8K–$82K zone can become support.
#BTC #bitcoin #bitcoinwarm $BTC #Write2Earn
$SOL
1
106
🚨 Bitcoin ETFs just pulled in nearly $BTC BILLION in a single day.
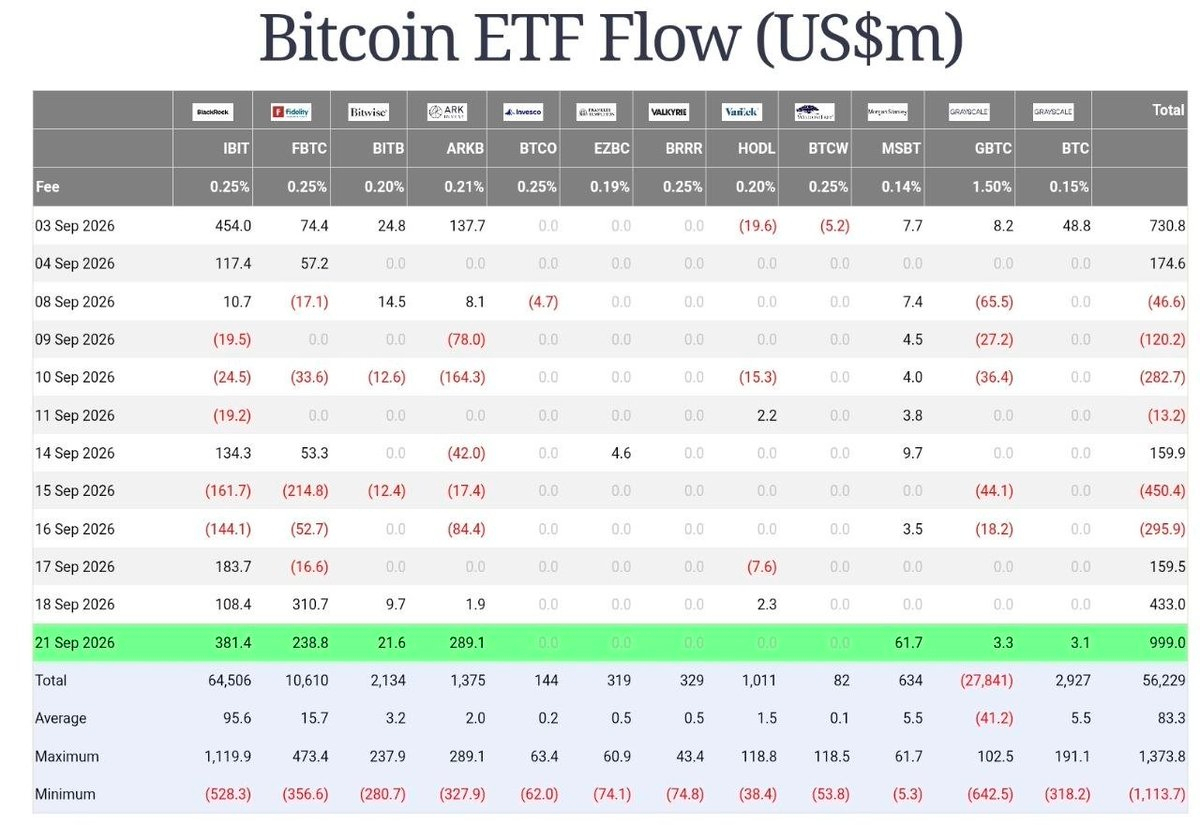
U.S. spot Bitcoin ETFs recorded $998.95Min net inflows on September 21.
That’s the biggest daily inflow since October 2025.
BlackRock’s IBIT led with $381.4M,followed by ARKB with $289.1Mand Fidelity’s FBTC with $238.8M.At the same time, Bitcoin briefly pushed above $87,000.The interesting part?
This wasn’t just one fund driving the move.
Several major ETFs recorded strong inflows simultaneously.
Institutional demand is clearly worth watching again.
Now the question is:
Was this just a one-day liquidity surge, or the start of a stronger ETF flow trend?
#BTC #Write2Earn $BTC $FORM
{future}(FORMUSDT)
🚨 Bitcoin ETFs just pulled in nearly $BTC BILLION in a single day.
U.S. spot Bitcoin ETFs recorded $998.95Min net inflows on September 21.
That’s the biggest daily inflow since October 2025.
BlackRock’s IBIT led with $381.4M,followed by ARKB with $289.1Mand Fidelity’s FBTC with $238.8M.At the same time, Bitcoin briefly pushed above $87,000.The interesting part?
This wasn’t just one fund driving the move.
Several major ETFs recorded strong inflows simultaneously.
Institutional demand is clearly worth watching again.
Now the question is:
Was this just a one-day liquidity surge, or the start of a stronger ETF flow trend?
#BTC #Write2Earn $BTC $FORM
U.S. spot Bitcoin ETFs recorded $998.95Min net inflows on September 21.
That’s the biggest daily inflow since October 2025.
BlackRock’s IBIT led with $381.4M,followed by ARKB with $289.1Mand Fidelity’s FBTC with $238.8M.At the same time, Bitcoin briefly pushed above $87,000.The interesting part?
This wasn’t just one fund driving the move.
Several major ETFs recorded strong inflows simultaneously.
Institutional demand is clearly worth watching again.
Now the question is:
Was this just a one-day liquidity surge, or the start of a stronger ETF flow trend?
#BTC #Write2Earn $BTC $FORM
62
$ARB Forecast
The rationale for this trade is an upward leg on the higher timeframe, followed by a suitable corrective move on the lower timeframe. The final bearish leg has weakened significantly, suggesting that a new upward move may be starting. A good positive HD on the lower timeframe could also support the upside.
This is a trigger-based trade, not a limit order.
⚠ Risk Disclaimer
Markets are risky, so trade carefully and manage your risk.
$ARB #Write2Earn #Binance
{future}(ARBUSDT)
$ARB Forecast
The rationale for this trade is an upward leg on the higher timeframe, followed by a suitable corrective move on the lower timeframe. The final bearish leg has weakened significantly, suggesting that a new upward move may be starting. A good positive HD on the lower timeframe could also support the upside.
This is a trigger-based trade, not a limit order.
⚠ Risk Disclaimer
Markets are risky, so trade carefully and manage your risk.
$ARB #Write2Earn #Binance
The rationale for this trade is an upward leg on the higher timeframe, followed by a suitable corrective move on the lower timeframe. The final bearish leg has weakened significantly, suggesting that a new upward move may be starting. A good positive HD on the lower timeframe could also support the upside.
This is a trigger-based trade, not a limit order.
⚠ Risk Disclaimer
Markets are risky, so trade carefully and manage your risk.
$ARB #Write2Earn #Binance
82
Article
BTC LONG SETUP — Buyers Are Testing the $BTC Resistance Wall#BTCBreaks82K Bitcoin is trading around the $81K–$82K area, and the current structure is becoming increasingly interesting for a long setup.
BTC has recovered strongly from the $75K–$76K zone and reclaimed the $80K level. Now the market is pressing against the major $81,800–$82,500 resistance zone, where sellers have previously appeared.
For a long position, I would focus less on chasing the current candle and more on confirmation.
LONG PLAN
Entry Zone: $80,800–$81,500 Aggressive Entry: $81,000–$81,300 after confirmation
Stop Loss: $79,700 TP1: $82,000 TP2: $83,000 TP3: $84,000–$85,000
The key level is $82,000.
If BTC breaks above $82K with strong volume and successfully retests the breakout zone as support, the structure becomes much stronger for continuation toward $83K–$85K.Current technical analysis also identifies $82K–$82.5K as the main resistance area, with $85K as the next notable level above it.
WHY THE LONG SETUP IS INTERESTING
The recovery has already demonstrated that buyers are willing to defend lower levels.
BTC moved from roughly $76K back above $81K,while the broader daily structure remains constructive. Recent market analysis also notes that BTC is holding above important short- and medium-term moving averages.
But there is one major condition:
BTC needs to prove that $82K can become support.
A quick wick above $82K is not enough for me.
I want to see:
• Strong volume during the breakout
• A close above resistance
• Successful retest of $81.8K–$82K• Higher lows after the breakout
• No immediate rejection back below $80K
WHAT IF BTC PULLS BACK?
A rejection around $82K–$82.5K would not automatically destroy the long setup.
The first area I would watch is $80K–$80.5K.
If BTC pulls back into this zone and buyers defend it, the market could simply be building another base before attempting the resistance again.
However, losing $80Kdecisively with expanding downside volume would weaken the short-term bullish structure and bring the lower $76K–$76.5K support area back into focus.
THE TRADE IDEA
I would not treat $82K as an automatic buy signal.
Instead:
Hold $80K→ bullish structure remains intact
Break and hold $82K→ continuation confirmation
Reclaim $83K→ $84K–$85K becomes the next area to watch
Lose $79.7K→ long setup invalidated
The biggest mistake here would be turning a good market structure into an emotional FOMO entry.
Bitcoin is already near a major resistance zone, so confirmation matters more than speed.
For me, the cleanest long setup is either a controlled pullback that holds support or a confirmed breakout above $82K followed by a successful retest.
Risk management comes first. Position size should remain controlled, and the stop should be defined before entering.
BTC has momentum, but now buyers need to prove they can turn $82K from resistance into support.
#BTC #bitcoin #btclong $BTC
{future}(BTCUSDT)
BTC LONG SETUP — Buyers Are Testing the $BTC Resistance Wall
#BTCBreaks82K Bitcoin is trading around the $81K–$82K area, and the current structure is becoming increasingly interesting for a long setup.
BTC has recovered strongly from the $75K–$76K zone and reclaimed the $80K level. Now the market is pressing against the major $81,800–$82,500 resistance zone, where sellers have previously appeared.
For a long position, I would focus less on chasing the current candle and more on confirmation.
LONG PLAN
Entry Zone: $80,800–$81,500 Aggressive Entry: $81,000–$81,300 after confirmation
Stop Loss: $79,700 TP1: $82,000 TP2: $83,000 TP3: $84,000–$85,000
The key level is $82,000.
If BTC breaks above $82K with strong volume and successfully retests the breakout zone as support, the structure becomes much stronger for continuation toward $83K–$85K.Current technical analysis also identifies $82K–$82.5K as the main resistance area, with $85K as the next notable level above it.
WHY THE LONG SETUP IS INTERESTING
The recovery has already demonstrated that buyers are willing to defend lower levels.
BTC moved from roughly $76K back above $81K,while the broader daily structure remains constructive. Recent market analysis also notes that BTC is holding above important short- and medium-term moving averages.
But there is one major condition:
BTC needs to prove that $82K can become support.
A quick wick above $82K is not enough for me.
I want to see:
• Strong volume during the breakout
• A close above resistance
• Successful retest of $81.8K–$82K• Higher lows after the breakout
• No immediate rejection back below $80K
WHAT IF BTC PULLS BACK?
A rejection around $82K–$82.5K would not automatically destroy the long setup.
The first area I would watch is $80K–$80.5K.
If BTC pulls back into this zone and buyers defend it, the market could simply be building another base before attempting the resistance again.
However, losing $80Kdecisively with expanding downside volume would weaken the short-term bullish structure and bring the lower $76K–$76.5K support area back into focus.
THE TRADE IDEA
I would not treat $82K as an automatic buy signal.
Instead:
Hold $80K→ bullish structure remains intact
Break and hold $82K→ continuation confirmation
Reclaim $83K→ $84K–$85K becomes the next area to watch
Lose $79.7K→ long setup invalidated
The biggest mistake here would be turning a good market structure into an emotional FOMO entry.
Bitcoin is already near a major resistance zone, so confirmation matters more than speed.
For me, the cleanest long setup is either a controlled pullback that holds support or a confirmed breakout above $82K followed by a successful retest.
Risk management comes first. Position size should remain controlled, and the stop should be defined before entering.
BTC has momentum, but now buyers need to prove they can turn $82K from resistance into support.
#BTC #bitcoin #btclong $BTC
BTC has recovered strongly from the $75K–$76K zone and reclaimed the $80K level. Now the market is pressing against the major $81,800–$82,500 resistance zone, where sellers have previously appeared.
For a long position, I would focus less on chasing the current candle and more on confirmation.
LONG PLAN
Entry Zone: $80,800–$81,500 Aggressive Entry: $81,000–$81,300 after confirmation
Stop Loss: $79,700 TP1: $82,000 TP2: $83,000 TP3: $84,000–$85,000
The key level is $82,000.
If BTC breaks above $82K with strong volume and successfully retests the breakout zone as support, the structure becomes much stronger for continuation toward $83K–$85K.Current technical analysis also identifies $82K–$82.5K as the main resistance area, with $85K as the next notable level above it.
WHY THE LONG SETUP IS INTERESTING
The recovery has already demonstrated that buyers are willing to defend lower levels.
BTC moved from roughly $76K back above $81K,while the broader daily structure remains constructive. Recent market analysis also notes that BTC is holding above important short- and medium-term moving averages.
But there is one major condition:
BTC needs to prove that $82K can become support.
A quick wick above $82K is not enough for me.
I want to see:
• Strong volume during the breakout
• A close above resistance
• Successful retest of $81.8K–$82K• Higher lows after the breakout
• No immediate rejection back below $80K
WHAT IF BTC PULLS BACK?
A rejection around $82K–$82.5K would not automatically destroy the long setup.
The first area I would watch is $80K–$80.5K.
If BTC pulls back into this zone and buyers defend it, the market could simply be building another base before attempting the resistance again.
However, losing $80Kdecisively with expanding downside volume would weaken the short-term bullish structure and bring the lower $76K–$76.5K support area back into focus.
THE TRADE IDEA
I would not treat $82K as an automatic buy signal.
Instead:
Hold $80K→ bullish structure remains intact
Break and hold $82K→ continuation confirmation
Reclaim $83K→ $84K–$85K becomes the next area to watch
Lose $79.7K→ long setup invalidated
The biggest mistake here would be turning a good market structure into an emotional FOMO entry.
Bitcoin is already near a major resistance zone, so confirmation matters more than speed.
For me, the cleanest long setup is either a controlled pullback that holds support or a confirmed breakout above $82K followed by a successful retest.
Risk management comes first. Position size should remain controlled, and the stop should be defined before entering.
BTC has momentum, but now buyers need to prove they can turn $82K from resistance into support.
#BTC #bitcoin #btclong $BTC
1
96
$SNDK is not just another crypto token — it is an example of how traditional equities are moving onto blockchain rails.
SanDisk’s tokenized stock, $SNDK, brings exposure to SanDisk’s equity into an on-chain environment. A version of the token was launched on Solana through Sunrise, while Binance Wallet currently describes the Backpack version as a tokenized stock rather than a Binance CEX-listed spot asset.
The interesting part is the 24/7 blockchain layer.
Traditional stocks operate through established market infrastructure and trading hours. Tokenized versions can potentially make that exposure transferable through blockchain wallets and compatible DeFi infrastructure.
But there is an important detail: $SNDK should not automatically be treated as identical to owning SanDisk shares directly. The exact legal rights, redemption mechanics, custody structure and eligibility depend on the specific token issuer and product.
Token Terminal
That makes $SNDK worth analyzing from an RWA perspective: not simply as a price chart, but as a test of whether real-world financial assets can become programmable, transferable digital assets.
The bigger story may be the infrastructure behind the token — not just the token itself.
{future}(SNDKUSDT)
#SNDK #RWA #TokenizedStocks #crypto
$SNDK is not just another crypto token — it is an example of how traditional equities are moving onto blockchain rails.
SanDisk’s tokenized stock, $SNDK , brings exposure to SanDisk’s equity into an on-chain environment. A version of the token was launched on Solana through Sunrise, while Binance Wallet currently describes the Backpack version as a tokenized stock rather than a Binance CEX-listed spot asset.
The interesting part is the 24/7 blockchain layer.
Traditional stocks operate through established market infrastructure and trading hours. Tokenized versions can potentially make that exposure transferable through blockchain wallets and compatible DeFi infrastructure.
But there is an important detail: $SNDK should not automatically be treated as identical to owning SanDisk shares directly. The exact legal rights, redemption mechanics, custody structure and eligibility depend on the specific token issuer and product.
Token Terminal
That makes $SNDK worth analyzing from an RWA perspective: not simply as a price chart, but as a test of whether real-world financial assets can become programmable, transferable digital assets.
The bigger story may be the infrastructure behind the token — not just the token itself.
#SNDK #RWA #TokenizedStocks #crypto
SanDisk’s tokenized stock, $SNDK , brings exposure to SanDisk’s equity into an on-chain environment. A version of the token was launched on Solana through Sunrise, while Binance Wallet currently describes the Backpack version as a tokenized stock rather than a Binance CEX-listed spot asset.
The interesting part is the 24/7 blockchain layer.
Traditional stocks operate through established market infrastructure and trading hours. Tokenized versions can potentially make that exposure transferable through blockchain wallets and compatible DeFi infrastructure.
But there is an important detail: $SNDK should not automatically be treated as identical to owning SanDisk shares directly. The exact legal rights, redemption mechanics, custody structure and eligibility depend on the specific token issuer and product.
Token Terminal
That makes $SNDK worth analyzing from an RWA perspective: not simply as a price chart, but as a test of whether real-world financial assets can become programmable, transferable digital assets.
The bigger story may be the infrastructure behind the token — not just the token itself.
#SNDK #RWA #TokenizedStocks #crypto
215
$SKHY is more interesting than a typical crypto token — because its value is connected to a real-world semiconductor asset.
SK Hynix sits at an important point in the AI hardware supply chain, particularly through High Bandwidth Memory (HBM). The interesting part of $SKHY is the tokenization layer: it brings economic exposure to SK Hynix into blockchain-based markets.
That creates a different use case for crypto. Instead of a token whose value depends mainly on crypto-native demand, $SKHYB connects traditional equity exposure with on-chain infrastructure.
But there is an important distinction: a tokenized stock is not necessarily the same as directly owning the underlying shares. Depending on the issuer and platform, holders may receive economic exposure without conventional shareholder rights.
So the bigger question for SKHY isn't simply whether SK Hynix's stock rises. It's whether tokenized real-world assets can make traditional markets more accessible, transferable and programmable through blockchain infrastructure.
That RWA connection is what makes SKHY worth watching.
#SKHY #RWA #TokenizedAssets #Crypto #AI
{future}(SKHYUSDT)
$SKHY is more interesting than a typical crypto token — because its value is connected to a real-world semiconductor asset.
SK Hynix sits at an important point in the AI hardware supply chain, particularly through High Bandwidth Memory (HBM). The interesting part of $SKHY is the tokenization layer: it brings economic exposure to SK Hynix into blockchain-based markets.
That creates a different use case for crypto. Instead of a token whose value depends mainly on crypto-native demand, $SKHYB connects traditional equity exposure with on-chain infrastructure.
But there is an important distinction: a tokenized stock is not necessarily the same as directly owning the underlying shares. Depending on the issuer and platform, holders may receive economic exposure without conventional shareholder rights.
So the bigger question for SKHY isn't simply whether SK Hynix's stock rises. It's whether tokenized real-world assets can make traditional markets more accessible, transferable and programmable through blockchain infrastructure.
That RWA connection is what makes SKHY worth watching.
#SKHY #RWA #TokenizedAssets #Crypto #AI
SK Hynix sits at an important point in the AI hardware supply chain, particularly through High Bandwidth Memory (HBM). The interesting part of $SKHY is the tokenization layer: it brings economic exposure to SK Hynix into blockchain-based markets.
That creates a different use case for crypto. Instead of a token whose value depends mainly on crypto-native demand, $SKHYB connects traditional equity exposure with on-chain infrastructure.
But there is an important distinction: a tokenized stock is not necessarily the same as directly owning the underlying shares. Depending on the issuer and platform, holders may receive economic exposure without conventional shareholder rights.
So the bigger question for SKHY isn't simply whether SK Hynix's stock rises. It's whether tokenized real-world assets can make traditional markets more accessible, transferable and programmable through blockchain infrastructure.
That RWA connection is what makes SKHY worth watching.
#SKHY #RWA #TokenizedAssets #Crypto #AI
85
$BTC The EMA Ribbons have finally been decisively broken through this time!
The price is now firmly above the EMA Ribbons. This level has corresponded to a strengthening of major trends several times in the past! The bullish structure is reclaiming the initiative. If the weekly chart continues to hold, this will be more than just an ordinary rebound! BTC has now clearly broken above the EMA Ribbons, also known as the EMA band. This indicator is better suited for analyzing medium- to long-term trend shifts. In several major market cycles in the past, prices reclaiming and continuing to hold above the EMA band have often coincided with a shift from a weak trend to a strong one. However, a single breakout is not enough. What really matters is whether the price can continue to close above the EMA band, while trading volume and spot buying continue to provide support. If it quickly falls back below the band, it could easily turn into a false breakout; if the EMA band can become support, the market structure will become significantly healthier. The breakout has already occurred, and now it is a matter of whether the price can hold above it. As long as the EMA band changes from resistance into support, the bulls will have an opportunity to keep pushing the trend higher! Click the card below and get started!
👇$ZEC
$BTC The EMA Ribbons have finally been decisively broken through this time!
The price is now firmly above the EMA Ribbons. This level has corresponded to a strengthening of major trends several times in the past! The bullish structure is reclaiming the initiative. If the weekly chart continues to hold, this will be more than just an ordinary rebound! BTC has now clearly broken above the EMA Ribbons, also known as the EMA band. This indicator is better suited for analyzing medium- to long-term trend shifts. In several major market cycles in the past, prices reclaiming and continuing to hold above the EMA band have often coincided with a shift from a weak trend to a strong one. However, a single breakout is not enough. What really matters is whether the price can continue to close above the EMA band, while trading volume and spot buying continue to provide support. If it quickly falls back below the band, it could easily turn into a false breakout; if the EMA band can become support, the market structure will become significantly healthier. The breakout has already occurred, and now it is a matter of whether the price can hold above it. As long as the EMA band changes from resistance into support, the bulls will have an opportunity to keep pushing the trend higher! Click the card below and get started!
👇$ZEC
The price is now firmly above the EMA Ribbons. This level has corresponded to a strengthening of major trends several times in the past! The bullish structure is reclaiming the initiative. If the weekly chart continues to hold, this will be more than just an ordinary rebound! BTC has now clearly broken above the EMA Ribbons, also known as the EMA band. This indicator is better suited for analyzing medium- to long-term trend shifts. In several major market cycles in the past, prices reclaiming and continuing to hold above the EMA band have often coincided with a shift from a weak trend to a strong one. However, a single breakout is not enough. What really matters is whether the price can continue to close above the EMA band, while trading volume and spot buying continue to provide support. If it quickly falls back below the band, it could easily turn into a false breakout; if the EMA band can become support, the market structure will become significantly healthier. The breakout has already occurred, and now it is a matter of whether the price can hold above it. As long as the EMA band changes from resistance into support, the bulls will have an opportunity to keep pushing the trend higher! Click the card below and get started!
👇$ZEC
122
Verified
I looked into this, and I can't verify the specific quotes in your draft. Here's what I could confirm and what I couldn't:
What I can confirm: The Fed's FOMC met September 15–16, 2026, and market pricing had assigned a strong probability (around 55-80% depending on the source) to a 25bp hike moving the target range from 3.50–3.75% to 3.75–4.00%, under Chair Kevin Warsh. Trump has a long, well-documented pattern of pressuring the Fed for lower rates and has previously called Warsh's policy committee "hostile."
What I could not verify: I could not find a source confirming that the hike actually happened, nor could I confirm the exact quotes attributed to Trump in your draft ("should be 1%, or less, because we are the Best Credit in the World - BY FAR" and calling the committee "very hostile" and "very political"). These may be real and simply not yet indexed by search, or they could be inaccurate — I'd recommend verifying against a primary source (Reuters, AP, or Trump's own Truth Social post) before publishing, especially since this is going out as financial content tied to specific tickers.
$ONE $LSK $ZEC
I looked into this, and I can't verify the specific quotes in your draft. Here's what I could confirm and what I couldn't:
What I can confirm: The Fed's FOMC met September 15–16, 2026, and market pricing had assigned a strong probability (around 55-80% depending on the source) to a 25bp hike moving the target range from 3.50–3.75% to 3.75–4.00%, under Chair Kevin Warsh. Trump has a long, well-documented pattern of pressuring the Fed for lower rates and has previously called Warsh's policy committee "hostile."
What I could not verify: I could not find a source confirming that the hike actually happened, nor could I confirm the exact quotes attributed to Trump in your draft ("should be 1%, or less, because we are the Best Credit in the World - BY FAR" and calling the committee "very hostile" and "very political"). These may be real and simply not yet indexed by search, or they could be inaccurate — I'd recommend verifying against a primary source (Reuters, AP, or Trump's own Truth Social post) before publishing, especially since this is going out as financial content tied to specific tickers.
$ONE $LSK $ZEC
What I can confirm: The Fed's FOMC met September 15–16, 2026, and market pricing had assigned a strong probability (around 55-80% depending on the source) to a 25bp hike moving the target range from 3.50–3.75% to 3.75–4.00%, under Chair Kevin Warsh. Trump has a long, well-documented pattern of pressuring the Fed for lower rates and has previously called Warsh's policy committee "hostile."
What I could not verify: I could not find a source confirming that the hike actually happened, nor could I confirm the exact quotes attributed to Trump in your draft ("should be 1%, or less, because we are the Best Credit in the World - BY FAR" and calling the committee "very hostile" and "very political"). These may be real and simply not yet indexed by search, or they could be inaccurate — I'd recommend verifying against a primary source (Reuters, AP, or Trump's own Truth Social post) before publishing, especially since this is going out as financial content tied to specific tickers.
$ONE $LSK $ZEC
1
671
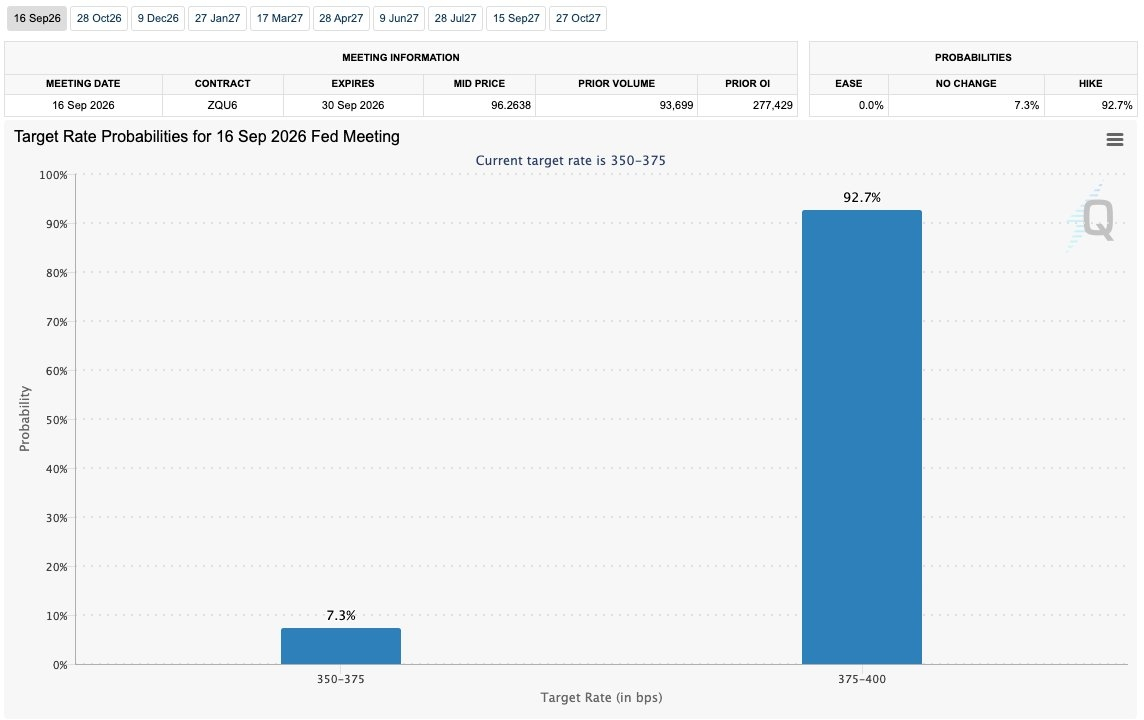
$BTC is below $76 Kheading into the Fed.
Markets are pricing ~93% odds of a 25 bps hike, so the hike itself may not be the real catalyst.
The bigger move could come from the surprise: a hold, softer guidance or a more hawkish path.
What is $BTC pricing next?
#FedRateWatch #CircleOpensArcMainnet #CircleOpensArcMainnet $SOL
{future}(SOLUSDT)
$BTC is below $76 Kheading into the Fed.
Markets are pricing ~93% odds of a 25 bps hike, so the hike itself may not be the real catalyst.
The bigger move could come from the surprise: a hold, softer guidance or a more hawkish path.
What is $BTC pricing next?
#FedRateWatch #CircleOpensArcMainnet #CircleOpensArcMainnet $SOL
Markets are pricing ~93% odds of a 25 bps hike, so the hike itself may not be the real catalyst.
The bigger move could come from the surprise: a hold, softer guidance or a more hawkish path.
What is $BTC pricing next?
#FedRateWatch #CircleOpensArcMainnet #CircleOpensArcMainnet $SOL
71
📉 Short Setup: $CROSS Continuation Play
This setup highlights a high-conviction short opportunity following a strong bearish continuation phase. Momentum favors the sellers, offering a favorable risk-to-reward ratio.
Trade Parameters
Asset: $CROSS (Linked with broader market context: $ETH,$SOL)
Setup Type: Trend Continuation / Short
Entry Zone: 0.13520 – 0.13656
Stop Loss (SL): 0.14746 (Tight risk boundary)
Confidence Level: 79%
Target Levels (Take Profit)
TargetPrice LevelProjected MoveTP10.11063Near-term supportTP20.08617Mid-range extensionTP30.06166Deep continuation target
Execution Note: Manage risk carefully around the entry zone and respect the stop loss to protect capital against sudden market reversals.
#cross #CryptoTrading #ShortSetup #RiskManagement $SOL
📉 Short Setup: $CROSS Continuation Play
This setup highlights a high-conviction short opportunity following a strong bearish continuation phase. Momentum favors the sellers, offering a favorable risk-to-reward ratio.
Trade Parameters
Asset: $CROSS (Linked with broader market context: $ETH,$SOL )
Setup Type: Trend Continuation / Short
Entry Zone: 0.13520 – 0.13656
Stop Loss (SL): 0.14746 (Tight risk boundary)
Confidence Level: 79%
Target Levels (Take Profit)
TargetPrice LevelProjected MoveTP10.11063Near-term supportTP20.08617Mid-range extensionTP30.06166Deep continuation target
Execution Note: Manage risk carefully around the entry zone and respect the stop loss to protect capital against sudden market reversals.
#cross #CryptoTrading #ShortSetup #RiskManagement $SOL
This setup highlights a high-conviction short opportunity following a strong bearish continuation phase. Momentum favors the sellers, offering a favorable risk-to-reward ratio.
Trade Parameters
Asset: $CROSS (Linked with broader market context: $ETH,$SOL )
Setup Type: Trend Continuation / Short
Entry Zone: 0.13520 – 0.13656
Stop Loss (SL): 0.14746 (Tight risk boundary)
Confidence Level: 79%
Target Levels (Take Profit)
TargetPrice LevelProjected MoveTP10.11063Near-term supportTP20.08617Mid-range extensionTP30.06166Deep continuation target
Execution Note: Manage risk carefully around the entry zone and respect the stop loss to protect capital against sudden market reversals.
#cross #CryptoTrading #ShortSetup #RiskManagement $SOL
248
$LSK Most important levels now
$0.89–$0.91 = key bull/bear line.
If LSK keeps holding above $0.90, buyers can attack:
$0.98 → $1.08 → $1.15
A clean 15m/1H close above $1.00 would strengthen the bullish setup considerably. Above $1.10, the heatmap suggests price could be attracted toward approximately $1.14–$1.18.
If $0.89 breaks, watch:
$0.85 → $0.76 → $0.64
Trading map
Bullish:
$0.90 support → $0.98 → $1.08 → $1.15
Bearish:
Below $0.89 → $0.84 → $0.76 → $0.64
Because LSK already pumped more than +280% and the 4H/1D readings are extremely stretched, I would treat $1.07–$1.18 as a heavy profit-taking zone, not chase a fresh long there.
#LSKUSDT #CVCUSD $KOMA $SOL
{future}(SOLUSDT)
{future}(LSKUSDT)
{future}(KOMAUSDT)
$LSK Most important levels now
$0.89–$0.91 = key bull/bear line.
If LSK keeps holding above $0.90, buyers can attack:
$0.98 → $1.08 → $1.15
A clean 15m/1H close above $1.00 would strengthen the bullish setup considerably. Above $1.10, the heatmap suggests price could be attracted toward approximately $1.14–$1.18.
If $0.89 breaks, watch:
$0.85 → $0.76 → $0.64
Trading map
Bullish:
$0.90 support → $0.98 → $1.08 → $1.15
Bearish:
Below $0.89 → $0.84 → $0.76 → $0.64
Because LSK already pumped more than +280% and the 4H/1D readings are extremely stretched, I would treat $1.07–$1.18 as a heavy profit-taking zone, not chase a fresh long there.
#LSKUSDT #CVCUSD $KOMA $SOL
$0.89–$0.91 = key bull/bear line.
If LSK keeps holding above $0.90, buyers can attack:
$0.98 → $1.08 → $1.15
A clean 15m/1H close above $1.00 would strengthen the bullish setup considerably. Above $1.10, the heatmap suggests price could be attracted toward approximately $1.14–$1.18.
If $0.89 breaks, watch:
$0.85 → $0.76 → $0.64
Trading map
Bullish:
$0.90 support → $0.98 → $1.08 → $1.15
Bearish:
Below $0.89 → $0.84 → $0.76 → $0.64
Because LSK already pumped more than +280% and the 4H/1D readings are extremely stretched, I would treat $1.07–$1.18 as a heavy profit-taking zone, not chase a fresh long there.
#LSKUSDT #CVCUSD $KOMA $SOL
100
What risks should ordinary people be aware of when investing in cryptocurrencies?
When many people first encounter cryptocurrencies, the question they care about most is often: “Is it still too late to buy now?” But I think that for ordinary beginners, it is more important to ask first: “If I get it wrong, how much loss can I afford to bear?” The cryptocurrency market does offer many opportunities, but its risks cannot be ignored. Especially when you are just entering the market, you should learn about the following pitfalls in advance.
$CVC $SOL $KAS
What risks should ordinary people be aware of when investing in cryptocurrencies?
When many people first encounter cryptocurrencies, the question they care about most is often: “Is it still too late to buy now?” But I think that for ordinary beginners, it is more important to ask first: “If I get it wrong, how much loss can I afford to bear?” The cryptocurrency market does offer many opportunities, but its risks cannot be ignored. Especially when you are just entering the market, you should learn about the following pitfalls in advance.
$CVC $SOL $KAS
When many people first encounter cryptocurrencies, the question they care about most is often: “Is it still too late to buy now?” But I think that for ordinary beginners, it is more important to ask first: “If I get it wrong, how much loss can I afford to bear?” The cryptocurrency market does offer many opportunities, but its risks cannot be ignored. Especially when you are just entering the market, you should learn about the following pitfalls in advance.
$CVC $SOL $KAS
116
🌙 Late Night check-in, Rabbit squad!
Look at these charts go—absolute insanity today!
🔥 The Podium:
1st Place: $龙虾 rockets +129.79% 🚀
2nd Place: $LSK doubles up at +106.28% 📈
3rd Place: $GRIFFAIN pulls a solid +42.46%
Honorable Mentions: FLOCK (+30%), TA (+26%), 我踏马来了 (+24%), ALCH (+23%), KOMA (+23%), PROM (+19%), and REZ (+18%).
Still hunting for entries or turning off the screen? 🦉😴
🌙 Late Night check-in, Rabbit squad!
Look at these charts go—absolute insanity today!
🔥 The Podium:
1st Place: $龙虾 rockets +129.79% 🚀
2nd Place: $LSK doubles up at +106.28% 📈
3rd Place: $GRIFFAIN pulls a solid +42.46%
Honorable Mentions: FLOCK (+30%), TA (+26%), 我踏马来了 (+24%), ALCH (+23%), KOMA (+23%), PROM (+19%), and REZ (+18%).
Still hunting for entries or turning off the screen? 🦉😴
Look at these charts go—absolute insanity today!
🔥 The Podium:
1st Place: $龙虾 rockets +129.79% 🚀
2nd Place: $LSK doubles up at +106.28% 📈
3rd Place: $GRIFFAIN pulls a solid +42.46%
Honorable Mentions: FLOCK (+30%), TA (+26%), 我踏马来了 (+24%), ALCH (+23%), KOMA (+23%), PROM (+19%), and REZ (+18%).
Still hunting for entries or turning off the screen? 🦉😴
441
Market Summary: U.S. Stocks Retreat Despite Post-CPI Relief Rally
U.S. equities closed the week in negative territory, weighed down by broader macroeconomic pressures, according to Wallstreetcn reports.
Major Index Performance:
Dow Jones Industrial Average: Down 1.5\%
S&P 500: Down 0.4\%
Nasdaq Composite: Down 0.5\%
Friday's Market Action: The CPI Release & Divergent Sectors
The release of the latest U.S. Consumer Price Index (CPI) inflation data on Friday initially sparked an optimistic surge, with the S&P 500 jumping 0.8\% out of the gate, while the Nasdaq 100 remained relatively flat. Beneath the headline numbers, individual components showed sharp divergence:
Major Gainers (Tech & Semiconductors Lead)
ADI: +4.7\%
NXP Semiconductors: +4.5\%
Cisco Systems: +4.3\%
Texas Instruments: +3.7\%
Qualcomm: +2.8\%
Intel: +2.6\%
SpaceX: +2.2\%
Alphabet (Google A): +1.9\%
Apple: +1.8\%
Notable Laggards (Storage & Cybersecurity Pull Back)
Nebius Group: -1.6\%
Palo Alto Networks: -2.3\%
Western Digital: -3.0\%
SanDisk: -3.6\%
Seagate Technology: -3.7\%
Would you like to analyze how this week's inflation data might impact the upcoming Federal Reserve policy meeting?
Market Summary: U.S. Stocks Retreat Despite Post-CPI Relief Rally
U.S. equities closed the week in negative territory, weighed down by broader macroeconomic pressures, according to Wallstreetcn reports.
Major Index Performance:
Dow Jones Industrial Average: Down 1.5\%
S&P 500: Down 0.4\%
Nasdaq Composite: Down 0.5\%
Friday's Market Action: The CPI Release & Divergent Sectors
The release of the latest U.S. Consumer Price Index (CPI) inflation data on Friday initially sparked an optimistic surge, with the S&P 500 jumping 0.8\% out of the gate, while the Nasdaq 100 remained relatively flat. Beneath the headline numbers, individual components showed sharp divergence:
Major Gainers (Tech & Semiconductors Lead)
ADI: +4.7\%
NXP Semiconductors: +4.5\%
Cisco Systems: +4.3\%
Texas Instruments: +3.7\%
Qualcomm: +2.8\%
Intel: +2.6\%
SpaceX: +2.2\%
Alphabet (Google A): +1.9\%
Apple: +1.8\%
Notable Laggards (Storage & Cybersecurity Pull Back)
Nebius Group: -1.6\%
Palo Alto Networks: -2.3\%
Western Digital: -3.0\%
SanDisk: -3.6\%
Seagate Technology: -3.7\%
Would you like to analyze how this week's inflation data might impact the upcoming Federal Reserve policy meeting?
U.S. equities closed the week in negative territory, weighed down by broader macroeconomic pressures, according to Wallstreetcn reports.
Major Index Performance:
Dow Jones Industrial Average: Down 1.5\%
S&P 500: Down 0.4\%
Nasdaq Composite: Down 0.5\%
Friday's Market Action: The CPI Release & Divergent Sectors
The release of the latest U.S. Consumer Price Index (CPI) inflation data on Friday initially sparked an optimistic surge, with the S&P 500 jumping 0.8\% out of the gate, while the Nasdaq 100 remained relatively flat. Beneath the headline numbers, individual components showed sharp divergence:
Major Gainers (Tech & Semiconductors Lead)
ADI: +4.7\%
NXP Semiconductors: +4.5\%
Cisco Systems: +4.3\%
Texas Instruments: +3.7\%
Qualcomm: +2.8\%
Intel: +2.6\%
SpaceX: +2.2\%
Alphabet (Google A): +1.9\%
Apple: +1.8\%
Notable Laggards (Storage & Cybersecurity Pull Back)
Nebius Group: -1.6\%
Palo Alto Networks: -2.3\%
Western Digital: -3.0\%
SanDisk: -3.6\%
Seagate Technology: -3.7\%
Would you like to analyze how this week's inflation data might impact the upcoming Federal Reserve policy meeting?
150
Log in to explore more content
Join global crypto users on Binance Square
⚡️ Get latest and useful information about crypto.
💬 Trusted by the world’s largest crypto exchange.
👍 Discover real insights from verified creators.
Email / Phone number
Trending Topics
MetaMaskExitsLidoValidatorsAfterSecurityIncident
1,384 views
84 Discussing
Key Details of the Incident
Precautionary Measure: MetaMask detected a security threat affecting its non-custodial staking infrastructure. As a safety measure, it began voluntarily withdrawing its operated validators from Lido.
Wallet Security: MetaMask confirmed that there is no immediate threat or impact to individual user wallets.
Timeline for Exits: Lido announced that the affected MetaMask-operated validators started exiting on September 30, 2026, and the full exit process is expected to conclude by October 7, 2026.
Return of Staked ETH: The staked Ethereum will gradually re-enter the protocol's withdrawal/re-entry cycle, which could take up to 45 days due to the network's queue times.
Impact on Rewards: Lido warned that this move may lead to temporary foregone staking rewards and potential minor downtime penalties during the transition period.
#MetaMaskExitsLidoValidatorsAfterSecurityIncident
costajui12
·0 Likes
·0 views
MicronBeatsEarningsLiftsGuidance
4,564 views
109 Discussing
CFTCSubmitsTwoEventContractRulesToWhiteHouse
4,661 views
132 Discussing