

AnFX Crypto
852 Posts

AnFX Crypto
Report
Block User
Teknikal Analisis Price Action | Twitter@anFx Crypto
Open Trade
Frequent Trader
2.2 Years
341 Following
124 Followers
239 Liked
Posts
Portfolio
All
Quotes
PINNED
·
--
Hamster Kombat, the popular Telegram-based clicker game, has just released an ambitious roadmap for the end of 2024 and throughout 2025. The development team announced their plans that include NFT integration, development of a Web3 gaming platform, and a token buyback strategy to maintain price stability and reward distribution to players.$HMSTR
#hamsterkombat
{future}(HMSTRUSDT)
Hamster Kombat, the popular Telegram-based clicker game, has just released an ambitious roadmap for the end of 2024 and throughout 2025. The development team announced their plans that include NFT integration, development of a Web3 gaming platform, and a token buyback strategy to maintain price stability and reward distribution to players.$HMSTR
#hamsterkombat
#hamsterkombat

6
23
14.5k
·
--
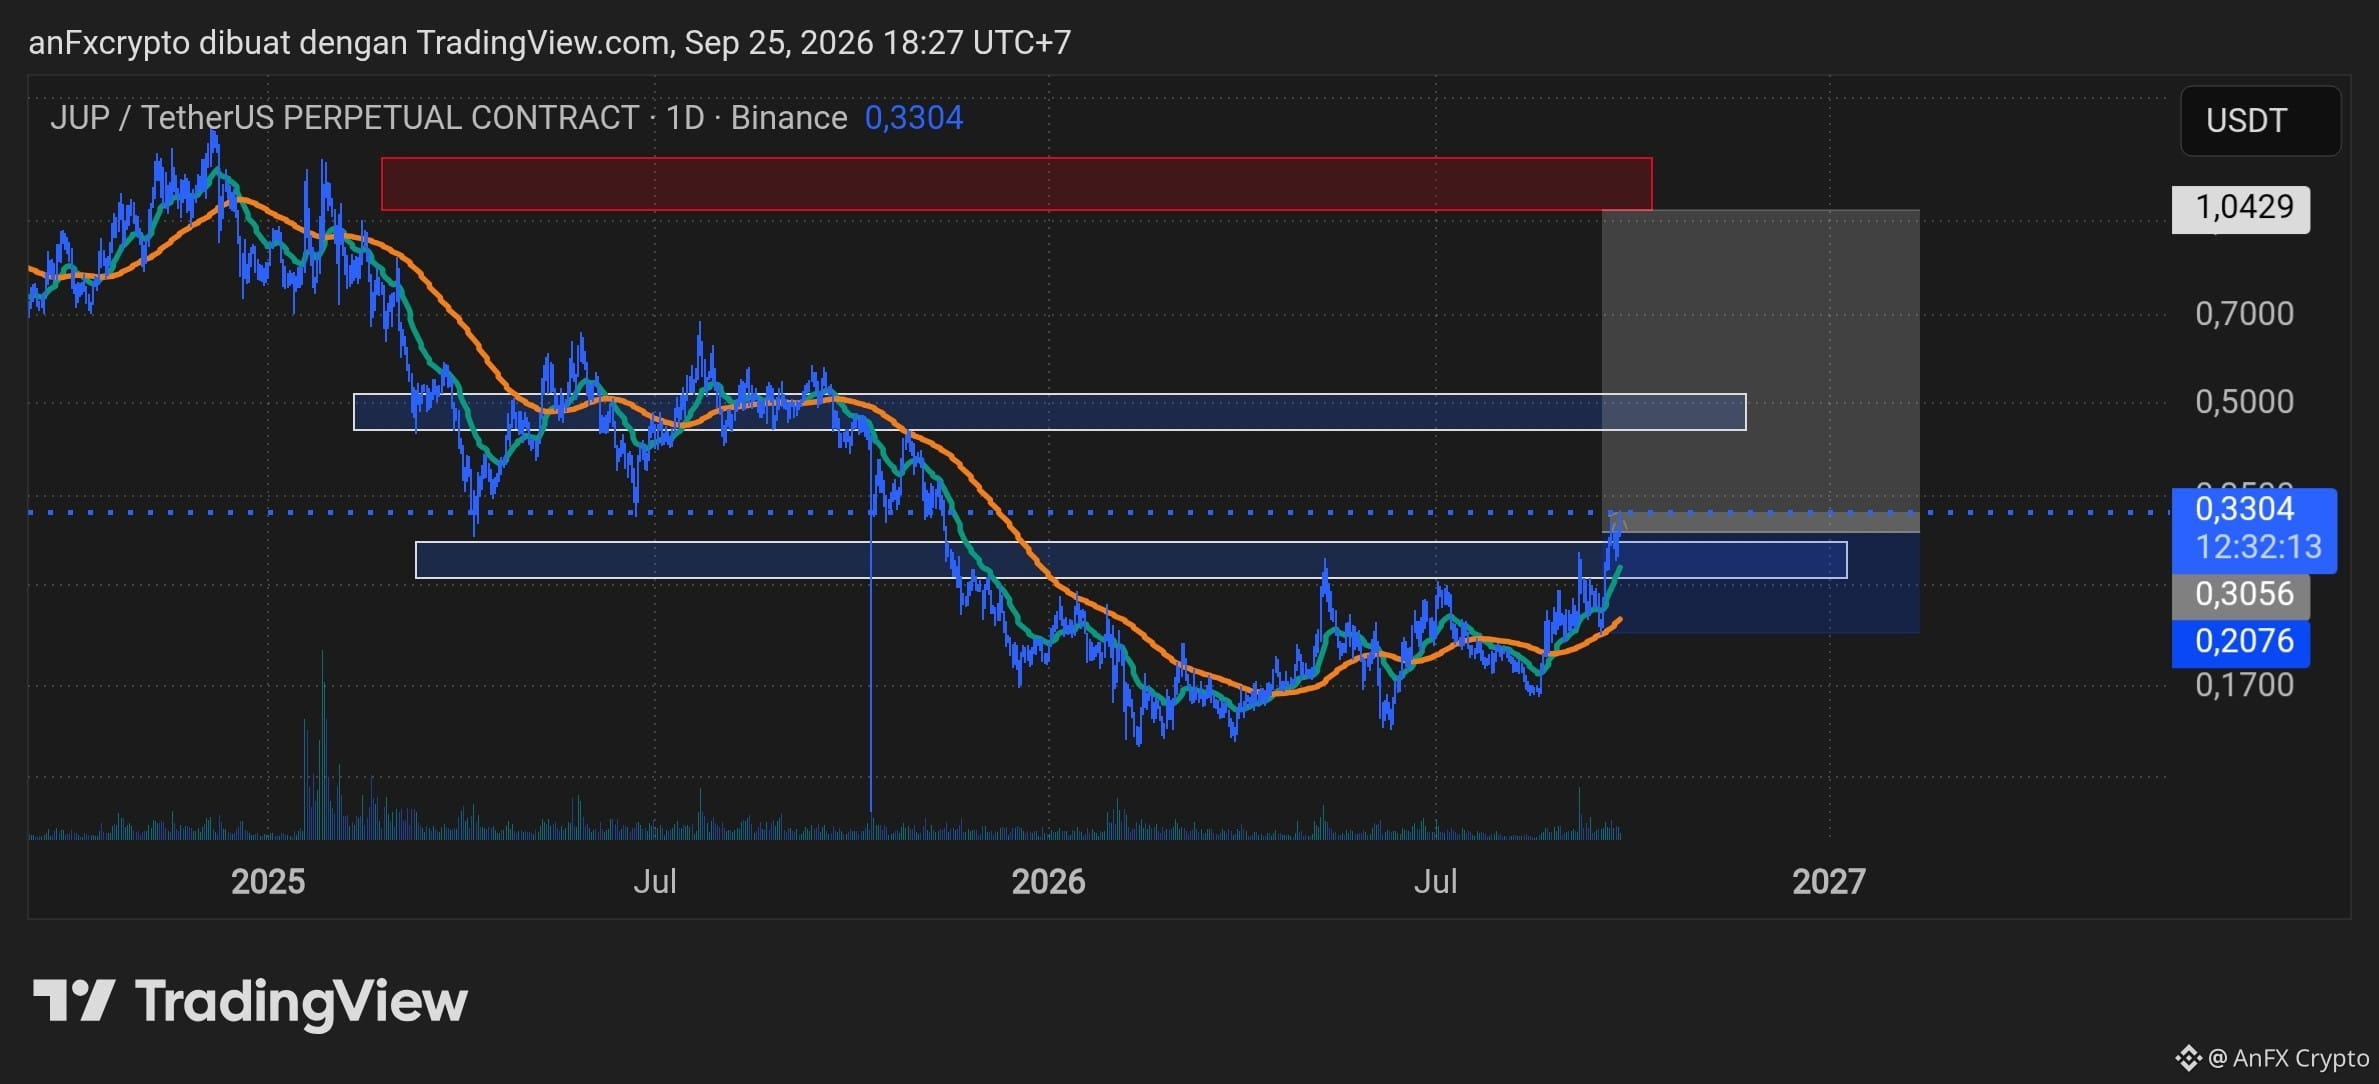
Based on the $JUP /USDT Perpetual chart (Daily Timeframe / 1D), here is an in-depth technical analysis along with a trading plan (setup) based on chart projections.
1. Market Structure & Trend Analysis
Macro Trend: The chart shows a long downtrend phase from the peak area of $1.00+ to the formation of a bottom (accumulation area) in the 0.1700 – 0.2076 USDT zone.
Reversal Momentum: Price managed to bounce from the lower demand zone and break out above the Moving Average (green MA/EMA line & orange).
Current Condition: Price is around 0.3304 USDT, breaking through a local resistance (minor resistance) in the 0.3056 – 0.3300 area. If the daily candle closes strongly above this level, confirmation for the continuation of the uptrend (bullish continuation) becomes increasingly solid.
2. Key Levels
Major Support / Base Zone: 0.1700 – 0.2076 USDT (Bottom accumulation area).
Immediate Support / Retest Zone: 0.2800 – 0.3056 USDT (The breakout area that is now acting as new support).
Intermediate Resistance (TP1 Zone): 0.4800 – 0.5000 USDT (Middle blue box / mid-level supply area).
Major Supply Zone (TP2 Zone): 0.9000 – 1.0429 USDT (Upper red box / major resistance).
3. Trading Signals & Plan (Long Position / Swing Trade)
Trading Parameter | Entry Price | Direction | Position | BUY / LONG
Buy Zone (Entry): 0.3100 – 0.3300 USDT (aggressive entry at current price) or wait for a pullback to 0.2800 – 0.3056 USDT
Stop Loss (SL): 0.2076 USDT (placed below the swing low / lower boundary of the support zone)
Take Profit 1 (TP1): 0.5000 USDT (mid consolidation area)
Take Profit 2 (TP2): 1.0429 USDT (main target in the red supply zone)
Risk-to-Reward Ratio: ~1 : 5.8 (Very ideal for swing trading)
{future}(JUPUSDT)
Based on the $JUP /USDT Perpetual chart (Daily Timeframe / 1D), here is an in-depth technical analysis along with a trading plan (setup) based on chart projections.
1. Market Structure & Trend Analysis
Macro Trend: The chart shows a long downtrend phase from the peak area of $1.00+ to the formation of a bottom (accumulation area) in the 0.1700 – 0.2076 USDT zone.
Reversal Momentum: Price managed to bounce from the lower demand zone and break out above the Moving Average (green MA/EMA line & orange).
Current Condition: Price is around 0.3304 USDT, breaking through a local resistance (minor resistance) in the 0.3056 – 0.3300 area. If the daily candle closes strongly above this level, confirmation for the continuation of the uptrend (bullish continuation) becomes increasingly solid.
2. Key Levels
Major Support / Base Zone: 0.1700 – 0.2076 USDT (Bottom accumulation area).
Immediate Support / Retest Zone: 0.2800 – 0.3056 USDT (The breakout area that is now acting as new support).
Intermediate Resistance (TP1 Zone): 0.4800 – 0.5000 USDT (Middle blue box / mid-level supply area).
Major Supply Zone (TP2 Zone): 0.9000 – 1.0429 USDT (Upper red box / major resistance).
3. Trading Signals & Plan (Long Position / Swing Trade)
Trading Parameter | Entry Price | Direction | Position | BUY / LONG
Buy Zone (Entry): 0.3100 – 0.3300 USDT (aggressive entry at current price) or wait for a pullback to 0.2800 – 0.3056 USDT
Stop Loss (SL): 0.2076 USDT (placed below the swing low / lower boundary of the support zone)
Take Profit 1 (TP1): 0.5000 USDT (mid consolidation area)
Take Profit 2 (TP2): 1.0429 USDT (main target in the red supply zone)
Risk-to-Reward Ratio: ~1 : 5.8 (Very ideal for swing trading)
1. Market Structure & Trend Analysis
Macro Trend: The chart shows a long downtrend phase from the peak area of $1.00+ to the formation of a bottom (accumulation area) in the 0.1700 – 0.2076 USDT zone.
Reversal Momentum: Price managed to bounce from the lower demand zone and break out above the Moving Average (green MA/EMA line & orange).
Current Condition: Price is around 0.3304 USDT, breaking through a local resistance (minor resistance) in the 0.3056 – 0.3300 area. If the daily candle closes strongly above this level, confirmation for the continuation of the uptrend (bullish continuation) becomes increasingly solid.
2. Key Levels
Major Support / Base Zone: 0.1700 – 0.2076 USDT (Bottom accumulation area).
Immediate Support / Retest Zone: 0.2800 – 0.3056 USDT (The breakout area that is now acting as new support).
Intermediate Resistance (TP1 Zone): 0.4800 – 0.5000 USDT (Middle blue box / mid-level supply area).
Major Supply Zone (TP2 Zone): 0.9000 – 1.0429 USDT (Upper red box / major resistance).
3. Trading Signals & Plan (Long Position / Swing Trade)
Trading Parameter | Entry Price | Direction | Position | BUY / LONG
Buy Zone (Entry): 0.3100 – 0.3300 USDT (aggressive entry at current price) or wait for a pullback to 0.2800 – 0.3056 USDT
Stop Loss (SL): 0.2076 USDT (placed below the swing low / lower boundary of the support zone)
Take Profit 1 (TP1): 0.5000 USDT (mid consolidation area)
Take Profit 2 (TP2): 1.0429 USDT (main target in the red supply zone)
Risk-to-Reward Ratio: ~1 : 5.8 (Very ideal for swing trading)
33
·
--
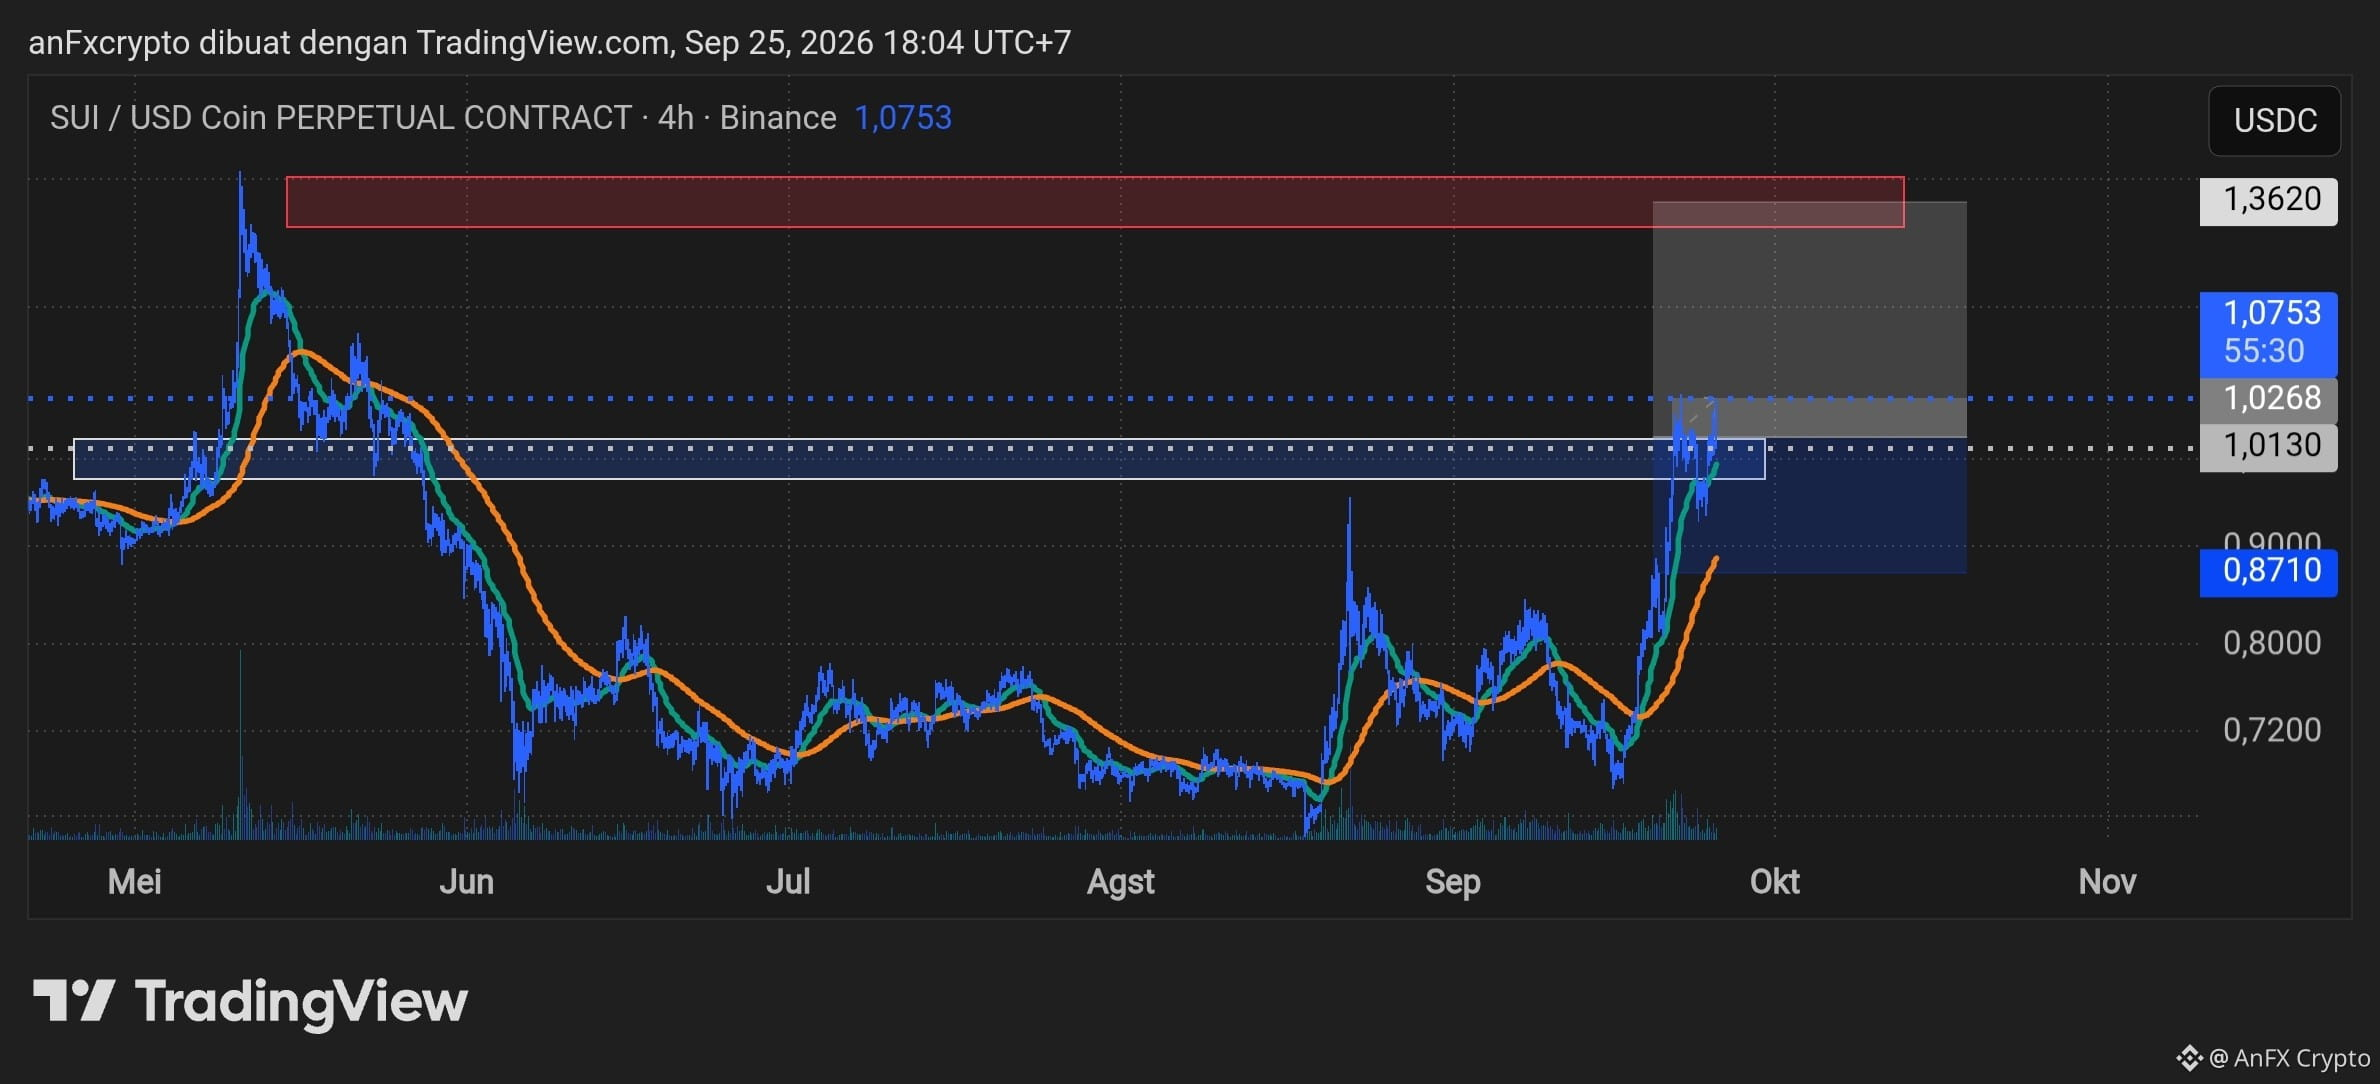
Here is a professional technical analysis and trading signals based on the chart $SUI /USDT (Perpetual Contract - 4H Timeframe).
Market Structure & Trend Analysis
Trend Structure:
There has been a market structure shift (Market Structure Shift) from a consolidation/accumulation phase in the 0.7200 – 0.8000 range into a bullish structure (Higher Highs & Higher Lows).
Price has just broken out above the crucial resistance area at 1.0130 – 1.0268 with an impulsive candlestick.
Moving Average (MA) Indicator:
The short MA line (green) has formed a Golden Cross above the long MA (orange), and both are curving upward, confirming buyer-dominant momentum on the H4 timeframe.
Area of Attention (Key Levels):
Demand / Support Swap Zone: $1.0130 – $1.0268 (former resistance that now acts as a support/retest area).
Invalidation / Stop Level: $0.8710 (below the local swing low and the MA trajectory).
Major Resistance Target: $1.3620 (red supply zone at the peak).
Trading Signal: SUI/USDC (Long / Buy Plan)
ComponentLevelPriceDirectionPositionBUY / LONGFollow the uptrend (Trend Following / Breakout Retest)Entry Area (Ideal)$1.0130 – $1.0268Wait for a pullback/retest to the new support areaAggressive Entry$1.0500 – $1.0750Staged buy option (DCA) with small portionsStop Loss (SL)$0.8710Risk tolerance limit (below the support structure)Take Profit 1 (TP1)$1.2000Interim target / secure part of the profitTake Profit 2 (TP2)$1.3620Main target (Red Resistance Zone)
Risk & Reward Ratio (Risk-to-Reward Ratio)
Estimated Average Entry: $1.0200
Risk (SL): ~ $0.1490 per coin (~14.6%)
Potential Profit (TP2): ~ $0.3420 per coin (~33.5%)
Risk-to-Reward Ratio (RRR): ~ 1 : 2.3 (Well-measured and healthy for swing trading strategy).
{future}(SUIUSDT)
Here is a professional technical analysis and trading signals based on the chart $SUI /USDT (Perpetual Contract - 4H Timeframe).
Market Structure & Trend Analysis
Trend Structure:
There has been a market structure shift (Market Structure Shift) from a consolidation/accumulation phase in the 0.7200 – 0.8000 range into a bullish structure (Higher Highs & Higher Lows).
Price has just broken out above the crucial resistance area at 1.0130 – 1.0268 with an impulsive candlestick.
Moving Average (MA) Indicator:
The short MA line (green) has formed a Golden Cross above the long MA (orange), and both are curving upward, confirming buyer-dominant momentum on the H4 timeframe.
Area of Attention (Key Levels):
Demand / Support Swap Zone: $1.0130 – $1.0268 (former resistance that now acts as a support/retest area).
Invalidation / Stop Level: $0.8710 (below the local swing low and the MA trajectory).
Major Resistance Target: $1.3620 (red supply zone at the peak).
Trading Signal: SUI/USDC (Long / Buy Plan)
ComponentLevelPriceDirectionPositionBUY / LONGFollow the uptrend (Trend Following / Breakout Retest)Entry Area (Ideal)$1.0130 – $1.0268Wait for a pullback/retest to the new support areaAggressive Entry$1.0500 – $1.0750Staged buy option (DCA) with small portionsStop Loss (SL)$0.8710Risk tolerance limit (below the support structure)Take Profit 1 (TP1)$1.2000Interim target / secure part of the profitTake Profit 2 (TP2)$1.3620Main target (Red Resistance Zone)
Risk & Reward Ratio (Risk-to-Reward Ratio)
Estimated Average Entry: $1.0200
Risk (SL): ~ $0.1490 per coin (~14.6%)
Potential Profit (TP2): ~ $0.3420 per coin (~33.5%)
Risk-to-Reward Ratio (RRR): ~ 1 : 2.3 (Well-measured and healthy for swing trading strategy).
Market Structure & Trend Analysis
Trend Structure:
There has been a market structure shift (Market Structure Shift) from a consolidation/accumulation phase in the 0.7200 – 0.8000 range into a bullish structure (Higher Highs & Higher Lows).
Price has just broken out above the crucial resistance area at 1.0130 – 1.0268 with an impulsive candlestick.
Moving Average (MA) Indicator:
The short MA line (green) has formed a Golden Cross above the long MA (orange), and both are curving upward, confirming buyer-dominant momentum on the H4 timeframe.
Area of Attention (Key Levels):
Demand / Support Swap Zone: $1.0130 – $1.0268 (former resistance that now acts as a support/retest area).
Invalidation / Stop Level: $0.8710 (below the local swing low and the MA trajectory).
Major Resistance Target: $1.3620 (red supply zone at the peak).
Trading Signal: SUI/USDC (Long / Buy Plan)
ComponentLevelPriceDirectionPositionBUY / LONGFollow the uptrend (Trend Following / Breakout Retest)Entry Area (Ideal)$1.0130 – $1.0268Wait for a pullback/retest to the new support areaAggressive Entry$1.0500 – $1.0750Staged buy option (DCA) with small portionsStop Loss (SL)$0.8710Risk tolerance limit (below the support structure)Take Profit 1 (TP1)$1.2000Interim target / secure part of the profitTake Profit 2 (TP2)$1.3620Main target (Red Resistance Zone)
Risk & Reward Ratio (Risk-to-Reward Ratio)
Estimated Average Entry: $1.0200
Risk (SL): ~ $0.1490 per coin (~14.6%)
Potential Profit (TP2): ~ $0.3420 per coin (~33.5%)
Risk-to-Reward Ratio (RRR): ~ 1 : 2.3 (Well-measured and healthy for swing trading strategy).
46
·
--
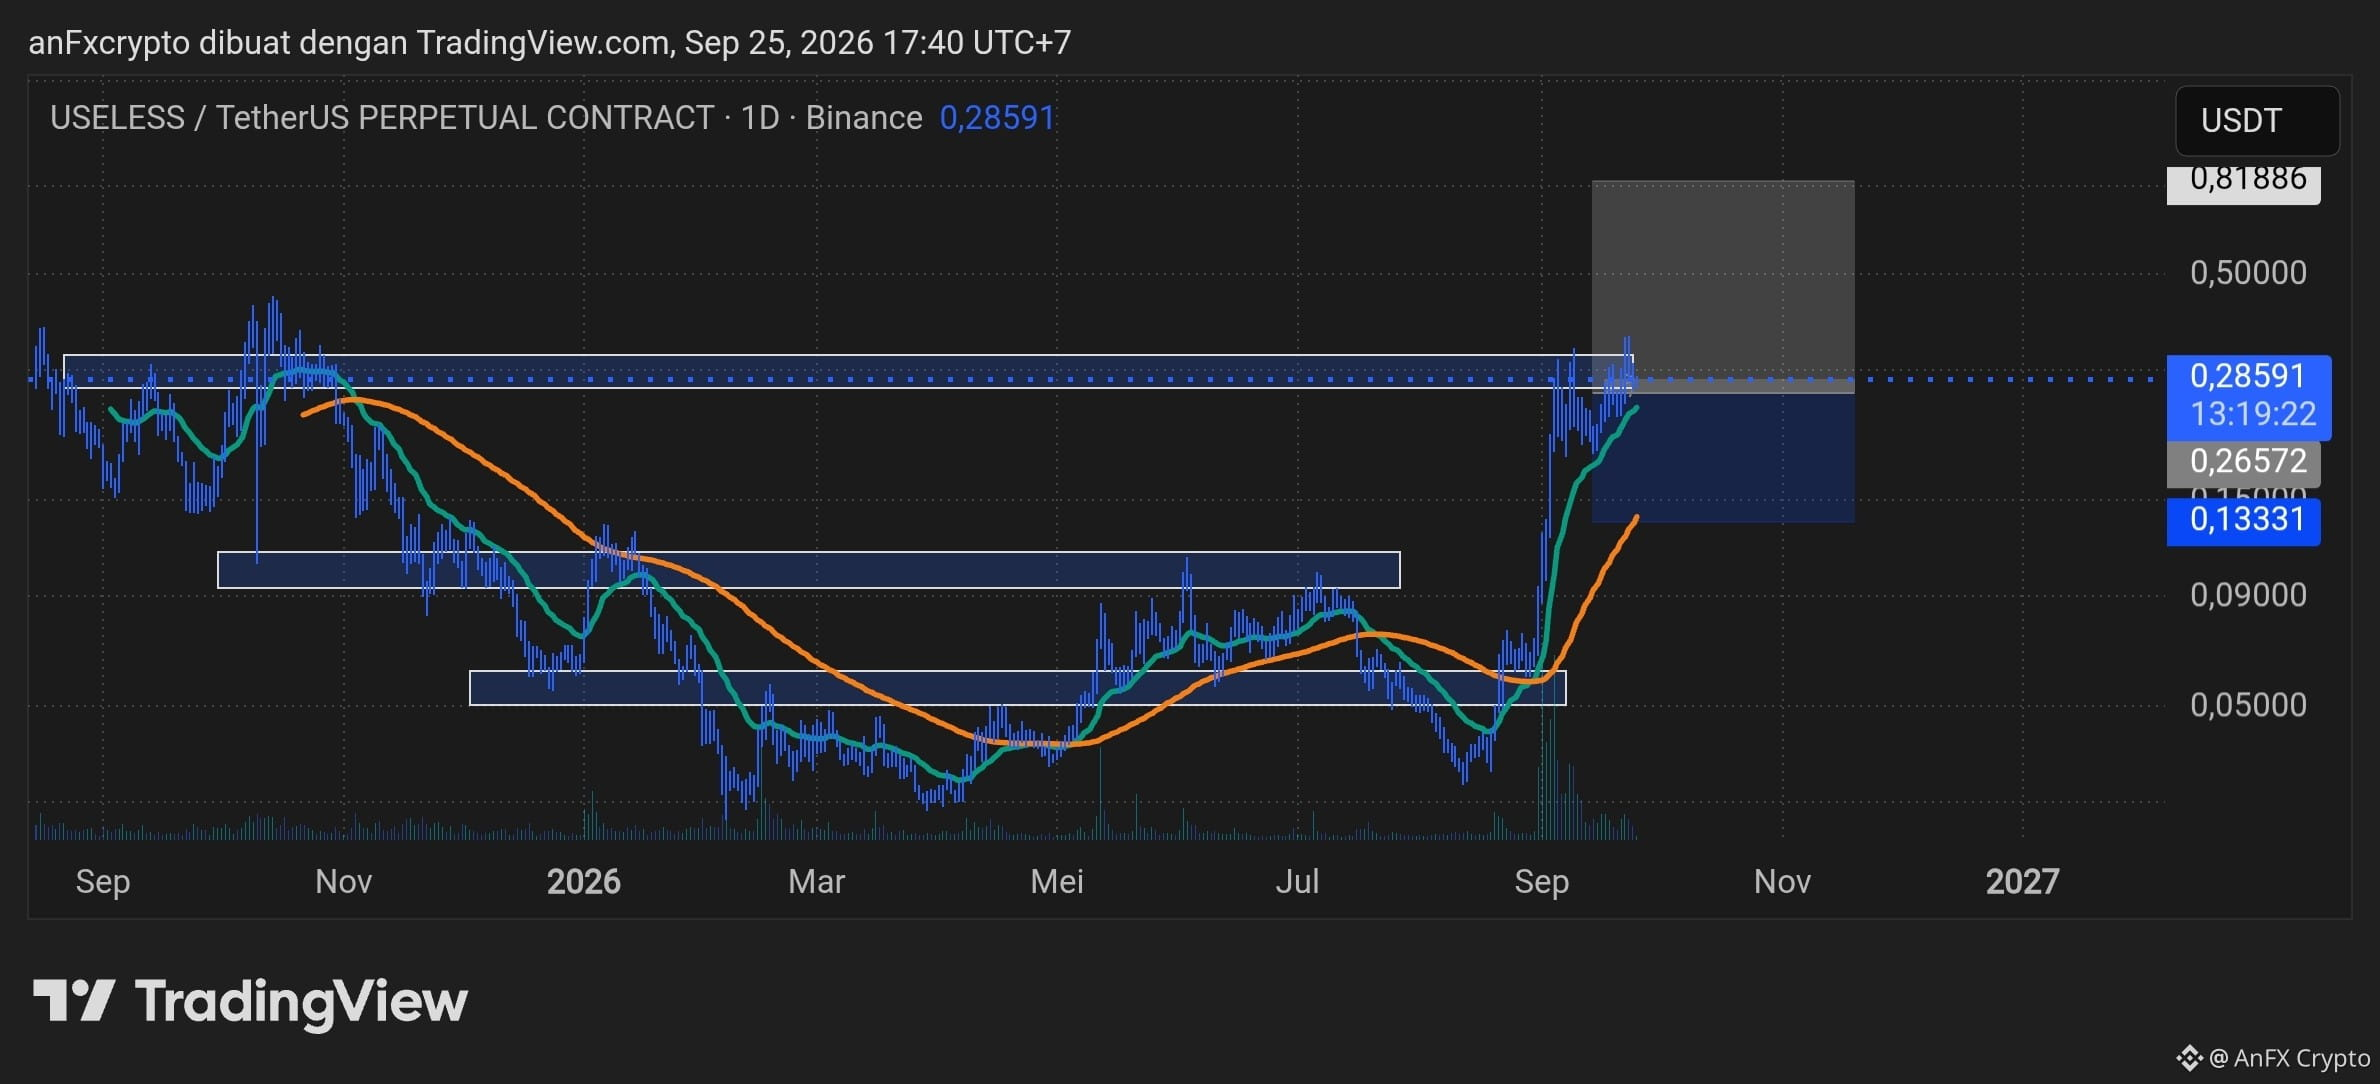
The following is a professional technical analysis and a trading execution plan based on the chart $USELESS /USDT Perpetual (1D).
1. Market Structure & Trend
Trend Direction (Trend Bias): Strong Bullish. After a long accumulation phase in the base area ($0.03 – $0.05), price has gone through a significant impulsive rally, breaking above multiple key resistances.
Current Price Position: $0.28591.
Moving Averages: The short EMA line (green) is sharply above the long EMA (orange), with a strong upward slope, confirming buyer momentum dominates.
Key Level Conditions: Current price is testing the Major Resistance / Supply Zone ($0.2700 – $0.3000). A daily candle close above $0.3000 will confirm a perfect breakout toward the next upside target.
2. Trading Signal (Swing Long)
Based on the Risk-to-Reward (RRR) projection available on the chart, this is a Continuation / Breakout Retest setup:
ParameterLevel PriceDescription DirectionPositionBUY / LONGFollows the main trend (Trend Following)Entry Area$0.2657 – $0.2859Staged entry on retest of support / market priceStop Loss (SL)$0.1333Below the local structure swing low & EMA confluenceTake Profit 1 (TP1)$0.5000Psychological target & mid-range areaTake Profit 2 (TP2)$0.8188Main swing-high projection targetRisk-to-Reward Ratio~1 : 3.5The risk-to-reward ratio is very ideal
3. Execution Strategy & Risk Management
Entry Options Method:
Aggressive: Open partial positions at the current market price ($0.2859).
Conservative: Wait for confirmation of a pullback/retest to the $0.2657 area or a daily candle close ($0.3000+) to avoid false breakouts.
Capital Allocation Settings:
Limit maximum risk to 1% – 2% of your account’s total equity on this trade.
Because the Stop Loss distance is fairly wide (~53% from entry to SL), use low leverage (2x – 3x) or adjust position sizing so that the nominal loss amount does not exceed your risk tolerance.
Position Management:
Move SL to Breakeven (SL Plus) once price has successfully reached and tested the $0.5000 area (TP1).
{future}(USELESSUSDT)
The following is a professional technical analysis and a trading execution plan based on the chart $USELESS /USDT Perpetual (1D).
1. Market Structure & Trend
Trend Direction (Trend Bias): Strong Bullish. After a long accumulation phase in the base area ($0.03 – $0.05), price has gone through a significant impulsive rally, breaking above multiple key resistances.
Current Price Position: $0.28591.
Moving Averages: The short EMA line (green) is sharply above the long EMA (orange), with a strong upward slope, confirming buyer momentum dominates.
Key Level Conditions: Current price is testing the Major Resistance / Supply Zone ($0.2700 – $0.3000). A daily candle close above $0.3000 will confirm a perfect breakout toward the next upside target.
2. Trading Signal (Swing Long)
Based on the Risk-to-Reward (RRR) projection available on the chart, this is a Continuation / Breakout Retest setup:
ParameterLevel PriceDescription DirectionPositionBUY / LONGFollows the main trend (Trend Following)Entry Area$0.2657 – $0.2859Staged entry on retest of support / market priceStop Loss (SL)$0.1333Below the local structure swing low & EMA confluenceTake Profit 1 (TP1)$0.5000Psychological target & mid-range areaTake Profit 2 (TP2)$0.8188Main swing-high projection targetRisk-to-Reward Ratio~1 : 3.5The risk-to-reward ratio is very ideal
3. Execution Strategy & Risk Management
Entry Options Method:
Aggressive: Open partial positions at the current market price ($0.2859).
Conservative: Wait for confirmation of a pullback/retest to the $0.2657 area or a daily candle close ($0.3000+) to avoid false breakouts.
Capital Allocation Settings:
Limit maximum risk to 1% – 2% of your account’s total equity on this trade.
Because the Stop Loss distance is fairly wide (~53% from entry to SL), use low leverage (2x – 3x) or adjust position sizing so that the nominal loss amount does not exceed your risk tolerance.
Position Management:
Move SL to Breakeven (SL Plus) once price has successfully reached and tested the $0.5000 area (TP1).
1. Market Structure & Trend
Trend Direction (Trend Bias): Strong Bullish. After a long accumulation phase in the base area ($0.03 – $0.05), price has gone through a significant impulsive rally, breaking above multiple key resistances.
Current Price Position: $0.28591.
Moving Averages: The short EMA line (green) is sharply above the long EMA (orange), with a strong upward slope, confirming buyer momentum dominates.
Key Level Conditions: Current price is testing the Major Resistance / Supply Zone ($0.2700 – $0.3000). A daily candle close above $0.3000 will confirm a perfect breakout toward the next upside target.
2. Trading Signal (Swing Long)
Based on the Risk-to-Reward (RRR) projection available on the chart, this is a Continuation / Breakout Retest setup:
ParameterLevel PriceDescription DirectionPositionBUY / LONGFollows the main trend (Trend Following)Entry Area$0.2657 – $0.2859Staged entry on retest of support / market priceStop Loss (SL)$0.1333Below the local structure swing low & EMA confluenceTake Profit 1 (TP1)$0.5000Psychological target & mid-range areaTake Profit 2 (TP2)$0.8188Main swing-high projection targetRisk-to-Reward Ratio~1 : 3.5The risk-to-reward ratio is very ideal
3. Execution Strategy & Risk Management
Entry Options Method:
Aggressive: Open partial positions at the current market price ($0.2859).
Conservative: Wait for confirmation of a pullback/retest to the $0.2657 area or a daily candle close ($0.3000+) to avoid false breakouts.
Capital Allocation Settings:
Limit maximum risk to 1% – 2% of your account’s total equity on this trade.
Because the Stop Loss distance is fairly wide (~53% from entry to SL), use low leverage (2x – 3x) or adjust position sizing so that the nominal loss amount does not exceed your risk tolerance.
Position Management:
Move SL to Breakeven (SL Plus) once price has successfully reached and tested the $0.5000 area (TP1).
16
·
--
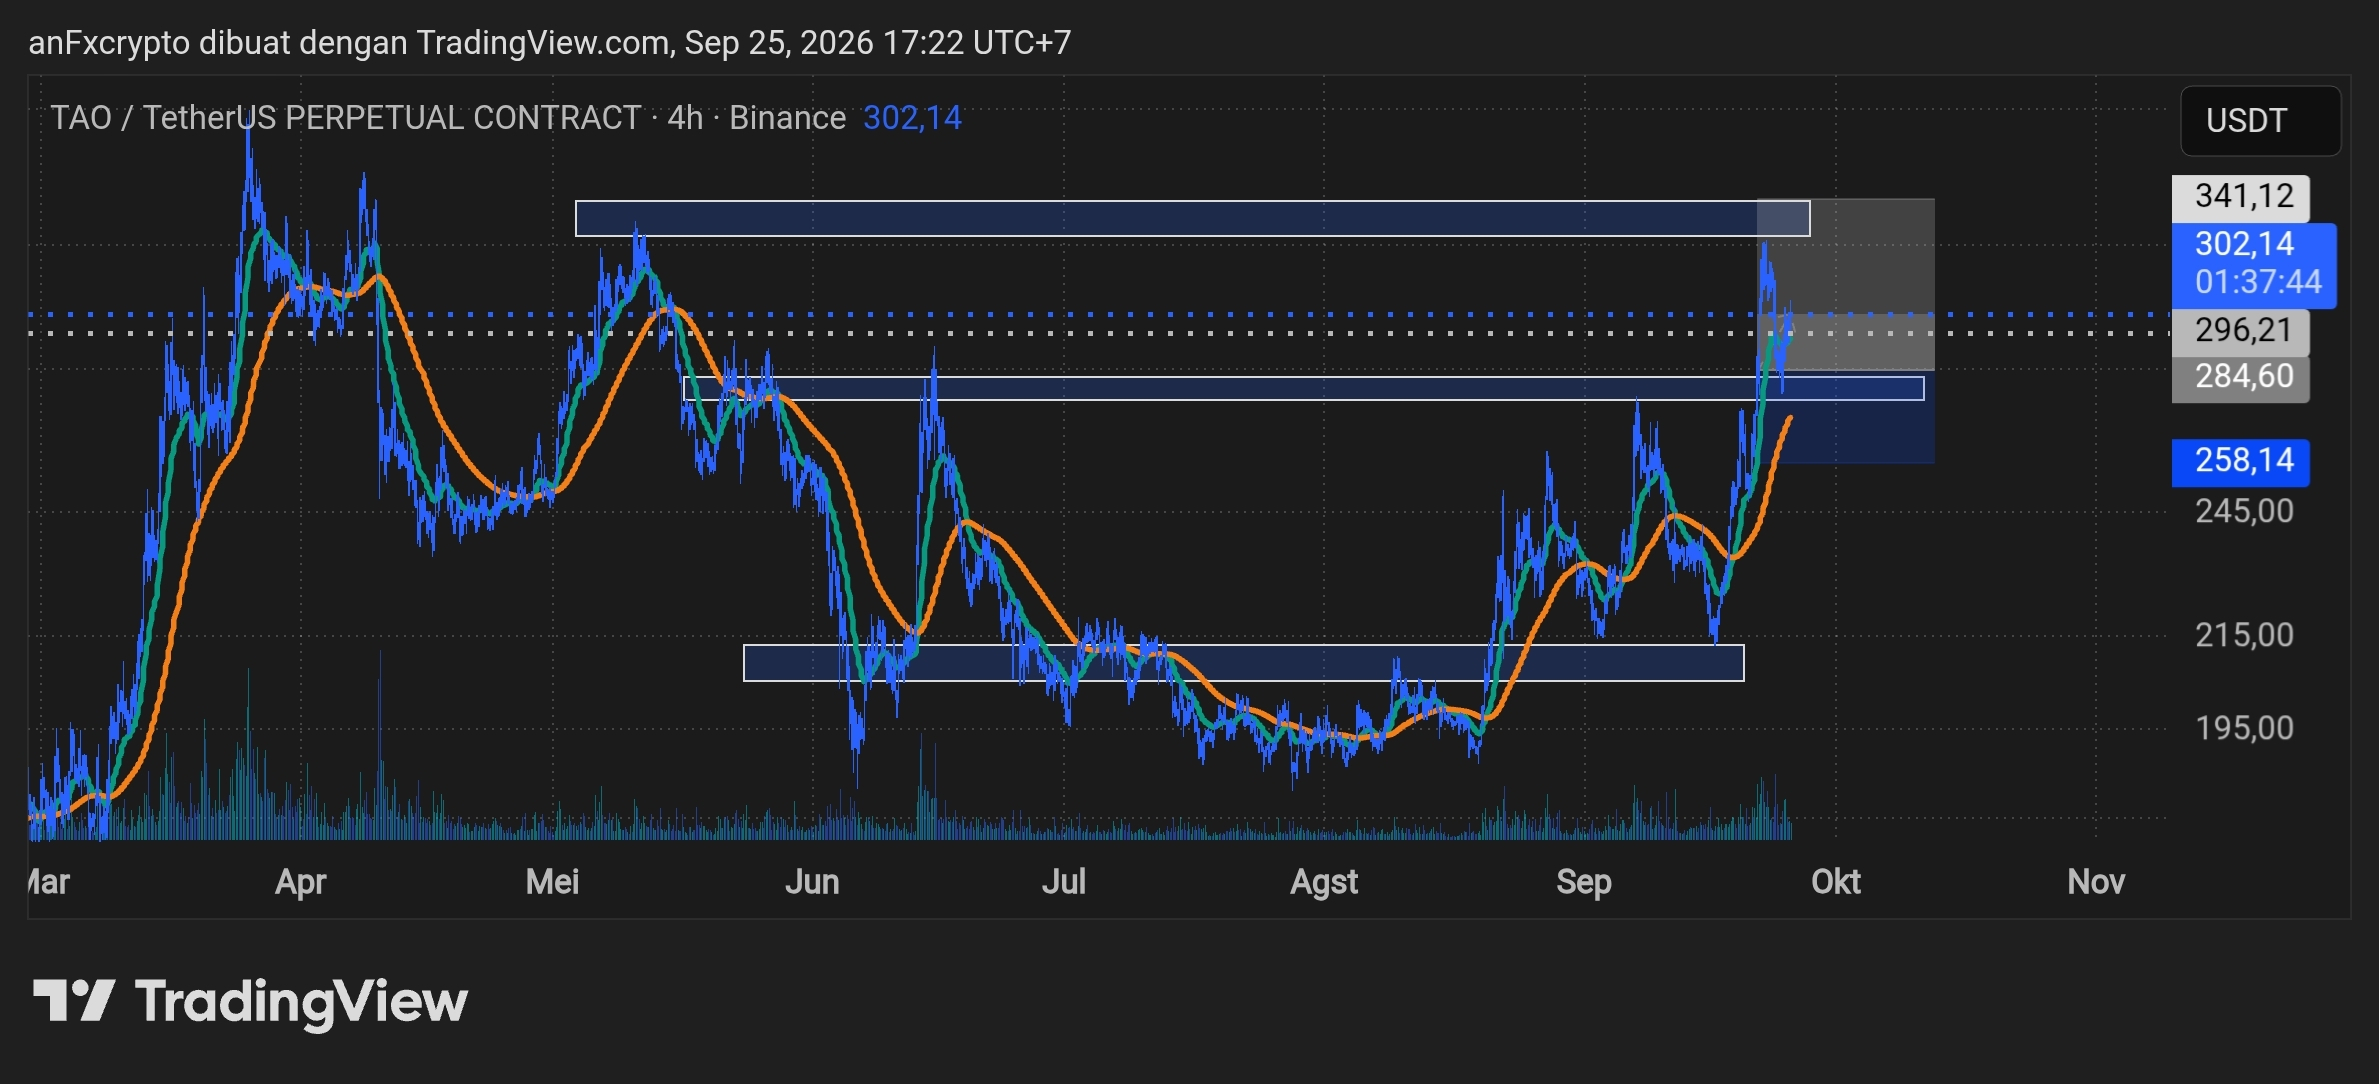
Here is a professional technical analysis and trading plan for $TAO /USDT Perpetual (Timeframe 4-Hour):
1. Trend Analysis & Market Structure
Main Trend: Bullish momentum on the 4H timeframe. After experiencing an accumulation phase in the $190.00–$215.00 area during July–August, TAO successfully formed a strong higher high and higher low structure.
Moving Average Indicator: The two MA lines are curving upward beneath the price movement, providing dynamic support and confirming the uptrend.
Current Condition: Price is testing a strong resistance area in the $296.21–$302.09 range. A valid breakout above this area could trigger an acceleration toward the previously reached high area.
2. Key Levels
Major Resistance / Primary Target: $341.12
Immediate Resistance / Breakout Level: $296.21–$302.09
Demand / Support Zone (Flip Area): $284.60–$296.21
Invalidation / Stop Loss Level: $258.14 (below the local swing low and the MA support)
3. Signals & Trading Plan (Long Setup)
ParameterValue / AreaPosition DirectionBUY / LONGBuy / Entry Zone$284.60–$296.21 (waiting for a pullback/retest) or a confirmed 4H candle close above $302.00Take Profit (TP)$341.12Stop Loss (SL)$258.14Risk to Reward Ratio (RRR)~1:1.5 to 1:2 (depending on the precision of the entry point)
4. Execution Strategy & Risk Management
Best Entry Option: It is recommended to use the Retest scenario (buying when price corrects healthily into the $284.60–$296.21 demand zone) to achieve the optimal Risk-to-Reward.
Breakout Confirmation: If entering on a breakout when price breaks above $302.00, ensure there is a strong 4H candle close accompanied by an increase in trading volume.
Position Management:
Allocate a maximum risk of 1%–2% of total account equity per trade.
Move the Stop Loss to Break Even (BEP) if price reaches the $320.00 area.
{future}(TAOUSDT)
Here is a professional technical analysis and trading plan for $TAO /USDT Perpetual (Timeframe 4-Hour):
1. Trend Analysis & Market Structure
Main Trend: Bullish momentum on the 4H timeframe. After experiencing an accumulation phase in the $190.00–$215.00 area during July–August, TAO successfully formed a strong higher high and higher low structure.
Moving Average Indicator: The two MA lines are curving upward beneath the price movement, providing dynamic support and confirming the uptrend.
Current Condition: Price is testing a strong resistance area in the $296.21–$302.09 range. A valid breakout above this area could trigger an acceleration toward the previously reached high area.
2. Key Levels
Major Resistance / Primary Target: $341.12
Immediate Resistance / Breakout Level: $296.21–$302.09
Demand / Support Zone (Flip Area): $284.60–$296.21
Invalidation / Stop Loss Level: $258.14 (below the local swing low and the MA support)
3. Signals & Trading Plan (Long Setup)
ParameterValue / AreaPosition DirectionBUY / LONGBuy / Entry Zone$284.60–$296.21 (waiting for a pullback/retest) or a confirmed 4H candle close above $302.00Take Profit (TP)$341.12Stop Loss (SL)$258.14Risk to Reward Ratio (RRR)~1:1.5 to 1:2 (depending on the precision of the entry point)
4. Execution Strategy & Risk Management
Best Entry Option: It is recommended to use the Retest scenario (buying when price corrects healthily into the $284.60–$296.21 demand zone) to achieve the optimal Risk-to-Reward.
Breakout Confirmation: If entering on a breakout when price breaks above $302.00, ensure there is a strong 4H candle close accompanied by an increase in trading volume.
Position Management:
Allocate a maximum risk of 1%–2% of total account equity per trade.
Move the Stop Loss to Break Even (BEP) if price reaches the $320.00 area.
1. Trend Analysis & Market Structure
Main Trend: Bullish momentum on the 4H timeframe. After experiencing an accumulation phase in the $190.00–$215.00 area during July–August, TAO successfully formed a strong higher high and higher low structure.
Moving Average Indicator: The two MA lines are curving upward beneath the price movement, providing dynamic support and confirming the uptrend.
Current Condition: Price is testing a strong resistance area in the $296.21–$302.09 range. A valid breakout above this area could trigger an acceleration toward the previously reached high area.
2. Key Levels
Major Resistance / Primary Target: $341.12
Immediate Resistance / Breakout Level: $296.21–$302.09
Demand / Support Zone (Flip Area): $284.60–$296.21
Invalidation / Stop Loss Level: $258.14 (below the local swing low and the MA support)
3. Signals & Trading Plan (Long Setup)
ParameterValue / AreaPosition DirectionBUY / LONGBuy / Entry Zone$284.60–$296.21 (waiting for a pullback/retest) or a confirmed 4H candle close above $302.00Take Profit (TP)$341.12Stop Loss (SL)$258.14Risk to Reward Ratio (RRR)~1:1.5 to 1:2 (depending on the precision of the entry point)
4. Execution Strategy & Risk Management
Best Entry Option: It is recommended to use the Retest scenario (buying when price corrects healthily into the $284.60–$296.21 demand zone) to achieve the optimal Risk-to-Reward.
Breakout Confirmation: If entering on a breakout when price breaks above $302.00, ensure there is a strong 4H candle close accompanied by an increase in trading volume.
Position Management:
Allocate a maximum risk of 1%–2% of total account equity per trade.
Move the Stop Loss to Break Even (BEP) if price reaches the $320.00 area.
29
·
--
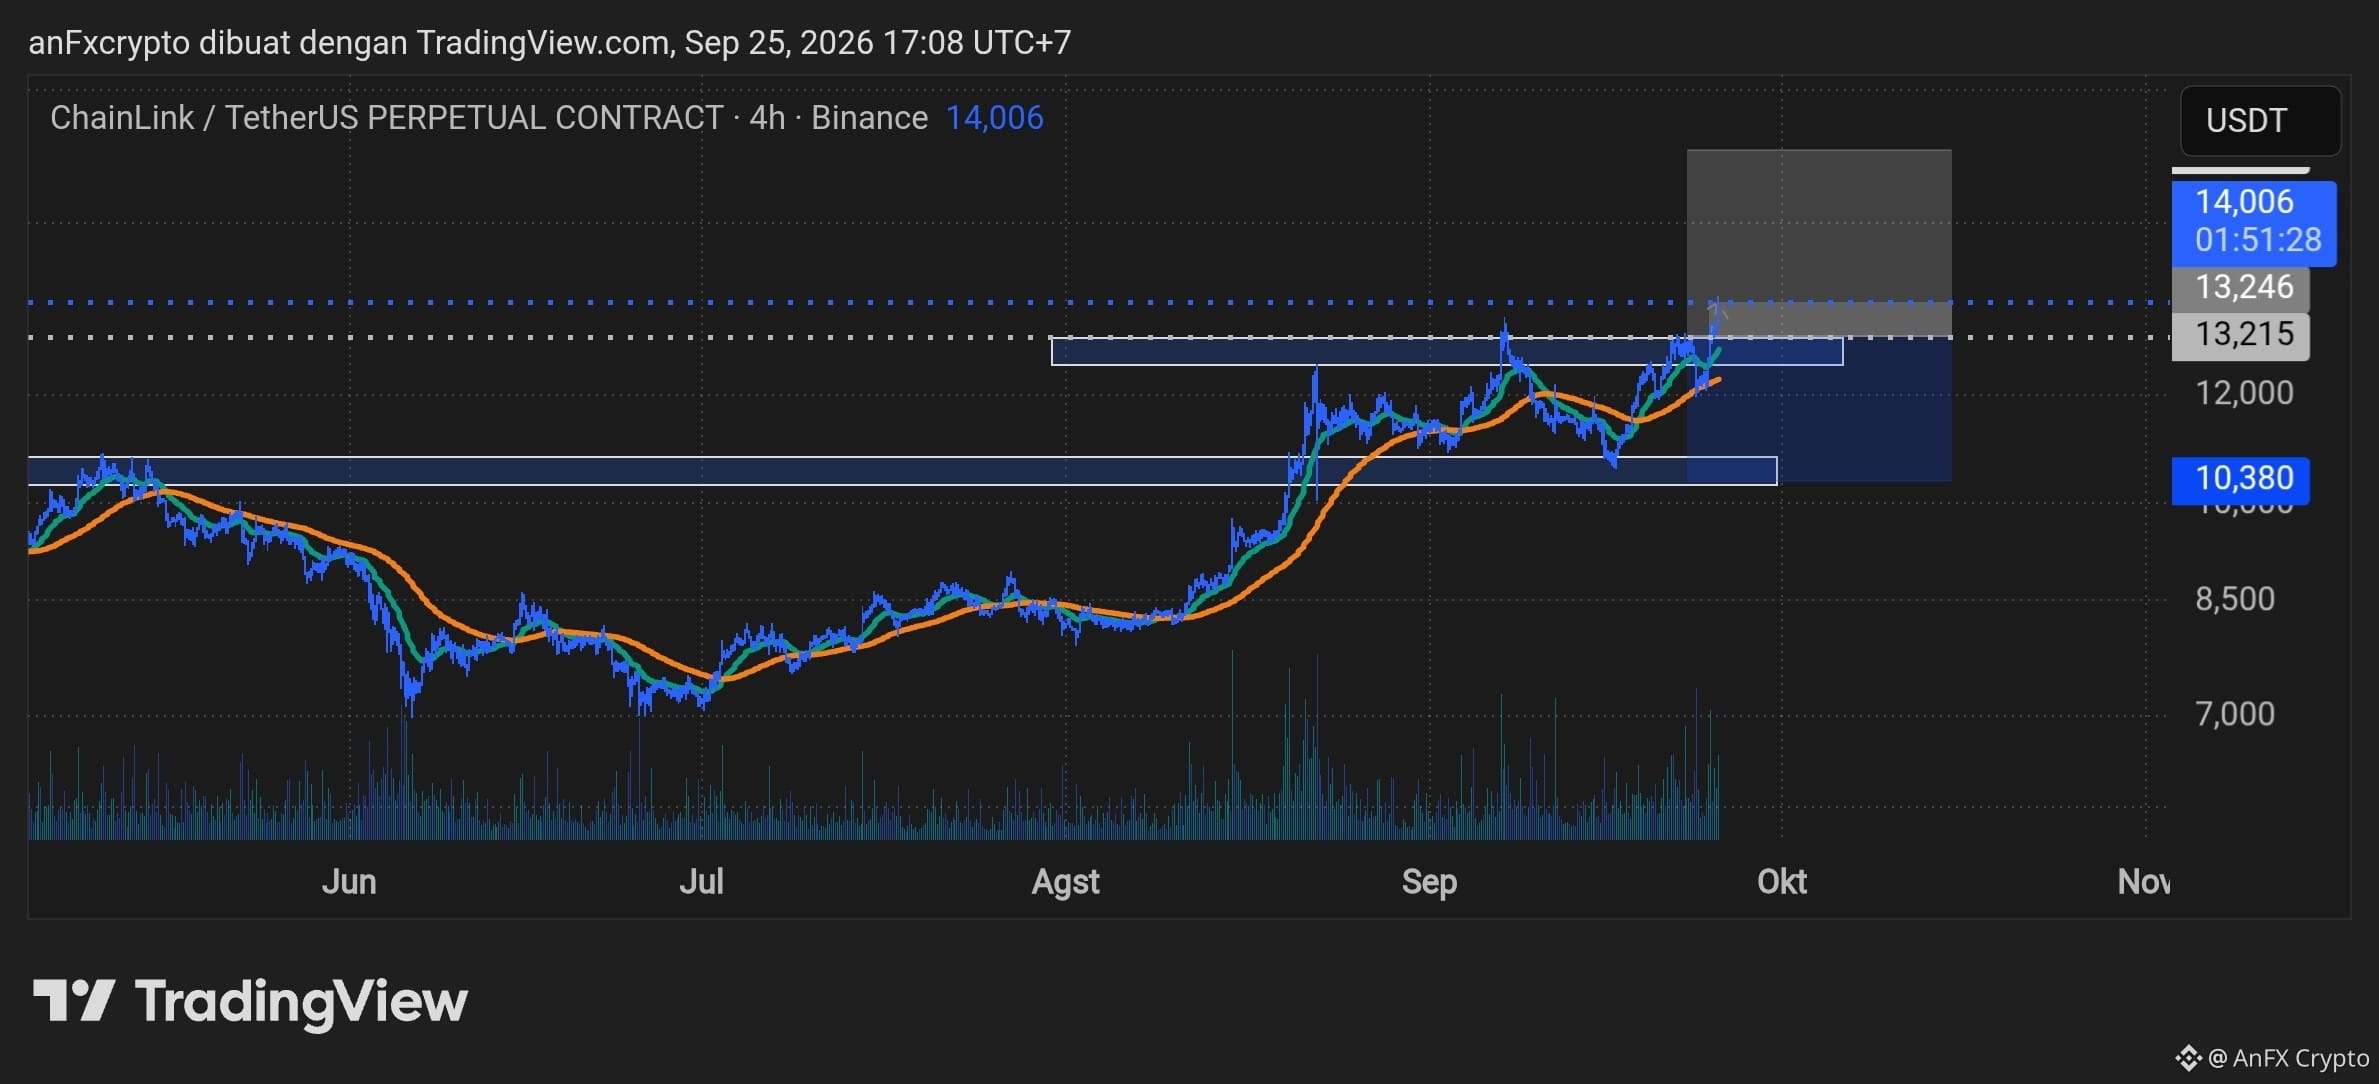
Technical Analysis ($LINK /USDT - 4H )
1. Understanding Market Structure & Trend
* Main Trend (Market Structure): Very bullish in the short-to-medium term. Price has formed Higher Highs and Higher Lows since bouncing from a strong demand/support area in the 10,380 USDT range.
* Breakout Confirmation: Price has just broken through an important resistance zone in the 12,000 – 13,246 USDT area with significant impulsive volume, bringing price to the current level of 14,006 USDT.
* Moving Average Indicator: The moving average (green & orange lines) has experienced a Golden Cross and is leaning upward, confirming that the buy momentum is still dominant.
Trading Signal & Plan
Based on the Long Position mapping on the chart, here is the recommended execution plan:
Strategy A: Retest Entry (Conservative / Recommended)
Wait for a short-term pullback into the Resistance Become Support (RBS) zone before entering the position.
* Position Direction: LONG
* Entry Area (Buy Zone): 13,000 – 13,250 USDT
* Stop Loss (SL): 10,380 USDT (Below the main support level / previous swing low)
* Take Profit (TP):
* TP 1: 15,500 USDT
* TP 2: 17,500 – 18,000 USDT (Aligned with the gray block target on the chart)
Strategy B: Momentum Breakout Entry (Aggressive)
Buy directly following the trend push.
* Position Direction: LONG
* Entry Area: 14,000 USDT (Current Price)
* Stop Loss (SL): 12,900 USDT (Tighter risk cut)
* Take Profit (TP): 16,500 – 18,000 USDT
Risk Management & Notes
* Leverage Recommendation: 3x to 5x (Max 10x on Futures/Perpetual accounts) to keep margin safely protected from volatility spikes.
* Capital Risk: Limit maximum risk to 1% – 2% of total portfolio equity on this trade.
* Scenario Invalidation: If the 4-hour candle closes below the 12,000 USDT level, the bullish breakout scenario is considered void/cancelled (invalidated).
{future}(LINKUSDT)
Technical Analysis ($LINK /USDT - 4H )
1. Understanding Market Structure & Trend
* Main Trend (Market Structure): Very bullish in the short-to-medium term. Price has formed Higher Highs and Higher Lows since bouncing from a strong demand/support area in the 10,380 USDT range.
* Breakout Confirmation: Price has just broken through an important resistance zone in the 12,000 – 13,246 USDT area with significant impulsive volume, bringing price to the current level of 14,006 USDT.
* Moving Average Indicator: The moving average (green & orange lines) has experienced a Golden Cross and is leaning upward, confirming that the buy momentum is still dominant.
Trading Signal & Plan
Based on the Long Position mapping on the chart, here is the recommended execution plan:
Strategy A: Retest Entry (Conservative / Recommended)
Wait for a short-term pullback into the Resistance Become Support (RBS) zone before entering the position.
* Position Direction: LONG
* Entry Area (Buy Zone): 13,000 – 13,250 USDT
* Stop Loss (SL): 10,380 USDT (Below the main support level / previous swing low)
* Take Profit (TP):
* TP 1: 15,500 USDT
* TP 2: 17,500 – 18,000 USDT (Aligned with the gray block target on the chart)
Strategy B: Momentum Breakout Entry (Aggressive)
Buy directly following the trend push.
* Position Direction: LONG
* Entry Area: 14,000 USDT (Current Price)
* Stop Loss (SL): 12,900 USDT (Tighter risk cut)
* Take Profit (TP): 16,500 – 18,000 USDT
Risk Management & Notes
* Leverage Recommendation: 3x to 5x (Max 10x on Futures/Perpetual accounts) to keep margin safely protected from volatility spikes.
* Capital Risk: Limit maximum risk to 1% – 2% of total portfolio equity on this trade.
* Scenario Invalidation: If the 4-hour candle closes below the 12,000 USDT level, the bullish breakout scenario is considered void/cancelled (invalidated).
1. Understanding Market Structure & Trend
* Main Trend (Market Structure): Very bullish in the short-to-medium term. Price has formed Higher Highs and Higher Lows since bouncing from a strong demand/support area in the 10,380 USDT range.
* Breakout Confirmation: Price has just broken through an important resistance zone in the 12,000 – 13,246 USDT area with significant impulsive volume, bringing price to the current level of 14,006 USDT.
* Moving Average Indicator: The moving average (green & orange lines) has experienced a Golden Cross and is leaning upward, confirming that the buy momentum is still dominant.
Trading Signal & Plan
Based on the Long Position mapping on the chart, here is the recommended execution plan:
Strategy A: Retest Entry (Conservative / Recommended)
Wait for a short-term pullback into the Resistance Become Support (RBS) zone before entering the position.
* Position Direction: LONG
* Entry Area (Buy Zone): 13,000 – 13,250 USDT
* Stop Loss (SL): 10,380 USDT (Below the main support level / previous swing low)
* Take Profit (TP):
* TP 1: 15,500 USDT
* TP 2: 17,500 – 18,000 USDT (Aligned with the gray block target on the chart)
Strategy B: Momentum Breakout Entry (Aggressive)
Buy directly following the trend push.
* Position Direction: LONG
* Entry Area: 14,000 USDT (Current Price)
* Stop Loss (SL): 12,900 USDT (Tighter risk cut)
* Take Profit (TP): 16,500 – 18,000 USDT
Risk Management & Notes
* Leverage Recommendation: 3x to 5x (Max 10x on Futures/Perpetual accounts) to keep margin safely protected from volatility spikes.
* Capital Risk: Limit maximum risk to 1% – 2% of total portfolio equity on this trade.
* Scenario Invalidation: If the 4-hour candle closes below the 12,000 USDT level, the bullish breakout scenario is considered void/cancelled (invalidated).
6
·
--
Article
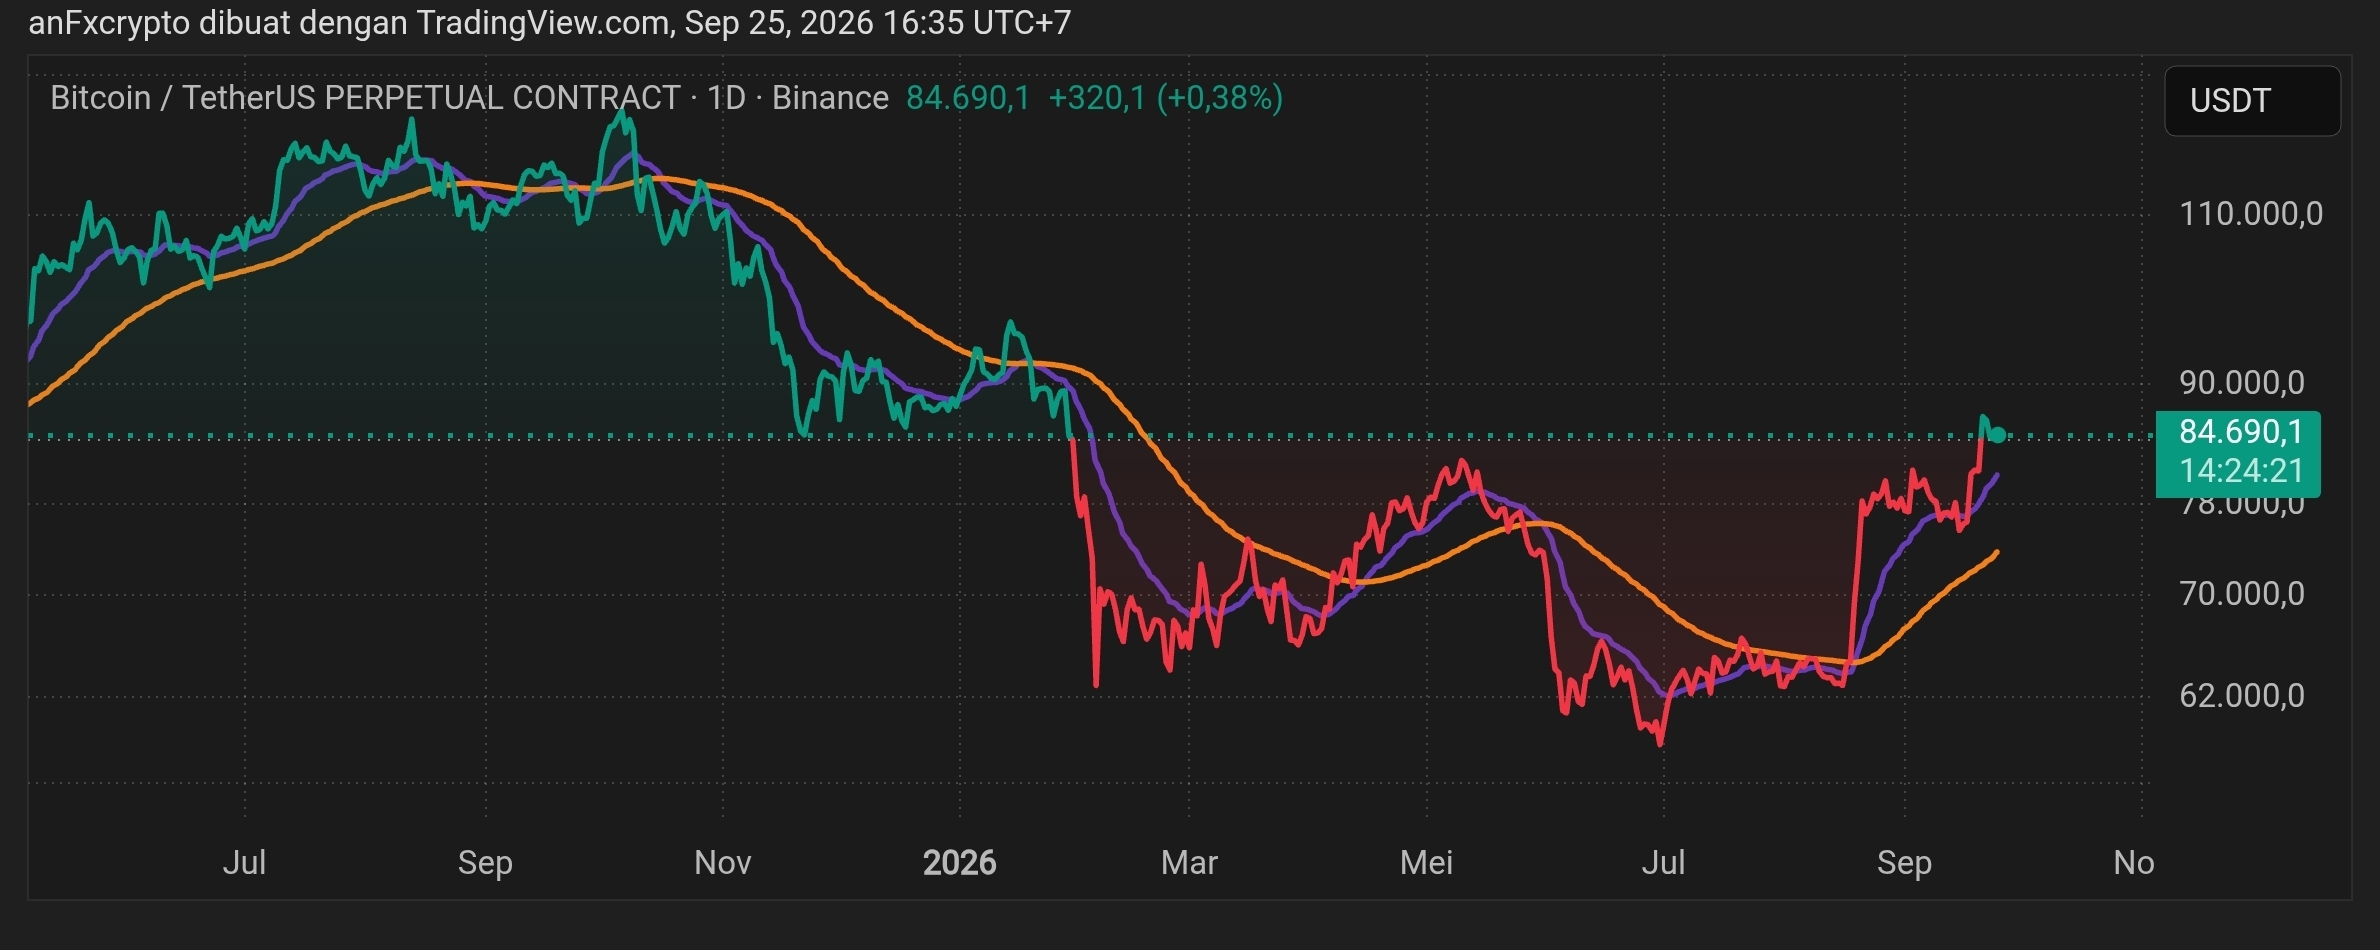
BTC QUARTERLYQuarterly Analysis of Bitcoin ($BTC Quarterly Performance) refers to a recap of returns (percentage increase/decrease) in the price of Bitcoin, measured over each period of three months:
Q1 (First Quarter): January – March
Q2 (Second Quarter): April – June
Q3 (Third Quarter): July – September
Q4 (Fourth Quarter): October – December
Historical BTC Seasonal Patterns
Based on the history of Bitcoin price movements since 2011:
Q1 (Beginning of the Year): Tends to move variably. Often there is a recovery after the New Year or profit-taking actions following the end-of-year rally.
BTC QUARTERLY
Quarterly Analysis of Bitcoin ($BTC Quarterly Performance) refers to a recap of returns (percentage increase/decrease) in the price of Bitcoin, measured over each period of three months:
Q1 (First Quarter): January – March
Q2 (Second Quarter): April – June
Q3 (Third Quarter): July – September
Q4 (Fourth Quarter): October – December
Historical BTC Seasonal Patterns
Based on the history of Bitcoin price movements since 2011:
Q1 (Beginning of the Year): Tends to move variably. Often there is a recovery after the New Year or profit-taking actions following the end-of-year rally.
Q1 (First Quarter): January – March
Q2 (Second Quarter): April – June
Q3 (Third Quarter): July – September
Q4 (Fourth Quarter): October – December
Historical BTC Seasonal Patterns
Based on the history of Bitcoin price movements since 2011:
Q1 (Beginning of the Year): Tends to move variably. Often there is a recovery after the New Year or profit-taking actions following the end-of-year rally.
13
·
--
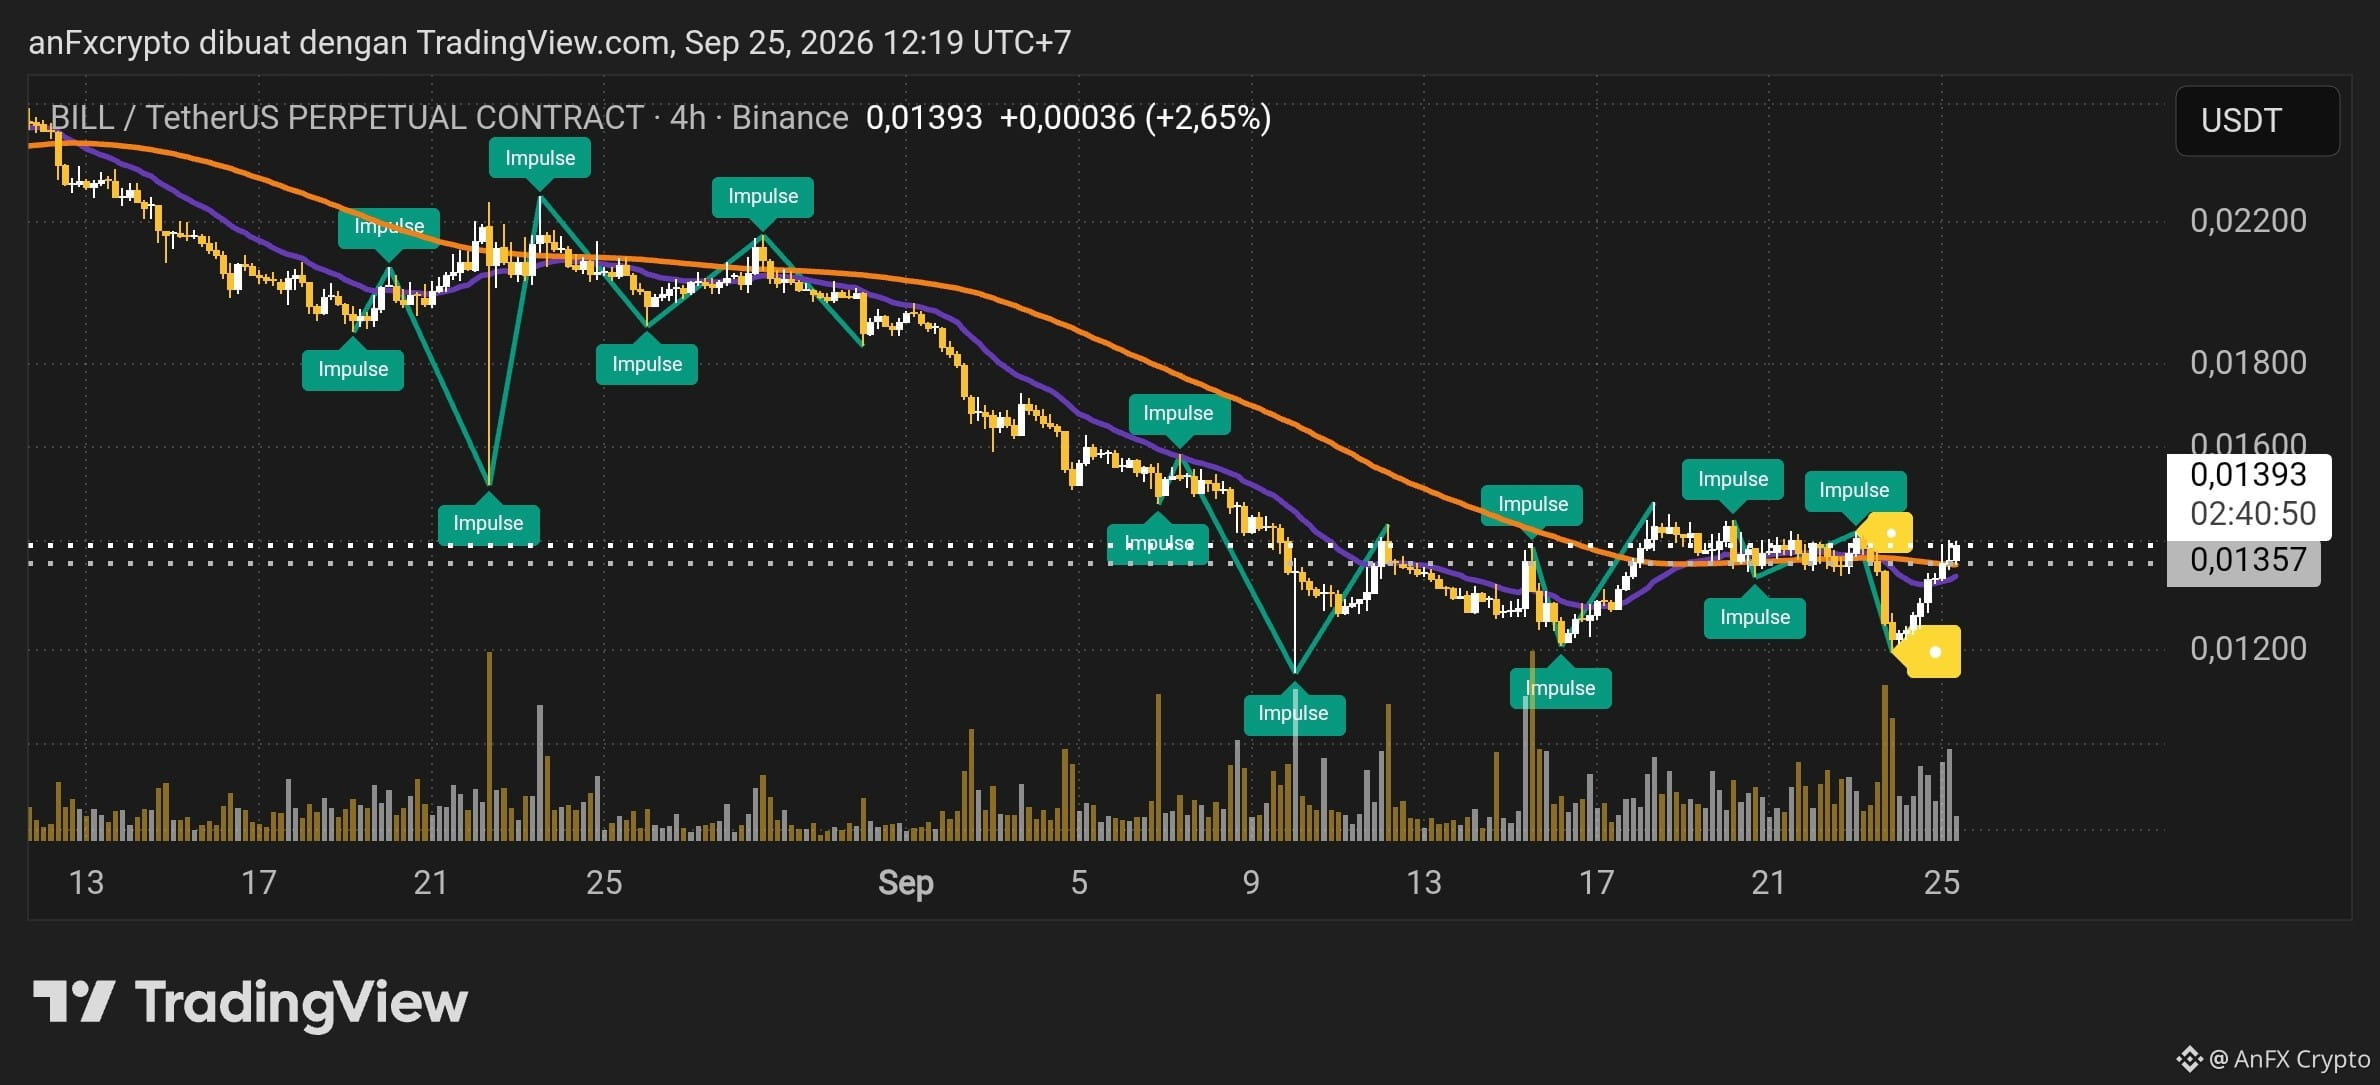
Market Structure Analysis ($BILL /USDT 4H)
On the BILL/USDT Perpetual Contract chart (Timeframe 4 Hours), there are several important technical structure points:
Liquidity Sweep & Absorption: A fast breakout (liquidity sweep) into the lowest area around $0.01200 occurs and is immediately absorbed by buyers. This is shown by a long lower candlestick wick accompanied by a significant spike in transaction volume.
Support/Resistance Flip ($0.01357): Price successfully rebounds back above the horizontal dotted line at $0.01357. This level now acts as a key local support after briefly being broken.
Moving Average (MA) Compression: The Moving Average lines (purple and orange) start to flatten and converge around the running price ($0.01393). This indicates that the large downtrend momentum is starting to exhaust and the market is entering a consolidation phase / potential reversal.
Signal & Trading Plan (Long Setup)
Direction: BUY / LONG
Entry Zone: $0.01350 – $0.01390 (You can use staged buying / scale-in when price retests the $0.01357 support area)
Stop Loss (SL): $0.01270 (Placed below the local swing low to limit risk)
Take Profit (TP):
TP 1: $0.01500 (Closest local resistance area)
TP 2: $0.01620 (Dynamic resistance area & previous impulsive point)
TP 3: $0.01800 (Swing target if the trend fully reverses)
Risk to Reward Ratio (RRR): ~1 : 2.5 (measured up to TP2)
Risk Management & Execution Strategy
Account Risk: Use a maximum risk limit of 1% to 2% of your total equity account on this trade.
Invalidation Scenario: If the 4-hour candle closes below $0.01270, this rebound structure is considered invalid and you should exit the position immediately to limit losses.
{future}(BILLUSDT)
Market Structure Analysis ($BILL /USDT 4H)
On the BILL/USDT Perpetual Contract chart (Timeframe 4 Hours), there are several important technical structure points:
Liquidity Sweep & Absorption: A fast breakout (liquidity sweep) into the lowest area around $0.01200 occurs and is immediately absorbed by buyers. This is shown by a long lower candlestick wick accompanied by a significant spike in transaction volume.
Support/Resistance Flip ($0.01357): Price successfully rebounds back above the horizontal dotted line at $0.01357. This level now acts as a key local support after briefly being broken.
Moving Average (MA) Compression: The Moving Average lines (purple and orange) start to flatten and converge around the running price ($0.01393). This indicates that the large downtrend momentum is starting to exhaust and the market is entering a consolidation phase / potential reversal.
Signal & Trading Plan (Long Setup)
Direction: BUY / LONG
Entry Zone: $0.01350 – $0.01390 (You can use staged buying / scale-in when price retests the $0.01357 support area)
Stop Loss (SL): $0.01270 (Placed below the local swing low to limit risk)
Take Profit (TP):
TP 1: $0.01500 (Closest local resistance area)
TP 2: $0.01620 (Dynamic resistance area & previous impulsive point)
TP 3: $0.01800 (Swing target if the trend fully reverses)
Risk to Reward Ratio (RRR): ~1 : 2.5 (measured up to TP2)
Risk Management & Execution Strategy
Account Risk: Use a maximum risk limit of 1% to 2% of your total equity account on this trade.
Invalidation Scenario: If the 4-hour candle closes below $0.01270, this rebound structure is considered invalid and you should exit the position immediately to limit losses.
On the BILL/USDT Perpetual Contract chart (Timeframe 4 Hours), there are several important technical structure points:
Liquidity Sweep & Absorption: A fast breakout (liquidity sweep) into the lowest area around $0.01200 occurs and is immediately absorbed by buyers. This is shown by a long lower candlestick wick accompanied by a significant spike in transaction volume.
Support/Resistance Flip ($0.01357): Price successfully rebounds back above the horizontal dotted line at $0.01357. This level now acts as a key local support after briefly being broken.
Moving Average (MA) Compression: The Moving Average lines (purple and orange) start to flatten and converge around the running price ($0.01393). This indicates that the large downtrend momentum is starting to exhaust and the market is entering a consolidation phase / potential reversal.
Signal & Trading Plan (Long Setup)
Direction: BUY / LONG
Entry Zone: $0.01350 – $0.01390 (You can use staged buying / scale-in when price retests the $0.01357 support area)
Stop Loss (SL): $0.01270 (Placed below the local swing low to limit risk)
Take Profit (TP):
TP 1: $0.01500 (Closest local resistance area)
TP 2: $0.01620 (Dynamic resistance area & previous impulsive point)
TP 3: $0.01800 (Swing target if the trend fully reverses)
Risk to Reward Ratio (RRR): ~1 : 2.5 (measured up to TP2)
Risk Management & Execution Strategy
Account Risk: Use a maximum risk limit of 1% to 2% of your total equity account on this trade.
Invalidation Scenario: If the 4-hour candle closes below $0.01270, this rebound structure is considered invalid and you should exit the position immediately to limit losses.
38
·
--
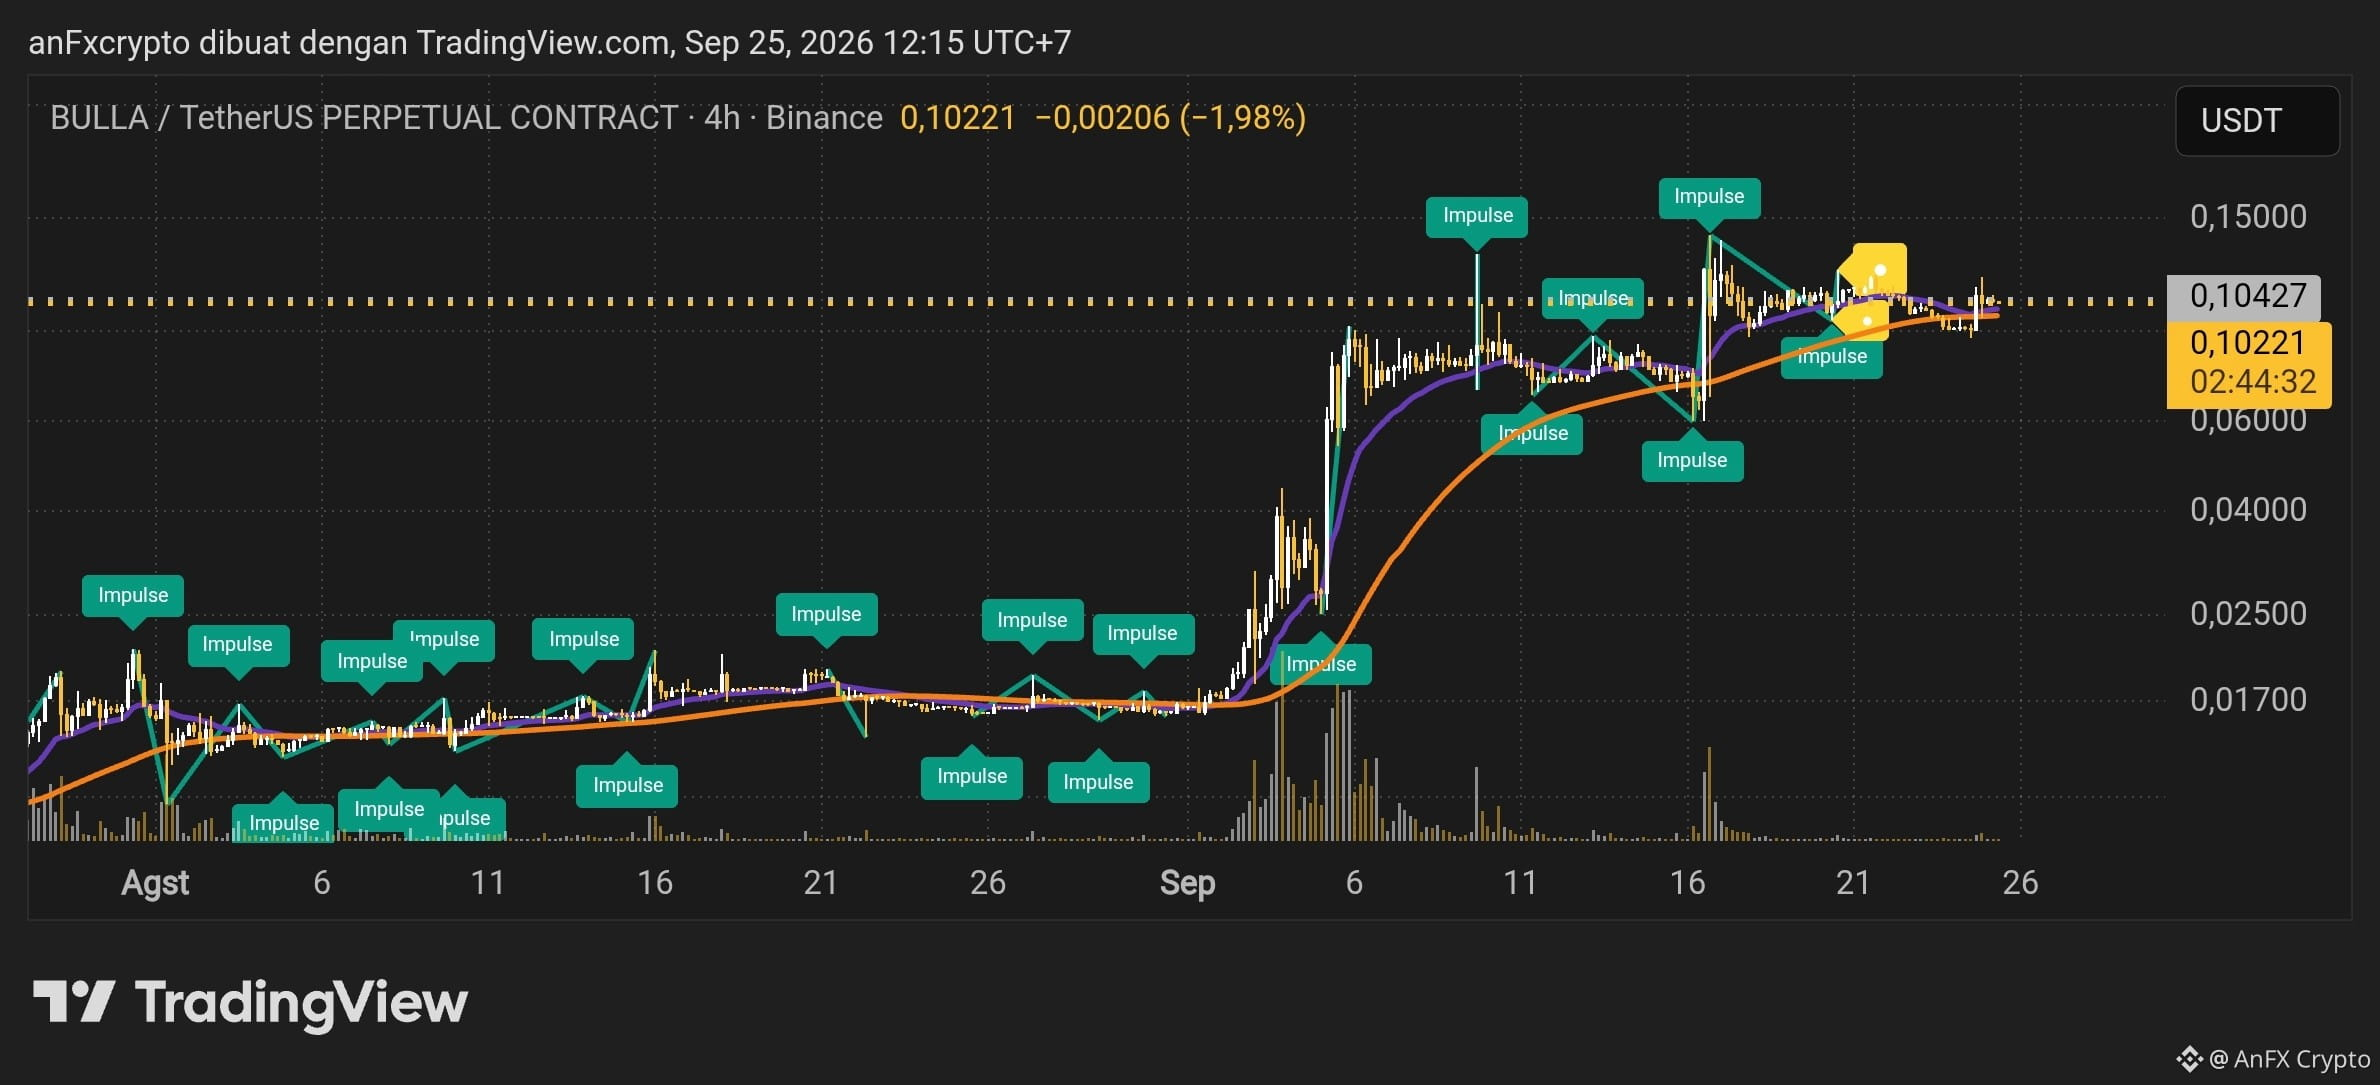
Based on the chart $BULLA /USDT Perpetual (Timeframe 4-Hour / 4H)
1. Market Structure Analysis & Trend
Main Trend (HTF): Strong Bullish. A massive breakout occurred from a long consolidation area at $0,01700 – $0,02500, moving toward the peak (local All-Time High) in the range of $0,15000.
Current Structure (4H): The price is experiencing a healthy correction (pullback) to the support area $0,06000–$0,07500 and has successfully formed a Higher Low. Currently, the price is trading around 0,10221 USDT and is testing the mid consolidation area.
Moving Average Indicator: The orange line (medium/long-term MA) acts as a very strong dynamic support during the rally. The current price is holding above the Orange MA and is trying to break back above the Purple MA (short-term).
2. Key Levels
Key Resistance:
R1 (Local): $0,10800 – $0,11200 (trend continuation confirmation point)
R2 (Main Target): $0,14800 – $0,15000 (previous peak)
Key Support:
S1 (Local): $0,09200 – $0,09500
S2 (Major/Orange MA): $0,07800 – $0,08200
3. Trading Setup & Signals
Option A: Buy on Retest / Limit Buy (Risk Profile: Aggressive / Better Risk-Reward)
Entry Zone: $0,09400 – $0,09900 (buy when there is a pullback to local support)
Take Profit 1 (TP1): $0,11200
Take Profit 2 (TP2): $0,13500
Take Profit 3 (TP3): $0,14800
Stop Loss (SL): $0,08800 (below local support)
Option B: Buy on Breakout (Risk Profile: Conservative)
Entry Zone: $0,10850 – $0,11000 (wait for the 4H candle to close above $0,10800)
Take Profit 1 (TP1): $0,13000
Take Profit 2 (TP2): $0,14800
Stop Loss (SL): $0,09800
4. Risk Management
Risk/Reward Ratio: ~1:2,5
Capital Allocation: Max 2% – 5% of total portfolio equity per position.
Use a Trailing Stop: If the price breaks above $0,12000, move the Stop Loss to Break Even (Entry) to secure capital.
{future}(BULLAUSDT)
Based on the chart $BULLA /USDT Perpetual (Timeframe 4-Hour / 4H)
1. Market Structure Analysis & Trend
Main Trend (HTF): Strong Bullish. A massive breakout occurred from a long consolidation area at $0,01700 – $0,02500, moving toward the peak (local All-Time High) in the range of $0,15000.
Current Structure (4H): The price is experiencing a healthy correction (pullback) to the support area $0,06000–$0,07500 and has successfully formed a Higher Low. Currently, the price is trading around 0,10221 USDT and is testing the mid consolidation area.
Moving Average Indicator: The orange line (medium/long-term MA) acts as a very strong dynamic support during the rally. The current price is holding above the Orange MA and is trying to break back above the Purple MA (short-term).
2. Key Levels
Key Resistance:
R1 (Local): $0,10800 – $0,11200 (trend continuation confirmation point)
R2 (Main Target): $0,14800 – $0,15000 (previous peak)
Key Support:
S1 (Local): $0,09200 – $0,09500
S2 (Major/Orange MA): $0,07800 – $0,08200
3. Trading Setup & Signals
Option A: Buy on Retest / Limit Buy (Risk Profile: Aggressive / Better Risk-Reward)
Entry Zone: $0,09400 – $0,09900 (buy when there is a pullback to local support)
Take Profit 1 (TP1): $0,11200
Take Profit 2 (TP2): $0,13500
Take Profit 3 (TP3): $0,14800
Stop Loss (SL): $0,08800 (below local support)
Option B: Buy on Breakout (Risk Profile: Conservative)
Entry Zone: $0,10850 – $0,11000 (wait for the 4H candle to close above $0,10800)
Take Profit 1 (TP1): $0,13000
Take Profit 2 (TP2): $0,14800
Stop Loss (SL): $0,09800
4. Risk Management
Risk/Reward Ratio: ~1:2,5
Capital Allocation: Max 2% – 5% of total portfolio equity per position.
Use a Trailing Stop: If the price breaks above $0,12000, move the Stop Loss to Break Even (Entry) to secure capital.
1. Market Structure Analysis & Trend
Main Trend (HTF): Strong Bullish. A massive breakout occurred from a long consolidation area at $0,01700 – $0,02500, moving toward the peak (local All-Time High) in the range of $0,15000.
Current Structure (4H): The price is experiencing a healthy correction (pullback) to the support area $0,06000–$0,07500 and has successfully formed a Higher Low. Currently, the price is trading around 0,10221 USDT and is testing the mid consolidation area.
Moving Average Indicator: The orange line (medium/long-term MA) acts as a very strong dynamic support during the rally. The current price is holding above the Orange MA and is trying to break back above the Purple MA (short-term).
2. Key Levels
Key Resistance:
R1 (Local): $0,10800 – $0,11200 (trend continuation confirmation point)
R2 (Main Target): $0,14800 – $0,15000 (previous peak)
Key Support:
S1 (Local): $0,09200 – $0,09500
S2 (Major/Orange MA): $0,07800 – $0,08200
3. Trading Setup & Signals
Option A: Buy on Retest / Limit Buy (Risk Profile: Aggressive / Better Risk-Reward)
Entry Zone: $0,09400 – $0,09900 (buy when there is a pullback to local support)
Take Profit 1 (TP1): $0,11200
Take Profit 2 (TP2): $0,13500
Take Profit 3 (TP3): $0,14800
Stop Loss (SL): $0,08800 (below local support)
Option B: Buy on Breakout (Risk Profile: Conservative)
Entry Zone: $0,10850 – $0,11000 (wait for the 4H candle to close above $0,10800)
Take Profit 1 (TP1): $0,13000
Take Profit 2 (TP2): $0,14800
Stop Loss (SL): $0,09800
4. Risk Management
Risk/Reward Ratio: ~1:2,5
Capital Allocation: Max 2% – 5% of total portfolio equity per position.
Use a Trailing Stop: If the price breaks above $0,12000, move the Stop Loss to Break Even (Entry) to secure capital.
10
·
--
Here is a technical analysis and trading plan recommendation for $ARK /USDT (Perpetual 4H):
1. Technical Analysis (Timeframe 4H)
Market Structure & Trend: The current trend is strongly Bullish. You can see the formation of successive impulse waves after a strong bounce from the support area around 0.1400.
Main Resistance Zone: Price is currently testing the critical resistance line in the range 0.1940 – 0.2015 (the horizontal dashed line). This is the previous swing high point in mid-September.
Moving Average (EMA): The purple and orange EMA lines show an upward crossover (golden cross) and curve upward, confirming strong buying momentum. However, the current price is quite far (overextended) from the EMA line, which increases the possibility of a short-term correction (pullback) before continuing higher.
2. Signals & Trading Plan
Since price is right in an important resistance area, there are two high-probability scenarios:
Scenario A: Buy on Breakout (Momentum / Aggressive Type)
If price successfully breaks through and closes the 4H candle above the resistance zone.
Buy Stop / Entry: 0.2020 – 0.2050 (After confirmation of a 4H candle close above resistance)
Take Profit 1 (TP1): 0.2200
Take Profit 2 (TP2): 0.2450
Stop Loss (SL): 0.1880 (Below the breakout area)
Scenario B: Buy on Dip / Retrace (Conservative - Low Risk Type)
Wait for price to correct healthily first into the support/EMA area before entering.
Buy Limit / Entry Zone: 0.1600 – 0.1680
Take Profit 1 (TP1): 0.1940
Take Profit 2 (TP2): 0.2150
Stop Loss (SL): 0.1490 (Below the EMA line & local support)
3. Risk Management
Research & Confirmation: Don’t do a FOMO Buy just below the resistance line 0.1940 - 0.2015 without a clear breakout.
Position Sizing: Use a maximum risk of 1% – 2% of your total capital per position.
Volatility Warning: Perpetual contracts have high leverage; always place a Stop Loss to avoid liquidation if the market suddenly turns against you.
{future}(ARKUSDT)
Here is a technical analysis and trading plan recommendation for $ARK /USDT (Perpetual 4H):
1. Technical Analysis (Timeframe 4H)
Market Structure & Trend: The current trend is strongly Bullish. You can see the formation of successive impulse waves after a strong bounce from the support area around 0.1400.
Main Resistance Zone: Price is currently testing the critical resistance line in the range 0.1940 – 0.2015 (the horizontal dashed line). This is the previous swing high point in mid-September.
Moving Average (EMA): The purple and orange EMA lines show an upward crossover (golden cross) and curve upward, confirming strong buying momentum. However, the current price is quite far (overextended) from the EMA line, which increases the possibility of a short-term correction (pullback) before continuing higher.
2. Signals & Trading Plan
Since price is right in an important resistance area, there are two high-probability scenarios:
Scenario A: Buy on Breakout (Momentum / Aggressive Type)
If price successfully breaks through and closes the 4H candle above the resistance zone.
Buy Stop / Entry: 0.2020 – 0.2050 (After confirmation of a 4H candle close above resistance)
Take Profit 1 (TP1): 0.2200
Take Profit 2 (TP2): 0.2450
Stop Loss (SL): 0.1880 (Below the breakout area)
Scenario B: Buy on Dip / Retrace (Conservative - Low Risk Type)
Wait for price to correct healthily first into the support/EMA area before entering.
Buy Limit / Entry Zone: 0.1600 – 0.1680
Take Profit 1 (TP1): 0.1940
Take Profit 2 (TP2): 0.2150
Stop Loss (SL): 0.1490 (Below the EMA line & local support)
3. Risk Management
Research & Confirmation: Don’t do a FOMO Buy just below the resistance line 0.1940 - 0.2015 without a clear breakout.
Position Sizing: Use a maximum risk of 1% – 2% of your total capital per position.
Volatility Warning: Perpetual contracts have high leverage; always place a Stop Loss to avoid liquidation if the market suddenly turns against you.
1. Technical Analysis (Timeframe 4H)
Market Structure & Trend: The current trend is strongly Bullish. You can see the formation of successive impulse waves after a strong bounce from the support area around 0.1400.
Main Resistance Zone: Price is currently testing the critical resistance line in the range 0.1940 – 0.2015 (the horizontal dashed line). This is the previous swing high point in mid-September.
Moving Average (EMA): The purple and orange EMA lines show an upward crossover (golden cross) and curve upward, confirming strong buying momentum. However, the current price is quite far (overextended) from the EMA line, which increases the possibility of a short-term correction (pullback) before continuing higher.
2. Signals & Trading Plan
Since price is right in an important resistance area, there are two high-probability scenarios:
Scenario A: Buy on Breakout (Momentum / Aggressive Type)
If price successfully breaks through and closes the 4H candle above the resistance zone.
Buy Stop / Entry: 0.2020 – 0.2050 (After confirmation of a 4H candle close above resistance)
Take Profit 1 (TP1): 0.2200
Take Profit 2 (TP2): 0.2450
Stop Loss (SL): 0.1880 (Below the breakout area)
Scenario B: Buy on Dip / Retrace (Conservative - Low Risk Type)
Wait for price to correct healthily first into the support/EMA area before entering.
Buy Limit / Entry Zone: 0.1600 – 0.1680
Take Profit 1 (TP1): 0.1940
Take Profit 2 (TP2): 0.2150
Stop Loss (SL): 0.1490 (Below the EMA line & local support)
3. Risk Management
Research & Confirmation: Don’t do a FOMO Buy just below the resistance line 0.1940 - 0.2015 without a clear breakout.
Position Sizing: Use a maximum risk of 1% – 2% of your total capital per position.
Volatility Warning: Perpetual contracts have high leverage; always place a Stop Loss to avoid liquidation if the market suddenly turns against you.
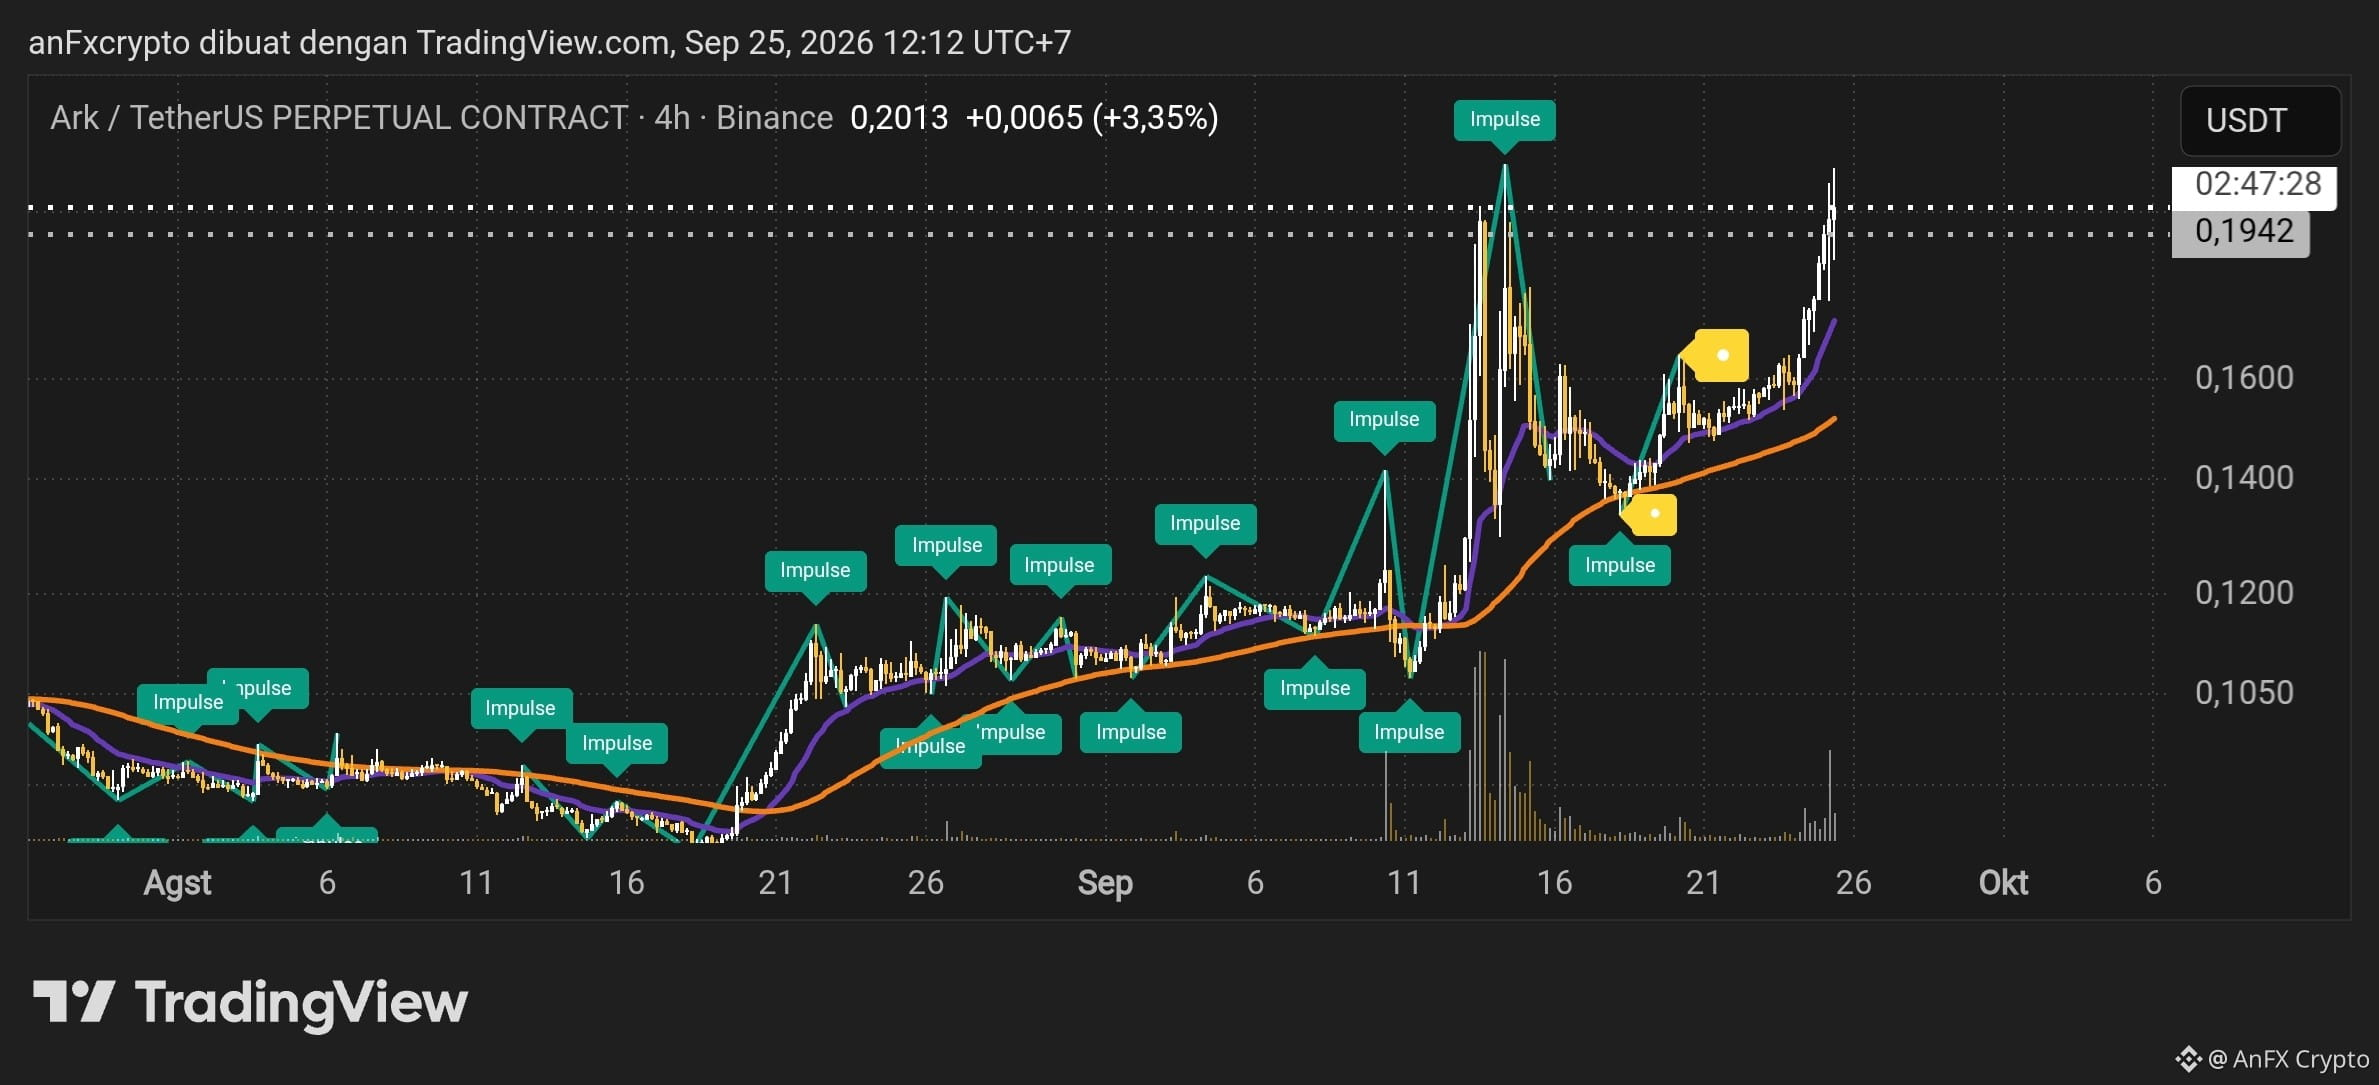
20
·
--
Here is a technical analysis and trading signal options for $XAI /USDT (Perpetual Contract - Timeframe 4H) based on the chart:
1. Market Structure Analysis & Indicators
Market Condition: There was an extremely impulsive price spike (impulse pump) that broke through the peak level above 0.011800 USDT, but was immediately followed by a sharp rejection (rejection/liquidity sweep) with a long upper tail (upper wick).
Trend: The medium-term trend is still bullish (shown by the slope of the Moving Average and the previously green Impulse signal), but the short-term is experiencing a sharp correction (flush out) to cool down the price.
Key Levels:
Main Resistance: 0.009822 USDT and 0.011000 USDT
Nearest Support: 0.009161 USDT (current price)
Demand Zone / Strong Support: 0.007800 USDT – 0.008100 USDT (Moving Average area & former breakout yellow box)
2. Trading Signals & Execution Plan
Currently, the price is in a "no man's land" zone after the spike. Opening a position directly at the current price carries high risk. Use the following pending order scenarios:
Scenario A: Buy / Long on Dip (Main Recommendation)
Entry Zone: 0.007800 USDT – 0.008100 USDT (Wait for a pullback into the MA support area)
Stop Loss (SL): 0.007200 USDT (Below the swing low & supporting MA)
Take Profit (TP):
TP 1: 0.009160 USDT
TP 2: 0.009820 USDT
TP 3: 0.010800 USDT
Risk-to-Reward Ratio (RRR): ~ 1 : 2.5
Scenario B: Short / Sell (Aggressive - Counter-Trend)
Entry Zone: 0.009800 USDT – 0.010000 USDT (If a retest fails to break through resistance)
Stop Loss (SL): 0.010600 USDT
Take Profit (TP):
TP 1: 0.009160 USDT
TP 2: 0.008100 USDT
3. Risk Management
Maximum Leverage: 3x – 5x (because this instrument is extremely volatile).
Capital Risk: Maximum 1%–2% of your total account balance per trade.
Note: Do not panic buy/FOMO while the long red candle is still forming. Let the price stretch and build a new accumulation in the support area before entering a position.
{future}(XAIUSDT)
Here is a technical analysis and trading signal options for $XAI /USDT (Perpetual Contract - Timeframe 4H) based on the chart:
1. Market Structure Analysis & Indicators
Market Condition: There was an extremely impulsive price spike (impulse pump) that broke through the peak level above 0.011800 USDT, but was immediately followed by a sharp rejection (rejection/liquidity sweep) with a long upper tail (upper wick).
Trend: The medium-term trend is still bullish (shown by the slope of the Moving Average and the previously green Impulse signal), but the short-term is experiencing a sharp correction (flush out) to cool down the price.
Key Levels:
Main Resistance: 0.009822 USDT and 0.011000 USDT
Nearest Support: 0.009161 USDT (current price)
Demand Zone / Strong Support: 0.007800 USDT – 0.008100 USDT (Moving Average area & former breakout yellow box)
2. Trading Signals & Execution Plan
Currently, the price is in a "no man's land" zone after the spike. Opening a position directly at the current price carries high risk. Use the following pending order scenarios:
Scenario A: Buy / Long on Dip (Main Recommendation)
Entry Zone: 0.007800 USDT – 0.008100 USDT (Wait for a pullback into the MA support area)
Stop Loss (SL): 0.007200 USDT (Below the swing low & supporting MA)
Take Profit (TP):
TP 1: 0.009160 USDT
TP 2: 0.009820 USDT
TP 3: 0.010800 USDT
Risk-to-Reward Ratio (RRR): ~ 1 : 2.5
Scenario B: Short / Sell (Aggressive - Counter-Trend)
Entry Zone: 0.009800 USDT – 0.010000 USDT (If a retest fails to break through resistance)
Stop Loss (SL): 0.010600 USDT
Take Profit (TP):
TP 1: 0.009160 USDT
TP 2: 0.008100 USDT
3. Risk Management
Maximum Leverage: 3x – 5x (because this instrument is extremely volatile).
Capital Risk: Maximum 1%–2% of your total account balance per trade.
Note: Do not panic buy/FOMO while the long red candle is still forming. Let the price stretch and build a new accumulation in the support area before entering a position.
1. Market Structure Analysis & Indicators
Market Condition: There was an extremely impulsive price spike (impulse pump) that broke through the peak level above 0.011800 USDT, but was immediately followed by a sharp rejection (rejection/liquidity sweep) with a long upper tail (upper wick).
Trend: The medium-term trend is still bullish (shown by the slope of the Moving Average and the previously green Impulse signal), but the short-term is experiencing a sharp correction (flush out) to cool down the price.
Key Levels:
Main Resistance: 0.009822 USDT and 0.011000 USDT
Nearest Support: 0.009161 USDT (current price)
Demand Zone / Strong Support: 0.007800 USDT – 0.008100 USDT (Moving Average area & former breakout yellow box)
2. Trading Signals & Execution Plan
Currently, the price is in a "no man's land" zone after the spike. Opening a position directly at the current price carries high risk. Use the following pending order scenarios:
Scenario A: Buy / Long on Dip (Main Recommendation)
Entry Zone: 0.007800 USDT – 0.008100 USDT (Wait for a pullback into the MA support area)
Stop Loss (SL): 0.007200 USDT (Below the swing low & supporting MA)
Take Profit (TP):
TP 1: 0.009160 USDT
TP 2: 0.009820 USDT
TP 3: 0.010800 USDT
Risk-to-Reward Ratio (RRR): ~ 1 : 2.5
Scenario B: Short / Sell (Aggressive - Counter-Trend)
Entry Zone: 0.009800 USDT – 0.010000 USDT (If a retest fails to break through resistance)
Stop Loss (SL): 0.010600 USDT
Take Profit (TP):
TP 1: 0.009160 USDT
TP 2: 0.008100 USDT
3. Risk Management
Maximum Leverage: 3x – 5x (because this instrument is extremely volatile).
Capital Risk: Maximum 1%–2% of your total account balance per trade.
Note: Do not panic buy/FOMO while the long red candle is still forming. Let the price stretch and build a new accumulation in the support area before entering a position.
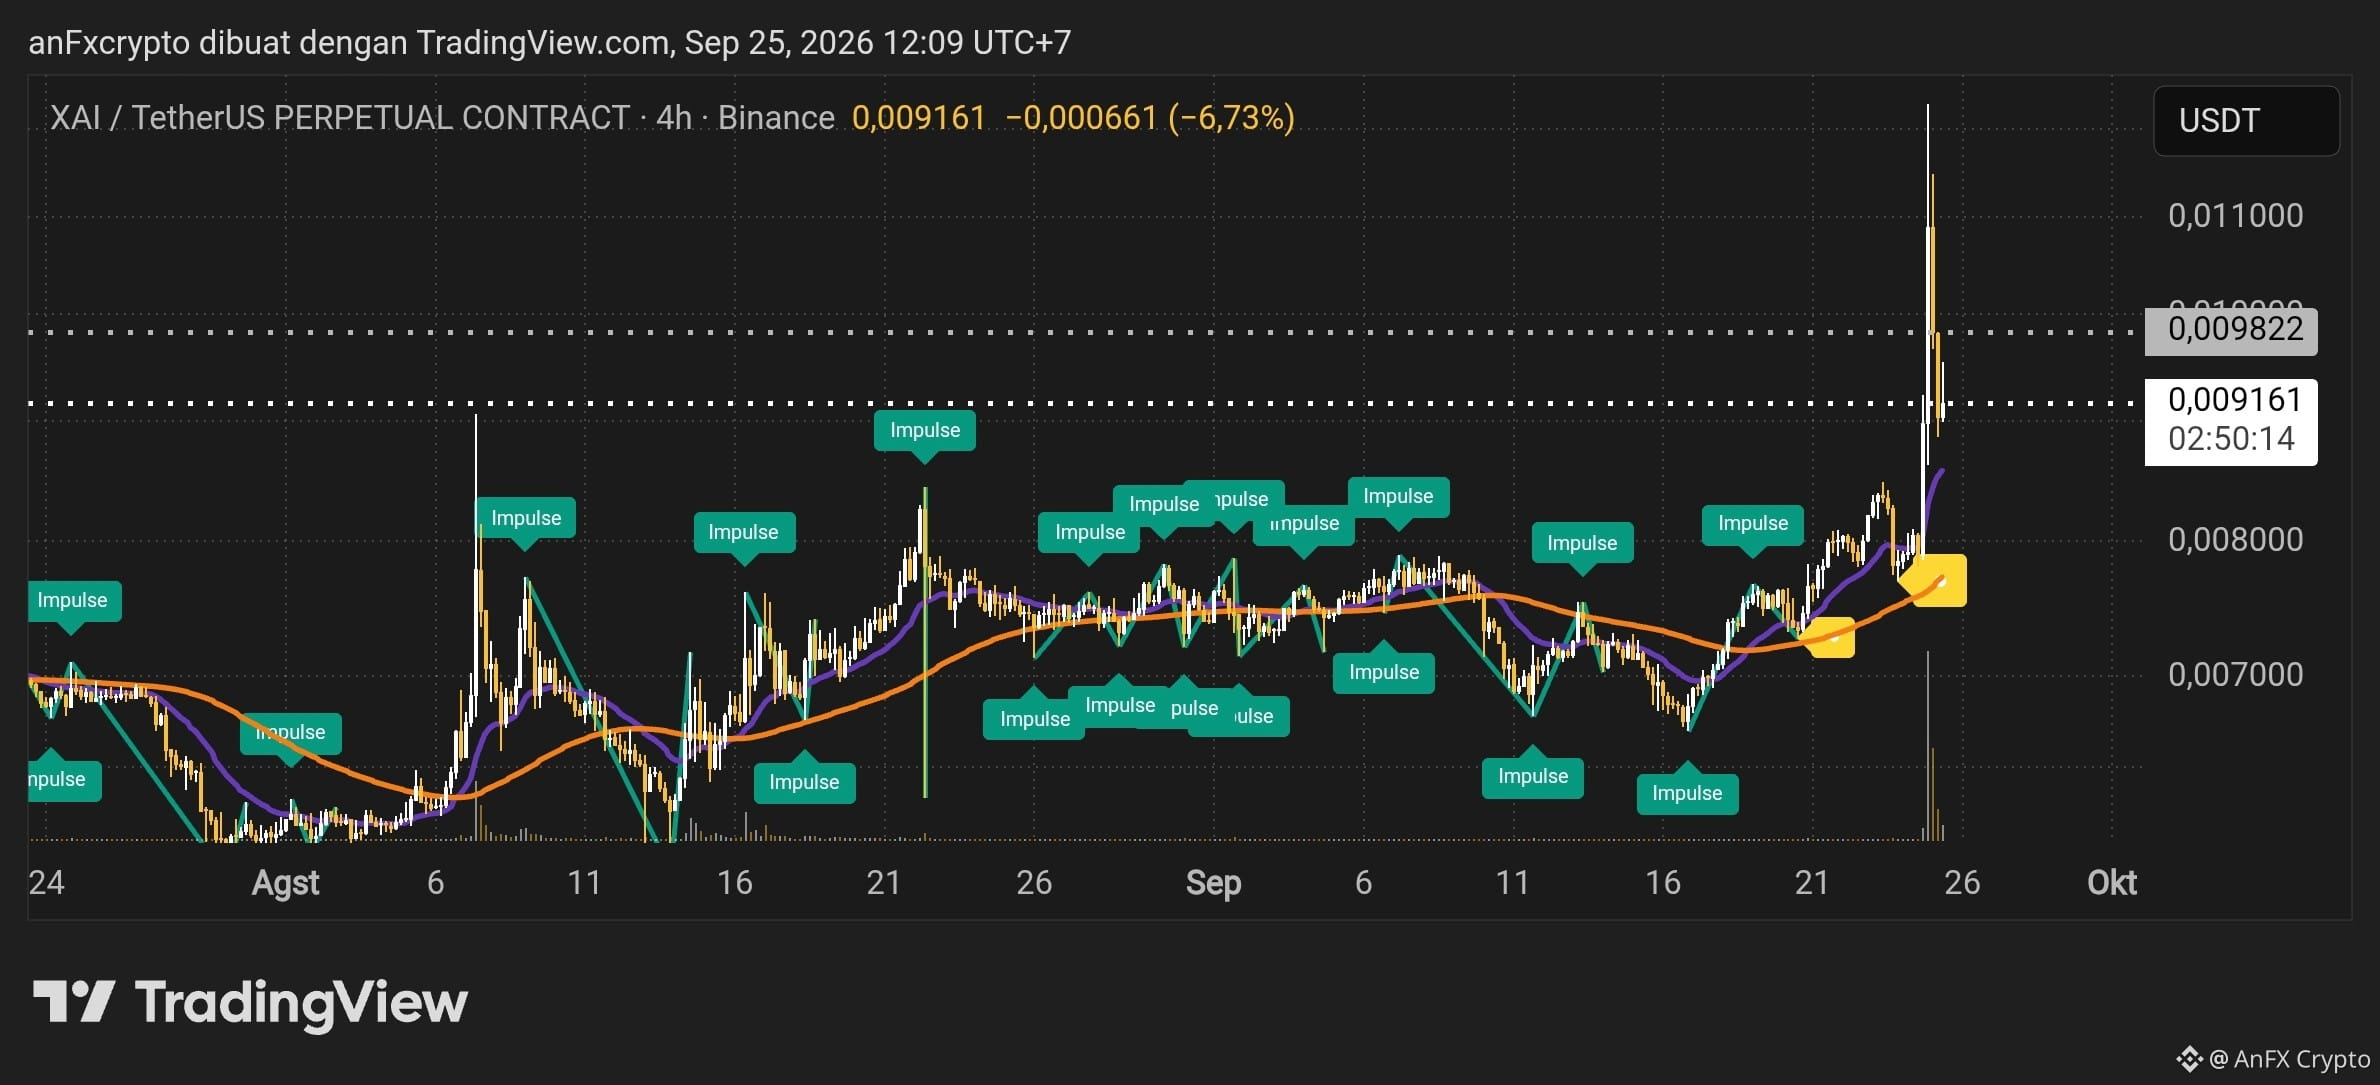
46
·
--
Technical Analysis $ONDO /USDT Perpetual (Timeframe 4H)
Market Condition: Bullish Breakout.
Confirmation: Price successfully broke through a strong horizontal resistance line at the 0.5220 USDT level with a dominant impulse candle and an increase in volume.
Trend Structure: The Moving Average (MA) line is curving upward and the price position is far above the MA line, indicating very strong buyer momentum.
Trading Signal (LONG / BUY)
Entry Area: 0.5200 USDT – 0.5280 USDT (The most ideal option is to wait for a retest to the flip resistance-into-support area at 0.5220 USDT).
Stop Loss (SL): 0.4850 USDT (Below the swing low and the consolidation area before the breakout).
Take Profit (TP):
TP 1: 0.5700 USDT
TP 2: 0.6200 USDT
TP 3: 0.6800 USDT
Risk/Reward Ratio: ~1 : 2.5
Execution Plan & Risk Management
Capital Allocation: Use risk on the position of up to a maximum of 1% – 3% of the total account balance.
Profit Protection: When price reaches TP 1 (0.5700 USDT), close 50% of the position and move the Stop Loss boundary to the Entry point (Break Even / BEP) to lock in risk.
Anticipate False Breakout: If the next 4-hour candle closes successfully below the 0.5200 USDT level with high selling volume, consider exiting earlier.
{future}(ONDOUSDT)
Technical Analysis $ONDO /USDT Perpetual (Timeframe 4H)
Market Condition: Bullish Breakout.
Confirmation: Price successfully broke through a strong horizontal resistance line at the 0.5220 USDT level with a dominant impulse candle and an increase in volume.
Trend Structure: The Moving Average (MA) line is curving upward and the price position is far above the MA line, indicating very strong buyer momentum.
Trading Signal (LONG / BUY)
Entry Area: 0.5200 USDT – 0.5280 USDT (The most ideal option is to wait for a retest to the flip resistance-into-support area at 0.5220 USDT).
Stop Loss (SL): 0.4850 USDT (Below the swing low and the consolidation area before the breakout).
Take Profit (TP):
TP 1: 0.5700 USDT
TP 2: 0.6200 USDT
TP 3: 0.6800 USDT
Risk/Reward Ratio: ~1 : 2.5
Execution Plan & Risk Management
Capital Allocation: Use risk on the position of up to a maximum of 1% – 3% of the total account balance.
Profit Protection: When price reaches TP 1 (0.5700 USDT), close 50% of the position and move the Stop Loss boundary to the Entry point (Break Even / BEP) to lock in risk.
Anticipate False Breakout: If the next 4-hour candle closes successfully below the 0.5200 USDT level with high selling volume, consider exiting earlier.
Market Condition: Bullish Breakout.
Confirmation: Price successfully broke through a strong horizontal resistance line at the 0.5220 USDT level with a dominant impulse candle and an increase in volume.
Trend Structure: The Moving Average (MA) line is curving upward and the price position is far above the MA line, indicating very strong buyer momentum.
Trading Signal (LONG / BUY)
Entry Area: 0.5200 USDT – 0.5280 USDT (The most ideal option is to wait for a retest to the flip resistance-into-support area at 0.5220 USDT).
Stop Loss (SL): 0.4850 USDT (Below the swing low and the consolidation area before the breakout).
Take Profit (TP):
TP 1: 0.5700 USDT
TP 2: 0.6200 USDT
TP 3: 0.6800 USDT
Risk/Reward Ratio: ~1 : 2.5
Execution Plan & Risk Management
Capital Allocation: Use risk on the position of up to a maximum of 1% – 3% of the total account balance.
Profit Protection: When price reaches TP 1 (0.5700 USDT), close 50% of the position and move the Stop Loss boundary to the Entry point (Break Even / BEP) to lock in risk.
Anticipate False Breakout: If the next 4-hour candle closes successfully below the 0.5200 USDT level with high selling volume, consider exiting earlier.
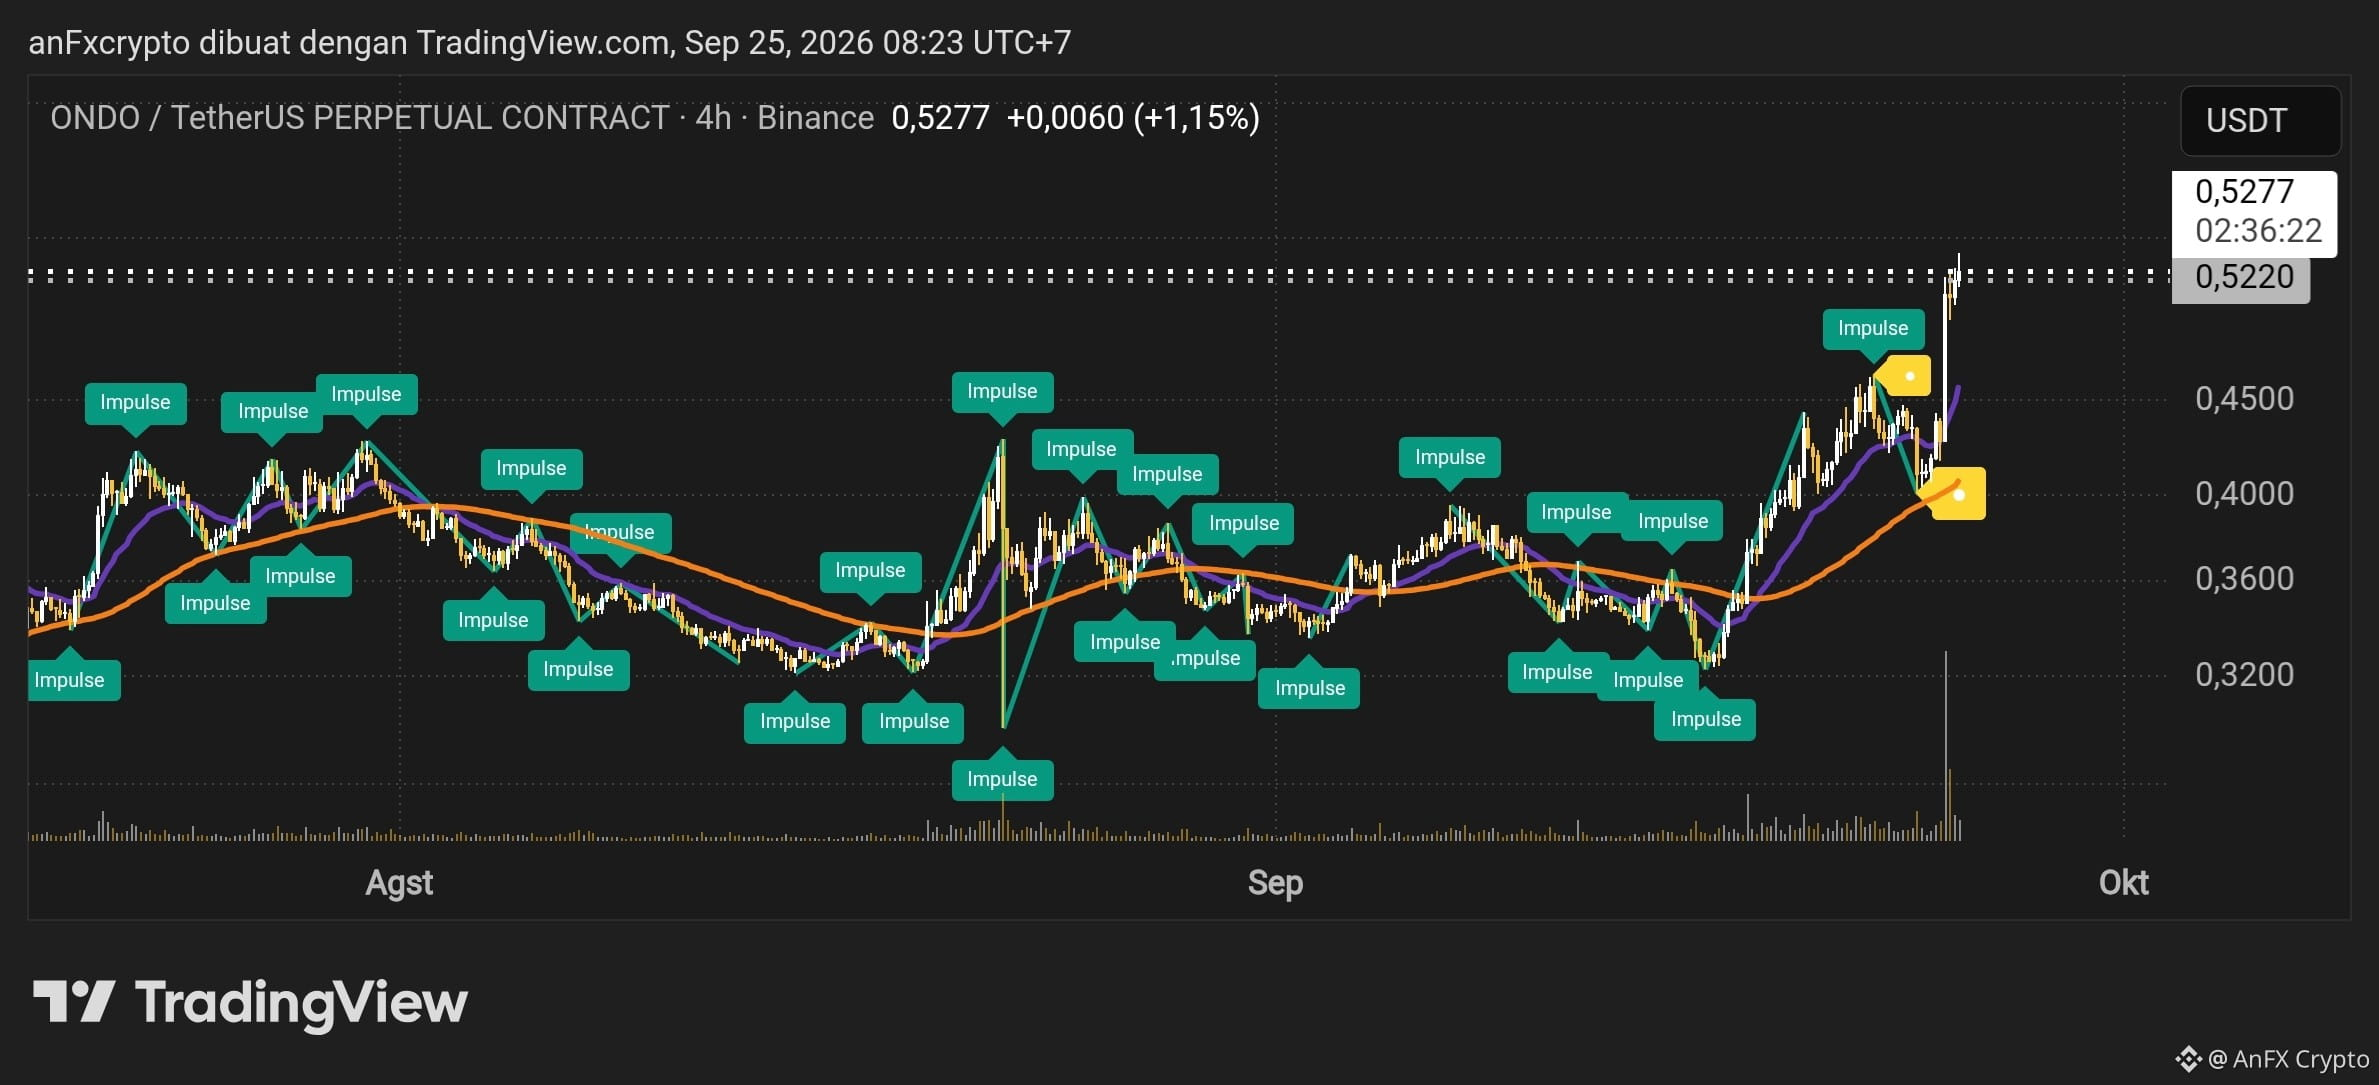
38
·
--
Based on the $XPL /USDT Perpetual Contract (4H Timeframe) chart from Binance in the image, here is an in-depth technical analysis and a trading plan that can be applied.
1. Technical Analysis
Market Structure & Trend: The market is experiencing a very strong bullish impulse breakout. Price has just surged through a crucial resistance area at 0.11078.
Volume: The price increase is accompanied by a significant spike in transaction volume (high volume breakout), confirming buyer dominance.
Moving Average (MA): Current price is far above both the short-term and long-term MAs (purple and orange lines), indicating very strong short-term upward momentum.
Risk Evaluation: Buying (entry) exactly at the running price (0.11417) while the candle is extended chasing the previous swing high (around 0.11500–0.11600) is high-risk for a short correction (pullback). The most rational strategy is Buy on Dip / Retest.
2. Trading Signal (Trading Plan)
Main Strategy: Buy on Retest (Optimal Risk/Reward)
Entry Area (Buy Zone): 0.10800 – 0.11080 (Wait for a correction back to the former resistance area, now acting as support)
Stop Loss (SL): 0.10250 (Placed below the breakout candle structure to limit losses if a fakeout occurs)
Take Profit 1 (TP1): 0.11600 (Retest of the peak resistance)
Take Profit 2 (TP2): 0.12500 (Momentum extension target)
Take Profit 3 (TP3): 0.13800 (Mid-term trend target)
Risk/Reward Ratio: ~ 1 : 2.5
3. Risk Management Guidelines
Close Candle Confirmation: Make sure the current 4H candle closes above 0.11078. If the candle closes below that level, it suggests a potential fakeout / bull trap.
Leverage (Futures): Recommended maximum 3x – 5x considering this coin’s volatility is relatively high.
Risk per Trade: Limit risk to a maximum of 1% – 2% of your total account capital for this trade.
{future}(XPLUSDT)
Based on the $XPL /USDT Perpetual Contract (4H Timeframe) chart from Binance in the image, here is an in-depth technical analysis and a trading plan that can be applied.
1. Technical Analysis
Market Structure & Trend: The market is experiencing a very strong bullish impulse breakout. Price has just surged through a crucial resistance area at 0.11078.
Volume: The price increase is accompanied by a significant spike in transaction volume (high volume breakout), confirming buyer dominance.
Moving Average (MA): Current price is far above both the short-term and long-term MAs (purple and orange lines), indicating very strong short-term upward momentum.
Risk Evaluation: Buying (entry) exactly at the running price (0.11417) while the candle is extended chasing the previous swing high (around 0.11500–0.11600) is high-risk for a short correction (pullback). The most rational strategy is Buy on Dip / Retest.
2. Trading Signal (Trading Plan)
Main Strategy: Buy on Retest (Optimal Risk/Reward)
Entry Area (Buy Zone): 0.10800 – 0.11080 (Wait for a correction back to the former resistance area, now acting as support)
Stop Loss (SL): 0.10250 (Placed below the breakout candle structure to limit losses if a fakeout occurs)
Take Profit 1 (TP1): 0.11600 (Retest of the peak resistance)
Take Profit 2 (TP2): 0.12500 (Momentum extension target)
Take Profit 3 (TP3): 0.13800 (Mid-term trend target)
Risk/Reward Ratio: ~ 1 : 2.5
3. Risk Management Guidelines
Close Candle Confirmation: Make sure the current 4H candle closes above 0.11078. If the candle closes below that level, it suggests a potential fakeout / bull trap.
Leverage (Futures): Recommended maximum 3x – 5x considering this coin’s volatility is relatively high.
Risk per Trade: Limit risk to a maximum of 1% – 2% of your total account capital for this trade.
1. Technical Analysis
Market Structure & Trend: The market is experiencing a very strong bullish impulse breakout. Price has just surged through a crucial resistance area at 0.11078.
Volume: The price increase is accompanied by a significant spike in transaction volume (high volume breakout), confirming buyer dominance.
Moving Average (MA): Current price is far above both the short-term and long-term MAs (purple and orange lines), indicating very strong short-term upward momentum.
Risk Evaluation: Buying (entry) exactly at the running price (0.11417) while the candle is extended chasing the previous swing high (around 0.11500–0.11600) is high-risk for a short correction (pullback). The most rational strategy is Buy on Dip / Retest.
2. Trading Signal (Trading Plan)
Main Strategy: Buy on Retest (Optimal Risk/Reward)
Entry Area (Buy Zone): 0.10800 – 0.11080 (Wait for a correction back to the former resistance area, now acting as support)
Stop Loss (SL): 0.10250 (Placed below the breakout candle structure to limit losses if a fakeout occurs)
Take Profit 1 (TP1): 0.11600 (Retest of the peak resistance)
Take Profit 2 (TP2): 0.12500 (Momentum extension target)
Take Profit 3 (TP3): 0.13800 (Mid-term trend target)
Risk/Reward Ratio: ~ 1 : 2.5
3. Risk Management Guidelines
Close Candle Confirmation: Make sure the current 4H candle closes above 0.11078. If the candle closes below that level, it suggests a potential fakeout / bull trap.
Leverage (Futures): Recommended maximum 3x – 5x considering this coin’s volatility is relatively high.
Risk per Trade: Limit risk to a maximum of 1% – 2% of your total account capital for this trade.
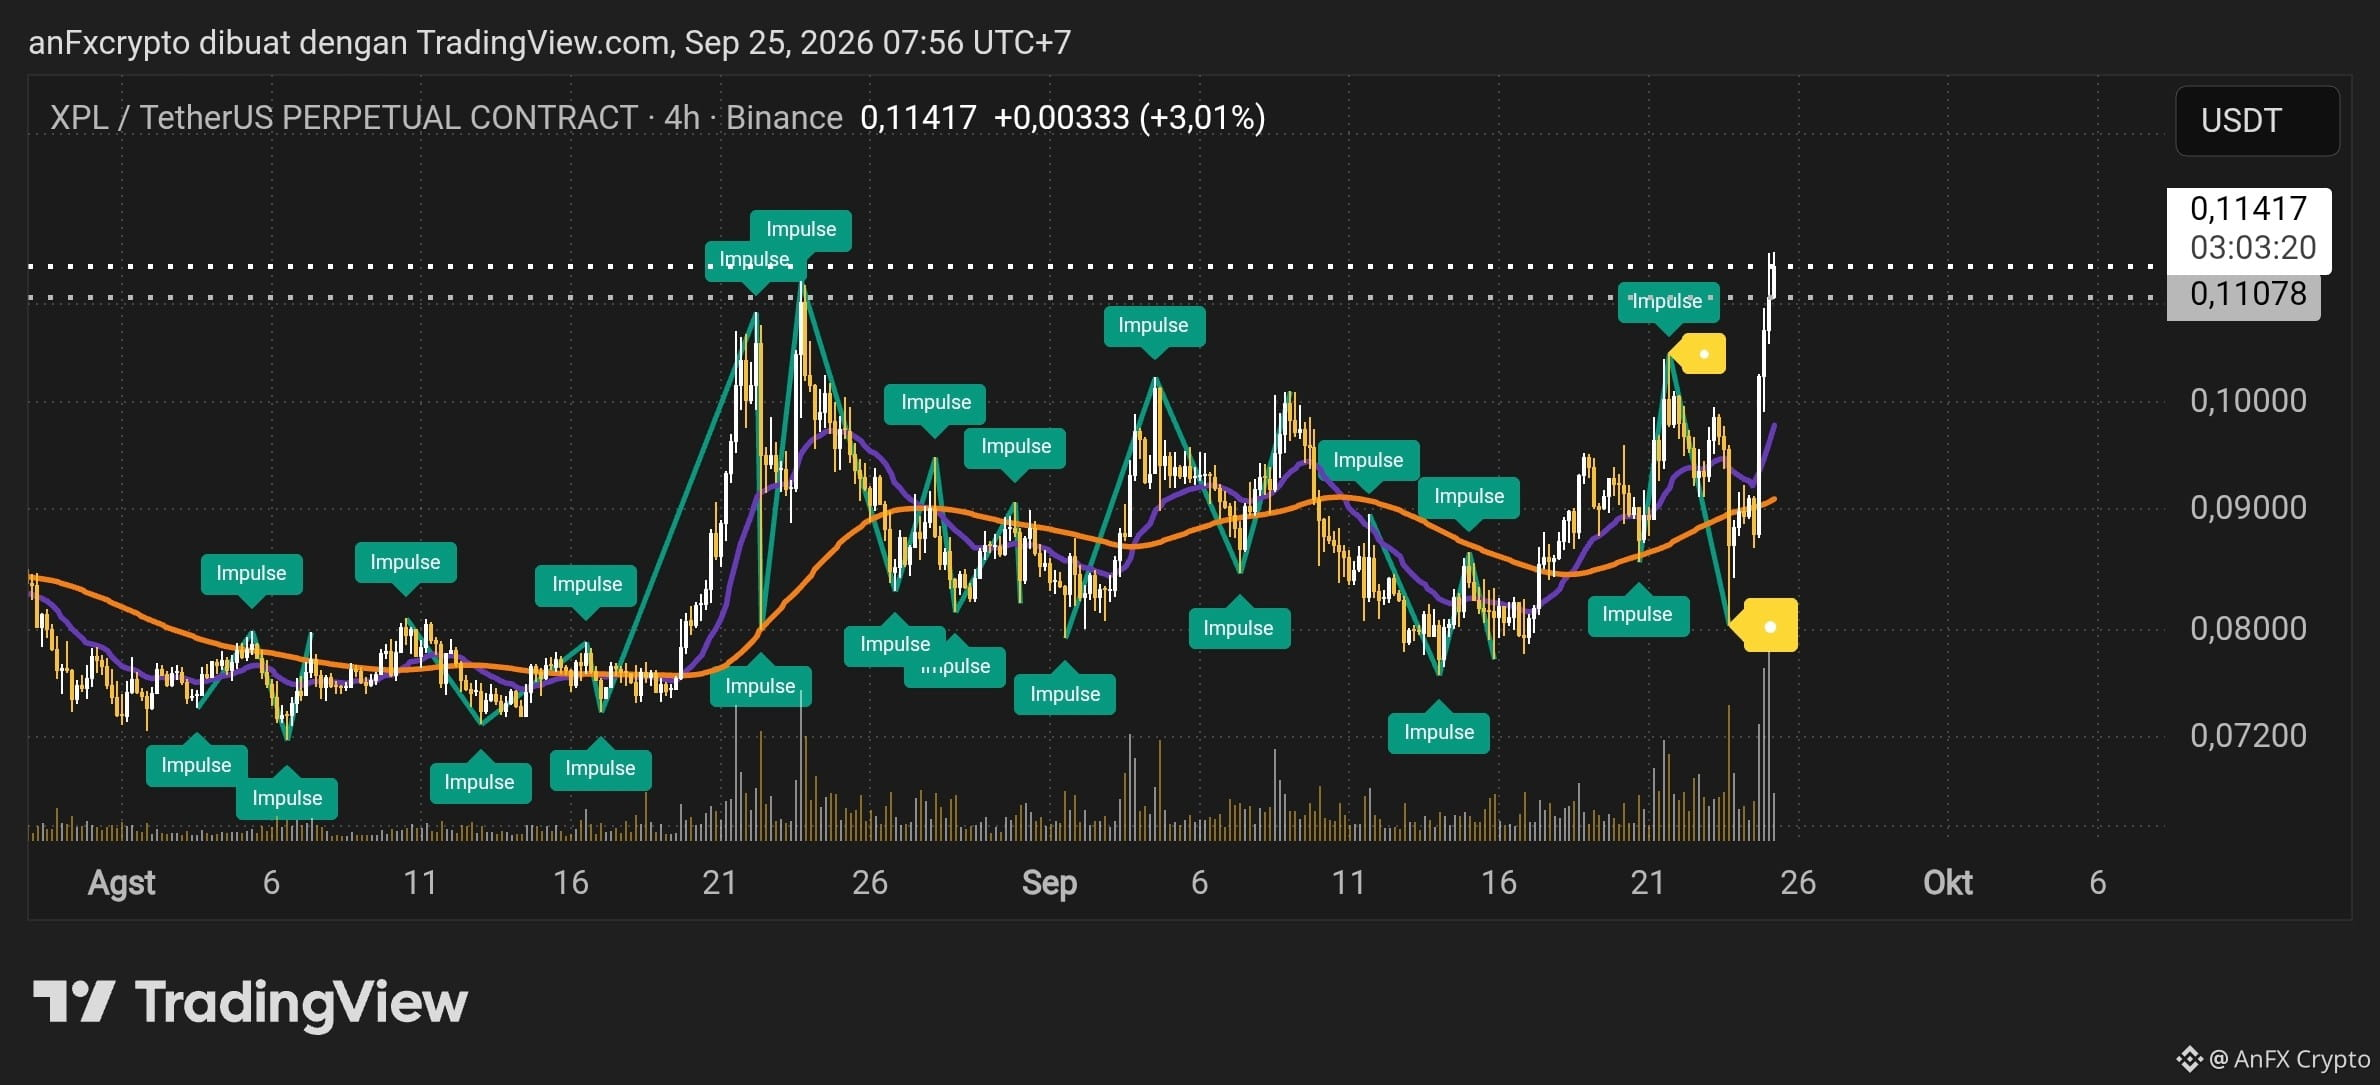
69
·
--
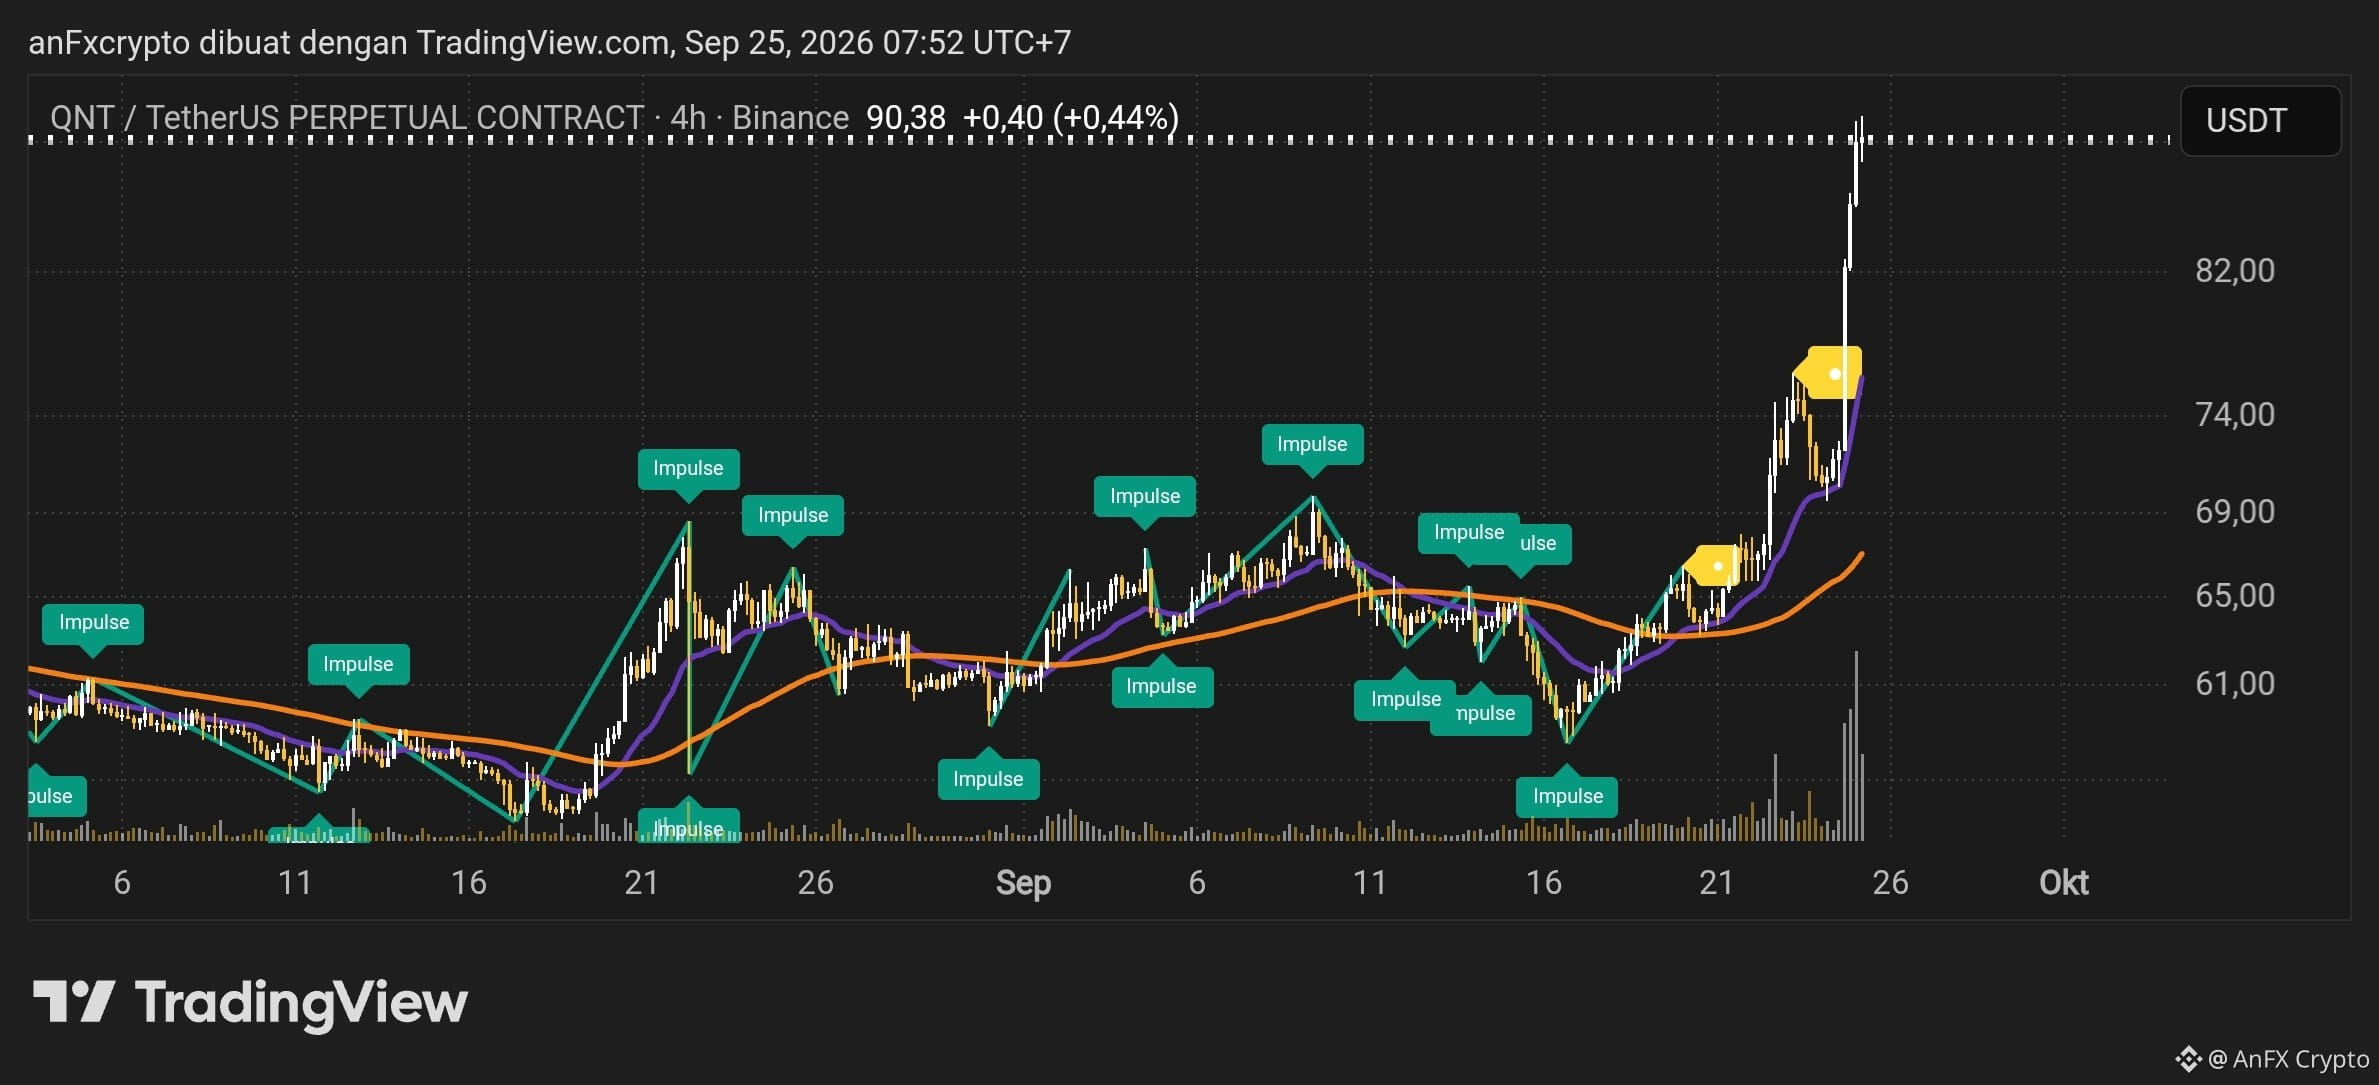
Based on the $QNT /USDT Perpetual chart (4-hour timeframe), here is an in-depth technical analysis and trading scenario options to maintain a healthy Risk-to-Reward (R:R) ratio.
📈 Technical Analysis
Trend Structure & Momentum:
Parabolic Breakout: Price has just experienced a sharp impulsive surge (vertical pump) from the $74 range and broke through the $90.38+ level.
Volume Spike: The transaction volume on the last candlestick surged significantly, confirming a very strong push from buyers.
Overextension of the Moving Average: The distance between the current price and the Moving Average indicators (purple and orange lines) is very far. Statistically, such overextended conditions are often followed by technical correction (mean reversion) or temporary consolidation.
Crucial Areas:
Nearest Resistance: $92.00 – $95.00
Support Retest 1 (Breakout Zone): $80.00 – $82.00
Support Retest 2 (Stronger): $74.00 – $76.00
🎯 Signals & Trading Scenarios
Main Warning: Avoid buying on FOMO right at the peak of a tall green candle. Entering at $90+ without a confirmed pullback is high-risk for liquidation / stop loss if a sudden correction occurs.
Scenario A: Retest Buy / Long (Recommended — Safe Setup)
The best option is to wait for a healthy correction (throwback) into the former resistance area that has now turned into support.
Entry Zone: $80.00 – $82.00 (Wait for a reversal confirmation / pin bar in this area)
Stop Loss (SL): $76.50 (Below the nearest swing low area)
Take Profit (TP):
TP 1: $88.00
TP 2: $92.00
TP 3: $98.00+
Scenario B: Counter-Trend Short / Scalping (High Risk)
Only recommended for experienced traders who can leverage large take-profits by whales / buyers at the peak area.
Entry Zone: $90.50 – $92.00 (If rejection / long upper wick forms)
Stop Loss (SL): $93.80 (Strict discipline required, since the main trend is still very bullish)
Take Profit (TP):
TP 1: $85.00
TP 2: $81.00
🛡️ Risk Management
Max Leverage: 5x – 10x (Given the extremely high volatility).
Position Size: Maximum 2% – 3% of total account equity for this trade.
Based on the $QNT /USDT Perpetual chart (4-hour timeframe), here is an in-depth technical analysis and trading scenario options to maintain a healthy Risk-to-Reward (R:R) ratio.
📈 Technical Analysis
Trend Structure & Momentum:
Parabolic Breakout: Price has just experienced a sharp impulsive surge (vertical pump) from the $74 range and broke through the $90.38+ level.
Volume Spike: The transaction volume on the last candlestick surged significantly, confirming a very strong push from buyers.
Overextension of the Moving Average: The distance between the current price and the Moving Average indicators (purple and orange lines) is very far. Statistically, such overextended conditions are often followed by technical correction (mean reversion) or temporary consolidation.
Crucial Areas:
Nearest Resistance: $92.00 – $95.00
Support Retest 1 (Breakout Zone): $80.00 – $82.00
Support Retest 2 (Stronger): $74.00 – $76.00
🎯 Signals & Trading Scenarios
Main Warning: Avoid buying on FOMO right at the peak of a tall green candle. Entering at $90+ without a confirmed pullback is high-risk for liquidation / stop loss if a sudden correction occurs.
Scenario A: Retest Buy / Long (Recommended — Safe Setup)
The best option is to wait for a healthy correction (throwback) into the former resistance area that has now turned into support.
Entry Zone: $80.00 – $82.00 (Wait for a reversal confirmation / pin bar in this area)
Stop Loss (SL): $76.50 (Below the nearest swing low area)
Take Profit (TP):
TP 1: $88.00
TP 2: $92.00
TP 3: $98.00+
Scenario B: Counter-Trend Short / Scalping (High Risk)
Only recommended for experienced traders who can leverage large take-profits by whales / buyers at the peak area.
Entry Zone: $90.50 – $92.00 (If rejection / long upper wick forms)
Stop Loss (SL): $93.80 (Strict discipline required, since the main trend is still very bullish)
Take Profit (TP):
TP 1: $85.00
TP 2: $81.00
🛡️ Risk Management
Max Leverage: 5x – 10x (Given the extremely high volatility).
Position Size: Maximum 2% – 3% of total account equity for this trade.
📈 Technical Analysis
Trend Structure & Momentum:
Parabolic Breakout: Price has just experienced a sharp impulsive surge (vertical pump) from the $74 range and broke through the $90.38+ level.
Volume Spike: The transaction volume on the last candlestick surged significantly, confirming a very strong push from buyers.
Overextension of the Moving Average: The distance between the current price and the Moving Average indicators (purple and orange lines) is very far. Statistically, such overextended conditions are often followed by technical correction (mean reversion) or temporary consolidation.
Crucial Areas:
Nearest Resistance: $92.00 – $95.00
Support Retest 1 (Breakout Zone): $80.00 – $82.00
Support Retest 2 (Stronger): $74.00 – $76.00
🎯 Signals & Trading Scenarios
Main Warning: Avoid buying on FOMO right at the peak of a tall green candle. Entering at $90+ without a confirmed pullback is high-risk for liquidation / stop loss if a sudden correction occurs.
Scenario A: Retest Buy / Long (Recommended — Safe Setup)
The best option is to wait for a healthy correction (throwback) into the former resistance area that has now turned into support.
Entry Zone: $80.00 – $82.00 (Wait for a reversal confirmation / pin bar in this area)
Stop Loss (SL): $76.50 (Below the nearest swing low area)
Take Profit (TP):
TP 1: $88.00
TP 2: $92.00
TP 3: $98.00+
Scenario B: Counter-Trend Short / Scalping (High Risk)
Only recommended for experienced traders who can leverage large take-profits by whales / buyers at the peak area.
Entry Zone: $90.50 – $92.00 (If rejection / long upper wick forms)
Stop Loss (SL): $93.80 (Strict discipline required, since the main trend is still very bullish)
Take Profit (TP):
TP 1: $85.00
TP 2: $81.00
🛡️ Risk Management
Max Leverage: 5x – 10x (Given the extremely high volatility).
Position Size: Maximum 2% – 3% of total account equity for this trade.
83
·
--
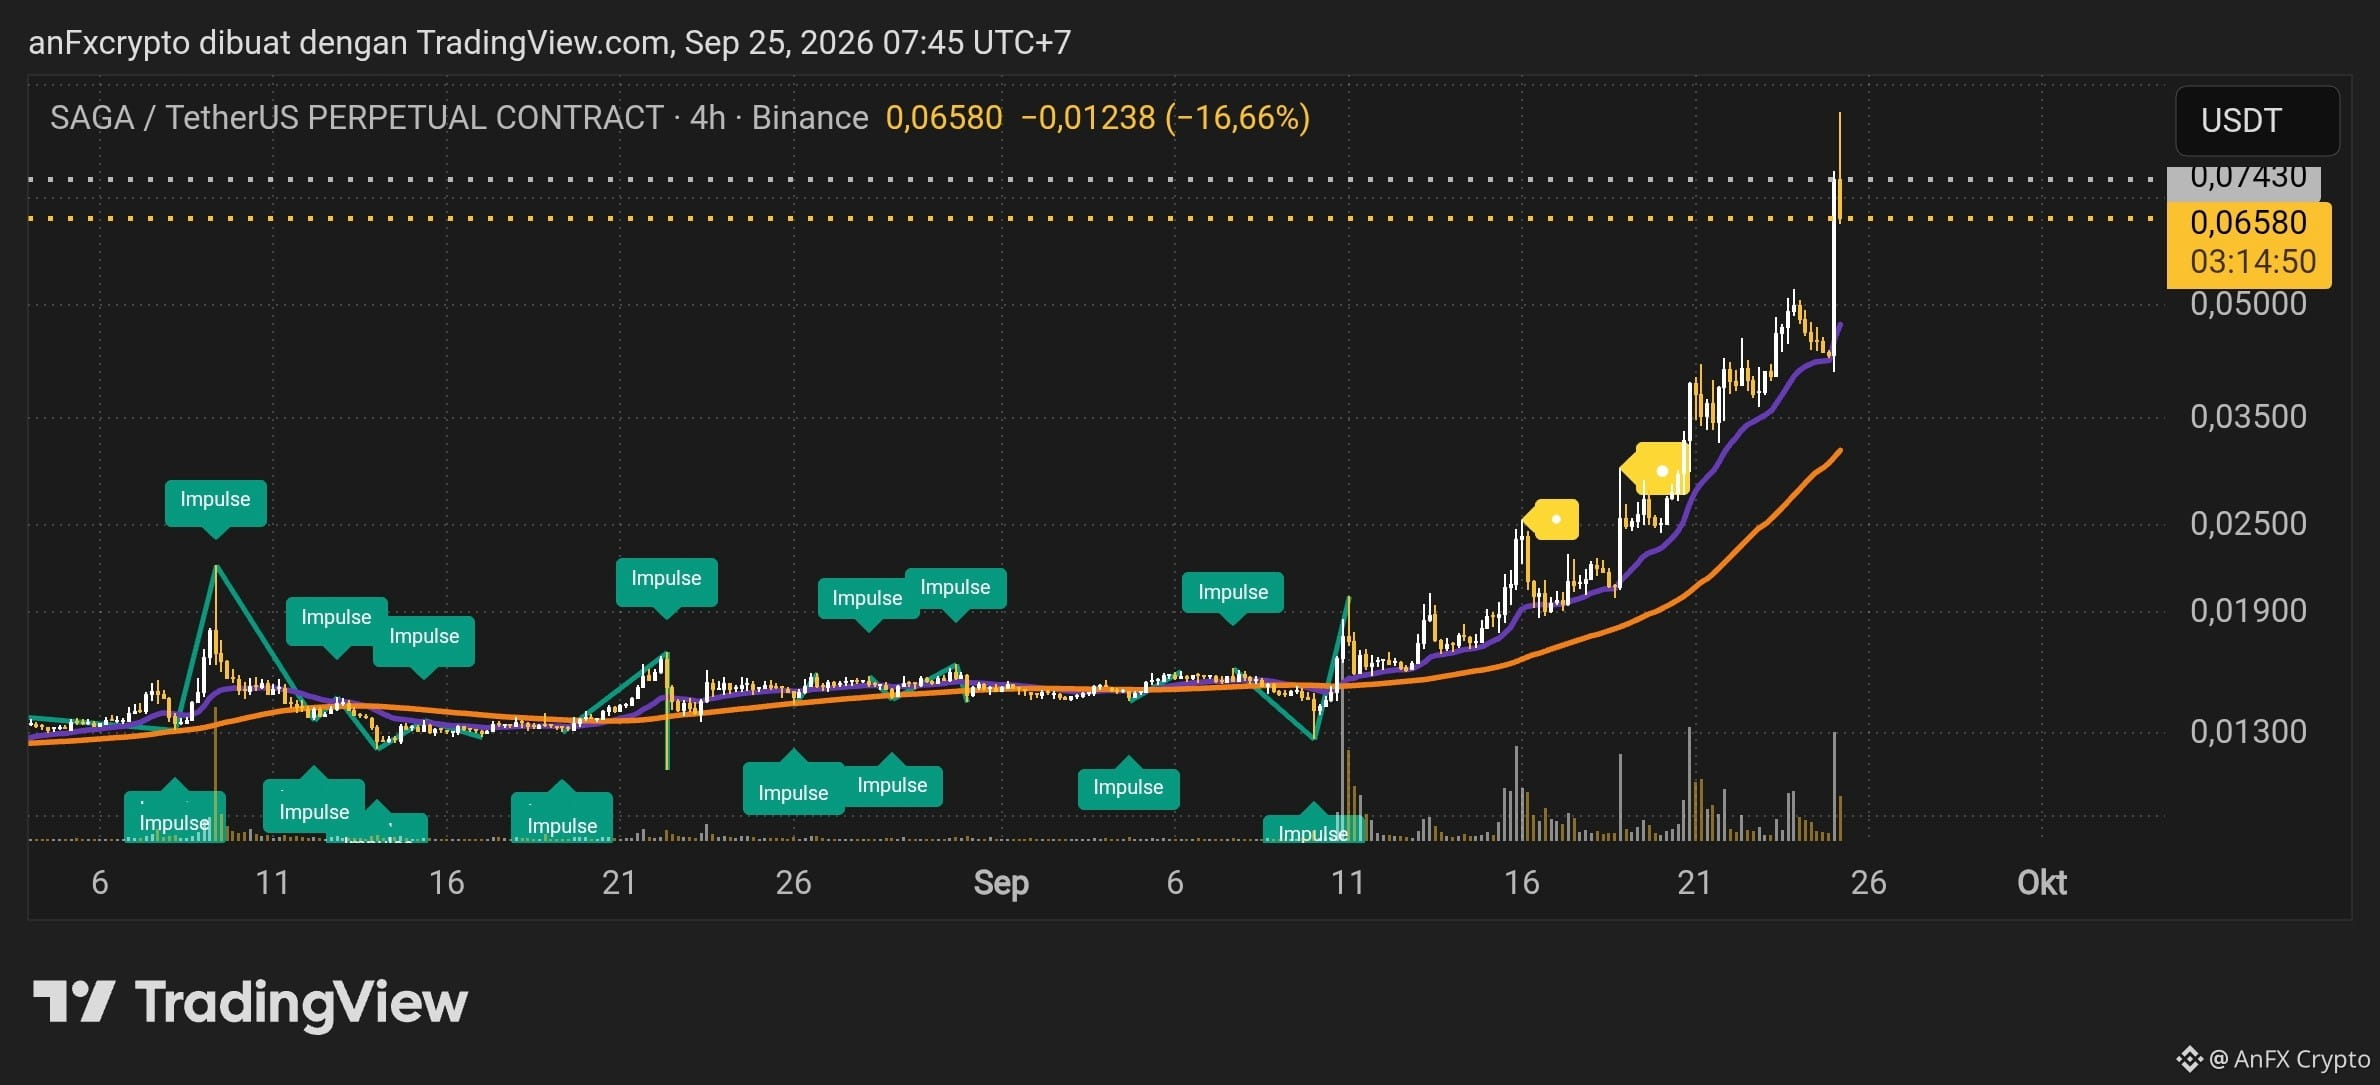
Technical Analysis: $SAGA /USDT Perpetual (Timeframe 4H)
Price Action & Trend Structure: SAGA has just experienced a parabolic pump from a consolidation area (~0.01300–0.02500) all the way through and breaking the high wick at 0.07430. However, the latest 4-hour candle formed a long upper shadow (very long upper tail) with a sharp drop to 0.06580 (-16.66%). This suggests massive profit-taking and the potential for a liquidity sweep / fakeout in the peak area.
Moving Average Conditions: The current price is highly overextended (too far deviated) above the Moving Average lines (purple & orange). Technically, this condition is prone to mean reversion or a healthy pullback toward the MA area before continuing the trend.
Key Levels:
Main Resistance: 0,07430 (Top Wick / Local All-Time High)
Nearest Resistance: 0,06800 – 0,07000
Nearest Support: 0,04800 – 0,05200 (Base before the spike)
Major Support: 0,03800 – 0,04200 (Dynamic Support MA zone)
Trading Signals (Trading Setup)
Volatility Warning: The asset is in a phase of very high volatility. Avoid FOMO market orders without a measured plan.
1. Long Setup (Buy on Retest) — Main Recommendation (Safer)
Wait for a controlled correction into the demand area before entering a long position:
Entry Zone: 0,04800 – 0,05200
Take Profit 1 (TP1): 0,06000
Take Profit 2 (TP2): 0,06800
Stop Loss (SL): 0,04350 (Below the local support area)
Risk/Reward Ratio: ~1 : 2.2
2. Short Setup (Counter-Trend Momentum) — High Risk / Aggressive
Take advantage of the correction momentum after the sharp rejection at the top:
Entry Zone: 0,06580 – 0,06800
Take Profit 1 (TP1): 0,05500
Take Profit 2 (TP2): 0,04800
Stop Loss (SL): 0,07480 (Above the peak high needle)
Risk/Reward Ratio: ~1 : 1.9
{future}(SAGAUSDT)
Technical Analysis: $SAGA /USDT Perpetual (Timeframe 4H)
Price Action & Trend Structure: SAGA has just experienced a parabolic pump from a consolidation area (~0.01300–0.02500) all the way through and breaking the high wick at 0.07430. However, the latest 4-hour candle formed a long upper shadow (very long upper tail) with a sharp drop to 0.06580 (-16.66%). This suggests massive profit-taking and the potential for a liquidity sweep / fakeout in the peak area.
Moving Average Conditions: The current price is highly overextended (too far deviated) above the Moving Average lines (purple & orange). Technically, this condition is prone to mean reversion or a healthy pullback toward the MA area before continuing the trend.
Key Levels:
Main Resistance: 0,07430 (Top Wick / Local All-Time High)
Nearest Resistance: 0,06800 – 0,07000
Nearest Support: 0,04800 – 0,05200 (Base before the spike)
Major Support: 0,03800 – 0,04200 (Dynamic Support MA zone)
Trading Signals (Trading Setup)
Volatility Warning: The asset is in a phase of very high volatility. Avoid FOMO market orders without a measured plan.
1. Long Setup (Buy on Retest) — Main Recommendation (Safer)
Wait for a controlled correction into the demand area before entering a long position:
Entry Zone: 0,04800 – 0,05200
Take Profit 1 (TP1): 0,06000
Take Profit 2 (TP2): 0,06800
Stop Loss (SL): 0,04350 (Below the local support area)
Risk/Reward Ratio: ~1 : 2.2
2. Short Setup (Counter-Trend Momentum) — High Risk / Aggressive
Take advantage of the correction momentum after the sharp rejection at the top:
Entry Zone: 0,06580 – 0,06800
Take Profit 1 (TP1): 0,05500
Take Profit 2 (TP2): 0,04800
Stop Loss (SL): 0,07480 (Above the peak high needle)
Risk/Reward Ratio: ~1 : 1.9
Price Action & Trend Structure: SAGA has just experienced a parabolic pump from a consolidation area (~0.01300–0.02500) all the way through and breaking the high wick at 0.07430. However, the latest 4-hour candle formed a long upper shadow (very long upper tail) with a sharp drop to 0.06580 (-16.66%). This suggests massive profit-taking and the potential for a liquidity sweep / fakeout in the peak area.
Moving Average Conditions: The current price is highly overextended (too far deviated) above the Moving Average lines (purple & orange). Technically, this condition is prone to mean reversion or a healthy pullback toward the MA area before continuing the trend.
Key Levels:
Main Resistance: 0,07430 (Top Wick / Local All-Time High)
Nearest Resistance: 0,06800 – 0,07000
Nearest Support: 0,04800 – 0,05200 (Base before the spike)
Major Support: 0,03800 – 0,04200 (Dynamic Support MA zone)
Trading Signals (Trading Setup)
Volatility Warning: The asset is in a phase of very high volatility. Avoid FOMO market orders without a measured plan.
1. Long Setup (Buy on Retest) — Main Recommendation (Safer)
Wait for a controlled correction into the demand area before entering a long position:
Entry Zone: 0,04800 – 0,05200
Take Profit 1 (TP1): 0,06000
Take Profit 2 (TP2): 0,06800
Stop Loss (SL): 0,04350 (Below the local support area)
Risk/Reward Ratio: ~1 : 2.2
2. Short Setup (Counter-Trend Momentum) — High Risk / Aggressive
Take advantage of the correction momentum after the sharp rejection at the top:
Entry Zone: 0,06580 – 0,06800
Take Profit 1 (TP1): 0,05500
Take Profit 2 (TP2): 0,04800
Stop Loss (SL): 0,07480 (Above the peak high needle)
Risk/Reward Ratio: ~1 : 1.9
336
·
--
Based on the technical chart $ZETA / TetherUS PERPETUAL CONTRACT (Timeframe 4-Hour / 4H), the following is a professional technical analysis along with suggested trading signal setups:
Technical Analysis of the Market
Trend Structure & Movement Pattern (Market Structure):
Bullish Impulse: A very strong bullish impulsive move is visible, rising sharply from the $0.03500 range to touch a local peak at $0.08036, supported by a significant spike in buy volume.
Healthy Pullback: After reaching the high, the price experienced a gradual decline (pullback) with volume tending to decrease. This suggests the drop is a technical correction and reasonable profit-taking, not panic selling.
Key Support Area ($0.05014): The current price ($0.05124) is being held and is consolidating just above the horizontal support line at $0.05014, while trading above the Moving Average (purple line).
Risk-to-Reward Ratio (RRR):
The Long projection setup on the chart indicates a potential upside of +55.26% toward the previous peak ($0.08036), with a measured loss level at $0.04378.
The RRR is around ~1 : 3.8, which is considered excellent for a professional risk-management strategy.
Trading Signal: LONG / BUY SETUP
Trade Direction: Long (Futures / Spot)
Entry Zone: $0.05000 – $0.05150 (Buy near the retest area of support)
Stop Loss (SL): $0.04378 (Placed below the swing low and the Orange MA line to limit downside risk to approximately ~13-14%)
Take Profit (TP) Targets:
TP 1 (Conservative): $0.06000 (Secures part of the profit near the closest resistance level)
TP 2 (Moderate): $0.07000 (Trend recovery area)
TP 3 (Main Target): $0.08036 (Retest of the previous peak / +55.26% upside)
{future}(ZETAUSDT)
Based on the technical chart $ZETA / TetherUS PERPETUAL CONTRACT (Timeframe 4-Hour / 4H), the following is a professional technical analysis along with suggested trading signal setups:
Technical Analysis of the Market
Trend Structure & Movement Pattern (Market Structure):
Bullish Impulse: A very strong bullish impulsive move is visible, rising sharply from the $0.03500 range to touch a local peak at $0.08036, supported by a significant spike in buy volume.
Healthy Pullback: After reaching the high, the price experienced a gradual decline (pullback) with volume tending to decrease. This suggests the drop is a technical correction and reasonable profit-taking, not panic selling.
Key Support Area ($0.05014): The current price ($0.05124) is being held and is consolidating just above the horizontal support line at $0.05014, while trading above the Moving Average (purple line).
Risk-to-Reward Ratio (RRR):
The Long projection setup on the chart indicates a potential upside of +55.26% toward the previous peak ($0.08036), with a measured loss level at $0.04378.
The RRR is around ~1 : 3.8, which is considered excellent for a professional risk-management strategy.
Trading Signal: LONG / BUY SETUP
Trade Direction: Long (Futures / Spot)
Entry Zone: $0.05000 – $0.05150 (Buy near the retest area of support)
Stop Loss (SL): $0.04378 (Placed below the swing low and the Orange MA line to limit downside risk to approximately ~13-14%)
Take Profit (TP) Targets:
TP 1 (Conservative): $0.06000 (Secures part of the profit near the closest resistance level)
TP 2 (Moderate): $0.07000 (Trend recovery area)
TP 3 (Main Target): $0.08036 (Retest of the previous peak / +55.26% upside)
Technical Analysis of the Market
Trend Structure & Movement Pattern (Market Structure):
Bullish Impulse: A very strong bullish impulsive move is visible, rising sharply from the $0.03500 range to touch a local peak at $0.08036, supported by a significant spike in buy volume.
Healthy Pullback: After reaching the high, the price experienced a gradual decline (pullback) with volume tending to decrease. This suggests the drop is a technical correction and reasonable profit-taking, not panic selling.
Key Support Area ($0.05014): The current price ($0.05124) is being held and is consolidating just above the horizontal support line at $0.05014, while trading above the Moving Average (purple line).
Risk-to-Reward Ratio (RRR):
The Long projection setup on the chart indicates a potential upside of +55.26% toward the previous peak ($0.08036), with a measured loss level at $0.04378.
The RRR is around ~1 : 3.8, which is considered excellent for a professional risk-management strategy.
Trading Signal: LONG / BUY SETUP
Trade Direction: Long (Futures / Spot)
Entry Zone: $0.05000 – $0.05150 (Buy near the retest area of support)
Stop Loss (SL): $0.04378 (Placed below the swing low and the Orange MA line to limit downside risk to approximately ~13-14%)
Take Profit (TP) Targets:
TP 1 (Conservative): $0.06000 (Secures part of the profit near the closest resistance level)
TP 2 (Moderate): $0.07000 (Trend recovery area)
TP 3 (Main Target): $0.08036 (Retest of the previous peak / +55.26% upside)
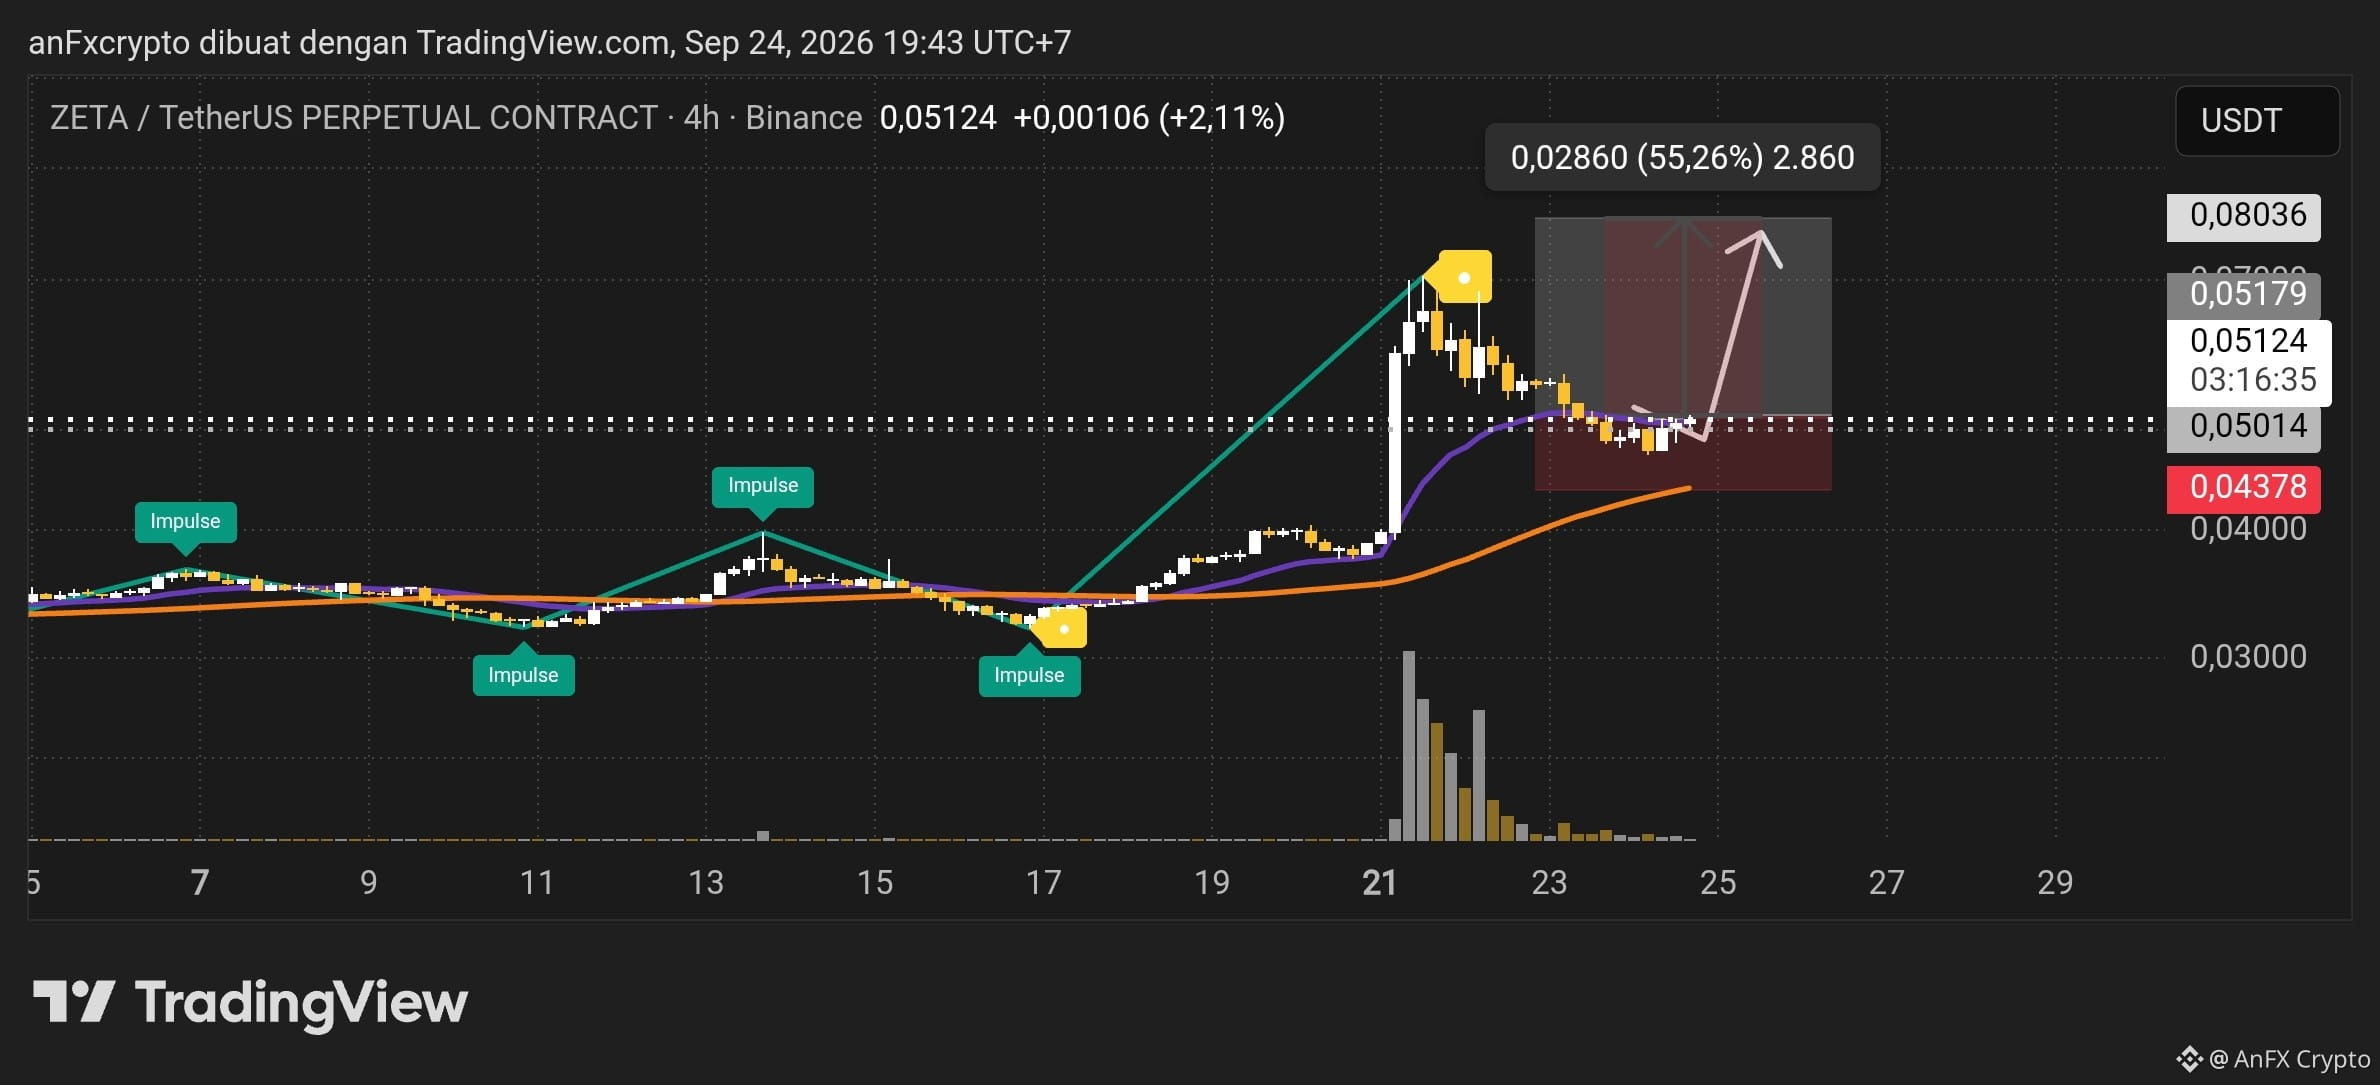
15
·
--
Based on the $INIT /USDT Perpetual chart (Timeframe 4H), the following is an in-depth technical analysis along with a trading plan (signal setup):
1. Market Structure & Trend Analysis
Main Trend (4H): Strong Bullish. Price action consistently forms Higher Highs (HH) and Higher Lows (HL).
Breakout Resistance: Price has just made an impulsive breakout (bullish breakout) above the key resistance area of 0.08893 and is currently trading around 0.09468.
Moving Averages (EMA): The short-term (purple) and mid-term (orange) EMA lines are curving upward, with price positioned well above both lines, confirming that buyer momentum (bulls) is still highly dominant.
Execution Note: Since price is currently at the peak of the impulsive rally, an immediate entry (FOMO) carries a less-than-ideal risk-to-reward. The best approach is to pursue a Retest / Buy on Dip strategy.
2. Signal & Trading Plan (INIT/USDT - LONG)
Strategy Type: Buy on Pullback / Retest
Entry Area (Limit Order): 0.0890 – 0.0910 (Wait for a healthy correction into the former resistance area, which is now support)
Stop Loss (SL): 0.0835 (Below the last swing low structure and the EMA support)
Take Profit (TP):
TP 1: 0.0985 (Partial take profit 30–50% & move SL to BEP/Entry)
TP 2: 0.1050 (Psychological level & upside extension)
TP 3: 0.1150 (Let profits run for the continued trend)
3. Risk Management & Professional Notes
Risk per Trade: Maximum 1% – 2% of the total trading account capital.
Entry Confirmation: Watch for the formation of an upside-reversal candle (bullish rejection/pin bar) on the 1H or 15M timeframe when price enters the retest area 0.0890–0.0910 before opening the position.
SL Discipline: If the 4H candle closes convincingly below 0.0835, the bullish scenario is invalidated. Regardless of market conditions, always follow the Stop Loss to protect your capital.
{future}(INITUSDT)
Based on the $INIT /USDT Perpetual chart (Timeframe 4H), the following is an in-depth technical analysis along with a trading plan (signal setup):
1. Market Structure & Trend Analysis
Main Trend (4H): Strong Bullish. Price action consistently forms Higher Highs (HH) and Higher Lows (HL).
Breakout Resistance: Price has just made an impulsive breakout (bullish breakout) above the key resistance area of 0.08893 and is currently trading around 0.09468.
Moving Averages (EMA): The short-term (purple) and mid-term (orange) EMA lines are curving upward, with price positioned well above both lines, confirming that buyer momentum (bulls) is still highly dominant.
Execution Note: Since price is currently at the peak of the impulsive rally, an immediate entry (FOMO) carries a less-than-ideal risk-to-reward. The best approach is to pursue a Retest / Buy on Dip strategy.
2. Signal & Trading Plan (INIT/USDT - LONG)
Strategy Type: Buy on Pullback / Retest
Entry Area (Limit Order): 0.0890 – 0.0910 (Wait for a healthy correction into the former resistance area, which is now support)
Stop Loss (SL): 0.0835 (Below the last swing low structure and the EMA support)
Take Profit (TP):
TP 1: 0.0985 (Partial take profit 30–50% & move SL to BEP/Entry)
TP 2: 0.1050 (Psychological level & upside extension)
TP 3: 0.1150 (Let profits run for the continued trend)
3. Risk Management & Professional Notes
Risk per Trade: Maximum 1% – 2% of the total trading account capital.
Entry Confirmation: Watch for the formation of an upside-reversal candle (bullish rejection/pin bar) on the 1H or 15M timeframe when price enters the retest area 0.0890–0.0910 before opening the position.
SL Discipline: If the 4H candle closes convincingly below 0.0835, the bullish scenario is invalidated. Regardless of market conditions, always follow the Stop Loss to protect your capital.
1. Market Structure & Trend Analysis
Main Trend (4H): Strong Bullish. Price action consistently forms Higher Highs (HH) and Higher Lows (HL).
Breakout Resistance: Price has just made an impulsive breakout (bullish breakout) above the key resistance area of 0.08893 and is currently trading around 0.09468.
Moving Averages (EMA): The short-term (purple) and mid-term (orange) EMA lines are curving upward, with price positioned well above both lines, confirming that buyer momentum (bulls) is still highly dominant.
Execution Note: Since price is currently at the peak of the impulsive rally, an immediate entry (FOMO) carries a less-than-ideal risk-to-reward. The best approach is to pursue a Retest / Buy on Dip strategy.
2. Signal & Trading Plan (INIT/USDT - LONG)
Strategy Type: Buy on Pullback / Retest
Entry Area (Limit Order): 0.0890 – 0.0910 (Wait for a healthy correction into the former resistance area, which is now support)
Stop Loss (SL): 0.0835 (Below the last swing low structure and the EMA support)
Take Profit (TP):
TP 1: 0.0985 (Partial take profit 30–50% & move SL to BEP/Entry)
TP 2: 0.1050 (Psychological level & upside extension)
TP 3: 0.1150 (Let profits run for the continued trend)
3. Risk Management & Professional Notes
Risk per Trade: Maximum 1% – 2% of the total trading account capital.
Entry Confirmation: Watch for the formation of an upside-reversal candle (bullish rejection/pin bar) on the 1H or 15M timeframe when price enters the retest area 0.0890–0.0910 before opening the position.
SL Discipline: If the 4H candle closes convincingly below 0.0835, the bullish scenario is invalidated. Regardless of market conditions, always follow the Stop Loss to protect your capital.
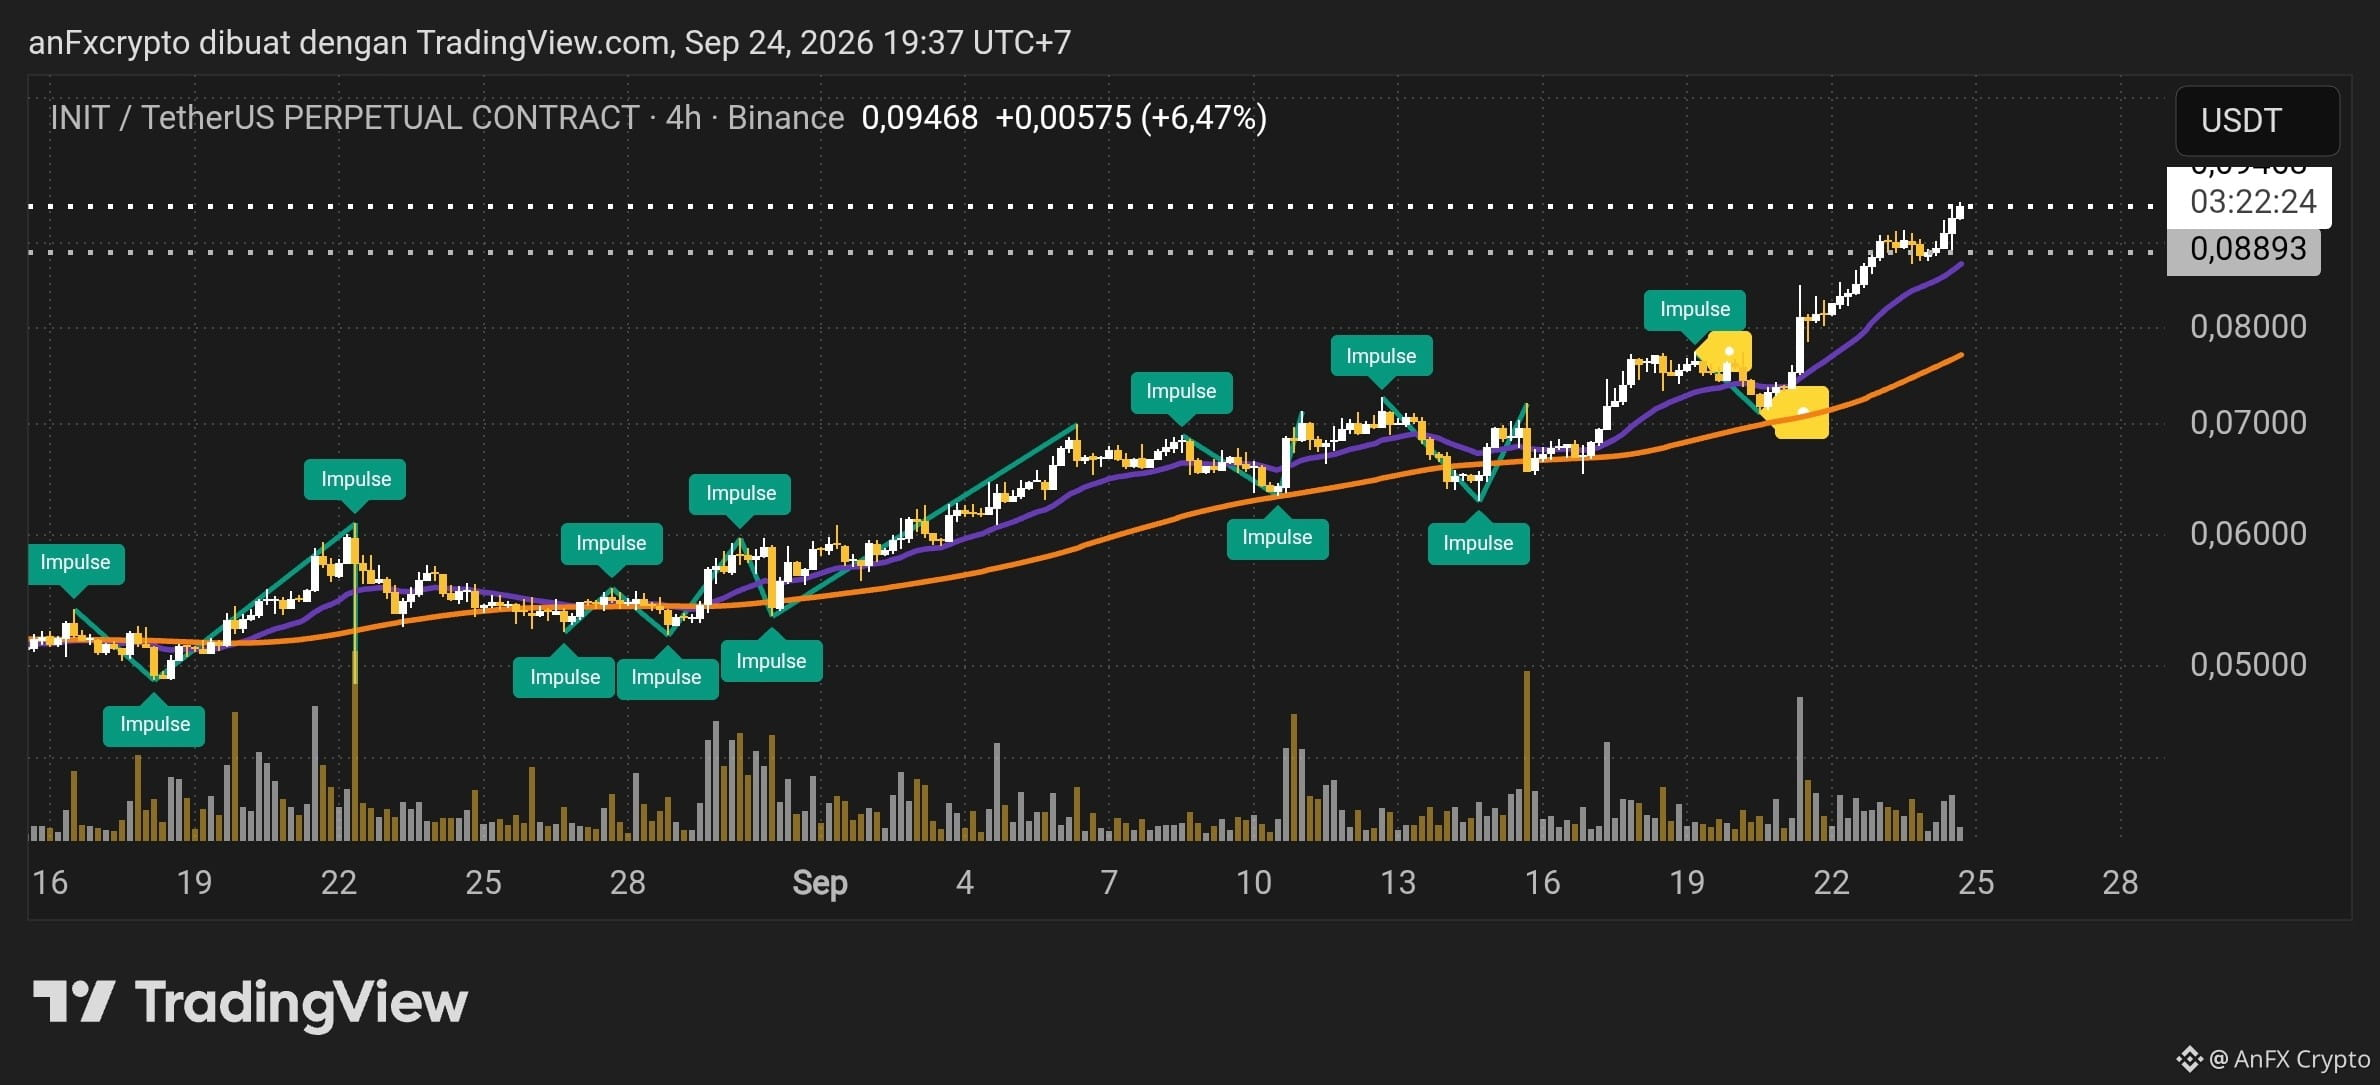
9
·
--
Below is a professional technical analysis and a trading plan (trading setup) for the $HYPE /USDT pair (4-H)
1. Market Structure Analysis & Trend
Main Trend (Major Trend): Bullish. The chart shows a solid rising structure (higher highs & higher lows) from the $68,000 level up to near $100,000.
Short-Term Condition: Healthy Correction / Pullback. After touching the peak area around $98,000, price experienced rejection and dropped by -3.04% toward the $91,174 range.
Moving Average (MA) Indicators:
Current price is breaking below the short-term MA (purple line) at around ~$93,000, indicating temporary selling pressure.
The medium/long-term MA (orange line) in the range of $81,000 – $82,000 is still trending upward and acts as a Dynamic Major Support.
2. Key Levels
Main Resistance: $94,024 & $98,000 – $100,000 (Supply Area / Local High)
Nearest Support: $91,000 – $91,200 (Current horizontal retest area)
Major Support / Demand Zone: $80,000 – $82,000 (A strong defense layer around the orange MA)
3. Trading Signal Plan (Trading Setup)
Since the main trend is still Bullish, the best strategy is to take advantage of the correction momentum to look for a Long / Buy area.
Scenario A: Buy the Dip / Aggressive (Utilize Local Support)
Trading Direction: LONG / BUY
Entry Area: $90,000 – $91,200 (You can wait for the formation of a rejection candle/bullish pin bar on the 1H/4H timeframe)
Take Profit 1 (TP1): $94,000
Take Profit 2 (TP2): $98,000
Take Profit 3 (TP3): $100,000
Stop Loss (SL): $87,800 (If price breaks down below this level, the correction may continue deeper)
Scenario B: Conservative Buy (Wait for Major Support)
If price fails to hold above $91,000 and breaks downward, wait for a retest back to the orange MA area.
Trading Direction: LONG / BUY
Entry Area: $81,500 – $83,000
Take Profit 1 (TP1): $91,000
Take Profit 2 (TP2): $98,000
Stop Loss (SL): $78,500
{future}(HYPEUSDT)
Below is a professional technical analysis and a trading plan (trading setup) for the $HYPE /USDT pair (4-H)
1. Market Structure Analysis & Trend
Main Trend (Major Trend): Bullish. The chart shows a solid rising structure (higher highs & higher lows) from the $68,000 level up to near $100,000.
Short-Term Condition: Healthy Correction / Pullback. After touching the peak area around $98,000, price experienced rejection and dropped by -3.04% toward the $91,174 range.
Moving Average (MA) Indicators:
Current price is breaking below the short-term MA (purple line) at around ~$93,000, indicating temporary selling pressure.
The medium/long-term MA (orange line) in the range of $81,000 – $82,000 is still trending upward and acts as a Dynamic Major Support.
2. Key Levels
Main Resistance: $94,024 & $98,000 – $100,000 (Supply Area / Local High)
Nearest Support: $91,000 – $91,200 (Current horizontal retest area)
Major Support / Demand Zone: $80,000 – $82,000 (A strong defense layer around the orange MA)
3. Trading Signal Plan (Trading Setup)
Since the main trend is still Bullish, the best strategy is to take advantage of the correction momentum to look for a Long / Buy area.
Scenario A: Buy the Dip / Aggressive (Utilize Local Support)
Trading Direction: LONG / BUY
Entry Area: $90,000 – $91,200 (You can wait for the formation of a rejection candle/bullish pin bar on the 1H/4H timeframe)
Take Profit 1 (TP1): $94,000
Take Profit 2 (TP2): $98,000
Take Profit 3 (TP3): $100,000
Stop Loss (SL): $87,800 (If price breaks down below this level, the correction may continue deeper)
Scenario B: Conservative Buy (Wait for Major Support)
If price fails to hold above $91,000 and breaks downward, wait for a retest back to the orange MA area.
Trading Direction: LONG / BUY
Entry Area: $81,500 – $83,000
Take Profit 1 (TP1): $91,000
Take Profit 2 (TP2): $98,000
Stop Loss (SL): $78,500
1. Market Structure Analysis & Trend
Main Trend (Major Trend): Bullish. The chart shows a solid rising structure (higher highs & higher lows) from the $68,000 level up to near $100,000.
Short-Term Condition: Healthy Correction / Pullback. After touching the peak area around $98,000, price experienced rejection and dropped by -3.04% toward the $91,174 range.
Moving Average (MA) Indicators:
Current price is breaking below the short-term MA (purple line) at around ~$93,000, indicating temporary selling pressure.
The medium/long-term MA (orange line) in the range of $81,000 – $82,000 is still trending upward and acts as a Dynamic Major Support.
2. Key Levels
Main Resistance: $94,024 & $98,000 – $100,000 (Supply Area / Local High)
Nearest Support: $91,000 – $91,200 (Current horizontal retest area)
Major Support / Demand Zone: $80,000 – $82,000 (A strong defense layer around the orange MA)
3. Trading Signal Plan (Trading Setup)
Since the main trend is still Bullish, the best strategy is to take advantage of the correction momentum to look for a Long / Buy area.
Scenario A: Buy the Dip / Aggressive (Utilize Local Support)
Trading Direction: LONG / BUY
Entry Area: $90,000 – $91,200 (You can wait for the formation of a rejection candle/bullish pin bar on the 1H/4H timeframe)
Take Profit 1 (TP1): $94,000
Take Profit 2 (TP2): $98,000
Take Profit 3 (TP3): $100,000
Stop Loss (SL): $87,800 (If price breaks down below this level, the correction may continue deeper)
Scenario B: Conservative Buy (Wait for Major Support)
If price fails to hold above $91,000 and breaks downward, wait for a retest back to the orange MA area.
Trading Direction: LONG / BUY
Entry Area: $81,500 – $83,000
Take Profit 1 (TP1): $91,000
Take Profit 2 (TP2): $98,000
Stop Loss (SL): $78,500
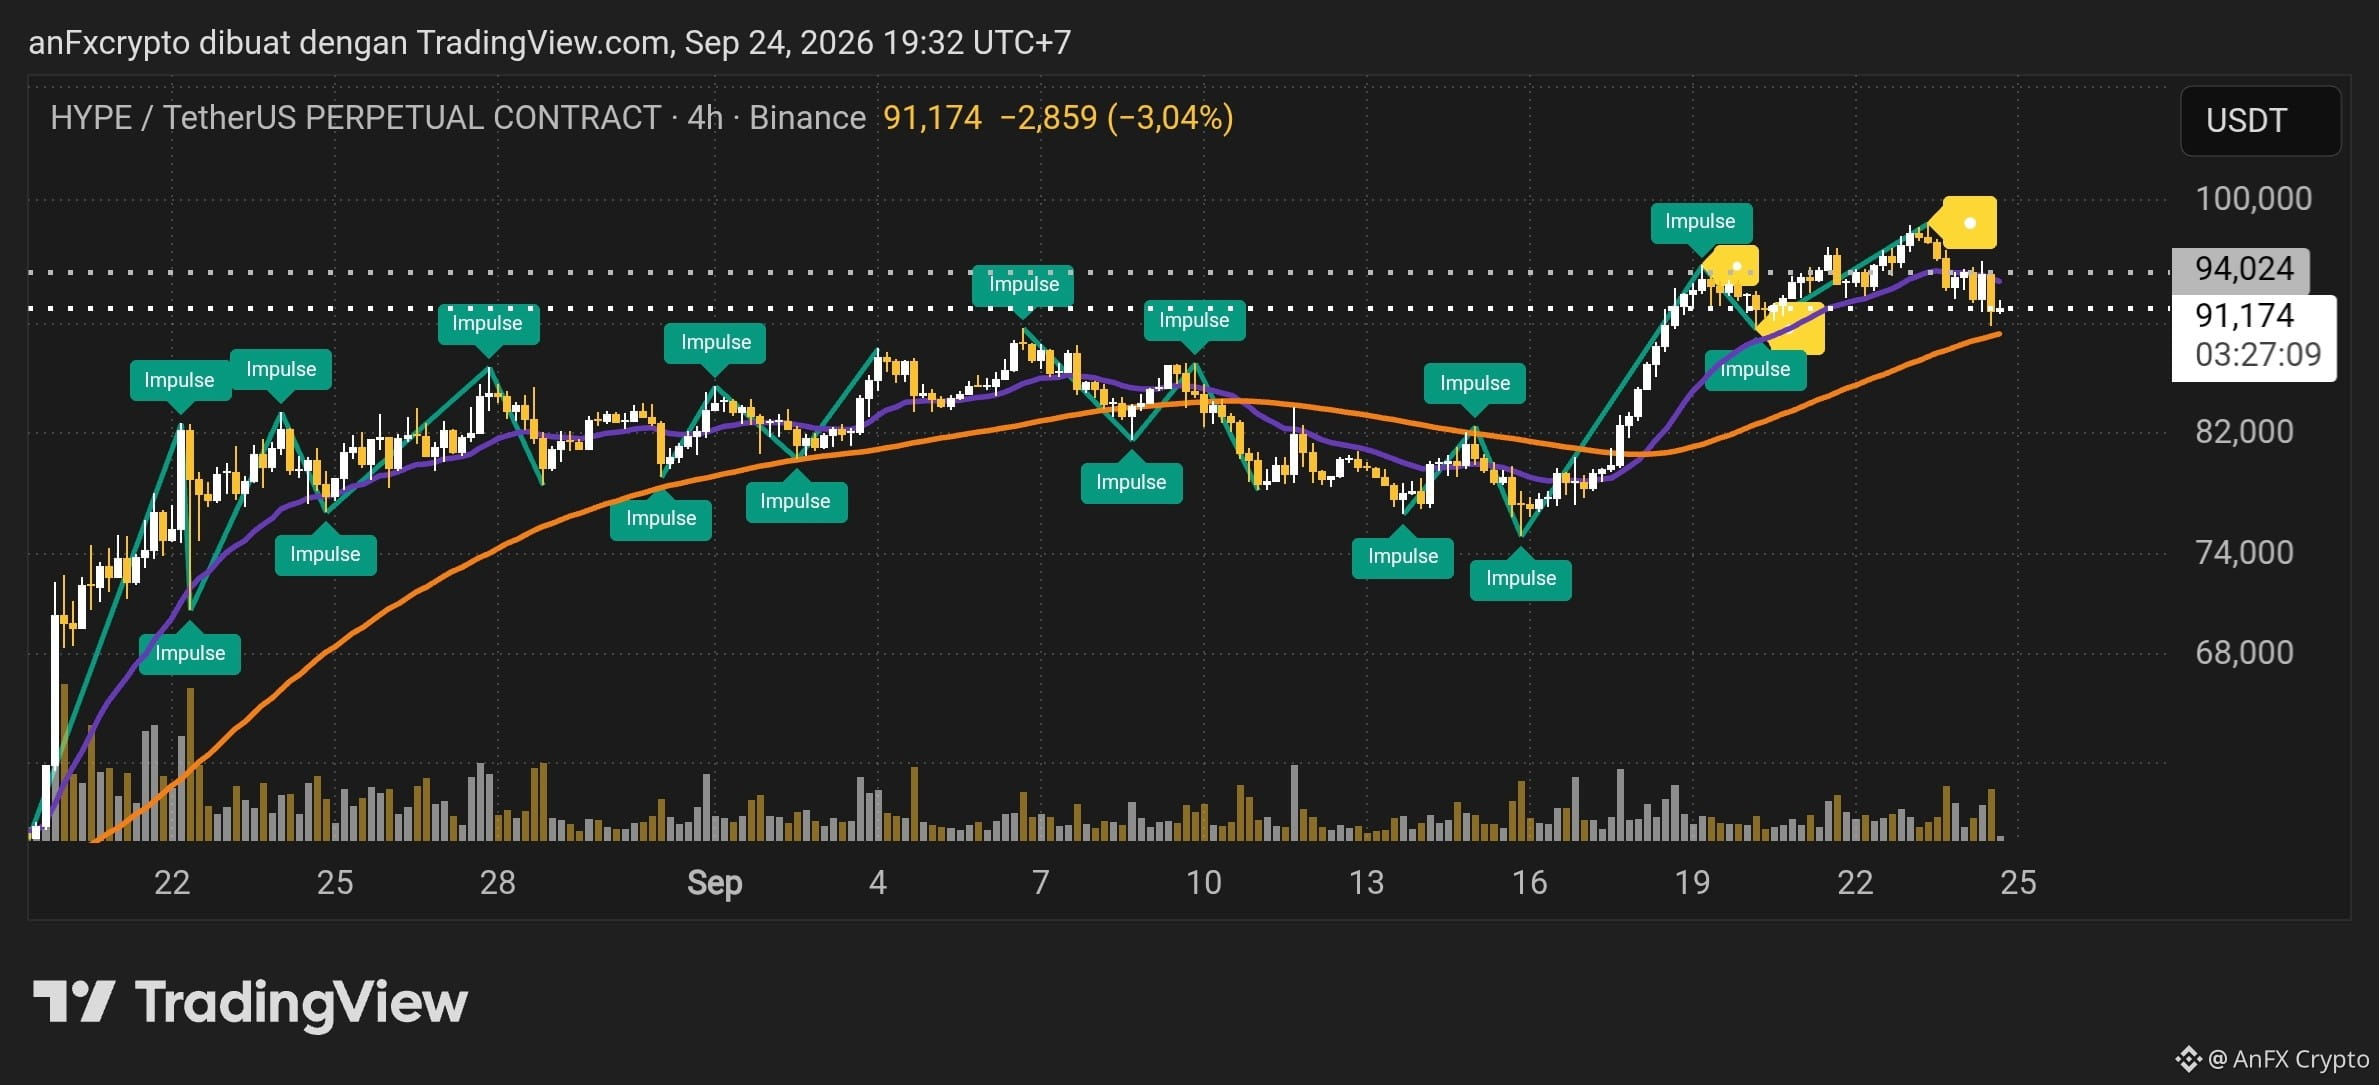
48
·
--
Based on the chart $GME /USDT Perpetual (Timeframe 4H):
📈 Technical Analysis
* Pattern Structure (Rounding Bottom)
* The chart shows a neat Rounding Bottom (Cup) pattern forming from August to September. This suggests a transition from the accumulation phase to a bullish trend phase.
* Key Support & Resistance
* The current price is in the horizontal line area of 24.00 – 24.13 USDT. This zone previously acted as the main resistance of the cup pattern and is now being tested again (retest).
* Momentum Indicators & Moving Average
* The Moving Average lines (orange & purple) cross upward (golden cross) and slope positively below the price movement, confirming that the short- to mid-term trend is still dominated by buyers (bulls).
* The appearance of consecutive Impulse signals indicates strong buy volume pushing during each stage of the rally.
🎯 Trading Signal: LONG / BUY SETUP
* Bias: Bullish (Aiming for Breakout & Retest)
* Entry Area: 23.85 – 24.10 USDT (Enter when price successfully holds above the 24.00 resistance or after a retest of the MA area)
* Take Profit (TP):
* TP 1: 25.50 USDT (Nearest local resistance)
* TP 2: 27.20 USDT (Next extension target of the pattern)
* TP 3: 29.00 USDT (Macro swing target)
* Stop Loss (SL): 22.70 USDT (Below the main Moving Average curve and the nearest swing low to limit risk)
* Risk to Reward Ratio: ~ 1 : 2.3
⚠️ Execution Plan & Risk Management
* Confirmation: Make sure the 4H candle closes above 24.00 USDT, or watch for a bounce on smaller timeframes (15M / 1H) before executing.
* Leverage: If using Futures/Perpetual contracts, it’s recommended to keep leverage at a safe 3x – 5x.
* Risk Per Trade: Maximum 1% – 2% of total equity per trade. If price breaks below the SL (22.70), cut the loss immediately because the Rounding Bottom scenario could trigger a false breakout.
{future}(GMEUSDT)
Based on the chart $GME /USDT Perpetual (Timeframe 4H):
📈 Technical Analysis
* Pattern Structure (Rounding Bottom)
* The chart shows a neat Rounding Bottom (Cup) pattern forming from August to September. This suggests a transition from the accumulation phase to a bullish trend phase.
* Key Support & Resistance
* The current price is in the horizontal line area of 24.00 – 24.13 USDT. This zone previously acted as the main resistance of the cup pattern and is now being tested again (retest).
* Momentum Indicators & Moving Average
* The Moving Average lines (orange & purple) cross upward (golden cross) and slope positively below the price movement, confirming that the short- to mid-term trend is still dominated by buyers (bulls).
* The appearance of consecutive Impulse signals indicates strong buy volume pushing during each stage of the rally.
🎯 Trading Signal: LONG / BUY SETUP
* Bias: Bullish (Aiming for Breakout & Retest)
* Entry Area: 23.85 – 24.10 USDT (Enter when price successfully holds above the 24.00 resistance or after a retest of the MA area)
* Take Profit (TP):
* TP 1: 25.50 USDT (Nearest local resistance)
* TP 2: 27.20 USDT (Next extension target of the pattern)
* TP 3: 29.00 USDT (Macro swing target)
* Stop Loss (SL): 22.70 USDT (Below the main Moving Average curve and the nearest swing low to limit risk)
* Risk to Reward Ratio: ~ 1 : 2.3
⚠️ Execution Plan & Risk Management
* Confirmation: Make sure the 4H candle closes above 24.00 USDT, or watch for a bounce on smaller timeframes (15M / 1H) before executing.
* Leverage: If using Futures/Perpetual contracts, it’s recommended to keep leverage at a safe 3x – 5x.
* Risk Per Trade: Maximum 1% – 2% of total equity per trade. If price breaks below the SL (22.70), cut the loss immediately because the Rounding Bottom scenario could trigger a false breakout.
📈 Technical Analysis
* Pattern Structure (Rounding Bottom)
* The chart shows a neat Rounding Bottom (Cup) pattern forming from August to September. This suggests a transition from the accumulation phase to a bullish trend phase.
* Key Support & Resistance
* The current price is in the horizontal line area of 24.00 – 24.13 USDT. This zone previously acted as the main resistance of the cup pattern and is now being tested again (retest).
* Momentum Indicators & Moving Average
* The Moving Average lines (orange & purple) cross upward (golden cross) and slope positively below the price movement, confirming that the short- to mid-term trend is still dominated by buyers (bulls).
* The appearance of consecutive Impulse signals indicates strong buy volume pushing during each stage of the rally.
🎯 Trading Signal: LONG / BUY SETUP
* Bias: Bullish (Aiming for Breakout & Retest)
* Entry Area: 23.85 – 24.10 USDT (Enter when price successfully holds above the 24.00 resistance or after a retest of the MA area)
* Take Profit (TP):
* TP 1: 25.50 USDT (Nearest local resistance)
* TP 2: 27.20 USDT (Next extension target of the pattern)
* TP 3: 29.00 USDT (Macro swing target)
* Stop Loss (SL): 22.70 USDT (Below the main Moving Average curve and the nearest swing low to limit risk)
* Risk to Reward Ratio: ~ 1 : 2.3
⚠️ Execution Plan & Risk Management
* Confirmation: Make sure the 4H candle closes above 24.00 USDT, or watch for a bounce on smaller timeframes (15M / 1H) before executing.
* Leverage: If using Futures/Perpetual contracts, it’s recommended to keep leverage at a safe 3x – 5x.
* Risk Per Trade: Maximum 1% – 2% of total equity per trade. If price breaks below the SL (22.70), cut the loss immediately because the Rounding Bottom scenario could trigger a false breakout.
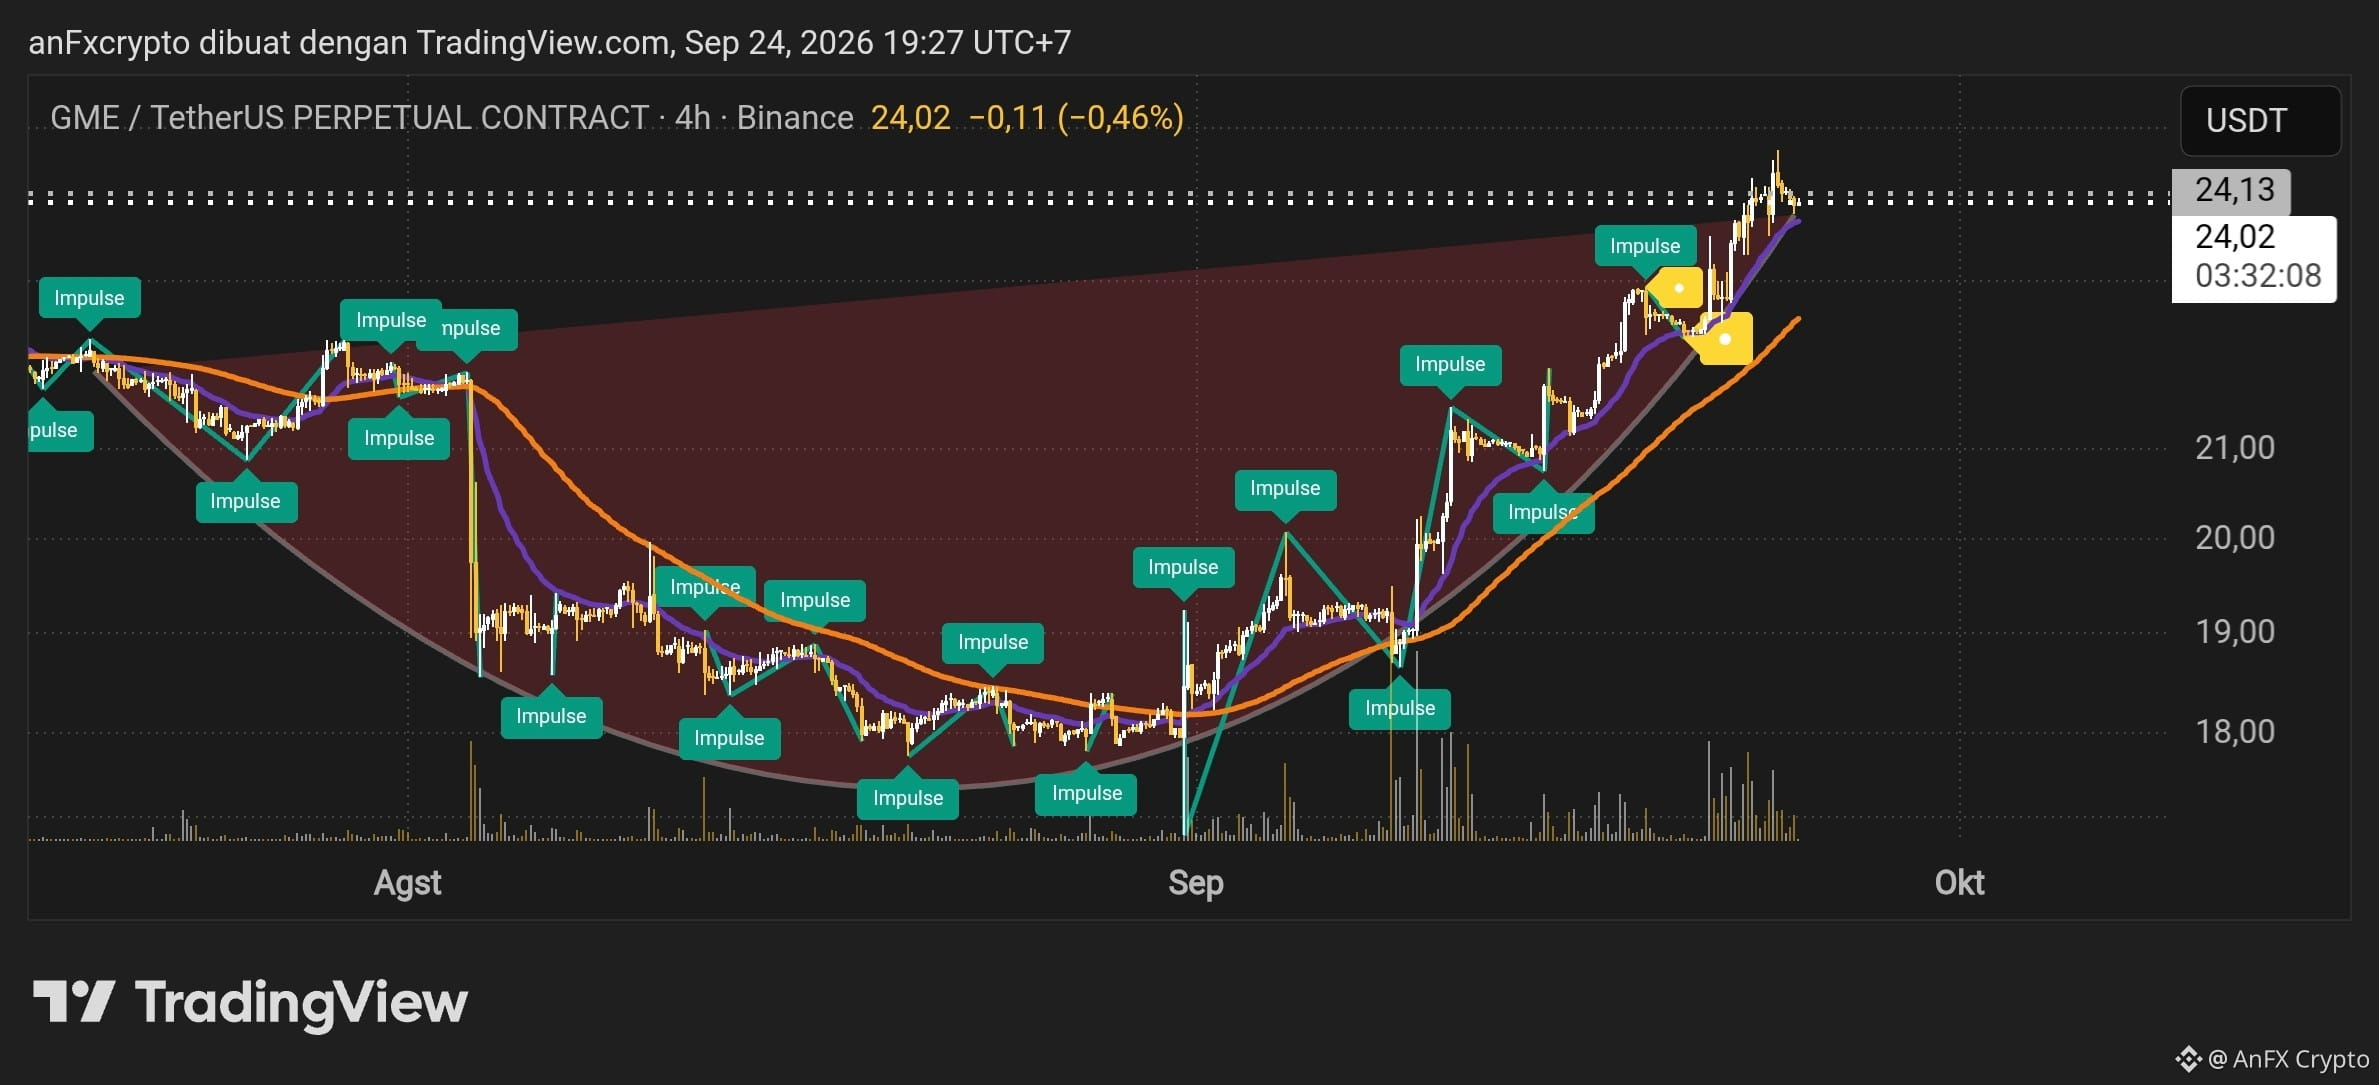
5
·
--
Here is a professional technical analysis and trading plan for the $ONDO /USDT pair (Perpetual 4H):
1. Market Structure Analysis & Indicators
Main Trend (Trend Structure): The market is in a strong Bullish (Uptrend) structure since mid-September after breaking out from the accumulation area at $0.3100 – $0.3300. The chart forms a pattern of Higher Highs and Higher Lows.
Moving Average (EMA): The short-term trend line (purple) is moving above the long-term trend line (orange), confirming buyer dominance. The gap between the current price and the EMA line shows impulsive price momentum.
Trading Volume: A significant volume spike (surge in buy volume) occurred during the move toward the $0.4589 area, indicating institutional participation/large buyers.
Key Levels:
Local Resistance: $0.4600 – $0.4800 (current local highs).
Major Support (Key Support): $0.4124 (resistance-turned-support / flip zone).
Secondary Support: $0.3700 – $0.3800 (supported by dynamic MA/EMA).
2. Signals & Trading Plan (Trading Setup)
Current Price ($0.4589) is approaching the upper limit of the local resistance after rising +11.25%. Buying impulsively (FOMO) at the running price is very risky. A low-risk rational option is to wait for a Pullback & Retest at the $0.4124 support area.
Complete Scenario: LONG (Buy on Dip)
Bias: Bullish (Trend Following)
Entry Area (Buy Zone): $0.4150 – $0.4250 (waiting for a healthy correction back into the horizontal support area of $0.4124)
Take Profit 1 (TP1): $0.4650 (retesting local resistance)
Take Profit 2 (TP2): $0.5100 (targeting the next expanding trend)
Stop Loss (SL): $0.3920 (below the horizontal support and the breakout candle tail)
Risk to Reward Ratio: 1 : 2.4
Alternative Scenario: Buy Breakout (Confirmation)
If the 4H candle closes above $0.4750 with continually increasing volume:
Entry: Retest at $0.4700
Stop Loss: $0.4450
Take Profit: $0.5300 – $0.5700
{future}(ONDOUSDT)
Here is a professional technical analysis and trading plan for the $ONDO /USDT pair (Perpetual 4H):
1. Market Structure Analysis & Indicators
Main Trend (Trend Structure): The market is in a strong Bullish (Uptrend) structure since mid-September after breaking out from the accumulation area at $0.3100 – $0.3300. The chart forms a pattern of Higher Highs and Higher Lows.
Moving Average (EMA): The short-term trend line (purple) is moving above the long-term trend line (orange), confirming buyer dominance. The gap between the current price and the EMA line shows impulsive price momentum.
Trading Volume: A significant volume spike (surge in buy volume) occurred during the move toward the $0.4589 area, indicating institutional participation/large buyers.
Key Levels:
Local Resistance: $0.4600 – $0.4800 (current local highs).
Major Support (Key Support): $0.4124 (resistance-turned-support / flip zone).
Secondary Support: $0.3700 – $0.3800 (supported by dynamic MA/EMA).
2. Signals & Trading Plan (Trading Setup)
Current Price ($0.4589) is approaching the upper limit of the local resistance after rising +11.25%. Buying impulsively (FOMO) at the running price is very risky. A low-risk rational option is to wait for a Pullback & Retest at the $0.4124 support area.
Complete Scenario: LONG (Buy on Dip)
Bias: Bullish (Trend Following)
Entry Area (Buy Zone): $0.4150 – $0.4250 (waiting for a healthy correction back into the horizontal support area of $0.4124)
Take Profit 1 (TP1): $0.4650 (retesting local resistance)
Take Profit 2 (TP2): $0.5100 (targeting the next expanding trend)
Stop Loss (SL): $0.3920 (below the horizontal support and the breakout candle tail)
Risk to Reward Ratio: 1 : 2.4
Alternative Scenario: Buy Breakout (Confirmation)
If the 4H candle closes above $0.4750 with continually increasing volume:
Entry: Retest at $0.4700
Stop Loss: $0.4450
Take Profit: $0.5300 – $0.5700
1. Market Structure Analysis & Indicators
Main Trend (Trend Structure): The market is in a strong Bullish (Uptrend) structure since mid-September after breaking out from the accumulation area at $0.3100 – $0.3300. The chart forms a pattern of Higher Highs and Higher Lows.
Moving Average (EMA): The short-term trend line (purple) is moving above the long-term trend line (orange), confirming buyer dominance. The gap between the current price and the EMA line shows impulsive price momentum.
Trading Volume: A significant volume spike (surge in buy volume) occurred during the move toward the $0.4589 area, indicating institutional participation/large buyers.
Key Levels:
Local Resistance: $0.4600 – $0.4800 (current local highs).
Major Support (Key Support): $0.4124 (resistance-turned-support / flip zone).
Secondary Support: $0.3700 – $0.3800 (supported by dynamic MA/EMA).
2. Signals & Trading Plan (Trading Setup)
Current Price ($0.4589) is approaching the upper limit of the local resistance after rising +11.25%. Buying impulsively (FOMO) at the running price is very risky. A low-risk rational option is to wait for a Pullback & Retest at the $0.4124 support area.
Complete Scenario: LONG (Buy on Dip)
Bias: Bullish (Trend Following)
Entry Area (Buy Zone): $0.4150 – $0.4250 (waiting for a healthy correction back into the horizontal support area of $0.4124)
Take Profit 1 (TP1): $0.4650 (retesting local resistance)
Take Profit 2 (TP2): $0.5100 (targeting the next expanding trend)
Stop Loss (SL): $0.3920 (below the horizontal support and the breakout candle tail)
Risk to Reward Ratio: 1 : 2.4
Alternative Scenario: Buy Breakout (Confirmation)
If the 4H candle closes above $0.4750 with continually increasing volume:
Entry: Retest at $0.4700
Stop Loss: $0.4450
Take Profit: $0.5300 – $0.5700
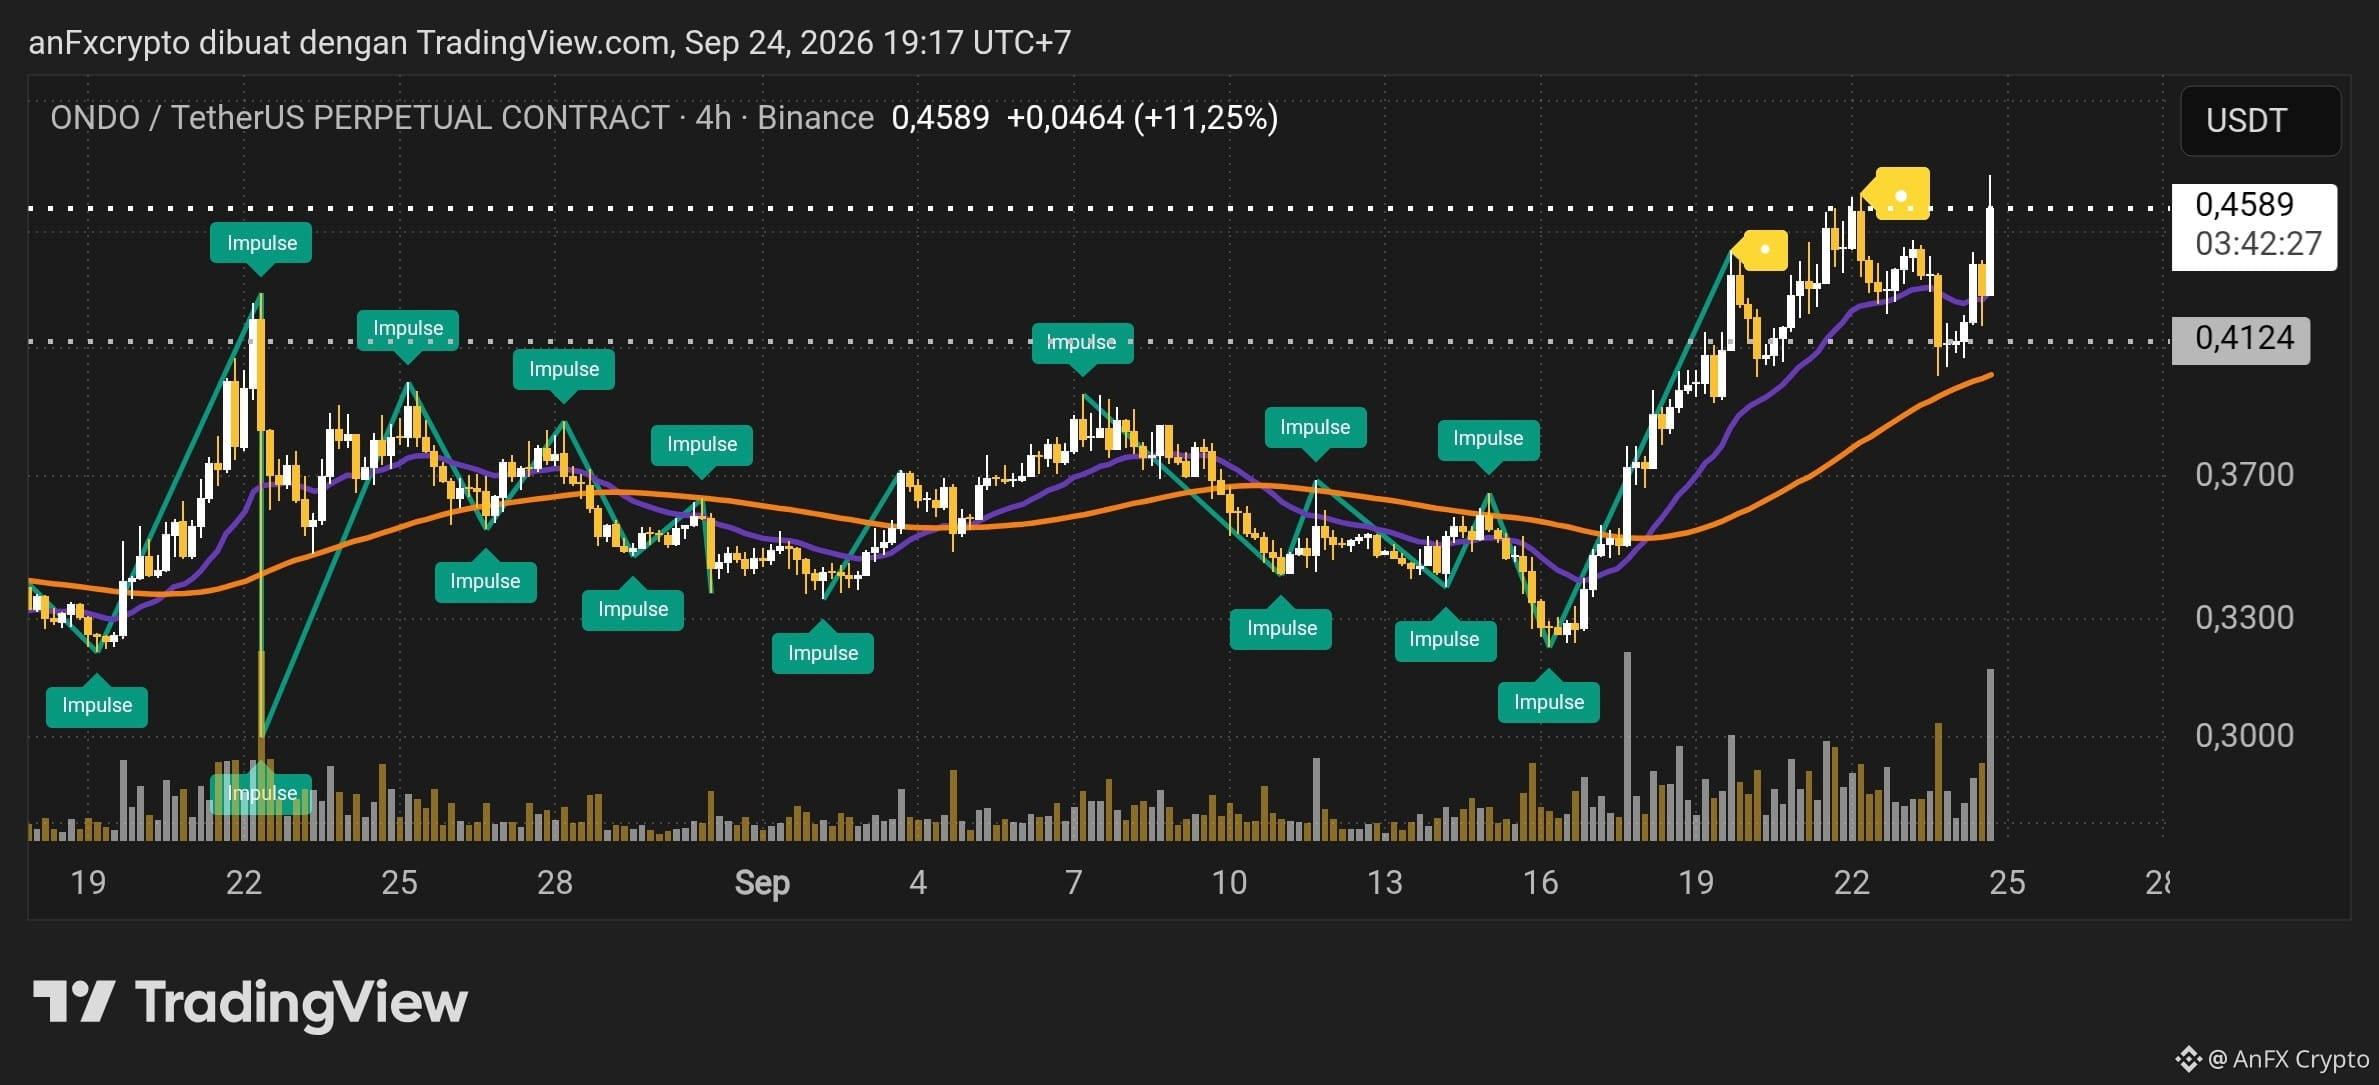
112
Log in to explore more content
Join global crypto users on Binance Square
⚡️ Get latest and useful information about crypto.
💬 Trusted by the world’s largest crypto exchange.
👍 Discover real insights from verified creators.
Email / Phone number
Trending Topics
QNTRises39%
118 views
66 Discussing
🚀 $QNT PUMPS +39%!
Quant just partnered with The Clearing House - the network that handles $2 TRILLION daily!
They will power the tokenized deposit network for 25 top US banks. From $70 to over $100 in hours, volume up 553%.
This is MASSIVE for institutional adoption.
Is $QNT heading to $110 next?
#QNT #Quant #CryptoNews #RWA #Bullish#qntrises39%
True News
·1 Likes
·97 views
EthereumBreaksAbove$2700
95 views
31 Discussing
BitgetBreachForgedRequestsNotStolenKeys
51 views
44 Discussing