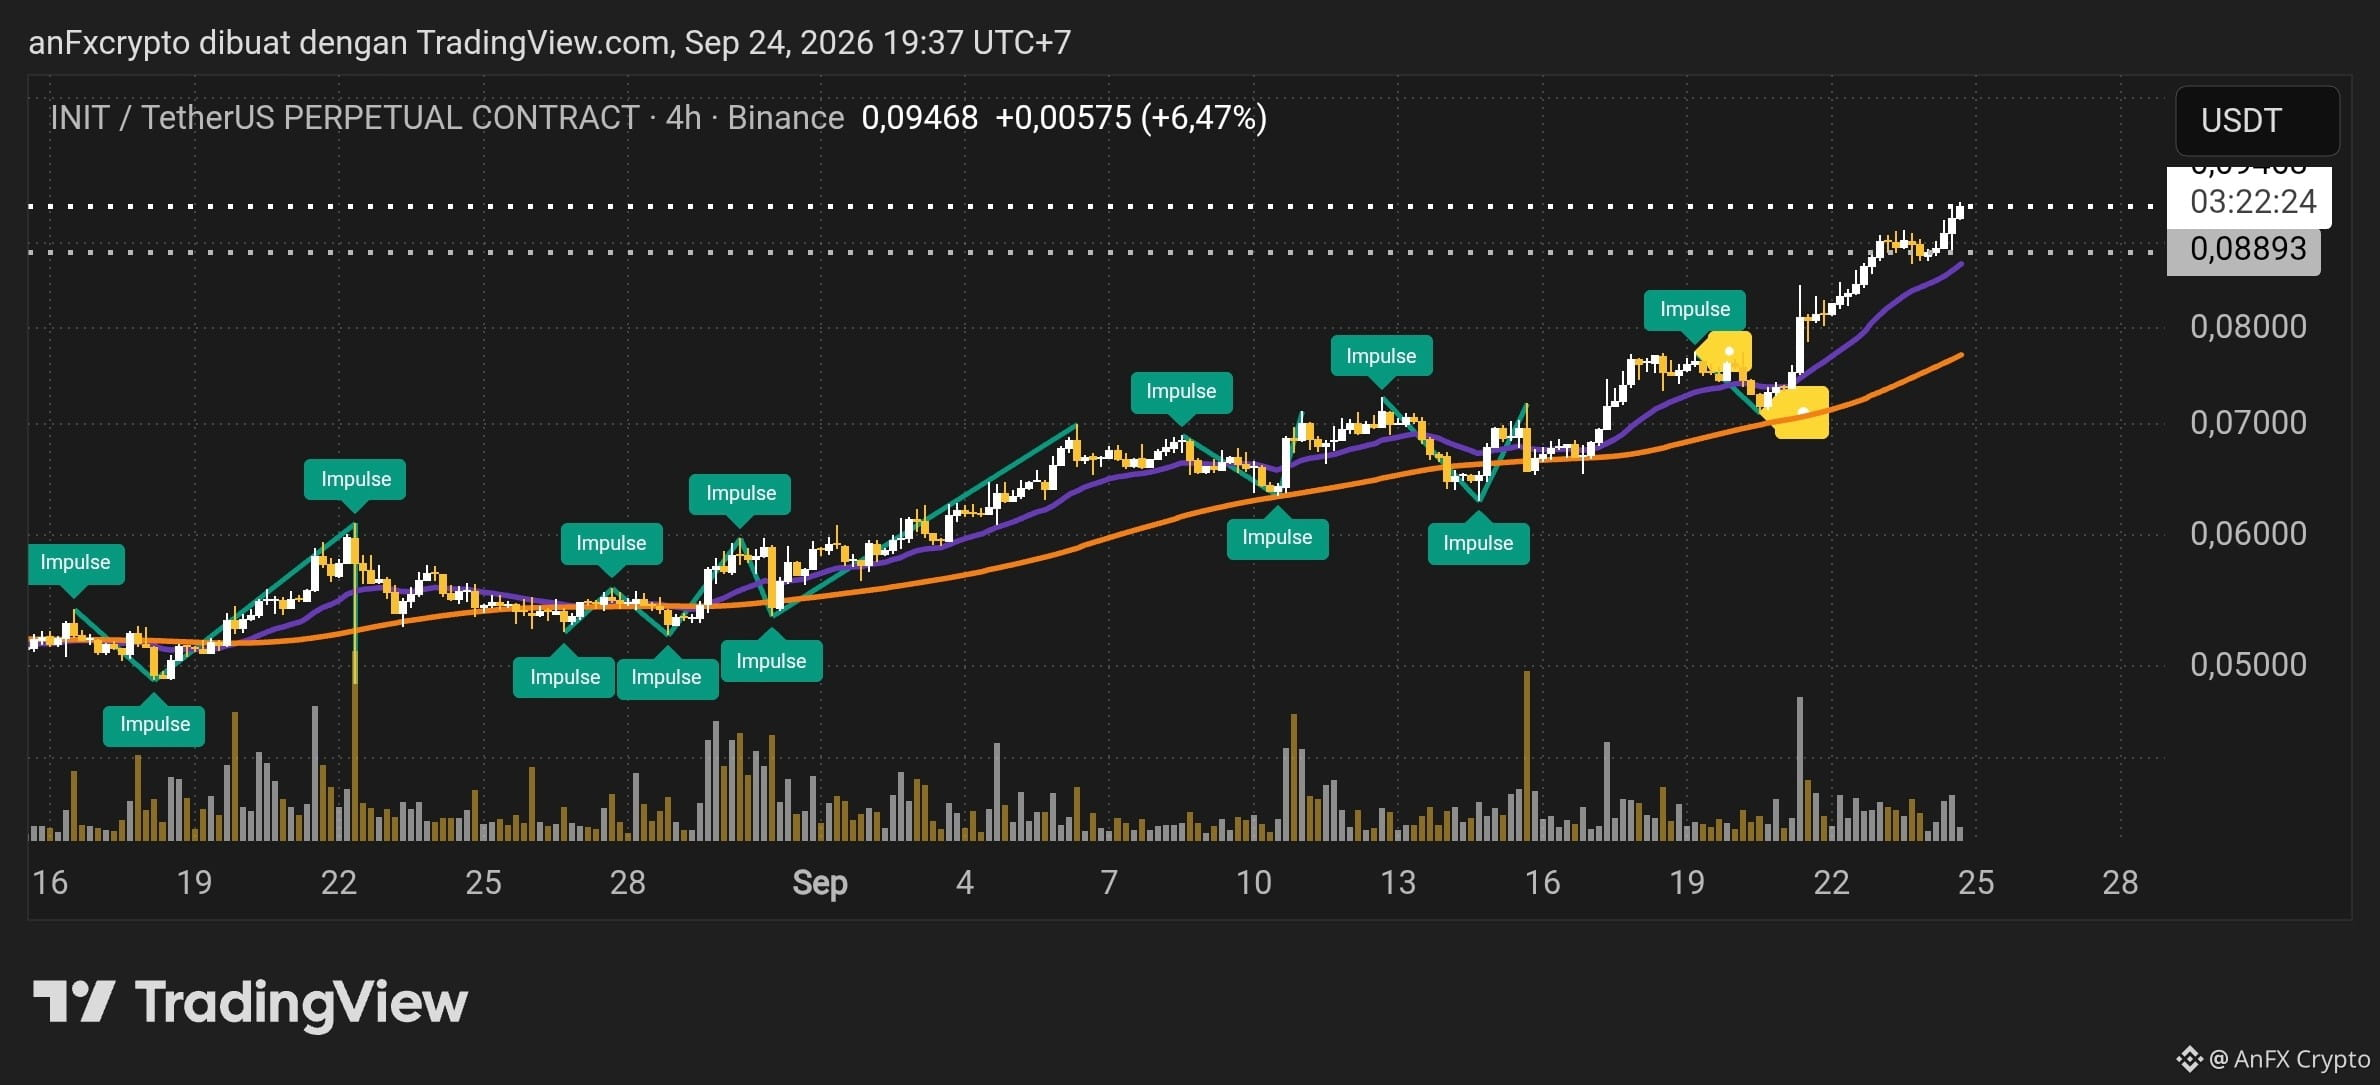
Based on the $INIT /USDT Perpetual chart (Timeframe 4H), the following is an in-depth technical analysis along with a trading plan (signal setup):
1. Market Structure & Trend Analysis
Main Trend (4H): Strong Bullish. Price action consistently forms Higher Highs (HH) and Higher Lows (HL).
Breakout Resistance: Price has just made an impulsive breakout (bullish breakout) above the key resistance area of 0.08893 and is currently trading around 0.09468.
Moving Averages (EMA): The short-term (purple) and mid-term (orange) EMA lines are curving upward, with price positioned well above both lines, confirming that buyer momentum (bulls) is still highly dominant.
Execution Note: Since price is currently at the peak of the impulsive rally, an immediate entry (FOMO) carries a less-than-ideal risk-to-reward. The best approach is to pursue a Retest / Buy on Dip strategy.
2. Signal & Trading Plan (INIT/USDT - LONG)
Strategy Type: Buy on Pullback / Retest
Entry Area (Limit Order): 0.0890 – 0.0910 (Wait for a healthy correction into the former resistance area, which is now support)
Stop Loss (SL): 0.0835 (Below the last swing low structure and the EMA support)
Take Profit (TP):
TP 1: 0.0985 (Partial take profit 30–50% & move SL to BEP/Entry)
TP 2: 0.1050 (Psychological level & upside extension)
TP 3: 0.1150 (Let profits run for the continued trend)
3. Risk Management & Professional Notes
Risk per Trade: Maximum 1% – 2% of the total trading account capital.
Entry Confirmation: Watch for the formation of an upside-reversal candle (bullish rejection/pin bar) on the 1H or 15M timeframe when price enters the retest area 0.0890–0.0910 before opening the position.
SL Discipline: If the 4H candle closes convincingly below 0.0835, the bullish scenario is invalidated. Regardless of market conditions, always follow the Stop Loss to protect your capital.
1. Market Structure & Trend Analysis
Main Trend (4H): Strong Bullish. Price action consistently forms Higher Highs (HH) and Higher Lows (HL).
Breakout Resistance: Price has just made an impulsive breakout (bullish breakout) above the key resistance area of 0.08893 and is currently trading around 0.09468.
Moving Averages (EMA): The short-term (purple) and mid-term (orange) EMA lines are curving upward, with price positioned well above both lines, confirming that buyer momentum (bulls) is still highly dominant.
Execution Note: Since price is currently at the peak of the impulsive rally, an immediate entry (FOMO) carries a less-than-ideal risk-to-reward. The best approach is to pursue a Retest / Buy on Dip strategy.
2. Signal & Trading Plan (INIT/USDT - LONG)
Strategy Type: Buy on Pullback / Retest
Entry Area (Limit Order): 0.0890 – 0.0910 (Wait for a healthy correction into the former resistance area, which is now support)
Stop Loss (SL): 0.0835 (Below the last swing low structure and the EMA support)
Take Profit (TP):
TP 1: 0.0985 (Partial take profit 30–50% & move SL to BEP/Entry)
TP 2: 0.1050 (Psychological level & upside extension)
TP 3: 0.1150 (Let profits run for the continued trend)
3. Risk Management & Professional Notes
Risk per Trade: Maximum 1% – 2% of the total trading account capital.
Entry Confirmation: Watch for the formation of an upside-reversal candle (bullish rejection/pin bar) on the 1H or 15M timeframe when price enters the retest area 0.0890–0.0910 before opening the position.
SL Discipline: If the 4H candle closes convincingly below 0.0835, the bullish scenario is invalidated. Regardless of market conditions, always follow the Stop Loss to protect your capital.