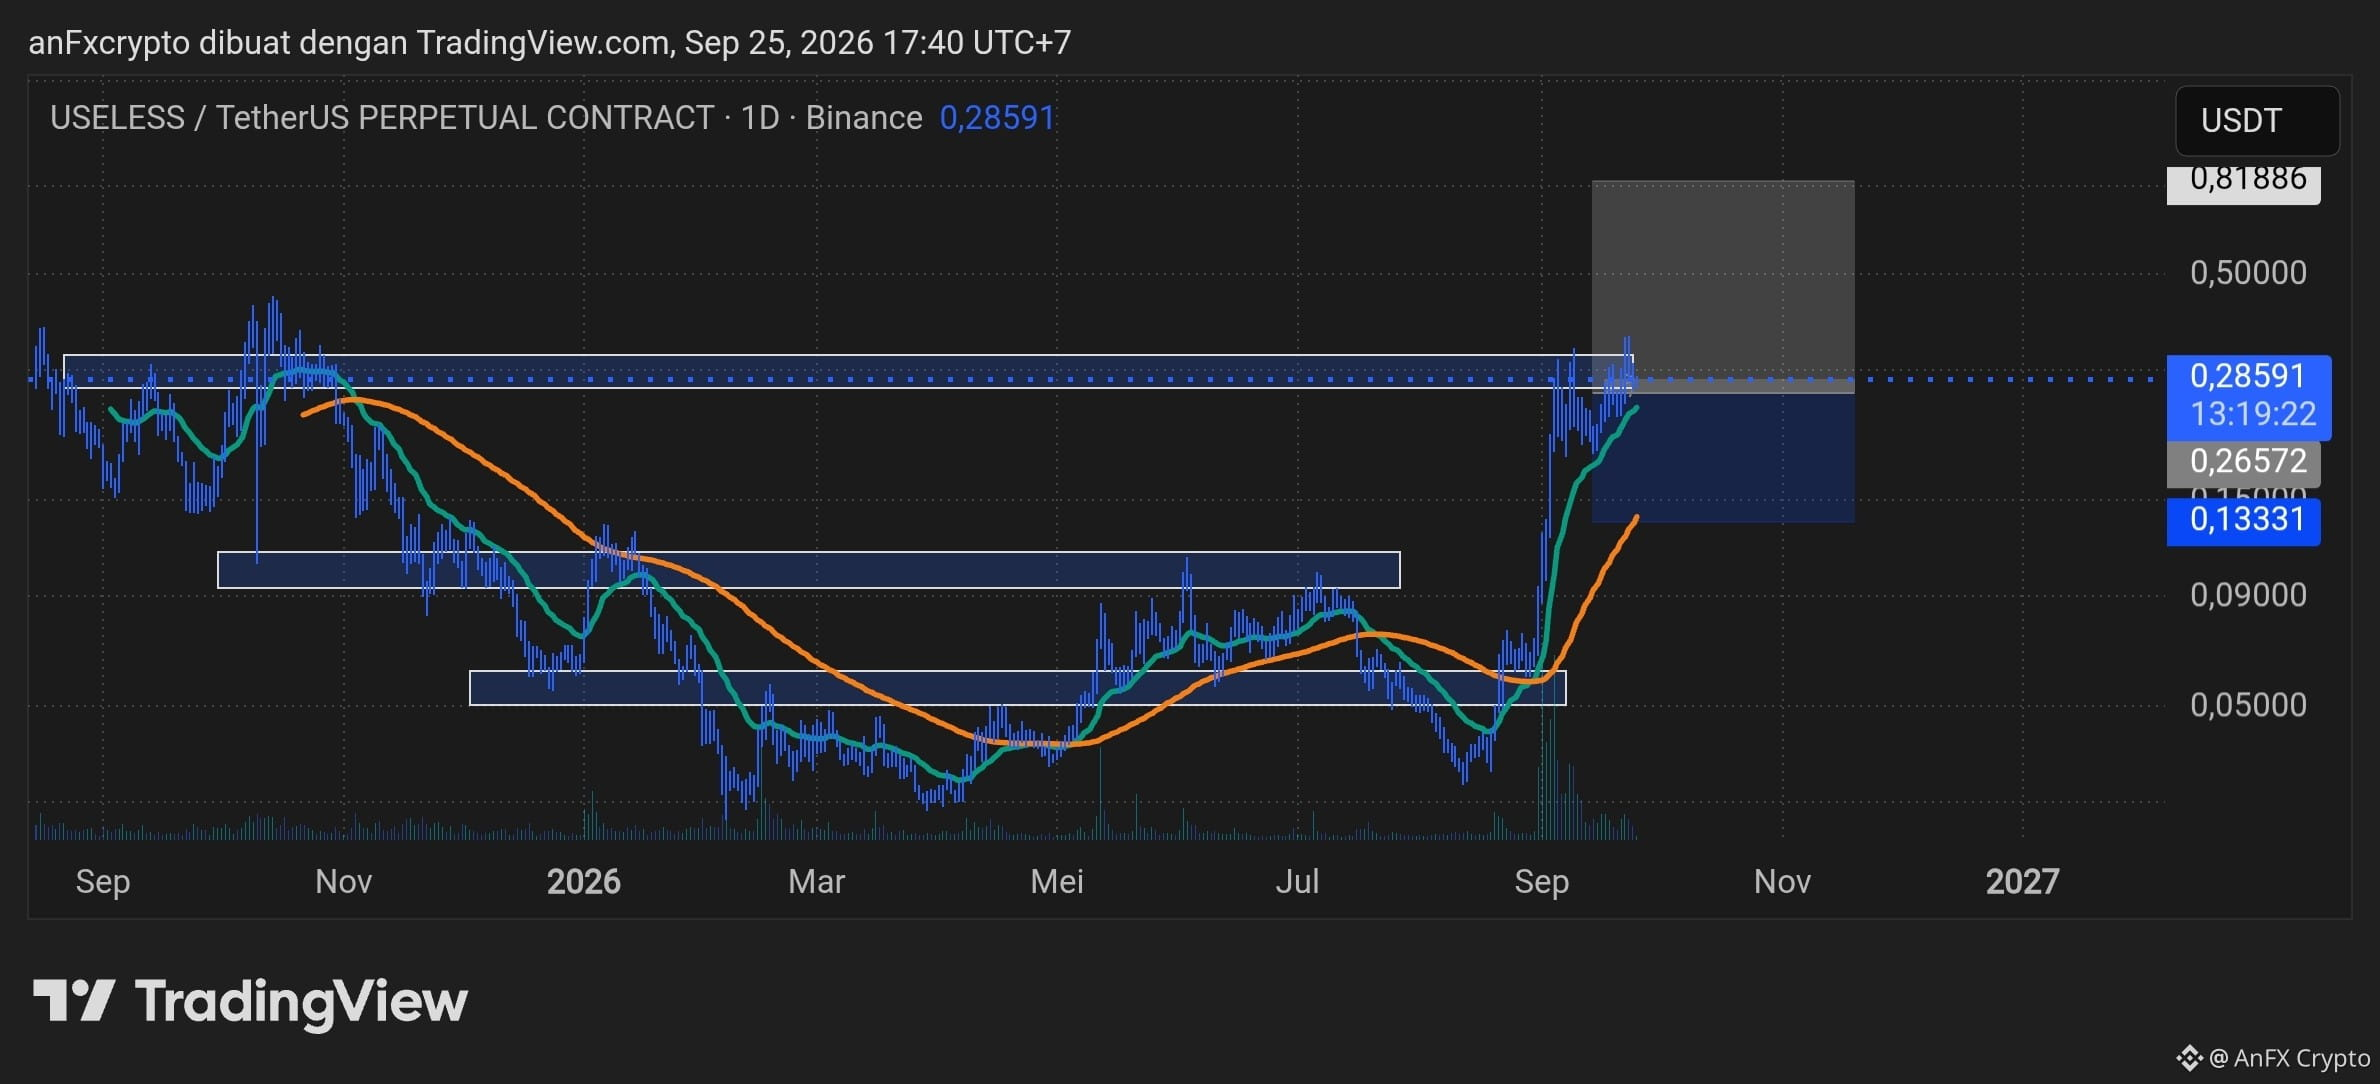
The following is a professional technical analysis and a trading execution plan based on the chart $USELESS /USDT Perpetual (1D).
1. Market Structure & Trend
Trend Direction (Trend Bias): Strong Bullish. After a long accumulation phase in the base area ($0.03 – $0.05), price has gone through a significant impulsive rally, breaking above multiple key resistances.
Current Price Position: $0.28591.
Moving Averages: The short EMA line (green) is sharply above the long EMA (orange), with a strong upward slope, confirming buyer momentum dominates.
Key Level Conditions: Current price is testing the Major Resistance / Supply Zone ($0.2700 – $0.3000). A daily candle close above $0.3000 will confirm a perfect breakout toward the next upside target.
2. Trading Signal (Swing Long)
Based on the Risk-to-Reward (RRR) projection available on the chart, this is a Continuation / Breakout Retest setup:
ParameterLevel PriceDescription DirectionPositionBUY / LONGFollows the main trend (Trend Following)Entry Area$0.2657 – $0.2859Staged entry on retest of support / market priceStop Loss (SL)$0.1333Below the local structure swing low & EMA confluenceTake Profit 1 (TP1)$0.5000Psychological target & mid-range areaTake Profit 2 (TP2)$0.8188Main swing-high projection targetRisk-to-Reward Ratio~1 : 3.5The risk-to-reward ratio is very ideal
3. Execution Strategy & Risk Management
Entry Options Method:
Aggressive: Open partial positions at the current market price ($0.2859).
Conservative: Wait for confirmation of a pullback/retest to the $0.2657 area or a daily candle close ($0.3000+) to avoid false breakouts.
Capital Allocation Settings:
Limit maximum risk to 1% – 2% of your account’s total equity on this trade.
Because the Stop Loss distance is fairly wide (~53% from entry to SL), use low leverage (2x – 3x) or adjust position sizing so that the nominal loss amount does not exceed your risk tolerance.
Position Management:
Move SL to Breakeven (SL Plus) once price has successfully reached and tested the $0.5000 area (TP1).
1. Market Structure & Trend
Trend Direction (Trend Bias): Strong Bullish. After a long accumulation phase in the base area ($0.03 – $0.05), price has gone through a significant impulsive rally, breaking above multiple key resistances.
Current Price Position: $0.28591.
Moving Averages: The short EMA line (green) is sharply above the long EMA (orange), with a strong upward slope, confirming buyer momentum dominates.
Key Level Conditions: Current price is testing the Major Resistance / Supply Zone ($0.2700 – $0.3000). A daily candle close above $0.3000 will confirm a perfect breakout toward the next upside target.
2. Trading Signal (Swing Long)
Based on the Risk-to-Reward (RRR) projection available on the chart, this is a Continuation / Breakout Retest setup:
ParameterLevel PriceDescription DirectionPositionBUY / LONGFollows the main trend (Trend Following)Entry Area$0.2657 – $0.2859Staged entry on retest of support / market priceStop Loss (SL)$0.1333Below the local structure swing low & EMA confluenceTake Profit 1 (TP1)$0.5000Psychological target & mid-range areaTake Profit 2 (TP2)$0.8188Main swing-high projection targetRisk-to-Reward Ratio~1 : 3.5The risk-to-reward ratio is very ideal
3. Execution Strategy & Risk Management
Entry Options Method:
Aggressive: Open partial positions at the current market price ($0.2859).
Conservative: Wait for confirmation of a pullback/retest to the $0.2657 area or a daily candle close ($0.3000+) to avoid false breakouts.
Capital Allocation Settings:
Limit maximum risk to 1% – 2% of your account’s total equity on this trade.
Because the Stop Loss distance is fairly wide (~53% from entry to SL), use low leverage (2x – 3x) or adjust position sizing so that the nominal loss amount does not exceed your risk tolerance.
Position Management:
Move SL to Breakeven (SL Plus) once price has successfully reached and tested the $0.5000 area (TP1).