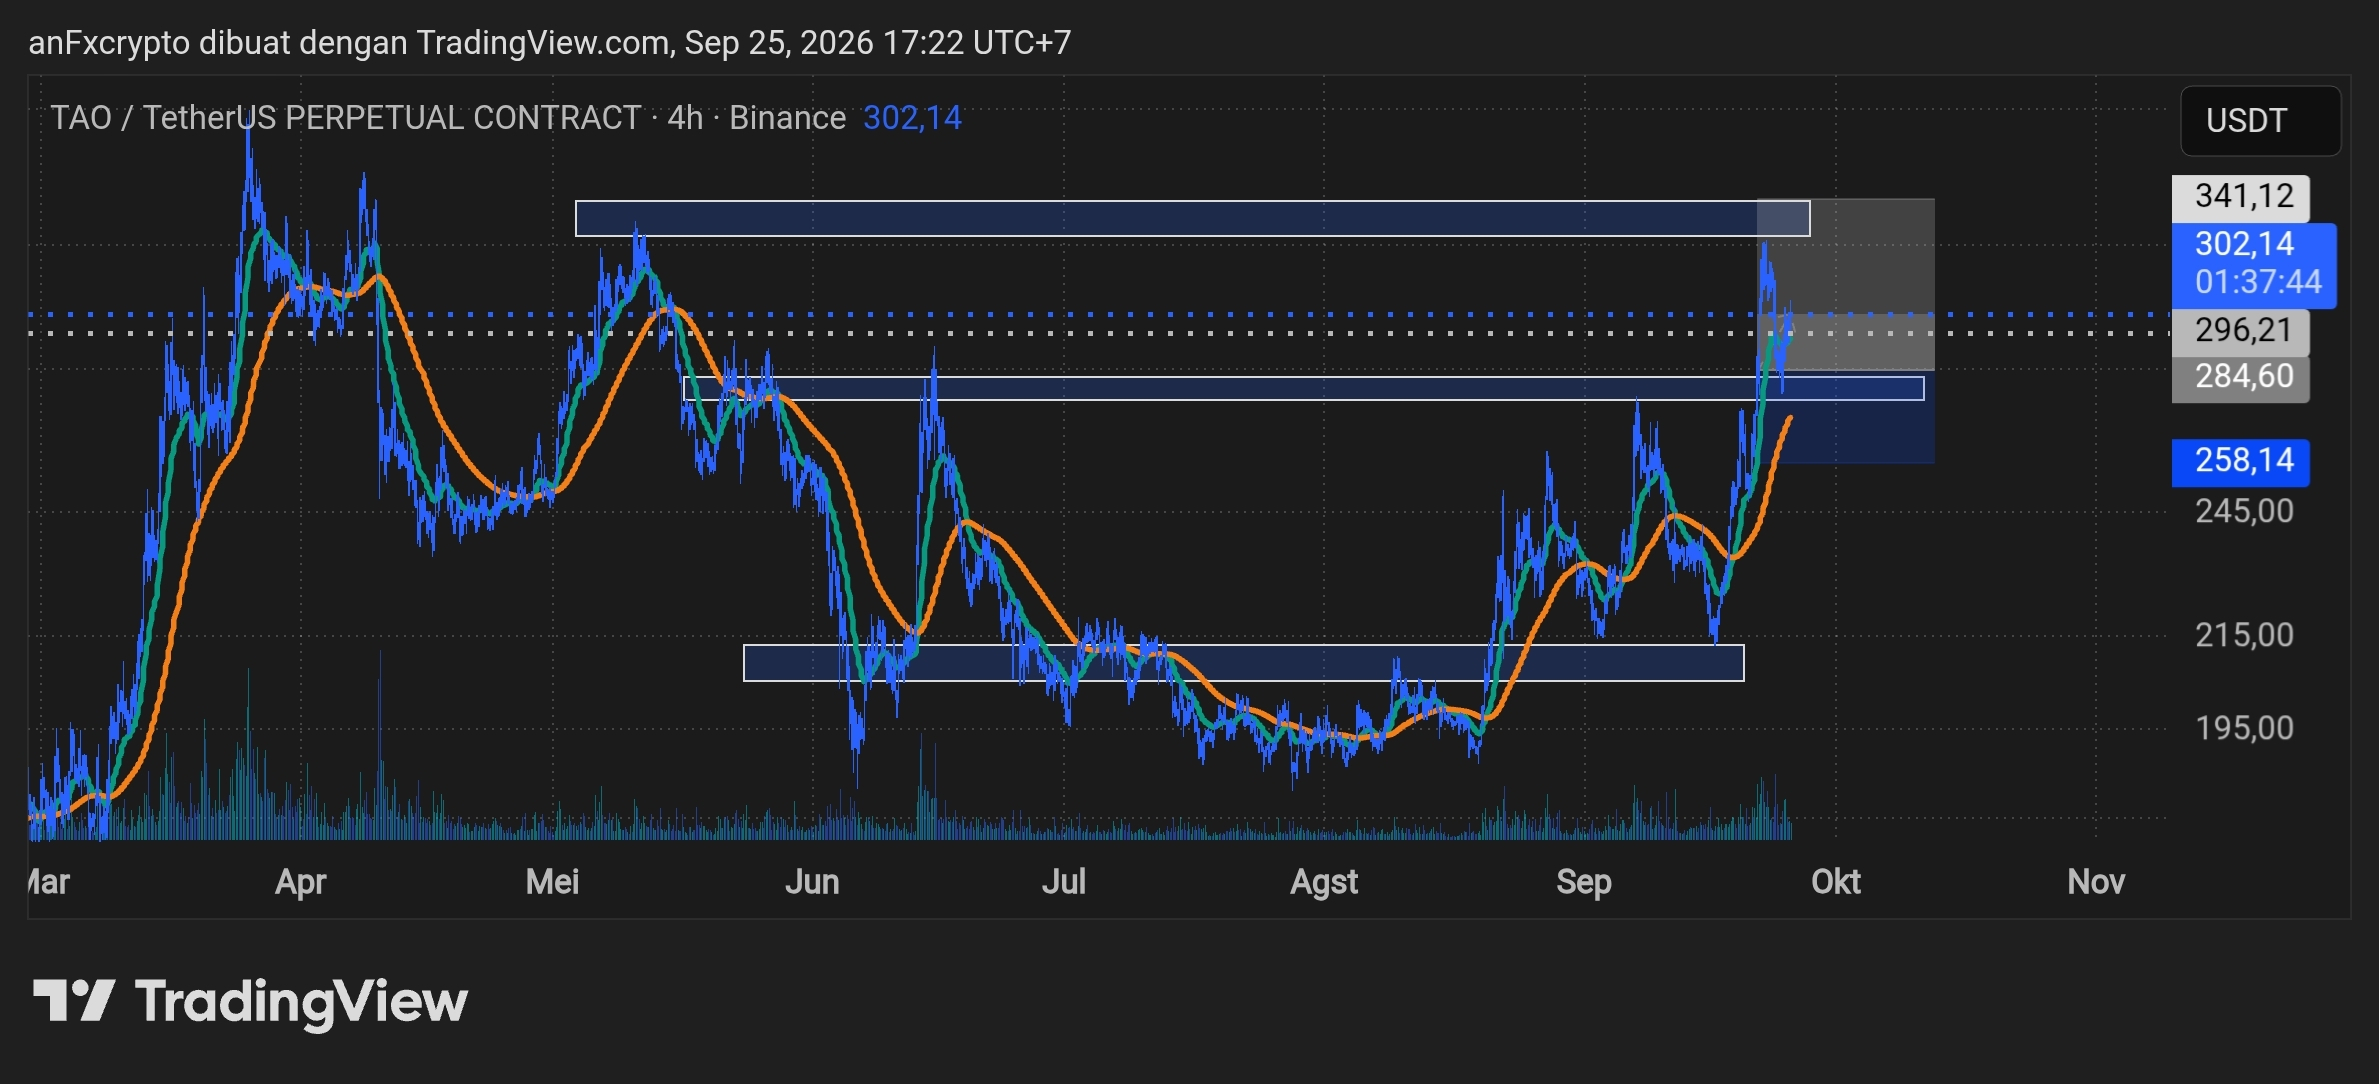
Here is a professional technical analysis and trading plan for $TAO /USDT Perpetual (Timeframe 4-Hour):
1. Trend Analysis & Market Structure
Main Trend: Bullish momentum on the 4H timeframe. After experiencing an accumulation phase in the $190.00–$215.00 area during July–August, TAO successfully formed a strong higher high and higher low structure.
Moving Average Indicator: The two MA lines are curving upward beneath the price movement, providing dynamic support and confirming the uptrend.
Current Condition: Price is testing a strong resistance area in the $296.21–$302.09 range. A valid breakout above this area could trigger an acceleration toward the previously reached high area.
2. Key Levels
Major Resistance / Primary Target: $341.12
Immediate Resistance / Breakout Level: $296.21–$302.09
Demand / Support Zone (Flip Area): $284.60–$296.21
Invalidation / Stop Loss Level: $258.14 (below the local swing low and the MA support)
3. Signals & Trading Plan (Long Setup)
ParameterValue / AreaPosition DirectionBUY / LONGBuy / Entry Zone$284.60–$296.21 (waiting for a pullback/retest) or a confirmed 4H candle close above $302.00Take Profit (TP)$341.12Stop Loss (SL)$258.14Risk to Reward Ratio (RRR)~1:1.5 to 1:2 (depending on the precision of the entry point)
4. Execution Strategy & Risk Management
Best Entry Option: It is recommended to use the Retest scenario (buying when price corrects healthily into the $284.60–$296.21 demand zone) to achieve the optimal Risk-to-Reward.
Breakout Confirmation: If entering on a breakout when price breaks above $302.00, ensure there is a strong 4H candle close accompanied by an increase in trading volume.
Position Management:
Allocate a maximum risk of 1%–2% of total account equity per trade.
Move the Stop Loss to Break Even (BEP) if price reaches the $320.00 area.
1. Trend Analysis & Market Structure
Main Trend: Bullish momentum on the 4H timeframe. After experiencing an accumulation phase in the $190.00–$215.00 area during July–August, TAO successfully formed a strong higher high and higher low structure.
Moving Average Indicator: The two MA lines are curving upward beneath the price movement, providing dynamic support and confirming the uptrend.
Current Condition: Price is testing a strong resistance area in the $296.21–$302.09 range. A valid breakout above this area could trigger an acceleration toward the previously reached high area.
2. Key Levels
Major Resistance / Primary Target: $341.12
Immediate Resistance / Breakout Level: $296.21–$302.09
Demand / Support Zone (Flip Area): $284.60–$296.21
Invalidation / Stop Loss Level: $258.14 (below the local swing low and the MA support)
3. Signals & Trading Plan (Long Setup)
ParameterValue / AreaPosition DirectionBUY / LONGBuy / Entry Zone$284.60–$296.21 (waiting for a pullback/retest) or a confirmed 4H candle close above $302.00Take Profit (TP)$341.12Stop Loss (SL)$258.14Risk to Reward Ratio (RRR)~1:1.5 to 1:2 (depending on the precision of the entry point)
4. Execution Strategy & Risk Management
Best Entry Option: It is recommended to use the Retest scenario (buying when price corrects healthily into the $284.60–$296.21 demand zone) to achieve the optimal Risk-to-Reward.
Breakout Confirmation: If entering on a breakout when price breaks above $302.00, ensure there is a strong 4H candle close accompanied by an increase in trading volume.
Position Management:
Allocate a maximum risk of 1%–2% of total account equity per trade.
Move the Stop Loss to Break Even (BEP) if price reaches the $320.00 area.